Embed Size (px)
Citation preview

1
Hypothesis-free identification of modulators of genetic risk factors Daria V. Zhernakova1*, Patrick Deelen1,2*, Martijn Vermaat3*, Maarten van Iterson4*, Michiel van
Galen3, Wibowo Arindrarto5, Peter van ’t Hof5, Hailiang Mei5, Freerk van Dijk1,2, Harm-Jan
Westra6,7,8, Marc Jan Bonder1, Jeroen van Rooij9, Marijn Verkerk9, P. Mila Jhamai9, Matthijs
Moed4, Szymon M. Kielbasa4 , Jan Bot10, Irene Nooren10, René Pool11, Jenny van Dongen11,
Jouke J. Hottenga11, Coen D.A. Stehouwer12, Carla J.H. van der Kallen12, Casper G.
Schalkwijk12, Alexandra Zhernakova1, Yang Li1, Ettje F. Tigchelaar1, Marian Beekman4, Joris
Deelen4, Diana van Heemst13, Leonard H. van den Berg14, Albert Hofman15, André G.
Uitterlinden9 , Marleen M.J. van Greevenbroek12, Jan H. Veldink16, Dorret I. Boomsma11,
Cornelia M. van Duijn17, Cisca Wijmenga1, P. Eline Slagboom4, Morris A. Swertz1,2, Aaron
Isaacs17,18, Joyce B.J. van Meurs9, Rick Jansen19, Bastiaan T. Heijmans4#, Peter A.C. ’t Hoen3#,
Lude Franke1#
* Shared first; # Shared last
1 University of Groningen, University Medical Center Groningen, Department of Genetics,
Groningen, the Netherlands
2 University of Groningen, University Medical Center Groningen, Genomics Coordination Center,
Groningen, the Netherlands
3 Department of Human Genetics, Leiden University Medical Center, Leiden, the Netherlands
4 Molecular Epidemiology Section, Department of Medical Statistics and Bioinformatics, Leiden
University Medical Center, Leiden, the Netherlands
5 Sequence Analysis Support Core, Leiden University Medical Center, Leiden, the Netherlands
6 Divisions of Genetics and Rheumatology, Department of Medicine, Brigham and Women's
Hospital and Harvard Medical School, Boston, USA
7 Partners Center for Personalized Genetic Medicine, Boston, USA
8 Program in Medical and Population Genetics, Broad Institute of MIT and Harvard, Cambridge,
USA
9 Department of Internal Medicine, ErasmusMC, Rotterdam, the Netherlands
10 SURFsara, Amsterdam, the Netherlands
. CC-BY-NC-ND 4.0 International licensepeer-reviewed) is the author/funder. It is made available under aThe copyright holder for this preprint (which was not. http://dx.doi.org/10.1101/033217doi: bioRxiv preprint first posted online Nov. 30, 2015;

2
11 Department of Biological Psychology, VU Amsterdam, Neuroscience Campus Amsterdam,
Amsterdam, the Netherlands
12 Department of Internal Medicine and School for Cardiovascular Diseases (CARIM),
Maastricht University Medical Center, Maastricht, the Netherlands
13 Department of Gerontology and Geriatrics, Leiden University Medical Center, Leiden, the
Netherlands
14 Department of Neurology, Brain Center Rudolf Magnus, University Medical Center Utrecht,
Utrecht, the Netherlands
15 Department of Epidemiology, ErasmusMC, Rotterdam, The Netherlands
16 Department of Neurology, Brain Center Rudolf Magnus, University Medical Center Utrecht,
Utrecht, the Netherlands
17 Genetic Epidemiology Unit, Department of Epidemiology, ErasmusMC, Rotterdam, the
Netherlands
18 CARIM School for Cardiovascular Diseases and Maastricht Centre for Systems Biology
(MaCSBio), Maastricht University, Maastricht, the Netherlands
19 Department of Psychiatry, VU University Medical Center, Neuroscience Campus Amsterdam,
Amsterdam, the Netherlands
. CC-BY-NC-ND 4.0 International licensepeer-reviewed) is the author/funder. It is made available under aThe copyright holder for this preprint (which was not. http://dx.doi.org/10.1101/033217doi: bioRxiv preprint first posted online Nov. 30, 2015;

3
Abstract Genetic risk factors often localize in non-coding regions of the genome with unknown effects on
disease etiology. Expression quantitative trait loci (eQTLs) help to explain the regulatory
mechanisms underlying the association of genetic risk factors with disease. More mechanistic
insights can be derived from knowledge of the context, such as cell type or the activity of
signaling pathways, influencing the nature and strength of eQTLs. Here, we generated
peripheral blood RNA-seq data from 2,116 unrelated Dutch individuals and systematically
identified these context-dependent eQTLs using a hypothesis-free strategy that does not require
prior knowledge on the identity of the modifiers. Out of the 23,060 significant cis-regulated
genes (false discovery rate ≤ 0.05), 2,743 genes (12%) show context-dependent eQTL effects.
The majority of those were influenced by cell type composition, revealing eQTLs that are
particularly strong in cell types such as CD4+ T-cells, erythrocytes, and even lowly abundant
eosinophils. A set of 145 cis-eQTLs were influenced by the activity of the type I interferon
signaling pathway and we identified several cis-eQTLs that are modulated by specific
transcription factors that bind to the eQTL SNPs. This demonstrates that large-scale eQTL
studies in unchallenged individuals can complement perturbation experiments to gain better
insight in regulatory networks and their stimuli.
. CC-BY-NC-ND 4.0 International licensepeer-reviewed) is the author/funder. It is made available under aThe copyright holder for this preprint (which was not. http://dx.doi.org/10.1101/033217doi: bioRxiv preprint first posted online Nov. 30, 2015;
4
Introduction The molecular mechanisms underlying the association of genetic risk factors with disease and
complex traits are still largely elusive. Many disease-associated genetic variants are found in
non-coding parts of the genome 1,2 and thus must have a regulatory effect on expression.
Mapping single nucleotide polymorphisms (SNPs) with an effect on the regulation of gene
expression (expression quantitative trait loci, eQTLs) helps to unravel the regulatory networks
that underlie physiological traits and diseases 3–8. Given differences between the regulatory
networks of different cell types, it is not surprising that a substantial fraction of eQTLs are only
apparent in specific cell types or tissues 9–14. The presence of external stimuli and the activity of
internal signaling pathways may also determine the presence and strength of the regulatory
effects of eQTLs. For example, a subset of eQTLs in immune cells may only be observed after
activation of these cells by immunological triggers 15–20. Knowledge of the cellular context in
which disease-associated eQTLs are active can help to identify the cell types that are relevant
in the pathophysiology; identification of the cell type in which a risk locus shows the most
profound effects allows prioritization of variants for functional experiments. Additionally, insights
into the activity of signaling pathways modifying eQTL effects help to unravel the regulatory
networks underlying disease. Here, we developed and applied a strategy to identify the most
important intrinsic and extrinsic factors that modify eQTL effects in blood cells, without making
any prior assumptions on the identity of these modifiers. We demonstrate how the eQTLs and
their modifiers contribute to better understand the molecular basis of disease.
Results
Main-effect cis-eQTLs
We generated a comprehensive set of cis-eQTLs by sequencing whole peripheral blood mRNA
of 2,176 healthy adults from four Dutch cohorts 21–24 (2,116 individuals remaining after stringent
quality control (Table S1, Supplementary material)). We quantified gene and exon expression,
as well as exon ratios (the proportion of expression of an exon relative to the total expression of
all exons of a gene) and polyA ratios (the ratio of the expression in upstream and downstream
parts of the 3’-UTRs separated by annotated polyadenylation (polyA) sites) and performed cis-
eQTL mapping for all of these. We detected cis-eQTL effects for 66% of the protein coding
genes tested and 19% of the non-coding genes tested. In total, we found eQTL effects for
23,060 different genes (false discovery rate (FDR) ≤ 0.05). We replicated 84% of 6,418
previously reported cis-eQTL genes that we had previously detected in a meta-analysis of 5,311
. CC-BY-NC-ND 4.0 International licensepeer-reviewed) is the author/funder. It is made available under aThe copyright holder for this preprint (which was not. http://dx.doi.org/10.1101/033217doi: bioRxiv preprint first posted online Nov. 30, 2015;

5
array-based blood samples 4 (90% with the same allelic direction) (Table S2). This
demonstrates the superior statistical power to detect eQTLs when using RNA-seq data (Tables
S2 and S3). We also observed strong overlap with RNA-seq based cis-eQTLs from EBV-
transformed lymphoblastoid cell lines (LCL) 5 (78% of the LCL cis-eQTLs could be replicated,
88% with the same allelic direction), but substantially extended the list of genes that are known
to be under genetic regulation (replication results in Supplementary material online, Table S2).
In addition to detected gene-level eQTLs, we identified for 21,888 different genes with one or
more exon-level QTL effects and 9,777 and 2,322 genes where SNPs affected the inclusion rate
of exons and the usage of polyA sites, respectively (Table S3). A complete catalogue of all our
eQTLs can be downloaded and explored via a dedicated browser at
http://genenetwork.nl/biosqtlbrowser.
Multiple unlinked SNPs in the same locus may independently influence expression or mRNA
processing of the same gene 25. We analyzed this using stepwise regression of the effects of
the top eQTL SNPs. More than half of the cis-regulated genes showed evidence for multiple
independent eQTL effects (Figure 1a, Figure S1).
The gene cis-eQTL SNPs are strongly enriched for DNase I footprints, various histone marks
and binding sites of multiple transcription factors 26 (Table S4) suggesting that our substantial
sample-size enabled us to pinpoint likely causal regulatory variants. Moreover, top eQTL SNPs
were significantly enriched for general and blood-cell-type-specific enhancers (as taken from
Andersson et al., 2014 27), but not for non-blood tissue-specific enhancers (Table S5). Evidence
for the functionality of exon ratio and polyA ratio QTLs in mRNA splicing and polyadenylation is
presented in the supplementary material.
One third (2,064 / 32.7%) of previously established genetic risk factors for disease or complex
traits (derived from the NHGRI GWAS catalog and a set of reported ImmunoChip associations,
P ≤ 5 x 10⁻⁸) were in strong linkage disequilibrium (LD r2 ≥ 0.8) with a top eQTL SNP (Table S6,
Figure 1b). As expected, eQTL effects were predominantly found for SNPs associated with
hematological, lipid or immune-related traits. We observed a highly significant enrichment of co-
localization of eQTL and GWAS SNPs (LD r2 ≥ 0.8) for many immune disorders, as compared to
height (see supplementary material for details), indicating that our blood cis-eQTLs are highly
informative for diseases such as inflammatory bowel disease, multiple sclerosis and rheumatoid
arthritis (Figure 1c).
. CC-BY-NC-ND 4.0 International licensepeer-reviewed) is the author/funder. It is made available under aThe copyright holder for this preprint (which was not. http://dx.doi.org/10.1101/033217doi: bioRxiv preprint first posted online Nov. 30, 2015;

6
Context-dependent eQTLs
The effects of SNPs on gene expression often depend on the cell type or tissue under
investigation 9–12, and may be modified by external and environmental factors 15–19. To identify
these context-dependent eQTLs, we developed a hypothesis-free strategy that does not
assume any prior knowledge about the factors that may modify the eQTL effects (Figure 2a).
Instead of using known factors, such as the percentage of neutrophils in blood 28, in a gene by
environment interaction model, we used the expression levels of other genes as interaction
factors. Here, we expect that the genes whose expression levels modify eQTLs are proxies of
cell types or other intrinsic or extrinsic factors, and we call these genes 'proxy genes'.
To do this in a systematic manner, we ran interaction analyses for all the eQTLs identified for
each gene, evaluating each gene for its potential to influence eQTLs and quantifying per gene
the extent to which it influenced the complete set of cis-eQTLs. We first identified the proxy
gene acting on the highest number of eQTLs. We subsequently corrected the expression data
for interaction effects with the top proxy gene and repeated this process in an iterative fashion to
find additional independent proxy genes (Figure 2a). We first concentrated on the top 10 proxy
genes that independently affected, in total, 1,842 unique cis-eQTL genes (Figure 2c).
An example is shown in Figure 2b. We found a significant eQTL effect of SNP rs1981760 (a
SNP associated with leprosy susceptibility) on NOD2 expression. The first top proxy gene,
STX3, had a significant interaction effect on this eQTL. Samples with very low expression of
STX3 showed only a very weak eQTL on NOD2, whereas samples with very high STX3
expression showed a stronger eQTL effect size. When visualizing this using an interaction plot,
a clear divergence in NOD2 expression between samples with different genotypes can be
observed (Figure 2b). Further analysis demonstrated that STX3 expression was strongly
correlated (Pearson r = 0.74) with the percentage of neutrophils in the blood, suggesting that
STX3 is a proxy for neutrophils. In this example, the eQTL effect is found to be more prominent
in neutrophils than in other blood cell types, and the expression of NOD2 found to be lower in
carriers of the risk allele compared to carriers of the protective allele. It also confirms a role for
neutrophils in the disease for which a genetic association with the locus is found, i.e. leprosy.
To investigate the biological context reflected by the 10 independent proxy genes, we selected,
for each of these genes, the top 100 genes showing a nearly identical interaction effect with
eQTLs (see Methods and Table S7 for full details). As expected, these genes are highly co-
expressed (Figure 2c), and we refer to such a set of genes as an ‘interaction module’.
. CC-BY-NC-ND 4.0 International licensepeer-reviewed) is the author/funder. It is made available under aThe copyright holder for this preprint (which was not. http://dx.doi.org/10.1101/033217doi: bioRxiv preprint first posted online Nov. 30, 2015;

7
We first assessed whether these interaction modules might represent markers for specific cell
types, and correlated the top 100 genes per module with the blood cell counts measured in our
samples (neutrophils, lymphocytes, eosinophils, basophils and monocytes) and assessed their
baseline gene expression levels in purified blood cells from the BLUEPRINT consortium 29.
Based on higher correlation with counts of the corresponding cell type and the higher
expression in BLUEPRINT data, we concluded that eight out of the ten modules were strongly
associated with specific blood cell types (Figure 2c and Figure S2), namely neutrophils, CD4+
T-cells, NK cells, CD8+ T-cells, monocytes, erythroblasts, macrophages and eosinophils.
The eQTLs modified by cell type proxies were enriched in cell-type-specific signaling pathways
(Figure 2c, Table S8). For example, genes for which the cis-eQTL effects were particularly
strong in erythroblasts (module 4) had erythrocyte-specific functions. They were also enriched in
binding sites for transcription factors involved in erythrocyte development based on ENCODE
ChIP-seq data (GATA1, TAL1, GATA2 and MafK, each with enrichment p-values ≤ 10-5) 30–32.
For the other modules, we also identified specific transcription factors having established
functions in the corresponding cell types (Table S9). Analysis of eQTL interactions with the
blood cell counts measured confirmed the cell-type-dependent effects on neutrophils,
lymphocytes, eosinophils and monocytes (Table S10). However, the comparison with
BLUEPRINT expression data showed that our unbiased analysis also identified effects for cell
types for which actual cell counts were not available (erythroblasts, CD4+ T-cells and NK
cells/CD8+ T-cells), showing the usefulness of such an approach in datasets without
comprehensive cell count measurements.
eQTLs that are lymphocyte-dependent and that show a stronger signal in B-, T- or NK cells are
expected to replicate better within the in B-cell-derived LCL eQTL data generated by the
Geuvadis consortium 5. We indeed found that replication of the lymphocyte-dependent eQTL
effects is higher than our overall replication rate in Geuvadis (Table S11) (46% vs 38%, Fisher
exact p-value = 0.005). In contrast, for our neutrophil-dependent eQTLs, the replication rate was
similar to the overall replication rate (39% vs 38%, Fisher exact p-value = 0.58). Here, however,
we observed that these neutrophil-dependent eQTLs are enriched for opposite allelic effects
between our data and the Geuvadis results (27% opposite effects, compared to 14% for all
overlapping eQTLs, Fisher exact p-value = 8.08 x 10⁻⁵). While the Geuvadis LCLs are not a
perfect model for any of our lymphoid modules, our replication results do provide further
evidence of the cell-type dependent nature of the identified context-dependent eQTLs.
. CC-BY-NC-ND 4.0 International licensepeer-reviewed) is the author/funder. It is made available under aThe copyright holder for this preprint (which was not. http://dx.doi.org/10.1101/033217doi: bioRxiv preprint first posted online Nov. 30, 2015;

8
The 10 proxy genes identified using the gene-level eQTLs also affected 4,216 exon-level eQTLs
and 572 exon ratio QTLs. Gene function enrichment analysis on the exon-level and exon ratio
QTLs showed results similar to that of eQTL genes (Table S8), indicating that the proxy genes
do not solely represent the factors modulating gene-level eQTLs but also those that affect
alternative splicing eQTLs.
Risk factors for immune disorders show context-dependent effects To demonstrate how eQTLs and their context-specific effects can help to better understand
disease, we highlight cis-eQTLs for inflammatory bowel disease (IBD) and rheumatoid arthritis
(RA). We performed clustering of the eQTL genes based on co-expression in our dataset.
These clusters consisted of genes expressed in the same cell types according to the
BLUEPRINT data. Functional enrichment analyses of the eQTL genes revealed pathways
relevant to the disease etiology. Moreover, the subset of context-specific eQTLs provides
additional evidence for the cell types in which the disease risk alleles are most active. Examples
are shown in Figures 3 (IBD), 4 (RA), S3 (other immune disorders), and Table S12.
For IBD we included the loci reported by a recent multi-ethnic meta-analysis 33. Of the 232 top
SNPs reported in this meta-analysis, 95 loci (41%) are in strong LD (r2 ≥ 0.8) with a top eQTL
SNP (median r2 = 0.96 and median D’ = 0.996). Importantly, 42 risk variants are in perfect LD
with the top eQTL SNP (Figure 3e), which was proportionally much higher compared to non-
immune traits (Figure 1c). In total, eQTL SNPs that are proxies for these 95 IBD loci affected
expression of 233 genes (Figure 3a).
Clustering of these 233 genes revealed a set of 123 genes mainly related to T-cell biology and a
set of 110 genes specific to neutrophils and toll-like receptor signaling (Figure 3b and 3c, see
Table S13 for full enrichment analysis results), confirming existing knowledge of the cell types
relevant in IBD 20,21. There was a significant imbalance in the direction of regulation within the T-
cell cluster: 54 genes were up-regulated by the IBD risk allele whereas only 29 were down-
regulated (binominal test p-value: 0.003), suggesting increased T-cell activity in IBD.
Incorporation of exon level eQTLs can be used to better understand gene level eQTLs. For
instance, rs727088 lowered CD226 expression. Zooming into the exon QTL effects of this gene,
we found two exons that were strongly up-regulated, both of them unique to a non-sense
mediate decay (NMD) transcript (as annotated by Ensembl). The other exons showed down-
regulation by the risk allele, suggesting that a shift to the NMD isoform is lowering overall gene
expression levels (Figure S4).
. CC-BY-NC-ND 4.0 International licensepeer-reviewed) is the author/funder. It is made available under aThe copyright holder for this preprint (which was not. http://dx.doi.org/10.1101/033217doi: bioRxiv preprint first posted online Nov. 30, 2015;

9
Twelve IBD-linked genes demonstrated context-dependent eQTL effects (Table S12). Five of
these eQTLs were strongest in neutrophils (positive interaction score for module 1) and the
genes containing these eQTLs were present in the neutrophil cluster (Figure 3d). We also
observed negative interactions, where the effect becomes smaller in a specific module, e.g. the
eQTL effect of rs1728801 regulating ZPF90 (Figure 3f), a gene that is known to be important in
T-helper cells 36. We found that carriers of the protective allele show increased expression of
ZPF90 in CD4+ T-cells, while the risk allele carriers show consistently high expression levels
independent of CD4+ T-cells. This indicates that while ZFP90 expression normally is restricted
to T-cells this does not apply to carriers of the risk allele which have high expression levels in
multiple cell-types, potentially activating T-cell specific pathways in other cells.
For RA, 81 eQTL genes were found that cluster into three groups (Figure 4a). The median r2
between the top eQTL SNPs and the top GWAS hits is 0.95, the median D’ is 0.996 and 24
variants are in perfect LD. The genes in two clusters showed high expression levels in B-cells
and NK/T-cells, respectively (Figure 4d). This was supported by the gene function enrichments
(Figure 4c). The genes in the third cluster were highly expressed in macrophages, neutrophils
and monocytes and were related to platelet activation and coagulation. RA patients are known
to be at increased risk for venous thromboembolism 25 and the importance of blood coagulation
factors in RA pathogenesis has recently been established 26. The eQTL results link risk loci and
genes to this symptom.
Eight RA-associated eQTLs were context dependent (Table S12). In concordance with their
gene expression patterns, six of these demonstrated stronger eQTL effects in T- or B-cells
(Figure 4b). FAM167A demonstrated an interaction with both module 9 (B-cells) and module 2
(CD4+ T-cells). Interestingly, we observe that for carriers of the protective allele there is no
correlation between CD4+ T-cells and the expression levels of FAM167A, whereas for carriers
of the risk allele we do see up-regulation of this gene in CD4+ T-cells.
We obtained similar results for celiac disease (Figure S3a), type 1 diabetes (Figure S3b),
multiple sclerosis (Figure S3c) and systemic lupus erythematosus (Figure S3d).
Modules not associated with cell types We found that most modules represented different cell types, except module 6 and 7. Although
module 6 could not be attributed to a clear biological process, module 7 contains many genes
that are known to be involved in the type I interferon response. Pathway enrichment of the 51
module 7 proxy genes, which were positively correlated with the expression of the top proxy
. CC-BY-NC-ND 4.0 International licensepeer-reviewed) is the author/funder. It is made available under aThe copyright holder for this preprint (which was not. http://dx.doi.org/10.1101/033217doi: bioRxiv preprint first posted online Nov. 30, 2015;

10
gene SP140, revealed that many of these genes are involved in the type I interferon response to
viral infection. The other 48 genes that correlated negatively with SP140 are involved in anti-
bacterial response and inflammation (Figure 5a). The positively correlated genes are enriched
for up-regulated genes upon rhinovirus stimulation 16 (Fisher exact p-value 1.14 x 10⁻⁹), in line
with their involvement in the type I interferon response. In contrast, the negatively correlated
genes are enriched for genes up-regulated upon LPS stimulation (Fisher exact p-value 0.02)
and interferon-gamma stimulation (Fisher exact p-value 8.72 x 10⁻⁴) 15, supporting the anti-
bacterial function of these genes (Table S14). Likewise, the affected eQTL genes can be
divided into two groups: those that were positively correlated with SP140 expression and those
with negative correlations to SP140. Similarly to the proxy genes, the most significantly enriched
pathway for the positively correlated eQTL genes was ‘response to type I interferon’ (Figure 5b).
Gene annotations from the interferome database 39 confirmed that the up-regulated eQTL genes
are indicative of a type I, but not of a type II interferon response (Figure 5c). Type I interferon
signaling is activated in a viral response and type II interferon signaling is activated upon
bacterial response 40. Both type I and type II interferon signaling result in binding of
heterodimers of the STAT1 transcription factor. Unique to type I interferon is that STAT1 forms a
complex with STAT2 and IRF9, resulting in the activation of viral response genes. STAT3
activation is also unique to the type I response, resulting in the down-regulation of inflammatory
pathways 41. The eQTLs were enriched for STAT1 (p-value = 4.82 x 10-04), STAT2 (3.12 x 10-04)
and STAT3 (4.72 x 10-05) binding sites (based on ENCODE ChIP-seq experiments) (Table S9).
Motif enrichment analysis 42 on the 25 bp flanking regions of the eQTL SNPs confirmed the
enrichment of STAT-binding motifs (Wilcoxon rank-sum test, p-value = 9.61 x 10-05). In support
of the modifying effects of viral cues on this set of eQTLs, eQTL genes that have recently been
reported as rhinovirus-response QTLs 16 typically have higher interaction z-scores for module 7
than other eQTL genes (Wilcoxon p-value = 0.02). We therefore conclude that the effect of
these 145 eQTL genes is dependent on stimulation with type I interferon.
Regulatory network discovery Each of the aforementioned ten modules demonstrated effects on many (>120) eQTLs.
However, some other factors may also exist that affect more limited numbers of eQTLs. To
identify these, we first corrected the expression data for the 10 module interaction effects and
then ascertained for each gene-level eQTL whether the eQTL effect size was significantly
dependent on the expression of any other gene. This resulted in the identification of an
additional set of 901 context-dependent eQTL genes (FDR ≤ 0.05). Of these eQTL
. CC-BY-NC-ND 4.0 International licensepeer-reviewed) is the author/funder. It is made available under aThe copyright holder for this preprint (which was not. http://dx.doi.org/10.1101/033217doi: bioRxiv preprint first posted online Nov. 30, 2015;
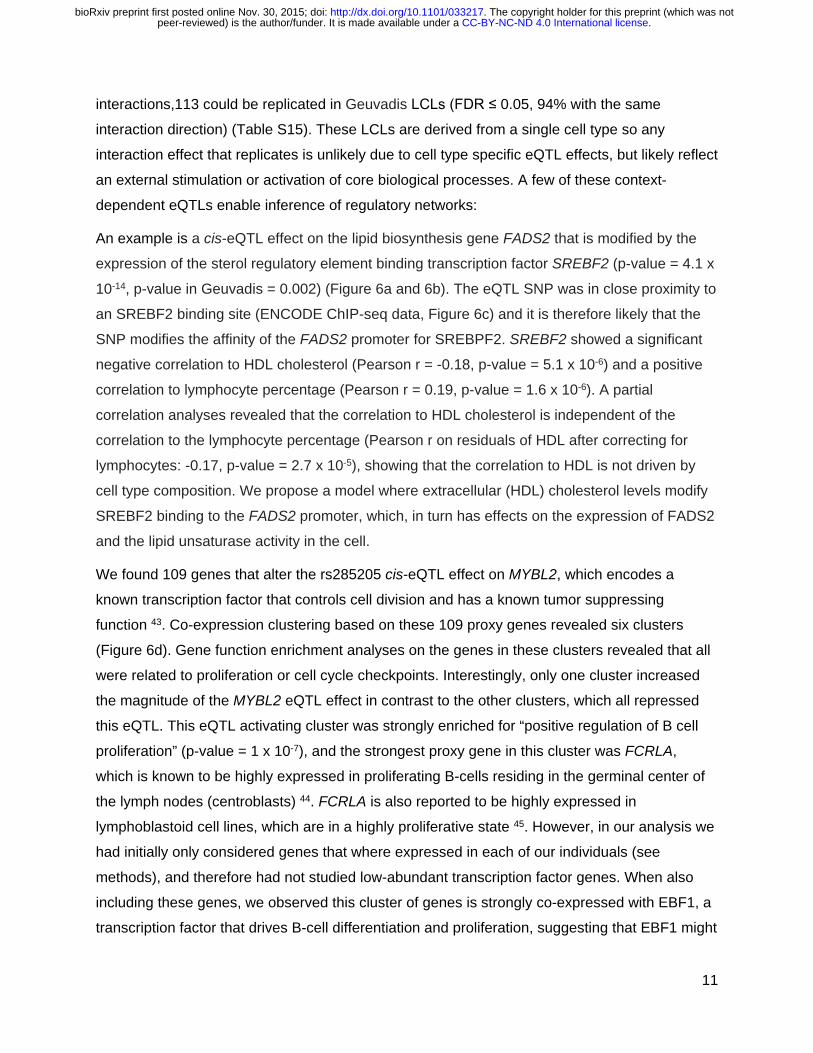
11
interactions,113 could be replicated in Geuvadis LCLs (FDR ≤ 0.05, 94% with the same
interaction direction) (Table S15). These LCLs are derived from a single cell type so any
interaction effect that replicates is unlikely due to cell type specific eQTL effects, but likely reflect
an external stimulation or activation of core biological processes. A few of these context-
dependent eQTLs enable inference of regulatory networks:
An example is a cis-eQTL effect on the lipid biosynthesis gene FADS2 that is modified by the
expression of the sterol regulatory element binding transcription factor SREBF2 (p-value = 4.1 x
10-14, p-value in Geuvadis = 0.002) (Figure 6a and 6b). The eQTL SNP was in close proximity to
an SREBF2 binding site (ENCODE ChIP-seq data, Figure 6c) and it is therefore likely that the
SNP modifies the affinity of the FADS2 promoter for SREBPF2. SREBF2 showed a significant
negative correlation to HDL cholesterol (Pearson r = -0.18, p-value = 5.1 x 10⁻⁶) and a positive
correlation to lymphocyte percentage (Pearson r = 0.19, p-value = 1.6 x 10⁻⁶). A partial
correlation analyses revealed that the correlation to HDL cholesterol is independent of the
correlation to the lymphocyte percentage (Pearson r on residuals of HDL after correcting for
lymphocytes: -0.17, p-value = 2.7 x 10⁻⁵), showing that the correlation to HDL is not driven by
cell type composition. We propose a model where extracellular (HDL) cholesterol levels modify
SREBF2 binding to the FADS2 promoter, which, in turn has effects on the expression of FADS2
and the lipid unsaturase activity in the cell.
We found 109 genes that alter the rs285205 cis-eQTL effect on MYBL2, which encodes a
known transcription factor that controls cell division and has a known tumor suppressing
function 43. Co-expression clustering based on these 109 proxy genes revealed six clusters
(Figure 6d). Gene function enrichment analyses on the genes in these clusters revealed that all
were related to proliferation or cell cycle checkpoints. Interestingly, only one cluster increased
the magnitude of the MYBL2 eQTL effect in contrast to the other clusters, which all repressed
this eQTL. This eQTL activating cluster was strongly enriched for “positive regulation of B cell
proliferation” (p-value = 1 x 10⁻⁷), and the strongest proxy gene in this cluster was FCRLA,
which is known to be highly expressed in proliferating B-cells residing in the germinal center of
the lymph nodes (centroblasts) 44. FCRLA is also reported to be highly expressed in
lymphoblastoid cell lines, which are in a highly proliferative state 45. However, in our analysis we
had initially only considered genes that where expressed in each of our individuals (see
methods), and therefore had not studied low-abundant transcription factor genes. When also
including these genes, we observed this cluster of genes is strongly co-expressed with EBF1, a
transcription factor that drives B-cell differentiation and proliferation, suggesting that EBF1 might
. CC-BY-NC-ND 4.0 International licensepeer-reviewed) is the author/funder. It is made available under aThe copyright holder for this preprint (which was not. http://dx.doi.org/10.1101/033217doi: bioRxiv preprint first posted online Nov. 30, 2015;
12
drive the eQTL interaction effect for MYBL2. This was indeed confirmed using ENCODE ChIP-
seq data in LCLs: we observed strong binding of EBF1 at rs285205 (Figure 6g). EBF1 is a
known player in B-cell differentiation and proliferation and positively correlated to both MYBL2 (r
= 0.11, p-value = 6.99 x 10⁻⁷) and FCRLA (r = 0.8, p-value ≤ 2.2 x 10⁻¹⁶). Finally, testing EBF1
as a proxy gene directly also revealed a significant interaction (p-value = 1.8 x 10⁻¹⁴) effect
(Figure 6f). As such EBF1 influences MYBL2 gene expression, but because of its binding at
SNP rs285205, this SNP likely affects the binding affinity of EBF1. In the Geuvadis dataset
these MYBL2 interactions are not significant, however 74% were in the same direction
(binominal p-value = 2.2 x 10⁻⁵).
Discussion Using whole blood RNA-seq data we greatly expanded the catalog of SNPs that have a known
regulatory function. Our study on 2,116 individuals allowed identification of many independent
genetic effects influencing expression levels. We observe co-localization of one third of the
disease- and trait-associated variants with eQTL signals, and we observed significantly more
overlap for traits related to blood (immunological disorders/metabolic levels) as compared to
other traits such as height and BMI, and thus arrive at different conclusions as compared to a
recent paper that observed that blood eQTL and IBD variants do not significantly more often co-
localize as compared to chance 46. However, since that analysis used earlier array-based blood
eQTL results that had not been imputed to recent reference panels, this suggests that earlier
eQTL studies either have lacked sufficient statistical power to identify eQTLs (i.e. limited sample
size and/or the use of microarrays instead of RNA-seq) or were unable to fine-map these
associations (i.e. imputation to older reference panels). Additionally, the presence of multiple
independent regulatory variants might have been missed; while the regulatory effects of nearly
500 GWAS hits were not in strong LD with our top eQTL SNPs, they were in strong LD with our
secondary, tertiary or even higher order eQTLs (Figure 1a, Figure S1). Moreover, approximately
10% of the GWAS hits did not affect the regulation of overall gene expression levels, but had an
impact on mRNA processing because they were found only in the exon, exon ratio or polyA-
ratio QTL analyses (Figure 1b, Table S6, examples in Supplementary Material online).
To gain a better understanding of the biology behind these regulatory variants, we identified
2,743 context-dependent eQTLs (1,842 in the first 10 modules and 901 in the remainder) and
identified many of the determinants that modify these eQTLs. These provide further insight into
the cell types in which the genetic risk factors are regulating gene expression and the regulatory
networks in which they participate, further refining our findings on GWAS risk loci. Unlike other
. CC-BY-NC-ND 4.0 International licensepeer-reviewed) is the author/funder. It is made available under aThe copyright holder for this preprint (which was not. http://dx.doi.org/10.1101/033217doi: bioRxiv preprint first posted online Nov. 30, 2015;

13
approaches (15,16,20), our method does not rely on any prior knowledge or assumptions on
differences in cell type composition or naturally occurring stimulations acting on our whole tissue
data.
We also observed various examples where eQTLs are influenced by transcription factors that
bind to the eQTL SNP. This includes rs968567 that strongly influences FADS2 gene expression
and depends on SREBF2 activity, but which also increases risk for rheumatoid arthritis, blood
metabolite levels and lipid levels. With future increases in sample-size we expect it might also
become possible to observe gene x environment interaction effects for this SNP on these
(disease) phenotypes as well.
Our method can easily be applied to other tissues and we expect that many more cell-type-
dependent eQTLs will become detectable in such datasets once sample-sizes become
sufficiently large. This will likely lead to the identification of even more unanticipated intrinsic
factors and external stimuli that modify the downstream effects of genetic risk factors. As such
our approach complements perturbation experiments to gain better insight in regulatory
networks and their stimuli.
Acknowledgements This work was performed within the framework of the Biobank-Based Integrative Omics Studies
(BIOS) Consortium funded by BBMRI-NL, a research infrastructure financed by the Dutch
government (NWO 184.021.007). Samples were contributed by LifeLines
(http://lifelines.nl/lifelines-research/general), the Leiden Longevity Study (http://www.healthy-
ageing.nl; http://www.leidenlangleven.nl), the Rotterdam studies (http://www.erasmus-
epidemiology.nl/rotterdamstudy) and the CODAM study (http://www.carimmaastricht.nl). We
thank the participants of all aforementioned biobanks and acknowledge the contributions of the
investigators to this study (Supplemental Acknowledgements). This work was carried out on the
Dutch national e-infrastructure with the support of SURF Cooperative and the Groningen Center
for Information Technology (Strikwerda, W. Albers, R. Teeninga, H. Gankema and H. Wind) and
Target storage (E. Valentyn and R. Williams). Target is supported by Samenwerkingsverband
Noord Nederland, the European Fund for Regional Development, the Dutch Ministry of
Economic Affairs, Pieken in de Delta and the provinces of Groningen and Drenthe.
. CC-BY-NC-ND 4.0 International licensepeer-reviewed) is the author/funder. It is made available under aThe copyright holder for this preprint (which was not. http://dx.doi.org/10.1101/033217doi: bioRxiv preprint first posted online Nov. 30, 2015;
14
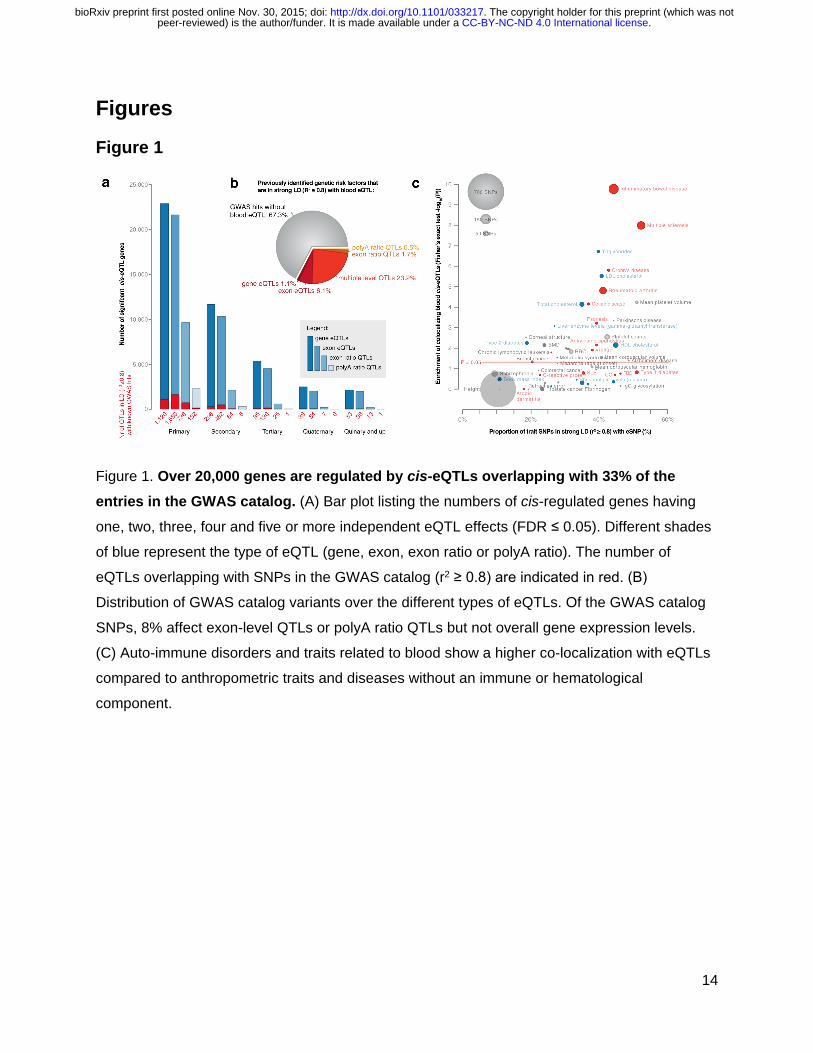
Figures Figure 1
Figure 1. Over 20,000 genes are regulated by cis-eQTLs overlapping with 33% of the entries in the GWAS catalog. (A) Bar plot listing the numbers of cis-regulated genes having
one, two, three, four and five or more independent eQTL effects (FDR ≤ 0.05). Different shades
of blue represent the type of eQTL (gene, exon, exon ratio or polyA ratio). The number of
eQTLs overlapping with SNPs in the GWAS catalog (r2 ≥ 0.8) are indicated in red. (B)
Distribution of GWAS catalog variants over the different types of eQTLs. Of the GWAS catalog
SNPs, 8% affect exon-level QTLs or polyA ratio QTLs but not overall gene expression levels.
(C) Auto-immune disorders and traits related to blood show a higher co-localization with eQTLs
compared to anthropometric traits and diseases without an immune or hematological
component.
. CC-BY-NC-ND 4.0 International licensepeer-reviewed) is the author/funder. It is made available under aThe copyright holder for this preprint (which was not. http://dx.doi.org/10.1101/033217doi: bioRxiv preprint first posted online Nov. 30, 2015;
15
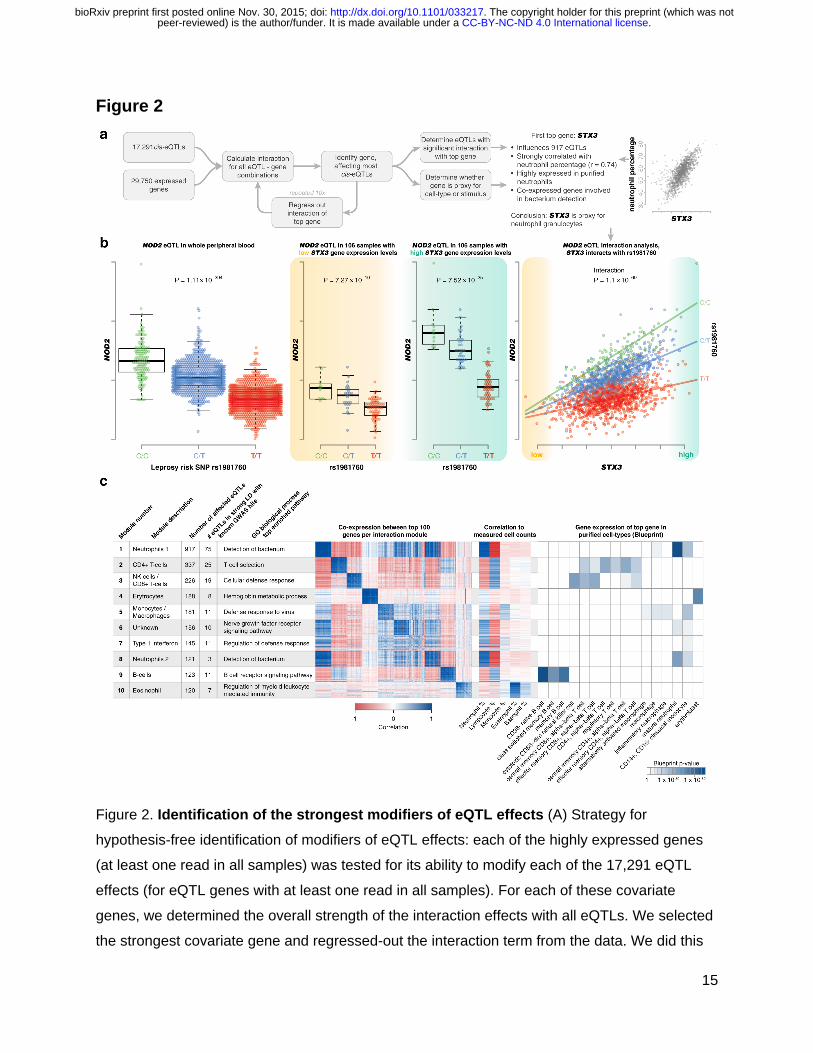
Figure 2
Figure 2. Identification of the strongest modifiers of eQTL effects (A) Strategy for
hypothesis-free identification of modifiers of eQTL effects: each of the highly expressed genes
(at least one read in all samples) was tested for its ability to modify each of the 17,291 eQTL
effects (for eQTL genes with at least one read in all samples). For each of these covariate
genes, we determined the overall strength of the interaction effects with all eQTLs. We selected
the strongest covariate gene and regressed-out the interaction term from the data. We did this
. CC-BY-NC-ND 4.0 International licensepeer-reviewed) is the author/funder. It is made available under aThe copyright holder for this preprint (which was not. http://dx.doi.org/10.1101/033217doi: bioRxiv preprint first posted online Nov. 30, 2015;
16
for 10 iterations allowing the identification of 10 independent modules that affect the strength of
eQTLs. (B) An example of a context-dependent eQTL effect is rs1981760, a strong eQTL for the
NOD2 gene. This SNP is in strong LD (r2 = 0.99) with rs9302752, a variant associated to
Leprosy susceptibility. The leprosy risk allele results in decreased expression of NOD2. In
samples with low STX3A expression, only a weak eQTL effect is observed. In samples with high
STX3A expression, a strong eQTL effect is observed. In accordance with this, using this STX3A
gene as a covariate in an interaction model reveals a very strong interaction effect. This STX3A
gene is the top covariate of our first interaction module. This module correlates strongly to
neutrophil percentage (Pearson r = 0.72) and gene enrichment analysis shows involvement in
antibacterial response. Furthermore, individuals carrying the Leprosy risk allele have
significantly weaker NOD2 up-regulation in neutrophils compared to non-carriers. This is in line
with earlier reports showing this eQTL to be stronger in FACS-sorted neutrophils compared to
monocytes 47. (C) We annotated each of our 10 modules using the top 100 proxy genes and
show that these top 100 genes are strongly correlating per module. This top 100 was used for
gene function enrichments (for full results see Table S9) and was correlated to known cell
proportions. We used BLUEPRINT expression data for sorted populations of blood cells to
validate cell-type-specific expression in each module.
. CC-BY-NC-ND 4.0 International licensepeer-reviewed) is the author/funder. It is made available under aThe copyright holder for this preprint (which was not. http://dx.doi.org/10.1101/033217doi: bioRxiv preprint first posted online Nov. 30, 2015;

17
Figure 3
. CC-BY-NC-ND 4.0 International licensepeer-reviewed) is the author/funder. It is made available under aThe copyright holder for this preprint (which was not. http://dx.doi.org/10.1101/033217doi: bioRxiv preprint first posted online Nov. 30, 2015;

18
Figure 3. eQTLs associated with inflammatory bowel disease are predominantly active in neutrophils and T-cells. (A) The
expression levels of 233 genes are regulated by 95 IBD loci. The gene-level eQTLs affected are indicated with arrows showing
whether the risk allele increases or decreases expression. Genes without an arrow show exon QTL effects or polyA-ratio QTLs.
Genes regulated by loci specific for ulcerative colitis (UC) or Crohn's disease (CD) are marked accordingly (those without label are
found in both). Genes regulated by an eQTL showing a significant interaction with one of our 10 modules are marked with a star.
Clustering of the genes based on co-expression in our data revealed two clusters (colored yellow and blue). For the yellow cluster,
we identified a significant overrepresentation of genes where the risk allele increases gene expression. (B) Gene function enrichment
per cluster showed T-cell biology for the yellow cluster and neutrophil biology for the blue cluster. (C) Expression levels in the cell-
sorted BLUEPRINT data show that the genes in the yellow cluster show higher expression in T-cells and the genes in the blue
cluster show higher expression in neutrophils. (D) All positive eQTL interaction effects for IBD eQTLs. All positive interactions with
module 1 (the neutrophil module) are by genes in the neutrophil cluster. (E) Distribution of LD (r2 and D’-values) between the top IBD
variant and the top eQTL variant. (F) Two examples of negative interaction effects. Note: ENSG00000262820 has been removed in
newer Ensembl versions.
. CC-BY-NC-ND 4.0 International licensepeer-reviewed) is the author/funder. It is made available under aThe copyright holder for this preprint (which was not. http://dx.doi.org/10.1101/033217doi: bioRxiv preprint first posted online Nov. 30, 2015;
19
Figure 4
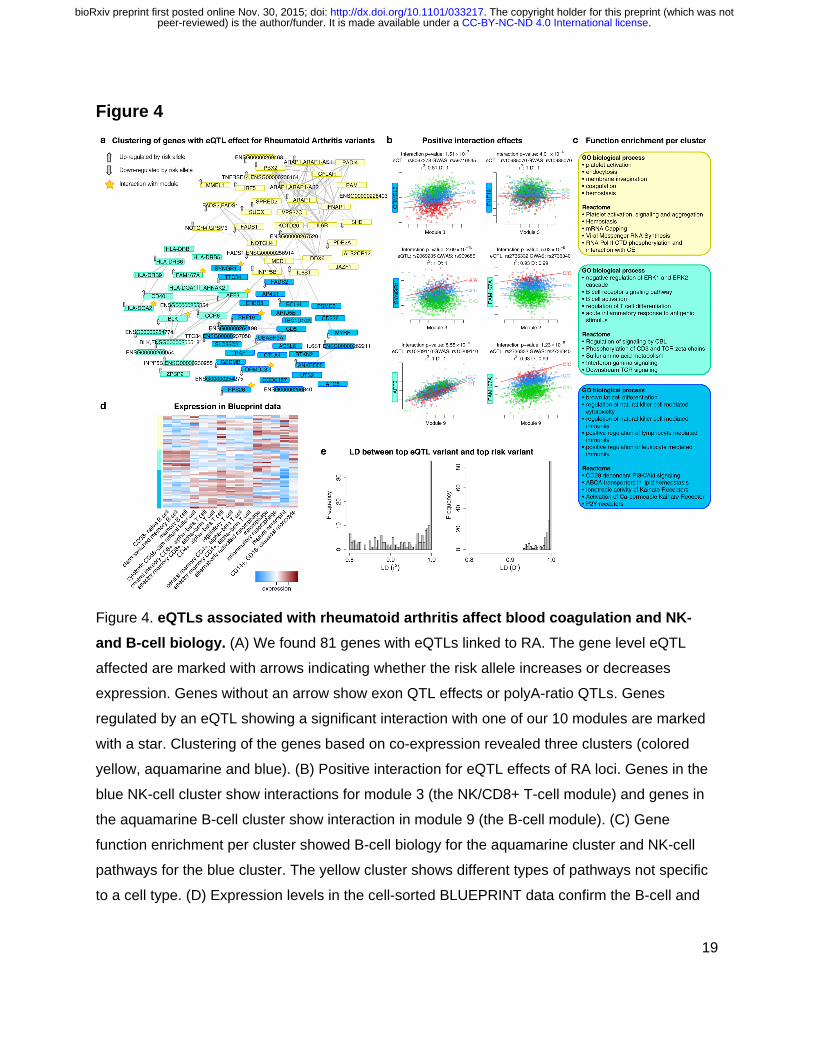
Figure 4. eQTLs associated with rheumatoid arthritis affect blood coagulation and NK- and B-cell biology. (A) We found 81 genes with eQTLs linked to RA. The gene level eQTL
affected are marked with arrows indicating whether the risk allele increases or decreases
expression. Genes without an arrow show exon QTL effects or polyA-ratio QTLs. Genes
regulated by an eQTL showing a significant interaction with one of our 10 modules are marked
with a star. Clustering of the genes based on co-expression revealed three clusters (colored
yellow, aquamarine and blue). (B) Positive interaction for eQTL effects of RA loci. Genes in the
blue NK-cell cluster show interactions for module 3 (the NK/CD8+ T-cell module) and genes in
the aquamarine B-cell cluster show interaction in module 9 (the B-cell module). (C) Gene
function enrichment per cluster showed B-cell biology for the aquamarine cluster and NK-cell
pathways for the blue cluster. The yellow cluster shows different types of pathways not specific
to a cell type. (D) Expression levels in the cell-sorted BLUEPRINT data confirm the B-cell and
. CC-BY-NC-ND 4.0 International licensepeer-reviewed) is the author/funder. It is made available under aThe copyright holder for this preprint (which was not. http://dx.doi.org/10.1101/033217doi: bioRxiv preprint first posted online Nov. 30, 2015;

20
NK-cell annotations of the aquamarine and blue clusters. (E) Distribution of LD (r2 and D’-
values) between the top IBD variant and the top eQTL variant.
Figure 5
Figure 5. eQTLs modified by type I interferon signaling (A) The top 100 covariate genes for
module 7 are clustered based on expression levels, revealing two distinct clusters of genes.
Genes positively correlated with the top covariate (SP140) are indicated in blue and those
negatively correlated with SP140 in red. Enrichment analysis of these two clusters show distinct
biology: the up-regulated genes are enriched for type I interferon response and response to
viruses whereas the down-regulated genes indicate an anti-bacterial inflammatory response. (B)
. CC-BY-NC-ND 4.0 International licensepeer-reviewed) is the author/funder. It is made available under aThe copyright holder for this preprint (which was not. http://dx.doi.org/10.1101/033217doi: bioRxiv preprint first posted online Nov. 30, 2015;

21
The eQTLs affected by module 7 can also be divided into those genes positively or negatively
correlated with SP140 expression. The significantly positively correlated eQTL genes are also
enriched for type I interferon response, whereas the negatively correlated eQTL genes do not
show strong enrichment for biological functions. (C) Interferome DB annotation of the up-
regulated eQTL genes confirmed their role in type I (and not type II or III) interferon signaling.
Figure 6
. CC-BY-NC-ND 4.0 International licensepeer-reviewed) is the author/funder. It is made available under aThe copyright holder for this preprint (which was not. http://dx.doi.org/10.1101/033217doi: bioRxiv preprint first posted online Nov. 30, 2015;

22
Figure 6. Context-dependent eQTL effects not present in the 10 modules. (A & B) SREBF2
expression modulates the eQTL effect on FADS2. (C) The eQTL SNP affecting FADS2
expression is located in an ENCODE ChIP-seq peak of SREBF2 binding. (D) Heatmap of the
co-expression of 109 proxy genes that affect the eQTL effect on MYBL2 expression. The
different clusters show pathway function enrichments related to proliferation and cell-cycle. (E)
Regulation of MYBL2 by the different cell-cycle clusters is likely modulated via EBF1 and
rs285205. (F) Interaction plot when using EBF1 as proxy gene (G) EBF1 binds directly over the
MYBL2 eQTL SNP rs285205.
Data availability All results can be queried using our dedicated QTL browser:
http://genenetwork.nl/biosqtlbrowser/. Raw data was submitted to the European Genome-
phenome Archive (EGA, accession number EGAS00001001077).
Author contributions BTH, PACtH, JBJvM, AI, RJ and LF formed the management team of the BIOS consortium.
DIB, RP, JvD, JJH, MMJVG, CDAS, CJHvdK, CGS, CW, LF, AZ, EFG, PES, MB, JD, DvH,
JHV, LHvdB, CMvD, AH, AI, AGU managed and organized the biobanks. JBJvM, PMJ, MV, JvR
and NL generated RNA-seq data. HM, MvI, MvG, WA, JB, DVZ, RJ, PvtH, PD, MV, IN, MaS,
PACtH, BTH and MM were responsible for data management and the computational
infrastructure. DVZ, PD, MV, MvI, FvD, MvG, WA, MJB, HJW, SMK, JL, MAS, PACtH and LF
performed the data analysis. DVZ, PD, PACtH and LF drafted the manuscript.
References 1. Schaub, M. A., Boyle, A. P., Kundaje, A., Batzoglou, S. & Snyder, M. Linking disease
associations with regulatory information in the human genome. Genome Res. 22, 1748–1759 (2012).
2. Hindorff, L. A. et al. Potential etiologic and functional implications of genome-wide association loci for human diseases and traits. Proc. Natl. Acad. Sci. U. S. A. 106, 9362–7 (2009).
3. Ardlie, K. G. et al. The Genotype-Tissue Expression (GTEx) pilot analysis: Multitissue gene regulation in humans. Science (80-. ). 348, 648–660 (2015).
4. Westra, H.-J. et al. Systematic identification of trans eQTLs as putative drivers of known disease associations. Nat Genet 45, 1238–1243 (2013).
5. Lappalainen, T. et al. Transcriptome and genome sequencing uncovers functional variation in humans. Nature 501, 506–511 (2013).
. CC-BY-NC-ND 4.0 International licensepeer-reviewed) is the author/funder. It is made available under aThe copyright holder for this preprint (which was not. http://dx.doi.org/10.1101/033217doi: bioRxiv preprint first posted online Nov. 30, 2015;

23
6. Battle, A. et al. Characterizing the genetic basis of transcriptome diversity through RNA-sequencing of 922 individuals. Genome Res. 24, 14–24 (2014).
7. Nica, A. C. et al. Candidate causal regulatory effects by integration of expression QTLs with complex trait genetic associations. PLoS Genet. 6, e1000895 (2010).
8. Wright, F. A. et al. Heritability and genomics of gene expression in peripheral blood. Nat. Genet. 46, 430–7 (2014).
9. Fu, J. et al. Unraveling the regulatory mechanisms underlying tissue-dependent genetic variation of gene expression. PLoS Genet 8, e1002431 (2012).
10. Fairfax, B. P. et al. Genetics of gene expression in primary immune cells identifies cell type-specific master regulators and roles of HLA alleles. Nat. Genet. 44, 502–10 (2012).
11. Andiappan, A. K. et al. Genome-wide analysis of the genetic regulation of gene expression in human neutrophils. Nat. Commun. 6, 7971 (2015).
12. Francesconi, M. & Lehner, B. The effects of genetic variation on gene expression dynamics during development. Nature 505, 208–11 (2014).
13. Powell, J. E. et al. Genetic control of gene expression in whole blood and lymphoblastoid cell lines is largely independent. Genome Res. 22, 456–66 (2012).
14. Deelen, P. et al. Calling genotypes from public RNA-sequencing data enables identification of genetic variants that affect gene-expression levels. Genome Med. 7, 30 (2015).
15. Fairfax, B. P. et al. Innate immune activity conditions the effect of regulatory variants upon monocyte gene expression. Science 343, 1246949 (2014).
16. Çalışkan, M., Baker, S. W., Gilad, Y. & Ober, C. Host genetic variation influences gene expression response to rhinovirus infection. PLoS Genet. 11, e1005111 (2015).
17. Idaghdour, Y. et al. Geographical genomics of human leukocyte gene expression variation in southern Morocco. Nat. Genet. 42, 62–7 (2010).
18. Yao, C. et al. Sex- and age-interacting eQTLs in human complex diseases. Hum. Mol. Genet. 23, 1947–56 (2014).
19. Lee, M. N. et al. Common Genetic Variants Modulate Pathogen-Sensing Responses in Human Dendritic Cells. Science (80-. ). 343, 1246980–1246980 (2014).
20. Knowles, D. A. et al. Allele-specific expression reveals interactions between genetic variation and environment. bioRxiv (2015). at <http://biorxiv.org/content/early/2015/09/13/025874.abstract>
21. van Greevenbroek, M. M. J. et al. The cross-sectional association between insulin resistance and circulating complement C3 is partly explained by plasma alanine aminotransferase, independent of central obesity and general inflammation (the CODAM study). Eur. J. Clin. Invest. 41, 372–379 (2011).
22. Tigchelaar, E. F. et al. Cohort profile: LifeLines DEEP, a prospective, general population cohort study in the northern Netherlands: study design and baseline characteristics. BMJ Open 5 , (2015).
23. Schoenmaker, M. et al. Evidence of genetic enrichment for exceptional survival using a
. CC-BY-NC-ND 4.0 International licensepeer-reviewed) is the author/funder. It is made available under aThe copyright holder for this preprint (which was not. http://dx.doi.org/10.1101/033217doi: bioRxiv preprint first posted online Nov. 30, 2015;
24
family approach: the Leiden Longevity Study. Eur. J. Hum. Genet. 14, 79–84 (2006).
24. Hofman, A. et al. The rotterdam study: 2014 objectives and design update. Eur. J. Epidemiol. 28, 889–926 (2013).
25. Wood, A. R. et al. Allelic heterogeneity and more detailed analyses of known loci explain additional phenotypic variation and reveal complex patterns of association. Hum. Mol. Genet. 20, 4082–92 (2011).
26. Ritchie, G. R. S., Dunham, I., Zeggini, E. & Flicek, P. Functional annotation of noncoding sequence variants. Nat. Methods 11, 294–6 (2014).
27. Andersson, R. et al. An atlas of active enhancers across human cell types and tissues. Nature 507, 455–61 (2014).
28. Westra, H.-J. et al. Cell Specific eQTL Analysis without Sorting Cells. PLoS Genet. 11, e1005223 (2015).
29. Adams, D. et al. BLUEPRINT to decode the epigenetic signature written in blood. Nat. Biotechnol. 30, 224–226 (2012).
30. Dore, L. C. & Crispino, J. D. Transcription factor networks in erythroid cell and megakaryocyte development. Blood 118, 231–239 (2011).
31. Hall, M. A. et al. The critical regulator of embryonic hematopoiesis, SCL, is vital in the adult for megakaryopoiesis, erythropoiesis, and lineage choice in CFU-S12. Proc. Natl. Acad. Sci. U. S. A. 100, 992–7 (2003).
32. Pevny, L. et al. Erythroid differentiation in chimaeric mice blocked by a targeted mutation in the gene for transcription factor GATA-1. Nature 349, 257–60 (1991).
33. Liu, J. Z. et al. Association analyses identify 38 susceptibility loci for inflammatory bowel disease and highlight shared genetic risk across populations. Nat. Genet. 47, (2015).
34. Fournier, B. M. & Parkos, C. A. The role of neutrophils during intestinal inflammation. Mucosal Immunol. 5, 354–366 (2012).
35. Funderburg, N. T. et al. Circulating CD4(+) and CD8(+) T cells are activated in inflammatory bowel disease and are associated with plasma markers of inflammation. Immunology 140, 87–97 (2013).
36. Huang, C. et al. Cutting Edge: a novel, human-specific interacting protein couples FOXP3 to a chromatin-remodeling complex that contains KAP1/TRIM28. J. Immunol. 190, 4470–3 (2013).
37. Holmqvist, M. E. et al. Risk of Venous Thromboembolism in Patients With Rheumatoid Arthritis and Association With Disease Duration and Hospitalization. JAMA 308, 1350 (2012).
38. Raghu, H. et al. Transglutaminase factor XIII promotes arthritis through mechanisms linked to inflammation and bone erosion. Blood 125, 427–37 (2015).
39. Rusinova, I. et al. Interferome v2.0: an updated database of annotated interferon-regulated genes. Nucleic Acids Res. 41, D1040–6 (2013).
40. Platanias, L. C. Mechanisms of type-I- and type-II-interferon-mediated signalling. Nat. Rev. Immunol. 5, 375–86 (2005).
. CC-BY-NC-ND 4.0 International licensepeer-reviewed) is the author/funder. It is made available under aThe copyright holder for this preprint (which was not. http://dx.doi.org/10.1101/033217doi: bioRxiv preprint first posted online Nov. 30, 2015;

25
41. Ivashkiv, L. B. & Donlin, L. T. Regulation of type I interferon responses. Nat. Rev. Immunol. 14, 36–49 (2014).
42. McLeay, R. C. & Bailey, T. L. Motif Enrichment Analysis: a unified framework and an evaluation on ChIP data. BMC Bioinformatics 11, 165 (2010).
43. Heinrichs, S. et al. MYBL2 is a sub-haploinsufficient tumor suppressor gene in myeloid malignancy. Elife 2, e00825 (2013).
44. Facchetti, F., Cella, M., Festa, S., Fremont, D. H. & Colonna, M. An unusual Fc receptor-related protein expressed in human centroblasts. Proc. Natl. Acad. Sci. U. S. A. 99, 3776–81 (2002).
45. Rosén, A. et al. Lymphoblastoid cell line with B1 cell characteristics established from a chronic lymphocytic leukemia clone by in vitro EBV infection. Oncoimmunology 1, 18–27 (2012).
46. Huang, H. et al. Association mapping of inflammatory bowel disease loci to single variant resolution. bioRxiv (2015). at <http://biorxiv.org/content/early/2015/10/20/028688.abstract>
47. Naranbhai, V. et al. Genomic modulators of gene expression in human neutrophils. Nat. Commun. 6, 7545 (2015).
. CC-BY-NC-ND 4.0 International licensepeer-reviewed) is the author/funder. It is made available under aThe copyright holder for this preprint (which was not. http://dx.doi.org/10.1101/033217doi: bioRxiv preprint first posted online Nov. 30, 2015;