Embed Size (px)
Citation preview

Hypothesis Tests
IEF 217a: Lecture 2.b
Fall 2002
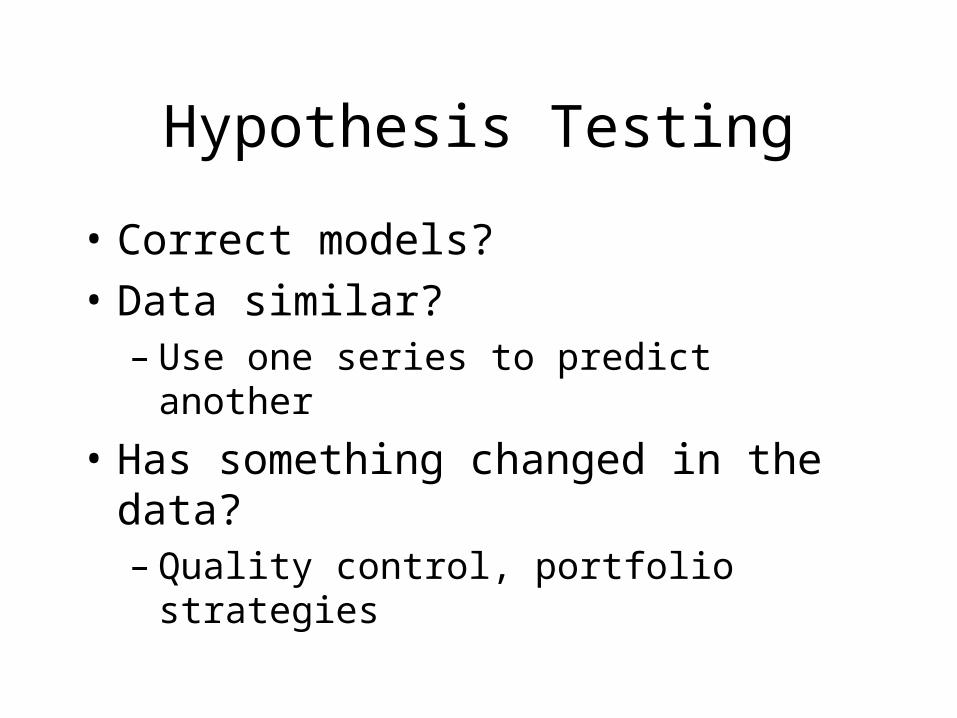
Hypothesis Testing
• Correct models?
• Data similar?– Use one series to predict another
• Has something changed in the data?– Quality control, portfolio strategies
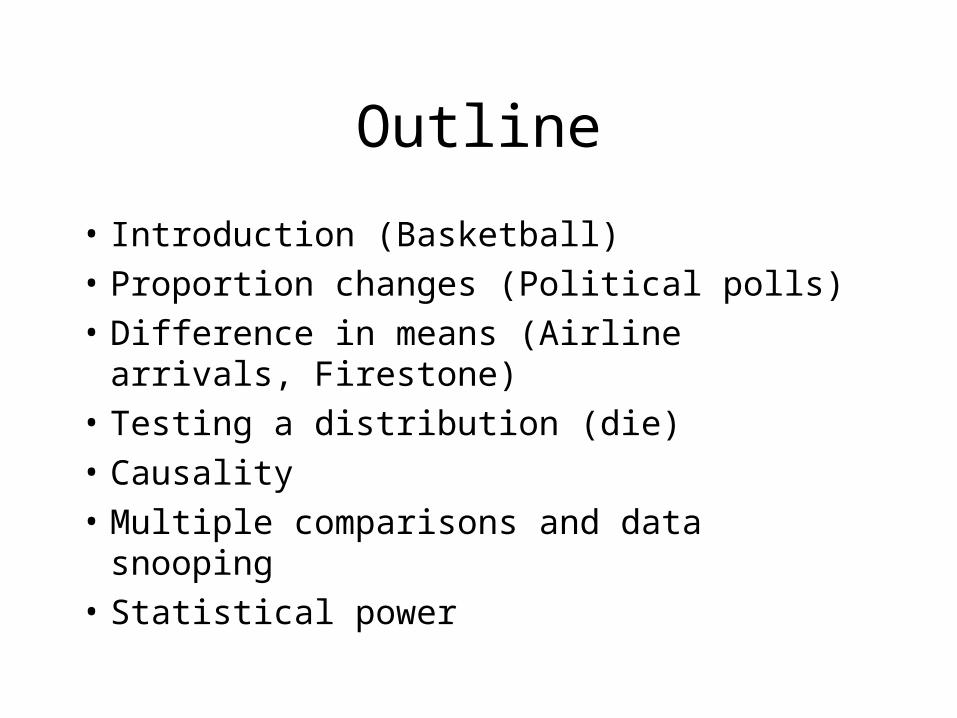
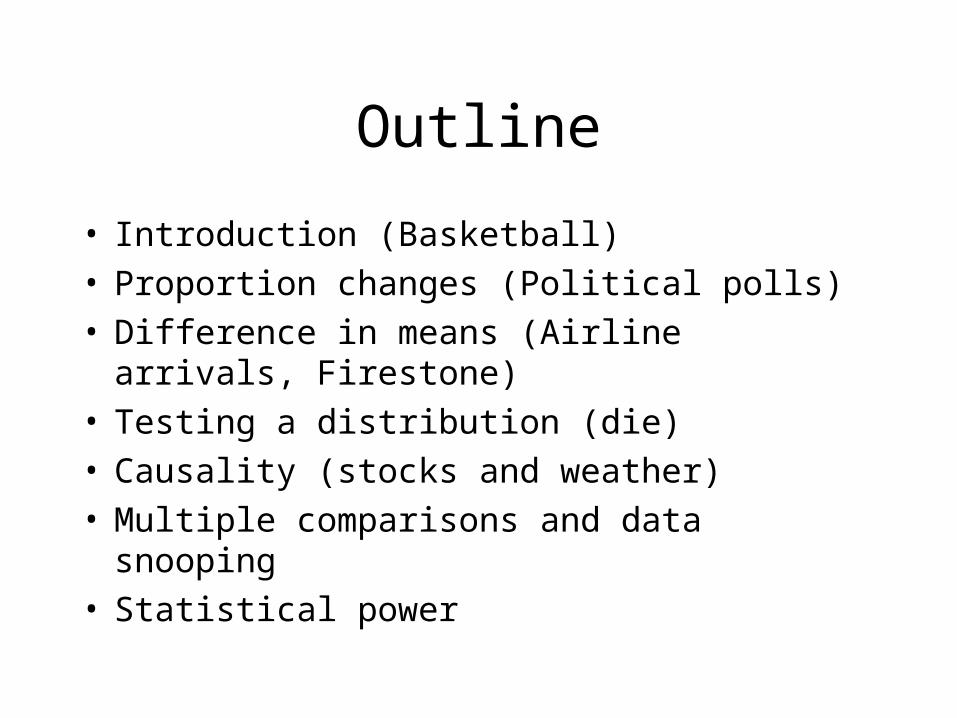
Outline
• Introduction (Basketball)
• Proportion changes (Political polls)
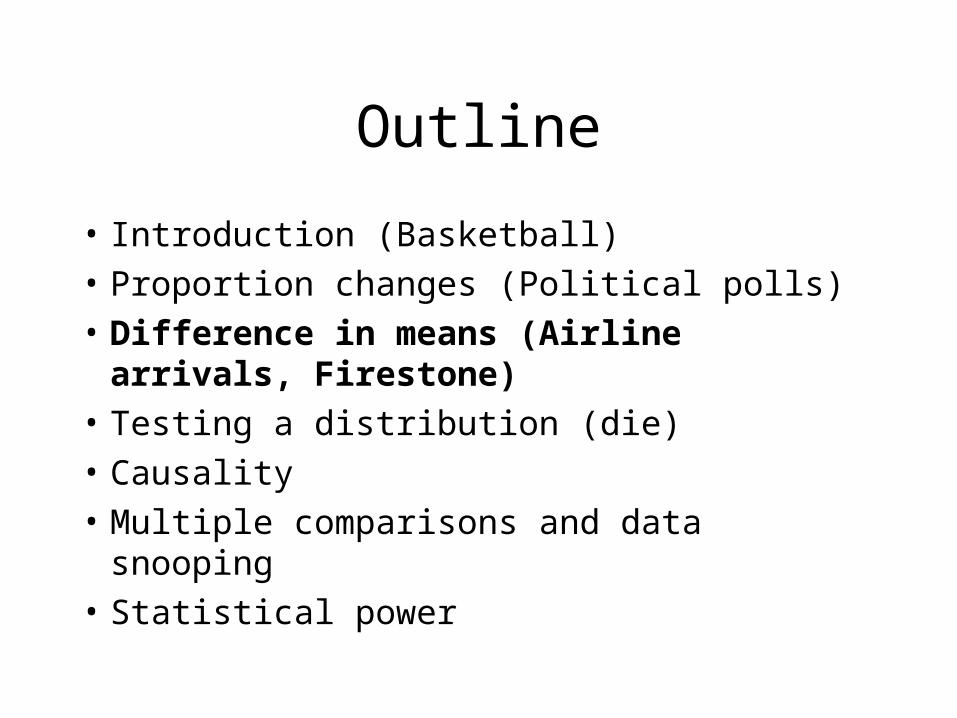
• Difference in means (Airline arrivals, Firestone)
• Testing a distribution (die)
• Causality
• Multiple comparisons and data snooping
• Statistical power
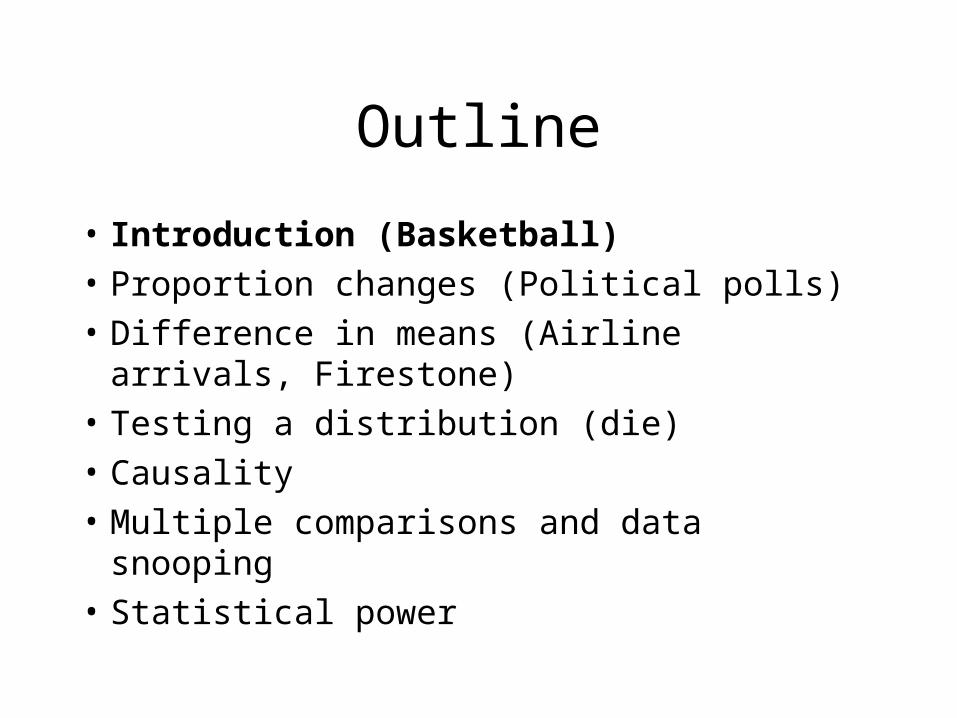
Outline
• Introduction (Basketball)
• Proportion changes (Political polls)
• Difference in means (Airline arrivals, Firestone)
• Testing a distribution (die)
• Causality
• Multiple comparisons and data snooping
• Statistical power
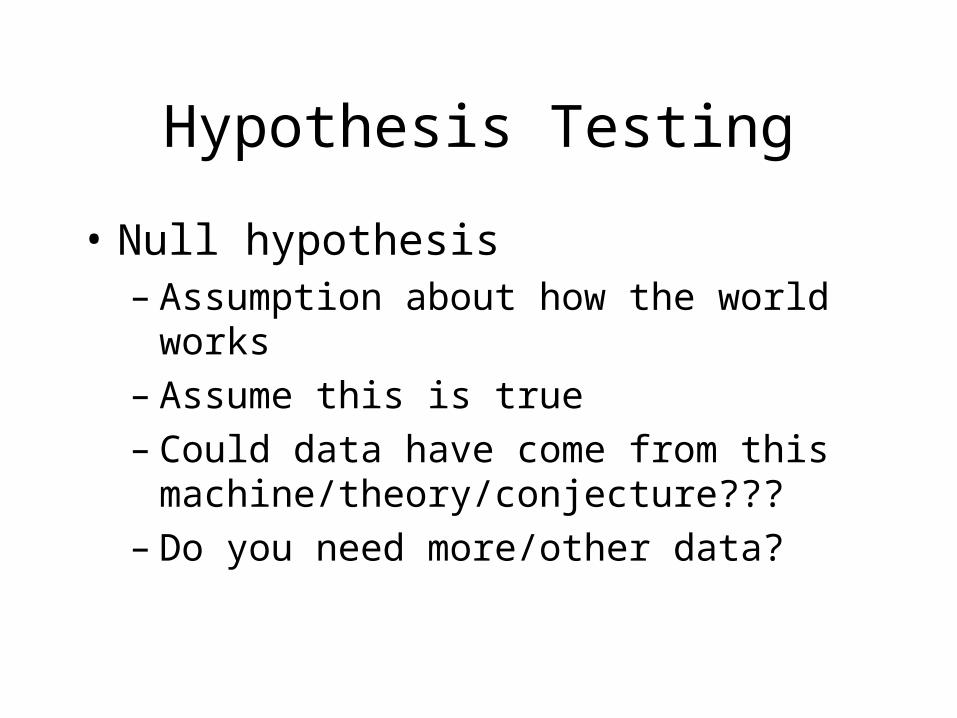
Hypothesis Testing
• Null hypothesis– Assumption about how the world works– Assume this is true– Could data have come from this
machine/theory/conjecture???– Do you need more/other data?
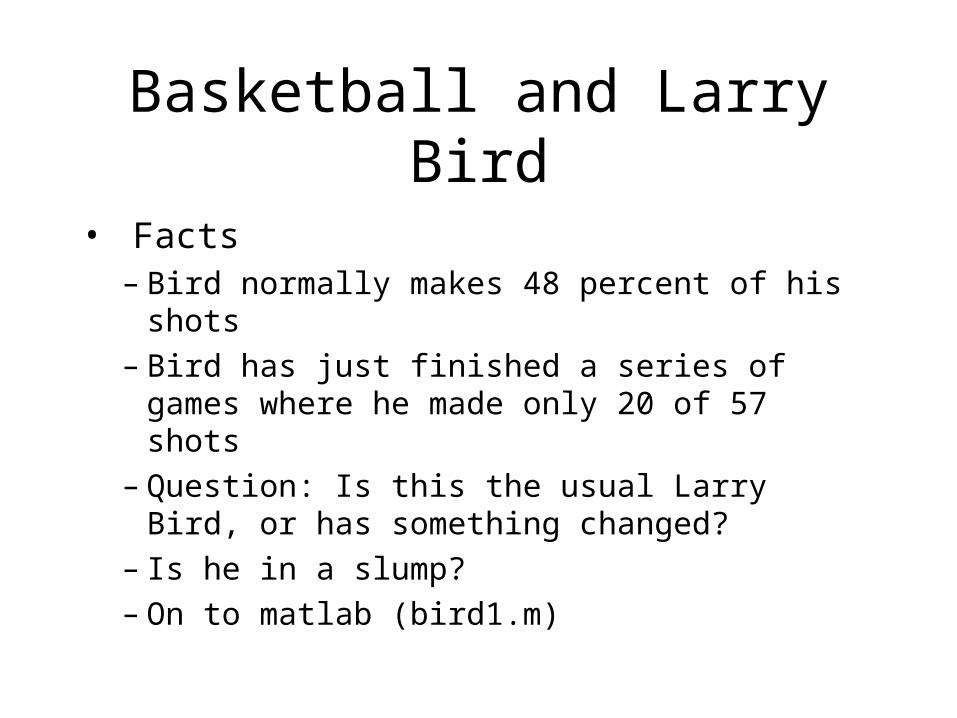
Basketball and Larry Bird
• Facts– Bird normally makes 48 percent of his shots– Bird has just finished a series of games where
he made only 20 of 57 shots– Question: Is this the usual Larry Bird, or has
something changed?– Is he in a slump?– On to matlab (bird1.m)
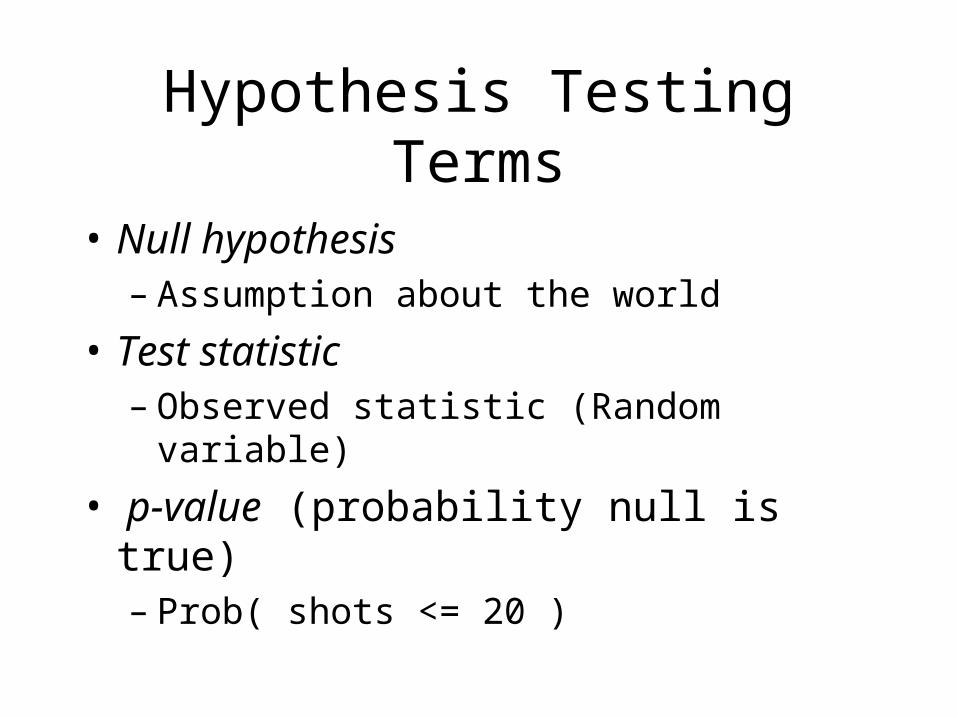
Hypothesis Testing Terms
• Null hypothesis– Assumption about the world
• Test statistic – Observed statistic (Random variable)
• p-value (probability null is true)– Prob( shots <= 20 )

Outline
• Introduction (Basketball)
• Proportion changes (Political polls)
• Difference in means (Airline arrivals, Firestone)
• Testing a distribution (die)
• Causality
• Multiple comparisons and data snooping
• Statistical power
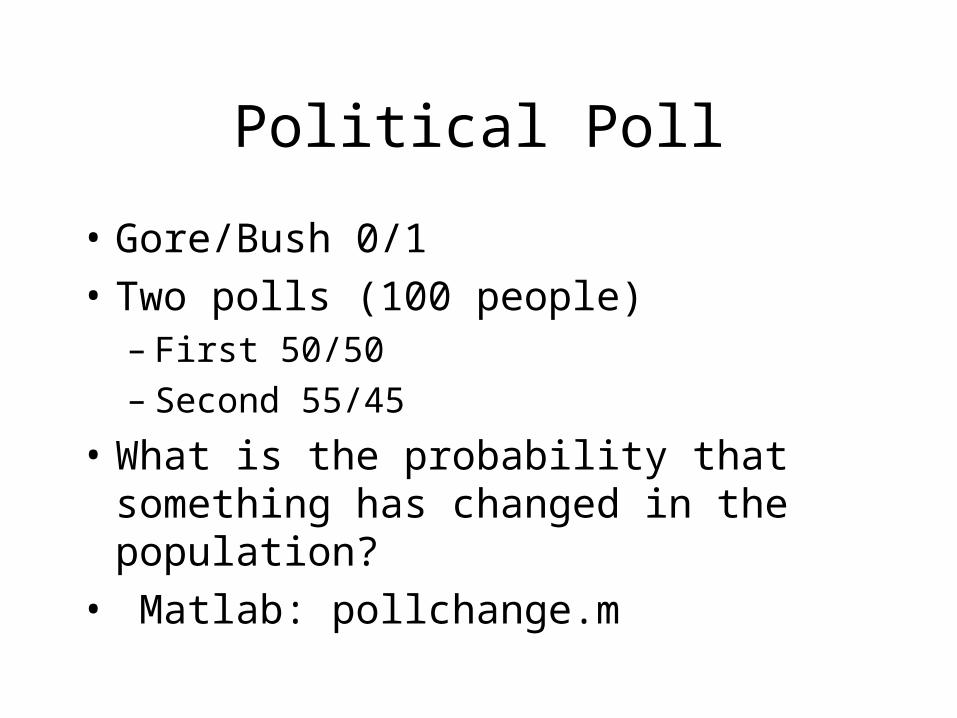
Political Poll
• Gore/Bush 0/1
• Two polls (100 people)– First 50/50– Second 55/45
• What is the probability that something has changed in the population?
• Matlab: pollchange.m
Outline
• Introduction (Basketball)
• Proportion changes (Political polls)
• Difference in means (Airline arrivals, Firestone)
• Testing a distribution (die)
• Causality
• Multiple comparisons and data snooping
• Statistical power
Differences in Means
• Two samples
• Different means
• Could they be drawn from the same population?
• Examples– Has something changed?
• Flights (time)
• Tires (Firestone)
Flight Delays
• Two series (minutes late)– Before mechanics threat of delays– After mechanics threat of delays
• More delays after threat
• Compare to pooled data
• Null = two series are the same
• Could the mean difference between the two come from the pooled series?
Flight Delays
• Matlab code: airline.m
• Note: Fancy histogram code
Firestone
• Overall tires have a failure rate of 5 in 1000
• You have observed in a sample of 10,000 tires a failure rate of 60
• Is something wrong with Firestone tires?
• Matlab: firestone.m
Outline
• Introduction (Basketball)
• Proportion changes (Political polls)
• Difference in means (Airline arrivals, Firestone)
• Testing a distribution (die)
• Causality
• Multiple comparisons and data snooping
• Statistical power
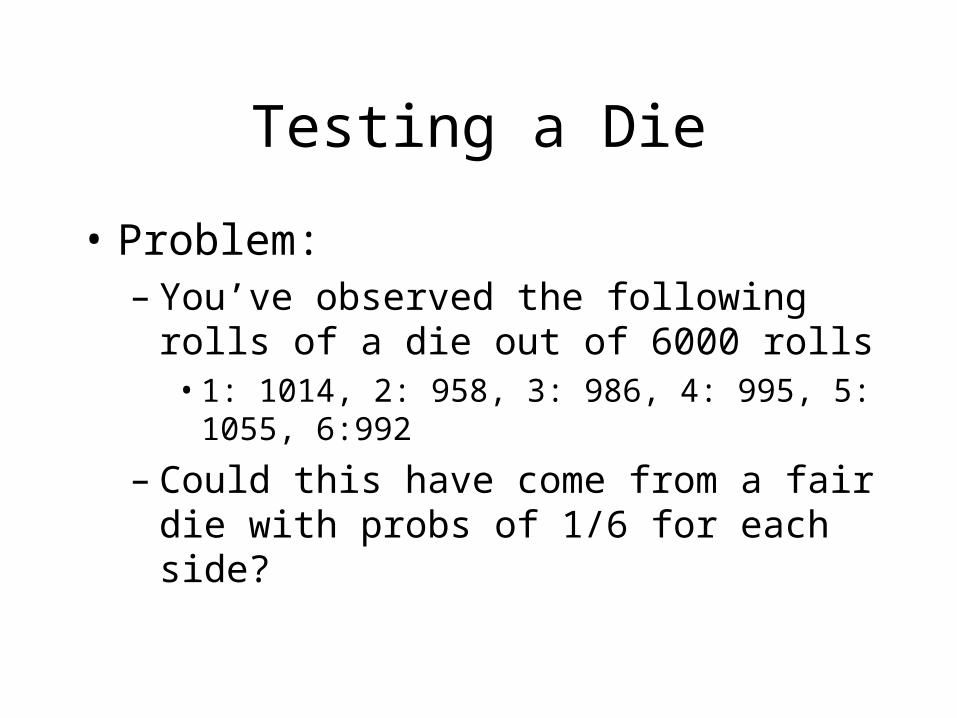
Testing a Die
• Problem:– You’ve observed the following rolls of a die
out of 6000 rolls• 1: 1014, 2: 958, 3: 986, 4: 995, 5: 1055, 6:992
– Could this have come from a fair die with probs of 1/6 for each side?
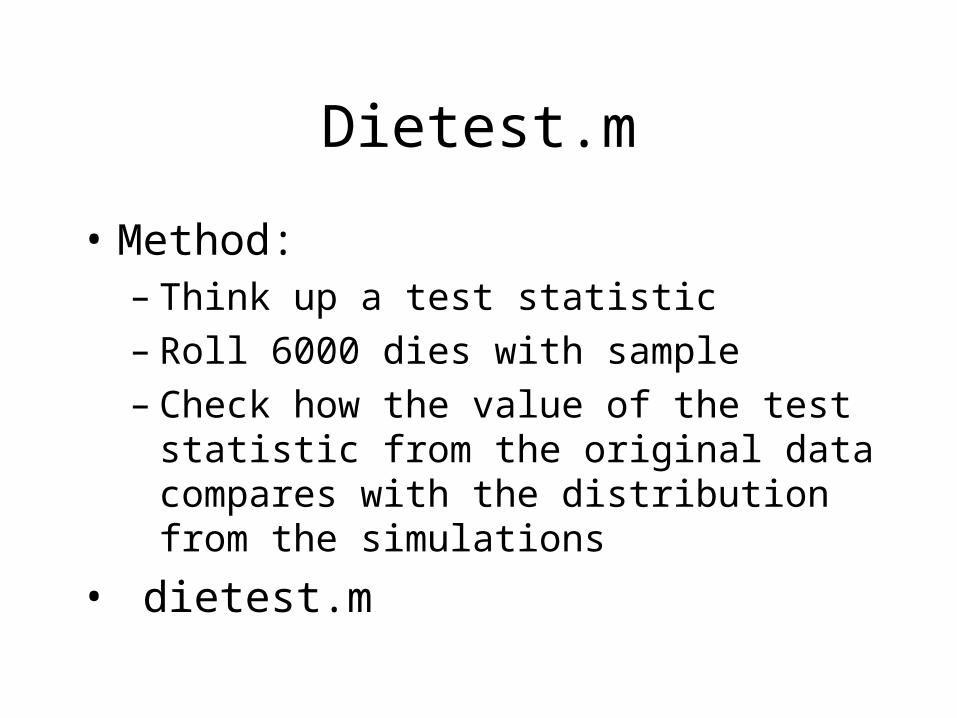
Dietest.m
• Method:– Think up a test statistic– Roll 6000 dies with sample– Check how the value of the test statistic from
the original data compares with the distribution from the simulations
• dietest.m

Outline
• Introduction (Basketball)
• Proportion changes (Political polls)
• Difference in means (Airline arrivals, Firestone)
• Testing a distribution (die)
• Causality
• Multiple comparisons and data snooping
• Statistical power
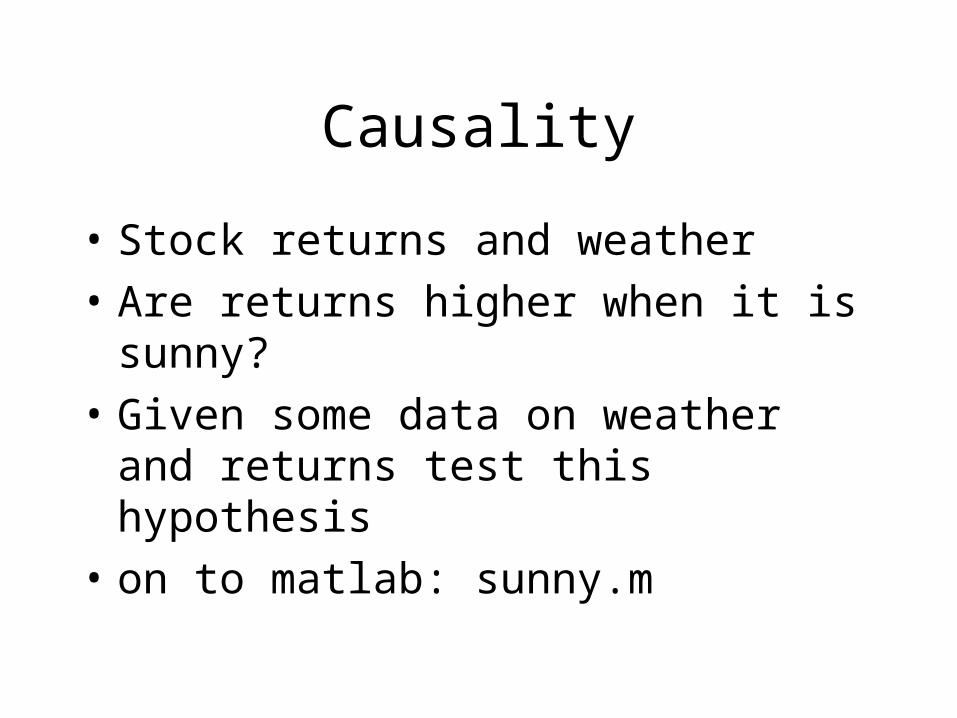
Causality
• Stock returns and weather
• Are returns higher when it is sunny?
• Given some data on weather and returns test this hypothesis
• on to matlab: sunny.m
Outline
• Introduction (Basketball)
• Proportion changes (Political polls)
• Difference in means (Airline arrivals, Firestone)
• Testing a distribution (die)
• Causality
• Multiple comparisons and data snooping
• Statistical power
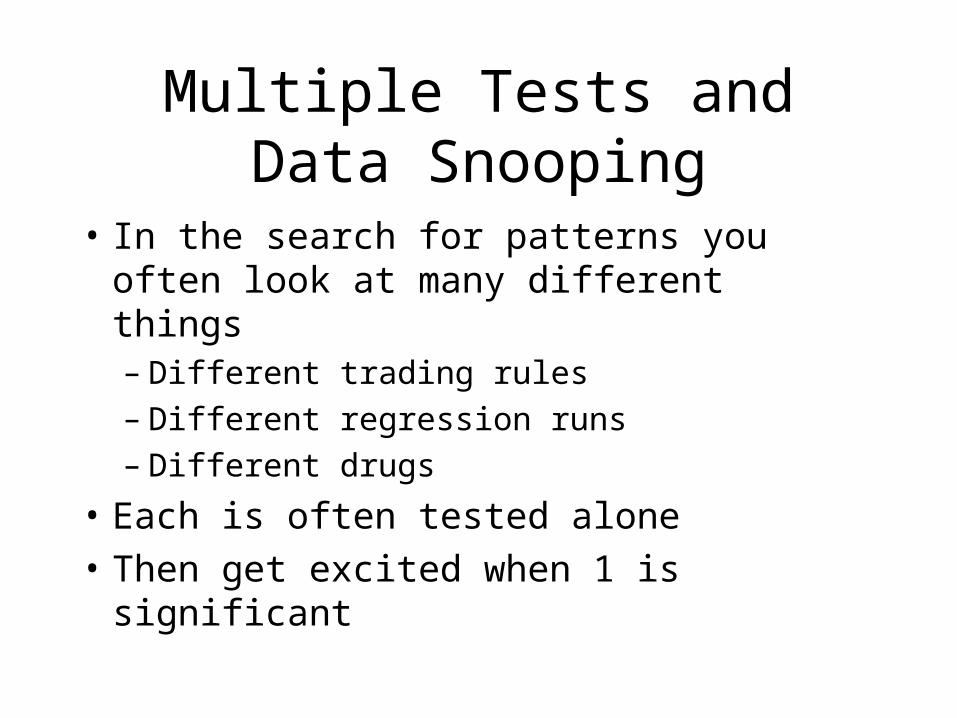
Multiple Tests and Data Snooping
• In the search for patterns you often look at many different things– Different trading rules– Different regression runs– Different drugs
• Each is often tested alone
• Then get excited when 1 is significant
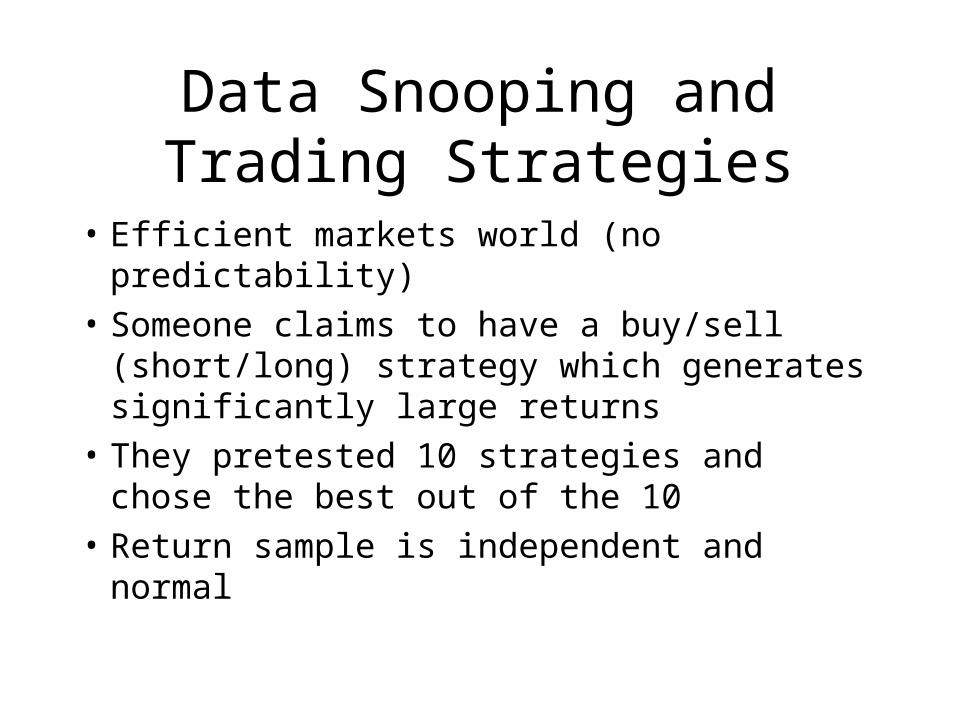
Data Snooping and Trading Strategies
• Efficient markets world (no predictability)
• Someone claims to have a buy/sell (short/long) strategy which generates significantly large returns
• They pretested 10 strategies and chose the best out of the 10
• Return sample is independent and normal
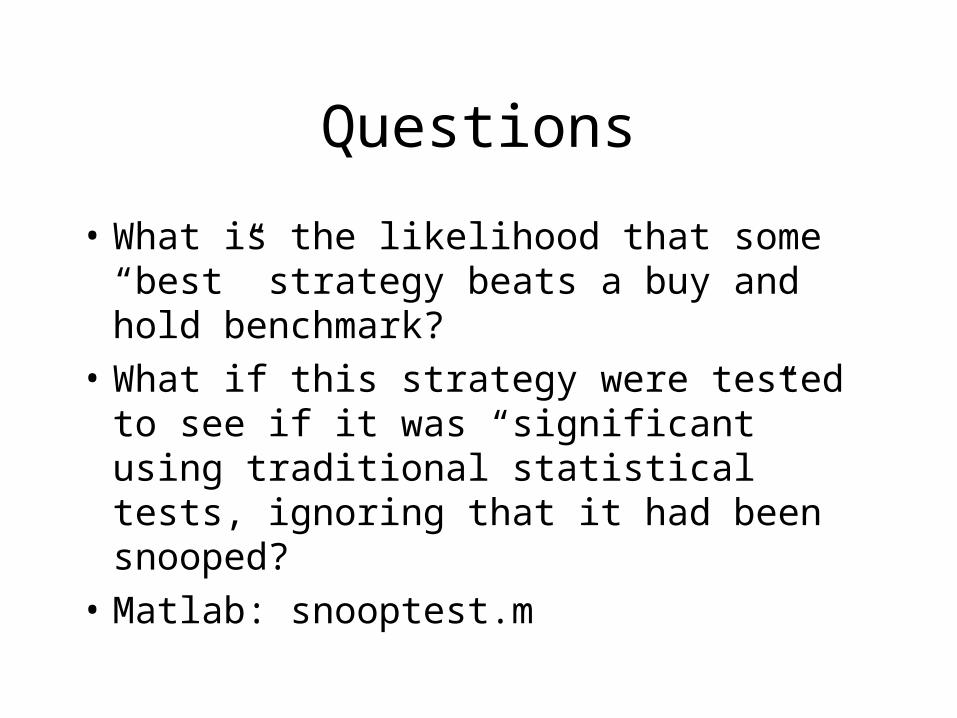
Questions
• What is the likelihood that some “best” strategy beats a buy and hold benchmark?
• What if this strategy were tested to see if it was “significant” using traditional statistical tests, ignoring that it had been snooped?
• Matlab: snooptest.m
Other Applications
• Many other trading strategies– More later
• Multiple regressions– Run 20 regressions of y = a + bx for different x– Report only those with significant b– Common economist sin
Outline
• Introduction (Basketball)
• Proportion changes (Political polls)
• Difference in means (Airline arrivals, Firestone)
• Testing a distribution (die)
• Causality
• Multiple comparisons and data snooping
• Statistical power
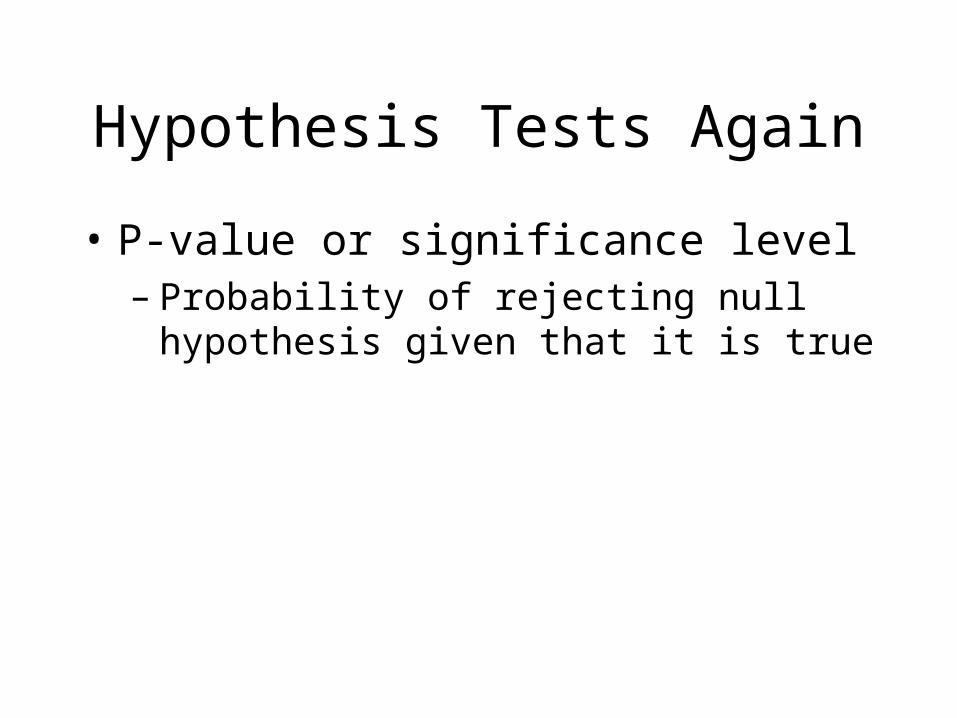
Hypothesis Tests Again
• P-value or significance level– Probability of rejecting null hypothesis given
that it is true
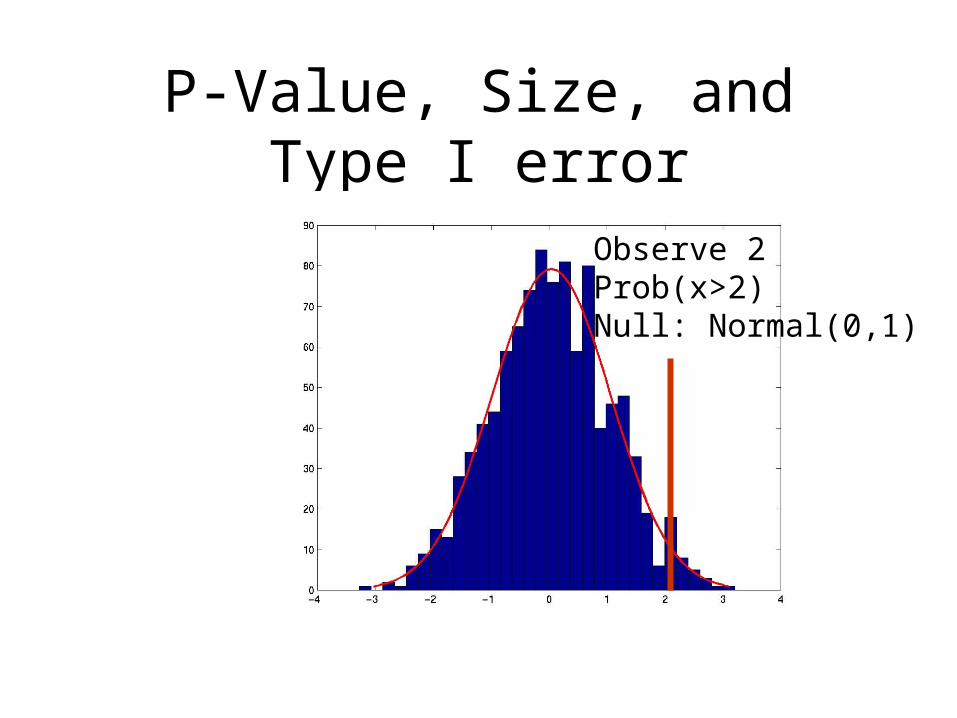
P-Value, Size, and Type I error
Observe 2Prob(x>2)Null: Normal(0,1)
Hypothesis Tests Again
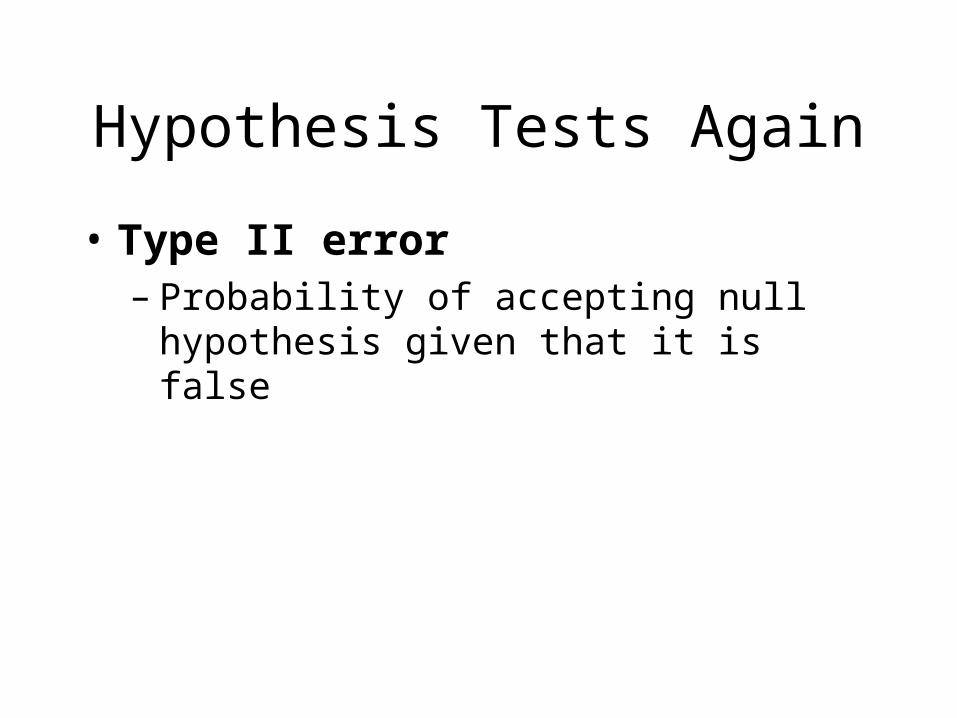
• Type II error– Probability of accepting null hypothesis given
that it is false
Hypothesis Tests Again
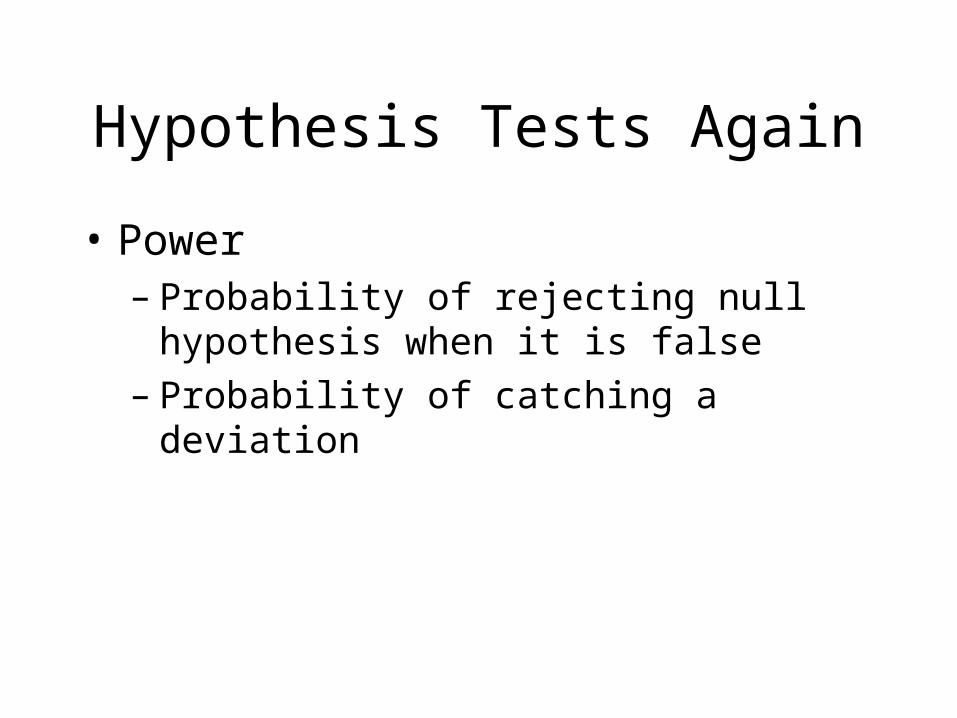
• Power– Probability of rejecting null hypothesis when it
is false– Probability of catching a deviation
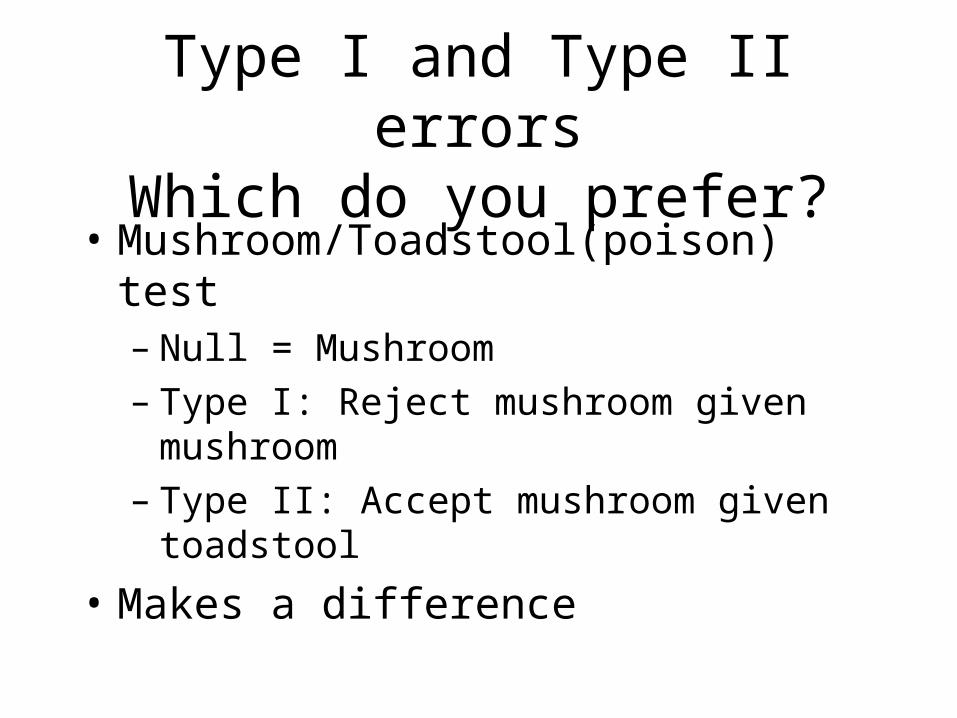
Type I and Type II errorsWhich do you prefer?
• Mushroom/Toadstool(poison) test– Null = Mushroom– Type I: Reject mushroom given mushroom– Type II: Accept mushroom given toadstool
• Makes a difference
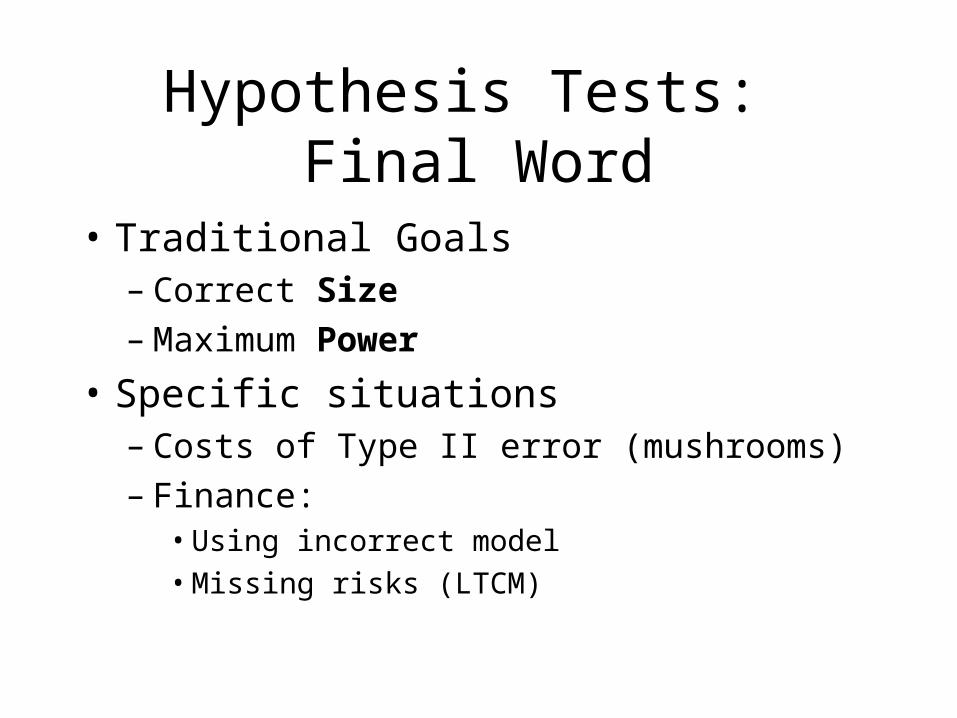
Hypothesis Tests: Final Word
• Traditional Goals– Correct Size– Maximum Power
• Specific situations– Costs of Type II error (mushrooms)– Finance:
• Using incorrect model
• Missing risks (LTCM)
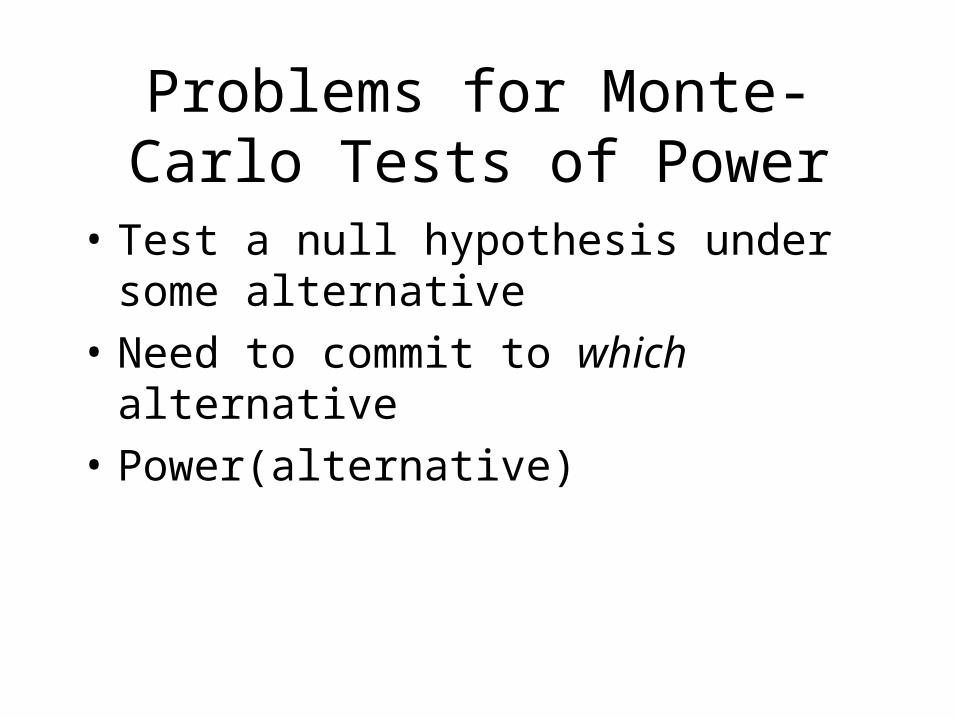
Problems for Monte-Carlo Tests of Power
• Test a null hypothesis under some alternative
• Need to commit to which alternative
• Power(alternative)
Outline
• Introduction (Basketball)• Proportion changes (Political polls)• Difference in means (Airline arrivals, Firestone)• Testing a distribution (die)• Causality (stocks and weather)• Multiple comparisons and data snooping• Statistical power