Embed Size (px)
Citation preview
Hypothesis Tests: Two Related Samples
Related SamplesRelated Samples
• The same participants give us data The same participants give us data on two measureson two measures e. g. Before and After treatmente. g. Before and After treatment Aggressive responses before video and Aggressive responses before video and
aggressive responses afteraggressive responses after
• With related samples, someone high With related samples, someone high on one measure is probably high on on one measure is probably high on other.other.
Cont.
Related Samples--cont.Related Samples--cont.
• Correlation between before and Correlation between before and after scoresafter scores Causes a change in the statistic we can Causes a change in the statistic we can
useuse
• Sometimes called matched samples Sometimes called matched samples or repeated measuresor repeated measures
Difference ScoresDifference Scores
• Calculate difference between first Calculate difference between first and second scoreand second score e. g. Difference = Before - Aftere. g. Difference = Before - After
• Base subsequent analysis on Base subsequent analysis on difference scoresdifference scores Ignoring Before and After dataIgnoring Before and After data
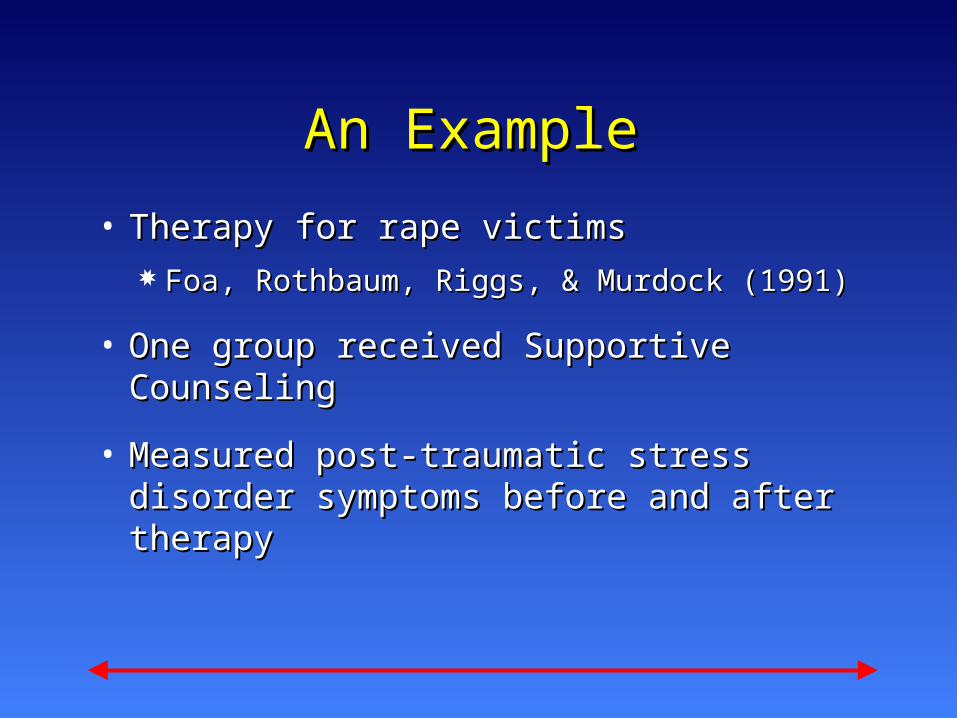
An ExampleAn Example
• Therapy for rape victimsTherapy for rape victims Foa, Rothbaum, Riggs, & Murdock (1991)Foa, Rothbaum, Riggs, & Murdock (1991)
• One group received Supportive One group received Supportive CounselingCounseling
• Measured post-traumatic stress Measured post-traumatic stress disorder symptoms before and after disorder symptoms before and after therapytherapy
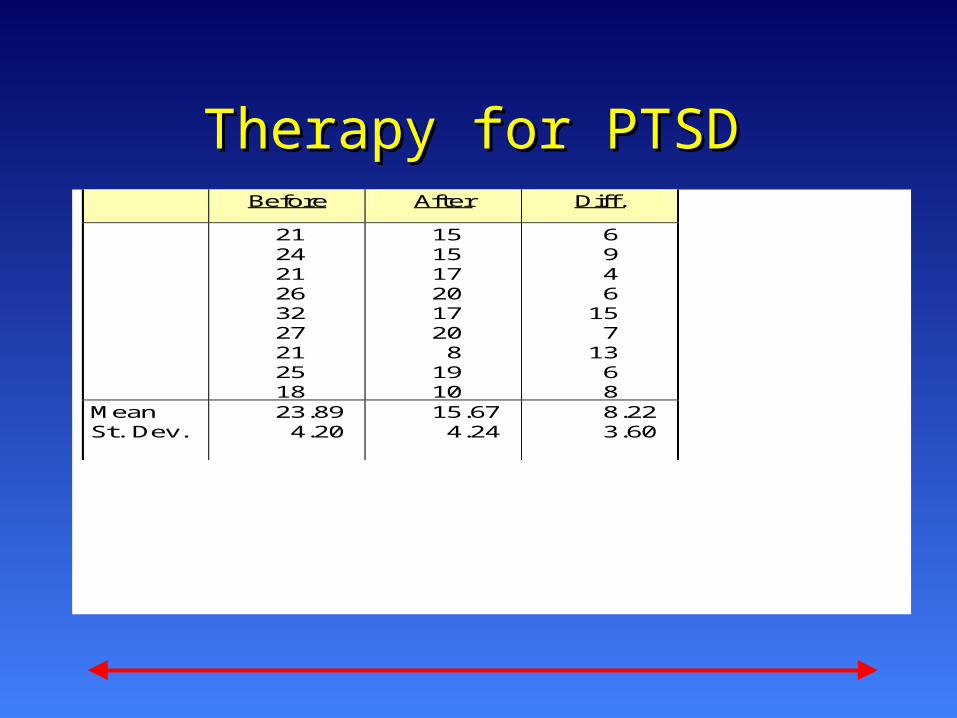
Therapy for PTSDTherapy for PTSD Before After Diff.
21 24 21 26 32 27 21 25 18
15 15 17 20 17 20 8
19 10
6 9 4 6
15 7
13 6 8
Mean St. Dev.
23.89 4.20
15.67 4.24
8.22 3.60
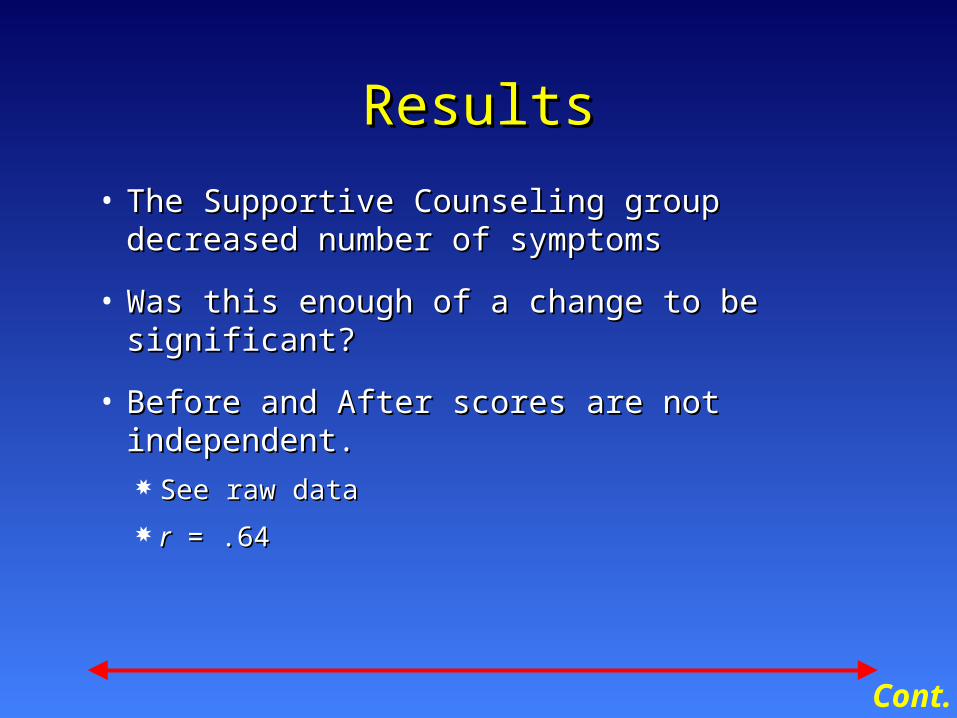
ResultsResults
• The Supportive Counseling group decreased The Supportive Counseling group decreased number of symptomsnumber of symptoms
• Was this enough of a change to be Was this enough of a change to be significant?significant?
• Before and After scores are not Before and After scores are not independent.independent. See raw dataSee raw data
rr = .64 = .64
Cont.
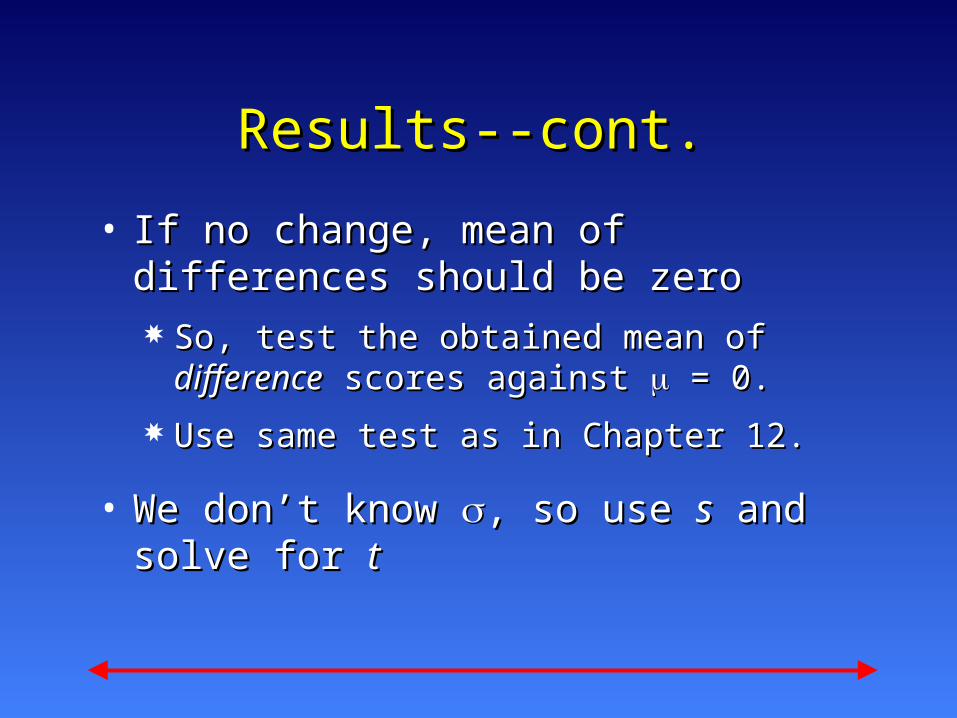
Results--cont.Results--cont.
• If no change, mean of differences If no change, mean of differences should be zeroshould be zero So, test the obtained mean of So, test the obtained mean of
differencedifference scores against scores against = 0. = 0.
Use same test as in Chapter 12.Use same test as in Chapter 12.
• We don’t know We don’t know , so use , so use ss and solve and solve for for tt
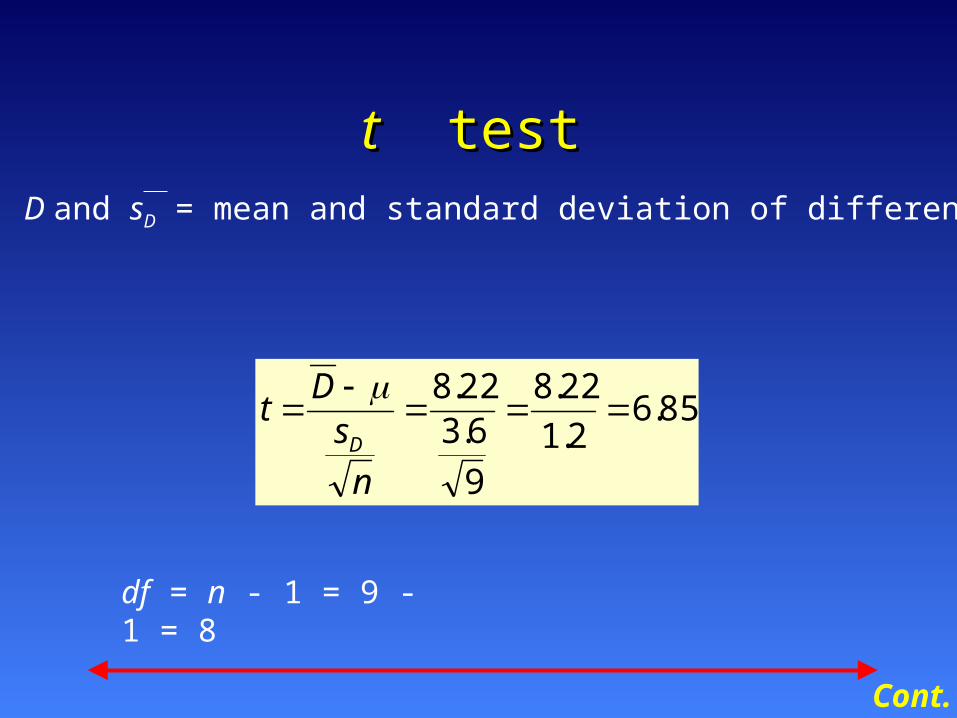
tt test test
85.62.1
22.8
9
6.322.8
n
sD
tD
D and sD = mean and standard deviation of differences.
df = n - 1 = 9 - 1 = 8
Cont.
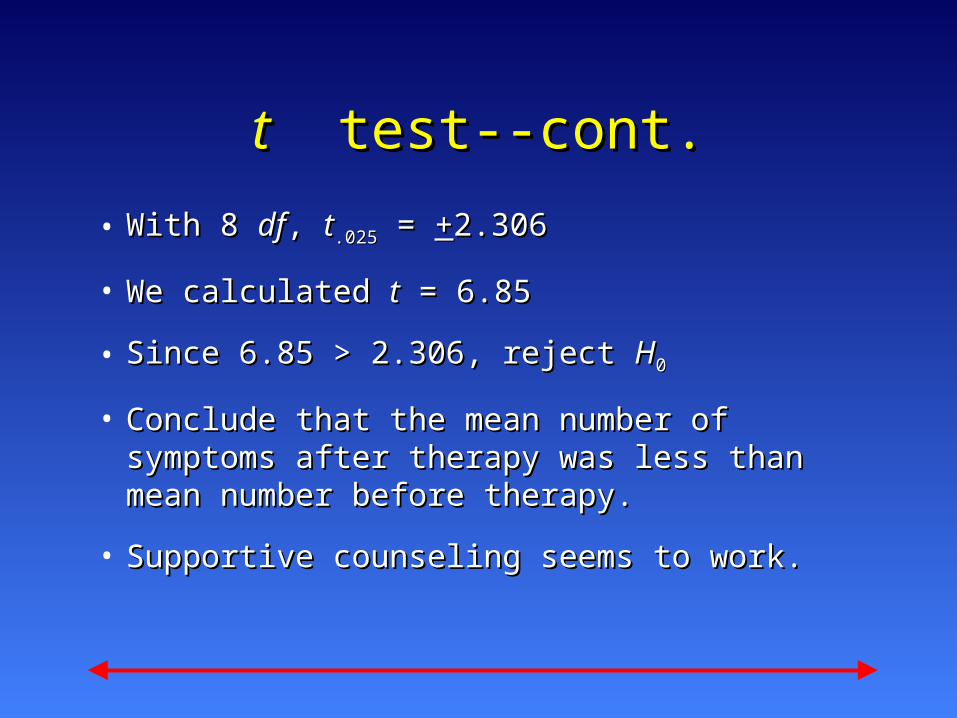
tt test--cont. test--cont.
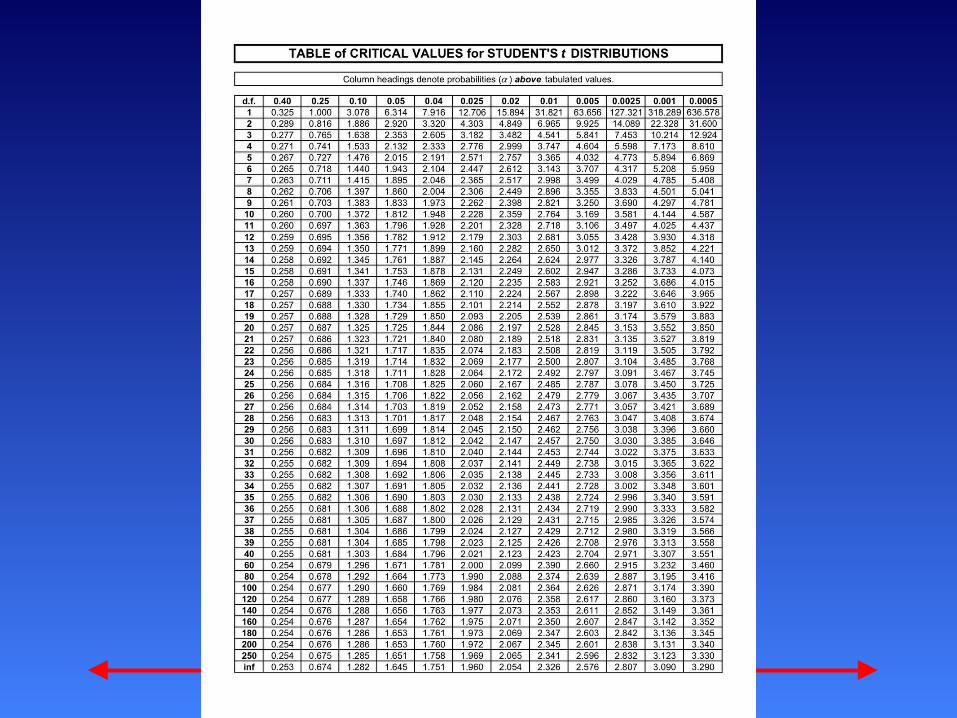
• With 8 With 8 dfdf, , tt.025.025 = = ++2.3062.306
• We calculated We calculated tt = 6.85 = 6.85
• Since 6.85 > 2.306, reject Since 6.85 > 2.306, reject HH00
• Conclude that the mean number of Conclude that the mean number of symptoms after therapy was less than mean symptoms after therapy was less than mean number before therapy.number before therapy.
• Supportive counseling seems to work.Supportive counseling seems to work.
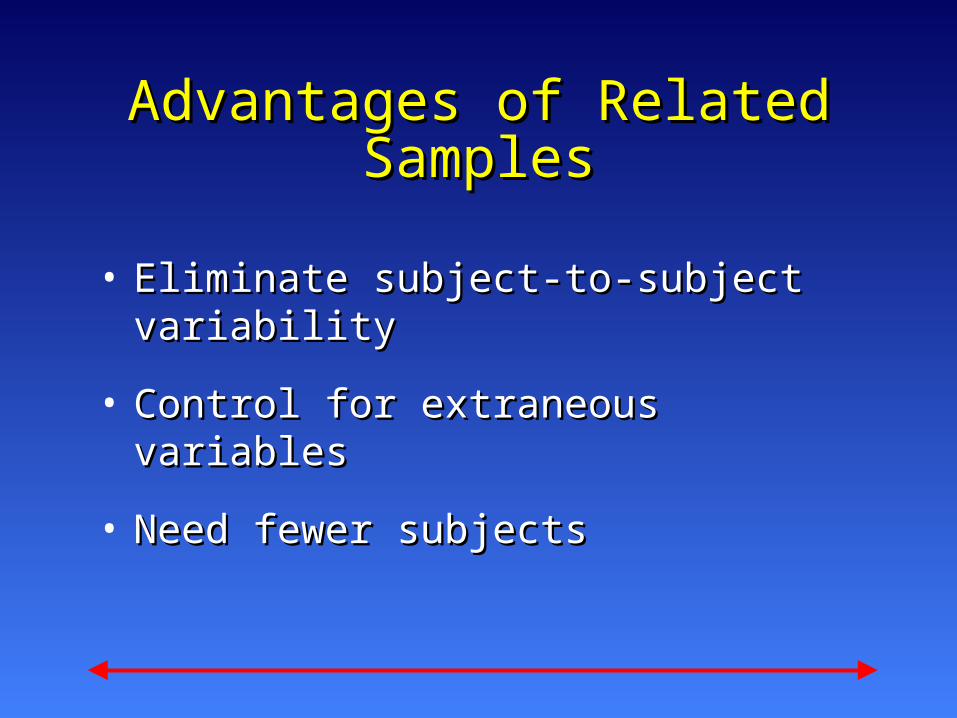
Advantages of Related Advantages of Related SamplesSamples
• Eliminate subject-to-subject Eliminate subject-to-subject variabilityvariability
• Control for extraneous variablesControl for extraneous variables
• Need fewer subjectsNeed fewer subjects
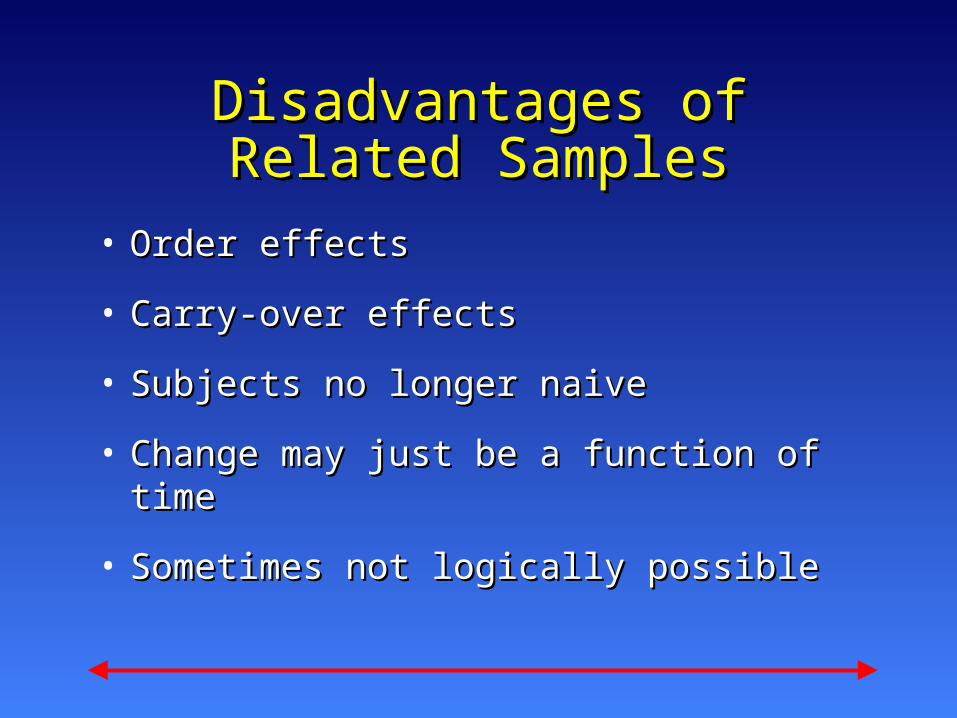
Disadvantages of Related Disadvantages of Related SamplesSamples
• Order effectsOrder effects
• Carry-over effectsCarry-over effects
• Subjects no longer naiveSubjects no longer naive
• Change may just be a function of timeChange may just be a function of time
• Sometimes not logically possibleSometimes not logically possible
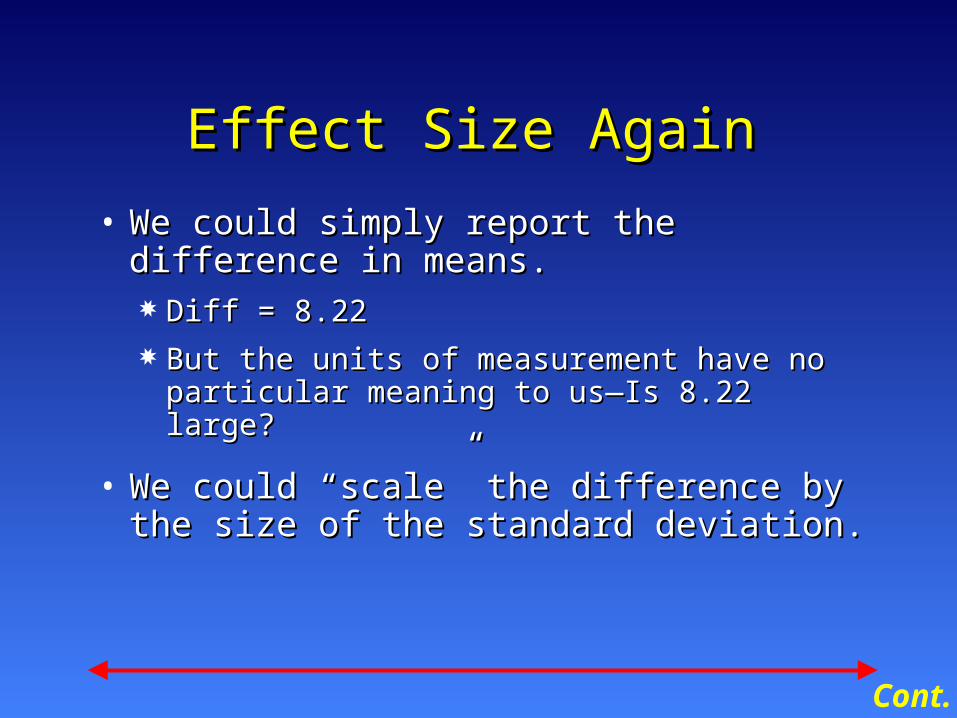
Effect Size AgainEffect Size Again
• We could simply report the We could simply report the difference in means.difference in means. Diff = 8.22Diff = 8.22 But the units of measurement have no But the units of measurement have no
particular meaning to us—Is 8.22 particular meaning to us—Is 8.22 large?large?
• We could “scale” the difference by We could “scale” the difference by the size of the standard deviation.the size of the standard deviation.
Cont.
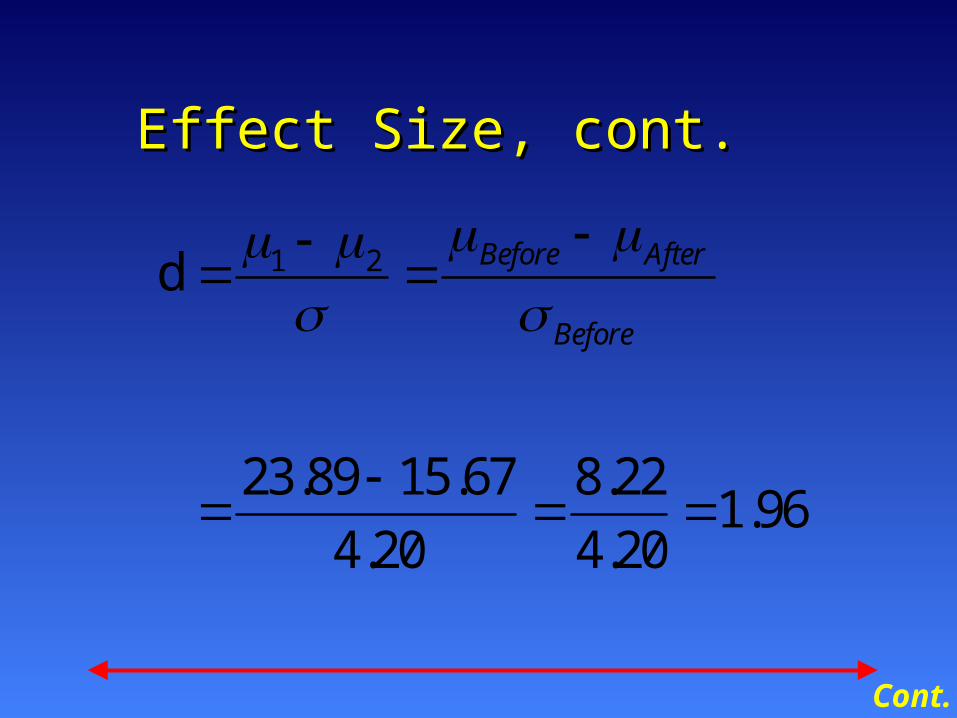
Effect Size, cont.Effect Size, cont.
1 2d
23.89 15.67 8.221.96
4.20 4.20
Before After
Before
Cont.
Effect Size, cont.Effect Size, cont.
• The difference is approximately 2 The difference is approximately 2 standard deviations, which is very standard deviations, which is very large.large.
• Why use standard deviation of Before Why use standard deviation of Before scores?scores?
• Notice that we substituted statistics Notice that we substituted statistics for parameters.for parameters.
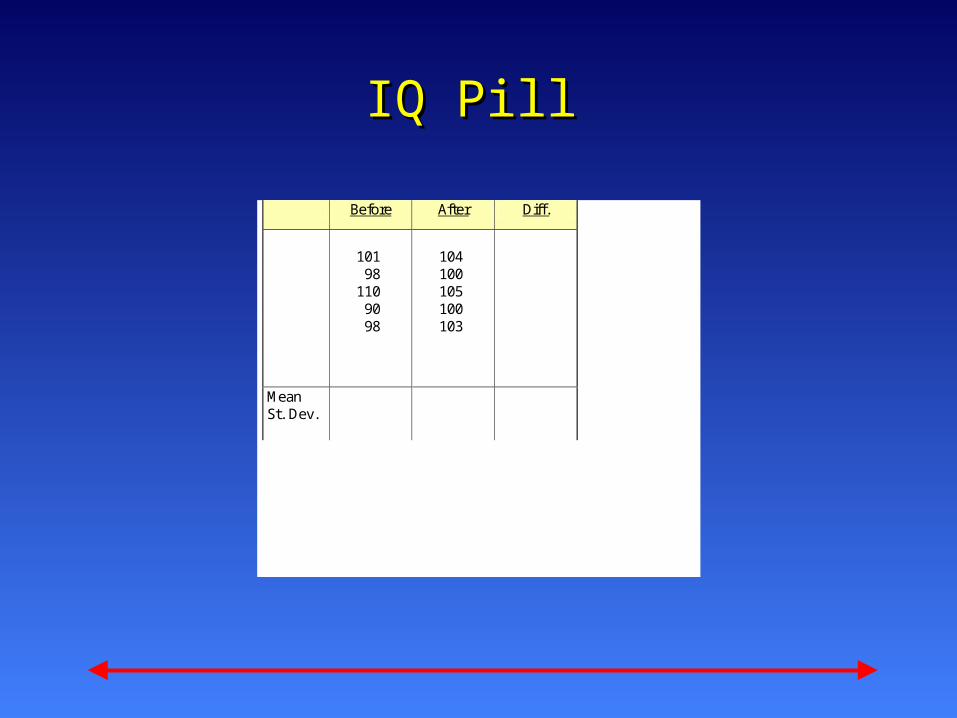
IQ PillIQ Pill
Before After Diff.
101 98
110 90 98
104 100 105 100 103
Mean St. Dev.
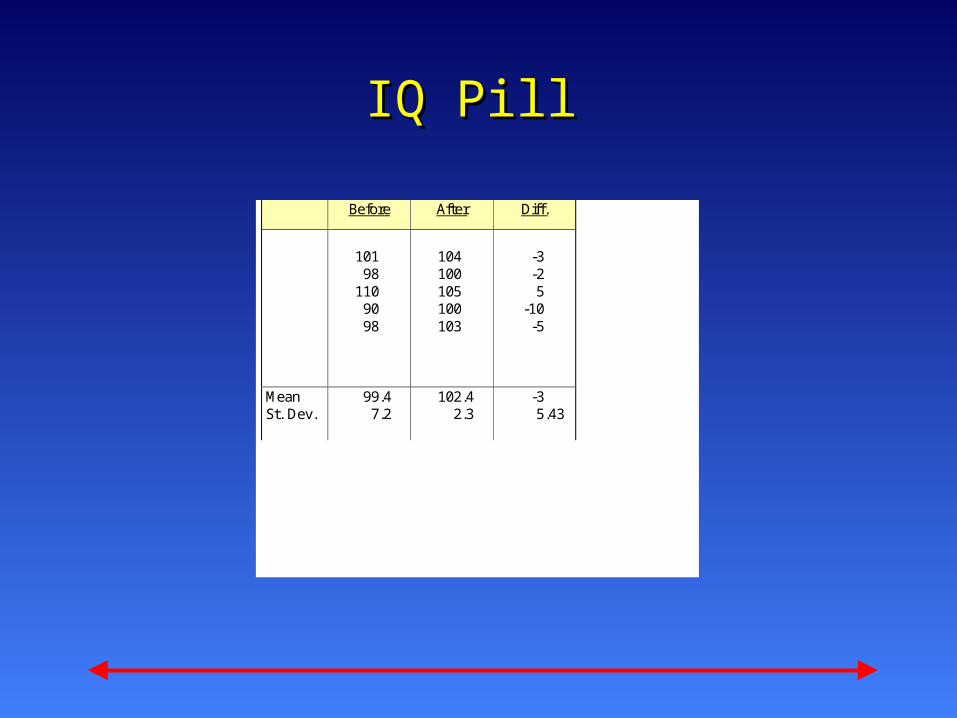
IQ PillIQ Pill
Before After Diff.
101 98
110 90 98
104 100 105 100 103
-3 -2 5
-10 -5
Mean St. Dev.
99.4 7.2
102.4 2.3
-3 5.43
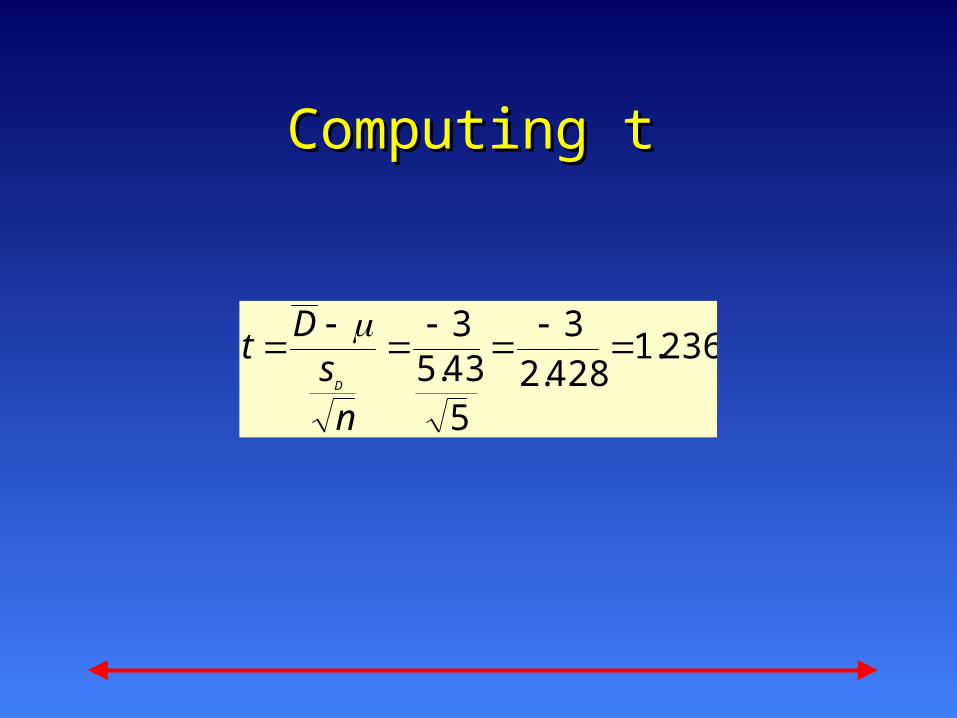
Computing tComputing t
236.1428.2
3
543.53
nsD
tD
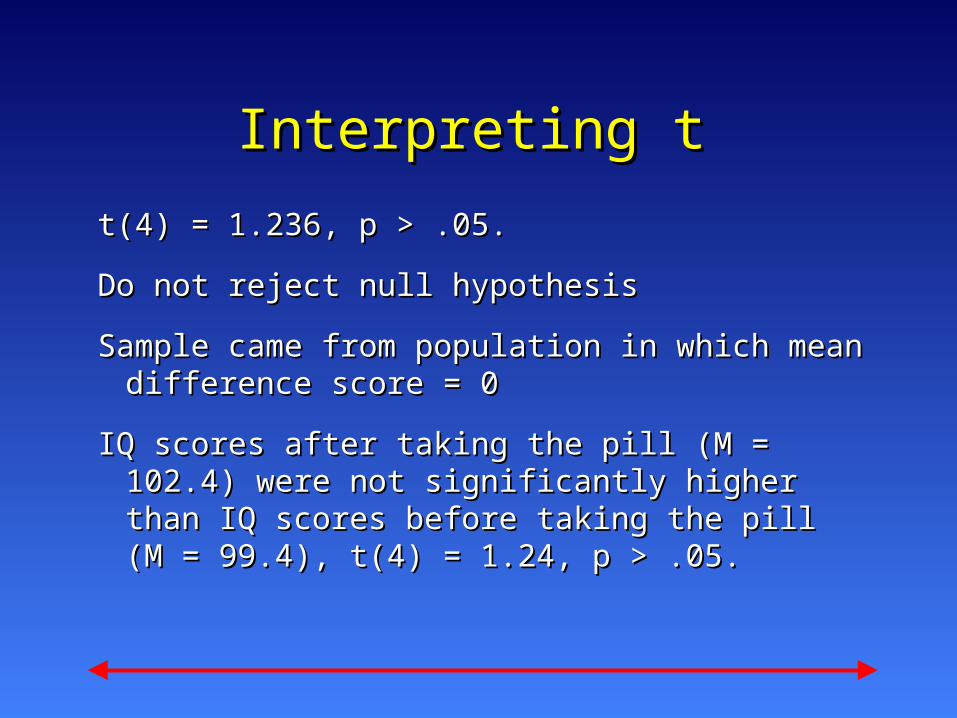
Interpreting tInterpreting t
t(4) = 1.236, p > .05.t(4) = 1.236, p > .05.
Do not reject null hypothesisDo not reject null hypothesis
Sample came from population in which mean Sample came from population in which mean difference score = 0difference score = 0
IQ scores after taking the pill (M = 102.4) were IQ scores after taking the pill (M = 102.4) were not significantly higher than IQ scores before not significantly higher than IQ scores before taking the pill (M = 99.4), t(4) = 1.24, p taking the pill (M = 99.4), t(4) = 1.24, p > .05.> .05.