Embed Size (px)
Citation preview

Hyundai Merchant Marine December 2013

Table of Contents
1. Company Overview
1.1 Business Portfolio
1.2 Fleet Portfolio
1.3 Fleet Expansion Plan
2. Performance Review
3. Divisional Data
4. Financial Data
5. Appendix

1. Company Overview
Business Portfolio
HMM has three main business operations: container, wet bulk, and dry bulk shipping service.
Diversified business portfolio supports sustainable growth withstanding market volatility.
■ Historical Revenue ■ Historical Operating Income
3
15%
(Unit : KRW billion)
(Source : Non–consolidated financial statements)
3,945
5,119 4,846 4,734
5,092
8,003
6,115
8,087
7,188 7,714
6,908
2003 2004 2005 2006 2007 2008 2009 2010 2011 2012 2013
Container Wet Bulk Dry Bulk
18%
64%
16%
20%
64%
14%
23%
63%
16%
18%
66%
15%
19%
66%
13%
19%
68%
15%
14%
71%
15%
12%
73%
16%
12%
72%
15%
12%
73%
12%
16%
72%
18%
303
555 466
97
314
587
-565
602
-318
-520
-351
2003 2004 2005 2006 2007 2008 2009 2010 2011 2012 2013
Container Wet Bulk Dry Bulk Total(Unit : KRW billion, %)

1. Company Overview
Fleet Portfolio
※ Capacity Unit : Container 1,000 TEU / Wet Bulk 1,000 DWT / Dry Bulk 1,000 DWT (Chartered over one year)
(As of December 31, 2013)
4
Owned Chartered Total
No. Capacity No. Capacity No. Capacity
Container > 10,000TEU 5 65 5 65
8,000-10,000TEU 4 34 4 34 8 68
4,000-8,000TEU 14 73 19 111 33 184
< 4,000TEU 10 19 10 19
Container total 18 107 38 229 56 336
Wet Bulk Gas carrier 6 454 3 226 9 680
Crude tanker 7 1,536 7 1,810 14 3,346
Other tanker 2 98 6 284 8 382
Wet bulk total 15 2,088 16 2,320 31 4,408
Dry Bulk Capesize 11 1,855 10 1,854 21 3,709
Panamax 7 551 7 551
Supramax 2 120 21 1,159 23 1,279
Handysize 1 38 9 255 10 293
Heavy Lift 10 273 10 273
Dry bulk total 14 2,013 57 4,092 71 6,105
Total 47 111 158

1. Company Overview
Fleet Expansion Plan
2014 2015 2016 2017
Owned Chartered Owned Chartered Owned Chartered Owned Chartered
Container 13,100 TEU 5
10,000 TEU 6
Wet Bulk VLCC
Dry Bulk Capesize 1 4 1
Panamax 3
Supramax
Handysize
Heavy Lift
Total No. of New vessel 5 1 7 6 1
(As of December 31, 2013)
(Chartered over one year) (Number of delivered vessel)* 5

Table of Contents
1. Company Overview
2. Performance Review
2.1 FY2013 Annual Results
2.2 Quarterly Results
2.3 Divisional Results
2.4 Cost Structure
3. Divisional Data
4. Financial Data
5. Appendix

FY2013 Results
2. Performance Review
(Unit : KRW billion, USD million)
7
FY2013 FY2012 YoY
Revenue 6,908 7,714 -10.4%
(USD million) 6,294 6,830 -7.8%
COGS 7,096 8,064 -12.0%
SG&A 163 170 -4.1%
Operating Income -351 -520
Operating Margin -5.1% -6.7%
1. Revenue : KRW 6,908 Bn
YoY - 10.4%
Container Freight Rate YoY -7.6%
2. COGS : KRW 7,096 Bn
YoY -12.0%
Fuel Cost YoY -29.9%
Charterage YoY -11.2%
3. Operating Income : KRW -351 Bn

Quarterly Results
2. Performance Review
(Unit : KRW billion, USD million)
8
4Q 2013 3Q 2013 QoQ 4Q 2012 YoY
Revenue 1,650 1,740 -5.2% 1,842 -10.4%
(USD million) 1,557 1,564 -0.4% 1,696 -8.2%
COGS 1,717 1,743 -1.5% 1,966 -12.7%
SG&A 39 43 44
Operating Income -107 -46 -168
Operating Margin -6.5% -2.6% -9.1%
(Source : Non–consolidated financial statements)

Divisional Results
2. Performance Review
2013 4Q 2013 3Q QoQ 2012 4Q YoY
Container Revenue 1,221 1,297 -5.9% 1,324 -7.9%
Operating Income -51 4 -58
Operating Margin -4.2% 0.3% -4.4%
Wet Bulk Revenue 183 184 -0.5% 209 -12.4%
Operating Income -9 -24 -10
Operating Margin -4.9% -13.0% -4.3%
Dry Bulk Revenue 246 259 -5.0% 309 -20.4%
Operating Income -47 -26 -100
Operating Margin -19.0% -10.0% -32.5%
Total Revenue 1,650 1,740 -5.2% 1,842 -10.4%
Operating Income -107 -46 -168
Operating Margin -6.5% -2.7% -9.1%
(Unit : KRW billion)
9 (Source : HMM inside data)

Cost Structure
2. Performance Review
(Unit : KRW billion)
10
4Q 2013 3Q 2013 QoQ 4Q 2012 YoY
COGS 1,717 1,743 -1.5% 1,966 -12.7%
Cargo Handling 768 809 -5.1% 774 -0.8%
Fuel 296 332 -10.8% 480 -38.3%
Charterage 574 531 8.1% 590 -2.5%
Depreciations 40 45 -11.1% 45 -11.1%
Others 39 26 50.0% 77 -49.4%
■ COGS Structure
44%
17%
34%
2% 2%
Cargo Handling Fuel Charterage Depreciations Others
KRW 1,717 Bn
COGS decreased by 1.5% QoQ.
Cargo Handling fee decreased by 5.1% QoQ as container volume diminished.
Fuel cost fell by 10.8% QoQ due to fuel saving plans as well as lowering of bunker price.
(Source : HMM inside data)

Table of Contents
1. Company Overview
2. Performance Review
3. Divisional Data
3.1 Container Division
3.2 Wet Bulk Division
3.3 Dry Bulk Division
4. Financial Data
5. Appendix

Container Division
(Source: HMM inside data)
■ Freight Rate Trend
HMM implemented GRI(General Rate Increase) for all U.S destinations as of November 15, 2013.
$950/TEU GRI in Asia-North Europe & Med trades(W/B) in November is followed by another $800/TEU GRI as of
December 16.
3. Divisional Data
■ HMM GRI Record
12
50
75
100
125
150
Transpacific Asia-Europe Intra Asia
(Unit : percentage)
*
Service Effective
$400/FEU November 15
$200/FEU December 20
PSS $50/FEU January 6, 2014
$300/FEU January 15, 2014
$300/FEU March 15, 2014
$515/TEU September 1
$950/TEU November 1
$800/TEU December 16
$800/TEU January 13, 2014
$500/TEU March 15, 2014
Guideline
Transpacific
(E/B)
Asia Europe
(W/B)

Container Division
(Source: HMM inside data)
■ Utilization Ratio
Trade volume remains strong despite 4Q slack season.
Carriers seek to improve supply-demand imbalance by way of reorganizing their service products as well as of
expanding blank sailings.
3. Divisional Data
■ Weekly Trade Volume
13
23 24 26 23 23 26 27 25 25 26 26 27
14 14 15 14 14
14 14 13 12
13 14 13
17 19 19
19 17 19 19
20 20 21 22 22
55 57 60
56 54 59 60 58 57
60 62 61
0
20,000
40,000
60,000
80,000
Transpacific Asia-Europe Intra Asia
(Unit : 1,000 TEU/WK)
*
80
90
100
Transpacific Asia-Europe Intra Asia
*
(Unit : percentage)

Wet Bulk Division
■ World Scale(WS)
3. Divisional Data
World Scale(WS) has rallied sharply by strong seasonal demand.
3.5%
4.7%
3.5%
5.2%
2.7%
4.5%
2012 2013 2014
Supply Demand
■ Supply & Demand Growth
(Source : Drewry) (Source: Clarksons – BDTI TD3 : 260,000mt, Middle East Gulf to Japan)
14
60.25
0
20
40
60
80
100
120
Mar
-10
Jun
-10
Sep
-10
De
c-1
0
Mar
-11
Jun
-11
Sep
-11
De
c-1
1
Mar
-12
Jun
-12
Sep
-12
De
c-1
2
Mar
-13
Jun
-13
Sep
-13
De
c-1
3

Wet Bulk Division
3. Divisional Data
(Source: HMM inside data)
■ Wet Bulk Revenue Mix ■ Spot Exposure
COA 59.8%
Charter-out 4.6%
SPOT 35.6%
(Based on 4Q 2013 Wet Bulk Revenue)
KRW 183 Bn
15
48%
HMM has secured long term contract for stable earnings as bearish market continues with oversupply of vessels.
HMM is finding opportunities to increase crude oil tankers to take best advantage of the trough of industrial cycle.
48% 48% 47%
12% 12% 13%
37% 37% 38%
4% 4% 2%
FY2011 FY2012 FY2013
Crude Tanker Product Tanker LNG LPG

0
50
100
150
200
0
25
50
75
100
2000 2001 2002 2003 2004 2005 2006 2007 2008 2009 2010 2011 2012
Fixed Revenue Exposure(L) WS(R)
Wet Bulk Division
(Source: HMM inside data, Clarksons)
* Delivery includes Owned and Chartered Vessels
HMM’s VLCCs are cost competitive as they were set to be delivered ahead of the hike of new building price.
Based on accurate and extensive market forecasts, HMM has well balanced the ratio of spot and fixed revenues in
crude oil tanker service.
3. Divisional Data
2 2 2 3
5
3 4
0
5
10
0
50
100
150
200
Vessel Delivery(R) VLCC New Building Price(L)
■ VLCC Delivery vs. New Building Price ■ Historical Fixed Revenue vs. World Scale
($ million) (Percentage)
16

Dry Bulk Division
■ BDI
3. Divisional Data
Bearish market continued during the year, but the market seems to be gradually improving next year.
After sharp rally in capesize market due to increasing Brazil iron ore export in the 3Q, the market shows upward trend
while in volatile condition.
■ Supply & Demand Growth
10.3%
7.8%
6.6% 6.5%
9.3% 8.5%
2012 2013 2014
Supply Demand
17
(Source : MSI) (Source: Baltic Exchange)
1,752
2,277
0
1,000
2,000
3,000
4,000
5,000
Mar
-10
Jun
-10
Sep
-10
De
c-1
0
Mar
-11
Jun
-11
Sep
-11
De
c-1
1
Mar
-12
Jun
-12
Sep
-12
De
c-1
2
Mar
-13
Jun
-13
Sep
-13
De
c-1
3

Dry Bulk Division
3. Divisional Data
(Source: HMM inside Data)
■ Dry Bulk Revenue mix ■ Spot Exposure
COA/CVC 31.5%
Charter-out 23.1%
SPOT 45.4% KRW 246 Bn
18
HMM will continue to try long-term freight contracts for stable income flow.
HMM has been focusing on reforming cost structure for the longer-term perspective.
(Based on 4Q 2013 Dry Bulk Revenue)
23% 22% 24%
50% 50% 46%
17% 17% 18%
11% 12% 12%
FY2011 FY2012 FY2013
Dedicated Service Tramper Bulk Liner Heavy Lift
Table of Contents
1. Company Overview
2. Performance Review
3. Divisional Data
4. Financial Data
4.1 Non Consolidated
4.2 Consolidated
5. Appendix

Summary Financial Statements - Non consolidated
Category FY2012 FY2013 Category FY2012 FY2013
Total assets 7,908,884 6,854,879 Sales Revenue 7,713,825 6,908,325
Current assets 2,136,915 1,765,697 Cost of sales 8,064,005 7,096,331
(Cash and cash equivalents) 624,894 614,139 Gross profit -350,180 -188,006
Non-current assets 5,771,969 5,089,182 Operating Income -519,778 -351,392
Total liabilities 7,029,206 6,396,954 Profit before tax -987,590 -591,813
Current liabilities 1,854,801 3,773,266 Profit (Loss) -998,938 -585,881
Non-current liabilities 5,174,405 2,623,688
Total equity 879,678 457,925
Total equity and liabilities 7,908,884 6,854,879
(Unit: KRW million)
■ Statement of Financial Position ■ Statement of Comprehensive Income
Category FY2012 FY2013
Debt to Equity Ratio 799.1% 1396.9%
Net Debt to Equity Ratio 633.0% 1088.8%
Dividends FY2012 FY2013
Common Stock N/A N/A
4. Financial Data
(Unit: KRW million)
20
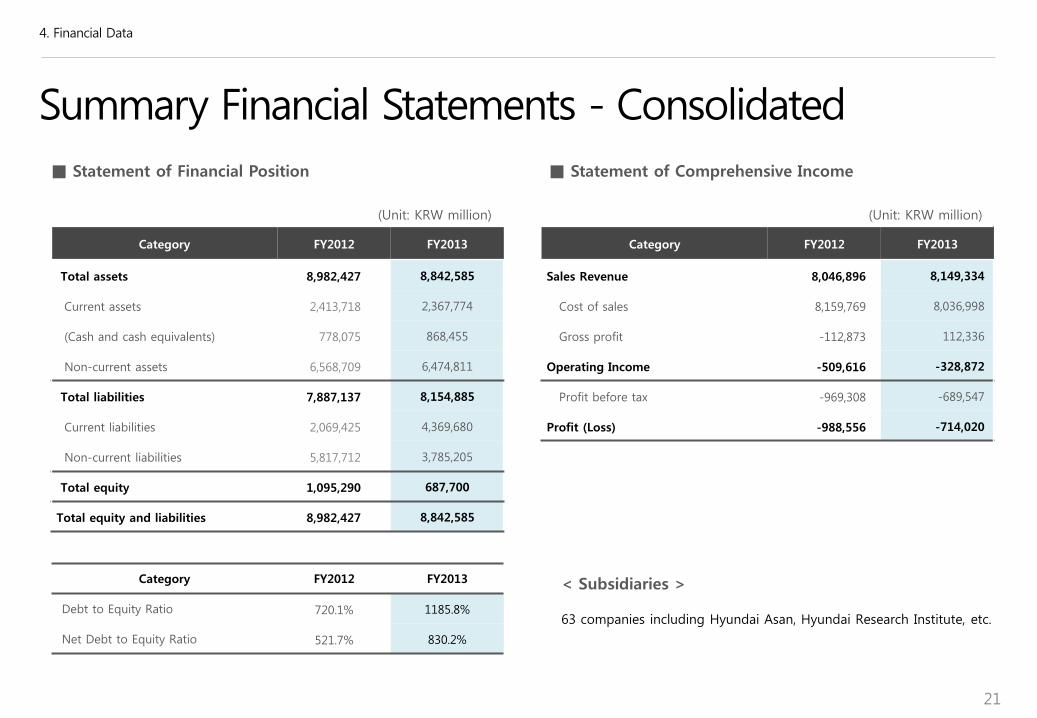
Summary Financial Statements - Consolidated
Category FY2012 FY2013 Category FY2012 FY2013
Total assets 8,982,427 8,842,585 Sales Revenue 8,046,896 8,149,334
Current assets 2,413,718 2,367,774 Cost of sales 8,159,769 8,036,998
(Cash and cash equivalents) 778,075 868,455 Gross profit -112,873 112,336
Non-current assets 6,568,709 6,474,811 Operating Income -509,616 -328,872
Total liabilities 7,887,137 8,154,885 Profit before tax -969,308 -689,547
Current liabilities 2,069,425 4,369,680 Profit (Loss) -988,556 -714,020
Non-current liabilities 5,817,712 3,785,205
Total equity 1,095,290 687,700
Total equity and liabilities 8,982,427 8,842,585
■ Statement of Financial Position ■ Statement of Comprehensive Income
Category FY2012 FY2013
Debt to Equity Ratio 720.1% 1185.8%
Net Debt to Equity Ratio 521.7% 830.2%
63 companies including Hyundai Asan, Hyundai Research Institute, etc.
< Subsidiaries >
(Unit: KRW million) (Unit: KRW million)
4. Financial Data
21
Table of Contents
1. Company Overview
2. Performance Review
3. Divisional Data
4. Financial Data
5. Appendix
5.1 Shareholder Structure
5.2 Global Networks
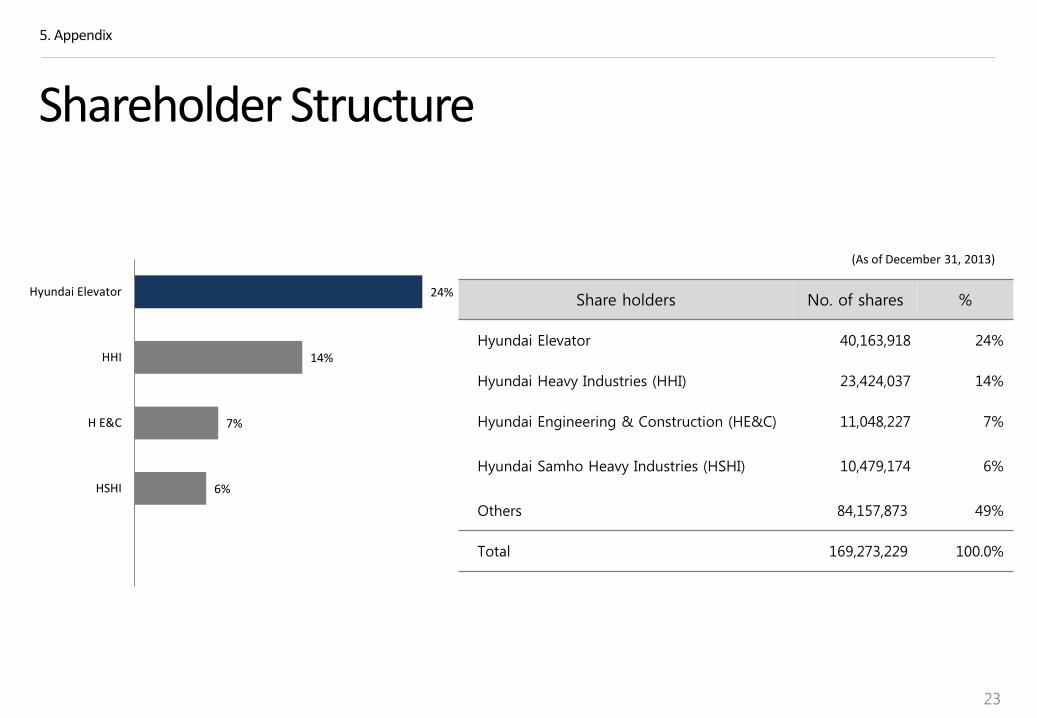
Shareholder Structure
5. Appendix
(As of December 31, 2013)
23
Share holders No. of shares %
Hyundai Elevator 40,163,918 24%
Hyundai Heavy Industries (HHI) 23,424,037 14%
Hyundai Engineering & Construction (HE&C) 11,048,227 7%
Hyundai Samho Heavy Industries (HSHI) 10,479,174 6%
Others 84,157,873 49%
Total 169,273,229 100.0%
24%
14%
7%
6%
Hyundai Elevator
HHI
H E&C
HSHI

5. Appendix
Global Networks
Hamburg
Le Harve
Gothenburg
London
Genoa
St. Petersburg
Vienna
Hong Kong Dubai Mumbai Bangkok
Singapore Klang
Ho Chi Minh
Kaohsiung
Taipei
Shanghai Tokyo
Sydney
Long Beach
Tacoma
Irving
Antwerp
Rotterdam HMM HQ
HMM CHINA
HMM America
HMM Europe
HMM South East/West Asia
Seoul
Operating Terminals
HMM HQ
Regional HQ
Operating Terminals Location Capacity /year Owned Share Remark
CUT California 1,200,000 TEU 100%
WUT Washington 1,100,000 TEU 100%
KHT Kaohsiung 800,000 TEU 100%
HPNT Busan 2,000,000 TEU 50%
RWG Rotterdam 4,000,000 TEU 20% to be opened in 2014
4 Regional HQ, 26 Subsidiaries, 74 Branches, 3 Liaison Offices, 5 Operating Terminals
24
Sau Paulo
(Others are subsidiaries)
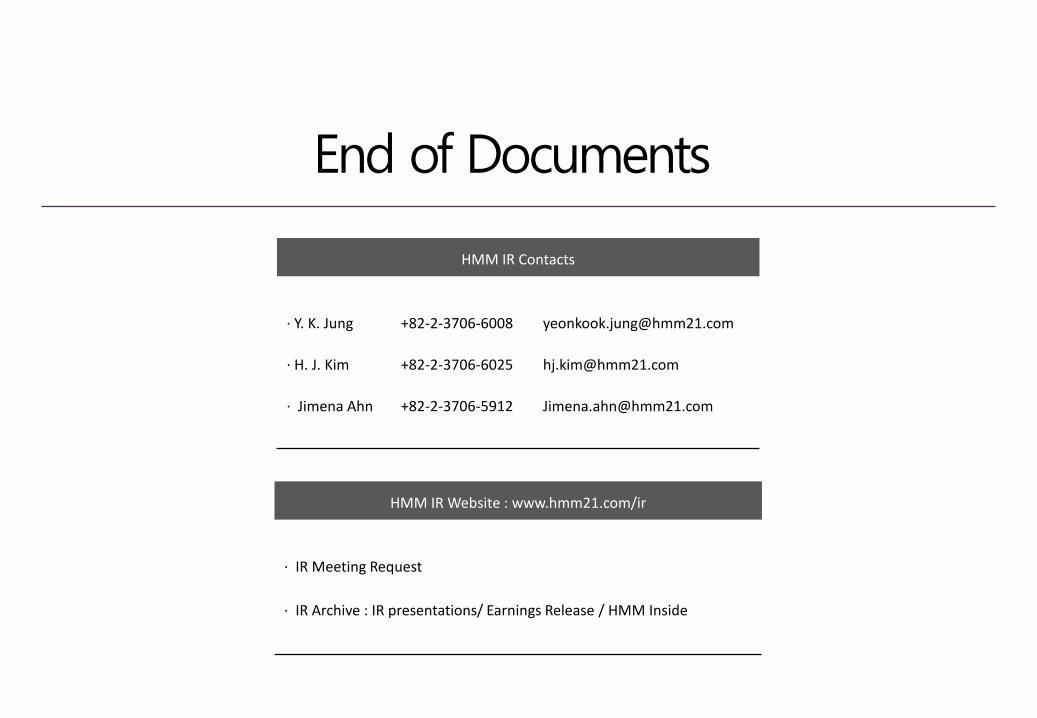
End of Documents
HMM IR Contacts
∙ Y. K. Jung +82-2-3706-6008 [email protected]
∙ H. J. Kim +82-2-3706-6025 [email protected]
∙ Jimena Ahn +82-2-3706-5912 [email protected]
HMM IR Website : www.hmm21.com/ir
∙ IR Meeting Request
∙ IR Archive : IR presentations/ Earnings Release / HMM Inside