Embed Size (px)
Citation preview
HYUNDAI MOTOR COMPANY AND ITS SUBSIDIARIES CONSOLIDATED FINANCIAL STATEMENTS FOR THE THREE MONTHS AND NINE MONTHS ENDED SEPTEMBER 30, 2012 AND 2011 AND INDEPENDENT ACCOUNTANTS’ REVIEW REPORT
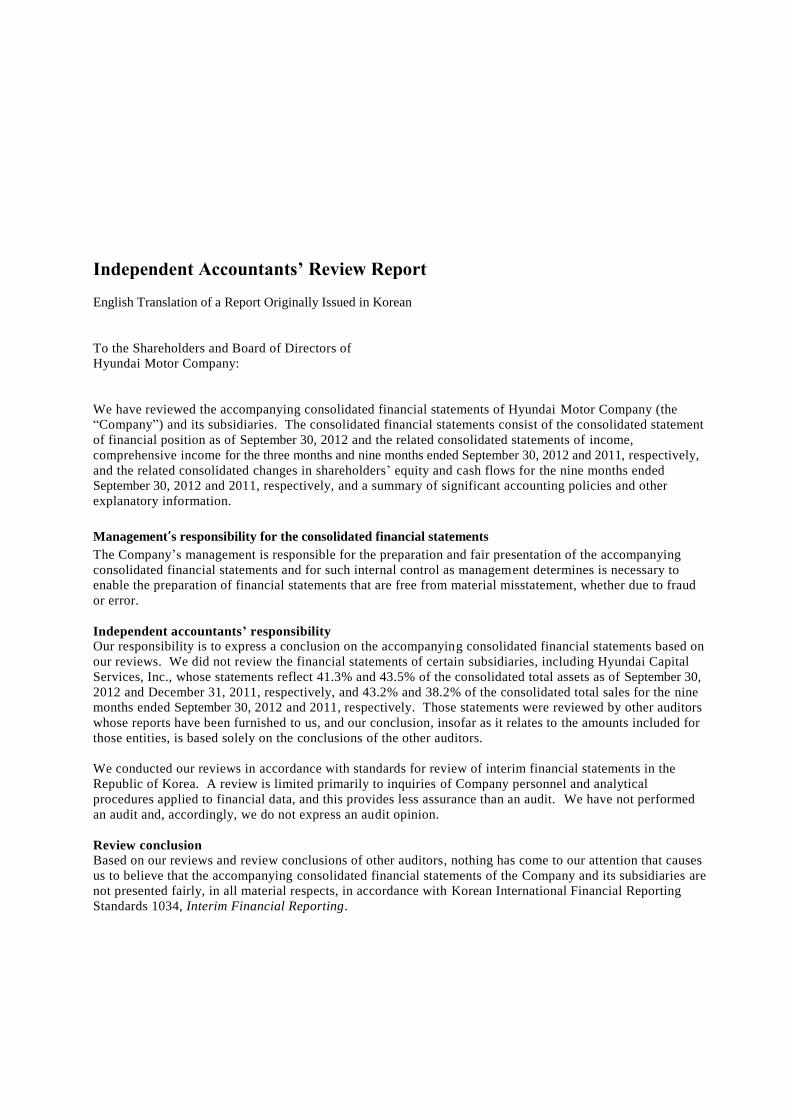
Independent Accountants’ Review Report
English Translation of a Report Originally Issued in Korean
To the Shareholders and Board of Directors of
Hyundai Motor Company:
We have reviewed the accompanying consolidated financial statements of Hyundai Motor Company (the
“Company”) and its subsidiaries. The consolidated financial statements consist of the consolidated statement
of financial position as of September 30, 2012 and the related consolidated statements of income,
comprehensive income for the three months and nine months ended September 30, 2012 and 2011, respectively,
and the related consolidated changes in shareholders‟ equity and cash flows for the nine months ended
September 30, 2012 and 2011, respectively, and a summary of significant accounting policies and other
explanatory information.
Management’s responsibility for the consolidated financial statements
The Company‟s management is responsible for the preparation and fair presentation of the accompanying
consolidated financial statements and for such internal control as management determines is necessary to
enable the preparation of financial statements that are free from material misstatement, whether due to fraud
or error.
Independent accountants’ responsibility
Our responsibility is to express a conclusion on the accompanying consolidated financial statements based on
our reviews. We did not review the financial statements of certain subsidiaries, including Hyundai Capital
Services, Inc., whose statements reflect 41.3% and 43.5% of the consolidated total assets as of September 30,
2012 and December 31, 2011, respectively, and 43.2% and 38.2% of the consolidated total sales for the nine
months ended September 30, 2012 and 2011, respectively. Those statements were reviewed by other auditors
whose reports have been furnished to us, and our conclusion, insofar as it relates to the amounts included for
those entities, is based solely on the conclusions of the other auditors.
We conducted our reviews in accordance with standards for review of interim financial statements in the
Republic of Korea. A review is limited primarily to inquiries of Company personnel and analytical
procedures applied to financial data, and this provides less assurance than an audit. We have not performed
an audit and, accordingly, we do not express an audit opinion.
Review conclusion
Based on our reviews and review conclusions of other auditors, nothing has come to our attention that causes
us to believe that the accompanying consolidated financial statements of the Company and its subsidiaries are
not presented fairly, in all material respects, in accordance with Korean International Financial Reporting
Standards 1034, Interim Financial Reporting.


HYUNDAI MOTOR COMPANY AND ITS SUBSIDIARIES (the “Group”) CONSOLIDATED FINANCIAL STATEMENTS FOR THE THREE MONTHS AND NINE MONTHS ENDED SEPTEMBER 30, 2012 AND 2011
The accompanying consolidated financial statements including all footnote disclosures were
prepared by and are the responsibility of the Group.
Kim, Choong Ho
CEO, HYUNDAI MOTOR COMPANY

HYUNDAI MOTOR COMPANY AND ITS SUBSIDIARIES
CONSOLIDATED STATEMENTS OF FINANCIAL POSITION
AS OF SEPTEMBER 30, 2012 AND DECEMBER 31, 2011
ASSETS NOTES September 30, 2012 December 31, 2011
(In millions of Korean Won)
Current assets:
Cash and cash equivalents 18 ₩ 7,471,674 ₩ 6,231,946
Short-term financial instruments 18 11,387,671 9,182,575
Trade notes and accounts receivable 3,18 3,630,295 3,845,517
Other receivables 4,18 2,853,604 2,240,482
Other financial assets 5,18 107,811 356,444
Inventories 6 6,691,439 6,237,752
Other assets 7,18 1,740,161 1,137,862
Current tax assets 23,688 36,084
Financial services receivables 12,18 20,201,509 19,657,688
Total current assets 54,107,852 48,926,350
Non-current assets:
Long-term financial instruments 18 1,386 211,540
Long-term trade notes and accounts receivable 3,18 62,045 76,843
Other receivables 4,18 1,029,712 987,207
Other financial assets 5,18 1,770,334 1,897,943
Other assets 7,18 11,691 1,288
Property, plant and equipment 8 20,272,333 19,548,048
Investment property 9 271,692 282,427
Intangibles 10 2,787,460 2,660,109
Investments in joint ventures and associates 11 12,660,763 11,709,238
Deferred tax assets 440,860 458,287
Financial services receivables 12,18 18,277,638 17,452,441
Operating lease assets 13 7,384,643 5,268,254
Total non-current assets 64,970,557 60,553,625
Total assets ₩ 119,078,409 ₩ 109,479,975
(Continued)
HYUNDAI MOTOR COMPANY AND ITS SUBSIDIARIES
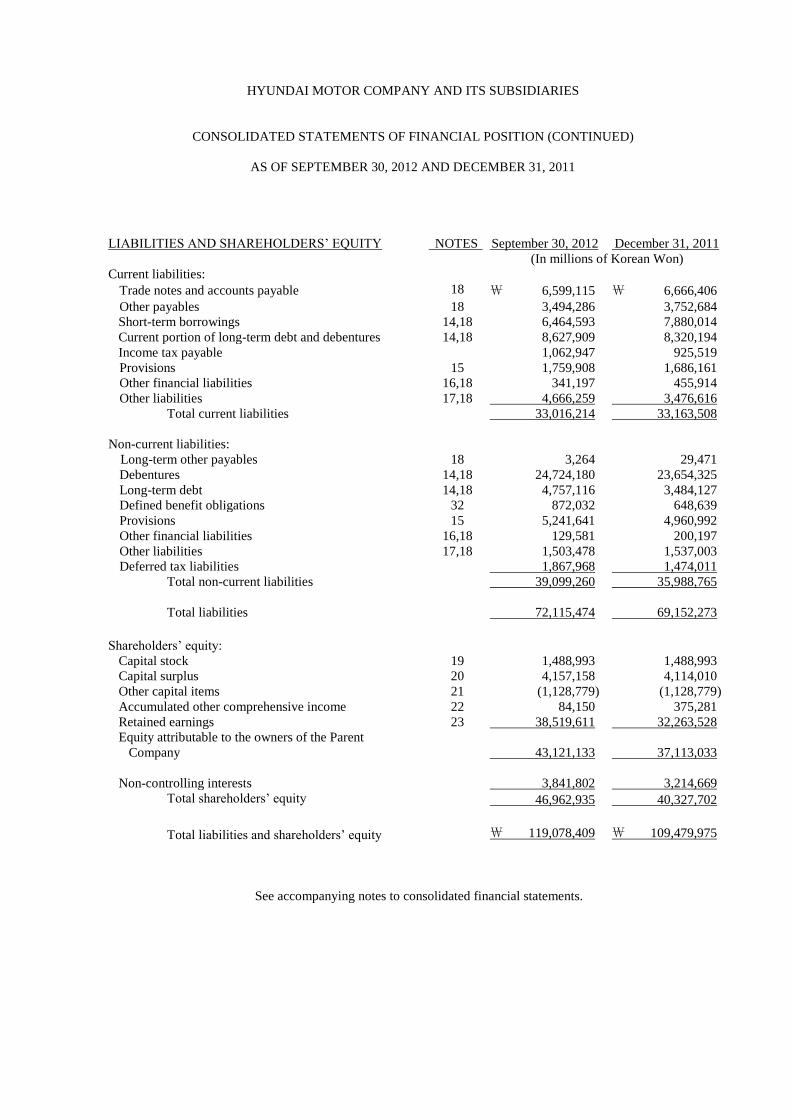
CONSOLIDATED STATEMENTS OF FINANCIAL POSITION (CONTINUED)
AS OF SEPTEMBER 30, 2012 AND DECEMBER 31, 2011
LIABILITIES AND SHAREHOLDERS‟ EQUITY NOTES September 30, 2012 December 31, 2011
(In millions of Korean Won)
Current liabilities:
Trade notes and accounts payable 18 ₩ 6,599,115 ₩ 6,666,406
Other payables 18 3,494,286 3,752,684
Short-term borrowings 14,18 6,464,593 7,880,014
Current portion of long-term debt and debentures 14,18 8,627,909 8,320,194
Income tax payable 1,062,947 925,519
Provisions 15 1,759,908 1,686,161
Other financial liabilities 16,18 341,197 455,914
Other liabilities 17,18 4,666,259 3,476,616
Total current liabilities 33,016,214 33,163,508
Non-current liabilities:
Long-term other payables 18 3,264 29,471
Debentures 14,18 24,724,180 23,654,325
Long-term debt 14,18 4,757,116 3,484,127
Defined benefit obligations 32 872,032 648,639
Provisions 15 5,241,641 4,960,992
Other financial liabilities 16,18 129,581 200,197
Other liabilities 17,18 1,503,478 1,537,003
Deferred tax liabilities 1,867,968 1,474,011
Total non-current liabilities 39,099,260 35,988,765
Total liabilities 72,115,474 69,152,273
Shareholders‟ equity:
Capital stock 19 1,488,993 1,488,993
Capital surplus 20 4,157,158 4,114,010
Other capital items 21 (1,128,779) (1,128,779)
Accumulated other comprehensive income 22 84,150 375,281
Retained earnings 23 38,519,611 32,263,528
Equity attributable to the owners of the Parent
Company
43,121,133 37,113,033
Non-controlling interests 3,841,802 3,214,669
Total shareholders‟ equity 46,962,935 40,327,702
Total liabilities and shareholders‟ equity ₩ 119,078,409 ₩ 109,479,975
See accompanying notes to consolidated financial statements.

HYUNDAI MOTOR COMPANY AND ITS SUBSIDIARIES
CONSOLIDATED STATEMENTS OF INCOME
FOR THE THREE MONTHS AND NINE MONTHS ENDED SEPTEMBER 30, 2012 AND 2011
2012 2011
NOTES
Three months
ended
September 30,
Nine months
ended
September 30,
Three months
ended
September 30,
Nine months
ended
September 30,
(In millions of Korean Won, except per share amounts)
Sales 24,37 ₩ 19,645,634 ₩ 61,750,745 ₩ 18,953,964 ₩ 57,278,912
Cost of sales 29 15,201,751 47,259,875 14,056,814 43,318,973
Gross profit 4,443,883 14,490,870 4,897,150 13,959,939
Selling and administrative expenses 25,29 2,491,708 7,911,441 2,801,583 8,041,929
Other operating income 26 340,586 887,175 182,672 727,004
Other operating expenses 26,29 236,940 625,844 283,473 696,009
Operating income 2,055,821 6,840,760 1,994,766 5,949,005
Gain on investments in joint ventures and
associates, net 27 601,426 2,005,242 520,653 1,933,989
Finance income 28 253,085 714,434 189,514 573,261
Finance expenses 28 129,617 486,475 251,863 554,637
Income before income tax 2,780,715 9,073,961 2,453,070 7,901,618
Income tax expense 31 615,106 1,910,167 534,731 1,799,225
Profit for the period ₩ 2,165,609 ₩ 7,163,794 ₩ 1,918,339 ₩ 6,102,393
Profit attributable to:
Owners of the Parent Company 2,025,231 6,771,547 1,813,923 5,705,756
Non-controlling interests 140,378 392,247 104,416 396,637
Earnings per share attributable to the owners of the
Parent Company: 30
Basic earnings per common share ₩ 7,454 ₩ 24,926 ₩ 6,660 ₩ 20,984
Diluted earnings per common share ₩ 7,454 ₩ 24,926 ₩ 6,660 ₩ 20,984
See accompanying notes to consolidated financial statements.

HYUNDAI MOTOR COMPANY AND ITS SUBSIDIARIES
CONSOLIDATED STATEMENTS OF COMPREHENSIVE INCOME
FOR THE THREE MONTHS AND NINE MONTHS ENDED SEPTEMBER 30, 2012 AND 2011
2012 2011
Three months
ended
September 30,
Nine months
ended
September 30,
Three months
ended
September 30,
Nine months
ended
September 30,
(In millions of Korean Won)
Profit for the period ₩ 2,165,609 ₩ 7,163,794 ₩ 1,918,339 ₩ 6,102,393
Other comprehensive income (expenses):
Gain (loss) on valuation of available-for-sale
financial assets, net 22,000 (16,124) (197,111) (108,062)
Gain (loss) on valuation of cash flow hedge
derivatives, net (21,705) 36,154 (86,666) (56,366)
Changes in valuation of equity-accounted investees, net (28,209) (55,213) 97,143 243,711
Actuarial loss on defined benefit obligations, net (3,163) (4,744) (27,555) (22,972)
Gain (loss) on foreign operations translation, net (56,131) (266,940) 345,394 150,925
Total other comprehensive income (expenses) (87,208) (306,867) 131,205 207,236
Total comprehensive income ₩ 2,078,401 ₩ 6,856,927 ₩ 2,049,544 ₩ 6,309,629
Comprehensive income attributable to:
Owners of the Parent Company 1,954,425 6,461,806 1,972,278 5,940,656
Non-controlling interests 123,976 395,121 77,266 368,973
Total comprehensive income ₩ 2,078,401 ₩ 6,856,927 ₩ 2,049,544 ₩ 6,309,629
See accompanying notes to consolidated financial statements.

HYUNDAI MOTOR COMPANY AND ITS SUBSIDIARIES
CONSOLIDATED STATEMENTS OF CHANGES IN SHAREHOLDERS‟ EQUITY
FOR THE NINE MONTHS ENDED SEPTEMBER 30, 2012 AND 2011
Capital
stock
Capital
surplus
Other
capital
items
Accumulated
other
comprehensive
income
Retained
earnings
Total
Non-
controlling
interests
Total
equity
(In millions of Korean Won)
Balance at
January 1, 2011 ₩ 1,488,993 ₩ 3,900,935 ₩ (918,214) ₩ 409,914 ₩ 25,216,163 ₩ 30,097,791 ₩ 2,790,182 ₩ 32,887,973
Comprehensive
income:
Profit for the period - - - - 5,705,756 5,705,756 396,637 6,102,393
Loss on valuation of
available-for-sale
financial assets, net - - - (107,850) - (107,850) (212) (108,062)
Loss on valuation of
cash flow hedge
derivatives, net - - - (26,134) - (26,134) (30,232) (56,366)
Changes in valuation
of equity-accounted
investees, net - - - 238,629 5,071 243,700 11 243,711
Actuarial loss on
defined benefit
obligations, net - - - - (21,046) (21,046) (1,926) (22,972)
Gain on foreign
operations
translation, net - - - 146,230 - 146,230 4,695 150,925
Total comprehensive
Income - - - 250,875 5,689,781 5,940,656 368,973 6,309,629
Transactions with
owners, recorded
directly in equity:
Payment of cash
dividends - - - - (412,227) (412,227) (45,423) (457,650)
Purchase of treasury
stock - - (173,778) - - (173,778) - (173,778)
Increase in
subsidiaries‟ stock - - - - - - 10,780 10,780
Disposal of
subsidiaries‟ stock - 40 - - - 40 - 40
Other - - - - 50 50 (826) (776)
Total transactions with
owners, recorded
directly in equity - 40 (173,778) - (412,177) (585,915) (35,469) (621,384)
Balance at
September 30, 2011 ₩ 1,488,993 ₩ 3,900,975 ₩ (1,091,992) ₩ 660,789 ₩ 30,493,767 ₩ 35,452,532 ₩ 3,123,686 ₩ 38,576,218
(Continued)
HYUNDAI MOTOR COMPANY AND ITS SUBSIDIARIES
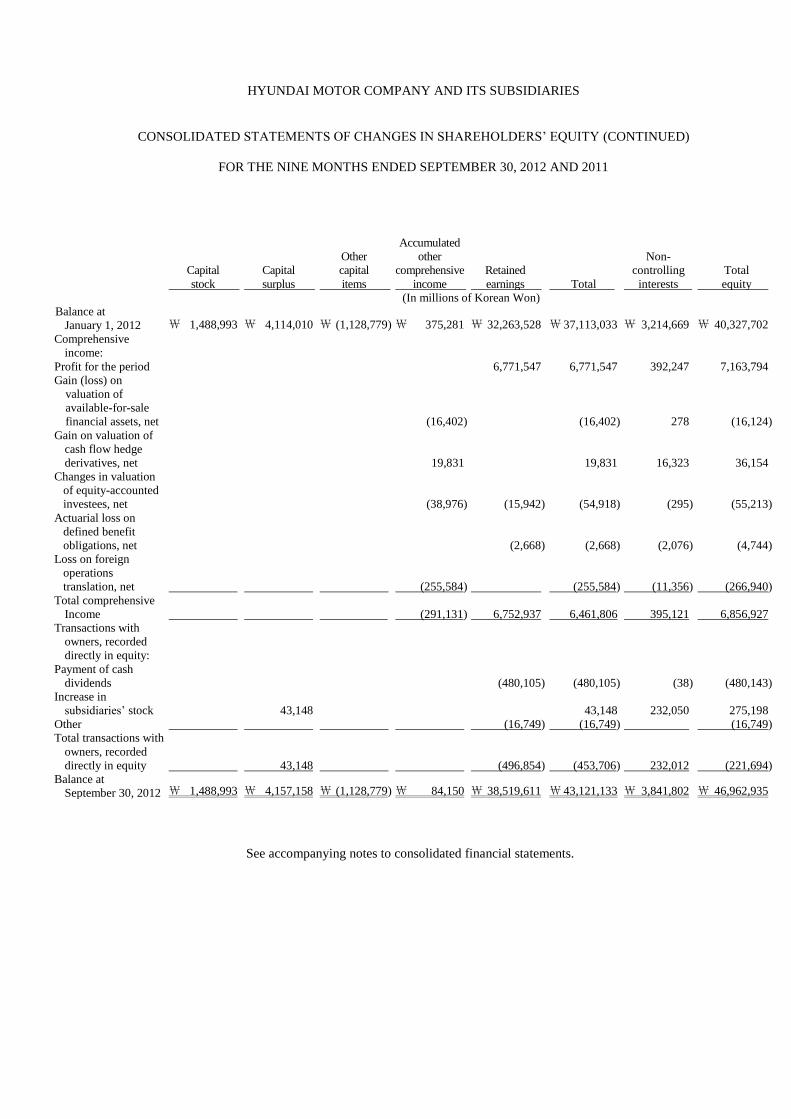
CONSOLIDATED STATEMENTS OF CHANGES IN SHAREHOLDERS‟ EQUITY (CONTINUED)
FOR THE NINE MONTHS ENDED SEPTEMBER 30, 2012 AND 2011
Capital
stock
Capital
surplus
Other
capital
items
Accumulated
other
comprehensive
income
Retained
earnings
Total
Non-
controlling
interests
Total
equity
(In millions of Korean Won)
Balance at
January 1, 2012 ₩ 1,488,993 ₩ 4,114,010 ₩ (1,128,779) ₩ 375,281 ₩ 32,263,528 ₩ 37,113,033 ₩ 3,214,669 ₩ 40,327,702
Comprehensive
income:
Profit for the period 6,771,547 6,771,547 392,247 7,163,794
Gain (loss) on
valuation of
available-for-sale
financial assets, net (16,402) (16,402) 278 (16,124)
Gain on valuation of
cash flow hedge
derivatives, net 19,831 19,831 16,323 36,154
Changes in valuation
of equity-accounted
investees, net (38,976) (15,942) (54,918) (295) (55,213)
Actuarial loss on
defined benefit
obligations, net (2,668) (2,668) (2,076) (4,744)
Loss on foreign
operations
translation, net (255,584) (255,584) (11,356) (266,940)
Total comprehensive
Income (291,131) 6,752,937 6,461,806 395,121 6,856,927
Transactions with
owners, recorded
directly in equity:
Payment of cash
dividends (480,105) (480,105) (38) (480,143)
Increase in
subsidiaries‟ stock 43,148 43,148 232,050 275,198
Other (16,749) (16,749) (16,749)
Total transactions with
owners, recorded
directly in equity 43,148 (496,854) (453,706) 232,012 (221,694)
Balance at
September 30, 2012 ₩ 1,488,993 ₩ 4,157,158 ₩ (1,128,779) ₩ 84,150 ₩ 38,519,611 ₩ 43,121,133 ₩ 3,841,802 ₩ 46,962,935
See accompanying notes to consolidated financial statements.
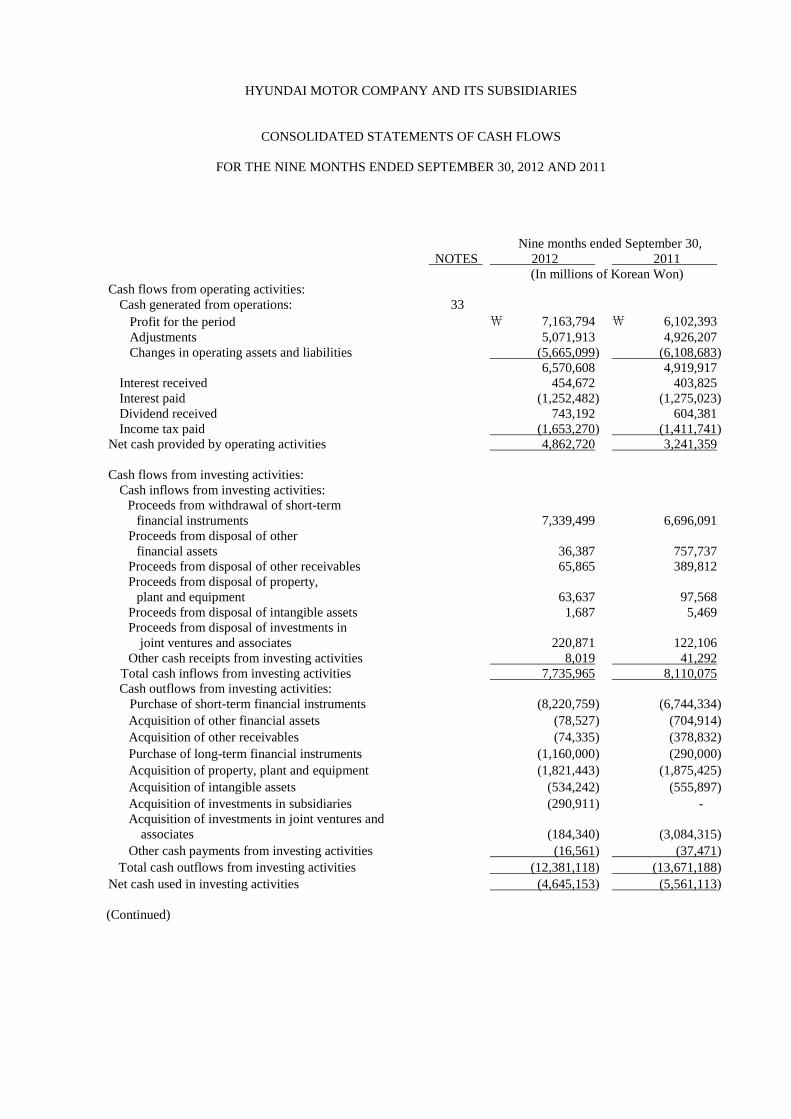
HYUNDAI MOTOR COMPANY AND ITS SUBSIDIARIES
CONSOLIDATED STATEMENTS OF CASH FLOWS
FOR THE NINE MONTHS ENDED SEPTEMBER 30, 2012 AND 2011
Nine months ended September 30,
NOTES 2012 2011
(In millions of Korean Won)
Cash flows from operating activities:
Cash generated from operations: 33
Profit for the period ₩ 7,163,794 ₩ 6,102,393
Adjustments 5,071,913 4,926,207
Changes in operating assets and liabilities (5,665,099) (6,108,683)
6,570,608 4,919,917
Interest received 454,672 403,825
Interest paid (1,252,482) (1,275,023)
Dividend received 743,192 604,381
Income tax paid (1,653,270) (1,411,741)
Net cash provided by operating activities 4,862,720 3,241,359
Cash flows from investing activities:
Cash inflows from investing activities:
Proceeds from withdrawal of short-term
financial instruments 7,339,499 6,696,091
Proceeds from disposal of other
financial assets 36,387 757,737
Proceeds from disposal of other receivables 65,865 389,812
Proceeds from disposal of property,
plant and equipment 63,637 97,568
Proceeds from disposal of intangible assets 1,687 5,469
Proceeds from disposal of investments in
joint ventures and associates 220,871 122,106
Other cash receipts from investing activities 8,019 41,292
Total cash inflows from investing activities 7,735,965 8,110,075
Cash outflows from investing activities:
Purchase of short-term financial instruments (8,220,759) (6,744,334)
Acquisition of other financial assets (78,527) (704,914)
Acquisition of other receivables (74,335) (378,832)
Purchase of long-term financial instruments (1,160,000) (290,000)
Acquisition of property, plant and equipment (1,821,443) (1,875,425)
Acquisition of intangible assets (534,242) (555,897)
Acquisition of investments in subsidiaries (290,911) -
Acquisition of investments in joint ventures and
associates (184,340) (3,084,315)
Other cash payments from investing activities (16,561) (37,471)
Total cash outflows from investing activities (12,381,118) (13,671,188)
Net cash used in investing activities (4,645,153) (5,561,113)
(Continued)
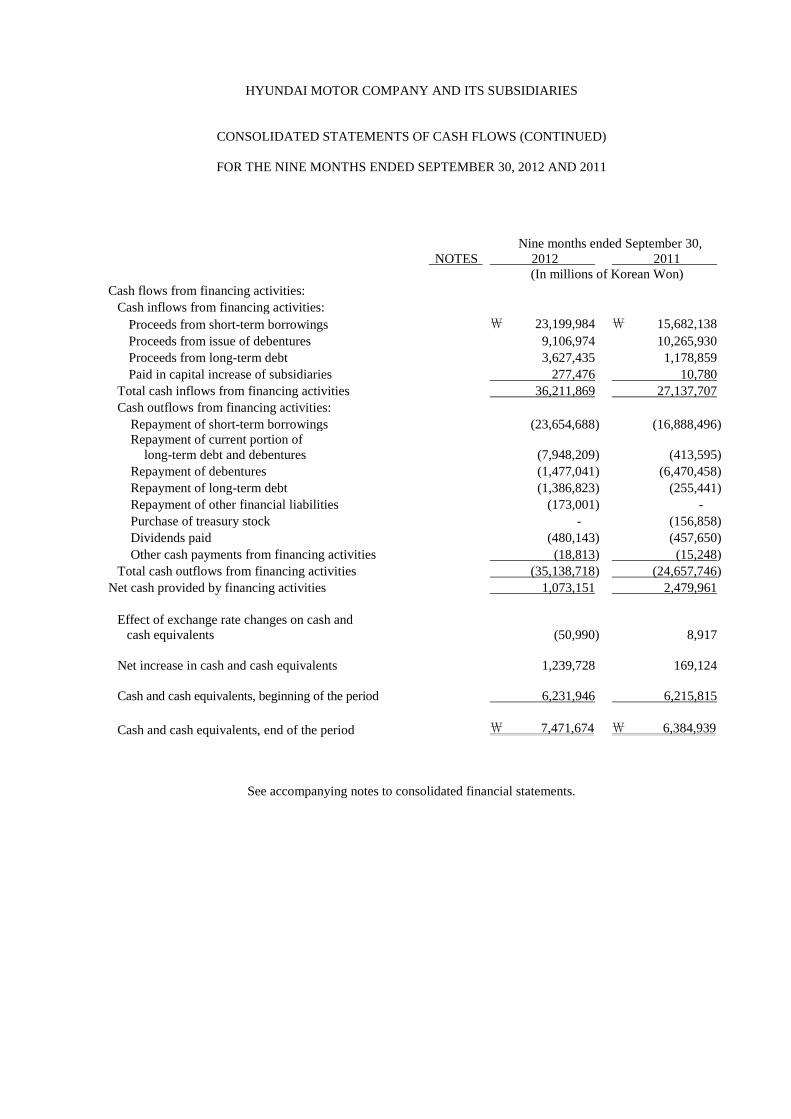
HYUNDAI MOTOR COMPANY AND ITS SUBSIDIARIES
CONSOLIDATED STATEMENTS OF CASH FLOWS (CONTINUED)
FOR THE NINE MONTHS ENDED SEPTEMBER 30, 2012 AND 2011
Nine months ended September 30,
NOTES 2012 2011
(In millions of Korean Won)
Cash flows from financing activities:
Cash inflows from financing activities:
Proceeds from short-term borrowings ₩ 23,199,984 ₩ 15,682,138
Proceeds from issue of debentures 9,106,974 10,265,930
Proceeds from long-term debt 3,627,435 1,178,859
Paid in capital increase of subsidiaries 277,476 10,780
Total cash inflows from financing activities 36,211,869 27,137,707
Cash outflows from financing activities:
Repayment of short-term borrowings (23,654,688) (16,888,496)
Repayment of current portion of
long-term debt and debentures (7,948,209) (413,595)
Repayment of debentures (1,477,041) (6,470,458)
Repayment of long-term debt (1,386,823) (255,441)
Repayment of other financial liabilities (173,001) -
Purchase of treasury stock - (156,858)
Dividends paid (480,143) (457,650)
Other cash payments from financing activities (18,813) (15,248)
Total cash outflows from financing activities (35,138,718) (24,657,746)
Net cash provided by financing activities 1,073,151 2,479,961
Effect of exchange rate changes on cash and
cash equivalents (50,990) 8,917
Net increase in cash and cash equivalents 1,239,728 169,124
Cash and cash equivalents, beginning of the period 6,231,946 6,215,815
Cash and cash equivalents, end of the period ₩ 7,471,674 ₩ 6,384,939
See accompanying notes to consolidated financial statements.
HYUNDAI MOTOR COMPANY AND ITS SUBSIDIARIES
NOTES TO CONSOLIDATED FINANCIAL STATEMENTS
FOR THE THREE MONTHS AND NINE MONTHS ENDED SEPTEMBER 30, 2012 AND 2011
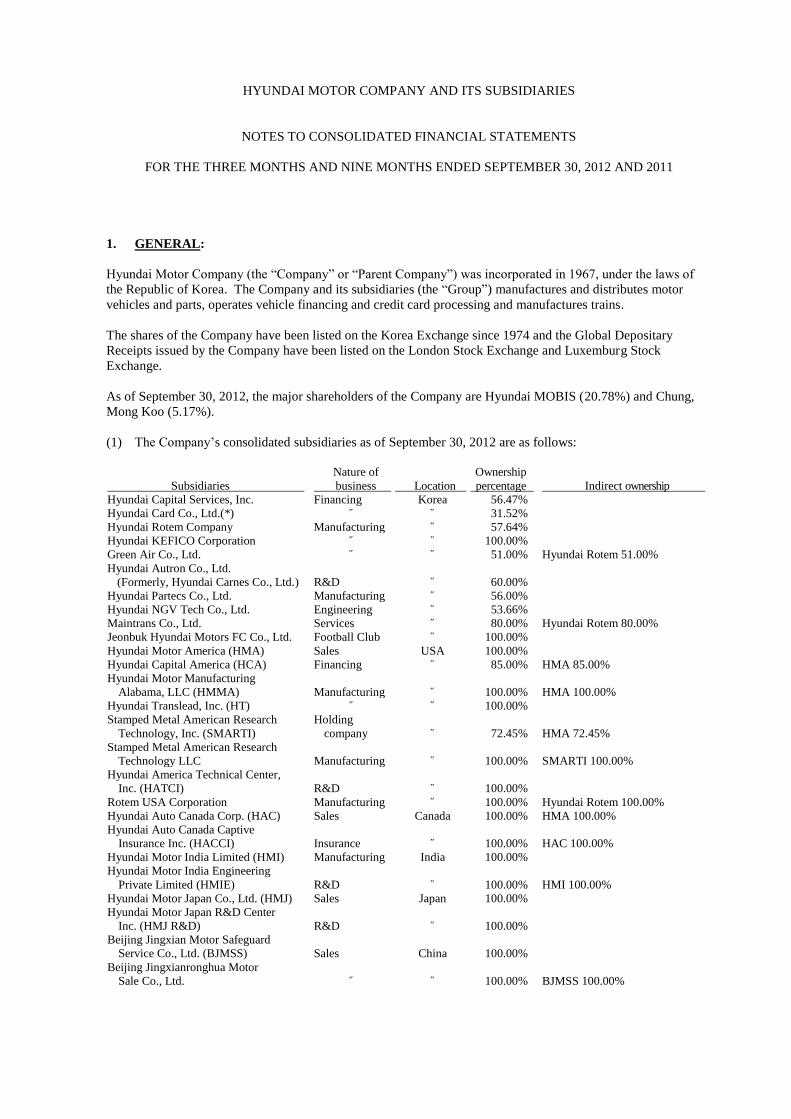
1. GENERAL:
Hyundai Motor Company (the “Company” or “Parent Company”) was incorporated in 1967, under the laws of
the Republic of Korea. The Company and its subsidiaries (the “Group”) manufactures and distributes motor
vehicles and parts, operates vehicle financing and credit card processing and manufactures trains.
The shares of the Company have been listed on the Korea Exchange since 1974 and the Global Depositary
Receipts issued by the Company have been listed on the London Stock Exchange and Luxemburg Stock
Exchange.
As of September 30, 2012, the major shareholders of the Company are Hyundai MOBIS (20.78%) and Chung,
Mong Koo (5.17%).
(1) The Company‟s consolidated subsidiaries as of September 30, 2012 are as follows:
Subsidiaries
Nature of
business
Location
Ownership
percentage
Indirect ownership
Hyundai Capital Services, Inc. Financing Korea 56.47%
Hyundai Card Co., Ltd.(*) ˝ ˝ 31.52%
Hyundai Rotem Company Manufacturing ˝ 57.64%
Hyundai KEFICO Corporation ˝ ˝ 100.00%
Green Air Co., Ltd. ˝ ˝ 51.00% Hyundai Rotem 51.00%
Hyundai Autron Co., Ltd.
(Formerly, Hyundai Carnes Co., Ltd.) R&D ˝ 60.00%
Hyundai Partecs Co., Ltd. Manufacturing ˝ 56.00%
Hyundai NGV Tech Co., Ltd. Engineering ˝ 53.66%
Maintrans Co., Ltd. Services ˝ 80.00% Hyundai Rotem 80.00%
Jeonbuk Hyundai Motors FC Co., Ltd. Football Club ˝ 100.00%
Hyundai Motor America (HMA) Sales USA 100.00%
Hyundai Capital America (HCA) Financing ˝ 85.00% HMA 85.00%
Hyundai Motor Manufacturing
Alabama, LLC (HMMA) Manufacturing ˝ 100.00% HMA 100.00%
Hyundai Translead, Inc. (HT) ˝ ˝ 100.00%
Stamped Metal American Research
Technology, Inc. (SMARTI)
Holding
company ˝ 72.45% HMA 72.45%
Stamped Metal American Research
Technology LLC Manufacturing ˝ 100.00% SMARTI 100.00%
Hyundai America Technical Center,
Inc. (HATCI) R&D ˝ 100.00%
Rotem USA Corporation Manufacturing ˝ 100.00% Hyundai Rotem 100.00%
Hyundai Auto Canada Corp. (HAC) Sales Canada 100.00% HMA 100.00%
Hyundai Auto Canada Captive
Insurance Inc. (HACCI) Insurance ˝ 100.00% HAC 100.00%
Hyundai Motor India Limited (HMI) Manufacturing India 100.00%
Hyundai Motor India Engineering
Private Limited (HMIE) R&D ˝ 100.00% HMI 100.00%
Hyundai Motor Japan Co., Ltd. (HMJ) Sales Japan 100.00%
Hyundai Motor Japan R&D Center
Inc. (HMJ R&D) R&D ˝ 100.00%
Beijing Jingxian Motor Safeguard
Service Co., Ltd. (BJMSS) Sales China 100.00%
Beijing Jingxianronghua Motor
Sale Co., Ltd. ˝ ˝ 100.00% BJMSS 100.00%

- 2 -
Subsidiaries
Nature of
business
Location
Ownership
percentage
Indirect ownership
Beijing Xinhuaxiaqiyuetong Motor
Chain Co., Ltd. ˝ ˝ 100.00% “
Beijing Hines Millennium Real Estate
Development
Real estate
development
China
99.00%
CMEs 99.00%
Rotem Equipments (Beijing) Co., Ltd. Manufacturing ˝ 100.00% Hyundai Rotem 100.00%
KEFICO Automotive Systems
(Beijing) Co., Ltd. ˝ ˝ 100.00% Hyundai KEFICO 100.00%
KEFICO VIETNAM COMPANY
LIMITED ˝ Vietnam 100.00% ˝
Hyundai Motor Company Australia
Pty Limited (HMCA) Sales Australia 100.00%
Hyundai Motor Manufacturing Czech,
s.r.o. (HMMC) Manufacturing Czech 100.00%
Hyundai Motor Czech s.r.o (HMCZ) Sales ˝ 100.00%
Hyundai Motor Europe GmbH (HME) Marketing and
Sales Germany 100.00%
Hyundai Motor Deutschland GmbH
(HMD) Sales ˝ 100.00%
Hyundai Motor Europe Technical
Center GmbH (HMETC) R&D ˝ 100.00%
Hyundai Capital Europe GmbH Financing ˝ 100.00% Hyundai Capital Services 100.00%
Hyundai Motor Manufacturing Rus
LLC (HMMR) Manufacturing Russia 70.00%
Hyundai Motor Commonwealth of
Independent States B.V (HMCIS B.V)
Holding
company Netherlands 100.00% HMMR 1.40%
Hyundai Motor Commonwealth of
Independent States (HMCIS) Sales Russia 100.00% HMCIS B.V 100.00%
Hyundai Capital Services Limited
Liability Company Financing ˝ 100.00% Hyundai Capital Europe 100.00%
Hyundai Assan Otomotiv Sanayi Ve
Ticaret A.S. (HAOSVT) Manufacturing Turkey 89.29%
Eurotem DEMIRYOLU ARACLARI
SAN. VE TIC A.S ˝ ˝ 50.50% Hyundai Rotem 50.50%
Hyundai Motor UK Limited (HMUK) Sales UK 100.00%
Hyundai Motor Company Italy S.r.l
(HMCI) ˝ Italy 100.00%
Hyundai Motor Espana. S.L (HMES) ˝ Spain 100.00%
Hyundai Motor France SAS (HMF) ˝ France 100.00%
Hyundai Motor Poland Sp. Zo.O (HMP) ˝ Poland 100.00%
Hyundai Motor Norway AS (HMN) ˝ Norway 100.00%
Hyundai de Mexico, SA DE C.V.,
(HYMEX) Manufacturing Mexico 99.99% HT 99.99%
Hyundai Motor Hungary (HMH) Sales Hungary 100.00%
Hyundai Motor Brasil Montadora de
Automoveis LTDA (HMB) Manufacturing Brazil 100.00%
China Millennium Corporations (CMEs) Holding
company
Cayman
Islands 59.60%
Autopia Thirty-Fifth ~ Thirty-Seventh
Asset Securitization Specialty
Company (*) Financing Korea 0.90% Hyundai Capital Services 0.90%
Autopia Thirty-Ninth ~ Fortieth
Asset Securitization Specialty
Company (*) ˝ ˝ 0.90% ˝
Autopia Forty-Second ~ Forty-Seventh
Asset Securitization Specialty
Company (*) ˝ ˝ 0.90% ˝
Privia the First ~ Third Securitization
Specialty Co., Ltd. (*) ˝ ˝ 0.90% Hyundai Card 0.90%
Hyundai BC Funding Corporation ˝ USA 100.00% HCA 100.00%
Hyundai CHA Funding Corporation ˝ ˝ 100.00% ˝
Hyundai Lease Titling Trust ˝ ˝ 100.00% ˝
Hyundai HK Funding, LLC ˝ ˝ 100.00% ˝
Hyundai HK Funding One, LLC ˝ ˝ 100.00% ˝
Hyundai HK Funding Two, LLC ˝ ˝ 100.00% ˝

- 3 -
Subsidiaries
Nature of
business
Location
Ownership
percentage
Indirect ownership
Hyundai Auto Lease Funding, LLC ˝ ˝ 100.00% ˝
Hyundai ABS Funding Corporation ˝ ˝ 100.00% ˝
Hyundai Capital Insurance Services, LLC ˝ ˝ 100.00% ˝
HK Real Properties, LLC ˝ ˝ 100.00% ˝
Hyundai Auto Lease Offering, LLC Financing USA 100.00% HCA 100.00%
Hyundai HK Lease, LLC ˝ ˝ 100.00% ˝
Hyundai Protection Plan, Inc. Insurance ˝ 100.00% ˝
Hyundai Protection Plan Florida, Inc. ˝ ˝ 100.00% ˝
Hyundai Capital Insurance Company ˝ ˝ 100.00% ˝
(*) The Group is considered to have substantial control over the entities by virtue of an agreement with other investors or
relationship with special purpose entities.
(2) Condensed financial information of the Company‟s major consolidated subsidiaries as of and for the nine
months ended September 30, 2012 is as follows:
Name of subsidiaries Assets Liabilities Sales (*2) Net income (*2)
(In millions of Korean Won)
Hyundai Capital Services, Inc. (*1) ₩ 21,661,493 ₩ 18,613,498 ₩ 2,495,529 ₩ 355,432
Hyundai Card Co., Ltd. (*1) 10,901,572 8,741,975 1,860,994 162,365
Hyundai Rotem Company (*1) 3,933,635 2,756,870 2,180,759 66,626
Hyundai KEFICO Corporation (*1, *2) 866,610 620,096 1,116,748 42,856
HCA (*1) 19,861,917 18,067,762 2,014,849 196,725
HMA 6,252,877 3,283,182 12,931,047 525,096
HMMC 2,639,899 1,470,532 4,066,450 353,326
HMMA 2,907,066 1,494,924 5,191,502 317,125
HMI (*1) 2,353,380 1,346,145 3,861,085 176,354
HMCIS 847,984 602,743 2,933,520 185,623
HAC (*1) 938,302 518,139 2,620,907 56,047
HMCA 709,775 483,396 1,759,499 13,206
HAOSVT 881,612 637,037 1,136,535 16,432
HMUK 488,568 441,606 1,010,518 7,764
(*1) Based on the subsidiary‟s consolidated financial statements
(*2) Accumulated amounts for the nine months ended September 30, 2012
(3) The financial statements of all subsidiaries, which are used in the preparation of the consolidated financial
statements, are prepared for the same reporting periods as the Company‟s.
(4) Changes in consolidated subsidiaries
Subsidiaries newly included in or excluded from consolidation for the nine months ended September 30, 2012
are as follows:
Changes Name of subsidiaries Description
Included
Hyundai Motor Deutschland GmbH
Acquisition
Hyundai Motor France SAS
Hyundai Automobiles Services SAS (HAS)
Hyundai Accessories & Parts SARL (HAAP)
GE Capital Korea, Ltd.
Hyundai Protection Plan, Inc.
Privia the Third Securitization Specialty Co., Ltd.
Hyundai Protection Plan Florida, Inc.
Hyundai Capital Insurance Company
Hyundai KEFICO Corporation
Capital reduction KEFICO Automotive Systems (Beijing) Co., Ltd.
KEFICO VIETNAM COMPANY LIMITED
Excluded
Hyundai Automobiles Services SAS
Merger Hyundai Accessories & Parts SARL
GE Capital Korea, Ltd.
- 4 -
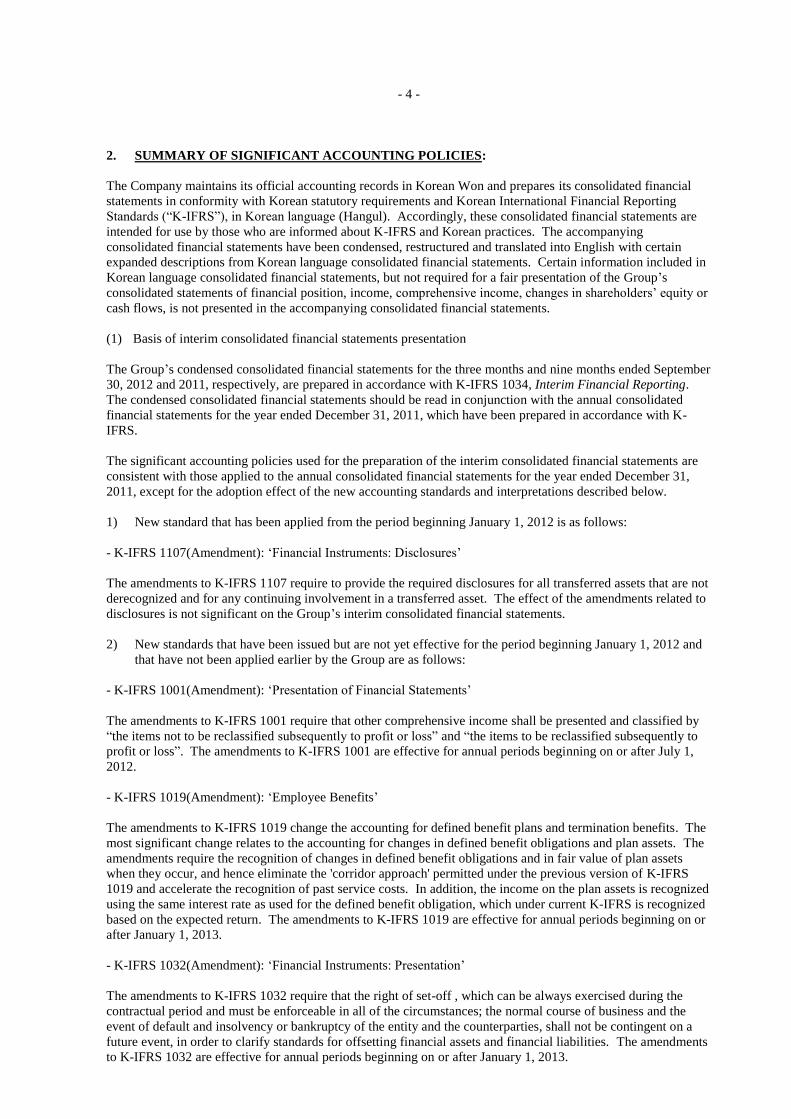
2. SUMMARY OF SIGNIFICANT ACCOUNTING POLICIES:
The Company maintains its official accounting records in Korean Won and prepares its consolidated financial
statements in conformity with Korean statutory requirements and Korean International Financial Reporting
Standards (“K-IFRS”), in Korean language (Hangul). Accordingly, these consolidated financial statements are
intended for use by those who are informed about K-IFRS and Korean practices. The accompanying
consolidated financial statements have been condensed, restructured and translated into English with certain
expanded descriptions from Korean language consolidated financial statements. Certain information included in
Korean language consolidated financial statements, but not required for a fair presentation of the Group‟s
consolidated statements of financial position, income, comprehensive income, changes in shareholders‟ equity or
cash flows, is not presented in the accompanying consolidated financial statements.
(1) Basis of interim consolidated financial statements presentation
The Group‟s condensed consolidated financial statements for the three months and nine months ended September
30, 2012 and 2011, respectively, are prepared in accordance with K-IFRS 1034, Interim Financial Reporting.
The condensed consolidated financial statements should be read in conjunction with the annual consolidated
financial statements for the year ended December 31, 2011, which have been prepared in accordance with K-
IFRS.
The significant accounting policies used for the preparation of the interim consolidated financial statements are
consistent with those applied to the annual consolidated financial statements for the year ended December 31,
2011, except for the adoption effect of the new accounting standards and interpretations described below.
1) New standard that has been applied from the period beginning January 1, 2012 is as follows:
- K-IFRS 1107(Amendment): „Financial Instruments: Disclosures‟
The amendments to K-IFRS 1107 require to provide the required disclosures for all transferred assets that are not
derecognized and for any continuing involvement in a transferred asset. The effect of the amendments related to
disclosures is not significant on the Group‟s interim consolidated financial statements.
2) New standards that have been issued but are not yet effective for the period beginning January 1, 2012 and
that have not been applied earlier by the Group are as follows:
- K-IFRS 1001(Amendment): „Presentation of Financial Statements‟
The amendments to K-IFRS 1001 require that other comprehensive income shall be presented and classified by
“the items not to be reclassified subsequently to profit or loss” and “the items to be reclassified subsequently to
profit or loss”. The amendments to K-IFRS 1001 are effective for annual periods beginning on or after July 1,
2012.
- K-IFRS 1019(Amendment): „Employee Benefits‟
The amendments to K-IFRS 1019 change the accounting for defined benefit plans and termination benefits. The
most significant change relates to the accounting for changes in defined benefit obligations and plan assets. The
amendments require the recognition of changes in defined benefit obligations and in fair value of plan assets
when they occur, and hence eliminate the 'corridor approach' permitted under the previous version of K-IFRS
1019 and accelerate the recognition of past service costs. In addition, the income on the plan assets is recognized
using the same interest rate as used for the defined benefit obligation, which under current K-IFRS is recognized
based on the expected return. The amendments to K-IFRS 1019 are effective for annual periods beginning on or
after January 1, 2013.
- K-IFRS 1032(Amendment): „Financial Instruments: Presentation‟
The amendments to K-IFRS 1032 require that the right of set-off , which can be always exercised during the
contractual period and must be enforceable in all of the circumstances; the normal course of business and the
event of default and insolvency or bankruptcy of the entity and the counterparties, shall not be contingent on a
future event, in order to clarify standards for offsetting financial assets and financial liabilities. The amendments
to K-IFRS 1032 are effective for annual periods beginning on or after January 1, 2013.
- 5 -
- K-IFRS 1107(Amendment): „Financial Instruments: Disclosures‟
The amendments to K-IFRS 1107 require that offsetting financial assets and financial liabilities shall be
disclosed. The amendments to K-IFRS 1107 are effective for annual periods beginning on or after January 1,
2013.
- K-IFRS 1113(Enactment): „Fair Value Measurement‟
K-IFRS 1113 establishes a single source of guidance for fair value measurements and disclosures about fair value
measurements. The standard defines fair value, establishes a framework for measuring fair value, and requires
disclosures about fair value measurements. K-IFRS 1113 is effective for annual periods beginning on or after
January 1, 2013.
The Group does not anticipate that these standards referred above will have a significant effect on the Group‟s
consolidated financial statements and disclosures.
(2) Significant accounting judgements and key sources of estimation uncertainties
In the preparation of the Group‟s interim consolidated financial statements, management is required to apply
accounting policies and make judgments, estimation and assumptions affecting the carrying amounts of assets
and liabilities, income and expenses. The estimation and assumptions are based on historical experience and
other factors that are considered to be relevant. Actual results may be different from those estimations. The
management‟s significant judgements about the application of the Group‟s accounting policies and the main
resources of the uncertainty are consistent with those of the annual consolidated financial statements for the year
ended December 31, 2011.
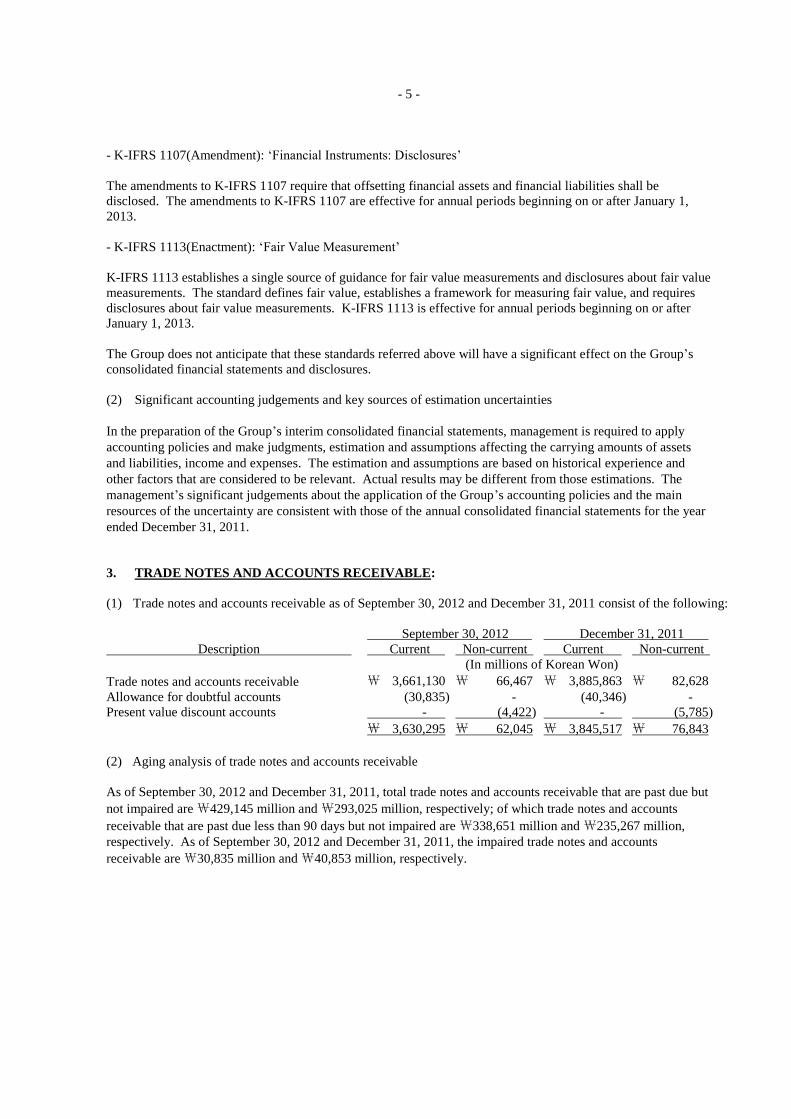
3. TRADE NOTES AND ACCOUNTS RECEIVABLE:
(1) Trade notes and accounts receivable as of September 30, 2012 and December 31, 2011 consist of the following:
September 30, 2012 December 31, 2011
Description Current Non-current Current Non-current
(In millions of Korean Won)
Trade notes and accounts receivable ₩ 3,661,130 ₩ 66,467 ₩ 3,885,863 ₩ 82,628
Allowance for doubtful accounts (30,835) - (40,346) -
Present value discount accounts - (4,422) - (5,785)
₩ 3,630,295 ₩ 62,045 ₩ 3,845,517 ₩ 76,843
(2) Aging analysis of trade notes and accounts receivable
As of September 30, 2012 and December 31, 2011, total trade notes and accounts receivable that are past due but
not impaired are ₩429,145 million and ₩293,025 million, respectively; of which trade notes and accounts
receivable that are past due less than 90 days but not impaired are ₩338,651 million and ₩235,267 million,
respectively. As of September 30, 2012 and December 31, 2011, the impaired trade notes and accounts
receivable are ₩30,835 million and ₩40,853 million, respectively.
- 6 -
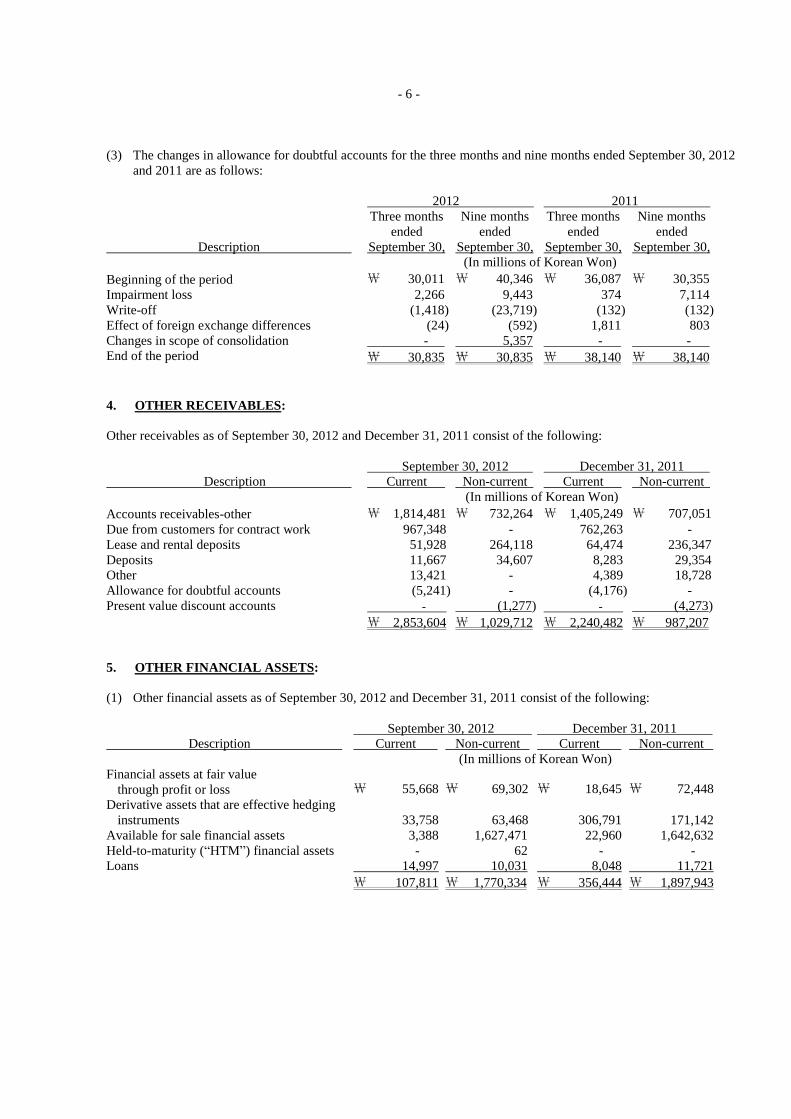
(3) The changes in allowance for doubtful accounts for the three months and nine months ended September 30, 2012
and 2011 are as follows:
2012 2011
Description
Three months
ended
September 30,
Nine months
ended
September 30,
Three months
ended
September 30,
Nine months
ended
September 30,
(In millions of Korean Won)
Beginning of the period ₩ 30,011 ₩ 40,346 ₩ 36,087 ₩ 30,355
Impairment loss 2,266 9,443 374 7,114
Write-off (1,418) (23,719) (132) (132)
Effect of foreign exchange differences (24) (592) 1,811 803
Changes in scope of consolidation - 5,357 - -
End of the period ₩ 30,835 ₩ 30,835 ₩ 38,140 ₩ 38,140
4. OTHER RECEIVABLES:
Other receivables as of September 30, 2012 and December 31, 2011 consist of the following:
September 30, 2012 December 31, 2011
Description Current Non-current Current Non-current
(In millions of Korean Won)
Accounts receivables-other ₩ 1,814,481 ₩ 732,264 ₩ 1,405,249 ₩ 707,051
Due from customers for contract work 967,348 - 762,263 -
Lease and rental deposits 51,928 264,118 64,474 236,347
Deposits 11,667 34,607 8,283 29,354
Other 13,421 - 4,389 18,728
Allowance for doubtful accounts (5,241) - (4,176) -
Present value discount accounts - (1,277) - (4,273)
₩ 2,853,604 ₩ 1,029,712 ₩ 2,240,482 ₩ 987,207
5. OTHER FINANCIAL ASSETS:
(1) Other financial assets as of September 30, 2012 and December 31, 2011 consist of the following:
September 30, 2012 December 31, 2011
Description Current Non-current Current Non-current
(In millions of Korean Won)
Financial assets at fair value
through profit or loss ₩ 55,668 ₩ 69,302 ₩ 18,645 ₩ 72,448
Derivative assets that are effective hedging
instruments 33,758 121,644
63,468 306,791 171,142
Available for sale financial assets 3,388 1,627,471 22,960 1,642,632
Held-to-maturity (“HTM”) financial assets - 62 - -
Loans 14,997 10,031 8,048 11,721
₩ 107,811 ₩ 1,770,334 ₩ 356,444 ₩ 1,897,943

- 7 -
(2) Available for sale (“AFS”) financial assets which are measured at fair value as of September 30, 2012 and
December 31, 2011 consist of the following:
September 30, 2012
December 31,
2011
Description
Acquisition
cost
Difference
Book value Book value
(In millions of Korean Won)
Debt instruments ₩ 5,514 ₩ 209 ₩ 5,723 ₩ 24,739
Equity instruments 675,282 949,854 1,625,136 1,640,853
₩ 680,796 ₩ 950,063 ₩ 1,630,859 ₩ 1,665,592
(3) Equity instruments classified into AFS financial assets as of September 30, 2012 and December 31, 2011 consist
of the following:
September 30, 2012
December 31,
2011
Name of company
Ownership
percentage
Acquisition
cost
Difference
Book value Book value
(%) (In millions of Korean Won)
Hyundai Heavy Industries Co., Ltd. 2.88 ₩ 56,924 ₩ 496,051 ₩ 552,975 ₩ 562,830
Hyundai Glovis Co., Ltd. 4.88 210,688 235,146 445,834 351,540
Korea Aerospace Industries, Co., Ltd. 10.00 151,086 120,870 271,956 385,514
Hyundai Oil Refinery Co., Ltd. 4.35 53,734 76,363 130,097 130,097
Hyundai Green Food Co., Ltd. 2.36 15,005 27,918 42,923 37,270
Seoul Metro Line Nine Corporation (*) 25.00 41,779 - 41,779 41,779
Hyundai Merchant Marine Co., Ltd. 0.48 9,161 9,308 18,469 17,394
Doosan Capital Co., Ltd. 7.14 10,000 6,406 16,406 16,406
Hyundai Finance Corporation 9.29 9,888 1,062 10,950 10,427
Hyundai Development Company 0.60 9,025 988 10,013 7,560
Ubivelox Co., Ltd. 5.23 1,710 7,616 9,326 9,310
KT Corporation 0.09 8,655 (204) 8,451 8,559
NICE Information Service Co., Ltd. 2.25 3,312 (167) 3,145 3,189
NICE Holdings Co., Ltd. 1.42 3,491 (812) 2,679 2,497
Hyundai Asan Corporation 2.53 22,500 (20,384) 2,116 4,239
NESSCAP, Inc. 6.90 1,997 (726) 1,271 2,804
ENOVA Systems, Inc. 0.42 2,204 (2,181) 23 36
Other 64,123 (7,400) 56,723 49,402
₩ 675,282 ₩ 949,854 ₩ 1,625,136 ₩ 1,640,853
(*) Investments are not accounted for using the equity method, as the Group is considered not to have significant influence
over the investee, despite the fact that its ownership percentage exceeds twenty percentages.
As of September 30, 2012, the difference between the book value and the acquisition cost of AFS equity
instruments includes the cumulative impairment loss of ₩27,680 million.

- 8 -
6. INVENTORIES:
Inventories as of September 30, 2012 and December 31, 2011 consist of the following:
Description September 30, 2012 December 31, 2011
(In millions of Korean Won)
Finished goods ₩ 3,324,669 ₩ 3,293,273
Merchandise 307,200 242,583
Semi-finished goods 431,418 332,892
Work in process 388,068 304,958
Raw materials 1,177,965 1,050,361
Supplies 168,536 173,195
Materials in transit 527,191 420,601
Other 366,392 419,889
₩ 6,691,439 ₩ 6,237,752
7. OTHER ASSETS:
Other assets as of September 30, 2012 and December 31, 2011 consist of the following:
September 30, 2012 December 31, 2011
Description Current Non-current Current Non-current
(In millions of Korean Won)
Accrued income ₩ 361,478 ₩ 384 ₩ 310,286 ₩ -
Advanced payments 622,850 6,331 387,116 -
Prepaid expenses 247,986 4,976 230,561 1,288
Prepaid value added tax and other 507,847 - 209,899 -
₩ 1,740,161 ₩ 11,691 ₩ 1,137,862 ₩ 1,288
8. PROPERTY, PLANT AND EQUIPMENT:
The changes in property, plant and equipment for the nine months ended September 30, 2012 are as follows:
Description
Beginning of
the period
Acquisition
Acquisition
from business
combinations
Transfer
Disposal
Depreciation
Other (*)
End of
the period
(In millions of Korean Won)
Land ₩ 5,637,917 ₩ 68,770 ₩ 36,189 ₩ 75,908 ₩ (14,470) ₩ - ₩ 37,315 ₩ 5,841,629
Buildings 4,269,581 50,796 46,892 415,122 (6,666) (140,135) (47,030) 4,588,560
Structures 543,372 3,785 1,712 49,731 (705) (43,460) (2,400) 552,035
Machinery and
equipment 5,442,619 9,843 159,058 770,224 (30,727) (524,025) (70,898) 5,756,094
Vehicles 163,287 38,504 12,525 16,630 (12,657) (26,644) (7,238) 184,407
Dies, molds
and tools 1,425,188 18,316 7,421 376,156 (6,049) (380,444) (17,121) 1,423,467
Office equipment 354,913 48,285 2,844 84,838 (1,236) (110,321) (2,499) 376,824
Other 52,412 1,287 4,112 (11,527) (309) (6,704) (2,678) 36,593
Construction in
progress 1,658,759 1,581,857 29,213 (1,777,082) (3,458) - 23,435 1,512,724
₩ 19,548,048 ₩ 1,821,443 ₩ 299,966 ₩ - ₩ (76,277) ₩ (1,231,733) ₩ (89,114) ₩ 20,272,333
(*) Other includes the effect of foreign exchange differences and transfers from or to other accounts.
- 9 -
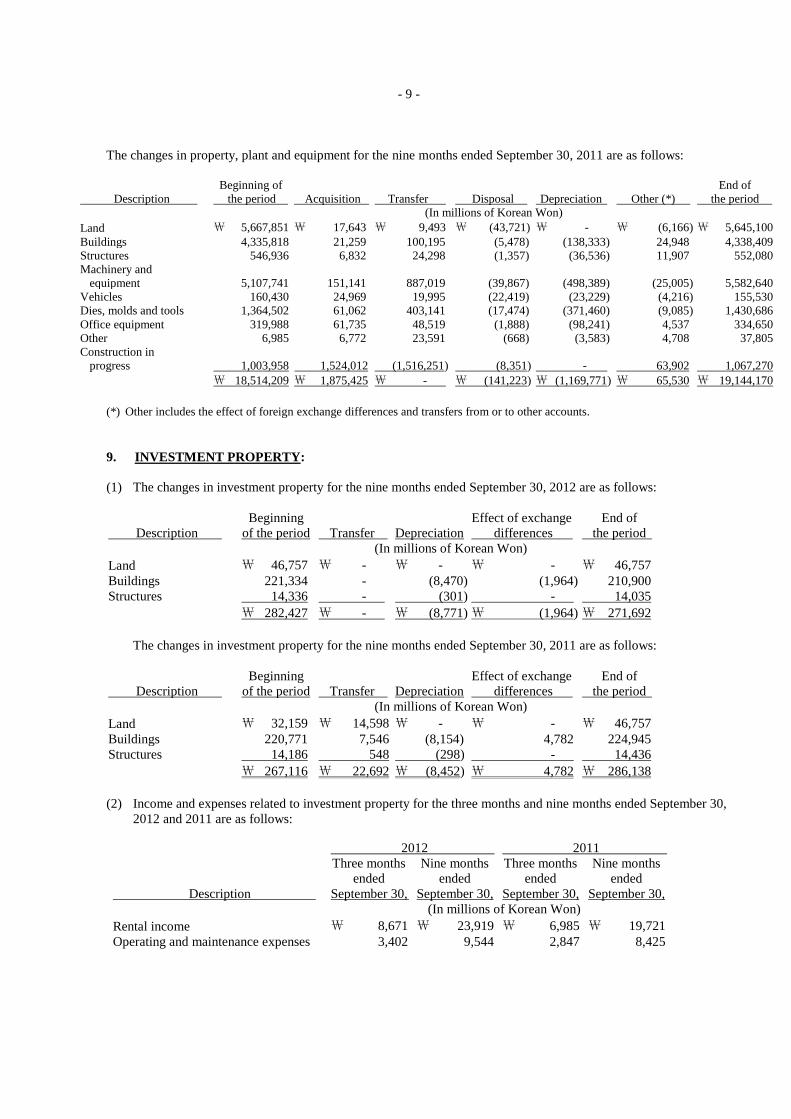
The changes in property, plant and equipment for the nine months ended September 30, 2011 are as follows:
Description
Beginning of
the period Acquisition Transfer Disposal Depreciation Other (*)
End of
the period
(In millions of Korean Won)
Land ₩ 5,667,851 ₩ 17,643 ₩ 9,493 ₩ (43,721) ₩ - ₩ (6,166) ₩ 5,645,100
Buildings 4,335,818 21,259 100,195 (5,478) (138,333) 24,948 4,338,409
Structures 546,936 6,832 24,298 (1,357) (36,536) 11,907 552,080
Machinery and
equipment 5,107,741 151,141 887,019 (39,867) (498,389) (25,005) 5,582,640
Vehicles 160,430 24,969 19,995 (22,419) (23,229) (4,216) 155,530
Dies, molds and tools 1,364,502 61,062 403,141 (17,474) (371,460) (9,085) 1,430,686
Office equipment 319,988 61,735 48,519 (1,888) (98,241) 4,537 334,650
Other 6,985 6,772 23,591 (668) (3,583) 4,708 37,805
Construction in
progress 1,003,958 1,524,012 (1,516,251) (8,351) - 63,902 1,067,270
₩ 18,514,209 ₩ 1,875,425 ₩ - ₩ (141,223) ₩ (1,169,771) ₩ 65,530 ₩ 19,144,170
(*) Other includes the effect of foreign exchange differences and transfers from or to other accounts.
9. INVESTMENT PROPERTY:
(1) The changes in investment property for the nine months ended September 30, 2012 are as follows:
Description
Beginning
of the period Transfer Depreciation
Effect of exchange
differences
End of
the period
(In millions of Korean Won)
Land ₩ 46,757 ₩ - ₩ - ₩ - ₩ 46,757
Buildings 221,334 - (8,470) (1,964) 210,900
Structures 14,336 - (301) - 14,035
₩ 282,427 ₩ - ₩ (8,771) ₩ (1,964) ₩ 271,692
The changes in investment property for the nine months ended September 30, 2011 are as follows:
Description
Beginning
of the period Transfer Depreciation
Effect of exchange
differences
End of
the period
(In millions of Korean Won)
Land ₩ 32,159 ₩ 14,598 ₩ - ₩ - ₩ 46,757
Buildings 220,771 7,546 (8,154) 4,782 224,945
Structures 14,186 548 (298) - 14,436
₩ 267,116 ₩ 22,692 ₩ (8,452) ₩ 4,782 ₩ 286,138
(2) Income and expenses related to investment property for the three months and nine months ended September 30,
2012 and 2011 are as follows:
2012 2011
Description
Three months
ended
September 30,
Nine months
ended
September 30,
Three months
ended
September 30,
Nine months
ended
September 30,
(In millions of Korean Won)
Rental income ₩ 8,671 ₩ 23,919 ₩ 6,985 ₩ 19,721
Operating and maintenance expenses 3,402 9,544 2,847 8,425

- 10 -
10. INTANGIBLES:
(1) The changes in intangibles for the nine months ended September 30, 2012 are as follows:
Description
Beginning
of the period
Internal
development
and separate
acquisition
Acquisition
from
business
combinations
Transfer Disposal Amortization Other (*)
End of
the period
(In millions of Korean Won)
Goodwill ₩ 177,154 ₩ - ₩ 114,552 ₩ - ₩ - ₩ - ₩ (725) ₩ 290,981
Development costs 1,848,032 414,038 74,776 22,308 - (554,330) 1,707 1,806,531
Industrial property rights 22,777 151 455 6,663 - (4,461) 448 26,033
Software 181,716 9,469 4,212 17,908 (21) (43,553) 40,658 210,389
Other 290,099 36,186 1,940 14,165 (1,550) (23,528) (1,649) 315,663
Construction in progress 140,331 74,398 - (61,044) (32) - (15,790) 137,863
₩ 2,660,109 ₩ 534,242 ₩ 195,935 ₩ - ₩ (1,603) ₩ (625,872) ₩ 24,649 ₩ 2,787,460
(*) Other includes the effect of foreign exchange differences and transfer from or to other accounts.
The changes in intangibles for the nine months ended September 30, 2011 are as follows:
Description
Beginning
of the period
Internal
development
and separate
acquisition
Transfer
Disposal Amortization Impairment Other (*)
End of
the period
(In millions of Korean Won)
Goodwill ₩ 177,607 ₩ - ₩ - ₩ - ₩ - ₩ - ₩ 2,336 ₩ 179,943
Development costs 1,943,466 438,859 11,904 (50) (481,010) (79,204) 7,174 1,841,139
Industrial property rights 21,027 75 4,893 - (3,905) - 10 22,100
Software 137,533 15,267 14,694 (5) (34,017) - 41,029 174,501
Other 273,778 29,933 4,682 (5,237) (16,598) - 9,129 295,687
Construction in progress 98,157 71,763 (36,173) (5) - - (1,790) 131,952
₩ 2,651,568 ₩ 555,897 ₩ - ₩ (5,297) ₩ (535,530) ₩ (79,204) ₩ 57,888 ₩ 2,645,322
(*) Other includes the effect of foreign exchange differences and transfer from or to other accounts.
(2) Research and development expenditure for the three months and nine months ended September 30, 2012 and
2011 are as follows:
2012 2011
Description
Three months
ended
September 30,
Nine months
ended
September 30,
Three months
ended
September 30,
Nine months
ended
September 30,
(In millions of Korean Won)
Development costs ₩ 170,609 ₩ 414,038 ₩ 178,521 ₩ 438,859
Ordinary development (manufacturing cost) 81,921 191,499 52,666 128,916
Research costs (administrative expenses) 167,720 459,738 172,425 418,925
₩ 420,250 ₩ 1,065,275 ₩ 403,612 ₩ 986,700
(3) Impairment test of goodwill
The recoverable amount of the Group‟s cash - generating unit (“CGU”) are measured at its value-in-use. The
value-in use are calculated based on cash flow projections of financial budgets for the next five years approved
by management. Cash flows projection beyond the next five-year period are extrapolated by using the estimated
growth rate which does not exceed the long-term average growth rate of the region and industry to which the
CGU belongs. No impairment loss is recognized based on the impairment test for the nine months ended
September 30, 2012 and 2011, respectively.

- 11 -
11. INVESTMENTS IN JOINT VENTURES AND ASSOCIATES:
(1) Investments in joint ventures and associates as of September 30, 2012 and December 31, 2011 consist of the
following:
September 30,
2012
December 31,
2011
Name of company
Nature of
business
Location
Ownership
Percentage
Book value
Book value
(%) (In millions of Korean Won)
Beijing-Hyundai Motor Company (BHMC) (*3) Manufacturing China 50.00 ₩ 1,468,214 ₩ 1,553,871
Hyundai Motor Group China, Ltd. (HMGC) (*3) Investment " 50.00 100,971 128,318
Hyundai WIA Automotive Engine (Shandong)
Company (WAE) Manufacturing " 22.00 100,284 81,260
Beijing Mobis Transmission Co., Ltd. (BMT) " " 24.08 59,312 64,575
Beijing Hyundai Auto Finance Co., Ltd.
(BHAF) (*4) Financing " 60.00 51,174 -
Hyundai Powertech Manufacturing America
(HPMA) Manufacturing U.S.A
30.00 23,754 23,796
Hyundai Powertech (Shandong) Co., Ltd. (PTS) " China 30.00 18,744 24,495
Innocean Worldwide Americas, LLC (IWA) Advertisement U.S.A 30.00 10,372 11,027
Hyundai Capital Services UK Ltd. (HCUK) Financing UK 39.99 8,953 -
Hyundai Information Service North America
(HISNA)
Information
technology U.S.A
30.00 3,238 3,476
Global Engine Alliance, LLC (GEA) Manufacturing " 33.33 1,798 1,865
Hyundai Capital Germany GmbH (HCGG) Financing Germany 40.01 1,381 1,065
Hyundai Motor Deutschland GmbH (HMD) (*2) Sales " 100.00 - 30,026
Kia Motors Corporation Manufacturing Korea 33.88 5,504,865 4,565,683
Hyundai engineering & construction Co., Ltd. Construction " 20.95 3,032,924 3,011,421
Hyundai HYSCO Co., Ltd. Manufacturing " 29.37 618,086 449,438
Hyundai WIA Corporation " " 26.79 459,923 482,996
Hyundai Powertech Co., Ltd. " " 37.58 295,383 254,066
HMC Investment Securities Co., Ltd. Securities
brokerage "
26.27 217,370 210,511
Hyundai Dymos Inc. Manufacturing " 47.27 215,851 194,332
Hyundai Commercial Inc. Financing " 50.00 115,752 122,364
Eukor Car Carriers Inc. (*1) Transportation " 12.00 122,657 111,312
Hyundai Autoever Corp. Information
technology " 29.90 52,422 47,215
HK Mutual Savings Bank Financing " 20.00 49,666 45,735
The Korea Economic Daily Co., Ltd. Newspaper " 20.55 33,652 32,220
Iljin Bearing Co., Ltd. Manufacturing " 20.00 24,351 22,928
Hyundai M & Soft Co., Ltd. Information
technology "
31.84 22,793 19,963
HMC Win Win Fund Investment
association "
33.33 18,589 18,589
Daesung Automotive Co., Ltd. Manufacturing " 20.00 16,302 15,841
Korea Credit Bureau Co., Ltd. (*1) Financing " 9.00 5,086 4,966
Haevichi Country Club., Ltd. Golf course
operation " 30.00 2,937 -
Seoul Line 9 Operation Co., Ltd. Metro
operation " 20.00 1,772 1,159
Clair Pixel Co., Ltd. (*1) Manufacturing " 19.22 1,448 1,986
HI Network Inc. (*1) Financing " 19.99 739 1,003
Hyundai KEFICO Corporation (*2) Manufacturing " 100.00 - 171,736
₩12,660,763 ₩ 11,709,238
(*1) As the Group is considered to be able to exercise significant influence by representation on board of directors of the
investee and other reasons, although the total ownership percentage is less than 20%, the investment is accounted for
using the equity method.
- 12 -
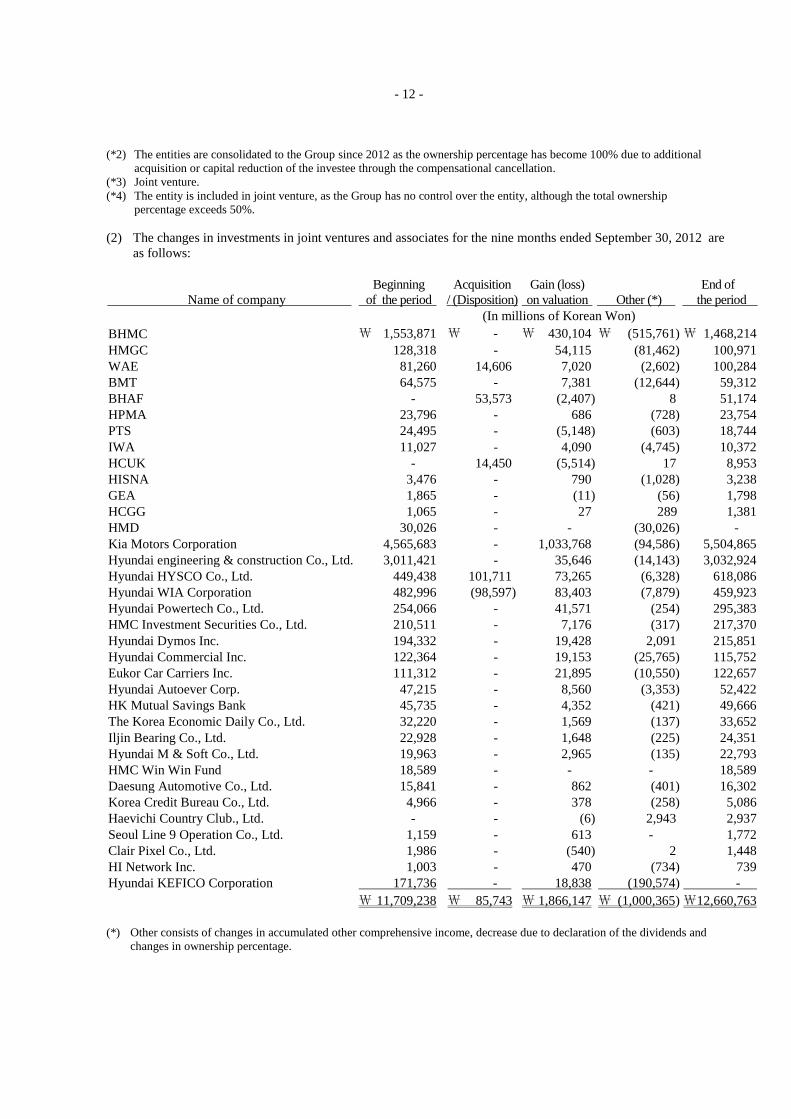
(*2) The entities are consolidated to the Group since 2012 as the ownership percentage has become 100% due to additional
acquisition or capital reduction of the investee through the compensational cancellation. (*3) Joint venture.
(*4) The entity is included in joint venture, as the Group has no control over the entity, although the total ownership
percentage exceeds 50%.
(2) The changes in investments in joint ventures and associates for the nine months ended September 30, 2012 are
as follows:
Name of company
Beginning
of the period
Acquisition
/ (Disposition)
Gain (loss)
on valuation Other (*)
End of
the period
(In millions of Korean Won)
BHMC ₩ 1,553,871 ₩ - ₩ 430,104 ₩ (515,761) ₩ 1,468,214
HMGC 128,318 - 54,115 (81,462) 100,971
WAE 81,260 14,606 7,020 (2,602) 100,284
BMT 64,575 - 7,381 (12,644) 59,312
BHAF - 53,573 (2,407) 8 51,174
HPMA 23,796 - 686 (728) 23,754
PTS 24,495 - (5,148) (603) 18,744
IWA 11,027 - 4,090 (4,745) 10,372
HCUK - 14,450 (5,514) 17 8,953
HISNA 3,476 - 790 (1,028) 3,238
GEA 1,865 - (11) (56) 1,798
HCGG 1,065 - 27 289 1,381
HMD 30,026 - - (30,026) -
Kia Motors Corporation 4,565,683 - 1,033,768 (94,586) 5,504,865
Hyundai engineering & construction Co., Ltd. 3,011,421 - 35,646 (14,143) 3,032,924
Hyundai HYSCO Co., Ltd. 449,438 101,711 73,265 (6,328) 618,086
Hyundai WIA Corporation 482,996 (98,597) 83,403 (7,879) 459,923
Hyundai Powertech Co., Ltd. 254,066 - 41,571 (254) 295,383
HMC Investment Securities Co., Ltd. 210,511 - 7,176 (317) 217,370
Hyundai Dymos Inc. 194,332 - 19,428 2,091 215,851
Hyundai Commercial Inc. 122,364 - 19,153 (25,765) 115,752
Eukor Car Carriers Inc. 111,312 - 21,895 (10,550) 122,657
Hyundai Autoever Corp. 47,215 - 8,560 (3,353) 52,422
HK Mutual Savings Bank 45,735 - 4,352 (421) 49,666
The Korea Economic Daily Co., Ltd. 32,220 - 1,569 (137) 33,652
Iljin Bearing Co., Ltd. 22,928 - 1,648 (225) 24,351
Hyundai M & Soft Co., Ltd. 19,963 - 2,965 (135) 22,793
HMC Win Win Fund 18,589 - - - 18,589
Daesung Automotive Co., Ltd. 15,841 - 862 (401) 16,302
Korea Credit Bureau Co., Ltd. 4,966 - 378 (258) 5,086
Haevichi Country Club., Ltd. - - (6) 2,943 2,937
Seoul Line 9 Operation Co., Ltd. 1,159 - 613 - 1,772
Clair Pixel Co., Ltd. 1,986 - (540) 2 1,448
HI Network Inc. 1,003 - 470 (734) 739
Hyundai KEFICO Corporation 171,736 - 18,838 (190,574) - -
₩ 11,709,238 ₩ 85,743 ₩ 1,866,147 ₩ (1,000,365) ₩ 12,660,763
(*) Other consists of changes in accumulated other comprehensive income, decrease due to declaration of the dividends and
changes in ownership percentage.
- 13 -
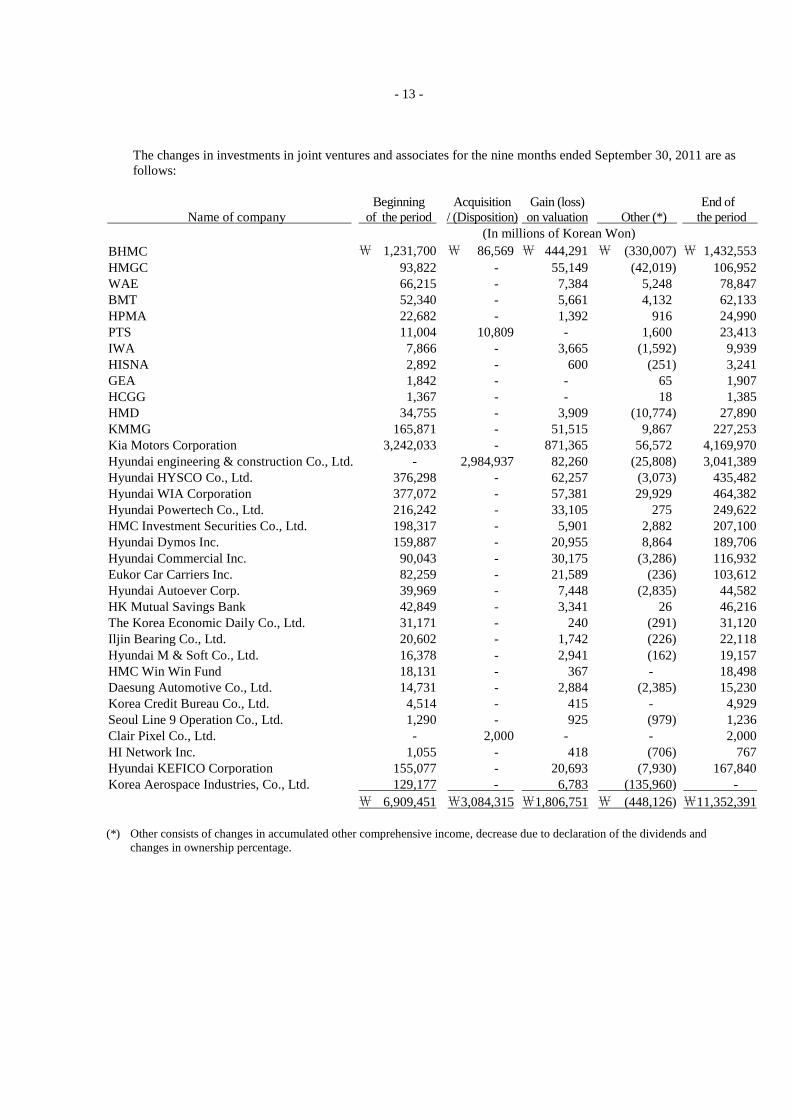
The changes in investments in joint ventures and associates for the nine months ended September 30, 2011 are as
follows:
Name of company
Beginning
of the period
Acquisition
/ (Disposition)
Gain (loss)
on valuation Other (*)
End of
the period
(In millions of Korean Won)
BHMC ₩ 1,231,700 ₩ 86,569 ₩ 444,291 ₩ (330,007) ₩ 1,432,553
HMGC 93,822 - 55,149 (42,019) 106,952
WAE 66,215 - 7,384 5,248 78,847
BMT 52,340 - 5,661 4,132 62,133
HPMA 22,682 - 1,392 916 24,990
PTS 11,004 10,809 - 1,600 23,413
IWA 7,866 - 3,665 (1,592) 9,939
HISNA 2,892 - 600 (251) 3,241
GEA 1,842 - - 65 1,907
HCGG 1,367 - - 18 1,385
HMD 34,755 - 3,909 (10,774) 27,890
KMMG 165,871 - 51,515 9,867 227,253
Kia Motors Corporation 3,242,033 - 871,365 56,572 4,169,970
Hyundai engineering & construction Co., Ltd. - 2,984,937 82,260 (25,808) 3,041,389
Hyundai HYSCO Co., Ltd. 376,298 - 62,257 (3,073) 435,482
Hyundai WIA Corporation 377,072 - 57,381 29,929 464,382
Hyundai Powertech Co., Ltd. 216,242 - 33,105 275 249,622
HMC Investment Securities Co., Ltd. 198,317 - 5,901 2,882 207,100
Hyundai Dymos Inc. 159,887 - 20,955 8,864 189,706
Hyundai Commercial Inc. 90,043 - 30,175 (3,286) 116,932
Eukor Car Carriers Inc. 82,259 - 21,589 (236) 103,612
Hyundai Autoever Corp. 39,969 - 7,448 (2,835) 44,582
HK Mutual Savings Bank 42,849 - 3,341 26 46,216
The Korea Economic Daily Co., Ltd. 31,171 - 240 (291) 31,120
Iljin Bearing Co., Ltd. 20,602 - 1,742 (226) 22,118
Hyundai M & Soft Co., Ltd. 16,378 - 2,941 (162) 19,157
HMC Win Win Fund 18,131 - 367 - 18,498
Daesung Automotive Co., Ltd. 14,731 - 2,884 (2,385) 15,230
Korea Credit Bureau Co., Ltd. 4,514 - 415 - 4,929
Seoul Line 9 Operation Co., Ltd. 1,290 - 925 (979) 1,236
Clair Pixel Co., Ltd. - 2,000 - - 2,000
HI Network Inc. 1,055 - 418 (706) 767
Hyundai KEFICO Corporation 155,077 - 20,693 (7,930) 167,840
Korea Aerospace Industries, Co., Ltd. 129,177 - 6,783 (135,960) -
₩ 6,909,451 ₩3,084,315 ₩1,806,751 ₩ (448,126) ₩ 11,352,391
(*) Other consists of changes in accumulated other comprehensive income, decrease due to declaration of the dividends and
changes in ownership percentage.
- 14 -
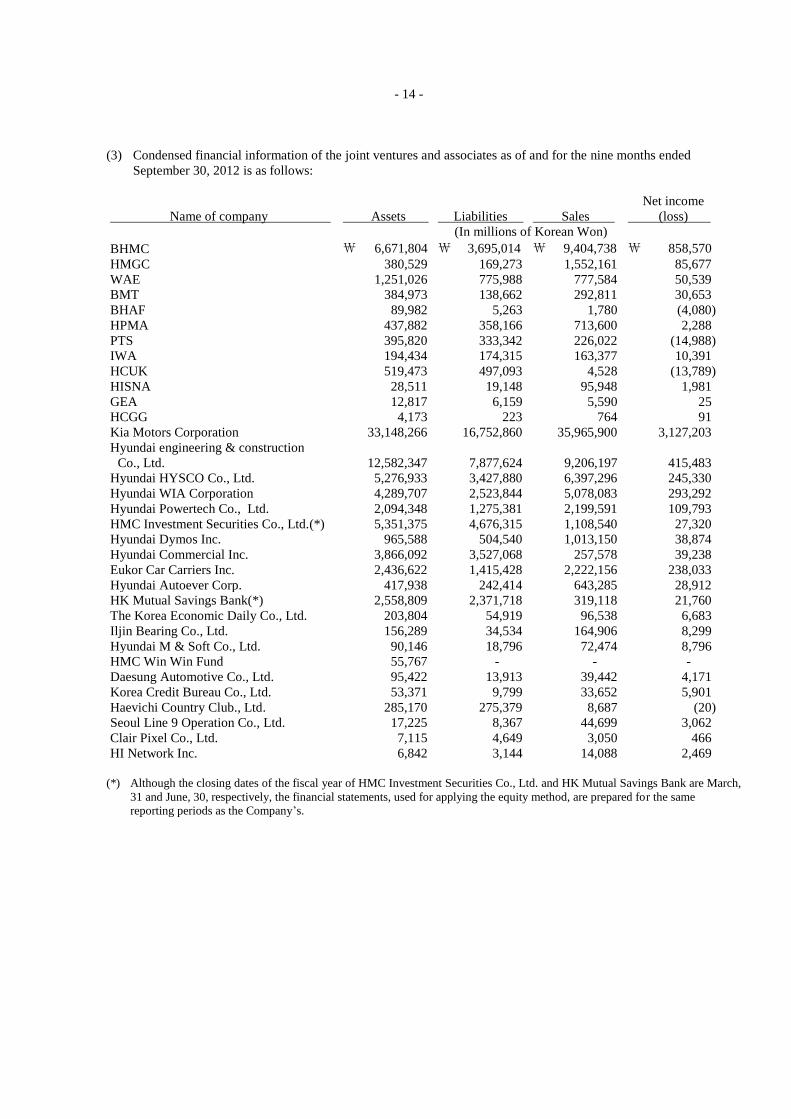
(3) Condensed financial information of the joint ventures and associates as of and for the nine months ended
September 30, 2012 is as follows:
Name of company
Assets
Liabilities
Sales
Net income
(loss)
(In millions of Korean Won)
BHMC ₩ 6,671,804 ₩ 3,695,014 ₩ 9,404,738 ₩ 858,570
HMGC 380,529 169,273 1,552,161 85,677
WAE 1,251,026 775,988 777,584 50,539
BMT 384,973 138,662 292,811 30,653
BHAF 89,982 5,263 1,780 (4,080)
HPMA 437,882 358,166 713,600 2,288
PTS 395,820 333,342 226,022 (14,988)
IWA 194,434 174,315 163,377 10,391
HCUK 519,473 497,093 4,528 (13,789)
HISNA 28,511 19,148 95,948 1,981
GEA 12,817 6,159 5,590 25
HCGG 4,173 223 764 91
Kia Motors Corporation 33,148,266 16,752,860 35,965,900 3,127,203
Hyundai engineering & construction
Co., Ltd. 12,582,347 7,877,624 9,206,197 415,483
Hyundai HYSCO Co., Ltd. 5,276,933 3,427,880 6,397,296 245,330
Hyundai WIA Corporation 4,289,707 2,523,844 5,078,083 293,292
Hyundai Powertech Co., Ltd. 2,094,348 1,275,381 2,199,591 109,793
HMC Investment Securities Co., Ltd.(*) 5,351,375 4,676,315 1,108,540 27,320
Hyundai Dymos Inc. 965,588 504,540 1,013,150 38,874
Hyundai Commercial Inc. 3,866,092 3,527,068 257,578 39,238
Eukor Car Carriers Inc. 2,436,622 1,415,428 2,222,156 238,033
Hyundai Autoever Corp. 417,938 242,414 643,285 28,912
HK Mutual Savings Bank(*) 2,558,809 2,371,718 319,118 21,760
The Korea Economic Daily Co., Ltd. 203,804 54,919 96,538 6,683
Iljin Bearing Co., Ltd. 156,289 34,534 164,906 8,299
Hyundai M & Soft Co., Ltd. 90,146 18,796 72,474 8,796
HMC Win Win Fund 55,767 - - -
Daesung Automotive Co., Ltd. 95,422 13,913 39,442 4,171
Korea Credit Bureau Co., Ltd. 53,371 9,799 33,652 5,901
Haevichi Country Club., Ltd. 285,170 275,379 8,687 (20)
Seoul Line 9 Operation Co., Ltd. 17,225 8,367 44,699 3,062
Clair Pixel Co., Ltd. 7,115 4,649 3,050 466
HI Network Inc. 6,842 3,144 14,088 2,469
(*) Although the closing dates of the fiscal year of HMC Investment Securities Co., Ltd. and HK Mutual Savings Bank are March,
31 and June, 30, respectively, the financial statements, used for applying the equity method, are prepared for the same
reporting periods as the Company‟s.

- 15 -
Condensed financial information of the joint ventures and associates as of and for the nine months ended
September 30, 2011 is as follows:
Name of company
Assets
Liabilities
Sales
Net income
(loss)
(In millions of Korean Won)
BHMC ₩ 6,106,873 ₩ 3,226,303 ₩ 9,028,132 ₩ 885,562
HMGC 500,178 263,770 1,665,905 111,083
WAE 823,074 464,677 690,359 33,563
BMT 371,227 113,202 252,437 23,507
HPMA 340,215 254,863 552,540 4,641
PTS 170,640 92,598 - -
IWA 165,546 146,693 132,313 9,612
HISNA 24,818 15,420 66,989 1,466
GEA 17,250 10,199 5,377 60
HCGG 3,529 179 476 103
HMD 318,326 239,304 1,186,419 11,077
KMMG 2,521,509 1,764,523 4,179,093 173,474
Kia Motors Corporation 29,796,705 16,580,507 32,228,331 2,728,884
Hyundai engineering & construction
Co., Ltd. 11,515,317 7,263,108 8,117,242 548,763
Hyundai HYSCO Co., Ltd. 4,453,169 2,873,760 5,985,933 237,846
Hyundai WIA Corporation 4,090,685 2,650,017 4,643,516 176,254
Hyundai Powertech Co., Ltd. 1,924,238 1,225,315 2,068,301 85,482
HMC Investment Securities Co., Ltd.(*) 4,085,453 3,449,491 480,955 26,661
Hyundai Dymos Inc. 947,740 543,332 1,060,465 44,332
Hyundai Commercial Inc. 3,324,537 3,092,282 241,678 60,145
Eukor Car Carriers Inc. 2,634,369 1,770,933 1,827,576 179,905
Hyundai Autoever Corp. 332,926 183,611 491,431 24,946
HK Mutual Savings Bank(*) 2,600,383 2,430,544 275,790 16,706
The Korea Economic Daily Co., Ltd. 191,914 55,345 88,477 1,166
Iljin Bearing Co., Ltd. 148,601 38,010 164,478 8,710
Hyundai M & Soft Co., Ltd. 84,293 24,362 61,693 9,239
HMC Win Win Fund 55,495 - 1,583 1,102
Daesung Automotive Co., Ltd. 93,047 16,896 40,510 4,365
Korea Credit Bureau Co., Ltd. 48,960 7,651 28,847 5,856
Seoul Line 9 Operation Co., Ltd. 13,873 7,749 41,714 4,624
Clair Pixel Co., Ltd. 6,218 3,028 - -
HI Network Inc. 6,649 2,817 15,774 2,132
Hyundai KEFICO Corporation 798,526 460,722 917,196 41,386
(*) Although the closing dates of the fiscal year of HMC Investment Securities Co., Ltd. and HK Mutual Savings Bank are March,
31 and June, 30, respectively, the financial statements, used for applying the equity method, are prepared for the same
reporting periods as the Company‟s.
(4) The market price of listed equity securities as of September 30, 2012 is as follows:
Name of company Price per share Number of shares Market price
(In millions of Korean Won, except price per share)
Kia Motors Corporation ₩ 69,400 137,318,251 ₩ 9,529,887
Hyundai engineering & construction
Co., Ltd. 67,500 23,327,400 1,574,600
Hyundai WIA Corporation 187,500 6,893,596 1,292,549
Hyundai HYSCO Co., Ltd. 47,200 23,554,188 1,111,758
HMC Investment Securities Co., Ltd. 15,100 7,705,980 116,360

- 16 -
12. FINANCIAL SERVICES RECEIVABLES:
(1) Financial services receivables as of September 30, 2012 and December 31, 2011 consist of the following:
Description
September 30,
2012
December 31,
2011
(In millions of Korean Won)
Loans ₩ 27,367,881 ₩ 26,478,053
Card receivables 9,282,754 9,394,236
Financial lease receivables 2,822,864 2,307,352
Other lease receivables 6,347 4,656
39,479,846 38,184,297
Allowance of doubtful accounts (727,484) (729,047)
Loan origination fee (264,581) (333,573)
Present value discount accounts (8,634) (11,548)
₩ 38,479,147 ₩ 37,110,129
(2) Aging analysis of financial services receivables
As of September 30, 2012 and December 31, 2011, total financial services receivables that are past due but not
impaired are ₩1,230,219 million and ₩1,098,415 million, respectively; of which financial services receivables
that are past due less than 90 days but not impaired are ₩1,230,219 million and ₩1,098,415 million,
respectively. As of September 30, 2012 and December 31, 2011, the impaired financial services receivables are
₩540,534 million and ₩347,906 million, respectively.
(3) The changes in allowance for doubtful accounts of financial services receivables for the three and nine months
ended September 30, 2012 and 2011 are as follows:
2012 2011
Description
Three months
ended
September 30,
Nine months
ended
September 30,
Three months
ended
September 30,
Nine months
ended
September 30,
(In millions of Korean Won)
Beginning of the period ₩ 710,538 ₩ 729,047 ₩ 657,177 ₩ 615,599
Impairment loss 111,585 334,032 120,360 331,528
Write-off (83,349) (281,717) (93,847) (215,314)
Effect of foreign exchange differences (5,893) (6,012) 17,932 8,123
Transfer and other (17,117) (59,586) (8,346) (46,660)
Changes in scope of consolidation 11,720 11,720 - -
End of the period ₩ 727,484 ₩ 727,484 ₩ 693,276 ₩ 693,276
(4) Gross investments in financial lease and its present value of minimum lease receipts as of September 30,
2012 and December 31, 2011 are as follows:
September 30, 2012 December 31, 2011
Description
Gross
investments
in financial
lease
Present value
of minimum
lease receipts
Gross
investments
in financial
lease
Present value
of minimum
lease receipts
(In millions of Korean Won)
Within 1 year ₩ 1,363,637 ₩ 1,074,604 ₩ 986,287 ₩ 810,018
Within 5 years more than 1 year 1,805,964 1,748,162 1,617,005 1,482,345
More than 5 years 99 98 77 76
₩ 3,169,700 ₩ 2,822,864 ₩ 2,603,369 ₩ 2,292,439
- 17 -
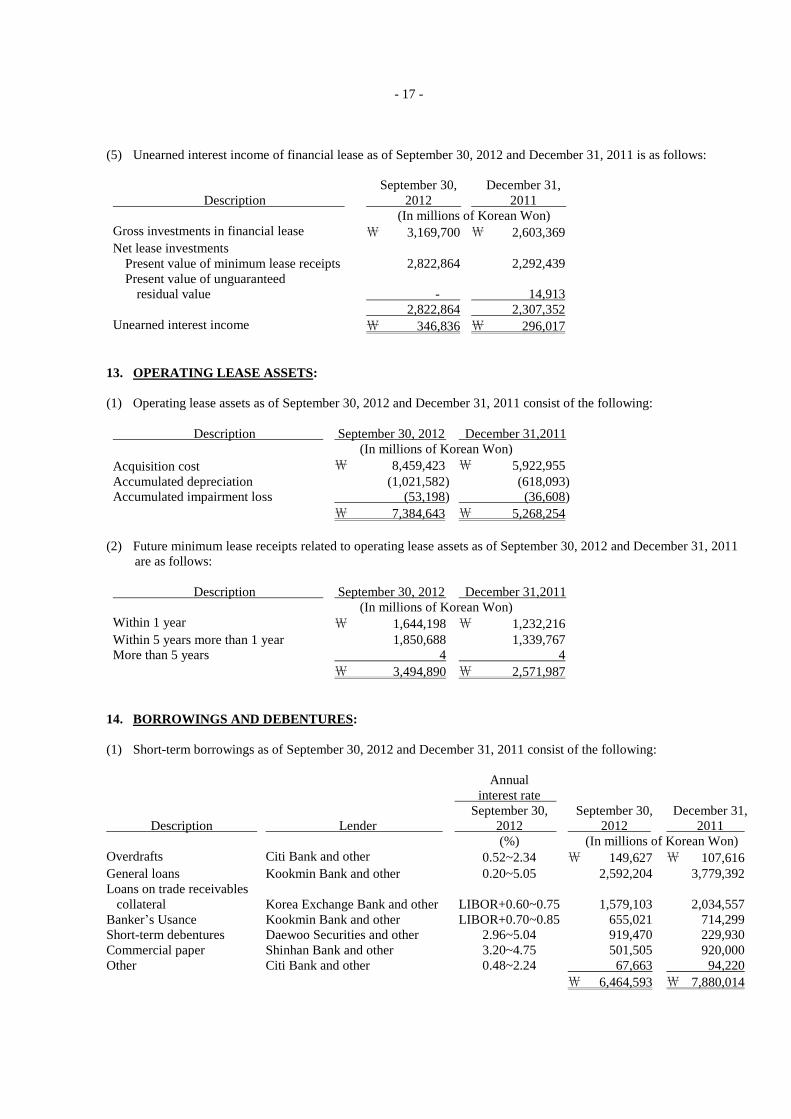
(5) Unearned interest income of financial lease as of September 30, 2012 and December 31, 2011 is as follows:
Description
September 30,
2012
December 31,
2011
(In millions of Korean Won)
Gross investments in financial lease ₩ 3,169,700 ₩ 2,603,369
Net lease investments
Present value of minimum lease receipts 2,822,864 2,292,439
Present value of unguaranteed
residual value
-
14,913
2,822,864 2,307,352
Unearned interest income ₩ 346,836 ₩ 296,017
13. OPERATING LEASE ASSETS:
(1) Operating lease assets as of September 30, 2012 and December 31, 2011 consist of the following:
Description September 30, 2012 December 31,2011
(In millions of Korean Won)
Acquisition cost ₩ 8,459,423 ₩ 5,922,955
Accumulated depreciation (1,021,582) (618,093)
Accumulated impairment loss (53,198) (36,608)
₩ 7,384,643 ₩ 5,268,254
(2) Future minimum lease receipts related to operating lease assets as of September 30, 2012 and December 31, 2011
are as follows:
Description September 30, 2012 December 31,2011
(In millions of Korean Won)
Within 1 year ₩ 1,644,198 ₩ 1,232,216
Within 5 years more than 1 year 1,850,688 1,339,767
More than 5 years 4 4
₩ 3,494,890 ₩ 2,571,987
14. BORROWINGS AND DEBENTURES:
(1) Short-term borrowings as of September 30, 2012 and December 31, 2011 consist of the following:
Annual
interest rate
Description Lender
September 30,
2012
September 30,
2012
December 31,
2011
(%) (In millions of Korean Won)
Overdrafts Citi Bank and other 0.52~2.34 ₩ 149,627 ₩ 107,616
General loans Kookmin Bank and other 0.20~5.05 2,592,204 3,779,392
Loans on trade receivables
collateral
Korea Exchange Bank and other
LIBOR+0.60~0.75 1,579,103 2,034,557
Banker‟s Usance Kookmin Bank and other LIBOR+0.70~0.85 655,021 714,299
Short-term debentures Daewoo Securities and other 2.96~5.04 919,470 229,930
Commercial paper Shinhan Bank and other 3.20~4.75 501,505 920,000
Other Citi Bank and other 0.48~2.24 67,663 94,220
₩ 6,464,593 ₩ 7,880,014
- 18 -
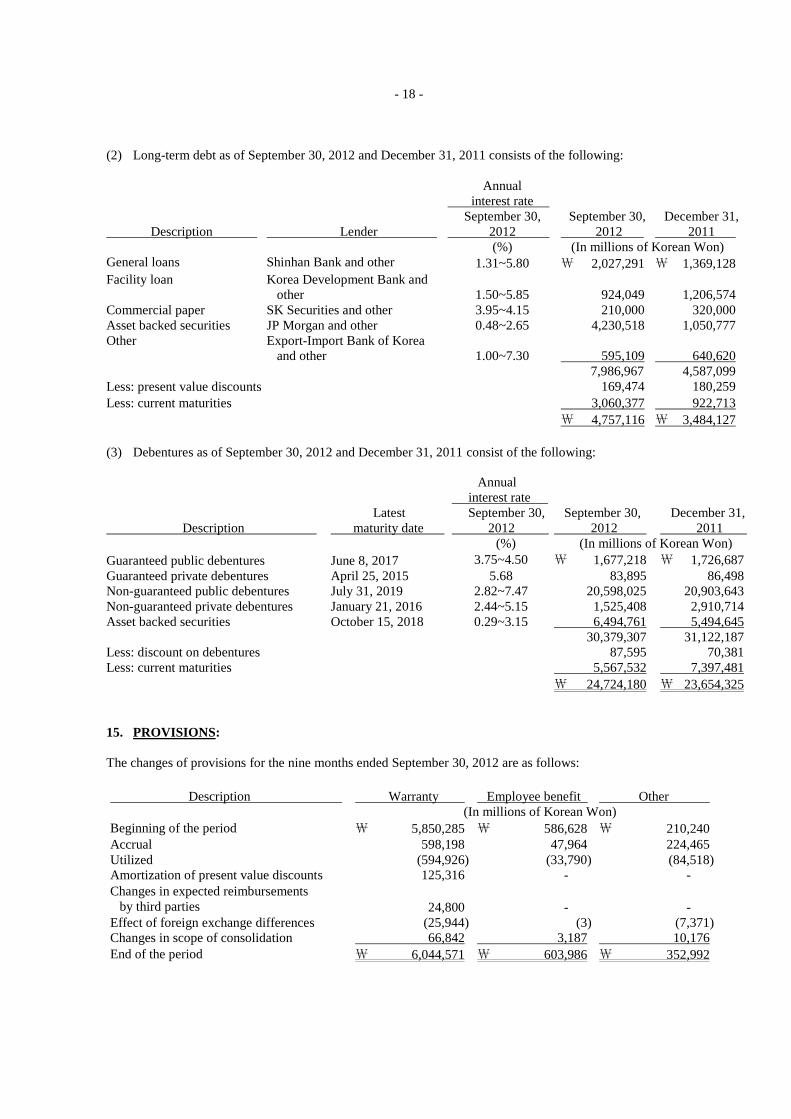
(2) Long-term debt as of September 30, 2012 and December 31, 2011 consists of the following:
Annual
interest rate
Description
Lender
September 30,
2012
September 30,
2012
December 31,
2011
(%) (In millions of Korean Won)
General loans Shinhan Bank and other 1.31~5.80 ₩ 2,027,291 ₩ 1,369,128
Facility loan Korea Development Bank and
other 1.50~5.85 924,049 1,206,574
Commercial paper SK Securities and other 3.95~4.15 210,000 320,000
Asset backed securities JP Morgan and other 0.48~2.65 4,230,518 1,050,777
Other Export-Import Bank of Korea
and other 1.00~7.30 595,109 640,620
7,986,967 4,587,099
Less: present value discounts 169,474 180,259
Less: current maturities 3,060,377 922,713
₩ 4,757,116 ₩ 3,484,127
(3) Debentures as of September 30, 2012 and December 31, 2011 consist of the following:
Annual
interest rate
Description
Latest
maturity date
September 30,
2012
September 30,
2012
December 31,
2011
(%) (In millions of Korean Won)
Guaranteed public debentures June 8, 2017 3.75~4.50 ₩ 1,677,218 ₩ 1,726,687
Guaranteed private debentures April 25, 2015 5.68 83,895 86,498
Non-guaranteed public debentures July 31, 2019 2.82~7.47 20,598,025 20,903,643
Non-guaranteed private debentures January 21, 2016 2.44~5.15 1,525,408 2,910,714
Asset backed securities October 15, 2018 0.29~3.15 6,494,761 5,494,645
30,379,307 31,122,187
Less: discount on debentures 87,595 70,381
Less: current maturities 5,567,532 7,397,481
₩ 24,724,180 ₩ 23,654,325
15. PROVISIONS:
The changes of provisions for the nine months ended September 30, 2012 are as follows:
Description Warranty Employee benefit Other
(In millions of Korean Won)
Beginning of the period ₩ 5,850,285 ₩ 586,628 ₩ 210,240
Accrual 598,198 47,964 224,465
Utilized (594,926) (33,790) (84,518)
Amortization of present value discounts 125,316 - -
Changes in expected reimbursements
by third parties 24,800 - -
Effect of foreign exchange differences differences (25,944) (3) (7,371) Changes in scope of consolidation differences 66,842 3,187 10,176
End of the period ₩ 6,044,571 ₩ 603,986 ₩ 352,992

- 19 -
The changes of provisions for the nine months ended September 30, 2011 are as follows:
Description Warranty Employee benefit Other
(In millions of Korean Won)
Beginning of the period ₩ 5,252,340 ₩ 431,518 ₩ 301,720
Accrual 880,052 41,109 79,052
Utilized (500,738) (41,877) (138,443)
Amortization of present value discounts 123,164 - -
Changes in expected reimbursements
by third parties 27,146 - -
Effect of foreign exchange differences 29,372 386 (724)
End of the period ₩ 5,811,336 ₩ 431,136 ₩ 241,605
16. OTHER FINANCIAL LIABILITIES: Other financial liabilities as of September 30, 2012 and December 31, 2011 consist of the following:
September 30, 2012 December 31, 2011
Description Current Non-current Current Non-current
(In millions of Korean Won)
Financial liabilities at fair value
through profit or loss(*) ₩ 201,793 ₩ 9,542 ₩ 426,897 ₩ 16,004
D Derivative liabilities that are effective
hedging instruments 21,129 96,861 20,482 43,058
Financial lease liabilities 8,530 23,178 8,535 31,390
Other 109,745 - - 109,745
₩ 341,197 ₩ 129,581 ₩ 455,914 ₩ 200,197
(*) As of September 30, 2012 and December 31, 2011, debentures designated as financial liabilities at fair value through
profit or loss (“FVTPL”) of ₩201,793 million and ₩404,666 million, respectively, are included.
17. OTHER LIABILITIES: Other liabilities as of September 30, 2012 and December 31, 2011 consist of the following: September 30, 2012 December 31, 2011
Description Current Non-current Current Non-current
(In millions of Korean Won)
Advance received ₩ 486,834 ₩ 48,944 ₩ 482,899 ₩ 84,173
Withholdings 1,484,359 588,991 963,451 626,011
Accrued expenses 1,906,230 - 1,102,940 -
Unearned income 434,144 343,414 374,175 299,210
Accrued dividends 76 - 77 -
Due to customers for contract work 280,576 - 467,868 -
Other 74,040 522,129 85,206 527,609
₩ 4,666,259 ₩ 1,503,478 ₩ 3,476,616 ₩ 1,537,003

- 20 -
18. FINANCIAL INSTRUMENTS:
(1) Categories of financial assets as of September 30, 2012 consist of the following:
Description
Financial
assets
at FVTPL
Loans
and
receivables
AFS
financial
assets
HTM
financial
assets
Derivatives
designated as
hedging
instruments Book value Fair value
(In millions of Korean Won)
Cash and
cash equivalents ₩ - ₩ 7,471,674 ₩ - ₩ - ₩ - ₩ 7,471,674 ₩ 7,471,674
Short-term and long-
term financial
instruments - 11,389,057 - - - 11,389,057 11,389,057
Trade notes and
accounts receivable - 3,692,340 - - - 3,692,340 3,692,340
Other receivables - 2,915,968 - - - 2,915,968 2,915,968
Other financial assets 124,970 25,028 1,630,859 62 97,226 1,878,145 1,878,145
Other assets - 361,862 - - - 361,862 361,862
Financial services
receivables - 38,479,147 - - - 38,479,147 38,977,037
₩ 124,970 ₩ 64,335,076 ₩ 1,630,859 ₩ 62 ₩ 97,226 ₩ 66,188,193 ₩ 66,686,083
Categories of financial assets as of December 31, 2011 consist of the following:
Description
Financial assets
at FVTPL
Loans
and receivables
AFS
financial assets
Derivatives
designated as
hedging instruments Book value Fair value
(In millions of Korean Won)
Cash and
cash equivalents ₩ - ₩ 6,231,946 ₩ - ₩ - ₩ 6,231,946 ₩ 6,231,946
Short-term and long-
term financial
instruments - 9,394,115 - - 9,394,115 9,394,115
Trade notes and
accounts receivable - 3,922,360 - - 3,922,360 3,922,360
Other receivables - 2,465,426 - - 2,465,426 2,465,426
Other financial assets 91,093 19,769 1,665,592 477,933 2,254,387 2,254,387
Other assets - 310,286 - - 310,286 310,286
Financial services
receivables - 37,110,129 - - 37,110,129 37,859,530
₩ 91,093 ₩ 59,454,031 ₩ 1,665,592 ₩ 477,933 ₩ 61,688,649 ₩ 62,438,050
(2) Categories of financial liabilities as of September 30, 2012 consist of the following:
Description
Financial liabilities
at FVTPL
Financial liabilities
carried at
amortized cost
Derivatives
designated as
hedging instruments Book value Fair value
(In millions of Korean Won)
Trade notes and
accounts payable ₩ - ₩ 6,599,115 ₩ - ₩ 6,599,115 ₩ 6,599,115
Other payables - 3,497,550 - 3,497,550 3,497,550
Borrowings and
debentures - 44,573,798 - 44,573,798 45,514,313
Other financial liabilities 211,335 141,453 117,990 470,778 470,778
Other liabilities - 1,906,306 - 1,906,306 1,906,306
₩ 211,335 ₩ 56,718,222 ₩ 117,990 ₩ 57,047,547 ₩ 57,988,062
- 21 -
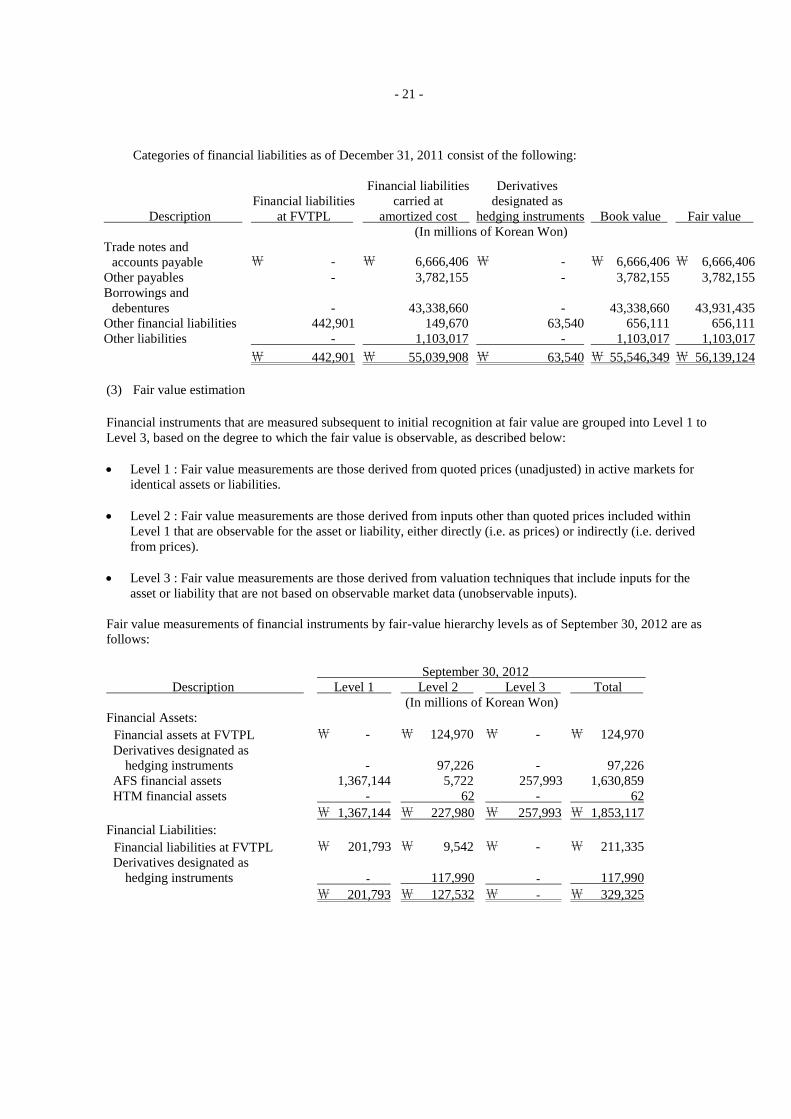
Categories of financial liabilities as of December 31, 2011 consist of the following:
Description
Financial liabilities
at FVTPL
Financial liabilities
carried at
amortized cost
Derivatives
designated as
hedging instruments Book value Fair value
(In millions of Korean Won)
Trade notes and
accounts payable ₩ - ₩ 6,666,406 ₩ - ₩ 6,666,406 ₩ 6,666,406
Other payables - 3,782,155 - 3,782,155 3,782,155
Borrowings and
debentures - 43,338,660 - 43,338,660 43,931,435
Other financial liabilities 442,901 149,670 63,540 656,111 656,111
Other liabilities - 1,103,017 - 1,103,017 1,103,017
₩ 442,901 ₩ 55,039,908 ₩ 63,540 ₩ 55,546,349 ₩ 56,139,124
(3) Fair value estimation
Financial instruments that are measured subsequent to initial recognition at fair value are grouped into Level 1 to
Level 3, based on the degree to which the fair value is observable, as described below:
Level 1 : Fair value measurements are those derived from quoted prices (unadjusted) in active markets for
identical assets or liabilities.
Level 2 : Fair value measurements are those derived from inputs other than quoted prices included within
Level 1 that are observable for the asset or liability, either directly (i.e. as prices) or indirectly (i.e. derived
from prices).
Level 3 : Fair value measurements are those derived from valuation techniques that include inputs for the
asset or liability that are not based on observable market data (unobservable inputs).
Fair value measurements of financial instruments by fair-value hierarchy levels as of September 30, 2012 are as
follows:
September 30, 2012
Description Level 1 Level 2 Level 3 Total
(In millions of Korean Won)
Financial Assets:
Financial assets at FVTPL ₩ - ₩ 124,970 ₩ - ₩ 124,970
Derivatives designated as
hedging instruments - 97,226 - 97,226
AFS financial assets 1,367,144 5,722 257,993 1,630,859
HTM financial assets - 62 - 62
₩ 1,367,144 ₩ 227,980 ₩ 257,993 ₩ 1,853,117
Financial Liabilities:
Financial liabilities at FVTPL ₩ 201,793 ₩ 9,542 ₩ - ₩ 211,335
Derivatives designated as
hedging instruments - 117,990 - 117,990
₩ 201,793 ₩ 127,532 ₩ - ₩ 329,325
- 22 -
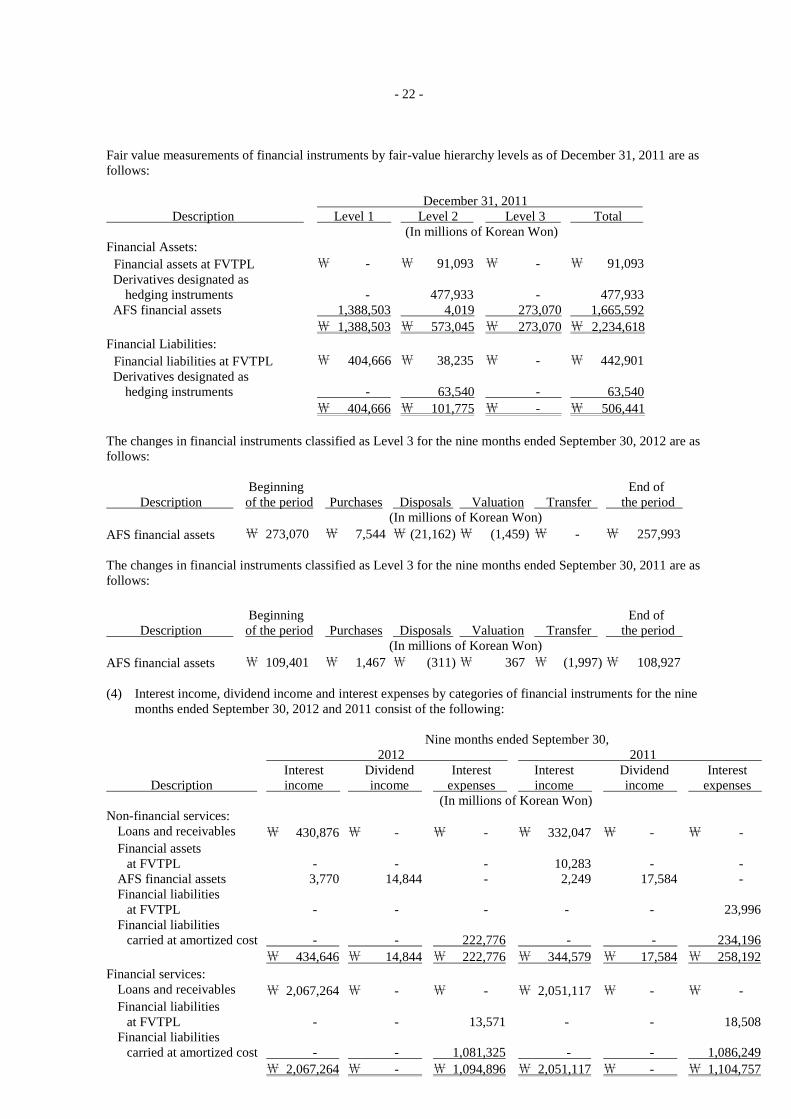
Fair value measurements of financial instruments by fair-value hierarchy levels as of December 31, 2011 are as
follows:
December 31, 2011
Description Level 1 Level 2 Level 3 Total
(In millions of Korean Won)
Financial Assets:
Financial assets at FVTPL ₩ - ₩ 91,093 ₩ - ₩ 91,093
Derivatives designated as
hedging instruments - 477,933 - 477,933
AFS financial assets 1,388,503 4,019 273,070 1,665,592
₩ 1,388,503 ₩ 573,045 ₩ 273,070 ₩ 2,234,618
Financial Liabilities:
Financial liabilities at FVTPL ₩ 404,666 ₩ 38,235 ₩ - ₩ 442,901
Derivatives designated as
hedging instruments - 63,540 - 63,540
₩ 404,666 ₩ 101,775 ₩ - ₩ 506,441
The changes in financial instruments classified as Level 3 for the nine months ended September 30, 2012 are as
follows:
Description
Beginning
of the period
Purchases
Disposals Valuation Transfer
End of
the period
(In millions of Korean Won)
AFS financial assets ₩ 273,070 ₩ 7,544 ₩ (21,162) ₩ (1,459) ₩ - ₩ 257,993
The changes in financial instruments classified as Level 3 for the nine months ended September 30, 2011 are as
follows:
Description
Beginning
of the period
Purchases
Disposals Valuation Transfer
End of
the period
(In millions of Korean Won)
AFS financial assets ₩ 109,401 ₩ 1,467 ₩ (311) ₩ 367 ₩ (1,997) ₩ 108,927
(4) Interest income, dividend income and interest expenses by categories of financial instruments for the nine
months ended September 30, 2012 and 2011 consist of the following:
Nine months ended September 30,
2012 2011
Description
Interest
income
Dividend
income
Interest
expenses
Interest
income
Dividend
income
Interest
expenses
(In millions of Korean Won)
Non-financial services:
Loans and receivables ₩ 430,876 ₩ - ₩ - ₩ 332,047 ₩ - ₩ -
Financial assets
at FVTPL - - - 10,283 - -
AFS financial assets 3,770 14,844 - 2,249 17,584 -
Financial liabilities
at FVTPL - - - - - 23,996
Financial liabilities
carried at amortized cost - - 222,776 - - 234,196
₩ 434,646 ₩ 14,844 ₩ 222,776 ₩ 344,579 ₩ 17,584 ₩ 258,192
Financial services:
Loans and receivables ₩ 2,067,264 ₩ - ₩ - ₩ 2,051,117 ₩ - ₩ -
Financial liabilities
at FVTPL - - 13,571 - - 18,508
Financial liabilities
carried at amortized cost - - 1,081,325 - - 1,086,249
₩ 2,067,264 ₩ - ₩ 1,094,896 ₩ 2,051,117 ₩ - ₩ 1,104,757
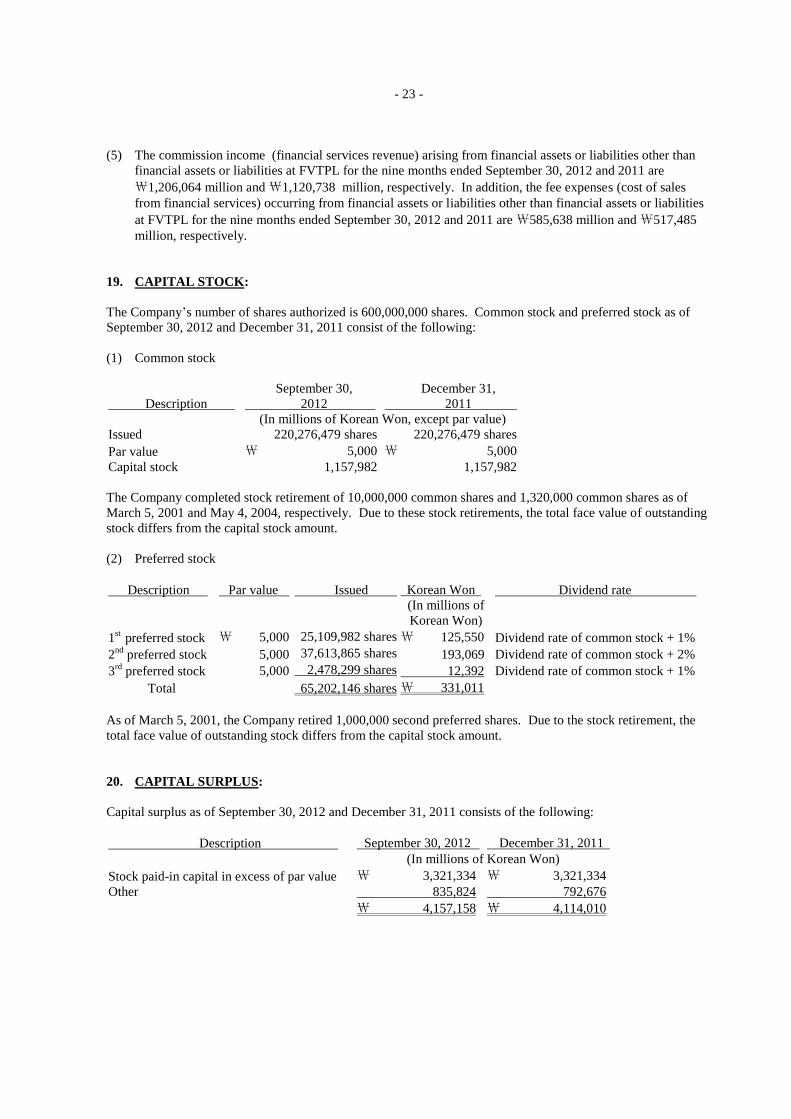
- 23 -
(5) The commission income (financial services revenue) arising from financial assets or liabilities other than
financial assets or liabilities at FVTPL for the nine months ended September 30, 2012 and 2011 are
₩1,206,064 million and ₩1,120,738 million, respectively. In addition, the fee expenses (cost of sales
from financial services) occurring from financial assets or liabilities other than financial assets or liabilities
at FVTPL for the nine months ended September 30, 2012 and 2011 are ₩585,638 million and ₩517,485
million, respectively.
19. CAPITAL STOCK:
The Company‟s number of shares authorized is 600,000,000 shares. Common stock and preferred stock as of
September 30, 2012 and December 31, 2011 consist of the following:
(1) Common stock
Description
September 30,
2012
December 31,
2011
(In millions of Korean Won, except par value)
Issued 220,276,479 shares 220,276,479 shares
Par value ₩ 5,000 ₩ 5,000
Capital stock 1,157,982 1,157,982
The Company completed stock retirement of 10,000,000 common shares and 1,320,000 common shares as of
March 5, 2001 and May 4, 2004, respectively. Due to these stock retirements, the total face value of outstanding
stock differs from the capital stock amount.
(2) Preferred stock
Description Par value Issued Korean Won Dividend rate
(In millions of
Korean Won)
1st
preferred stock ₩ 5,000 25,109,982 shares ₩ 125,550 Dividend rate of common stock + 1%
2nd
preferred stock 5,000 37,613,865 shares 193,069 Dividend rate of common stock + 2%
3rd
preferred stock 5,000 2,478,299 shares 12,392 Dividend rate of common stock + 1%
Total 65,202,146 shares ₩ 331,011
As of March 5, 2001, the Company retired 1,000,000 second preferred shares. Due to the stock retirement, the
total face value of outstanding stock differs from the capital stock amount.
20. CAPITAL SURPLUS:
Capital surplus as of September 30, 2012 and December 31, 2011 consists of the following:
Description September 30, 2012 December 31, 2011
(In millions of Korean Won)
Stock paid-in capital in excess of par value ₩ 3,321,334 ₩ 3,321,334
Other 835,824 792,676
₩ 4,157,158 ₩ 4,114,010
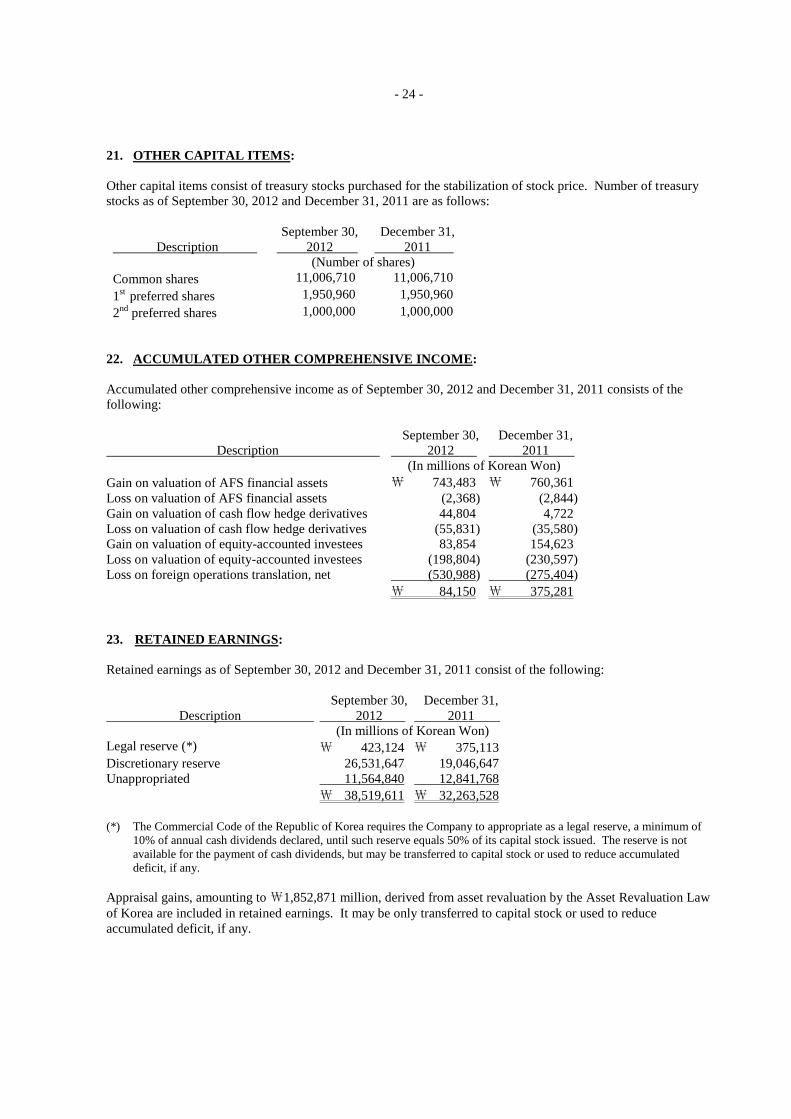
- 24 -
21. OTHER CAPITAL ITEMS:
Other capital items consist of treasury stocks purchased for the stabilization of stock price. Number of treasury
stocks as of September 30, 2012 and December 31, 2011 are as follows:
Description
September 30,
2012
December 31,
2011
(Number of shares)
Common shares 11,006,710 11,006,710
1st
preferred shares 1,950,960 1,950,960
2nd
preferred shares 1,000,000 1,000,000
22. ACCUMULATED OTHER COMPREHENSIVE INCOME:
Accumulated other comprehensive income as of September 30, 2012 and December 31, 2011 consists of the
following:
Description
September 30,
2012
December 31,
2011
(In millions of Korean Won)
Gain on valuation of AFS financial assets ₩ 743,483 ₩ 760,361
Loss on valuation of AFS financial assets (2,368) (2,844)
Gain on valuation of cash flow hedge derivatives 44,804 4,722
Loss on valuation of cash flow hedge derivatives (55,831) (35,580)
Gain on valuation of equity-accounted investees 83,854 154,623
Loss on valuation of equity-accounted investees (198,804) (230,597)
Loss on foreign operations translation, net (530,988) (275,404)
₩ 84,150 ₩ 375,281
23. RETAINED EARNINGS:
Retained earnings as of September 30, 2012 and December 31, 2011 consist of the following:
Description
September 30,
2012
December 31,
2011
(In millions of Korean Won)
Legal reserve (*) ₩ 423,124 ₩ 375,113
Discretionary reserve 26,531,647 19,046,647
Unappropriated 11,564,840 12,841,768
₩ 38,519,611 ₩ 32,263,528
(*) The Commercial Code of the Republic of Korea requires the Company to appropriate as a legal reserve, a minimum of
10% of annual cash dividends declared, until such reserve equals 50% of its capital stock issued. The reserve is not
available for the payment of cash dividends, but may be transferred to capital stock or used to reduce accumulated
deficit, if any.
Appraisal gains, amounting to ₩1,852,871 million, derived from asset revaluation by the Asset Revaluation Law
of Korea are included in retained earnings. It may be only transferred to capital stock or used to reduce
accumulated deficit, if any.
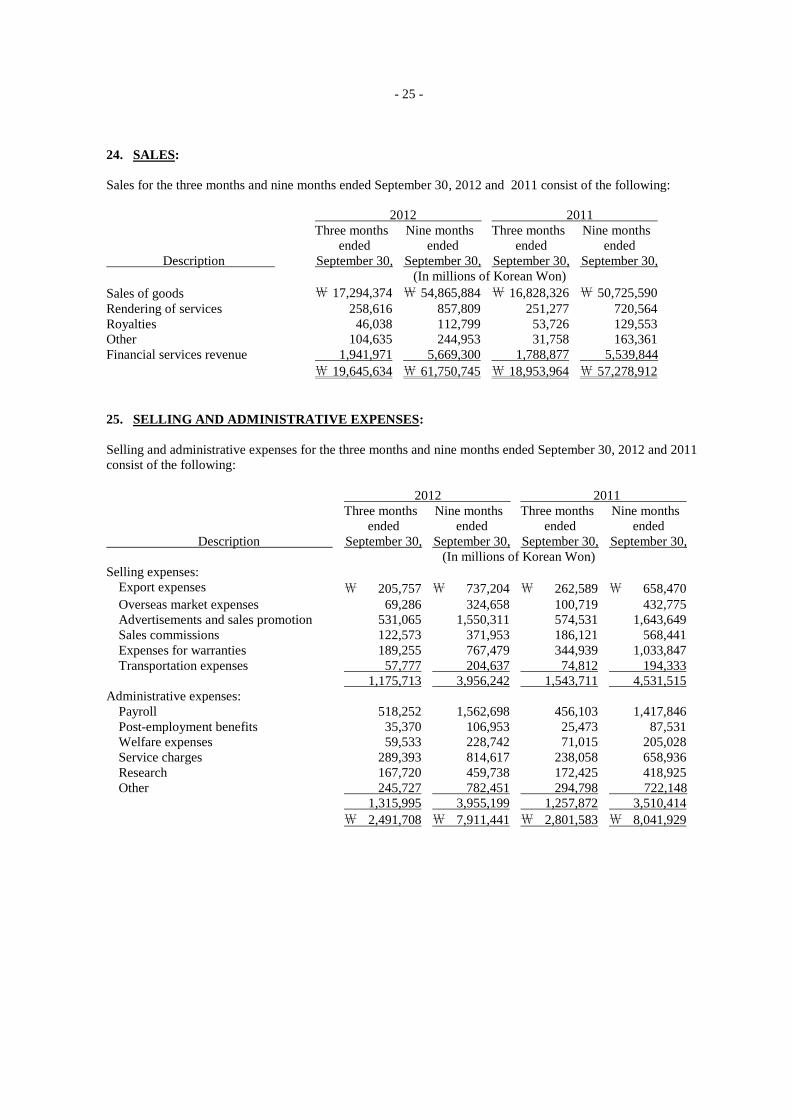
- 25 -
24. SALES:
Sales for the three months and nine months ended September 30, 2012 and 2011 consist of the following: 2012 2011
Description
Three months
ended
September 30,
Nine months
ended
September 30,
Three months
ended
September 30,
Nine months
ended
September 30,
(In millions of Korean Won)
Sales of goods ₩ 17,294,374 ₩ 54,865,884 ₩ 16,828,326 ₩ 50,725,590
Rendering of services 258,616 857,809 251,277 720,564
Royalties 46,038 112,799 53,726 129,553
Other 104,635 244,953 31,758 163,361
Financial services revenue 1,941,971 5,669,300 1,788,877 5,539,844
₩ 19,645,634 ₩ 61,750,745 ₩ 18,953,964 ₩ 57,278,912
25. SELLING AND ADMINISTRATIVE EXPENSES:
Selling and administrative expenses for the three months and nine months ended September 30, 2012 and 2011
consist of the following:
2012 2011
Description
Three months
ended
September 30,
Nine months
ended
September 30,
Three months
ended
September 30,
Nine months
ended
September 30,
(In millions of Korean Won)
Selling expenses:
Export expenses ₩ 205,757 ₩ 737,204 ₩ 262,589 ₩ 658,470
Overseas market expenses 69,286 324,658 100,719 432,775
Advertisements and sales promotion 531,065 1,550,311 574,531 1,643,649
Sales commissions 122,573 371,953 186,121 568,441
Expenses for warranties 189,255 767,479 344,939 1,033,847
Transportation expenses 57,777 204,637 74,812 194,333
1,175,713 3,956,242 1,543,711 4,531,515
Administrative expenses:
Payroll 518,252 1,562,698 456,103 1,417,846
Post-employment benefits 35,370 106,953 25,473 87,531
Welfare expenses 59,533 228,742 71,015 205,028
Service charges 289,393 814,617 238,058 658,936
Research 167,720 459,738 172,425 418,925
Other 245,727 782,451 294,798 722,148
1,315,995 3,955,199 1,257,872 3,510,414
₩ 2,491,708 ₩ 7,911,441 ₩ 2,801,583 ₩ 8,041,929
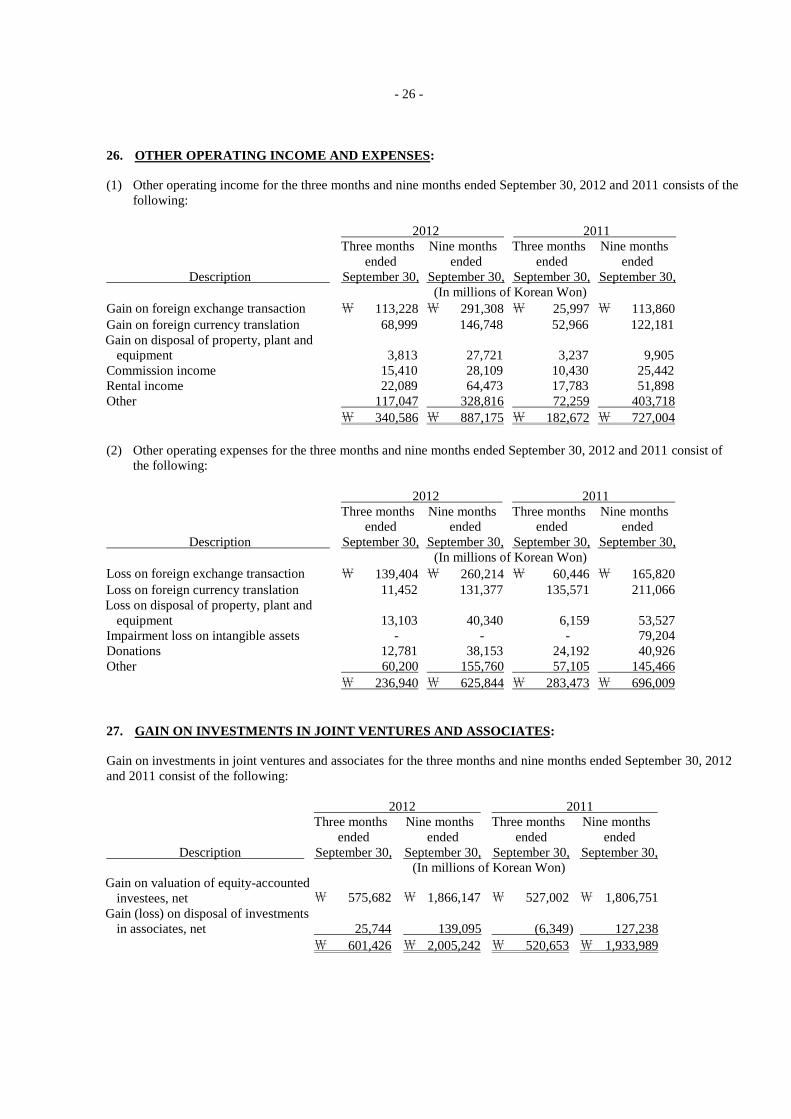
- 26 -
26. OTHER OPERATING INCOME AND EXPENSES: (1) Other operating income for the three months and nine months ended September 30, 2012 and 2011 consists of the
following:
2012 2011
Description
Three months
ended
September 30,
Nine months
ended
September 30,
Three months
ended
September 30,
Nine months
ended
September 30,
(In millions of Korean Won)
Gain on foreign exchange transaction ₩ 113,228 ₩ 291,308 ₩ 25,997 ₩ 113,860
Gain on foreign currency translation 68,999 146,748 52,966 122,181
Gain on disposal of property, plant and
equipment 3,813 27,721
3,237
9,905
Commission income 15,410 28,109 10,430 25,442
Rental income 22,089 64,473 17,783 51,898
Other 117,047 328,816 72,259 403,718
₩ 340,586 ₩ 887,175 ₩ 182,672 ₩ 727,004
(2) Other operating expenses for the three months and nine months ended September 30, 2012 and 2011 consist of
the following:
2012 2011
Description
Three months
ended
September 30,
Nine months
ended
September 30,
Three months
ended
September 30,
Nine months
ended
September 30,
(In millions of Korean Won)
Loss on foreign exchange transaction ₩ 139,404 ₩ 260,214 ₩ 60,446 ₩ 165,820
Loss on foreign currency translation 11,452 131,377 135,571 211,066
Loss on disposal of property, plant and
equipment 13,103 40,340
6,159
53,527
Impairment loss on intangible assets - - - 79,204
Donations 12,781 38,153 24,192 40,926
Other 60,200 155,760 57,105 145,466
₩ 236,940 ₩ 625,844 ₩ 283,473 ₩ 696,009
27. GAIN ON INVESTMENTS IN JOINT VENTURES AND ASSOCIATES: Gain on investments in joint ventures and associates for the three months and nine months ended September 30, 2012
and 2011 consist of the following:
2012 2011
Description
Three months
ended
September 30,
Nine months
ended
September 30,
Three months
ended
September 30,
Nine months
ended
September 30,
(In millions of Korean Won)
Gain on valuation of equity-accounted
investees, net ₩ 575,682 ₩ 1,866,147 ₩ 527,002 ₩ 1,806,751
Gain (loss) on disposal of investments
in associates, net 25,744 139,095 (6,349) 127,238
₩ 601,426 ₩ 2,005,242 ₩ 520,653 ₩ 1,933,989
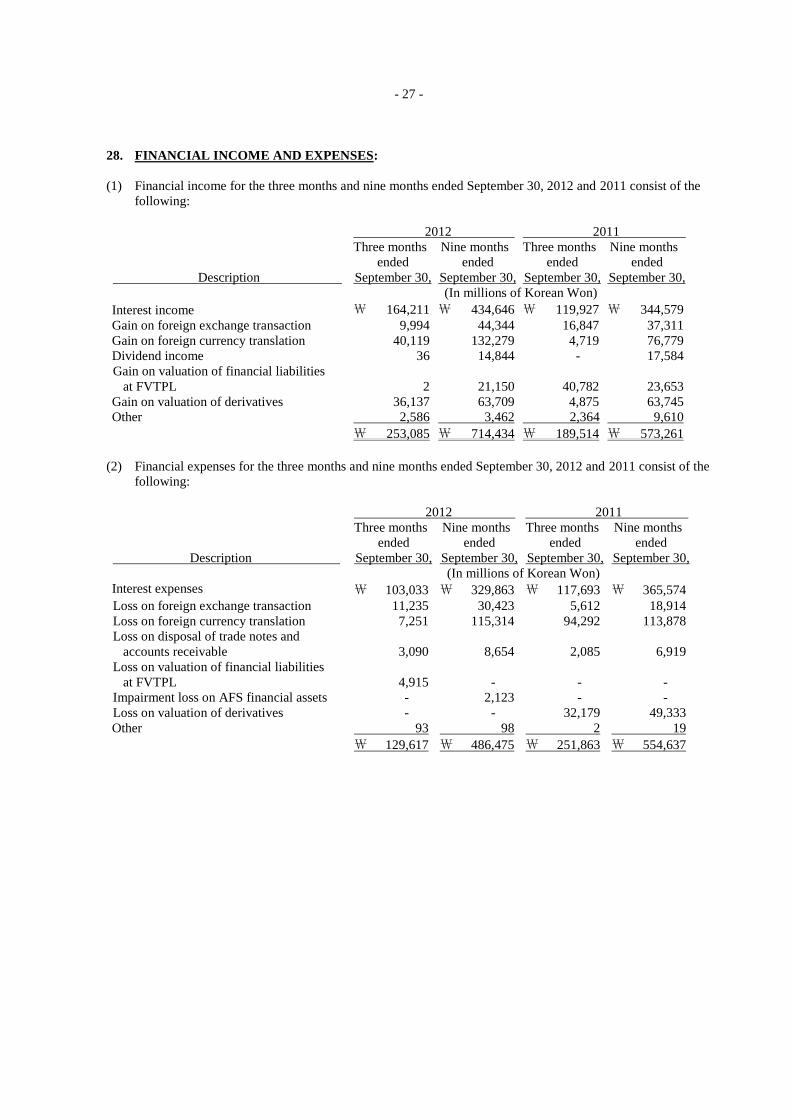
- 27 -
28. FINANCIAL INCOME AND EXPENSES:
(1) Financial income for the three months and nine months ended September 30, 2012 and 2011 consist of the
following:
2012 2011
Description
Three months
ended
September 30,
Nine months
ended
September 30,
Three months
ended
September 30,
Nine months
ended
September 30,
(In millions of Korean Won)
Interest income ₩ 164,211 ₩ 434,646 ₩ 119,927 ₩ 344,579
Gain on foreign exchange transaction 9,994 44,344 16,847 37,311
Gain on foreign currency translation 40,119 132,279 4,719 76,779
Dividend income 36 14,844 - 17,584
Gain on valuation of financial liabilities
at FVTPL 2 21,150 40,782 23,653
Gain on valuation of derivatives 36,137 63,709 4,875 63,745
Other 2,586 3,462 2,364 9,610
₩ 253,085 ₩ 714,434 ₩ 189,514 ₩ 573,261
(2) Financial expenses for the three months and nine months ended September 30, 2012 and 2011 consist of the
following:
2012 2011
Description
Three months
ended
September 30,
Nine months
ended
September 30,
Three months
ended
September 30,
Nine months
ended
September 30,
(In millions of Korean Won)
Interest expenses ₩ 103,033 ₩ 329,863 ₩ 117,693 ₩ 365,574
Loss on foreign exchange transaction 11,235 30,423 5,612 18,914
Loss on foreign currency translation 7,251 115,314 94,292 113,878
Loss on disposal of trade notes and
accounts receivable 3,090 8,654 2,085 6,919
Loss on valuation of financial liabilities
at FVTPL 4,915 - - -
Impairment loss on AFS financial assets - 2,123 - -
Loss on valuation of derivatives - - 32,179 49,333
Other 93 98 2 19
₩ 129,617 ₩ 486,475 ₩ 251,863 ₩ 554,637
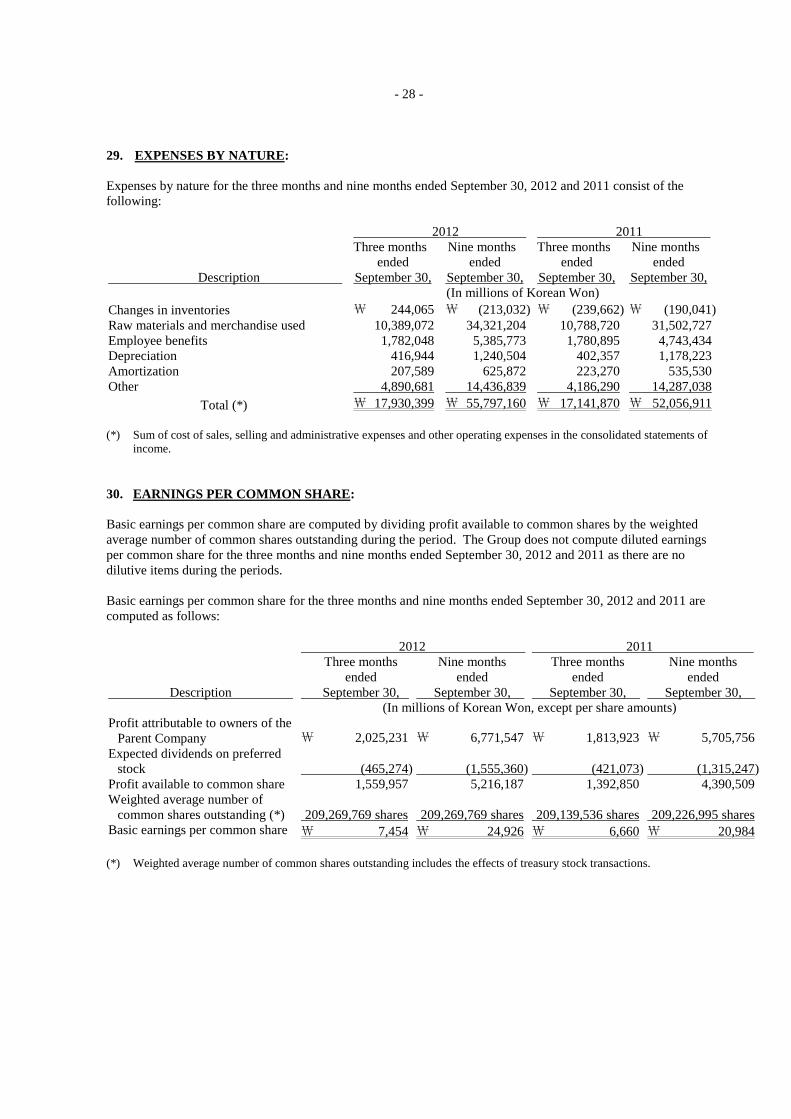
- 28 -
29. EXPENSES BY NATURE:
Expenses by nature for the three months and nine months ended September 30, 2012 and 2011 consist of the
following:
2012 2011
Description
Three months
ended
September 30,
Nine months
ended
September 30,
Three months
ended
September 30,
Nine months
ended
September 30,
(In millions of Korean Won)
Changes in inventories ₩ 244,065 ₩ (213,032) ₩ (239,662) ₩ (190,041)
Raw materials and merchandise used 10,389,072 34,321,204 10,788,720 31,502,727
Employee benefits 1,782,048 5,385,773 1,780,895 4,743,434
Depreciation 416,944 1,240,504 402,357 1,178,223
Amortization 207,589 625,872 223,270 535,530
Other 4,890,681 14,436,839 4,186,290 14,287,038
Total (*) ₩ 17,930,399 ₩ 55,797,160 ₩ 17,141,870 ₩ 52,056,911
(*) Sum of cost of sales, selling and administrative expenses and other operating expenses in the consolidated statements of
income.
30. EARNINGS PER COMMON SHARE:
Basic earnings per common share are computed by dividing profit available to common shares by the weighted
average number of common shares outstanding during the period. The Group does not compute diluted earnings
per common share for the three months and nine months ended September 30, 2012 and 2011 as there are no
dilutive items during the periods.
Basic earnings per common share for the three months and nine months ended September 30, 2012 and 2011 are
computed as follows:
2012 2011
Description
Three months
ended
September 30,
Nine months
ended
September 30,
Three months
ended
September 30,
Nine months
ended
September 30, (In millions of Korean Won, except per share amounts)
Profit attributable to owners of the
Parent Company ₩ 2,025,231 ₩ 6,771,547 ₩ 1,813,923 ₩ 5,705,756
Expected dividends on preferred
stock (465,274) (1,555,360) (421,073) (1,315,247)
Profit available to common share 1,559,957 5,216,187 1,392,850 4,390,509
Weighted average number of
common shares outstanding (*) 209,269,769 shares 209,269,769 shares 209,139,536 shares 209,226,995 shares
Basic earnings per common share ₩ 7,454 ₩ 24,926 ₩ 6,660 ₩ 20,984
(*) Weighted average number of common shares outstanding includes the effects of treasury stock transactions.
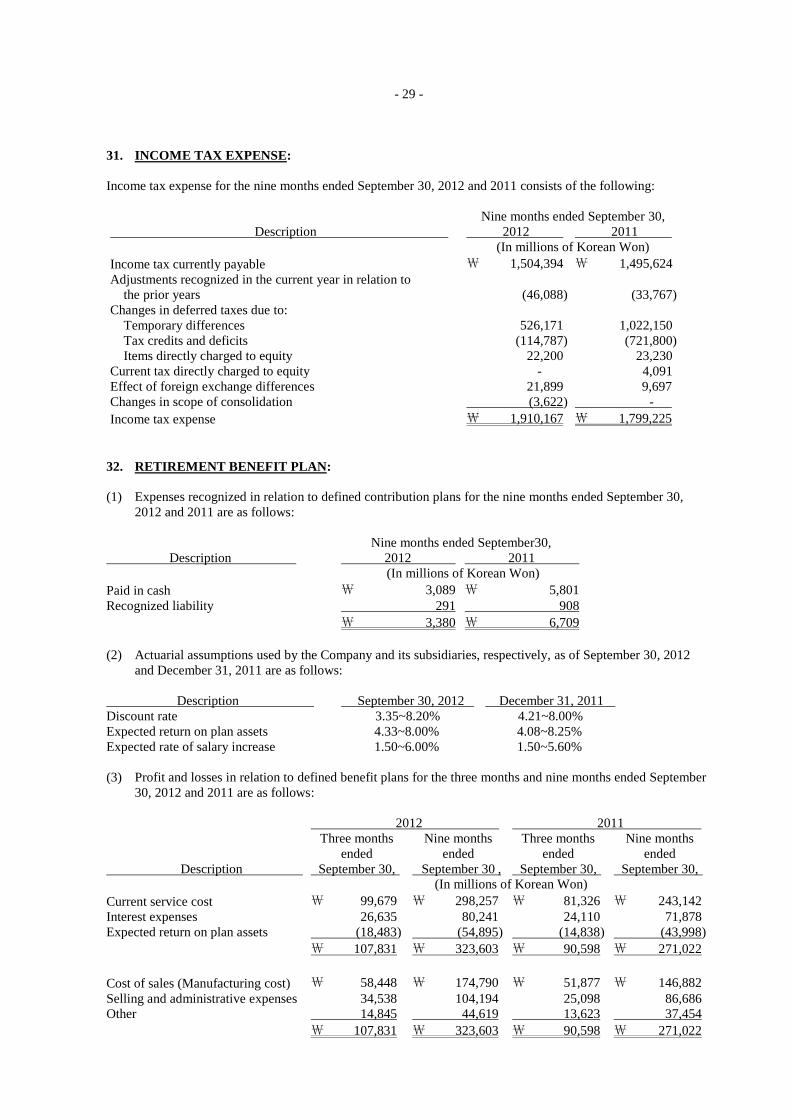
- 29 -
31. INCOME TAX EXPENSE:
Income tax expense for the nine months ended September 30, 2012 and 2011 consists of the following:
Nine months ended September 30,
Description 2012 2011
(In millions of Korean Won)
Income tax currently payable ₩ 1,504,394 ₩ 1,495,624
Adjustments recognized in the current year in relation to
the prior years (46,088) (33,767)
Changes in deferred taxes due to:
Temporary differences 526,171 1,022,150
Tax credits and deficits (114,787) (721,800)
Items directly charged to equity 22,200 23,230
Current tax directly charged to equity - 4,091
Effect of foreign exchange differences 21,899 9,697
Changes in scope of consolidation (3,622) -
Income tax expense ₩ 1,910,167 ₩ 1,799,225
32. RETIREMENT BENEFIT PLAN:
(1) Expenses recognized in relation to defined contribution plans for the nine months ended September 30,
2012 and 2011 are as follows:
Nine months ended September30,
Description 2012 2011
(In millions of Korean Won)
Paid in cash ₩ 3,089 ₩ 5,801
Recognized liability 291 908
₩ 3,380 ₩ 6,709
(2) Actuarial assumptions used by the Company and its subsidiaries, respectively, as of September 30, 2012
and December 31, 2011 are as follows:
Description September 30, 2012 December 31, 2011
Discount rate 3.35~8.20% 4.21~8.00%
Expected return on plan assets 4.33~8.00% 4.08~8.25%
Expected rate of salary increase 1.50~6.00% 1.50~5.60%
(3) Profit and losses in relation to defined benefit plans for the three months and nine months ended September
30, 2012 and 2011 are as follows:
2012 2011
Description
Three months
ended
September 30,
Nine months
ended
September 30 ,
Three months
ended
September 30,
Nine months
ended
September 30,
(In millions of Korean Won)
Current service cost ₩ 99,679 ₩ 298,257 ₩ 81,326 ₩ 243,142
Interest expenses 26,635 80,241 24,110 71,878
Expected return on plan assets (18,483) (54,895) (14,838) (43,998)
₩ 107,831 ₩ 323,603 ₩ 90,598 ₩ 271,022
Cost of sales (Manufacturing cost) ₩ 58,448 ₩ 174,790 ₩ 51,877 ₩ 146,882
Selling and administrative expenses 34,538 104,194 25,098 86,686
Other 14,845 44,619 13,623 37,454
₩ 107,831 ₩ 323,603 ₩ 90,598 ₩ 271,022

- 30 -
(4) The amounts recognized in the consolidated statements of financial position related to defined benefit plans
as of September 30, 2012 and December 31, 2011 consist of the following:
Description September 30, 2012 December 31, 2011
(In millions of Korean Won)
Present value of defined benefit obligation ₩ 2,575,911 ₩ 2,249,240
Fair value of plan assets (1,703,879) (1,600,601)
Defined benefit obligation ₩ 872,032 ₩ 648,639
(5) Changes in present value of the defined benefit obligation for the nine months ended September 30, 2012
and 2011 are as follows:
Nine months ended September 30,
Description 2012 2011
(In millions of Korean Won)
Beginning of the period ₩ 2,249,240 ₩ 1,808,027
Current service cost 298,257 243,142
Interest expenses 80,241 71,878
Transfer in (out) 533 4,490
Actuarial loss 16,828 23,419
Benefits paid (96,488) (248,397)
Changes in scope of consolidation 28,402 -
Effect of foreign exchange differences and other (1,102) 13,718
End of the period ₩ 2,575,911 ₩ 1,916,277
(6) Changes in fair value of the plan assets for the nine months ended September 30, 2012 and 2011 are as
follows:
Nine months ended September 30,
Description 2012 2011
(In millions of Korean Won)
Beginning of the period ₩ 1,600,601 ₩ 1,318,430
Expected return on plan assets 54,895 43,998
Actuarial gain (loss) 8,738 (9,727)
Transfer in (out) (129) 1,376
Contributions from plan participants 81,126 82,301
Benefits paid (54,156) (118,753)
Changes in scope of consolidation 16,945 -
Effect of foreign exchange differences and other (4,141) 5,002
End of the period ₩ 1,703,879 ₩ 1,322,627
The actual returns on plan assets for the nine months ended September 30, 2012 and 2011 are ₩68,432 million
and ₩46,949 million, respectively.
(7) Fair value of the plan assets as of September 30, 2012 and December 31, 2011 consist of the following:
Description September 30, 2012 December 31, 2011
(In millions of Korean Won)
Insurance instruments ₩ 1,511,939 ₩ 1,428,546
Debt instruments 33,437 29,346
Other 158,503 142,709
₩ 1,703,879 ₩ 1,600,601
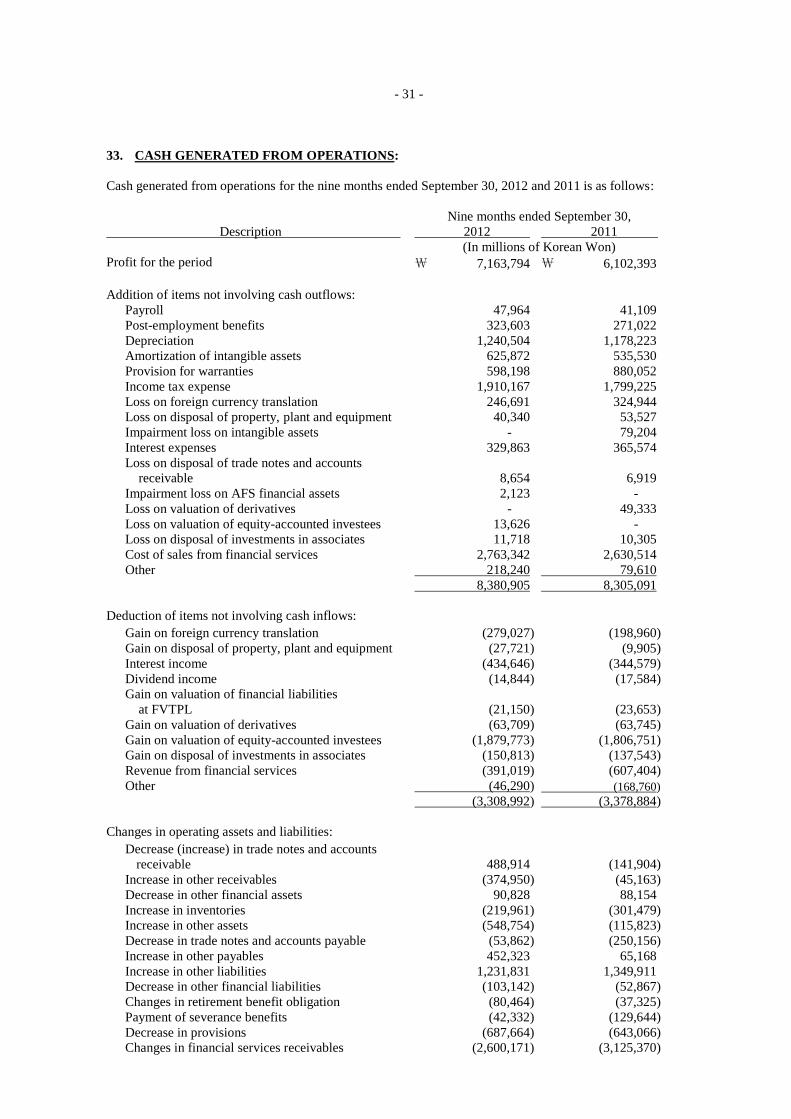
- 31 -
33. CASH GENERATED FROM OPERATIONS:
Cash generated from operations for the nine months ended September 30, 2012 and 2011 is as follows:
Nine months ended September 30,
Description 2012 2011
(In millions of Korean Won)
Profit for the period ₩ 7,163,794 ₩ 6,102,393
Addition of items not involving cash outflows:
Payroll 47,964 41,109
Post-employment benefits 323,603 271,022
Depreciation 1,240,504 1,178,223
Amortization of intangible assets 625,872 535,530
Provision for warranties 598,198 880,052
Income tax expense 1,910,167 1,799,225
Loss on foreign currency translation 246,691 324,944
Loss on disposal of property, plant and equipment 40,340 53,527
Impairment loss on intangible assets - 79,204
Interest expenses 329,863 365,574
Loss on disposal of trade notes and accounts
receivable 8,654 6,919
Impairment loss on AFS financial assets 2,123 -
Loss on valuation of derivatives - 49,333
Loss on valuation of equity-accounted investees 13,626 -
Loss on disposal of investments in associates 11,718 10,305
Cost of sales from financial services 2,763,342 2,630,514
Other 218,240 79,610
8,380,905 8,305,091
Deduction of items not involving cash inflows: Gain on foreign currency translation (279,027) (198,960)
Gain on disposal of property, plant and equipment (27,721) (9,905)
Interest income (434,646) (344,579)
Dividend income (14,844) (17,584)
Gain on valuation of financial liabilities
at FVTPL (21,150) (23,653)
Gain on valuation of derivatives (63,709) (63,745)
Gain on valuation of equity-accounted investees (1,879,773) (1,806,751)
Gain on disposal of investments in associates (150,813) (137,543)
Revenue from financial services (391,019) (607,404)
Other (46,290) (168,760)
(3,308,992) (3,378,884)
Changes in operating assets and liabilities: Decrease (increase) in trade notes and accounts
receivable 488,914 (141,904)
Increase in other receivables (374,950) (45,163)
Decrease in other financial assets 90,828 88,154
Increase in inventories (219,961) (301,479)
Increase in other assets (548,754) (115,823)
Decrease in trade notes and accounts payable (53,862) (250,156)
Increase in other payables 452,323 65,168
Increase in other liabilities 1,231,831 1,349,911
Decrease in other financial liabilities (103,142) (52,867)
Changes in retirement benefit obligation (80,464) (37,325)
Payment of severance benefits (42,332) (129,644)
Decrease in provisions (687,664) (643,066)
Changes in financial services receivables (2,600,171) (3,125,370)
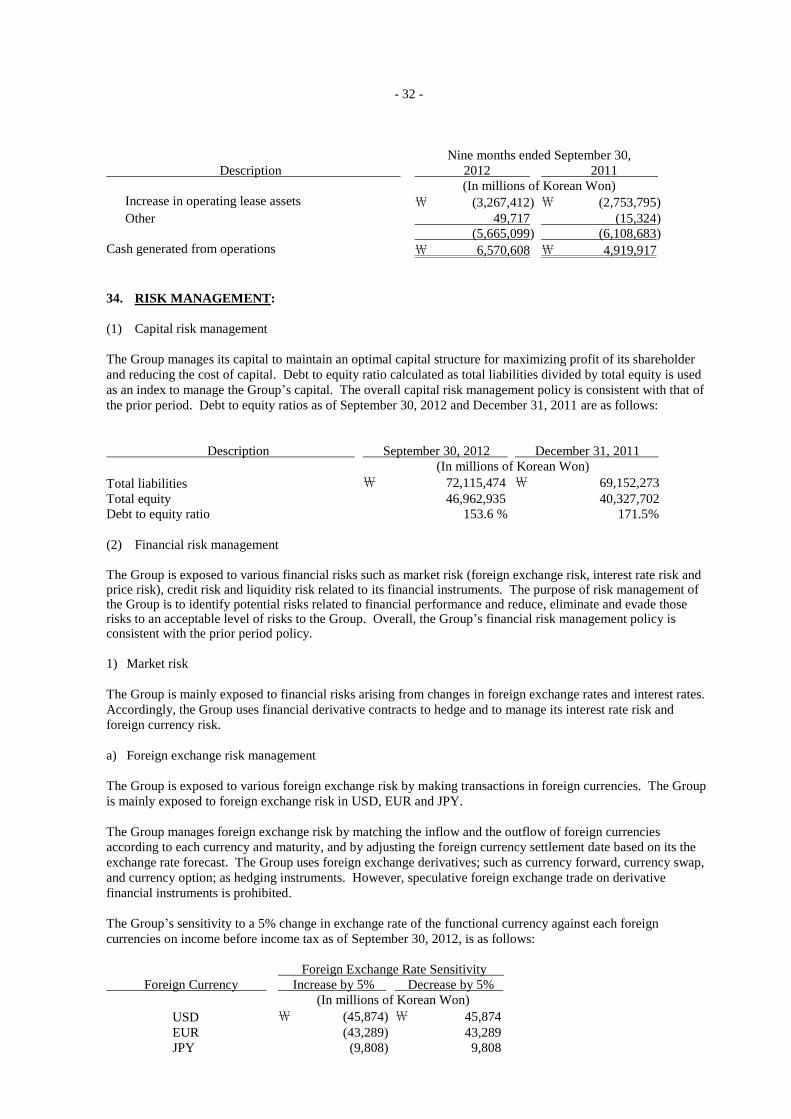
- 32 -
Nine months ended September 30,
Description 2012 2011
(In millions of Korean Won)
Increase in operating lease assets ₩ (3,267,412) ₩ (2,753,795)
Other 49,717 (15,324)
(5,665,099) (6,108,683)
Cash generated from operations ₩ 6,570,608 ₩ 4,919,917
34. RISK MANAGEMENT:
(1) Capital risk management
The Group manages its capital to maintain an optimal capital structure for maximizing profit of its shareholder
and reducing the cost of capital. Debt to equity ratio calculated as total liabilities divided by total equity is used
as an index to manage the Group‟s capital. The overall capital risk management policy is consistent with that of
the prior period. Debt to equity ratios as of September 30, 2012 and December 31, 2011 are as follows:
Description September 30, 2012 December 31, 2011
(In millions of Korean Won)
Total liabilities ₩ 72,115,474 ₩ 69,152,273
Total equity 46,962,935 40,327,702
Debt to equity ratio 153.6 % 171.5%
(2) Financial risk management
The Group is exposed to various financial risks such as market risk (foreign exchange risk, interest rate risk and price risk), credit risk and liquidity risk related to its financial instruments. The purpose of risk management of the Group is to identify potential risks related to financial performance and reduce, eliminate and evade those risks to an acceptable level of risks to the Group. Overall, the Group‟s financial risk management policy is consistent with the prior period policy.
1) Market risk
The Group is mainly exposed to financial risks arising from changes in foreign exchange rates and interest rates.
Accordingly, the Group uses financial derivative contracts to hedge and to manage its interest rate risk and
foreign currency risk.
a) Foreign exchange risk management
The Group is exposed to various foreign exchange risk by making transactions in foreign currencies. The Group
is mainly exposed to foreign exchange risk in USD, EUR and JPY.
The Group manages foreign exchange risk by matching the inflow and the outflow of foreign currencies
according to each currency and maturity, and by adjusting the foreign currency settlement date based on its the
exchange rate forecast. The Group uses foreign exchange derivatives; such as currency forward, currency swap,
and currency option; as hedging instruments. However, speculative foreign exchange trade on derivative
financial instruments is prohibited.
The Group‟s sensitivity to a 5% change in exchange rate of the functional currency against each foreign
currencies on income before income tax as of September 30, 2012, is as follows:
Foreign Exchange Rate Sensitivity
Foreign Currency Increase by 5% Decrease by 5%
(In millions of Korean Won)
USD ₩ (45,874) ₩ 45,874
EUR (43,289) 43,289
JPY (9,808) 9,808
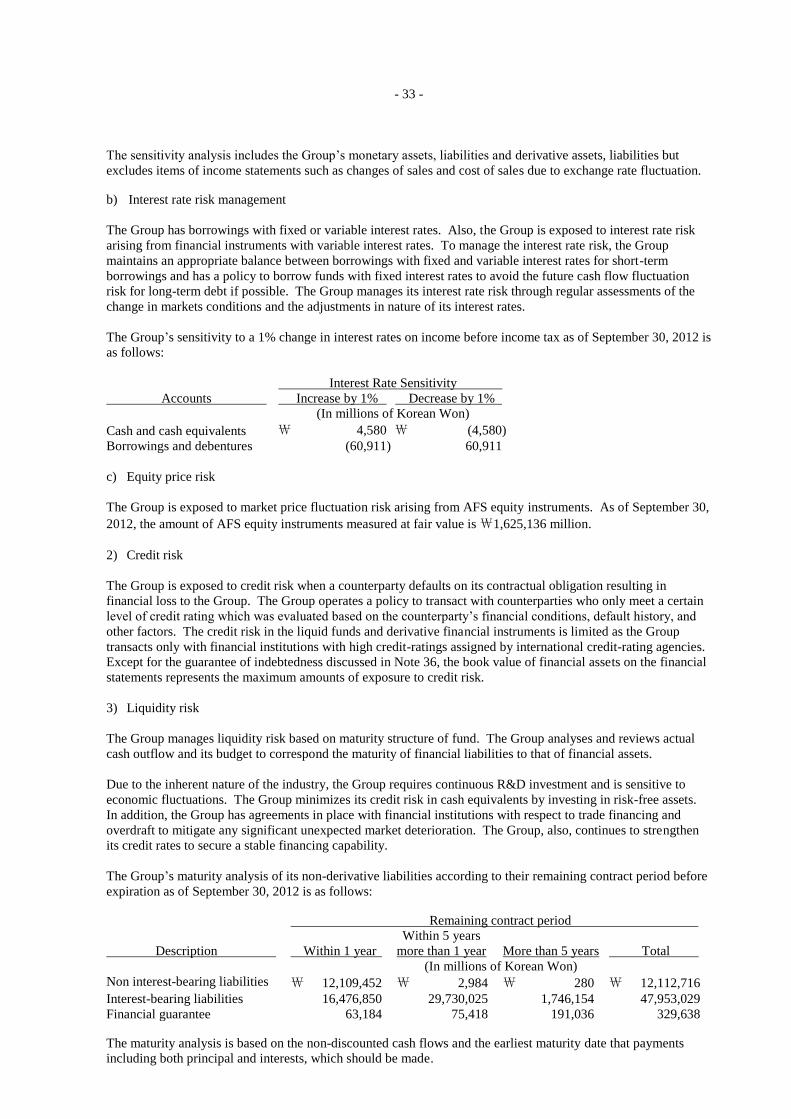
- 33 -
The sensitivity analysis includes the Group‟s monetary assets, liabilities and derivative assets, liabilities but
excludes items of income statements such as changes of sales and cost of sales due to exchange rate fluctuation.
b) Interest rate risk management
The Group has borrowings with fixed or variable interest rates. Also, the Group is exposed to interest rate risk
arising from financial instruments with variable interest rates. To manage the interest rate risk, the Group
maintains an appropriate balance between borrowings with fixed and variable interest rates for short-term
borrowings and has a policy to borrow funds with fixed interest rates to avoid the future cash flow fluctuation
risk for long-term debt if possible. The Group manages its interest rate risk through regular assessments of the
change in markets conditions and the adjustments in nature of its interest rates.
The Group‟s sensitivity to a 1% change in interest rates on income before income tax as of September 30, 2012 is
as follows:
Interest Rate Sensitivity
Accounts Increase by 1% Decrease by 1%
(In millions of Korean Won)
Cash and cash equivalents ₩ 4,580 ₩ (4,580)
Borrowings and debentures (60,911) 60,911
c) Equity price risk
The Group is exposed to market price fluctuation risk arising from AFS equity instruments. As of September 30,
2012, the amount of AFS equity instruments measured at fair value is ₩1,625,136 million.
2) Credit risk
The Group is exposed to credit risk when a counterparty defaults on its contractual obligation resulting in
financial loss to the Group. The Group operates a policy to transact with counterparties who only meet a certain
level of credit rating which was evaluated based on the counterparty‟s financial conditions, default history, and
other factors. The credit risk in the liquid funds and derivative financial instruments is limited as the Group
transacts only with financial institutions with high credit-ratings assigned by international credit-rating agencies.
Except for the guarantee of indebtedness discussed in Note 36, the book value of financial assets on the financial
statements represents the maximum amounts of exposure to credit risk.
3) Liquidity risk
The Group manages liquidity risk based on maturity structure of fund. The Group analyses and reviews actual
cash outflow and its budget to correspond the maturity of financial liabilities to that of financial assets.
Due to the inherent nature of the industry, the Group requires continuous R&D investment and is sensitive to
economic fluctuations. The Group minimizes its credit risk in cash equivalents by investing in risk-free assets.
In addition, the Group has agreements in place with financial institutions with respect to trade financing and
overdraft to mitigate any significant unexpected market deterioration. The Group, also, continues to strengthen
its credit rates to secure a stable financing capability.
The Group‟s maturity analysis of its non-derivative liabilities according to their remaining contract period before
expiration as of September 30, 2012 is as follows:
Remaining contract period
Description Within 1 year
Within 5 years
more than 1 year More than 5 years
Total
(In millions of Korean Won)
Non interest-bearing liabilities ₩ 12,109,452 ₩ 2,984 ₩ 280 ₩ 12,112,716
Interest-bearing liabilities 16,476,850 29,730,025 1,746,154 47,953,029
Financial guarantee 63,184 75,418 191,036 329,638
The maturity analysis is based on the non-discounted cash flows and the earliest maturity date that payments
including both principal and interests, which should be made.

- 34 -
(3) Derivative instrument
The Group entered into derivative instrument contracts such as forwards, options and swaps to hedge its
exposure to changes in foreign exchange rate.
As of September 30, 2012 and December 31, 2011, the Group deferred net loss of ₩11,027 million and
₩30,858 million, respectively, as accumulated other comprehensive loss, due to its effective cash flow hedging
instruments.
The longest period in which the forecasted transactions are expected to occur is within 60 months as of
September 30, 2012.
For the nine months ended September 30, 2012 and 2011, the Group recognized net loss of ₩98,426 million and
net gain of ₩400,231 million in profit or loss(before tax), respectively, which resulted from the ineffective
portion of its cash flow hedging instruments and changes in the valuation of its other non-hedging derivative
instruments.
35. RELATED PARTY TRANSACTIONS:
The transactions and balances of receivables and payables within the Group are wholly eliminated in the
preparation of consolidated financial statements of the Group.
(1) Significant transactions for the nine months ended September 30, 2012 and 2011 between the Group and
related parties or affiliates by Monopoly Regulation And Fair Trade Act of the Republic of Korea (“Act”)
are as follows:
Nine months ended September 30,
2012 2011
Description Sales/proceeds Purchases/expense Sales/proceeds Purchases/expense
(In millions of Korean Won)
Related parties:
Entity with significant influence
over the Company ₩ 405,871 ₩ 6,483,093 ₩ 396,967 ₩ 5,681,945
Joint ventures and associates 3,164,061 6,344,769 3,358,663 6,420,095
Other related parties 13,819 971,706 10,137 787,101
Affiliates by Act: 679,256 4,358,946 439,958 2,989,398
(2) As of September 30, 2012 and December 31, 2011, significant balances related to the transactions between the
Group and related parties or affiliates by Act are as follows:
September 30, 2012 December 31, 2011
Description Receivables Payables Receivables Payables
(In millions of Korean Won)
Related parties:
Entity with significant influence
over the Company ₩ 214,385 ₩ 1,135,004 ₩ 146,745 ₩ 1,238,695
Joint ventures and associates 892,910 1,271,651 923,052 1,282,713
Other related parties 10,398 275,988 7,504 329,323
Affiliates by Act: 287,298 963,847 76,273 866,699
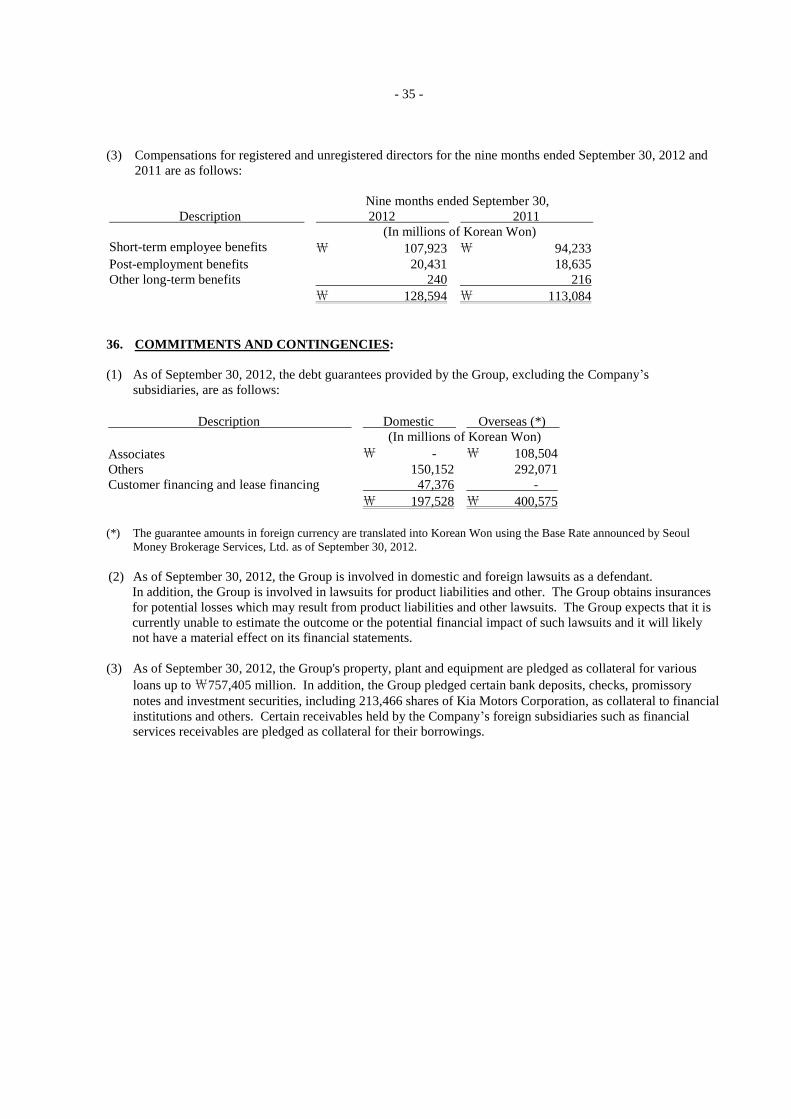
- 35 -
(3) Compensations for registered and unregistered directors for the nine months ended September 30, 2012 and
2011 are as follows:
Nine months ended September 30,
Description 2012 2011
(In millions of Korean Won)
Short-term employee benefits ₩ 107,923 ₩ 94,233
Post-employment benefits 20,431 18,635
Other long-term benefits 240 216
₩ 128,594 ₩ 113,084
36. COMMITMENTS AND CONTINGENCIES:
(1) As of September 30, 2012, the debt guarantees provided by the Group, excluding the Company‟s
subsidiaries, are as follows:
Description Domestic Overseas (*)
(In millions of Korean Won)
Associates ₩ - ₩ 108,504
Others 150,152 292,071
Customer financing and lease financing 47,376 -
₩ 197,528 ₩ 400,575
(*) The guarantee amounts in foreign currency are translated into Korean Won using the Base Rate announced by Seoul
Money Brokerage Services, Ltd. as of September 30, 2012.
(2) As of September 30, 2012, the Group is involved in domestic and foreign lawsuits as a defendant.
In addition, the Group is involved in lawsuits for product liabilities and other. The Group obtains insurances
for potential losses which may result from product liabilities and other lawsuits. The Group expects that it is
currently unable to estimate the outcome or the potential financial impact of such lawsuits and it will likely
not have a material effect on its financial statements.
(3) As of September 30, 2012, the Group's property, plant and equipment are pledged as collateral for various
loans up to ₩757,405 million. In addition, the Group pledged certain bank deposits, checks, promissory
notes and investment securities, including 213,466 shares of Kia Motors Corporation, as collateral to financial
institutions and others. Certain receivables held by the Company‟s foreign subsidiaries such as financial
services receivables are pledged as collateral for their borrowings.

- 36 -
(4) As of September 30, 2012, the Company‟s subsidiaries have been provided with payment guarantee from
other companies as follows:
Subsidiaries
Provider
Amounts of
guarantee
(In millions of Korean Won
and in thousands of
other currencies)
Hyundai Rotem Company Machinery Financial Cooperative KRW 811,599
Korea Defense Industry Association KRW 247,273
Seoul Guarantee Insurance Company KRW 307,786
Construction guarantee KRW 30,525
Woori Bank USD 32,608
˝ EUR 39,109
Export-Import Bank of Korea USD 337,578
˝ EUR 349,338
˝ INR 1,563,486
˝ SGD 6,409
˝ CNY 37,337
˝ OMR 5,311
˝ TND 2,000
Korea Exchange Bank INR 100,000
˝ USD 2,790
˝ EUR 2,189
˝ CNY 3,213
Korea Development Bank USD 26,926
Standard Chartered, Seoul Branch THB 686,000
˝ USD 182
ANZ Bank NZD 60,828
SG Bank, Seoul Branch KRW 4,995
˝ EUR 1,046
Daesung Industrial Gases KRW 57,432
Hyundai Capital Services, Inc. Hyundai WIA Corporation KRW 12
Seoul Guarantee Insurance Company KRW 152,170
Hyundai Card Co., Ltd. Seoul Guarantee Insurance Company KRW 1,243
HAOSVT Other USD 111,526
HMCI Other EUR 37,653
(5) In 2006, the Group sold 10,658,367 shares of Hyundai Rotem Company, a subsidiary of the Company, to
MSPE Metro Investment AB and entered into a shareholders‟ agreement. MSPE Metro Investment AB is
entitled to a put option to sell those shares back to the Group in certain events (as defined) in accordance
with the agreement. In relation to the agreement, the present value of exercise price of the put option is
recognized as a liability(other financial liability) by the Group.
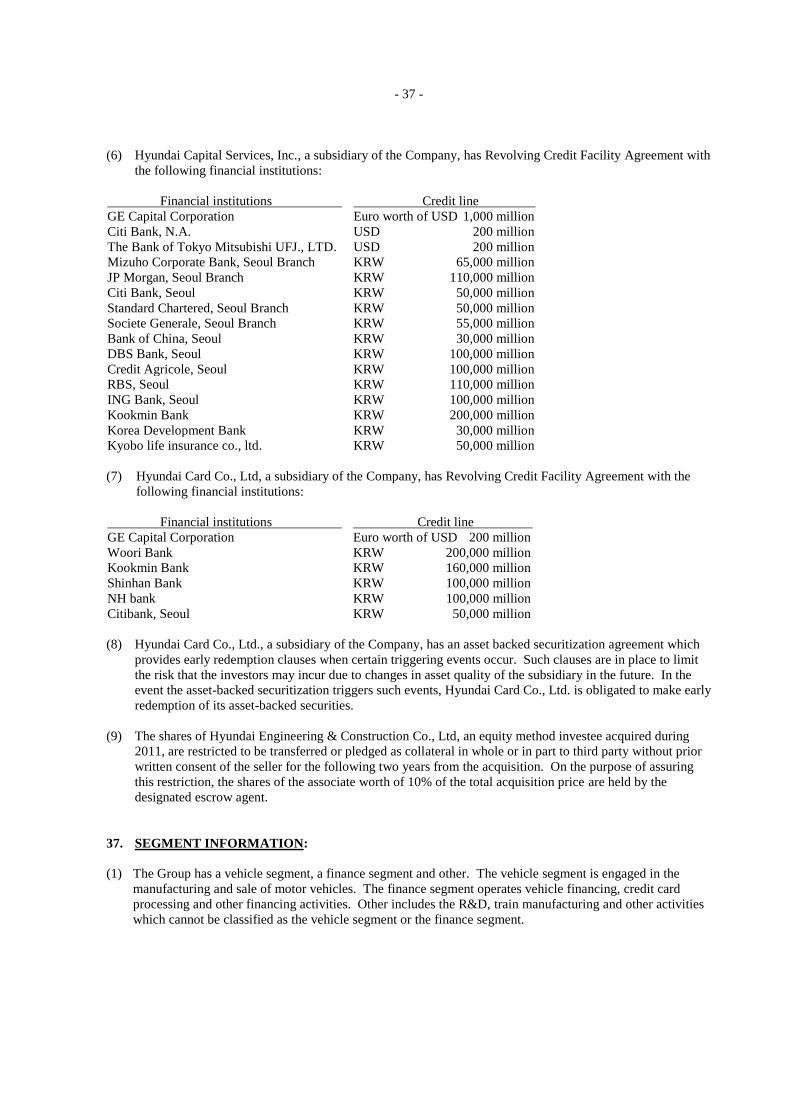
- 37 -
(6) Hyundai Capital Services, Inc., a subsidiary of the Company, has Revolving Credit Facility Agreement with
the following financial institutions:
Financial institutions Credit line
GE Capital Corporation Euro worth of USD 1,000 million
Citi Bank, N.A. USD 200 million
The Bank of Tokyo Mitsubishi UFJ., LTD. USD 200 million
Mizuho Corporate Bank, Seoul Branch KRW 65,000 million
JP Morgan, Seoul Branch KRW 110,000 million
Citi Bank, Seoul KRW 50,000 million
Standard Chartered, Seoul Branch KRW 50,000 million
Societe Generale, Seoul Branch KRW 55,000 million
Bank of China, Seoul KRW 30,000 million
DBS Bank, Seoul KRW 100,000 million
Credit Agricole, Seoul KRW 100,000 million
RBS, Seoul KRW 110,000 million
ING Bank, Seoul KRW 100,000 million
Kookmin Bank KRW 200,000 million
Korea Development Bank KRW 30,000 million
Kyobo life insurance co., ltd. KRW 50,000 million
(7) Hyundai Card Co., Ltd, a subsidiary of the Company, has Revolving Credit Facility Agreement with the
following financial institutions:
Financial institutions Credit line
GE Capital Corporation Euro worth of USD 200 million
Woori Bank KRW 200,000 million
Kookmin Bank KRW 160,000 million
Shinhan Bank KRW 100,000 million
NH bank KRW 100,000 million
Citibank, Seoul KRW 50,000 million
(8) Hyundai Card Co., Ltd., a subsidiary of the Company, has an asset backed securitization agreement which
provides early redemption clauses when certain triggering events occur. Such clauses are in place to limit
the risk that the investors may incur due to changes in asset quality of the subsidiary in the future. In the
event the asset-backed securitization triggers such events, Hyundai Card Co., Ltd. is obligated to make early
redemption of its asset-backed securities.
(9) The shares of Hyundai Engineering & Construction Co., Ltd, an equity method investee acquired during
2011, are restricted to be transferred or pledged as collateral in whole or in part to third party without prior
written consent of the seller for the following two years from the acquisition. On the purpose of assuring
this restriction, the shares of the associate worth of 10% of the total acquisition price are held by the
designated escrow agent.
37. SEGMENT INFORMATION:
(1) The Group has a vehicle segment, a finance segment and other. The vehicle segment is engaged in the
manufacturing and sale of motor vehicles. The finance segment operates vehicle financing, credit card
processing and other financing activities. Other includes the R&D, train manufacturing and other activities
which cannot be classified as the vehicle segment or the finance segment.
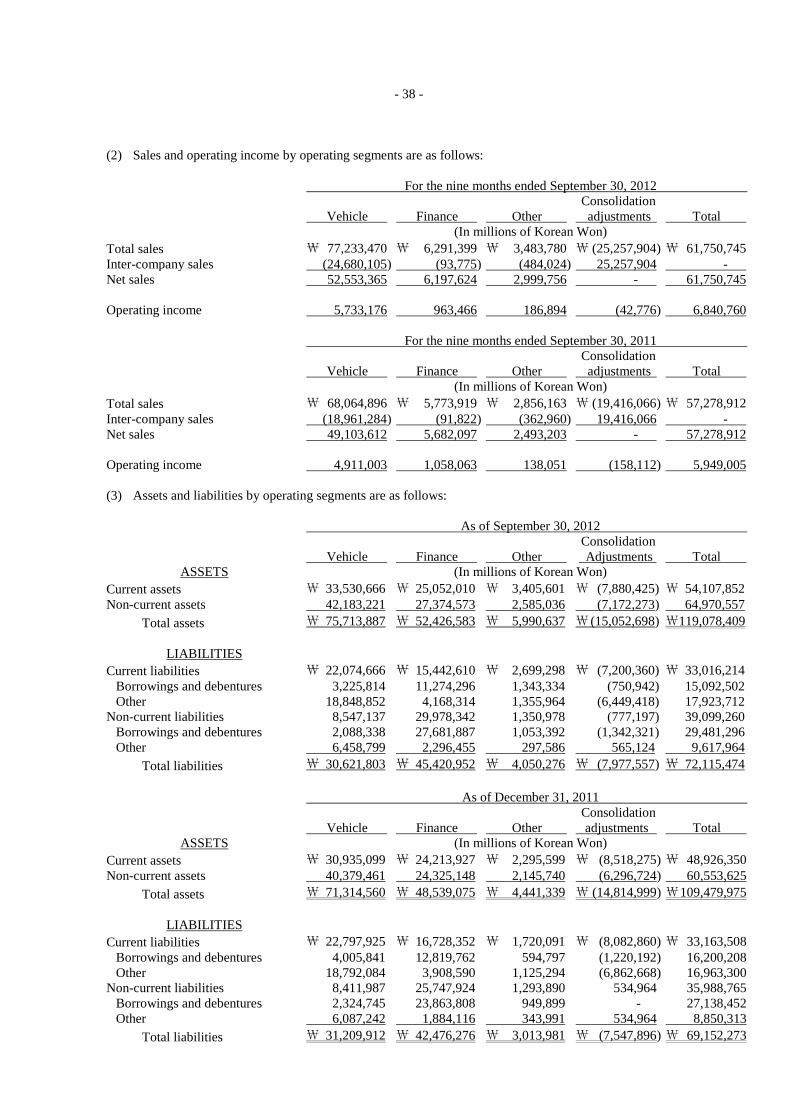
- 38 -
(2) Sales and operating income by operating segments are as follows:
For the nine months ended September 30, 2012
Vehicle
Finance Other
Consolidation
adjustments Total
(In millions of Korean Won)
Total sales ₩ 77,233,470 ₩ 6,291,399 ₩ 3,483,780 ₩ (25,257,904) ₩ 61,750,745
Inter-company sales (24,680,105) (93,775) (484,024) 25,257,904 -
Net sales 52,553,365 6,197,624 2,999,756 - 61,750,745
Operating income 5,733,176 963,466 186,894 (42,776) 6,840,760
For the nine months ended September 30, 2011
Vehicle
Finance Other
Consolidation
adjustments Total
(In millions of Korean Won)
Total sales ₩ 68,064,896 ₩ 5,773,919 ₩ 2,856,163 ₩ (19,416,066) ₩ 57,278,912
Inter-company sales (18,961,284) (91,822) (362,960) 19,416,066 -
Net sales 49,103,612 5,682,097 2,493,203 - 57,278,912
Operating income 4,911,003 1,058,063 138,051 (158,112) 5,949,005
(3) Assets and liabilities by operating segments are as follows:
As of September 30, 2012
Vehicle
Finance Other
Consolidation
Adjustments Total
ASSETS (In millions of Korean Won)
Current assets ₩ 33,530,666 ₩ 25,052,010 ₩ 3,405,601 ₩ (7,880,425) ₩ 54,107,852
Non-current assets 42,183,221 27,374,573 2,585,036 (7,172,273) 64,970,557
Total assets ₩ 75,713,887 ₩ 52,426,583 ₩ 5,990,637 ₩ (15,052,698) ₩119,078,409
LIABILITIES
Current liabilities ₩ 22,074,666 ₩ 15,442,610 ₩ 2,699,298 ₩ (7,200,360) ₩ 33,016,214
Borrowings and debentures 3,225,814 11,274,296 1,343,334 (750,942) 15,092,502
Other 18,848,852 4,168,314 1,355,964 (6,449,418) 17,923,712
Non-current liabilities 8,547,137 29,978,342 1,350,978 (777,197) 39,099,260
Borrowings and debentures 2,088,338 27,681,887 1,053,392 (1,342,321) 29,481,296
Other 6,458,799 2,296,455 297,586 565,124 9,617,964
Total liabilities ₩ 30,621,803 ₩ 45,420,952 ₩ 4,050,276 ₩ (7,977,557) ₩ 72,115,474
As of December 31, 2011
Vehicle Finance Other
Consolidation
adjustments Total
ASSETS (In millions of Korean Won)
Current assets ₩ 30,935,099 ₩ 24,213,927 ₩ 2,295,599 ₩ (8,518,275) ₩ 48,926,350
Non-current assets 40,379,461 24,325,148 2,145,740 (6,296,724) 60,553,625
Total assets ₩ 71,314,560 ₩ 48,539,075 ₩ 4,441,339 ₩ (14,814,999) ₩ 109,479,975
LIABILITIES
Current liabilities ₩ 22,797,925 ₩ 16,728,352 ₩ 1,720,091 ₩ (8,082,860) ₩ 33,163,508
Borrowings and debentures 4,005,841 12,819,762 594,797 (1,220,192) 16,200,208
Other 18,792,084 3,908,590 1,125,294 (6,862,668) 16,963,300
Non-current liabilities 8,411,987 25,747,924 1,293,890 534,964 35,988,765
Borrowings and debentures 2,324,745 23,863,808 949,899 - 27,138,452
Other 6,087,242 1,884,116 343,991 534,964 8,850,313
Total liabilities ₩ 31,209,912 ₩ 42,476,276 ₩ 3,013,981 ₩ (7,547,896) ₩ 69,152,273
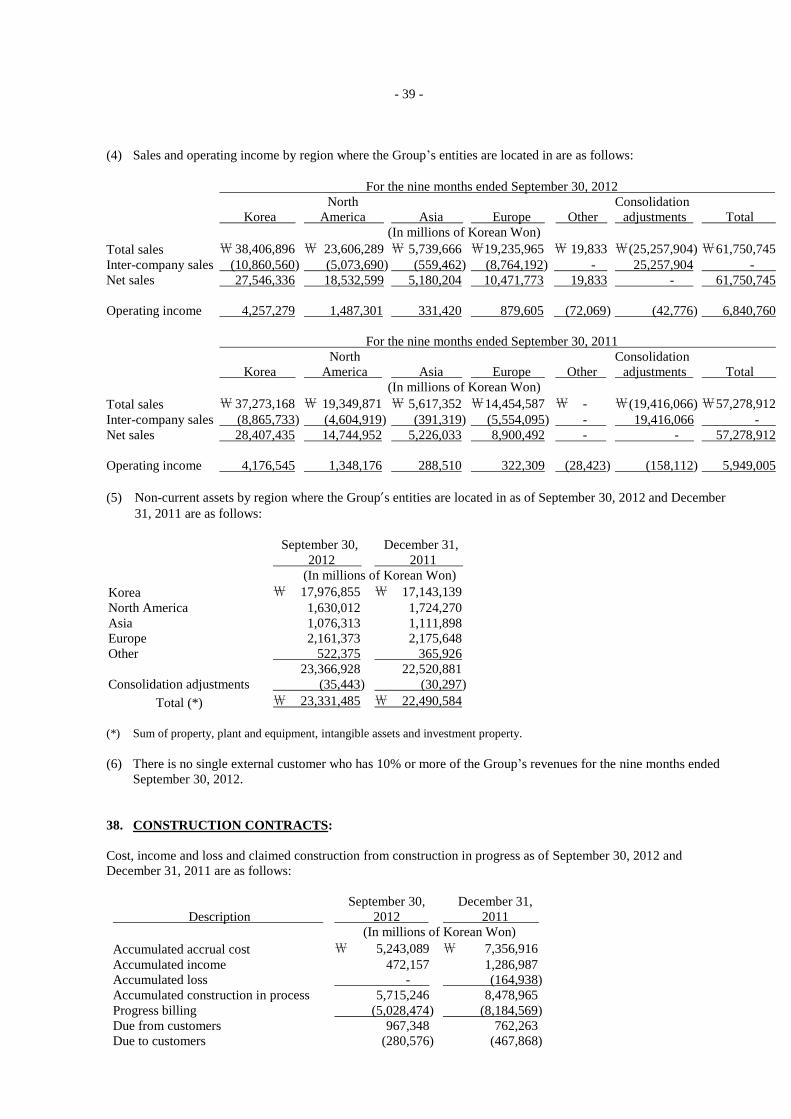
- 39 -
(4) Sales and operating income by region where the Group‟s entities are located in are as follows:
For the nine months ended September 30, 2012
Korea
North
America Asia Europe Other
Consolidation
adjustments Total
(In millions of Korean Won)
Total sales ₩ 38,406,896 ₩ 23,606,289 ₩ 5,739,666 ₩19,235,965 ₩ 19,833 ₩ (25,257,904) ₩ 61,750,745
Inter-company sales (10,860,560) (5,073,690) (559,462) (8,764,192) - 25,257,904 -
Net sales 27,546,336 18,532,599 5,180,204 10,471,773 19,833 - 61,750,745
Operating income 4,257,279 1,487,301 331,420 879,605 (72,069) (42,776) 6,840,760
For the nine months ended September 30, 2011
Korea
North
America Asia Europe Other
Consolidation
adjustments Total
(In millions of Korean Won)
Total sales ₩ 37,273,168 ₩ 19,349,871 ₩ 5,617,352 ₩ 14,454,587 ₩ - ₩ (19,416,066) ₩ 57,278,912
Inter-company sales (8,865,733) (4,604,919) (391,319) (5,554,095) - 19,416,066 -
Net sales 28,407,435 14,744,952 5,226,033 8,900,492 - - 57,278,912
Operating income 4,176,545 1,348,176 288,510 322,309 (28,423) (158,112) 5,949,005
(5) Non-current assets by region where the Group’s entities are located in as of September 30, 2012 and December
31, 2011 are as follows:
September 30,
2012
December 31,
2011
(In millions of Korean Won)
Korea ₩ 17,976,855 ₩ 17,143,139
North America 1,630,012 1,724,270
Asia 1,076,313 1,111,898
Europe 2,161,373 2,175,648
Other 522,375 365,926
23,366,928 22,520,881
Consolidation adjustments (35,443) (30,297)
Total (*) ₩ 23,331,485 ₩ 22,490,584
(*) Sum of property, plant and equipment, intangible assets and investment property.
(6) There is no single external customer who has 10% or more of the Group‟s revenues for the nine months ended
September 30, 2012.
38. CONSTRUCTION CONTRACTS:
Cost, income and loss and claimed construction from construction in progress as of September 30, 2012 and
December 31, 2011 are as follows:
Description
September 30,
2012
December 31,
2011
(In millions of Korean Won)
Accumulated accrual cost ₩ 5,243,089 ₩ 7,356,916
Accumulated income 472,157 1,286,987
Accumulated loss - (164,938)
Accumulated construction in process 5,715,246 8,478,965
Progress billing (5,028,474) (8,184,569)
Due from customers 967,348 762,263
Due to customers (280,576) (467,868)
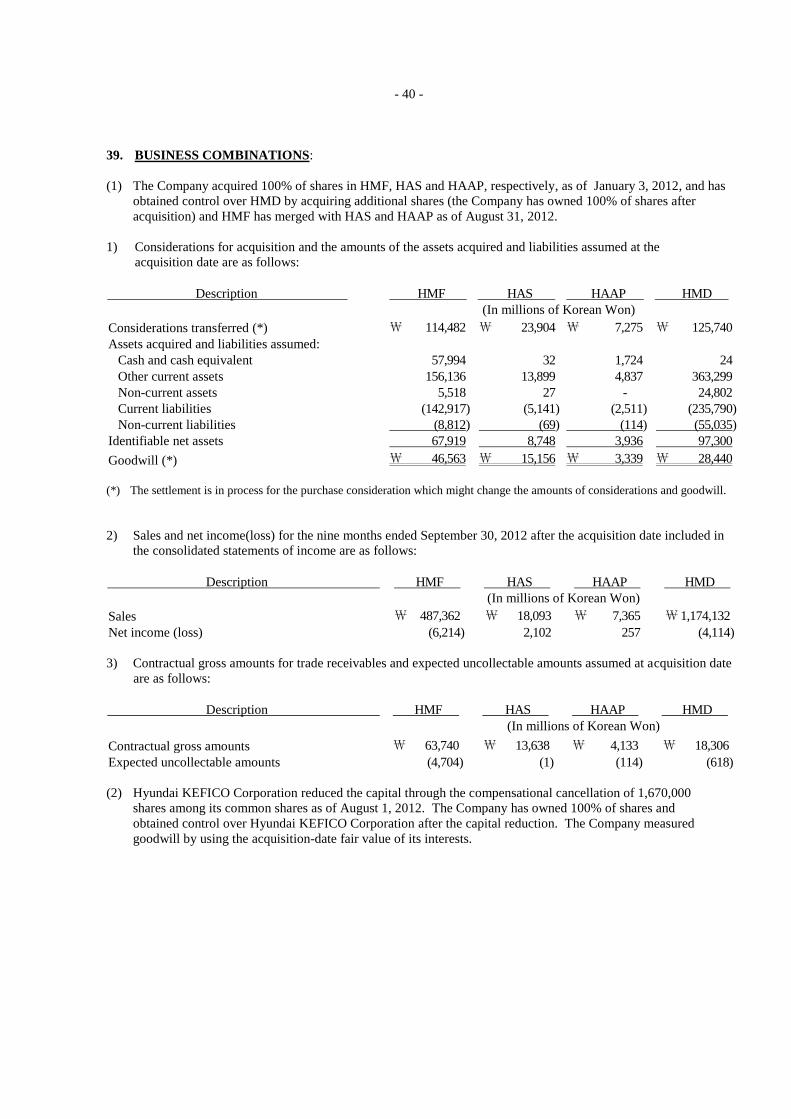
- 40 -
39. BUSINESS COMBINATIONS:
(1) The Company acquired 100% of shares in HMF, HAS and HAAP, respectively, as of January 3, 2012, and has
obtained control over HMD by acquiring additional shares (the Company has owned 100% of shares after
acquisition) and HMF has merged with HAS and HAAP as of August 31, 2012.
1) Considerations for acquisition and the amounts of the assets acquired and liabilities assumed at the
acquisition date are as follows:
Description HMF HAS HAAP HMD
(In millions of Korean Won)
Considerations transferred (*) ₩ 114,482 ₩ 23,904 ₩ 7,275 ₩ 125,740
Assets acquired and liabilities assumed:
Cash and cash equivalent 57,994 32 1,724 24
Other current assets 156,136 13,899 4,837 363,299
Non-current assets 5,518 27 - 24,802
Current liabilities (142,917) (5,141) (2,511) (235,790)
Non-current liabilities (8,812) (69) (114) (55,035)
Identifiable net assets 67,919 8,748 3,936 97,300
Goodwill (*) ₩ 46,563 ₩ 15,156 ₩ 3,339 ₩ 28,440
(*) The settlement is in process for the purchase consideration which might change the amounts of considerations and goodwill.
2) Sales and net income(loss) for the nine months ended September 30, 2012 after the acquisition date included in
the consolidated statements of income are as follows:
Description HMF HAS HAAP HMD
(In millions of Korean Won)
Sales ₩ 487,362 ₩ 18,093 ₩ 7,365 ₩ 1,174,132
Net income (loss) (6,214) 2,102 257 (4,114)
3) Contractual gross amounts for trade receivables and expected uncollectable amounts assumed at acquisition date
are as follows:
Description HMF HAS HAAP HMD
(In millions of Korean Won)
Contractual gross amounts ₩ 63,740 ₩ 13,638 ₩ 4,133 ₩ 18,306
Expected uncollectable amounts (4,704) (1) (114) (618)
(2) Hyundai KEFICO Corporation reduced the capital through the compensational cancellation of 1,670,000
shares among its common shares as of August 1, 2012. The Company has owned 100% of shares and
obtained control over Hyundai KEFICO Corporation after the capital reduction. The Company measured
goodwill by using the acquisition-date fair value of its interests.
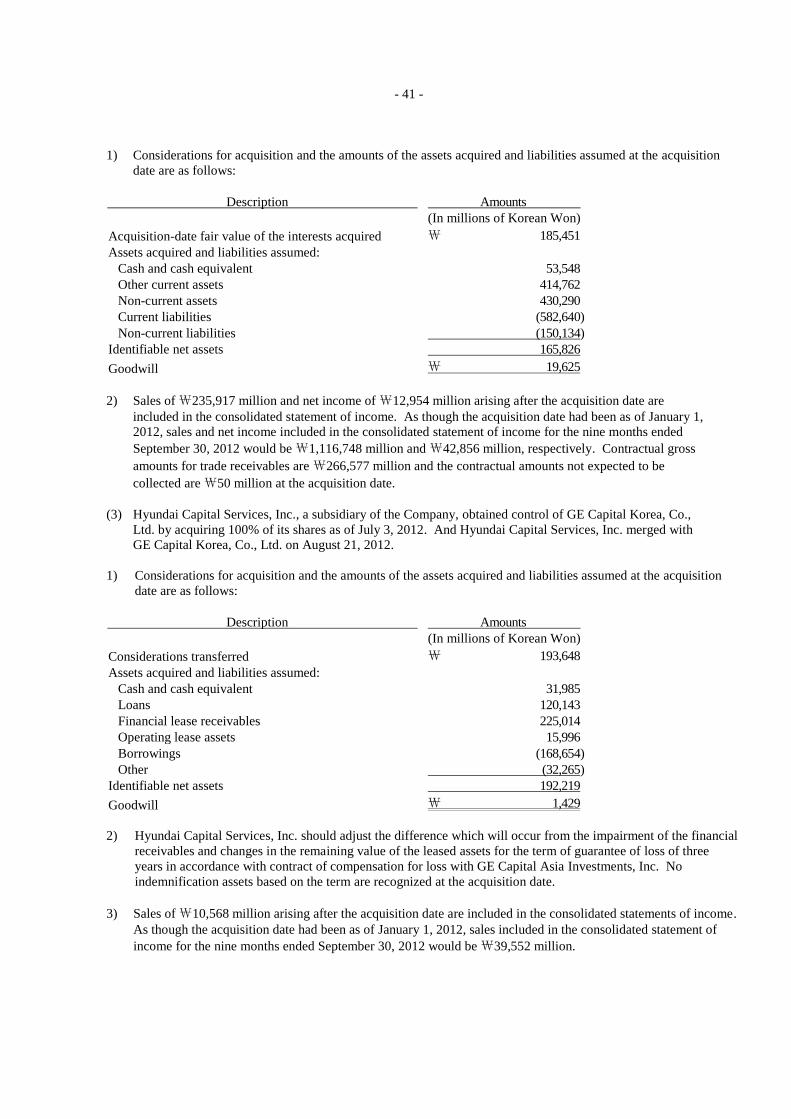
- 41 -
1) Considerations for acquisition and the amounts of the assets acquired and liabilities assumed at the acquisition
date are as follows:
Description Amounts
(In millions of Korean Won)
Acquisition-date fair value of the interests acquired ₩ 185,451
Assets acquired and liabilities assumed:
Cash and cash equivalent 53,548
Other current assets 414,762
Non-current assets 430,290
Current liabilities (582,640)
Non-current liabilities (150,134)
Identifiable net assets 165,826
Goodwill ₩ 19,625
2) Sales of ₩235,917 million and net income of ₩12,954 million arising after the acquisition date are
included in the consolidated statement of income. As though the acquisition date had been as of January 1,
2012, sales and net income included in the consolidated statement of income for the nine months ended
September 30, 2012 would be ₩1,116,748 million and ₩42,856 million, respectively. Contractual gross
amounts for trade receivables are ₩266,577 million and the contractual amounts not expected to be
collected are ₩50 million at the acquisition date.
(3) Hyundai Capital Services, Inc., a subsidiary of the Company, obtained control of GE Capital Korea, Co.,
Ltd. by acquiring 100% of its shares as of July 3, 2012. And Hyundai Capital Services, Inc. merged with
GE Capital Korea, Co., Ltd. on August 21, 2012.
1) Considerations for acquisition and the amounts of the assets acquired and liabilities assumed at the acquisition
date are as follows:
Description Amounts
(In millions of Korean Won)
Considerations transferred ₩ 193,648
Assets acquired and liabilities assumed:
Cash and cash equivalent 31,985
Loans 120,143
Financial lease receivables 225,014
Operating lease assets 15,996
Borrowings (168,654)
Other (32,265)
Identifiable net assets 192,219
Goodwill ₩ 1,429
2) Hyundai Capital Services, Inc. should adjust the difference which will occur from the impairment of the financial
receivables and changes in the remaining value of the leased assets for the term of guarantee of loss of three
years in accordance with contract of compensation for loss with GE Capital Asia Investments, Inc. No
indemnification assets based on the term are recognized at the acquisition date.
3) Sales of ₩10,568 million arising after the acquisition date are included in the consolidated statements of income.
As though the acquisition date had been as of January 1, 2012, sales included in the consolidated statement of
income for the nine months ended September 30, 2012 would be ₩39,552 million.
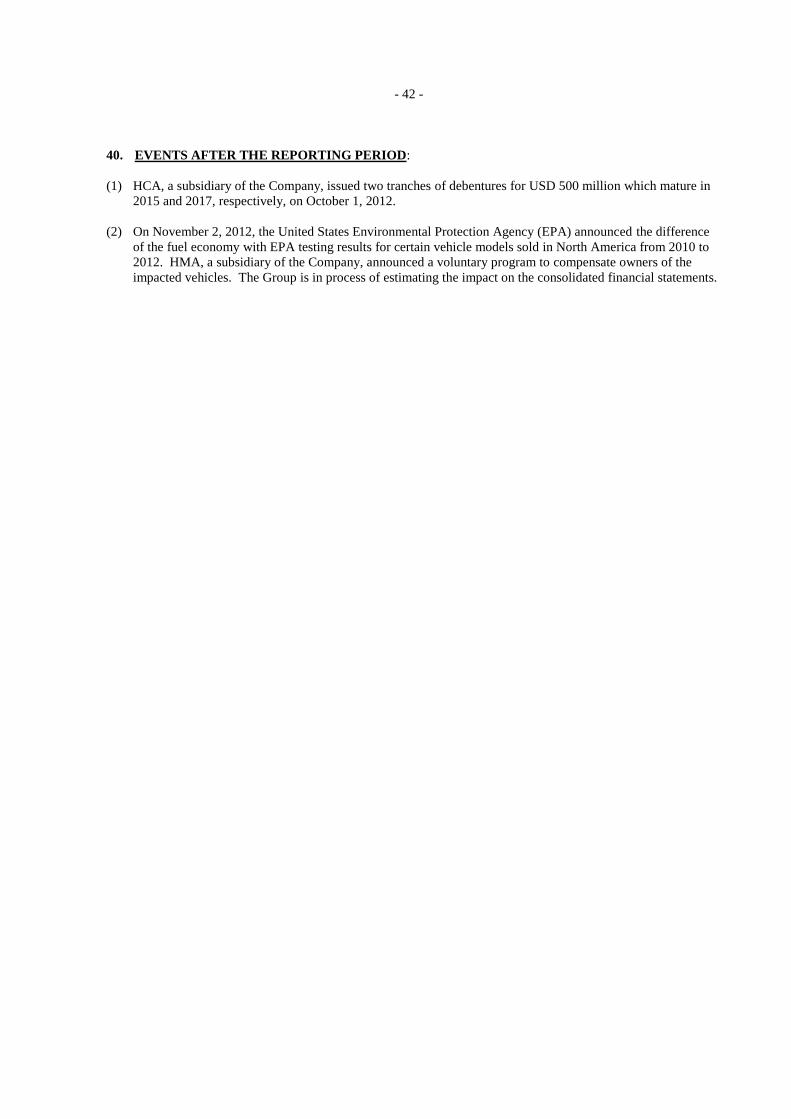
- 42 -
40. EVENTS AFTER THE REPORTING PERIOD:
(1) HCA, a subsidiary of the Company, issued two tranches of debentures for USD 500 million which mature in
2015 and 2017, respectively, on October 1, 2012.
(2) On November 2, 2012, the United States Environmental Protection Agency (EPA) announced the difference
of the fuel economy with EPA testing results for certain vehicle models sold in North America from 2010 to
2012. HMA, a subsidiary of the Company, announced a voluntary program to compensate owners of the
impacted vehicles. The Group is in process of estimating the impact on the consolidated financial statements.