Embed Size (px)
Citation preview
Deformation Induced Molecular Behavior of Cis 1,4-Polyisoprene andIts Nanocomposites Monitored by Solid-State NMR
By
Georgia Michelle Poliskie
B.A. ChemistryB.A. Economics
Grinnell College. 2000
UASSACHUSETTS OF TE CH;C ,C
APR 0 20
LIBRARIE
Submitted to the Department of Materials Science and Engineeringin Partial Fulfillment of the Requirements for the Degree of
Doctor of Philosophy in Polymer Science'at the
Massachusetts Institute of Technology
February 2005
© 2005 Massachusetts Institute of TechnologyAll rights reserved
Signature of Author:
Certified by:
Certified by:
7--.0 , Department of Material Science and EngineeringJanuary 21, 2005
// Karen K. GleasonProfessor of Chemical Engineering
Thesis Supervisor
i1
Joel P. Clark_J Professor of Materials Science and Engineering
Thesis Co-Supervisor
Accepted by:Gerbrand Ceder
Chair, Departmental Committee on Graduate Students
1
ISTTUTE
305I" .1
iffi
----- �3-�
.FCU
Deformation Induced Molecular Behavior of Cis 1,4-Polyisoprene and ItsNanocomposites Monitored by Solid-State NMR
by
Georgia Michelle Poliskie
Submitted to the Department of Materials Science and Engineeringon January 21th, 2005 in Partial Fulfillment of the requirements for theDegree of Doctor of Philosophy in Materials Science and Engineering
Abstract
Proton spin lattice (T1) relaxation time constants were used to monitor changes in the molecularmotion and architecture of polyisoprene, polyisoprene-clay composites and polyhedral oligomericsilsesquioxane (POSS) nanofillers. The high frequency relaxations monitored by NMR are sensitivity tochanges in the environment of polyisoprene chains as a function of compressive strain. These are the firstexperiments to use magic angle spinning nuclear magnetic resonance techniques in situ with compressionmeasurements to identify changes in the chain environment during compressive strain.
For the polyisoprene composites, in situ compression measurements were made during theacquisition of NMR relaxation measurements. Therefore, the architecture of polyisoprene-clay compositeswas monitored as a function of strain. Clay aggregates, composed of stacked clay platelets, were identifiedin the nanocomposites. Increases in strain resulted in an irreversible, increase in interfacial area betweenclay and the polymer as the aggregate broke apart. This increase in area could be easily quantified byNMR (- 230%) and was verified with optical microscopy (- 150%). The correlation between NMR andoptical microscopy indicates, with certainty, that NMR relaxation measurements can be used to quantifydifferences in interfacial area of nanocomposites. With this being established, the techniques developed inthis thesis could be applied to analyze strain induced changes in interfacial area for samples which are notoptically clear or samples in which the particle dimensions make microscopy techniques difficult. Thequantitative discrepancy between the two techniques suggests that NMR captures changes in the bulkwhereas microscopy is confined to surface effects. Finally, these results point to the potential to design acomposite in which this mechanism is halted, such as crosslinking the clay directly to the polymer matrix,in hopes of creating a higher energy mechanism of deformation and thereby improving the mechanicalproperties.
Octaethyl POSS was found to exhibit characteristics exemplified by plastic crystals. Phasetransitions were identified with NMR and differential scanning calorimetry at -258 K and -253 K forpartially deuterated and fully protonated ethyl POSS, respectively. For both derivatives at temperaturesabove the phase transition, the molecular motions of POSS were found to be on the order of nanoseconds(-30 ± 2 ns) and associated with molecular tumbling of the POSS molecule. After the phase transition, themolecular tumbling of POSS molecules slowed ( -530 ± 15 ns ) and became more asymmetric. Thesephase changes were characterized by a change in entropy of 20.2 ± 5 Jmol-'K', a typical value for plasticcrystals. This plastic crystalline behavior suggests that in the high temperature phase, the POSS moleculeswill undergo plastic flow at relatively low levels of stress. Therefore, in the high temperature phase POSSwill not enhance mechanical behavior in the same manner as other inorganic fillers, such as silica. Inaddition, the trends in the transition temperature suggest that the derivatives can be chemically altered toachieve the desired phase at a given operation temperature.
2
Finally, a compression device suitable for fitting inside the rotor of a magic angle spinning NMRprobe was built. Although in situ NMR compression experiments have previously been investigated, theseexperiments were the first to be done while magic angle spinning. This allowed for increased specificityfor assigning molecular mobility. Additionally, the magic angle spectra doubled the signal to noise, ascompared to static proton NMR spectra. Thus, more rapid spectral acquisition was possible, allowing"snapshots" to be acquired under dynamic processes such as mechanical deformation. This led to a moredetailed analysis of deformation than that possible from static spectra. For instance, using magic anglespinning the behavior of bulk polymer was separated from that adjacent to the clay. For this reason, theeffect of the changes on the architecture of nanocomposites could be monitored through those protons inclosest proximity to the clay surface. This enhanced selectivity resulted in an unambiguous determinationof change in composite architecture and its time dependence.
Thesis Supervisor: Karen K GleasonTitle: Professor of Chemical Engineering
3
Acknowledgement
I would like to thank my advisors, Prof. Karen Gleason and Prof. Robert Cohen, for funding andguidance for this thesis work. Thanks to both for their patience and willingness to keep reading andreviewing various drafts of this thesis. In addition, I would like to thank the group members in both labsfor their help with various aspects of this project. In particular, I would like to thank my NMR predecessorsProf. Leslie Loo and Prof. Kenneth Lau for teaching me the various experimental nuances of NMRspectroscopy. Thanks to Prof. Jeff Abes for help with the art of transmission electron microscopy and Prof.Yonathan Thio for many discussions about mechanical behavior. Finally, thanks to the Haddad Group atthe Edwards Air Force Base for supplying the POSS material I requested and Prof Wuensch and Joe Adariofor helpful suggestions and conversations about X-ray spectroscopy.
4
Index
AbstractAcknowledgementsList of FiguresList of Tables
Chapter 1: Introduction & Background
Chapter 2: Strain Behavior of Cis 1,4-Polyisoprene-Montmorillonite Clay Nanocomposites Monitored bySolid-State NMR
Chapter 3: Strain Behavior of Cis 1,4-Polyisoprene-Laponite® Clay Nanocomposites Monitored by Solid-State NMR
Chapter 4: Phase Transitions of Ethyl Substituted Polyhedral Oligomeric SilSesquioxane (POSS)
Chapter 5: Strain Induced Changes in Cis 1,4-Polyisoprene Monitored by Solid State NMR
Chapter 6: Summary and Future Work
Appendix 1: Description, Diagram and Photograph of the MAS Compression Device
Appendix 2: Representative Stress Relaxation Experiments for 13 wt% Na+ exchanged Cis 1,4-Polyisoprene-MMT Nanocomposites
Appendix 3: Strain Behavior of Cis 1 ,4-Polyisoprene-Montmorillonite Clay Nanocomposite Monitoredwith MAS 'H Solid State NMR
Appendix 4: Representative Solution Spectra of Protonated Ethyl Substituted Polyhedral OligomericSilSesquioxane (POSS)
Appendix 5: Representative Solution Spectra of Deuterated Ethyl Substituted Polyhedral OligomericSilSesquioxane (POSS)
Appendix 6: X-ray Data of Ethyl Substituted Polyhedral Oligomeric SilSesquioxane (POSS)
Appendix 7: Representative MAS H Compression Studies Polydisperse Cis 1,4-Polyisoprene
Appendix 8: Representative MAS H Spin Lattice Relaxation Behavior of Monodisperse Cis 1,4-Polyisoprene
5
List of Figures
Chapter 2: Strain Behavior of Cis 1,4-Polyisoprene-Montmorillonite Clay NanocompositesMonitored by Solid-State NMR
Figure 1: TEM images of the cis 1,4-polyisoprene blended with 13 wt% 30B montmorillonite prior todeformation
Figure 2. WAXD of cis 1,4-polyisoprene-montmorillonite nanocomposites
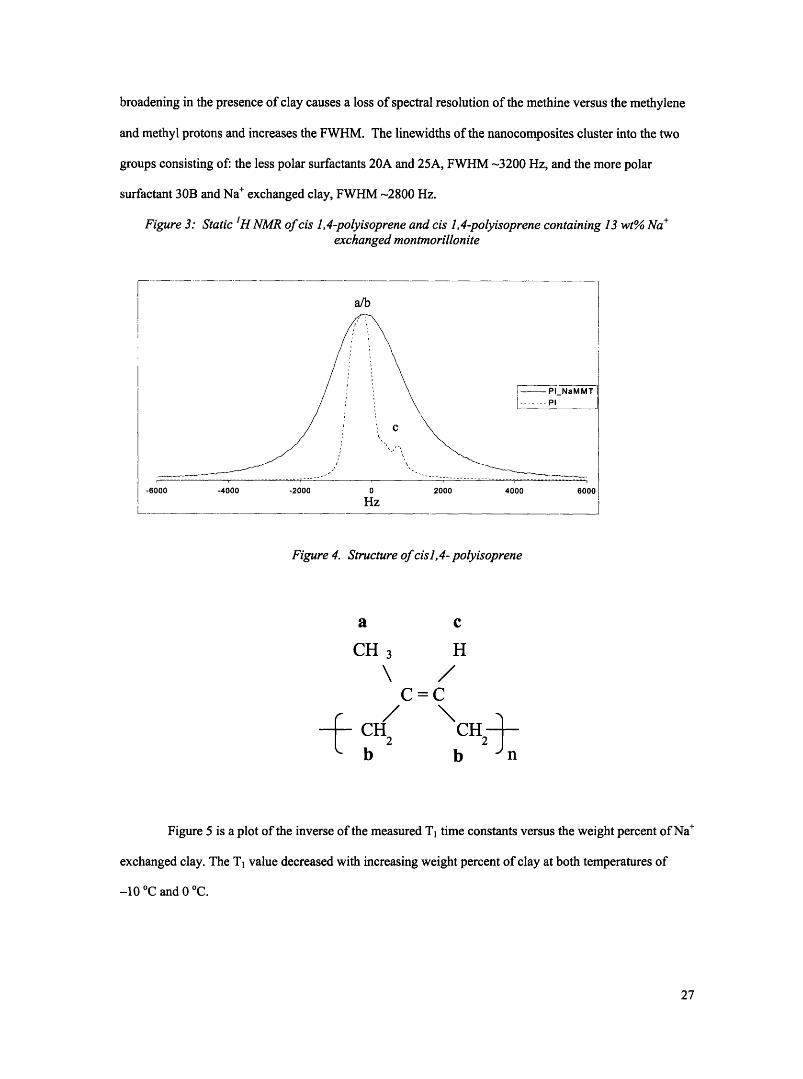
Figure 3: Static H NMR of cis 1,4-polyisoprene and cis 1,4-polyisoprene containing 13 wt% Na +
exchanged montmorillonite
Figure 4. Structure of cis1,4- polyisoprene
Figure 5: Plot of T, time constants as a function of amount of clay added for Na+ exchanged claynanocomposites
Figure 6: Magnetization recovery curve for cis 1,4-polyisoprene nanocomposites containing 13 wt% Na+
exchanged clay under compressive strains at -10 °C
Figure 7: Magnetization recovery curve for cis 1,4-polyisoprene nanocomposites containing 13 wt% 30Bexchanged clay under compressive strains at -10 °C
Figure 8: T time constants of cis 1,4-polyisoprene and cis 1,4-polyisoprene-montmorillonitenanocomposites under compressive strains at -10 °C
Figure 10: Compression modulus for cis 1,4-polyisoprene-montmorillonite nanocomposites
Chapter 3: Strain Behavior of Cis 1,4-Polyisoprene-Laponite® Clay Nanocomposites Monitored bySolid-State NMR
Figure 1. Optical micrograph (la) and SEM (lb) of the polyisoprene- Laponite® composite
Figure 2. Histogram of the number of particles for each bin of circumferences in the polyisoprene-Laponite® composite prior and post 40% compressive strain
Figure 3. Static and MAS 'H spectrum of the polyisoprene- Laponite® composite
Figure 4. Magnetization recovery plot of the polyisoprene- Laponite® composite under40% compressive strain
Figure 5. Plot of normalized magnetization versus the square root of the delay time for the methyleneresonance of polyisoprene- Laponite® composite as a function of compressive strain
6
Chapter 4: Plastic Crystalline Behavior of Ethyl Substituted Polyhedral Oligomeric SilSesquioxane
Figure 1. Molecular structure of ethyl POSS
Figure 2. Differential scanning calorimetry measurements of partially deuterated and fully protonatedethyl POSS
Figure 3. Solid-state deuterium NMR spectra for partially deuterated ethyl substituted POSS as a functionof temperature
Figure 4. Solid-state static H spectra of fully protonated and partially deuterated ethyl POSS as a functionof temperature
Figure 5. Solid-state H linewidth as a function of temperature for fully protonated and partially deuteratedethyl substituted POSS
Figure 6. Solid-state H spin-lattice relaxation time constants (TI) as a function of temperature for fullyprotonated ethyl substituted POSS
Figure 7. Solid-state H spin-lattice relaxation time constants (Tl) as a function of temperature for partiallydeuterated ethyl substituted POSS
Chapter 5: Compression of Cis 1,4-Polyisoprene Monitored by Solid-State NMR
Figure 1. Stress relaxation curve of 710k cis 1,4-polyisoprene at 40% strain
Figure 2. MAS H spectrum of monodispersed 710k cis 1,4-polyisoprene
Figure 3. Spin lattice relaxation (Tl) time constants as a function of duration of compressive strain for710k cis 1,4-polyisoprene at 40% strain
Figure 4. MAS magnetization recovery curve for the methyl (a) resonance of compressed 710k cis 1,4-polyisoprene after a 10 minute wait for mechanical equilibrium
Figure 5. MAS magnetization recovery curve for the methylene (b) resonance of compressed 710kpolyisoprene after a 10 minute wait for mechanical equilibrium
Figure 6. MAS magnetization recovery curve for the methine (c) resonance of compressed 710k cis 1,4-polyisoprene under compressive strain after a 10 minute wait for mechanical equilibrium
Appendices
AP2-1: Stress relaxation of 13 wt% Na+ exchanged MMT clay and cis 1,4-poyisoprene nanocompositeswith a continuous and step strain loading
AP3- 1: Plot of normalized magnetization versus the square root of the delay time for the methyleneresonance of 25A modified MMT-polyisoprene composite as a function of compressive strain
AP3- 2: Bar graph of the coefficient (slope) for the protons of the 25A modified MMT-polyisoprenecomposite
7
AP3-3: Plot of normalized magnetization versus the square root of the delay time for the methyleneresonance of 30B modified MMT-polyisoprene composite as a function of compressive strain
AP3-4: Bar graph of the coefficient (slope) for the protons of the 30B modified MMT-polyisoprenecomposite
AP4-1: 13C solution spectrum of protonated ethyl POSS
AP4-2: 29Si solution NMR of protonated ethyl POSS
AP4-3: H solution NMR of protonated ethyl POSS
AP5-l: 13C solution spectrum of deuterated ethyl POSS
AP5-2: 13C DEPT solution spectrum of deuterated Ethyl POSS
AP5-3: H solution NMR of deuterated ethyl POSS
AP5-4: 29Si solution NMR of deuterated ethyl POSS
AP6-1: WAXD spectra at various temperatures for fully protonated ethyl POSS
AP6-2: WAXD spectra at various temperatures for partially deuterated ethyl POSS
AP7-1. Static and MAS H spectrum of polydisperse cis 1,4-polyisoprene
AP7-2. Magnetization recovery plot of polydisperse cis 1,4-polyisoprene measured statically and underMAS conditions
AP7-3. T time constants for the methylene resonance under static and MAS conditions measured withincreasing compressive strain
AP7-4. Percentage of long component (FL) under MAS conditions measured with increasing compressivestrain for the methyl, methylene and methine protons
AP7-5. Stress Relaxation at 40% strain for Polydisperse cis 1,4-Polyisoprene
AP7-6. Percentage of long component (FL) as a function of time the 40% strain
AP8- 1. Spin lattice relaxation time constants as a function of an inversus number average molecular weightfor monodisperse polyisoprene for MAS Proton Spectra
8
List of Tables
Chapter 2: Strain Behavior of Cis 1,4-Polyisoprene-Montmorillonite Clay NanocompositesMonitored by Solid-State NMR
Table 1: Comparison of WAXD spacing of cis 1,4-polyisoprene montmorillonite nanocomposites
Chapter 4: Plastic Crystalline Behavior of Ethyl Substituted Polyhedral Oligomeric SilSesquioxane
Table 1: Characterisitcs of the phase tranistion and phase behavior of ethyl substiuted POSS extractedfrom DSC
Table 2: Characterisitcs of the phase tranistion and phase behavior of ethyl substiuted POSS from NMR
9

Chapter 1
Background and Introduction
10
Introduction
For many years, researchers have attempted to understand the structure-property relationship of
polymers and composites. It has been theorized that bulk macroscopic properties such as the glass
transition temperature (Tg), mechanical modulus and wear resistance are all controlled by the molecular
level mobility, often associated with only a few repeat units on the polymer chains. 1-4 In order to explore
these theories atomic level simulations were used to reproduce bulk property measurements from dielectric
or dynamic mechanical experiments.56 However, more recently researchers have designed in situ
experiments, for instruments such as atomic force microscopy and nuclear magnetic resonance, which
allow for molecular level observation of the polymer during mechanical deformation.7 9
There has been a surge in the research of nanocomposite materials in the recent years.
Nanocomposites are generally defined as a two component material system in which one of the components
has at least one dimension on the nanoscale. The applications of these materials have been far reaching
into essential all the fundamental scientific fields of research; such as biology, materials science and
chemistry. ° For instance, biological applications include biosensors and biomaterials composed of
nanocomposite materials." 11-13 Researchers in the field of material science have explored the utility of
nanocomposites for alternatives to traditional packaging materials and as lightweight alloys.' "14"15 Finally,
chemists have synthesized nanocomposites with a variety of chemical architectures to be used in solid state
battery application and sensors. '16'17 Therefore, as researchers look for medical, scientific and industrial
applications for nanocomposites there is a desire to explore and understand the relationship between
molecular level architecture and macroscopic behavior. In order to properly specify the macroscopic
properties of nanocomposites it is essential to control and design the composite on a molecular level.
This need to understand the atomic and molecular level interactions of a nanocomposite makes
observations by nuclear magnetic resonance (NMR) ideal. Solid-state NMR is a nondestructive molecular
level characterization technique, which can be used to observe the molecular level interactions and mobility
of different parts of a composite. The relationship between structure and function can be determined with
the use in situ mechanical techniques. Historically, quasi-static mechanical stress or strain has been applied
to the polymers while monitored by static solid-state NMR. 18-20 This work illustrates the advantages of
monitoring quasi-static deformation with magic angle spinning (MAS) solid-state NMR.
11
NMR Background
Previous NMR work has primarily used deuterium (2H) NMR to monitor in situ deformation of
polymers and polymer composites. 2 3 However, the low relative abundance of this nucleus results in low
signal to noise, which can only be overcome with the acquisition of numerous scans. In addition, the
researcher must either incur the cost of synthesizing a deuterated polymer or work with a substance which
has an exchangeable functionality, such as an alcohol or an amine. This work involves the use of proton
('H) NMR which has a high relative abundance and therefore requires fewer scans in order to acquire a
spectrum with large signal to noise. In addition, the high abundancy of the isotope means there is no
isotopic labeling necessary. Therefore, 'H NMR is time and cost effective relative to observation of other
nuclei.
As mentioned earlier, this work explores the use of magic angle spinning with in situ mechanical
deformation. Magic angle spinning (MAS) is a solid-state NMR technique used to resolve the powder
pattern to the isotropic chemical shifts of the chemically distinguishable nuclei. When a proton experiment
is done statically the observed behavior describes the collective motions of all the protons on the polymer.
With MAS the observed behavior can be assigned to each chemically distinguishable nucleus. The
increased specificity of MAS will be contrasted to static experiments throughout the following chapters.
Finally, there are numerous NMR methods to measure molecular mobility; however, the spin
lattice relaxation time constants (T1) were used in these experiments. Motions which cause this type of
nucleus relaxation are on the order of the Larmor frequency 24, for these experiment that is 270 MHz.
Previous, in situ NMR and mechanical experiments rarely monitor this type of relaxation because such a
high frequency cannot be readily compared to dynamic mechanical or dielectric measurements. However,
as will be illustrated in the following chapters, mechanical deformation does change the mobility detected
at this frequency. Specifically, the spectral density of motion, which dictates the spin-lattice relaxation,
may be centered at a much higher frequency than other techniques, but the tail of the spectral density
distribution can influence the T, experiments. In addition, the paramagnetic theory is well established for
this relaxation, making it an attractive parameter for measurements of paramagnetic containing
nanocomposites.
12
NMR of Polyisoprene
Molecular level theories to describe the macroscopic mechanical properties of polyisoprene were
widely hypothesized by the academic community in the 1940's. Specifically, Doi and Edwards explained
the macroscopic exponential decay of stress as chains slipping out of physical entanglements. 25 However,
Mooney, et. al. suggested stress relaxation in a vacuum can be described by a two term equation: one term
describes a transient relaxation caused by the molecular level rupture of secondary bonds and a second term
describes the exponential decay caused by the molecular level chain rupture and slippage.2 6 In comparison,
extensive work by Tobolsky and Razumovski identified oxidative scission of the polyisoprene chains as the
molecular mechanism for stress relaxation in air, at elevated temperatures. 27 28
Approximately a decade latter in the 1950's, the NMR community began to publish studies
characterizing the molecular motions of static, undeformed polyisoprene. Gutowsky, et. al. found, using
static proton NMR, that the activation energy associated with internal repeat units was larger than for the
methyl groups; furthermore, these barriers changed as a function of crosslink density.2 9 In Gutowsky's
study, it was noted that interchain crosslinks, caused by back biting of the sulfur radical, could be identified
by a decrease in the mobility of the methyl substituents.2 9 Odajima, et. al. found that the spectral
distribution used to describe the proton spin-lattice relaxations of polyisoprene was best described by a
distribution of correlation times rather than the single correlation time suggested by the Bloomberg, Pound
and Purcell model.30' 3' This distribution describes the range of motions occurring along the polymer chain
due to the slight differences in the motions of each repeat unit. Despite the complexity of the underlying
spectral density calculation, Yager, et. al. noted that static proton experiments of polyisoprene only
required a single spin-lattice relaxation time constant due to the extensive dipolar communication in the
sample.32
Building on this characterization of the static undeformed polyisoprene, various groups
investigated the changes in molecular mobility of strained polyisoprene. For instance, Von Meerwall, et.
al. discovered small changes in the spin-lattice relaxations but large changes in the lower frequency spin-
spin relaxations of tensile strained crosslinked polyisoprene.33 Only at large tensile strains, greater than
200%, did the polyisoprene chains became static increasing the dipolar interaction and decreasing the spin-
spin relaxation. In fact, the theory, suggested by Mooney and Tobolsky a decade earlier, was best
13
described by these low frequency motions. For this reason, Kariyo, et. al. also measured the effects of
tensile deformation using relaxometry. Proton relaxometry allowed for a simultaneous monitoring of a
range of motions occurring at various frequencies from 10-5 to 102 MHz. They found the largest
differences in the spin-lattice relaxation occurred at low frequencies, 10-2 to 100 MHz, when strain was
above 300%. 34 Extending beyond tensile deformation, various groups, 34 -36 have designed in situ static
compression devices. For instance, Hedden, et. al. noted decreased mobility and increased asymmetry of
methyl group rotations when using deuterium NMR to monitor compressed polydimethylsiloxane. 35
However, none of these compression studies have spoken to the polymer communities past interest in stress
relaxation by focusing on a time dependence of the induced molecular motions.
NMR of Polyisoprene-Nanocomposites
Due to the increased industrial importance of composites, the polymer community has recently
been interested in the casual relationship between the microscopic architecture and macroscopic strength.
For instance, Kraus, et. al. used electron microscopy to identify the effect of the carbon black-polyisoprene
interface on mechanical strength. However, Kraus acknowledges microscopy is best suited for observing
particle size not molecular level mobility at the interface. Indeed, Kraus notes the measured particle size
alone could not be used to completely describe the observed mechanical behavior.37 Furthermore, as
interests in polyisoprene-nanocomposites increases, 3840 the dimensions for the fillers become smaller and
microscopic techniques become challenging and time consuming. For instance Vu, et. al. investigated the
correlation between the degree of exfoliation and the mechanical properties of cis 1,4-polyisoprene-
montorillonite composites; however, dispersion techniques were limited to x-ray diffraction and
transmission electron microscopy. 4 0 In their experiments a sample contained both regions of clay
exfoliation and intercalation making characterization with these techniques tedious and difficult.
Therefore, there is a need to design convenient techniques to monitor interfacial effects and an averaged
composite architecture.
NMR is particularly well suited to study nanocomposites since it is a nondestructive technique,
sensitive to molecular level architecture and mobility. Since nanocomposites are a presently expanding
field of interest, NMR studies of nanocomposites have not been as extensive as those of homopolymers.
However, some researchers have developed NMR techniques to characterize nanocomposites.4143 For
14
instance, both VanderHart, et. al. and Asano, et. al. noted that the amount of clay would alter the spin-
lattice relaxation of nanocomposites due to the presence of natural occurring paramagnetic centers, Fe+3 , in
the clay structure. 41' 42 In fact, VanderHart used the presence of the iron to identify that the usually unstable
gamma crystallites are stabilized by the clay and form in close proximity to the surface.4 ' Therefore, most
of the NMR done on nanocomposites has centered on characterizing structures using the natural occurring
paramagnetic centers as markers. No studies have applied in situ NMR deformation techniques to
nanocomposites. Therefore, this thesis intends to apply that previous knowledge of in situ NMR techniques
to this new field of interest.
NMR of NanofillersA critical element of designing nanocomposites is to identify the independent behavior of each
constituent of the composite prior to blending. Therefore, there is a need to fully characterize the behavior
of nanofillers, prior to blending them in homopolymers, in order to accurately predict the properties of the
composite. Gates, et. al. and others have used solid state NMR to measure the effect of the oxidation state
of iron on the relaxation of various nuclei, 29Si and 27A1, in the clay.44 The spin-lattice relaxation time of the
nuclei decreases with an increase in the oxidation state.43 In addition, the absorption mechanisms of small
molecules on clay platelets were monitored with solid-state NMR by numerous investigators. Concerning
natural occurring montmorillonite, 46 -49 Xiong, et. al. used deuterium NMR to determine the orbitals of
deuterated benzene used for absorption with the interatomic Ca+2 ion in montmorillonite. 4 8 In addition, the
effect of absorption was a decrease in the molecular tumbling about the C6 axis. He, et. al. used carbon-13
NMR to analyze the ordering of alkyl groups on tallow surfactants in between sheets of clay. It was found
that the substituents became ordered, forming a trans configuration, when proximal to the surface.
Furthermore, the amount of ordering depended on the packing density of the surfactant. 47 However, the
conclusions of both groups were subject to speculation because the results were masked by the
paramagnetic centers contained in the clay structure.
The other nanofiller of current widespread interest is polyhedral oligomeric silsesquioxane
(POSS), a fused cage of cyclic siloxane with a molecular radius on the order of a nanometer. Although
NMR has been used to characterize various POSS-polymer nanocomposites; 50 '51 unlike the clays, no NMR
has been done solely on the POSS nanofiller. Therefore, this thesis will use solid state NMR to characterize
15
the properties of POSS crystals, with the premise that understanding the nanofiller properties will allow us
to better predict the composite properties.
Project Goals
The primary goal of this work is to develop in situ mechanical and NMR methodology which will
aid in the understanding the molecular level changes in the polymers and polymer nanocomposites during
macroscopic deformation. These techniques were developed and tested on the model systems of
polyisoprene homopolymers and polyisoprene nanocomposites.
Synthetic cis 1,4-polyisoprene was a desirable homopolymer for this study for three reasons: it is a
structurally simple system in comparison to natural occurring polyisoprene, due to its inherent molecular
mobility small amounts of MAS are required to resolve the spectrum, and the low modulus means a
lightweight compression device can be used to create in-situ deformation (Table 1, Appendix 1). First, in
the 1970's and 1980's, work by Tanaka, et. al. centered on the complete characterization of natural
polyisoprene. 5 2 They attempted to fully characterize the role of fatty acids on the mechanical behavior of
the polymer, as well as characterize the polymer so that it could be synthetically reproduced. Later, both
groups led by Tanaka and Smith found that the uniaxial extensibility of the polymer was dependent on the
degree of crystallinity formed by fatty acids. 52' 53 Due to this complexity, synthetic cis 1,4-polyisoprene was
an ideal choice for study because it avoided the complications introduced by proteins and fatty acids
occurring in natural polyisoprene. Second, a decrease in dipolar interactions increases spectral resolution.
The high mobility of elastomers creates a internal decrease in dipolar interactions; therefore, elastomers
only require small amounts of MAS to further resolve spectra into their isotropic chemical shifts. Finally,
elastomers have a relatively low modulus (- 0.5 MPa) which can be easily deformed using a lightweight
nylon screw. Therefore, a lightweight compression device could be designed and used in a MAS rotor.
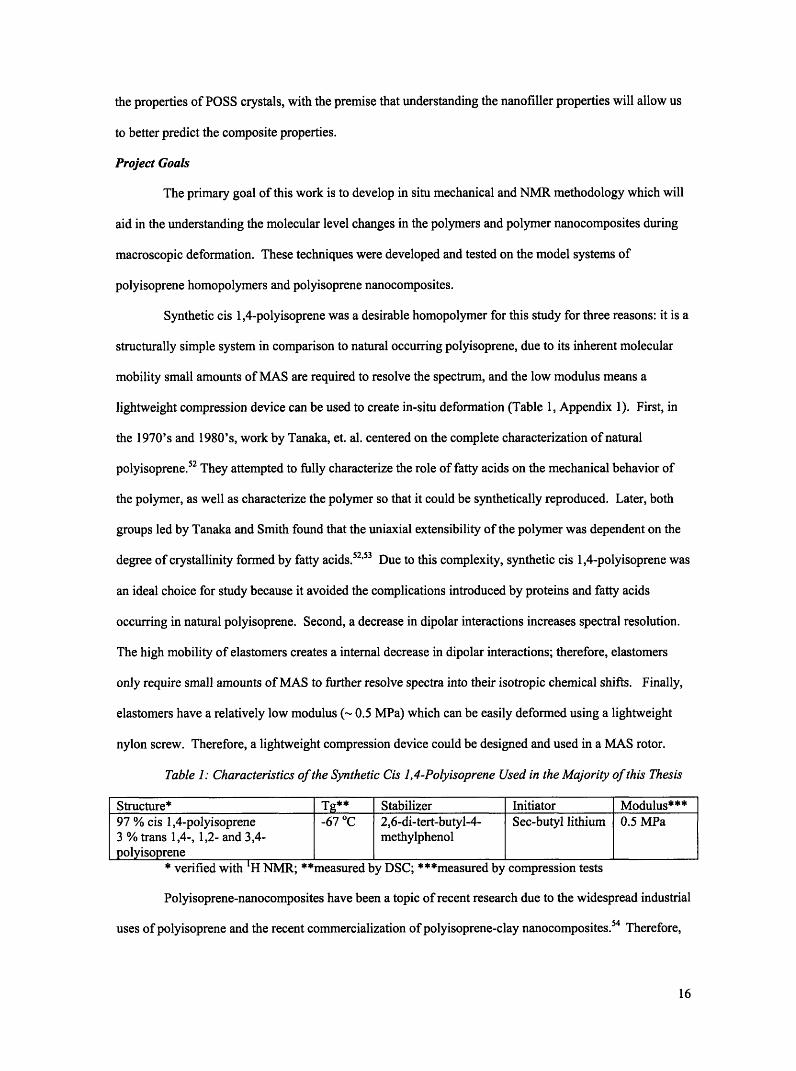
Table 1: Characteristics of the Synthetic Cis 1,4-Polyisoprene Used in the Majority of this Thesis
Structure* Tg ** Stabilizer Initiator Modulus***97 % cis 1,4-polyisoprene -67 °C 2,6-di-tert-butyl-4- Sec-butyl lithium 0.5 MPa3 % trans 1,4-, 1,2- and 3,4- methylphenolpolyisoprene
* verified with H NMR; **measured by DSC; ***measured by compression tests
Polyisoprene-nanocomposites have been a topic of recent research due to the widespread industrial
uses of polyisoprene and the recent commercialization of polyisoprene-clay nanocomposites.5 4 Therefore,
16
information about the structure-property relationships for these nanocomposites could aid in designing
composites with desired macroscopic properties.
In order to perform these measurements while the sample was spun at the magic angle a novel
compression device was made. This device included a rod of Teflon with a hole in the middle large enough
for the placement of the polymer or polymer composite. Strain was placed on the polymer with successive
turns of a nylon screw. The entire device was housed in a ceramic rotor so that the sample could be spun
by the NMR probe. As mentioned above it was important that the materials used be lightweight so that the
probe could easily spin the sample; therefore, these in situ techniques are limited to elastomeric materials.
The description of this thesis work is divided into: two chapters concerned with the deformation
mechanisms occurring in clay polyisoprene nanocomposites, a chapter which uses NMR to explore the
crystallographic phase transition of polyhedral oligomeric silsesquioxane (POSS), a commercially available
nanofiller and a chapter concerning the in situ mechanical behavior of polyisoprene
17
References1. Hartmann, L.; Kremer, F.; Leger,L; Pouret, P. J. Chem. Phys. 2003, 118, 6052.
2. Mays, J.W. Macromolecules 1990, 23, 3530.
3. Goodwin, AA.; Beever, M.S.; Clarson, S.J.; Semlyen, J.A. Polymer 1996, 37, 2603.
4. Ratner, B.D.; Castner, B.D. Surface Modification of Polymeric Biomaterials Plenium Press: New York,1996.
5. Oyerokun, F.T.; Schweizer, K.S. J. Chem Phys. 2004, 120, 9359.
6. Sheng, N; Boyce, M.C.; Parks, D.M.; Rutledge, G.C.; Abes, J.I.; Cohen, R.E. Polymer 2004, 45, 487-506.
7. Lu, Y.H.; Liang, S.; Chu, W.Y.; Qiao, L.J. Intermetallics 2002, 10, 823.
8. Loo, L.; Cohen, R.C.; Gleason, K.K. Science 2000, 288,116.
9. Bobji, M.S.; Bhushan, B. J. Mater. Res. 2001, 16, 844.
10. Seal, S.; Baraton, M. MRS Bulletin 2004, 29, 9.
11. Gill, I. Chem. Mater. 2001, 13, 3404.
12. Lee, S.W.; Morillo, C.; Visbal, S.; Olivares, J.L. Mater. Sci. Forum. 2003, 439, 79.
13. Krikorian, V. ; Kurian, M.; Galvin, M.E.; Nowak, A.P.; Deming, T.J.; Pochan, D.J. J. Appl. Polym.Sci. 2003, 88, 337.
14. Liu, J.R.; Itoh, M.; Jiang, J.Z.; Machida, K.I. J. Magn Mater. 2004, 271, L147.
15. Ziang, G. J. Alloy Compd. 2004, 370, 123.
16. Li, Y.; Yang, M.J.; She, Y. Talanta 2004, 62, 707.
17. Cantalini, C.; Valentini, L.; Armentano, I.; Kenny, J.M.; Lozzi, L.; Santucci, S. J. Eur. Ceram. Soc.2004, 24, 1405.
18. Loo, L.S.; Gleason, K.K.; Cohen, R.E. Polymer 2000, 41, 7699.
19. Callaghan, P.T.; Kilfoil, M.L.; Samulski, E.T. Phys. Rev. Lett. 1998, 81, 4524.
20. Oshima, K.; Kusumuto, H.. J.Chem.Phys. 1956, 24, 913.
21. Hedden, R.C.; McCasey, E.; Cohen, C.; Duncan, T.M. Macromolecules 2001, 34, 3285.
22. McLoughlin, K.; Waldbieser, J.K.; Cohen, C.; Duncan, T.M. Macromolecules 1997, 30, 1044.
23. Loo, S.S.; Cohen, R.E.; Gleason, K.K. Macromolecules 1998, 31, 8907.
24. Bruch, M.D. NMR Spectroscopy Techniques Marcel Dekker: New York 1996.
18
25. Erman, B.; Mark, J.E. Structures and Properties of Rubberlike Networks Oxford University:Oxford1997.
26. Mooney, M.; Wolstenholme, W.E; Villars, D.S. J. Appl. Phys. 1994, 15, 324.
27. Tobolsky, A.V.; Prettyman, F.B.; Dillon, J.H. J. Appl. Phys. 1944, 15, 324.
28. Razumovski, S.D.; Podasteviev, V.V.; Zaikov, G.E. Polym Degrad Stabil 1988, 20, 37.
29. Gutowsky, H.S.; Saika, A.; Takeda, M.; Woessher, D.E. J. Chem. Phys. 1957, 27, 542.
30. Odajima, A. Progr. Theoret. Phys. Suppl. 1959, 10. 142.
31. Abragam, A. Principles of Nuclear Magnetic Resonance; Oxford University Press: Oxford, 1961.
32. Yager Physics 1939, 7, 434.
33. Von Meerwall, E.; Ferguson, R.D. J. Poly. Sci. 1981, 19, 77.
34. Kariyo, S.; Stapf, S. Macromolecules 2002, 35, 9253.
35. Hedden, R.C.; McCaskey, E.; Cohen, C.; Duncan, T.M. Macromolecules 2001, 34, 3285.
36. Menge, H.; Hotopf, S.; Ponitzsch, S.; Richter, S.; Arndt, K.; Schneider, H.; Henert, U. Polymer 1999,40, 5303.
37. Kraus, A. J. Appl. Polym. Sci. 1984, 29, 75.
38. Jeon, H.S.; Rameshwaran, J.K.; Kim, G. J. Polym. Sci., Part B: Polym Phys. 2004, 42, 1000.
39. Rameshwaram, H.S.; Jeon, H.S.; Weinkauf, D.H. Polymer, 2003, 44, 5749.
40. Vu, Y.T; Mark, J.E.; Pham, L.H.; Engelhardt, M. J. Appl. Polym. Sci. 2001, 82, 1391.
41. VanderHart, D.L.; Asano, A; Gilman, J.W. Chem. Mater. 2001, 13. 3746.
42. Asano, A.; Shimizu, M.; Kurotsu, T. Chem. Letts. 2004, 33, 816.
43. Breakwell, I.K.; Homer, J.; Lawrence, M.; McWhinner, W.R. Polyhedron 1995, 14, 2511.
44. Gates, W.P.; Stucki, J.W.; Kirkpatrick, R.J. Phys. Chem. Minerals 1996, 23, 535.
45. Grandjean, J.; Bujdak, J.; Komadel, P. Clay Minerals 2003, 38, 367.
46. Kie, X.; Hayashi, S. J. Phys. Chem. B. 1999, 103, 5956.
47. He, H.P.; Frost, R.L.; Deng, F.; Zhu, J.X.; Wen, X.Y.; Yuan, P. Clays and Clay Minerals 2004, 52, 350.
48. Xiong, J.; Maciel, G.E. J. Phys. Chem. B 1999, 103, 5543.
49. Yamaguchi, N.; Shimazu, S.; Ichikuni, N.; Uematsu, T. Chemistry Letters 2004, 33, 208.
50. Kum, K.;Chajo, Y. J Mater Chem 2003, 13, 1384.
51. Mantz, R.A.; Jones, P.F.; Chaffee, K.P.; Lichtenhan, J.D.; Gilman, J.W.; Ismail, I.M.K.; Burmeister,M.J. Chem Mater 1996, 8, 1250.
19

52. Tanaka, Y.; Sakdapipanida, T.; Kowitteerawut, T.; Suchiva, K. Rubber Chem. Tech. 1999, 172,712.
53. Smith, T.L. Poly. Engin. Sci. 1977, 17, 129.
54. http://www.rtvanderbilt.com/ClayInRubber.pdf
20
Chapter 2
Strain Behavior of Cis 1,4-Polyisoprene-Montmorillonite ClayNanocomposites Monitored by Solid-State NMR
(Submitted to Journal of Applied Polymer Science, G.M. Poliskie, R.E.Cohen, K.K. Gleason)
21
Abstract
Previous work has focused on the use of microscopy to explore the mechanisms of deformation in polymer
nanocomposites. That technique creates a qualitative representation which may not be statistically
representative of the bulk properties. This paper illustrates the utility of solid-state NMR, which inherently
measures bulk behavior, to both identify and quantify mechanisms of deformation. Specifically, in this
study, increases in the interfacial area of various modifications of Cloisite® clay in 1,4-cis polyisoprene
nanocomposites were monitored during uniaxial compression. Interaction of the Fe +3 in the clay with the
polymer decreases the polymer's H spin-lattice relaxation time constant (Ti). In some of the
nanocomposites, the increase in the interfacial area of the clay platelets was observed by a decrease in the
polymer's TI with successive amounts of strain. The observation of these changes with static H NMR is
limited by the dispersion of the clay.
IntroductionTransmission electron microscopy (TEM) of elongated nylon-6 montmorillonite composites
indicated that individual clay layers of the aggregate could be pulled apart with macroscopic tensile strain.'
TEM allows for the qualitative observation of microscopic deformation; however, each individual
micrograph is not necessarily representative of the bulk composite. Furthermore, in order to quantitatively
determine changes in the interfacial area between the clay and the polymer, multiple micrographs would
have to be taken over the entire sample. In contrast, NMR is a technique which inherently averages the
bulk properties of the composite. Therefore, it is useful to explore the utility of NMR to identify and
quantify this mechanism of deformation in polymer nanocomposites.
Polyisoprene and polyisoprene composites have been the subject of a large number of studies
aimed at improving their mechanical properties due to their widespread industrial uses. 2-8 In particular,
clay nanocomposites have found a niche in the automotive and sporting good industries. 9 Clay has an
advantage over traditional fillers due to their larger aspect ratio, which allows for more interfacial contact
with the polymer. As a result of this higher aspect ratio, a clay nanocomposite has the capability of
improving strength with lower loadings than that used for traditional composites. 9
NMR has recently been used not only to identify structural changes in the polymer, but to
determine how these changes influence the macroscopic mechanical properties. In situ and quasi-static
22
experiments on a number of semi-crystalline and elastomeric polymers have explored the changes in
structure as a function of stress or strain.' 0 '3 Little work has focused on the mechanical and structural
effects of the addition of montmorillonite clay to polyisoprene. What has been reported has focused on the
well dispersed, surface modified clay in a crosslinked polyisoprene matrix. 14-16 NMR work on composites
has been limited to studies of the structural changes of the matrix polymer upon the addition of clay.'7 '19
Since polyisoprene is an elastomeric and not a semicrystlalline polymer, the addition of clay should not
significantly alter the morphology of the matrix. Furthermore, no NMR in situ mechanical measurements
have been reported on clay filled polyisoprene nancomposites. Therefore, this study investigates the use of
NMR to better understand the behavior of uncrosslinked polyisoprene nanocomposites under deformation.
Understanding this behavior will aid in optimizing the design of a mechanically desirable polyisoprene
nanocomposite. Furthermore, this study will illustrate the utility of solid-state NMR to quantitate changes
in the interfacial area between the clay and polyisoprene when the composite is deformed.
Experimental
Aldrich 97% cis 1,4-polyisoprene with weight average molecular weight 800,000 g/mol was used
as received. Cloisite®, a montmorillonite clay with varying surfactant modifications, was purchased from
Southern Clay Products. The surfactants on the clays included: methyl, tallow, bis-2-hydroxyethyl
quaternary ammonium (30B), dimethyl, dehydrogenated tallow quaternary ammonium (20A) and dimethyl,
hydrogenated tallow, 2-ethylhexyl quaternary ammonium (25A). All blends were solvent cast from a 1.1
wt% solution of polyisoprene in THF to which was added 0.15 wt% of the corresponding clay. After
solvent evaporation, the clay made up 13 wt% of the polymer nanocomposite. For those blends which
contained varying amounts of Na+ exchanged clay, the solution of polyisoprene in THF remained 1.1 wt%
and the solution of clay consisted of 0.23 wt%, 0.34 wt% and 0.45 wt% to make a 20wt%, 30wt% and
40wt% blends upon solvent evaporation, respectively.
Wide angle x-ray diffraction (WAXD) measurements were made on Riguku Ru300 x-ray
generator with Cu Kot radiation. The operating voltage was 60 kV with a current of 300 mA. Spectra were
taken, from thin films cast upon glass sides, in reflection mode at room temperature.
Transmission electron microscopy (TEM) was performed on a Joel 2000FX instrument. This
instrument had a lanthanum hexaboride filament operating at 200 kV. Samples were cryomicrotomed at -
23
130 °C to a thickness of 50 nm using a MT-X Ultramicrotome and a diamond knife. The samples were
collected on 400 mesh copper grids.
The mechanical data were acquired with an Instron Model 4201 operated in compression mode at
room temperature. The specimens were rectangular with dimensions: 0.2 in. x 0.2 in. x 0.4 in. Both the top
and bottom of the polymer specimen had a Teflon-polymer interface allowing for equal slip on both sides.
The deformation rate was 0.5mm/min. A 5 kN compression load cell was used for all tests.
All NMR spectra were taken with an Oxford 6.3 T magnet (with a 270 MHz IH resonance
frequency) using a Tecmag dual resonance pulse generator and receiver. Static H experiments were
performed on a home built probe with a 2jis n/2 pulse width. Spectra were acquired with a 10 gs dwell time
and a 5 s recycle delay. The static spectra, represented in Figure 3, were taken at room temperature and
the spin lattice relaxation times were taken at -10 °C ( ± 1C), unless otherwise noted. The nanocomposites
were compressed at room temperature and then the temperature was decreased for NMR acquisition. These
spectra were taken after a 10 minute wait for temperature equilibration and stress relaxation (Appendix 2).
The lower temperature was regulated with a N2 gas stream submerged in a dewar containing liquid N2.
The device used for static spectra in the presence of compressive strains was a Teflon rod 0.25 in.
in diameter and 1.00 in. in length. The polymer was placed in a threaded 0.18 in. diameter hole and
compression was induced by successive turns of the nylon screw. A Teflon spacer between the polymer
and screw allowed for slip at one end of the specimen while the bottom of the Teflon device created slip at
the other. Accordingly, the polymer specimens were rectangular with the dimensions of 0.09 in. x 0.09 in.
x 0.30 in.. After 40% compressive strain, there was clearance between the specimen's circumference and
the sides of the compression cell.
Spin-lattice relaxation time constants were measured using an inversion recovery sequence (-d -
n/2-Acq). A single least square exponential was fitted to the peak intensity (M) versus delay time (T),
resulting in a two parameter fit yielding: the equilibrium peak intensity (Mo) and the spin-lattice relaxation
time constant (TI) (Eq 1).20
Eq 1: M=M(1-2exp(-T/Tl))
Applying this single exponential, for the nanocomposites, resulted in an R2 value 2 0.99 in all cases. Each
fit consisted of 15 points from equally spaced delay times. All T, time constants are reproducible within
24
7% error. Simulations of line shapes for the static spectra were performed with the use of GRAMS®
software with three peaks used to represent the three chemically distinguishable protons. For the
homopolymer, simulated peaks were Gaussian with the full width half mass (FWHM) line widths extracted
from the simulation. A Lorentzian peak was used to simulate the lineshape for the various nanocomposites.
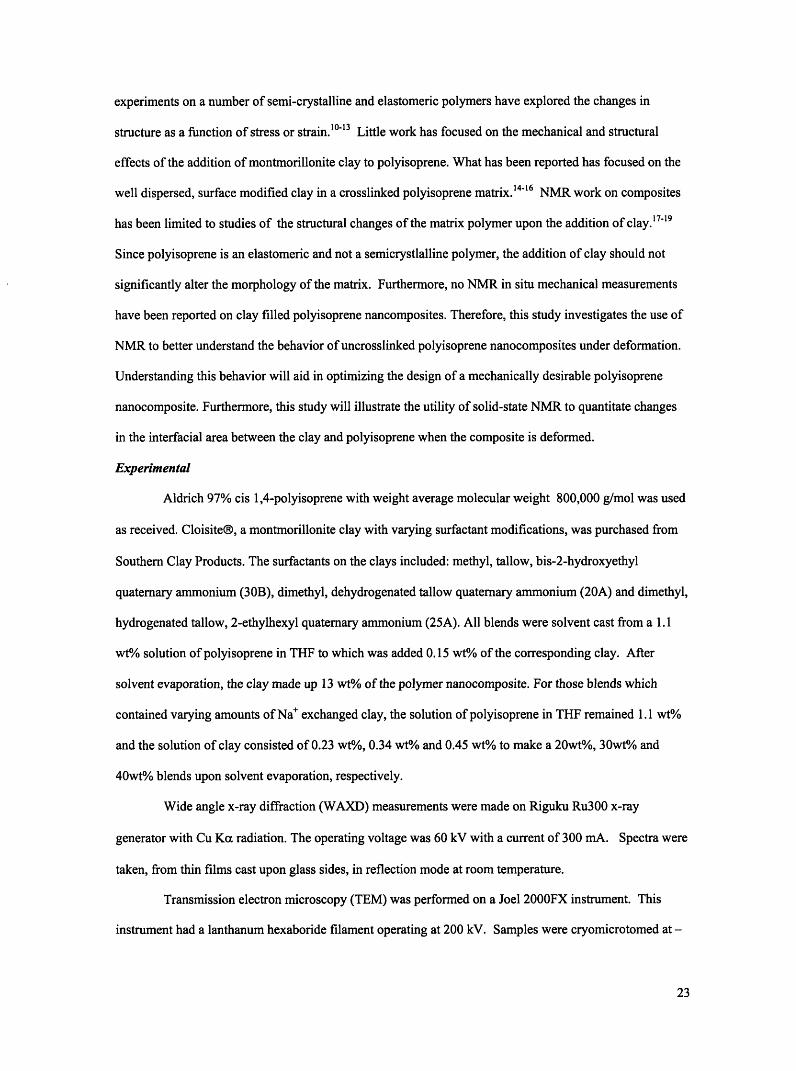
ResultsThere was no clear difference in the type of clay tactoids seen in the TEM as a function of
surfactant modification. Representative micrographs from the blend with the 30B surfactant are presented
in Figure 1. Figure la shows sheets of clay clustering in micron sized clumps. In Figure lb, single
exfoliated clay sheets can be observed surrounding smaller clusters.
Figure 1: TEM images of the cis 1,4-polyisoprene blended with 13 wt% 30B montmorilloniteprior to deformation
T.,
Figure 2 and Table 1 provide more quantitative details of the clay tactoids in the various blends.
Table 1: Comparison of WAXD spacing of cis 1,4-polyisoprene montmorillonite nanocomposites
Type of nanocomposite Clay dool spacing Nanocomposite dool spacing Change in dool spacing(nm) (nm) (nm)
Na+ 1.16 1.28 0.1230B 1.80 1.95 0.1520A 2.35 2.68 0.3325A 2.08 2.20 0.12
25
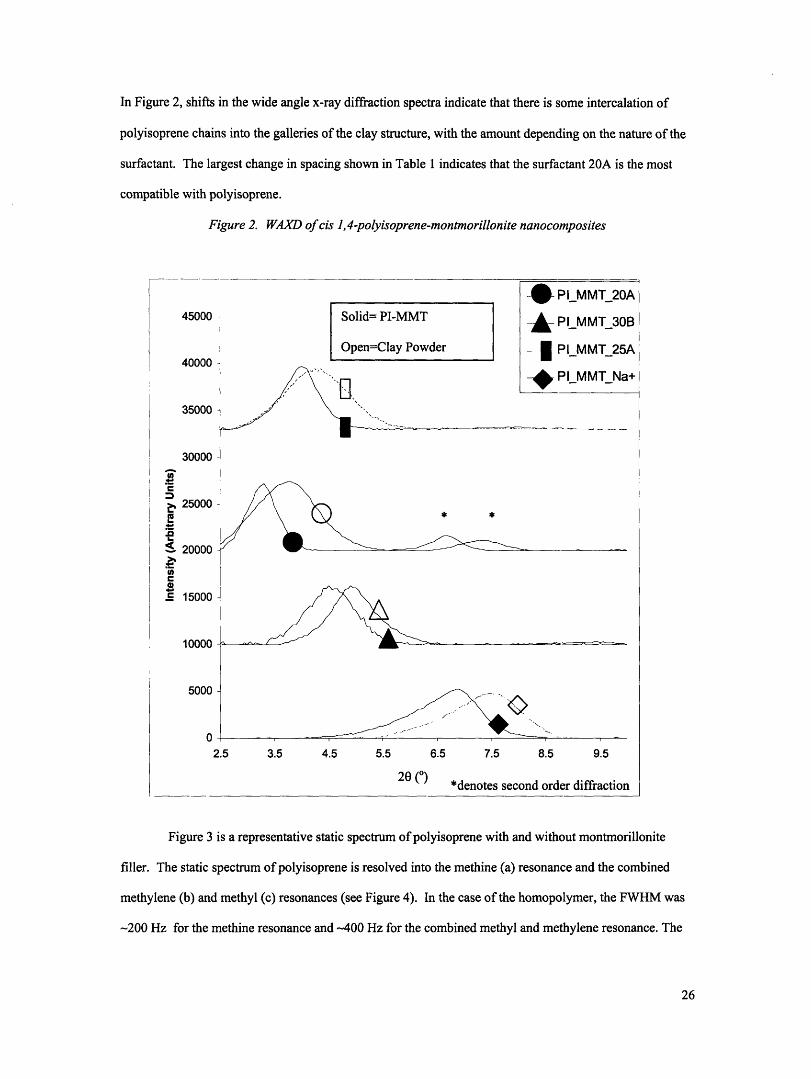
In Figure 2, shifts in the wide angle x-ray diffraction spectra indicate that there is some intercalation of
polyisoprene chains into the galleries of the clay structure, with the amount depending on the nature of the
surfactant. The largest change in spacing shown in Table 1 indicates that the surfactant 20A is the most
compatible with polyisoprene.
Figure 2. WAXD of cis 1,4-polyisoprene-montmorillonite nanocomposites
Solid= PI-MMT
Open=Clay Powder
-* PI_MMT_20A
_- PLMMT_30B
- PLMMT _25A
-4 PLMMT_Na+
* *
2.5 3.5 4.5 5.5 6.5 7.5 8.5 9.5
20 () *denotes second order diffraction
Figure 3 is a representative static spectrum of polyisoprene with and without montmorillonite
filler. The static spectrum of polyisoprene is resolved into the methine (a) resonance and the combined
methylene (b) and methyl (c) resonances (see Figure 4). In the case of the homopolymer, the FWHM was
-200 Hz for the methine resonance and -400 Hz for the combined methyl and methylene resonance. The
26
_--_--
45000
40000
35000
30000
._
, 25000.'
S 20000
)C
15000
10000
5000
0
__· ___
.
=___
_ -IE- - n
r--'---
C
broadening in the presence of clay causes a loss of spectral resolution of the methine versus the methylene
and methyl protons and increases the FWHM. The linewidths of the nanocomposites cluster into the two
groups consisting of: the less polar surfactants 20A and 25A, FWHM -3200 Hz, and the more polar
surfactant 30B and Na+ exchanged clay, FWHM -2800 Hz.
Figure 3: Static HNMR of cis 1,4-polyisoprene and cis 1,4-polyisoprene containing 13 wt% Na+
exchanged montmorillonite
a/b
I
-6000 -4000 -2000 0 2000 4000 6000
Hz
Figure 4. Structure of cisl,4-polyisoprene
aCH 3
/CH 2b
C
H
/C=C
CH2
b n
Figure 5 is a plot of the inverse of the measured T1 time constants versus the weight percent of Na +
exchanged clay. The T1 value decreased with increasing weight percent of clay at both temperatures of
-10 C and 0 C.
27
----- -- ------- --- -- ~__ __ __
----------------------------------------------------
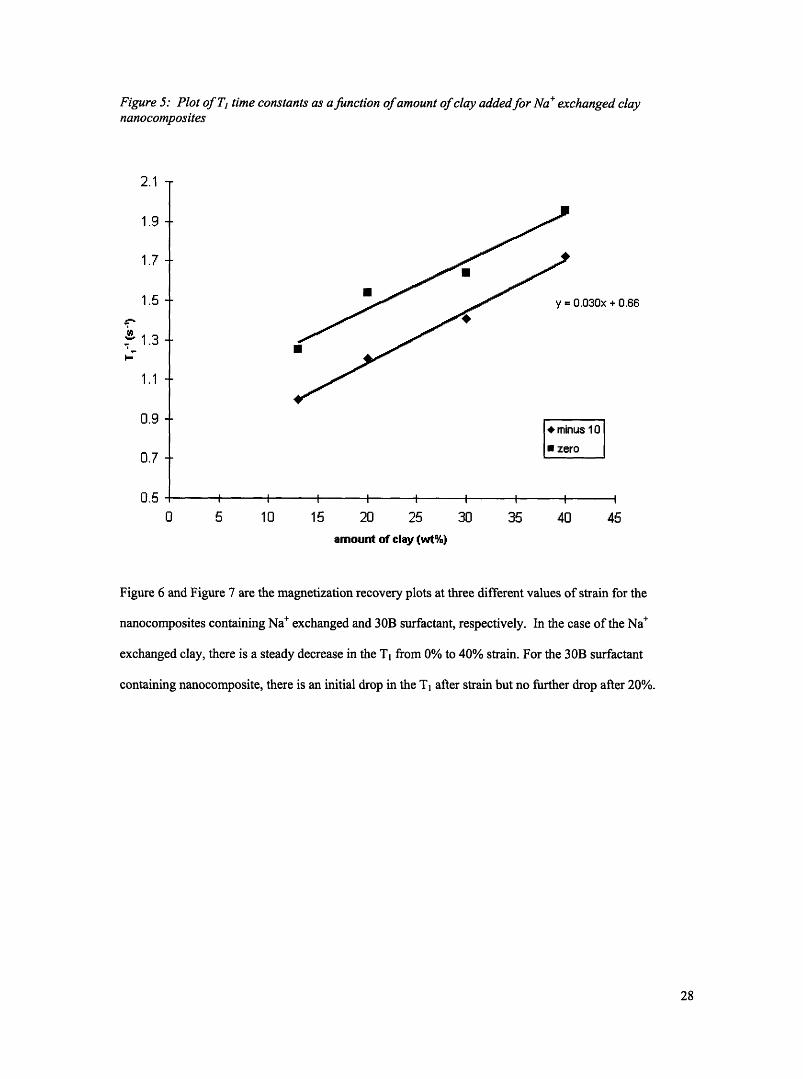
Figure 5: Plot of T. time constants as afunction of amount of clay addedfor Na+exchanged claynanocomposites
1 _/. I -
1.9 -
1.7 -
1.5 -
_ 1.3I.-
1.1 -
0.9 -
n7
0.5
0.030x + 0.66
+ minus 10
zero
0 5 10 15 20 25
amount of clay (wt%)
30 35 40 46
Figure 6 and Figure 7 are the magnetization recovery plots at three different values of strain for the
nanocomposites containing Na+ exchanged and 30B surfactant, respectively. In the case of the Na+
exchanged clay, there is a steady decrease in the T1 from 0% to 40% strain. For the 30B surfactant
containing nanocomposite, there is an initial drop in the T1 after strain but no further drop after 20%.
28
- _ · · · · · ·
I
i. I
I -- .- - -
Figure 6: Magnetization recovery curvefor cis 1,4-polyisoprene nanocomposites containing 13 wt% Na+
exchanged clay under compressive strains at -10 °C
800 0
ANa+ (strain 0%)ONa+ (strain 20%)o Na+ (strain 40%)
I T = 0.80 0.05 s
tau (ms)
Figure 7: Magnetization recovery curvefor cis 1,4-polyisoprene nanocomposites containing 13 wt% 30B
0
030B (strain 20%)a30B (strain 0%)o30B (strain 40%)
| T1 1.00 + 0.05 s
T]=0.82+0.05s
tau (ms)
29
0
-0.2
-0.4
-
: -03
-1
-1.2
-1.4
-1.6
I
I
0
-0.2
-0.4
- -0.6
o
C
-0.8
-1
-1.2
-
-
-
I T, = 00 ± 0.05 I
I T, = 0.73 0.05
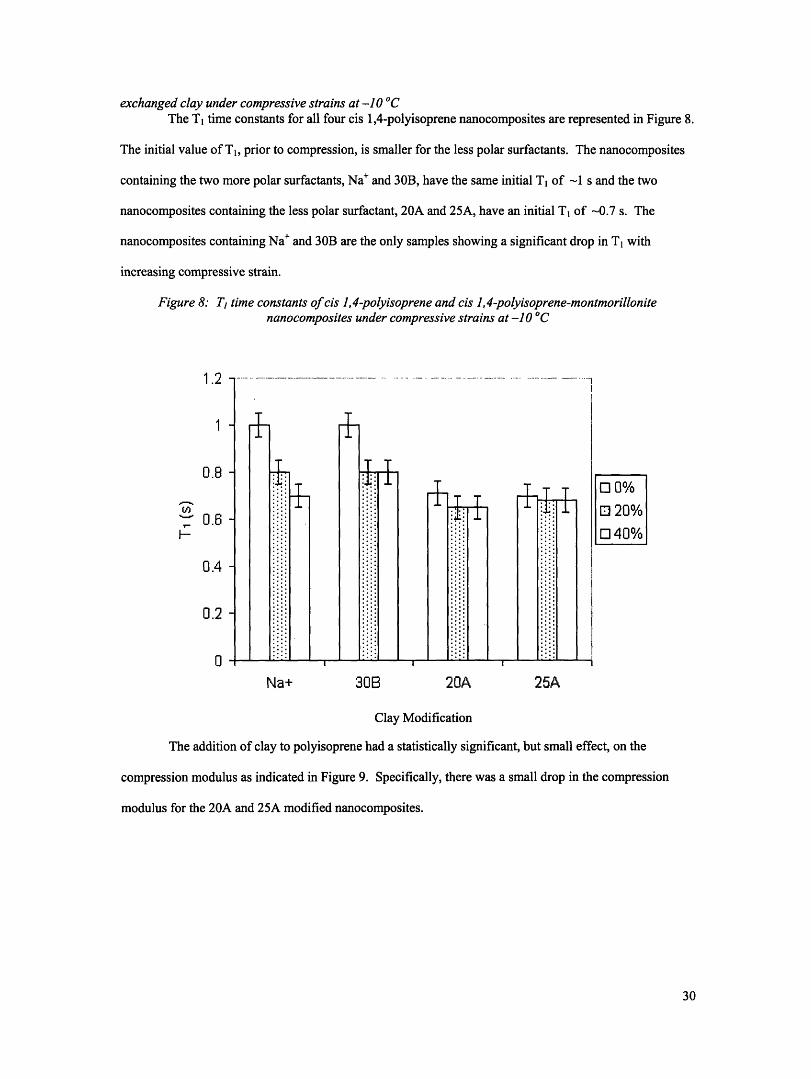
exchanged clay under compressive strains at -10 °CThe T1 time constants for all four cis 1,4-polyisoprene nanocomposites are represented in Figure 8.
The initial value of T, prior to compression, is smaller for the less polar surfactants. The nanocomposites
containing the two more polar surfactants, Na+ and 30B, have the same initial Ti of -1 s and the two
nanocomposites containing the less polar surfactant, 20A and 25A, have an initial T, of -0.7 s. The
nanocomposites containing Na+ and 30B are the only samples showing a significant drop in T1 with
increasing compressive strain.
Figure 8 T! time constants of cis 1,4-polyisoprene and cis 1,4-polyisoprene-montmorillonitenanocomposites under compressive strains at -10 °C
I .2
1
0.8
- 0.6
0.4
0.2
0Na+ 30B 20A 25A
Clay Modification
The addition of clay to polyisoprene had a statistically significant, but small effect, on the
compression modulus as indicated in Figure 9. Specifically, there was a small drop in the compression
modulus for the 20A and 25A modified nanocomposites.
30
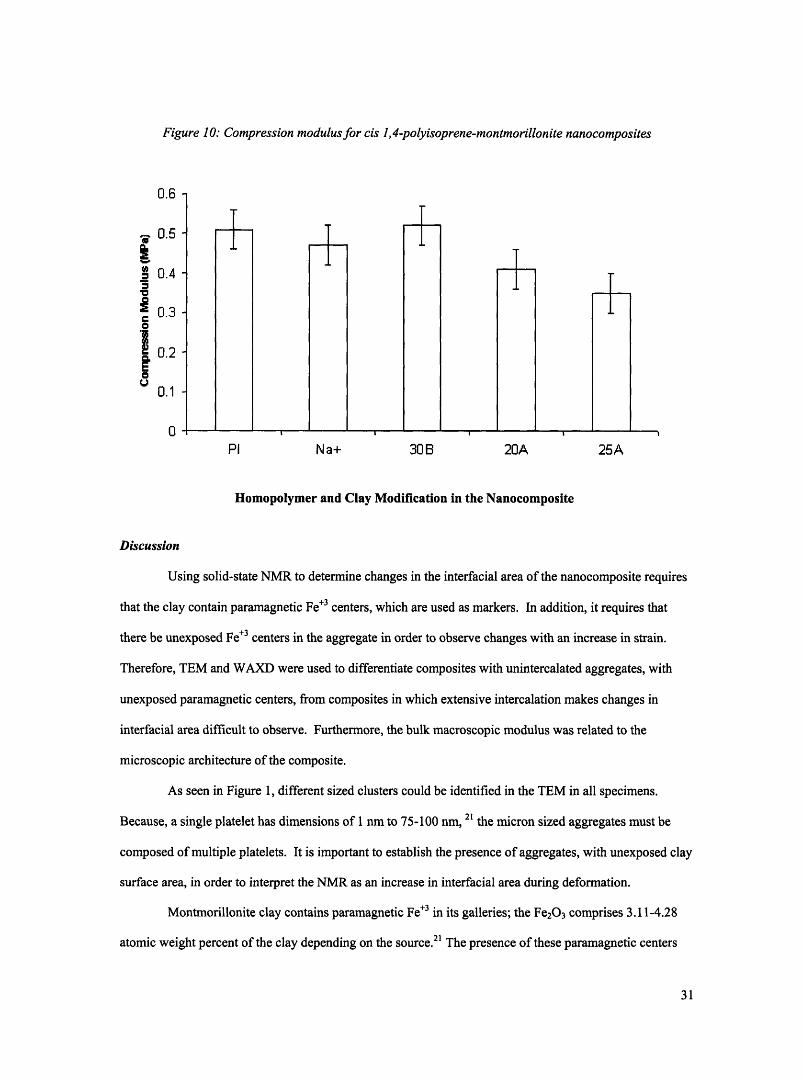
Figure 10: Compression modulus for cis 1,4-polyisoprene-montmorillonite nanocomposites
ri u.o
0.5
I 0.4
! 0.30
' 0.2
U0.1
O
Pi Na+ 30 B 20A 25A
Homopolymer and Clay Modification in the Nanocomposite
Discussion
Using solid-state NMR to determine changes in the interfacial area of the nanocomposite requires
that the clay contain paramagnetic Fe +3 centers, which are used as markers. In addition, it requires that
there be unexposed Fe+3 centers in the aggregate in order to observe changes with an increase in strain.
Therefore, TEM and WAXD were used to differentiate composites with unintercalated aggregates, with
unexposed paramagnetic centers, from composites in which extensive intercalation makes changes in
interfacial area difficult to observe. Furthermore, the bulk macroscopic modulus was related to the
microscopic architecture of the composite.
As seen in Figure 1, different sized clusters could be identified in the TEM in all specimens.
Because, a single platelet has dimensions of 1 nm to 75-100 nm, 21 the micron sized aggregates must be
composed of multiple platelets. It is important to establish the presence of aggregates, with unexposed clay
surface area, in order to interpret the NMR as an increase in interfacial area during deformation.
Montmorillonite clay contains paramagnetic Fe+3 in its galleries; the Fe20 3 comprises 3.11-4.28
atomic weight percent of the clay depending on the source.2 ' The presence of these paramagnetic centers
31
has important implications for the acquisition of NMR spectra. The linewidth is inversely related to the
inhomogeneous spin-spin relaxation, which is influenced by the homogeneity of the local magnetic field
around the observed nucleus. As noted in other systems, 22' 23 each paramagnetic center alters the local
magnetic field around it, increasing the linewidth.2 4 Figure 3 indicates that these local field gradients
broaden the spectrum, decreasing the spectral resolution of chemically inequivalent nuclei. Because of the
broadening, the T, time constants could not be assigned to a particular proton moiety. Instead the Tl values
describe the collective behavior of all the protons on the polymer.
The nanocomposites with the nonpolar surfactants, 20A and 25A, are expected to disperse better
in the polyisoprene matrix since their chemical structures more closely match that of the polymer.
Consistent with this logic, these two composites had a larger FWHM due to the greater distortion of the
local field created by the larger amount of exposed Fe+3 centers. This illustrates the utility of NMR to
identify improved dispersions caused by adding the appropriately modified clay.
For the nanocomposites, the T, time constant is a linear combination of variety of factors which
include, but are not limited to: paramagnetic centers, dipolar coupling, and chemical shift anisotropy (Eq
3).24
Eq 3: /T = l/Tipara+ l/Tianisotropy + l/Tldipolar
The chemical shift anisotropy for protons is small; 25 therefore, the dipolar coupling and the paramagnetic
effect are the two largest contributions to the T1 parameter. The paramagnetic contribution for a system
with spin diffusion has been worked out by others,2 4 2 6 the spin- lattice relaxation can be related to the
concentration of paramagnetic sites (N), the diffusion barrier length (b), and the spin diffusion constant (D)
(Eq 4). Therefore, as the polymer is exposed to more Fe+3 centers (N), within the diffusion barrier of 0.5
nm, 27 the contribution from the paramagnetic effect will increase and the measured H T, time constant of
the polymer will decrease.
Eq 4: /Tipara=4nNbD
As has been cited by other authors2 6-2 9 and according to Eq.4, a larger concentration of
paramagnetic centers lowers the T, value. Figure 5, shows that T, decreases when the weight percent of
clay increases, suggesting an increase in the amount of Fe+3 sites interacting with the polymer. The linear
regression to the data, at -10 °C, in Figure 5 is presented in Eq 5.
32
Eq 5: 1/Tlpa= 0.030 ± 0.002 (wt% clay) + 0.66 ± 0.03
The combination of Eq 3 and Eq 4 would create an equation of the same form as the linear
regression (Eq 5). However, the theory presented in Eq 4 was developed for a homogenous distribution of
paramagnetic centers with each center having a spherically symmetric interaction with neighboring spins.24
For these composites, each paramagnetic center is embedded in the clay platelet. Those centers buried in
the center of the aggregate will not influence the relaxation of the polymer's spins and those at the edges of
the aggregate will only be surrounded by polymer on one or two sides making their interaction with the
polymer non-spherical. Therefore, as cited by other authors' 8 this model cannot be rigorously used to find
an absolute concentration of paramagnetic centers; however, it does provide the correct functional
dependence to explain our observations and allows us to ratio the changes occurring as more paramagnetic
centers are exposed to the spins.
Figure 7 and Figure 8 show that the T1 decreases with an increase in compressive strain suggesting
an increase in the number of paramagnetic centers exposed to the polymer. This increase in number of
exposed centers is likely the result of a deformation of the clay aggregates. As the aggregates break apart
there is an increase in the interfacial area between the polymer and clay platelets.' The decrease in T, for
the Na+ exchanged nanocomposites after 40% of strain was -0.30 s, which from linear fit of Figure 5 (Eq
5), corresponds to a 226% increase in interfacial area. For the 30B exchanged nanocomposites, the
decrease was -0.20 s, corresponding to a 173% increase in interfacial area. Furthermore, experiments
indicated that when the strain is released the T1 does not change from its value at 40% strain. Therefore,
the increase in interfacial area is irreversible. This suggests that it is possible to improve the dispersion of
the clay by shearing the mixture when the clay is blended into the polyisoprene.
Improving the dispersion of clay increases the number of Fe+3 sites in contact with the polymer
and decreases the Ti time constant. Figure 9 indicates that the Na+ and 30B exchanged clay have a zero
strain T, (-1.00 s) higher than the zero strain T1 values (-0.70 s) of the 20A and 25A modified clay
composites. The 20A and 25A modifications are nonpolar and more closely match the nonpolar structure of
the polyisoprene, leading to more intercalation (Table 1). Better dispersion and the lower zero strain values
of the Ti time constants are consistent with more Fe+3 exposure to the polyisoprene. This increased
33
exposure means fewer unexposed paramagnetic centers prior to compression. As a result, there is no
significant increase in interactions between the polymer and the clay when the composite is compressed.
Thus, as seen in Figure 9, there were no significant changes in the spin lattice relaxation time constants
with increased strain for the 20A and 25A modifications.
More interactions between the polymer and filler and better dispersion would be expected to
produce an improvement in modulus of the samples. 9 Figure 9 shows clearly however, that the
compression modulus decreased meaningfully for the two samples containing the more compatible 20A
and 25A surfactants. The reason for this decrease lies in the anisotropic composite nature of the effective
filler particle when clay tactoids are present. There are substantial differences in the mechanical response
of clay-filler elastomers compared to more traditional carbon black filled compounds. In the latter,
favorable filler-polymer interactions lead to bound and occluded rubber which adds to the effective volume
filling capacity of the irreducible and non-deformable carbon black aggregates, thereby enhancing the
modulus. Intercalated clay tactoids are anisotropic and deformable; the amount of readily sheared material
in the interlamellar galleries, dependent on surfactant modification, directly influences the soft shearing
modes of deformation of the anistropic tactoids. Thus in the more compatible 20A and 25A blends, the
ease of the tactoid shearing overcompensates for any reinforcing effects of the filler and the modulus
decreases. It is also important to point out that better compatibility of surfactant and matrix polymer should
lead to an increased fraction of exfoliated clay sheets. As discussed in detail in a previous publication,
these exfoliated sheets do not augment the modulus as effectively as a particle containing several clay
sheets. Reasons for this non-reinforcing property of clay fillers include the very low value of effective
volume fraction per unit weight of clay when an isolated surfactant-modified clay layer is considered. In
addition, there is a tendency for exfoliated clay sheets to adopt easily-deformed curved configurations in a
polymer matrix.
Continuation of this work focused on the use of magic angle spinning to resolve the three
chemically distinguishable protons on polyisoprene and independently monitor changes in their interactions
with the clay interface (Appendix 3). There were no differences between the interactions experienced by
all three types of protons. Furthermore, confirming our results from the static spectra, increases in
34
interfacial area were observed with an increase in compressive strain. Application of the magic angle
spinning technique for compressed nanocomposites will be the focus of future publications.
ConclusionSolid state NMR, through measurements of spin-lattice relaxation times, can be used to quantify
the strain dependent evolution of interfacial area in clay-polyisoprene nanocomposites. Strain induced
evolution of interfacial area is dependent on the surfactant employed and therefore the initial amount of
intercalation by the polymer. In the clay-filled samples, soft modes of tactoid deformation compensated for
any reinforcing effect of the filler. In this case, with the more highly intercalated tactoids, a statistically
significant reduction in the modulus was observed.
Acknowledgement
The authors acknowledge funding from the US Air Force under Grant No. F49620-01-1-0447 withoutwhich this project would not be possible. In addition, the authors acknowledge the Center of MaterialScience (MIT-CMSE) for use of their microscopy and x-ray scattering facilities. A special thanks toProfessor Jeff Abes for assistance with TEM.
35
References1. Kim, G.M.; Lee, D.H.; Hoffmann, B.; Kressler, J.; Stoppelmann, G. Polymer 2001, 42, 1095.
2. Tucker, H. Encyclopedia of Chemical Technology, 3rd Ed; Wiley and Sons, Inc.:New York, 1979.
3. Tobolsky,A,V,; Prettyman, I.B.; Dillon, J.H. J Appl Phys 1944, 15, 380.
4. Mooney, M.; Wolstenhdue, W.E.; Villars, D.S. J Appl Phys 1944, 15, 324.
5. Choi, I.S.; Roland, C.M. Rubber Chem and Technol 1997, 70, 202.
6. Razumovski, S.D.; Podmastevev V.V.; Zaikov, G.E. Polym Degrad Stabil 1988, 20, 37.
7. Matsumiya, Y.; Watanabelt, K.; Osaki, K. Macromolecules 1999, 32, 6734.
8. Clarke, S.M.; Elias, F.; Terentjev, E.M. Eur Phys J E 2000, 2, 335.
9. Lincoln, D.M.; Vaia, R.A.; Wang, Z.G.; Hsiao, B.S. Polymer, 2001, 42, 1621.
10. Menge, H.; Hotopf, S.; Heuert, U.; Schneider, H. Polymer 2000, 41, 3019.
11. Loo, S.S.; Cohen, R.E.; Gleason, K.K. Macromolecules 1998, 31, 8907.
12. Hedden, R.C.; McCasey, E.; Cohen, C.; Duncan, T.M. Macromolecules 2001, 34, 3285.
13. McLoughlin, K.; Waldbieser, J.K.; Cohen, C.; Duncan, T.M. Macromolecules 1997, 30, 1044.
14. Vu, Y.T.; Mark, J.E.; Pham, L.H.; Engelhardt, M. J Appl Polym Sci 2001, 82, 1391.
15. Okada, A.; Usaki, A. Mat Sci Eng 1995, C3, 109.
16. Bala, P.; Samantaray, B.K.; Svivastava, S.K.; Nando, G.B. J Appl Polym Sci 2004, 92, 3583.
17. VanderHart, D.L.; Asano,A; Gilman, J.W. Chem Mat 2001, 13, 3796.
18. VanderHart, D.L.; Asano, A.; Gilman, J.W. Macromolecules 2001, 34, 3819.
19. Zax, D.B.; Yang, D.K.; Santos, R.A.; Hegemann, H. Giannelis, E.P.; Manias, E. J Chem Phys 2000,112, 2945.
20. Bruch, M.D. NMR Spectroscopy Techniques; Marcel Dekker: New York, 1996.
21. Personal communication with Southern Clay Products representative.
22. Bloembergen, N.; Morgan, L.O.; J Chem Phys 1961, 34, 842.
23. Henrichs, P.M.; Cofield, M.L.; Yound, R.H.; Hewitt, J.M. J Magn Reson 1984, 58, 85.
24. Abragam, A. Principles of Nuclear Magnetic Resonance; Oxford University Press: Oxford, 1961.
25. English, A; Dybowski, C.R. Macromolecules 1984, 17, 447.
26. Labouriau, A.; Kim, Y.; Earl, L. Phys Rev B 1996, 54, 9952.
27. Bryar, T.R.; Daughney, C.J.; Knight, R.J. J Magn Reson 2000, 142, 74.
36

28. Nestle, N.; Zimmermann, C.; Dakkouri, M.; Karger, J. J Phys D Appl Phys 2002, 35, 166.
29. Klempt, T.; Kanert, O.; Suter, D. Phys Status Solidi B 2003, 236, 151.
30. Sheng, N; Boyce, M.C.; Parks, D.M.; Rutledge, G.C.; Abes, J.I.; Cohen, R.E. Polymer 2004, 45, 487-506.
37
Chapter 3
Strain Behavior of Cis 1 ,4-Polyisoprene-Laponite ClayNanocomposites Monitored by Solid-State NMR
(To be submitted to Journal of Applied Polymer Science, G.M. Poliskie,K.K. Gleason)
38
Abstract
In order to illustrate the capacity of NMR to monitor compression induced changes in the morphology of
nanocomposites, solid-state NMR results were directly contrasted to optical microscopy. Increases in the
interfacial area of Laponite® clay in cis 1,4-polyisoprene composites were monitored during uniaxial
compression. Interaction of the Co+2 in the clay galleries with the polymer decreases the polymer's H spin-
lattice relaxation time constant (Tl). The composite showed a decrease in T, time constant with increasing
compressive strain. This behavior is consistent with an increase in interfacial area of the aggregate as it
breaks apart. Increases in interfacial area of the aggregate were confirmed with optical micrographs.
Introduction
Many researchers have shown improvements in the mechanical properties of polymers with the
addition of nanoclay fillers.' 4 In such instances, there is a desire to link morphological changes in the
composite with the increase in macroscopic strength. Due to the nanodimensions of the clay, the primary
technique used to monitor these changes has been transmission electron microscopy (TEM). In particular,
Kim, et.al. used TEM to analyze changes in the clay aggregates in a nylon- 12 matrix prior to and post
mechanical deformation.5 Although TEM has the correct resolution to directly observe the clay platelets,
the sample preparation is tedious and statistical sampling can be time consuming, as it requires numerous
sections from multiple samples. Therefore, there is a desire to identify alternative characterization
techniques.
A number of groups have used nuclear magnetic resonance (NMR) to characterize the molecular
structure of polymer-clay composites and clay nanofillers. Studies by Zax, et. al. explored the topological
constraints of polystyrene chains confined between two clay platelets. 6 In order to separately observe the
polystyrene adjacent to the clay from that centered in the galleries, various segments of the composite were
isotopically labeled. It was found that the polystyrene closest to the clay surface experienced slower
motions than those in the bulk. Gates, et. al. have attempted to correlate changes in NMR parameters, such
as spin-lattice relaxations and chemical shift, to the oxidation state of the iron in the clay.7 In its highest
oxidation state, Fe+3, iron is paramagnetic and increases the relaxation of surrounding nuclei. Using these
principles, VanderHart, et. al. have used the paramagnetic centers, Fe+3, of natural occurring clay to
identify the morphology of nylon-6 chains adjacent to the clay surface.8 In that case, it was found that the
39
stability of the crystalline phase is dictated by the presence of the clay. These various morphologies were
monitored using the spin-lattice relaxation, while the composite was spun at the magic angle. In those
instances the magic angle spinning was used to resolve the resonances of nuclei in different crystalline
phases. As will be discussed in further detail later, in addition to increasing spectral resolution, magic
angle spinning also disrupts the spin diffusion between regions of different magnetic behavior. In this
study, magic angle spinning was employed in order to independently monitor two regions of the composite:
the polymer surrounding the clay versus the bulk polymer far removed from the clay.
If NMR were used to study strain induced morphological changes in the clay composites, a single
experiment would yield quantitative and statistically representative data. In order to illustrate the capacity
of NMR to quantitate changes in the shape of the clay aggregates, the NMR behavior was compared to
optical measurements were the break-up of clay aggregates could be directly observed. In situ compression
measurements were induced while observing the polyisoprene-Laponite® composite using NMR and
optical microscopy. For NMR experiments, a novel compression device was constructed; while for optical
microscopy, the polymer was compressed between two glass slides. Polyisoprene-Laponite® composites
are a particularly useful system for optical microscopy; because, the polymer is translucent and the clay
aggregates are micron sized. However, the observed correlation between the microscopy and NMR
techniques, suggests the NMR could be independently used to quantitative changes in composites with
smaller aggregates and opaque polymer matrices.
NMR Background
Previous work has highlighted the utility of static proton NMR to monitor the changes in
interfacial area for polyisoprene-montmorillonite nanocomposites. 9 The results from that study and this
study are not directly comparable due to differences in both the location of the paramagnetic ions and the
NMR techniques employed.
In order for NMR to be used to monitor changes in interfacial area, the clay must contain
paramagnetic centers. Montmorillonite is a natural occurring clay with paramagnetic Fe+3 embedded in the
clay structure. Conversely, Laponite® is a synthetic clay with no paramagnetic centers in its structure.'0
Therefore, for this study the intergallery cation was exchanged with paramagnetic Co+2. The coupling of
the paramagnetic ions with the protons on the polymer is inversely related the distance between them raised
40
to the sixth power.1 Thus, the difference in the placement of the paramagnetic center alters its strength of
interaction with the surrounding polymer. In addition, when the inter-gallery ions are exchanged only the
polyisoprene in the immediate vaccinate of the gallery will be exposed to paramagnetic centers. In
comparison, when the paramagnetic center is embedded in the clay any chains in proximity to any side of a
platelet will be affected by the paramagnetic center. Therefore, this technique may underestimate the total
polymer-clay surface area but it is an equally accurate method for the determination of the changes in the
surface area.
Employing magic angle spinning (MAS) while observing a compressed composite has certain
advantages over static measurements. In analogy to previous NMR analysis of composites,'12 13 the
polysioprene-Laponite® composites is anticipated to have two spatially distinct regions: those polymer
chains close to the paramagnetic centers in the clay and those far removed from the clay. Each region of
polymer has a characteristic magnetic behavior. When the composite is monitored by static spectra, spin
diffusion occurs allowing the two regions to communicate and experience an averaged magnetic behavior.
When monitored with MAS, spin diffusion is hindered reducing this communication.' l"5 In the limit of
very slow spin diffusion between regions, the individual components can be monitored independently and
MAS can be employed to understand how a specific region of the composite responds to compressive
strain.
The rate of change in the polarization (p) of the spins within the sample is dependent on two
terms: spin diffusion (D) and direct coupling (C ). The polarization is both a function of the distance
between spins (r) and time (t) (Eq 1).15
Eq 1: p(r,t) = DV2p(r,t) - C(p(r,t) -p)'lr -r r6'Ot n
For static experiments, it is expected that the spin diffusion and direct coupling would both contribute to
changes in the polarization of the sample. For MAS, at speeds faster than the dipolar coupling constant, the
dipolar coupling is averaged to zero over the cycle of a rotor period, hindering spin diffusion. 15-17
Therefore, polarization of spins closest to the paramagnetic Co+2 will only be affected by direct coupling
(Eq 2). 14 ' 18
41
Eq2: dt (rt)= -c(p(rt)- po)lr- rnr-edt n
The polarization of the spins is related to the experimentally observed magnetization (M(t)) through
integration of polarization over the sample volume (Eq 3).18
Eq 3: Mz(t) = p(r, t)d3r
This equation has been solved by numerous authors to determine the relationship between the
magnetization (M(t)) as a function of time (t) (Eq 4).18, 21
Eq4: M(t)= (-7 r/2N Ci2tt2 for t<b6 /C3
In this case, the magnetization is a function of: the concentration of paramagnetic centers (Np), the coupling
constant (C) between the paramagnetic center and the proton and the time (t) elapsed after the
magnetization is perturbed. This relationship suggests a plot of magnetization as a function of time should
be linear when the delay time is less than the ratio of the sixth power of the spin diffusion barrier to the
coupling constant. Typical values for b and C are 0.6 nm and lx10-41 cm 6/s, 21 respectively, so that a delay
time less than 5 ms is required.
Although long range spin diffusion is interrupted with MAS, the large dipolar coupling constants
are not completely averaged by MAS allowing some short range diffusion to remain, as would be the case
for spins from the clay surface into the adjacent surrounding polymer can be estimated from the one
dimensional diffusion equation (Eq 5)."
Eq 5: X = (2Dt) /2
To estimate the length scale that such short range diffusion would operate under MAS, the root mean
squared distance (X) was computed using a diffusion time for the spins closest to the clay (Tl=t=30 ms)
and the diffusion constant (D). An approximation of the diffusion constant (0.005 nm2 /ms) was taken from
the MAS narrowed linewidth. 2 0 A region of polymer (X) equal to -1.1 nm affected by the presence of the
Co+2 in the clay galleries. This total region of-l. 1 nm includes a barrier diffusion length of 0.6 nm in
which the spins cannot be directly observed.
42
Experimental
Aldrich 97% cis 1,4-polyisoprene (Mw =790,000 g/mol, PDI=2.0) was used as received.
Laponite® XLG grade synthetic clay was purchased from Southern Clay Products. The Na + in the
Laponite® galleries was exchanged with paramagnetic Co+2 by dissolving the clay in an aqueous
supersaturated solution of cobaltous chloride. The exchange was monitored by wide angle x-ray
diffraction. The basal spacing changed from 1.4 nm for Na + to 1.1 nm for Co +2. Wide angle x-ray
diffraction (WAXD) measurements were made on Riguku Ru300 x-ray generator with Cu Ka radiation.
The operating voltage was 60 kV with a current of 300 mA. Spectra were taken in reflection mode from
powder on glass slides.
All blends of polyisoprene and clay were solvent cast from a 1.1 wt% solution of polyisoprene in
THF to which was added 0.15 wt% of the corresponding clay. After solvent evaporation, the clay made up
13 wt% of the polymer nanocomposite. All experiments and characterization were performed at room
temperature.
Optical microscopy was performed on Olympus CX41microscope with attached digital camera.
The uncompressed polyisoprene-Laponite® composite had dimensions of 0.1 95"x0. 195"x0. 195" and was
observed between two glass slides held at a fixed distance (0.195" + 0.002"). The sample was compressed
by decreasing the distance between the slides (0.1 17" ± 0.002") so that 40% strain was applied to the
polymer. The reported circumference measurements are a statistical representation from three specimens
from each sample and were made with Scion Image® software. The circumference is obtained from the
number of pixels surrounding a circular object.
Environmental scanning electron microscopy (SEM) was performed on a Joel 2000FX instrument.
Images were taken from a cryo-fractured surface as the polymer sat on a glass slide.
The device for in-situ NMR compression was constructed from a Teflon rod 0. 15" in diameter and
1.00" in length. A Teflon spacer between the polymer and screw allowed for slip at one end of the
specimen while the bottom of the Teflon device facilitated slip at the other. The specimen for these
experiments had rectangular dimensions of 0.05" x 0.05" x 0.30". For all experiments, at 40%
compressive strain, there was clearance between the polymer's circumference and the sides of the
compression cell.
43
All NMR spectra were taken at room temperature with an Oxford 6.3 T magnet (with a 270 MHz
'H resonance frequency) using a Tecmag dual resonance pulse generator and receiver. Magic angle
spinning (MAS) spectra were taken with a Chemagnetic 7.5mm probe with a 4is 7r/2 pulse width and a
spin speed of 2500 Hz. Spectra were acquired with a 10 s dwell time and a 5 s recycle delay at room
temperature and taken after a 10 minute wait for stress relaxation. Proton chemical shifts are reported to
tetramethylsilane (0 ppm). Magnetization recovery curves were measured using an inversion recovery
sequence (r-t -/2-Acq). The magnetization of the spins (M(t)) was monitored as a function of delay time
(t).
DiscussionRepresentative optical (la) and SEM (lb) micrographs are presented in Figure 1. Both
micrographs indicate the clay forms in micron sized clumps. Since a single platelet has a thickness of 1 nm
and a radial length which varies between 25-75 nm,'0 the clumps must be composed of many clay platelets.
This suggests that, prior to deformation, there are unexposed Co2+ centers in the aggregate which are not
interacting with the protons on the polymer. It is important to establish the existence of these unexposed
cobalt centers in order to interpret the NMR under deformation.
b) of the polyisoprene- Laponite® composite
44
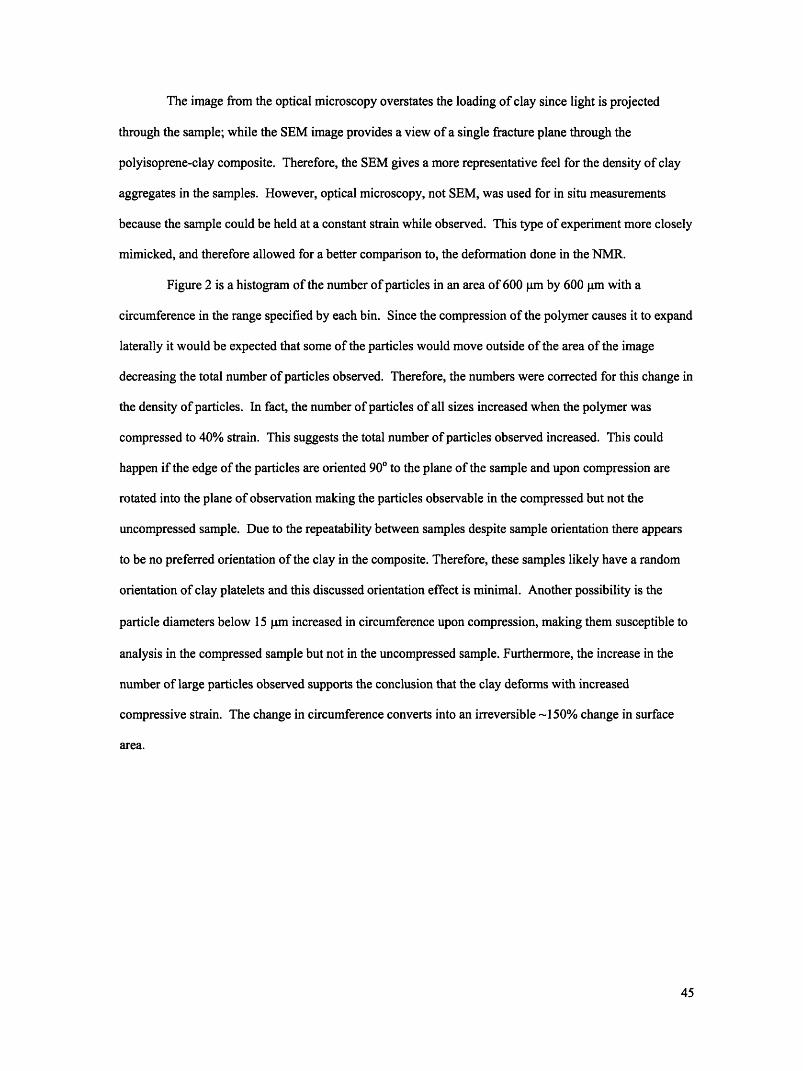
The image from the optical microscopy overstates the loading of clay since light is projected
through the sample; while the SEM image provides a view of a single fracture plane through the
polyisoprene-clay composite. Therefore, the SEM gives a more representative feel for the density of clay
aggregates in the samples. However, optical microscopy, not SEM, was used for in situ measurements
because the sample could be held at a constant strain while observed. This type of experiment more closely
mimicked, and therefore allowed for a better comparison to, the deformation done in the NMR.
Figure 2 is a histogram of the number of particles in an area of 600 Pnm by 600 gm with a
circumference in the range specified by each bin. Since the compression of the polymer causes it to expand
laterally it would be expected that some of the particles would move outside of the area of the image
decreasing the total number of particles observed. Therefore, the numbers were corrected for this change in
the density of particles. In fact, the number of particles of all sizes increased when the polymer was
compressed to 40% strain. This suggests the total number of particles observed increased. This could
happen if the edge of the particles are oriented 90 ° to the plane of the sample and upon compression are
rotated into the plane of observation making the particles observable in the compressed but not the
uncompressed sample. Due to the repeatability between samples despite sample orientation there appears
to be no preferred orientation of the clay in the composite. Therefore, these samples likely have a random
orientation of clay platelets and this discussed orientation effect is minimal. Another possibility is the
particle diameters below 15 lim increased in circumference upon compression, making them susceptible to
analysis in the compressed sample but not in the uncompressed sample. Furthermore, the increase in the
number of large particles observed supports the conclusion that the clay deforms with increased
compressive strain. The change in circumference converts into an irreversible -150% change in surface
area.
45
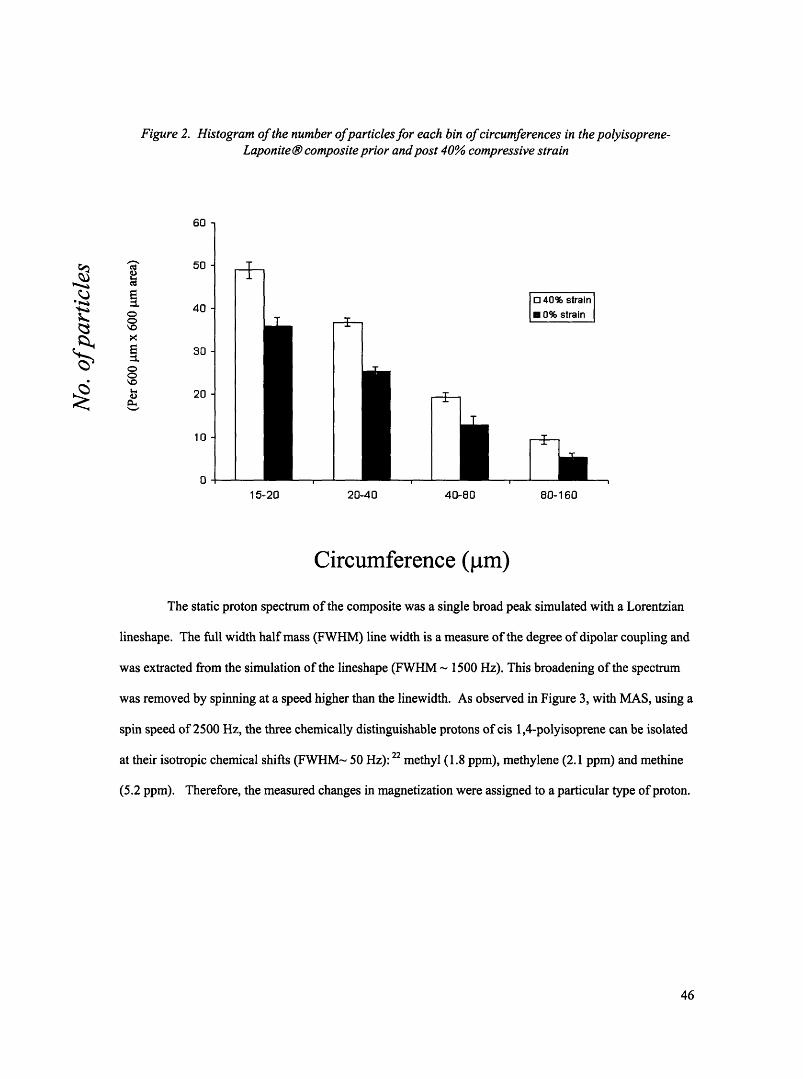
Figure 2. Histogram of the number ofparticles for each bin of circumferences in the polyisoprene-Laponite 0 composite prior and post 40% compressive strain
60-
C-
00Co0o\Ox
8
0I-O
vc
40-
30-
20
10-
0-15-20
E 40% strain0% strain
20-40 40-80 80-160
Circumference (pm)
The static proton spectrum of the composite was a single broad peak simulated with a Lorentzian
lineshape. The full width half mass (FWHM) line width is a measure of the degree of dipolar coupling and
was extracted from the simulation of the lineshape (FWHM - 1500 Hz). This broadening of the spectrum
was removed by spinning at a speed higher than the linewidth. As observed in Figure 3, with MAS, using a
spin speed of 2500 Hz, the three chemically distinguishable protons of cis 1,4-polyisoprene can be isolated
at their isotropic chemical shifts (FWHM- 50 Hz): 22 methyl (1.8 ppm), methylene (2.1 ppm) and methine
(5.2 ppm). Therefore, the measured changes in magnetization were assigned to a particular type of proton.
46
Ti
F-I--1 -I
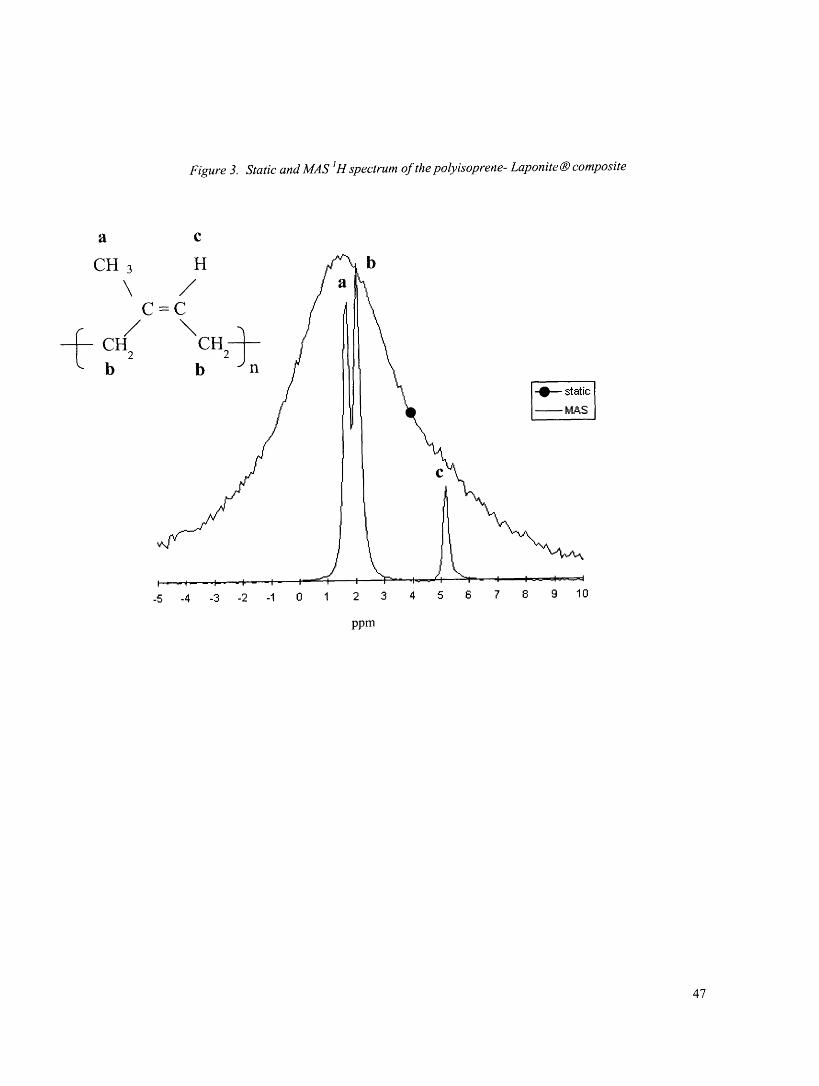
Figure 3. Static and MAS 'H spectrum of the polyisoprene- Laponite® composite
a c
bCH 3
C
' CH2b
-5 -4 -3 -2 -1 0 1 2 3 4 5 6 7 8 9 10
ppm
47
ic
s
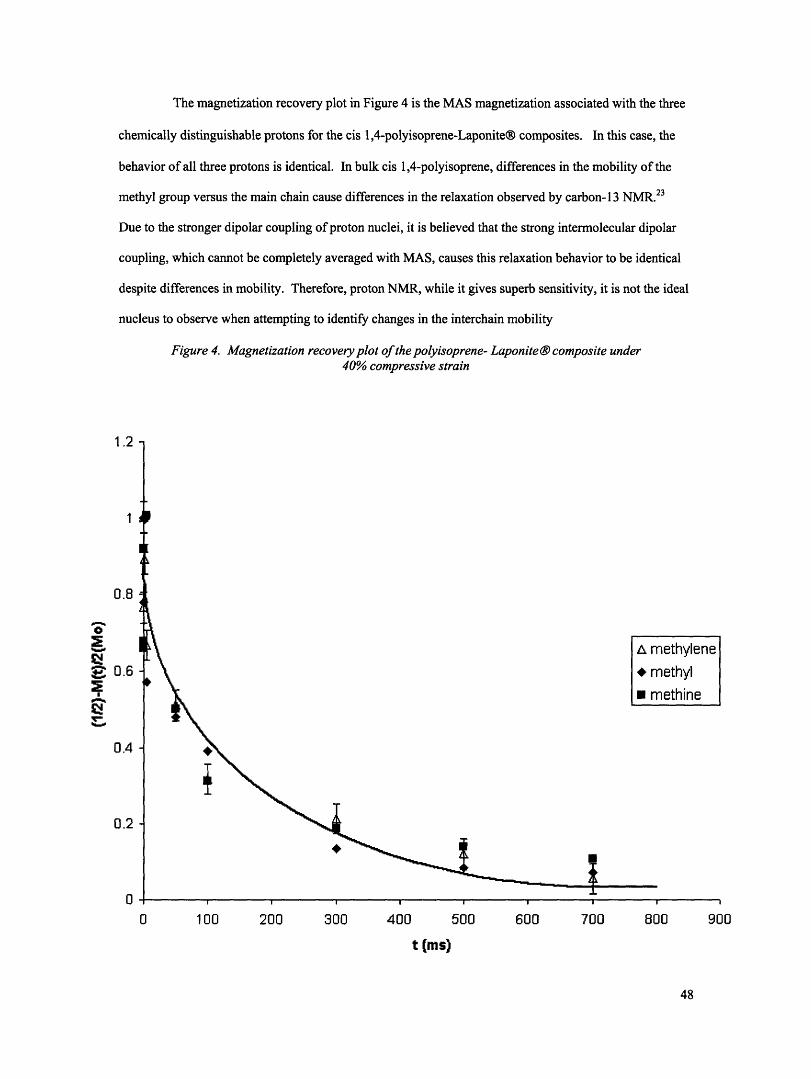
The magnetization recovery plot in Figure 4 is the MAS magnetization associated with the three
chemically distinguishable protons for the cis 1,4-polyisoprene-Laponite® composites. In this case, the
behavior of all three protons is identical. In bulk cis 1,4-polyisoprene, differences in the mobility of the
methyl group versus the main chain cause differences in the relaxation observed by carbon- 13 NMR. 23
Due to the stronger dipolar coupling of proton nuclei, it is believed that the strong intermolecular dipolar
coupling, which cannot be completely averaged with MAS, causes this relaxation behavior to be identical
despite differences in mobility. Therefore, proton NMR, while it gives superb sensitivity, it is not the ideal
nucleus to observe when attempting to identify changes in the interchain mobility
Figure 4. Magnetization recovery plot of the polyisoprene- Laponite® composite under40% compressive strain
1.2
1
0.8
0
I o
0.6
0.4
0.2
0
0 100 200 300 400 500 600 700 800
t (ms)
900
48
I
As discussed above, in addition to this improved resolution, the removal of dipolar broadening
will alter the observed relaxation behavior of the nuclei and allow for independent observation of regions
with different magnetization. Bloomberg, et. al.,'4 found that when using MAS on a heterogeneous
distribution of paramagnetic centers, the relaxation behavior is best described by a linear combination of
two functions, each describing a different component of the system. In the case of a homogenous
distribution of paramagnetic centers, where direct coupling dominates the relaxation, a single linear fit of
t/2 is used 15 (R2 -0.92). In homogenous materials, such as homopolymers, spin diffusion dominates, and
the relaxation is described by a decaying exponential (R2 -0.82). The data in Figure 3 can best be described
by a combination of a short time region which follows t 2 decay behavior, describing polymer adjacent to
the clay, and a second region which follows an exponential decay behavior (Eq 6) at long times, describing
polymer far removed from the clay (R2-0.99).14
M(t) 4 r3 /2 1/2I/ 2Eq6: -=( NC t )(-+(1 ¢xp(- ))
M. 3
As seen in Figure 4, at long times the magnetization of each of the chemically distinguishable
protons can be described by an exponential decay. As suggested by other authors, 4' 25 this exponential
effect is the behavior of the spins far removed from the paramagnetic centers and weakly influenced by
their presence. As a function of strain, this long time behavior is identical to that of the homopolymer
(Appendix 7). This behavior will be the focus of future publications. However, for now our focus will be
on the polymer around the clay aggregates. Specifically, the data obtained in the linear region of the
magnetization recovery curve, t< 5ms, will be the focus of the rest of this discussion.
The normalized magnetization, for the short time delay, is plotted against the square root of time
in Figure 5. The results presented are from the methylene resonance, but these slopes are representative of
all three types of protons. An increase in the number of paramagnetic centers (Np), interacting with
proton's spins on the polyisoprene, will increase the slope (Eq 4 & Eq 5). It has been observed by other
authors,5' 9 that clay clusters break apart upon macroscopic deformation. This deformation would increase
the interactions between the protons and the paramagnetic centers due to the increase in interfacial area
between the polymer and the clay aggregate. The slopes of the lines increase from -0.15 + 0.02 s' for 0%
49
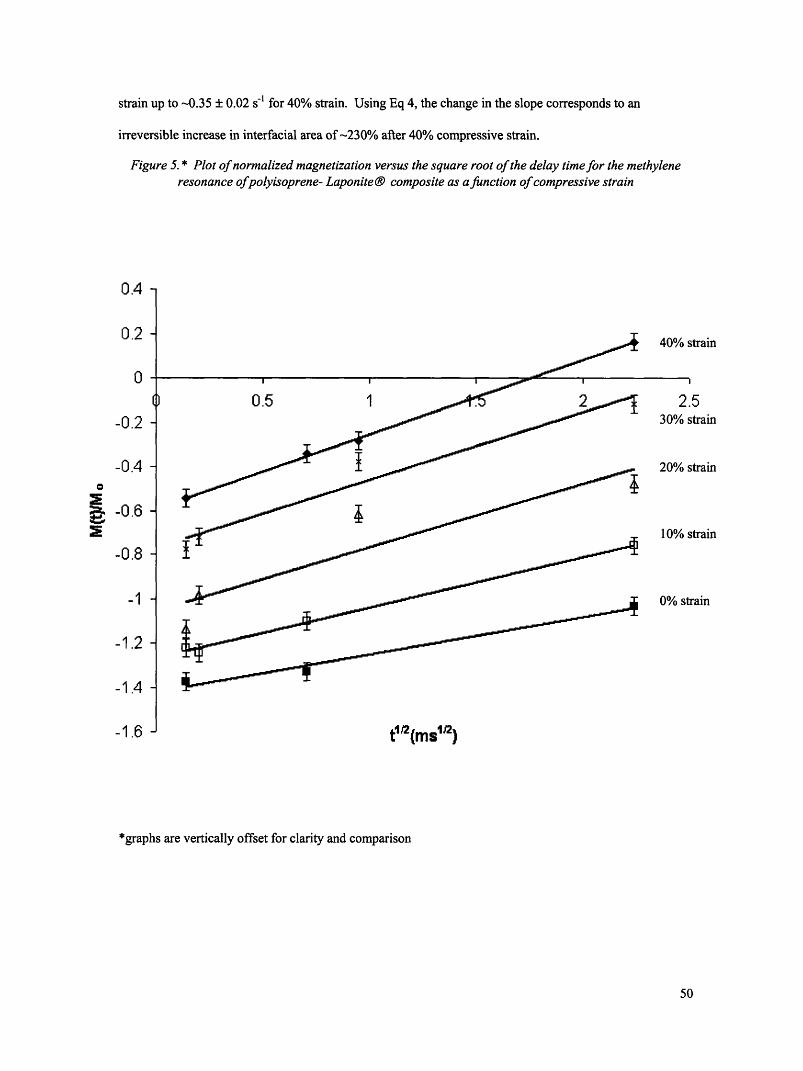
strain up to -0.35 + 0.02 s'- for 40% strain. Using Eq 4, the change in the slope corresponds to an
irreversible increase in interfacial area of -230% after 40% compressive strain.
Figure 5. * Plot of normalized magnetization versus the square root of the delay time for the methyleneresonance ofpolyisoprene- Laponite® composite as a function of compressive strain
0.4
0.2
0
-0.2
-0.4
-0.6
-0.8
-1
-1.2
-1.4
-1.6
train
5train
train
train
rain
*graphs are vertically offset for clarity and comparison
50
C
E.9
Day et. al. have had success matching absolute paramagnetic concentrations measured with NMR
to those measured with elemental analysis.2 5 In those instances, the interaction between the paramagnetic
centers and the observed nucleus was spherically symmetric. The theory presented in Eq 4 was developed
for a homogenous distribution of paramagnetic centers in which each center has a spherically symmetric
interaction with its neighboring spins.' 4 For these composites, each paramagnetic center is embedded
between the clay platelets. Those ions buried in the center of the aggregate will not influence the relaxation
of the polymer's spins and those at the edges of the aggregate will only be surrounded by polymer on one
or two sides making their interaction with the polymer non-spherical. Therefore, as cited by VanderHart,
et. al., 8 this model cannot be rigorously used to find an absolute concentration of paramagnetic centers;
however, it does provide the correct functional dependence to explain our observations and allow us to ratio
the changes occurring as more paramagnetic centers are exposed to spins.
The -150% increase in surface area observed with optical microscopy is lower than the -230%
increase observed by NMR. Since NMR identifies changes in the bulk while microscopy identifies
changes near the surface, it is not surprising that the increase in interfacial area observed by these two
techniques is different. However, both techniques illustrate that the break-up of clay aggregates is a mode
of deformation when these composites are compressed.
Conclusions
Through measurements of spin-lattice relaxation times, solid-state NMR can be used to quantify
the strain dependent evolution of interfacial area in polyisoprene-clay composites. With the use of MAS,
changes which occurred around the clay aggregates were isolated from the behavior of polymer far
removed from the clay. The optical micrographs confirmed that the aggregates broke apart upon
compressive strain. The quantitative changes observed with NMR represent changes occurring in the bulk
while the optical micrographs represent changes near the surface.
The correlation between NMR and optical microscopy indicates, with certainty, that NMR
relaxation measurements can be used to quantify differences in interfacial area of nanocomposites. With
this being established, the techniques developed in this paper could be applied to analyze strain induced
changes in interfacial area for samples which are not optically clear or samples in which the particle
dimensions make microscopy techniques difficult.
51

Acknowledgement
The authors acknowledge funding from the US Air Force under Grant No. F49620-01-1-0447. This work
also made use of MRSEC Shared Facilities supported by the National Science Foundation under Award
Number DMR-9400334.
52
References:
1. Usuki, A.; Koiwa, A; Kojima, Y.; Kawasumi, M; Okada, A; Kurauchi, T.; Kamigato, O. J. of Appl PolySci 1995, 55, 119.
2. LeBaron, P.C.; Pinnavaia, T.J. Chem. Mater. 2001, 13, 3760.
3. Wang, S.; Li, Q.; Qi, Z. Key Eng Mater 1998, 137, 87.
4. Gloaguen, J.M.; Lefebure, J.M. Polymer, 2001, 42, 5841.
5. Kim, G.M.; Lee, D.H.; Hoffmann, B.; Kressler, J.; Stoppelmann, G. Polymer 2001, 42, 1095.
6. Zax, D.B.; Yang, D.K.; Santos, R.A.; Hegemann, H.; Giannelis, E.P.; Manias, E. J. Chem Phys. 2000,112, 2945
7. Gates, W.P.; Stuck, J.W.; Kirkpatrick, R.J. Physics and Chem of Minerals 1996, 23, 535..
8. VanderHart, D.L.; Asano,A; Gilman, J.W. Chem Mater 2001, 13, 3796.
9. Poliskie, G.M.; Cohen, R.E.; Gleason, K.K. submitted to J Appl Polym Sci 2004.
10. Personal communication with Southern Clay Products representative.
11. Bruch, M.D. NMR Spectroscopy Techniques New York:Marcel Dekker 1996.
12. Mulken, R.V.; Bowers, J.L.; Heff, A.; Guttmann, R.G.; Sadowski, R.H. Phys. Med. Biol. 1996, 41,255.
13. Bourbigot, S.; Vanderhaart, D.L.; Gilman, J.W.; Awad, W.H.; Davis, R.D.; Morgan, A.B.; Wilkie,C.A. J. Polym. Sci. Poly. Phys. 2003, 41, 3188.
14. Blumberg, W.E. Phys Rev 1960, 119, 79.
15. Kessemeier, H.; Norberg, R.E. Phys Rev 1967, 155, 321.
16. Salamon, M.B. Phys Rev 1967, 155, 224.
17. Kenwright, A.M.; Say, B.J. Solid State Nucl Mag 1996, 7, 85.
18. Gil, A.M.; Alberti, E. Solid State Nucl Mag 1998, 11, 203.
19. Gavish, M.; Brennan, P.; Woodward, A.E. Macromolecules 1988, 21, 2075.
20. Torchia, D.A.; Szabo, A. J Magn Reson 1982, 49, 107.
21. Bertini, I.; Luchinat, C.; Parigi, G. Solution NMR of Paramagnetic Molecules Amsterdam:ElsevierScience 2001.
22. Sato, H.; Tanka, Y. J Polym Sci Pol Chem 1979, 17 3551
23. Dejean de la Batie, R.; Laupretre, F.; Monnerie, L. Macromolecules 1989, 22, 122.
24. Tse,D.; Lowe,I.J. Phys Rev 1968, 166, 279.
53

25. Day, S.M.; Humphries, L.J. Phys Rev B 1975, 12, 2601.
54
Chapter 4
Plastic Crystalline Behavior of Ethyl Substituted PolyhedralOligomeric SilSesquioxane (POSS)
(To be submitted to Inorganic Chemistry, G.M. Poliskie, T.S. Haddad, R.L.Blanski, K.K. Gleason)
55
AbstractThis study describes the synthesis and molecular mobility of both partially deuterated and fully
protonated ethyl polyhedral oligomeric silsesquioxane (POSS) crystals. Phase transitions were identified
with differential scanning calorimetry at -258 K and -253 K for partially deuterated and fully protonated
ethyl POSS, respectively. A change in entropy of - 20.2 + 5 Jmol-'K' was observed for both transitions.
Abrupt changes in the spin lattice relaxation and linewidth were detected with solid state proton nuclear
magnetic resonance (NMR) spectroscopy, at the same temperatures detected with calorimetry. This NMR
behavior suggests a transition in molecular motions of both ethyl derivatives. For deuterated ethyl POSS,
the motions become increasingly anisotropic after the temperature is lowered past its transition point. Both
derivatives exhibit an increase in the correlation time (-30 ± 2 ns to -530 + 15 ns ) and activation energy
(-16 + 2 kJ/mol to - 20 ± 2 kJ/mol ) for molecular tumbling at temperatures past their respective
transitions.
Introduction
Polyhedral oligomeric silsesquioxane (POSS) is a fused cage of cyclic siloxanes used as a
nanofiller in composite research.1 Synthetic work has strived to functionalize the substituents on POSS
molecules in order to increase its compatibility with an organic polymer matrix. 5 7 However, both free
POSS molecules and POSS tethered to polymer chains form localized crystalline POSS domains in the
polymer matrix.4 '5 As a step toward decoupling the molecular motions of the polymer from that of the
POSS, solely the molecular motions of POSS crystallites were the focus of this work.
The POSS molecule has two principle modes of rotation which includes: the rotation of the
individual organic substituents edge of the cage and tumbling of the POSS cage about an axis of symmetry.
In particular, rapid molecular tumbling of molecules ordered in a three dimensional crystalline array is
termed plastic crystalline behavior. Plastic crystals exhibit rapid molecular reorientation at high
temperatures which slows to a rigid limit when cooled below a transition temperature, resulting in a small
reduction in entropy (3-20 JmolP'K').8 ' 9 Three-dimensional crystallographic reordering, using x-ray
diffraction (XRD) and differential scanning calorimetry (DSC) can often be linked to changes in the
molecular motions monitored by nuclear magnetic resonance (NMR). All three techniques have been
employed to fully characterize the crystallographic, energetic and molecular motions of the plastic
56
crystalline adamantine.1 '-13 Nordman and Schmitkon found adamantane went through a crystallographic
phase transformation at 209 K between a high temperature cubic phase and the low temperature tetragonal
phase. Furthermore, the cubic a-axis was found to have rotated 9° with respect to the c-axis of the low
temperature tetragonal phase.'° Calorimetry performed by Chaung and Westrum confirmed a first order
phase transition at 209 K with a change in entropy of 3.4 Jmol'K'." Finally, spectroscopists, Resing 12
and McCall, et. al.,' 3 characterized the molecular motions of these phases and found adamantane molecules
underwent isotropic reorientations around the C6 axis at room temperature. The transition to hindered
molecular rotation is marked by discontinuities at 209 K in the solid state proton spin lattice relaxation time
constant and spectral linewidths. '21 3 In addition, cubane is another plastic crystal which has not been as
fully characterized as adamantane using these same techniques. '4 15 Cubane is polymorphic and
characterized by two high temperature phase transitions at: 394K and 405K. 5 Like adamantane it is known
to undergo rapid isotrpoic tumbling in its highest temperature phase. Due to the similarity in the molecular
architecture of cubane and POSS and the possibility that POSS undergoes isotropic molecular tumbling, it
may be of interest to monitor POSS molecules as a function of temperature.
Previous work by Larsson and coworkers, has used x-ray diffraction to monitor crystallographic
phase transitions in crystals of POSS containing various fully protonated organic substituents.'4 Larsson
notes a crystallographic phase transition of n-propyl POSS at 272 K from a close pack hexagonal unit cell
in the high temperature phase to triclinic unit cell in the low temperature phase. Other substituents
including methyl, ethyl, i-propyl, and n-butyl were also studied using the Klofer method; however, no
transition was observed for these derivatives, down to the lowest experimentally accessible temperature of
243 K..' 6 Differential scanning calorimetry by Kopesky, et. al. identified a transition at 330 K for i-butyl
functionalized POSS;1 7however, no detailed entropic information about the phase transitions of POSS
molecules has been reported. There has been no solid-state nuclear magnetic resonance spectroscopy
reported on the characteristic molecular motions of these phase transitions.
In the interest of characterizing the molecular motions as a function of temperature in POSS
crystallites, this paper will describe calorimetry and various solid-state NMR experiments on crystals of
ethyl substituted POSS. Despite Larsson's conclusions, we have identified a phase transition in fully
protonated ethyl POSS (253 K) suggesting there may be a limit to the sensitivity of the Klofer method
57
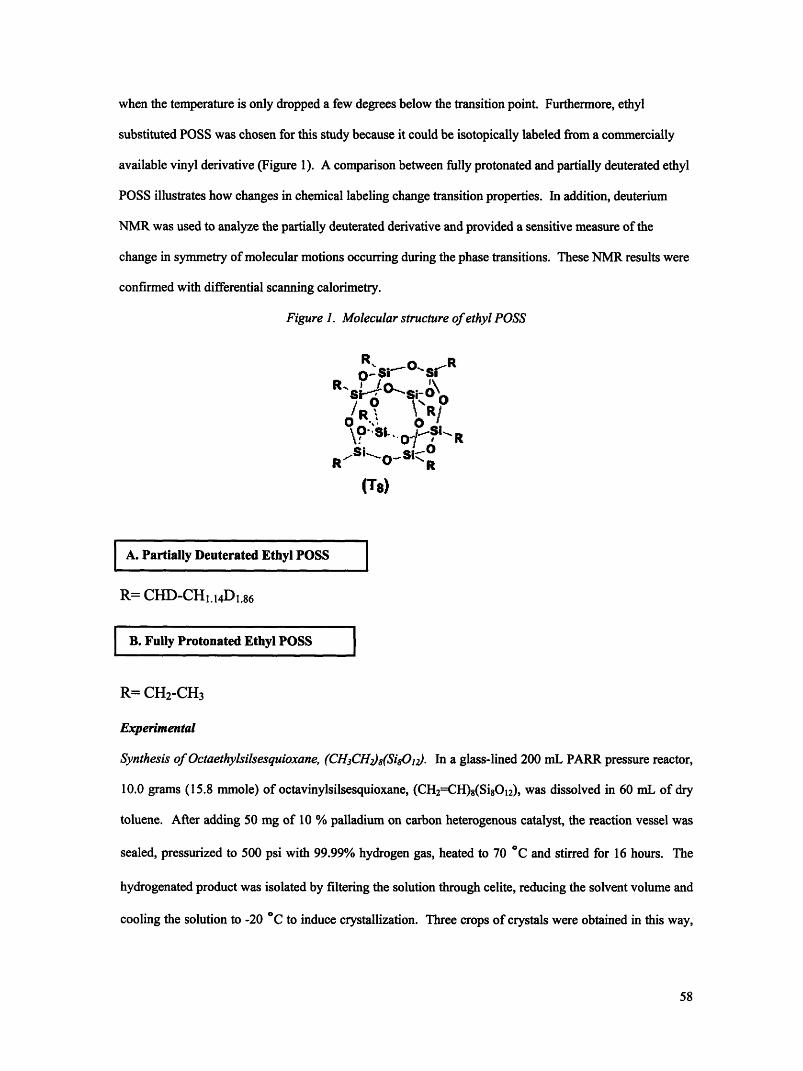
when the temperature is only dropped a few degrees below the transition point. Furthermore, ethyl
substituted POSS was chosen for this study because it could be isotopically labeled from a commercially
available vinyl derivative (Figure 1). A comparison between fully protonated and partially deuterated ethyl
POSS illustrates how changes in chemical labeling change transition properties. In addition, deuterium
NMR was used to analyze the partially deuterated derivative and provided a sensitive measure of the
change in symmetry of molecular motions occurring during the phase transitions. These NMR results were
confirmed with differential scanning calorimetry.
Figure 1. Molecular structure of ethyl POSS
of sO s r
oR 0.R r
Si .. oSi- R
R R
(T8)
A. Partially Deuterated Ethyl POSS
R= CHD-CH 1. 14D 1. 86
B. Fully Protonated Ethyl POSS
R= CH2-CH 3
Experimental
Synthesis of Octaethylsilsesquioxane, (CH3CH2)8(Si801,). In a glass-lined 200 mL PARR pressure reactor,
10.0 grams (15.8 mmole) of octavinylsilsesquioxane, (CH2=CH) 8(Si 8O12), was dissolved in 60 mL of dry
toluene. After adding 50 mg of 10 % palladium on carbon heterogenous catalyst, the reaction vessel was
sealed, pressurized to 500 psi with 99.99% hydrogen gas, heated to 70 °C and stirred for 16 hours. The
hydrogenated product was isolated by filtering the solution through celite, reducing the solvent volume and
cooling the solution to -20 °C to induce crystallization. Three crops of crystals were obtained in this way,
58
then combined together and sublimed at 150 C under dynamic vacuum (10-2 torr) to give 9.10 grams of
product (14.0 mmole, 89 % yield). A single product is evidenced by 'H, 3C and 29Si NMR spectroscopy.
'H NMR (relative to internal CHC13 at 7.26 ppm): 1.00 ppm (CH3, triplet, 3JH-H = 8.0 Hz), 0.61 ppm (CH 2,
quartet, 3JH-H = 8.0 Hz). 13C NMR (relative to internal CDC13 at 77.0 ppm): 6.51 ppm (CH3), 4.08 ppm
(CH 2, 29Si satellites Jsi-c = 109 Hz). 29Si NMR (relative to external SiMe4 at 0.0 ppm): -65.5 ppm ('3C
satellites Jsi-c = 109 Hz).
Synthesis of deuterated-Octaethylsilsesquioxane. The same hydrogenation procedure was followed except
that 98% deuterium gas was used instead of hydrogen. 10 grams of octavinylsilsesquioxane was converted
into 9.3 grams of partially deuterated octaethylsilsesquioxane. The product is a complex mixture of not just
(CH2DCHD)s(SiO,12 ), but contains numerous products arising from catalyst induced scrambling of the
deuterium. The 'H NMR spectrum shows an integral ratio of the methyl group to the methylene group of
1.14:1.00; the idealized product with the addition of one deuterium to each carbon would have an expected
ratio of 2:1. In the 3C spectrum, peaks corresponding to CH 3CH 2Si groups are easily identified, and a
DEPT 135 sequence 13C NMR spectrum demonstrates that the methyl groups can be CH3, CH 2D or CHD 2
and the methylene groups can be CH 2 or CHD. Evidence for perdeuterated methyl or methylene groups
was not observed. H NMR (relative to internal CHC13 at 7.26 ppm): 0.98 ppm (methyl, broad multiplet),
0.60 ppm (methylene, broad multiplet). 13C NMR (relative to internal CDC13 at 77.0 ppm): 6.52, 6.42,
6.34, 6.24, 6.15, 6.05, 5.95, 5.87, 5.77, 5.67, 5.58, 5.48, 5.39, 5.20 ppm (dn-CH 3), 4.08, 3.98, 3.87, 3.80,
3.77, 3.72, 3.62, 3.52, 3.44, 3.34, 3.23 ppm (dn-CH 2,). 29Si NMR (relative to external SiMe 4 at 0.0 ppm): -
65.4 ppm (broad multiplet).
As identified in the sysnthesis procedure, the 3:2 ratio for the methyl to the methylene resonances,
from the solution 'H NMR, indicated the desired fully protonated ethyl derivative was synthesized. For this
reason, this product will be referred to as fully protonated ethyl POSS. Unfortunately, the deuteration of
the ethyl POSS resulted in a complicated mixture of products (Figure 1). The desired deuterated ethyl
product had an expected ratio of 2:1 for the methyl to methylene from solution H NMR resonances.
However, the ratio for the synthesized product was 1.14:1. The palladium catalyst has been know to create
C-H activation' 8" 9 and the deuterium gas was more than 98% pure suggesting more that on average each
ethyl substituent had more than three deuterium isotopes. Despite this scrambling of isotopic products, the
59
deuterated ethyl POSS product contained residual protons from the vinyl precursor allowing for a direct
comparison of the two POSS derivatives using solid-state 'H NMR. Therefore, the deuterated product will
be referred to as partially deuterated POSS.
Differential Scanning Calorimetry
Dynamic scanning calorimetry (DSC) was performed on a Q1000 TA instrument. Each sample was run in
an aluminum pan with a step scan of two loops between 183 K and 273 K. The ramp rate was 5 K/minute.
Data was analyzed using Universal Analysis software.
NMR Spectroscopy
Deuterium solid state NMR spectra were taken with a Wang 7 T magnet (with a 45 MHz 2H
resonance frequency) using a Tecmag single resonance pulse generator and receiver. Static deuterium (2H)
experiments were performed on a home built probe with a 2.5 gs n/2 pulse width. Deuterium spectra were
acquired with a solid echo sequence (/2-X-c/2-Acq) and a fixed delay time () of 21 gs.
Proton solid state NMR spectra were taken with an Oxford 6.3 T magnet (with a 270 MHz H
resonance frequency) using a Tecmag dual resonance pulse generator and receiver. Static proton (H)
experiments were performed on a home built probe with a 2gs cn/2 pulse width. Proton spectra were
acquired with a 10 its dwell time and a 5 s recycle delay.
Simulations of line shapes for the static proton spectra were performed with a single peak using
GRAMS® software. Simulated peaks were Gaussian with the full width half mass (FWHM) line widths
extracted from the simulation.
Spin-lattice relaxations for the proton experiments were measured using an inversion recovery
sequence (- -/2-Acq). A single least square exponential was fit to the peak intensity (M) versus delay
time (t), resulting in a two parameter fit yielding: the equilibrium peak intensity (Mo) and the spin-lattice
relaxation time constant (Tl) (Eq 1).2°
Eq 1: M(t)=M(1-2exp(-t/T,))
This single exponential was used for the POSS data with an R2 value of 0.99.
From the plot of InT, versus the inverse of temperature, the activation energies were calculated
from the slope of the line (Eq 2) multiplied by the molar gas constant.2 0 The slopes were taken from the
most linear region of the data which created an R2 value > 0.98.
60
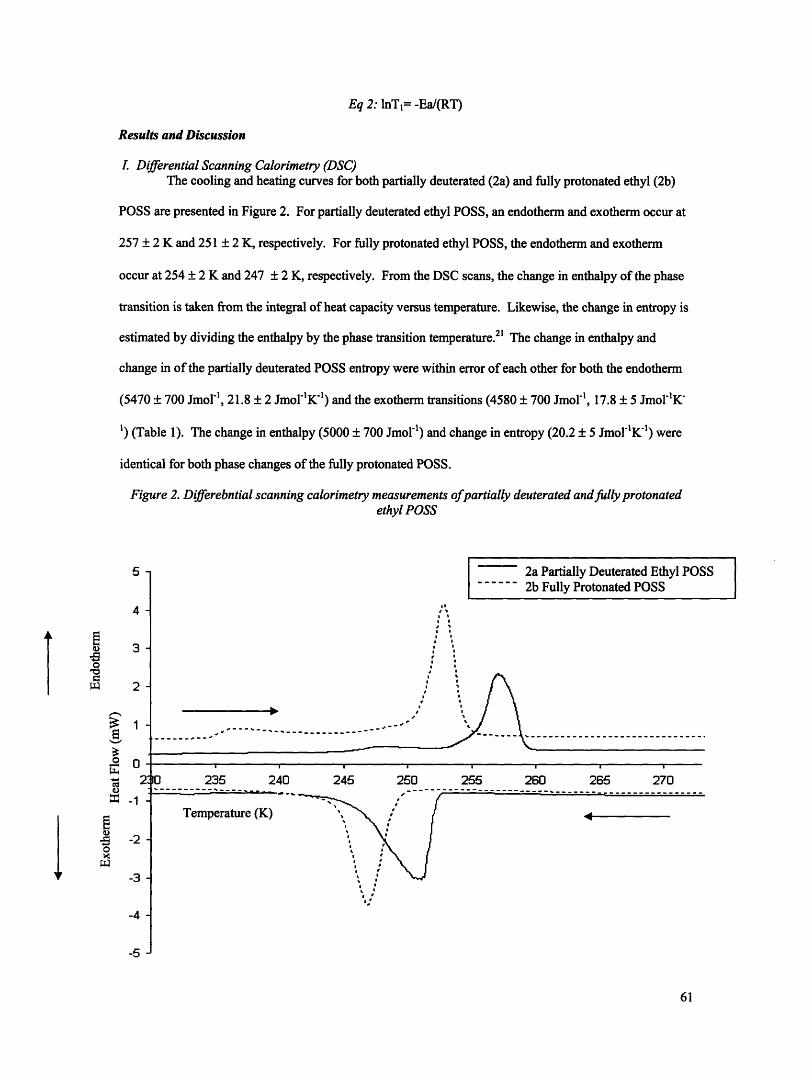
Eq 2: lnT,= -Ea/(RT)
Results and Discussion
I. Differential Scanning Calorimetry (DSC)The cooling and heating curves for both partially deuterated (2a) and fully protonated ethyl (2b)
POSS are presented in Figure 2. For partially deuterated ethyl POSS, an endotherm and exotherm occur at
257 ± 2 K and 251 ± 2 K, respectively. For fully protonated ethyl POSS, the endotherm and exotherm
occur at 254 ± 2 K and 247 ± 2 K, respectively. From the DSC scans, the change in enthalpy of the phase
transition is taken from the integral of heat capacity versus temperature. Likewise, the change in entropy is
estimated by dividing the enthalpy by the phase transition temperature. The change in enthalpy and
change in of the partially deuterated POSS entropy were within error of each other for both the endotherm
(5470 ± 700 Jmol ' , 21.8 ± 2 Jmol'K') and the exotherm transitions (4580 ± 700 Jmol ' , 17.8 ± 5 Jmol'K
') (Table 1). The change in enthalpy (5000 ± 700 Jmol') and change in entropy (20.2 5 Jmol'K' l) were
identical for both phase changes of the fully protonated POSS.
Figure 2. Differebntial scanning calorimetry measurements ofpartially deuterated and fully protonatedethyl POSS
I|A,_ 11 J L _1 'rI
4-
o 3-
2-
011
-3 -
-1-2
za rarually ueuteratea Etmyl ruS2b Fully Protonated POSS
,
l.,{1I I~~~~~~~~~~
I ·~~~~~~~~~I ·~~~~~~~~~I ·~~~~~~~~
.,,~~ ~ "''''" .~...... -
,-'~l
61
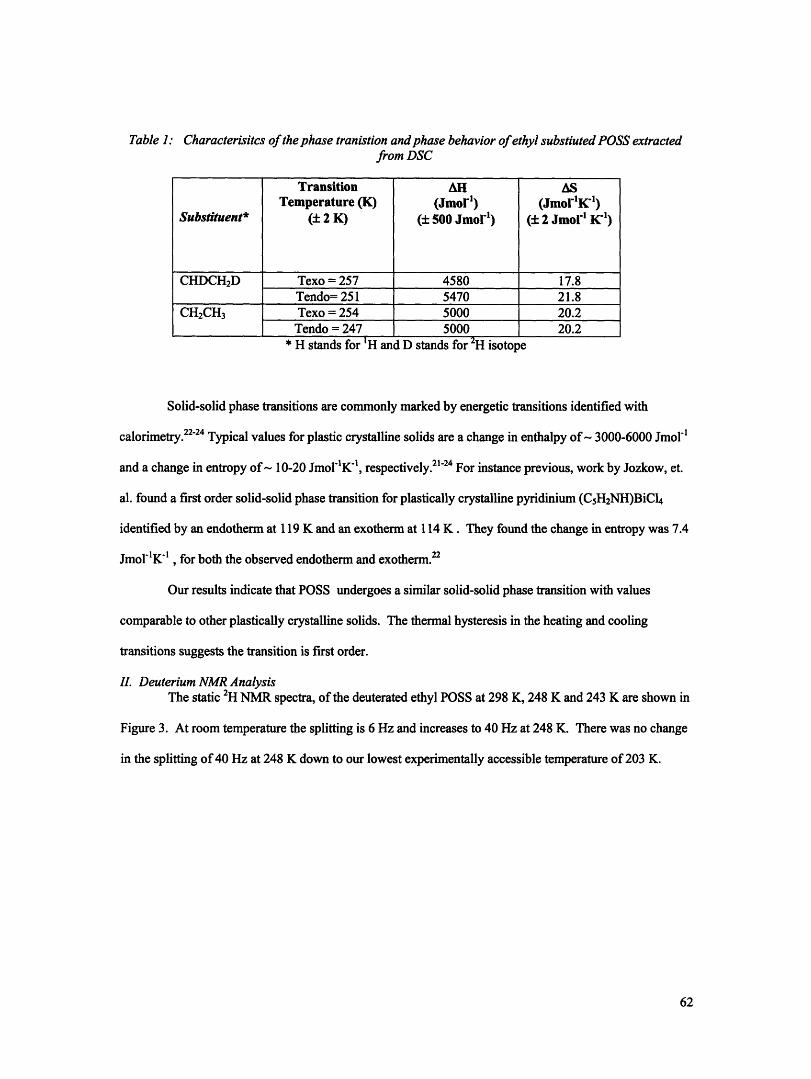
Table 1: Characterisitcs of the phase tranistion and phase behavior of ethyl substiuted POSS extractedfrom DSC
Transition Al ASTemperature (K) (Jmorl) (JmorlK' ')
Substituent* ( 2 K) 500 Jmo') ( 2 Jmo ' K')
CHDCH2D Texo = 257 4580 17.8Tendo= 251 5470 21.8
CH2CH 3 Texo = 254 5000 20.2Tendo = 247 5000 20.2
* H stands for H and D stands for 2H isotope
Solid-solid phase transitions are commonly marked by energetic transitions identified with
calorimetry.22 '24 Typical values for plastic crystalline solids are a change in enthalpy of - 3000-6000 Jmol'
and a change in entropy of- 10-20 Jmol''K', respectively. 21 24 For instance previous, work by Jozkow, et.
al. found a first order solid-solid phase transition for plastically crystalline pyridinium (CsH2NH)BiCI4
identified by an endotherm at 119 K and an exotherm at 114 K . They found the change in entropy was 7.4
Jmol'K l , for both the observed endotherm and exotherm.22
Our results indicate that POSS undergoes a similar solid-solid phase transition with values
comparable to other plastically crystalline solids. The thermal hysteresis in the heating and cooling
transitions suggests the transition is first order.
II. Deuterium NMR AnalysisThe static 2H NMR spectra, of the deuterated ethyl POSS at 298 K, 248 K and 243 K are shown in
Figure 3. At room temperature the splitting is 6 Hz and increases to 40 Hz at 248 K. There was no change
in the splitting of 40 Hz at 248 K down to our lowest experimentally accessible temperature of 203 K.
62
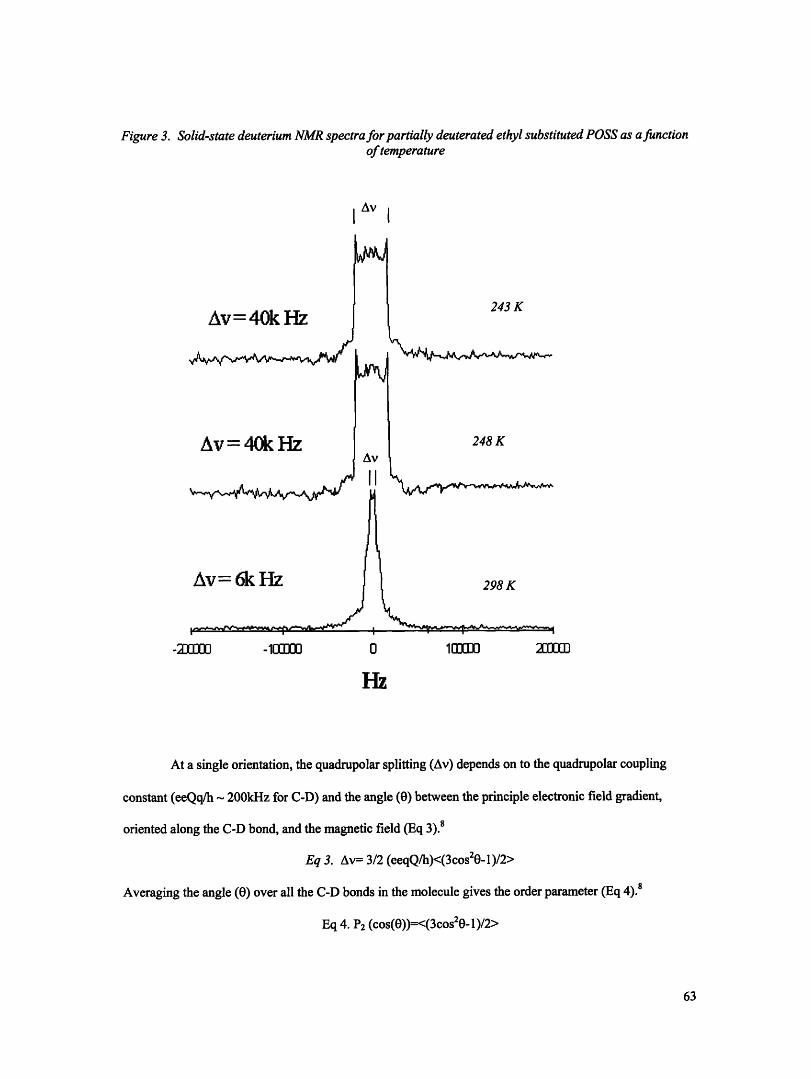
Figure 3. Solid-state deuterium NMR spectra for partially deuterated ethyl substituted POSS as afunctionof temperature
IAv I
Av = 40k Hz
Av= 40k Hz
Av= 6k Hz
-2JJJO -1rOWD 0 10E0
243 K
248 K
298 K
2100W
At a single orientation, the quadrupolar splitting (Av) depends on to the quadrupolar coupling
constant (eeQq/h - 200kHz for C-D) and the angle (0) between the principle electronic field gradient,
oriented along the C-D bond, and the magnetic field (Eq 3).8
Eq 3. Av= 3/2 (eeqQ/h)<(3cos 20-1)/2>
Averaging the angle (0) over all the C-D bonds in the molecule gives the order parameter (Eq 4).8
Eq 4. P2 (cos(O))=<(3cos 20 -1)/2>
63
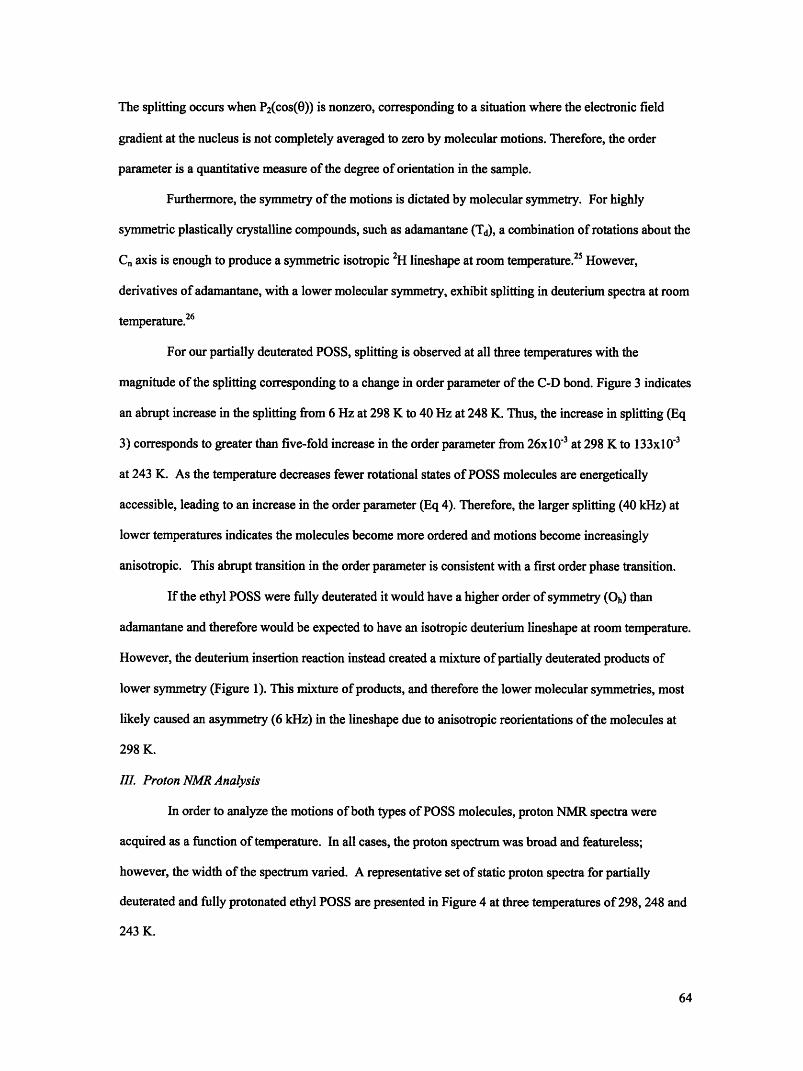
The splitting occurs when P2(cos(O)) is nonzero, corresponding to a situation where the electronic field
gradient at the nucleus is not completely averaged to zero by molecular motions. Therefore, the order
parameter is a quantitative measure of the degree of orientation in the sample.
Furthermore, the symmetry of the motions is dictated by molecular symmetry. For highly
symmetric plastically crystalline compounds, such as adamantane (Td), a combination of rotations about the
Cn axis is enough to produce a symmetric isotropic 2H lineshape at room temperature.2 5 However,
derivatives of adamantane, with a lower molecular symmetry, exhibit splitting in deuterium spectra at room
temperature.26
For our partially deuterated POSS, splitting is observed at all three temperatures with the
magnitude of the splitting corresponding to a change in order parameter of the C-D bond. Figure 3 indicates
an abrupt increase in the splitting from 6 Hz at 298 K to 40 Hz at 248 K. Thus, the increase in splitting (Eq
3) corresponds to greater than five-fold increase in the order parameter from 26x10 3 at 298 K to 133x10-3
at 243 K. As the temperature decreases fewer rotational states of POSS molecules are energetically
accessible, leading to an increase in the order parameter (Eq 4). Therefore, the larger splitting (40 kHz) at
lower temperatures indicates the molecules become more ordered and motions become increasingly
anisotropic. This abrupt transition in the order parameter is consistent with a first order phase transition.
If the ethyl POSS were fully deuterated it would have a higher order of symmetry (Oh) than
adamantane and therefore would be expected to have an isotropic deuterium lineshape at room temperature.
However, the deuterium insertion reaction instead created a mixture of partially deuterated products of
lower symmetry (Figure 1). This mixture of products, and therefore the lower molecular symmetries, most
likely caused an asymmetry (6 kHz) in the lineshape due to anisotropic reorientations of the molecules at
298 K.
III. Proton NMR Analysis
In order to analyze the motions of both types of POSS molecules, proton NMR spectra were
acquired as a function of temperature. In all cases, the proton spectrum was broad and featureless;
however, the width of the spectrum varied. A representative set of static proton spectra for partially
deuterated and fully protonated ethyl POSS are presented in Figure 4 at three temperatures of 298, 248 and
243 K.
64
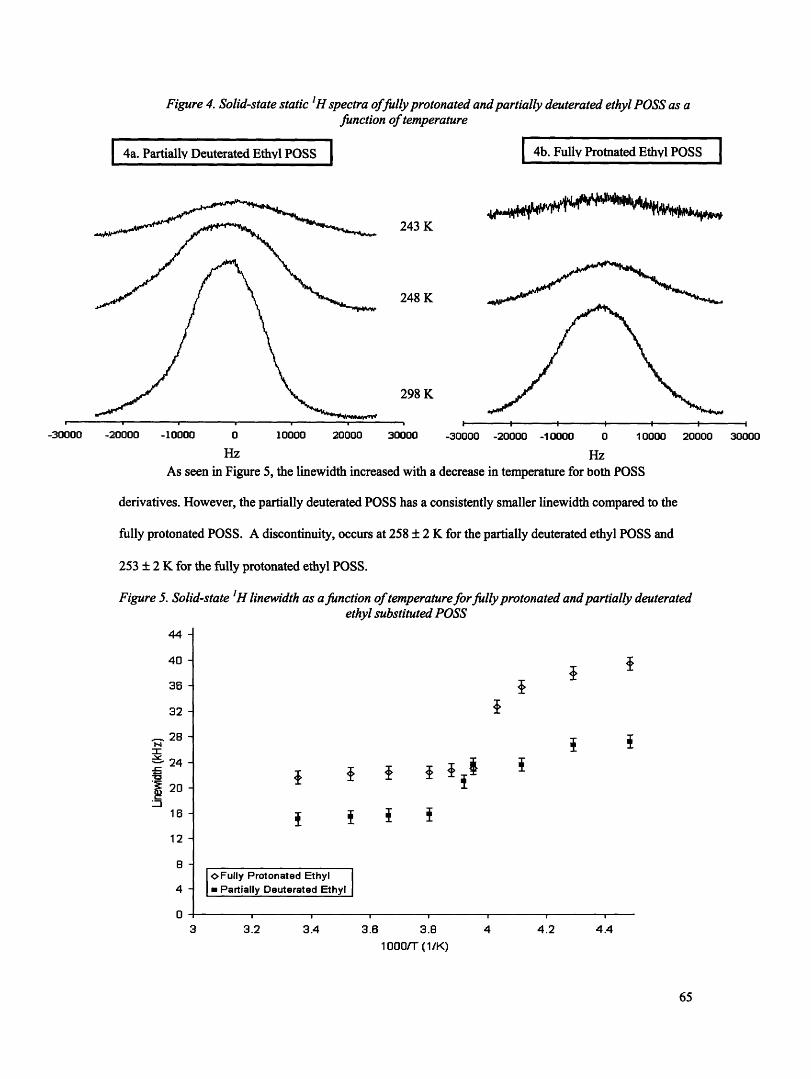
Figure 4. Solid-state static H spectra offully protonated and partially deuterated ethyl POSS as afunction of temperature
I 4a. Partially Deuterated Ethyl POSS 4b. Fully Protnated Ethyl POSS I
243 K
248 K
!98 K
)000 -10000 0 10000 20000 30000 -30000 -20000 -10000 0 10000 20
Hz HzAs seen in Figure 5, the linewidth increased with a decrease in temperature for both POSS
derivatives. However, the partially deuterated POSS has a consistently smaller linewidth compared to the
fully protonated POSS. A discontinuity, occurs at 258 + 2 K for the partially deuterated ethyl POSS and
253 + 2 K for the fully protonated ethyl POSS.
Figure 5. Solid-state H linewidth as a function of temperatureforfullyprotonated and partially deuteratedethyl substituted POSS
44 -
40 -
36 -
32 -
28 -
- 24-
20-
16 -
84-
4-
0-
f
I I I I
f I I f
OFully Protonated EthylI Partially Deuterated Ethyl
3 3.2 3.4 3.6 3.8
1 000fT (1 K)
4 4.2 4.4
-30000 -21 000 30000
65
, . . .
.~-w~irm~l~I
0-10" M-kb~
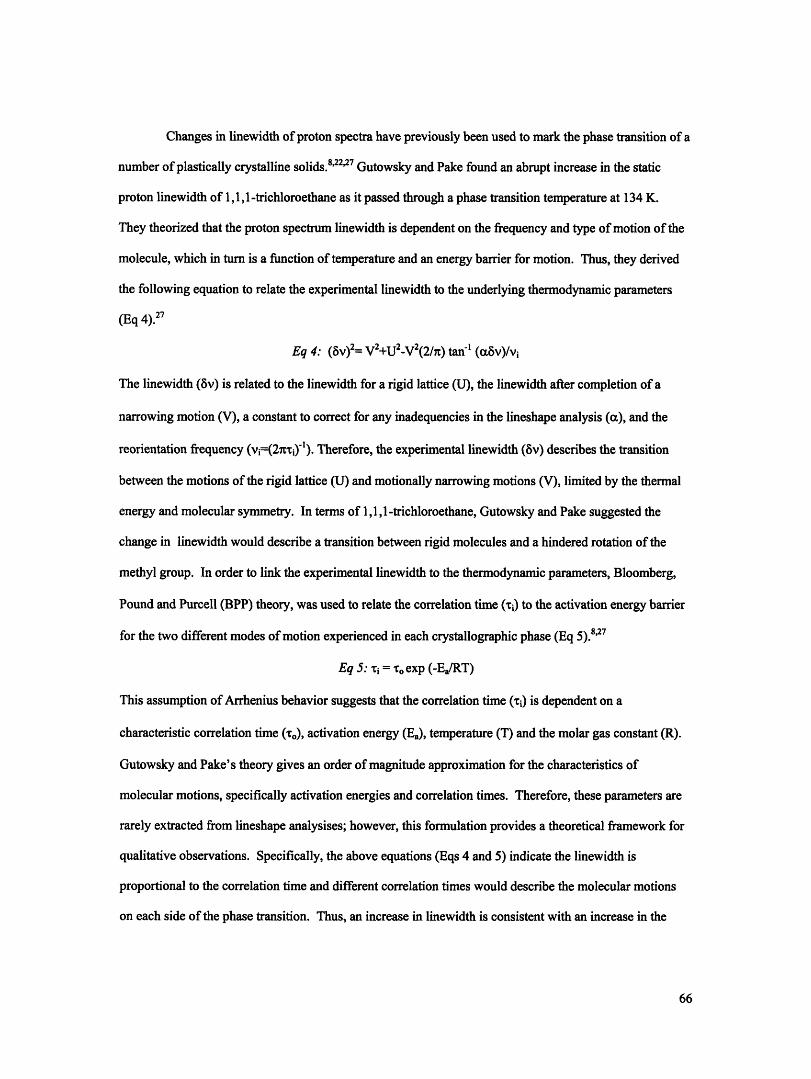
Changes in linewidth of proton spectra have previously been used to mark the phase transition of a
number of plastically crystalline solids.8 ' 22 27 Gutowsky and Pake found an abrupt increase in the static
proton linewidth of 1,1 ,1-trichloroethane as it passed through a phase transition temperature at 134 K.
They theorized that the proton spectrum linewidth is dependent on the frequency and type of motion of the
molecule, which in turn is a function of temperature and an energy barrier for motion. Thus, they derived
the following equation to relate the experimental linewidth to the underlying thermodynamic parameters
(Eq 4).27
Eq 4: (6v) 2= V2+U2 -V2(2/n) tan' (av)/v
The linewidth (v) is related to the linewidth for a rigid lattice (U), the linewidth after completion of a
narrowing motion (V), a constant to correct for any inadequencies in the lineshape analysis (a), and the
reorientation frequency (vj=(2xji)'). Therefore, the experimental linewidth (v) describes the transition
between the motions of the rigid lattice (U) and motionally narrowing motions (V), limited by the thermal
energy and molecular symmetry. In terms of 1,1 ,l-trichloroethane, Gutowsky and Pake suggested the
change in linewidth would describe a transition between rigid molecules and a hindered rotation of the
methyl group. In order to link the experimental linewidth to the thermodynamic parameters, Bloomberg,
Pound and Purcell (BPP) theory, was used to relate the correlation time (i) to the activation energy barrier
for the two different modes of motion experienced in each crystallographic phase (Eq 5).827
Eq 5: Ti = o exp (-EaRT)
This assumption of Arrhenius behavior suggests that the correlation time (i) is dependent on a
characteristic correlation time (o), activation energy (Ea), temperature (T) and the molar gas constant (R).
Gutowsky and Pake's theory gives an order of magnitude approximation for the characteristics of
molecular motions, specifically activation energies and correlation times. Therefore, these parameters are
rarely extracted from lineshape analysises; however, this formulation provides a theoretical framework for
qualitative observations. Specifically, the above equations (Eqs 4 and 5) indicate the linewidth is
proportional to the correlation time and different correlation times would describe the molecular motions
on each side of the phase transition. Thus, an increase in linewidth is consistent with an increase in the
66
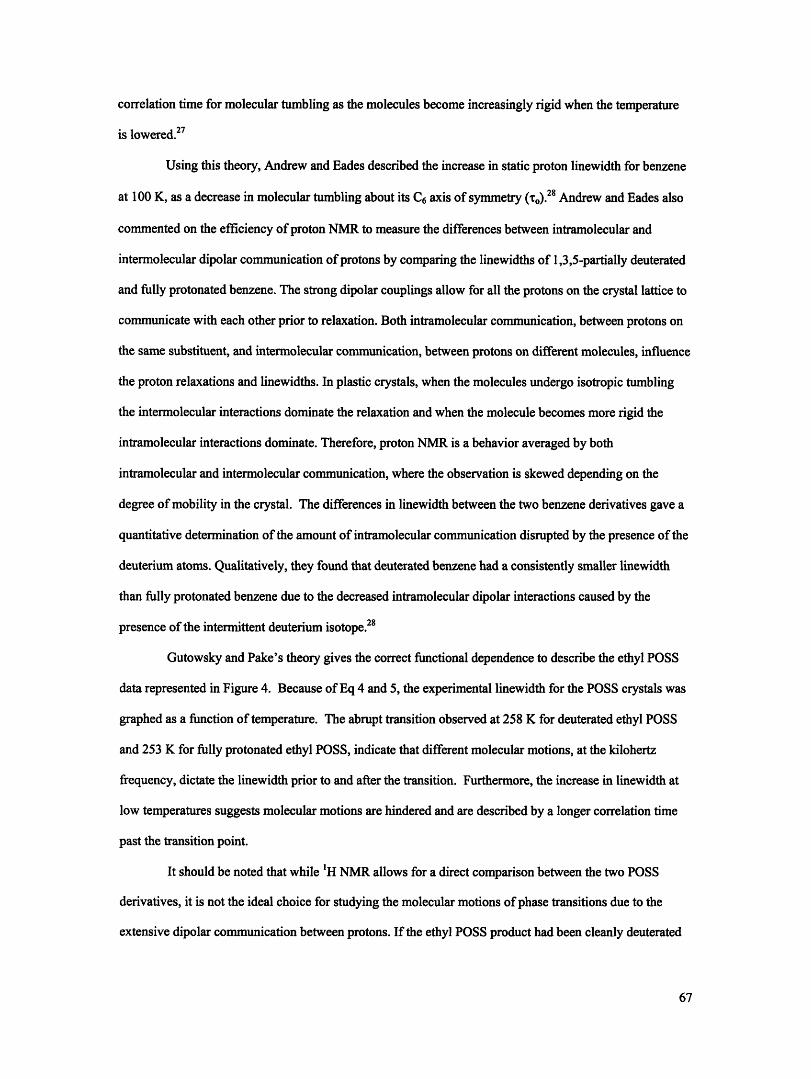
correlation time for molecular tumbling as the molecules become increasingly rigid when the temperature
is lowered.2
Using this theory, Andrew and Eades described the increase in static proton linewidth for benzene
at 100 K, as a decrease in molecular tumbling about its C6 axis of symmetry ( 0o) 2 8 Andrew and Eades also
commented on the efficiency of proton NMR to measure the differences between intramolecular and
intermolecular dipolar communication of protons by comparing the linewidths of 1,3,5-partially deuterated
and fully protonated benzene. The strong dipolar couplings allow for all the protons on the crystal lattice to
communicate with each other prior to relaxation. Both intramolecular communication, between protons on
the same substituent, and intermolecular communication, between protons on different molecules, influence
the proton relaxations and linewidths. In plastic crystals, when the molecules undergo isotropic tumbling
the intermolecular interactions dominate the relaxation and when the molecule becomes more rigid the
intramolecular interactions dominate. Therefore, proton NMR is a behavior averaged by both
intramolecular and intermolecular communication, where the observation is skewed depending on the
degree of mobility in the crystal. The differences in linewidth between the two benzene derivatives gave a
quantitative determination of the amount of intramolecular communication disrupted by the presence of the
deuterium atoms. Qualitatively, they found that deuterated benzene had a consistently smaller linewidth
than fully protonated benzene due to the decreased intramolecular dipolar interactions caused by the
presence of the intermittent deuterium isotope.28
Gutowsky and Pake's theory gives the correct functional dependence to describe the ethyl POSS
data represented in Figure 4. Because of Eq 4 and 5, the experimental linewidth for the POSS crystals was
graphed as a function of temperature. The abrupt transition observed at 258 K for deuterated ethyl POSS
and 253 K for fully protonated ethyl POSS, indicate that different molecular motions, at the kilohertz
frequency, dictate the linewidth prior to and after the transition. Furthermore, the increase in linewidth at
low temperatures suggests molecular motions are hindered and are described by a longer correlation time
past the transition point.
It should be noted that while H NMR allows for a direct comparison between the two POSS
derivatives, it is not the ideal choice for studying the molecular motions of phase transitions due to the
extensive dipolar communication between protons. If the ethyl POSS product had been cleanly deuterated
67
the same quantitative analysis used by Andrew and Eades2 8 could have been performed on the POSS
samples. However, our data provides the same qualitative observation that was observed for benzene. In
Figure 4 and Figure 5, we observed a consistently smaller linewidth for the partially deuterated ethyl POSS.
This difference between the ethyl derivatives implies the intermittent deuterium isotope decreases
intracommunication between protons. Therefore, the fully protonated ethyl POSS is measurably
influenced by intramolecular interactions.
These changes in molecular motions can be further characterized with the proton T1 spin-lattice
relaxation time constant, which is a sensitive measure of molecular reorientations occurring at the Larmor
frequency, 270 MHz. Figures 6 and 7 are the Arrhenius plots of the In T1 versus the inverse of temperature
for the POSS molecules. For the fully protonated POSS there is a discontinuity in the graph at 253 K and
for the partially deuterated POSS at 258 K. For both POSS molecules the activation energy for the low
temperature region is higher than that of the high temperature region.
Figure 6. Solid-state 'H spin-lattice relaxation time constants (T,) as a function of temperatureforfullyprotonated ethyl substituted POSS
. "at
I Ea-15.6 kJ/mol + 2 kJ/mol I
T
) /mol 2
-fit for Ea
3.2 3.4 3.6 3.8 4 4.2 4.4 4.61000F (1N
68
1.15 -
0.95
0.75 -
t-
0.55-
0.35 -
0.15 -
0.05
LJO I
T
Figure 7. Solid-state 'Hspin-lattice relaxation time constants (T.) as afiunction of temperatureforpartially deuterated ethyl substituted POSS
U
I Ea-15.0 kJ/mol
I I I I
3 3.2 3.4 3.6 3.8
1000 fT (1/K)
I I I
4 4.2 4.4 4.6
Using the dipolar part of the spectral density formula, the T, time constant is on the Larmor
frequency for the H isotope (o= 270 MHz) and the correlation time (i) for molecular motion.8
Eq 6: 1/Tl = C{tj/(ti2O2+l)+ 4ij/(4ci2 o2+1)}
Applying Bloomberg, Pound, and Purcell theory, inserting Eq 5 into Eq 6, suggests a plot of T, versus the
inverse of temperature will have a minimum. 827 This theory is only applicable to materials in which a
single correlation time (i) dictates the spin-lattice relaxation for the entire experimental temperature range.
This is often not the case for solids in which a phase transition occurs in the temperature range causing
different motions to dominate the relaxation in each phase.
It has been well documented for numerous solids that, when a phase transition occurs over the
experimental temperature range a minimum will not be observed.8' 2 2 Instead, as the molecular motions
69
1.8
1.6
1.4 -
1.2 -
C,
-
1-
0.8 -
0.6 -
0.4
0.2
0
I/mol 2
!I
decrease with a decrease in temperature, there is a discontinuity in the graph at the transition temperature.
For example, Resing, et. al. found that the T1 time constants from static proton NMR of adamantane has a
discontinuity in the graph at 209 K where the crystallographic phase transition occurs. At temperatures
above the transition, it is suggested that adamantane rotates freely about a C6 axis of symmetry, described
by a short correlation time and after the transition this motion is energetically less accessible, described by
a longer correlation time.8 ' 3
The discontinuities, observed in Figure 4 and 5, indicate that different molecular motions of POSS
dictate the relaxation of the nuclear spins prior to and after the phase transition. In addition, that transition
to rigid mobility occurs at a higher temperature (258 + 2 K ) for the partially deuterated sample compared
to the fully protonated sample (253 + 2 K). Due to the scrambling of deuterated products it is difficult to
conclude whether the increase in the transition temperature is the result of the heavier isotope or the
identified asymmetry of the molecular structures. It is plausible that the increased mass of the deuterium
labels increases the moment of inertia for the molecules decreasing the molecular tumbling in the high
temperature phase. This decreased mobility would require less thermal energy to be removed in order for
the molecules to become completely rigid. It is equally likely that due to the scrambling of the deuterated
products, on average, the asymmetry in the POSS molecules excludes certain modes of motion; therefore,
decreasing the mobility in the high temperature phase and increasing the temperature at which the molecule
becomes completely rigid.
The characteristic correlation time and the activation energy for the molecular motions can be
determined assuming BPP theory. When the temperature was decreased from 298 to 243 K, the
characteristic correlation time (o) increased from 28 + 2 ns to 530 + 15 ns and from 32 2 ns to 520 15
ns, for the partially deuterated and fully protonated POSS, respectively (Table 2). For both the fully
protonated and partially deuterated ethyl POSS, the activation energy for molecular tumbling is lower at
temperatures above the transition (Ea- 16 + 2 kJ/mol) than below (Ea- 20 2 kJ/mol) (Table 2).
70
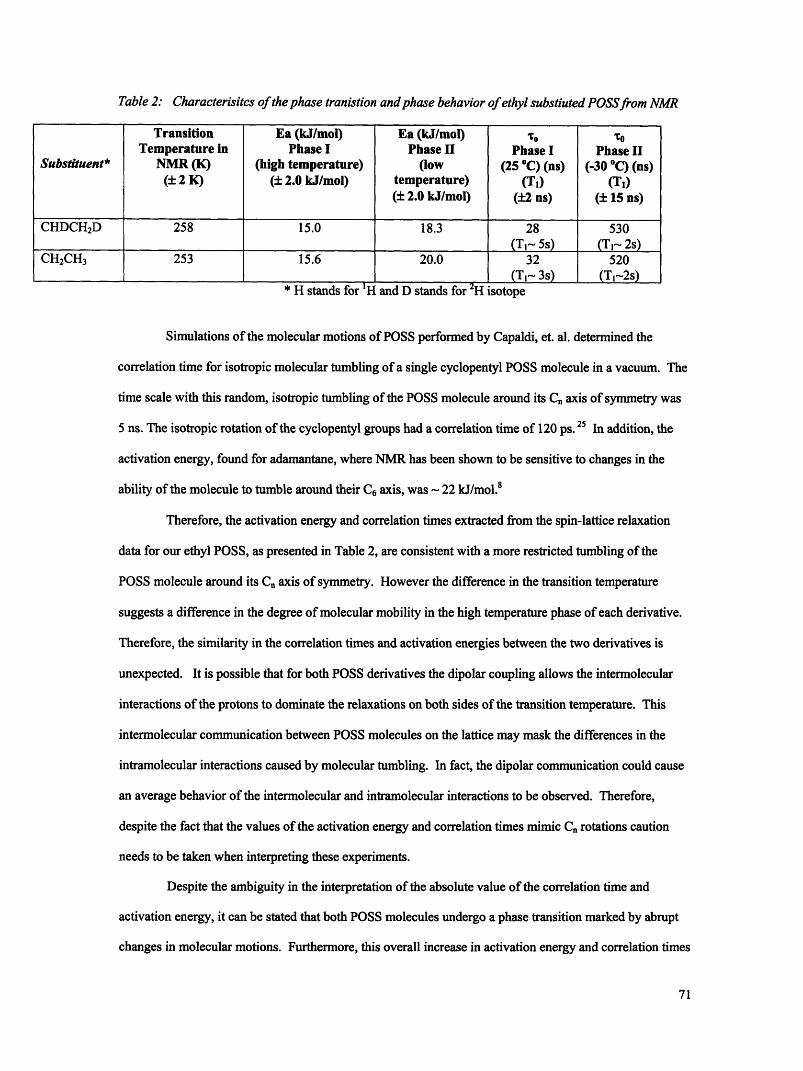
Table 2: Characterisitcs of the phase tranistion and phase behavior of ethyl substiuted POSSfrom NMR
Transition Ea (kJ/mol) Ea (kJ/mol), oTemperature in Phase I Phase II Phase I Phase II
Substituent* NMR (K) (high temperature) (low (25 C) (ns) (-30 C) (ns)(± 2 K) (± 2.0 kJ/mol) temperature) (Ti) (T1)
(± 2.0 kJ/mol) (±2 ns) (±15 ns)
CHDCH 2D 258 15.0 18.3 28 530(Ti- 5s) (T- 2s)
CH 2CH 3 253 15.6 20.0 32 520(Tj - 3s) (T-2s)
* H stands for H and D stands for 2H isotope
Simulations of the molecular motions of POSS performed by Capaldi, et. al. determined the
correlation time for isotropic molecular tumbling of a single cyclopentyl POSS molecule in a vacuum. The
time scale with this random, isotropic tumbling of the POSS molecule around its Cn axis of symmetry was
5 ns. The isotropic rotation of the cyclopentyl groups had a correlation time of 120 ps. 25 In addition, the
activation energy, found for adamantane, where NMR has been shown to be sensitive to changes in the
ability of the molecule to tumble around their C6 axis, was - 22 kJ/mol.8
Therefore, the activation energy and correlation times extracted from the spin-lattice relaxation
data for our ethyl POSS, as presented in Table 2, are consistent with a more restricted tumbling of the
POSS molecule around its Cn axis of symmetry. However the difference in the transition temperature
suggests a difference in the degree of molecular mobility in the high temperature phase of each derivative.
Therefore, the similarity in the correlation times and activation energies between the two derivatives is
unexpected. It is possible that for both POSS derivatives the dipolar coupling allows the intermolecular
interactions of the protons to dominate the relaxations on both sides of the transition temperature. This
intermolecular communication between POSS molecules on the lattice may mask the differences in the
intramolecular interactions caused by molecular tumbling. In fact, the dipolar communication could cause
an average behavior of the intermolecular and intramolecular interactions to be observed. Therefore,
despite the fact that the values of the activation energy and correlation times mimic Cn rotations caution
needs to be taken when interpreting these experiments.
Despite the ambiguity in the interpretation of the absolute value of the correlation time and
activation energy, it can be stated that both POSS molecules undergo a phase transition marked by abrupt
changes in molecular motions. Furthermore, this overall increase in activation energy and correlation times
71
with decreased temperature is consistent with restricted molecular mobility in the low temperature phase
due to a lower thermal energy.
Conclusions
Phase transitions occur in ethyl POSS molecules and have been identified using calorimetry and
various NMR experiments. The transition points observed with calorimetry are identical to those observed
with NMR. The behavior observed with calorimetry and NMR are typical to those of plastic crystals. The
temperature of the phase transition was tuned by isotopically labeling the substituents on the POSS
molecule. At higher temperatures, the molecular reorientations are rapid and for deuterated POSS slightly
anisotropic. After the transition, and at lower temperatures, the molecular reorientations are slower and for
deuterated POSS increasingly anisotropic.
Acknowledgement
The authors acknowledge funding from the US Air Force under Grant No. F49620-01-1-0447.
72
References
1. Iyer,S.; Somlal,A.P.;Schiraldi,D.A. Polymeric Material Science and Engineering 2004, 90, 486.
2. Yei,D.; Kuo,S.W.; Su,Y.; Chang,F. Polymer 2004, 45, 2633.
3. Lee,A. Lichtenhan,J.D. Macromolecules 1998, 31, 4970.
4. Jeon, H.G.; Mather, P.T.; Haddad, T.S. Polymer International 2000, 49, 453.
5. Kim, K.;Chujo, Y. J Mater Chem 2003, 13, 1384.
6. Mantz, R.A.; Jones, P.F.; Chaffee, K.P.; Lichtenhan, J.D.; Gilman, J.W.; Ismail, I.M.K.; Burmeister,M.J. Chem Mater 1996, 8, 1250.
7. Murtee, H.J.; Thoms, T.P.S.; Greaves,J.; Hong, B. Inorg Chem 2001, 39, 5209.
8.Fyfe, C.A. Solid State NMR for Chemists CFC Press: Ontario 1983.
9.Sherwood, J.N. The Plastically Crystalline State New York: John Wiley and Sons 1979.
10.Nordman, C.E.; Schmitkons, D.L. Acta Cryst 1965, 18, 764.
11 .Chang, S.; Westrum, E.F. J. Phys. Chem. 1960, 64, 1547.
12.Resing, H.A. Mol. Cryst. Liq. Cryst. 1969, 9, 101.
13.McCall, D.W.; Douglas, D.C. J. Chem. Phys. 1960, 33, 777.
14.Allen, S.M.; Thomas, E.L. The Structure of Materials New York:John Wiley 1999.
15.Detken, A.; Zimmermann, H.; Haeberlen, U. J. Phys. Chem. 1996, 100, 9598.
16. Larsson, K. Arkiv Kemi 1960, 16, 209.
17. Kopesky, E.; McKinely, G.; Cohen, R.E. Macromolecules 2004 in press.
18. Pass, G.; Littlewood, A.B.; Burwell, R.L. J. Chem Phys 1960, 12, 6281.
19.Lee, T.R.; Whitesides, G.M. Acct Chem Research 1992, 25, 266.
20. Bruch, M.D. NMR Spectroscopy Techniques New York:Marcel Dekker 1996.
21. Horiuchi, K.; Ishihara, H.; Hatano, N.; Okamoto, S; Gushiken, T. Z. Naturfisch 2002, 57, 425.
22. Jozkow, J.; Medycki, W.; Zaleski, J., Ryszard, J.; Bator, G,; Ciunik, Z. Phys. Chem. Chem. Phys.,2001, 3,3222.
23. Wilding, M.C.; McMilllan, P.F.; Navrotsky, A. Physica A 2002, 314, 379.
24.Willart, J.F.; Descamps, M.; Bertault, M.; Benzakour, N. J Phys Chem B 1992, 4, 9509.
25. Seeber, A.J.; Forstyh, M.; Forsyth, C.M.; Forsyth, S.A.; Annat, G.; MacFarlane, D.R. Phys. Chem.Chem. Phys., 2003, 5, 2692.
73

26. ManIntosh, M.R.; Fraser, B.; Gruwel, M.L.H.; Wasylishen, R.E.; Cameron, T.S. J. Phys. Chem. 1992,96, 8572.
27. Gutowsky, H.S.; Pake, G.E., J. Chem. Phys., 1950, 18, 162.
28. Andrew, E.R.; Eades, R.G. Proc. Roy. Soc. A 1953, 216, 398.
29. Capaldi, F. PhD Thesis, Department of Mechanical Engineering, MIT 2005.
74
Chapter 5
Strain Induced Changes in Cis 1,4-Polyisoprene Monitored bySolid State NMR
75
Abstract
Using magic angle spinning proton NMR, the spin lattice relaxation (Tl) time constants of monodisperse
cis 1,4-polyisoprene were monitored as a function of in situ compression. With a novel compression
device, the monodisperse 710,000 g/mol sample was compressed up to 40% strain. After 40% strain, there
was a 26 + 8%, 19 + 9% and 27 + 9% increase in the spin lattice relaxation time constants for the methyl,
methylene and methine resonances, respectively. Furthermore, with the use of proton NMR, acquisition is
sufficiently rapid that the spectra could be acquired during the stress relaxation. As a function of time,
there were no observed changes in the spin lattice relaxation time constants, illustrating the behavior could
not be described by the macroscopic stress relaxation. We hypothesize that the decrease in the spin lattice
relaxation time constant may be the result of chain fragmentation under mechanical strain.
Introduction
Due to the widespread use of elastomers in products such as tires and adhesives,'l the mechanisms
involved in mechanical behavior have been of interest for decades. Specifically, the stress relaxation
properties of polyisoprene have been investigated since the late 1940's.2-6 Doi and Edwards explained the
macroscopic exponential decay of stress as chains slipping out of physical entanglements.7 However,
Mooney and coworkers suggest the stress relaxation in a vacuum can often be described by a two term
equation which describes a transient relaxation caused by the rupture of secondary bonds and a second term
to describe the exponential decay caused by the molecular level chain rupture and slippage.8
This was followed by NMR studies focused on molecular motions monitored as a function of
crosslink density and in situ tensile deformation. 9 "l l For a variety of polymers, molecular motions induced
by mechanical deformation have been investigated.' 2 ' 6 Various NMR techniques have been used to probe
these molecular motions as a function of strain, with the premise that understanding deformation at the
molecular level will aid in formulating polymers with desired mechanical properties. For instance, Von
Meerwall and coworkers discovered large changes in the low frequency spin-spin relaxations of tensile
strained polyisoprene using static proton NMR. 9 However, it was not until large amounts of tensile strain
that the polymer chains became microscopically aligned increasing the dipolar interaction and spin-spin
relaxation.
76
These are the first experiments to utilize the higher frequency spin lattice relaxation measurements
in order to explore the molecular mechanisms occurring during in situ compression and magic angle
spinning. Additional information is achieved by removing the majority of the strong dipolar couplings,
using magic angle spinning, and observing the behavior of each chemically distinguishable resonance. The
magic angle spinning (MAS) spin lattice relaxation time constant behavior of polydisperse polyisoprene
has proven to be complicated (Appendix 7). Therefore, these in situ compression techniques are best
illustrated with a monodisperse sample which has proven to have a simpler behavior. Furthermore, this
work extends the use of NMR to expose the time dependence of the molecular motions induced by
compression. Proton spectra can be taken much faster in comparison to other nuclei, which results in an
ability to observe the spin lattice relaxation behavior at various points during the macroscopic stress
relaxation. Therefore, we were able to determine if there was a direct correlation between high frequency
molecular relaxation and macroscopic global polymer relaxation. Finally, we hypothesize that the trends
observed in the spin lattice relaxation time constants, as a function of compressive strain and time, are
consistent with chain scission during stress relaxation.
ExperimentalMonodisperse (PDI=1.02 ) 97% cis 1,4-polyisoprene was purchased from Polymer Source
Standards ( MN= 710,000) and used without further purification. This materials will be referred to as 7 10k.
The mechanical data were acquired with an Instron Model 4201 operated in compression mode at
room temperature. The specimens were rectangular with dimensions: 0.2 in. x 0.2 in. x 0.4 in. The polymer
specimen is sandwiched on the top and bottom by Teflon inserts, allowing for equal slip on both sides
during compression. A 1 kN compression load cell was used for all tests. The stress relaxation in the
polymer was measured as a function of time, at a constant strain of 40%.
All NMR spectra were taken with an Oxford 6.3 T magnet (with a 270 MHz 1H resonance
frequency) using a Tecmag dual resonance pulse generator and receiver. The magic angle spinning (MAS)
spectra were taken with a Chemagnetics 7.5mm probe at a sample spin speed of 2500 Hz. A compression
device was fabricated to enable in-situ NMR measurements of specimens under constant strain. The
compression device for the MAS spectra was constructed from a Teflon rod 0.15 in. in diameter and 1.00
in. in length. The specimen for these experiments had rectangular dimensions: 0.05 in. x 0.05 in. x 0.30
in.. A Teflon spacer between the polymer and screw allowed for slip at one end of the specimen while the
77
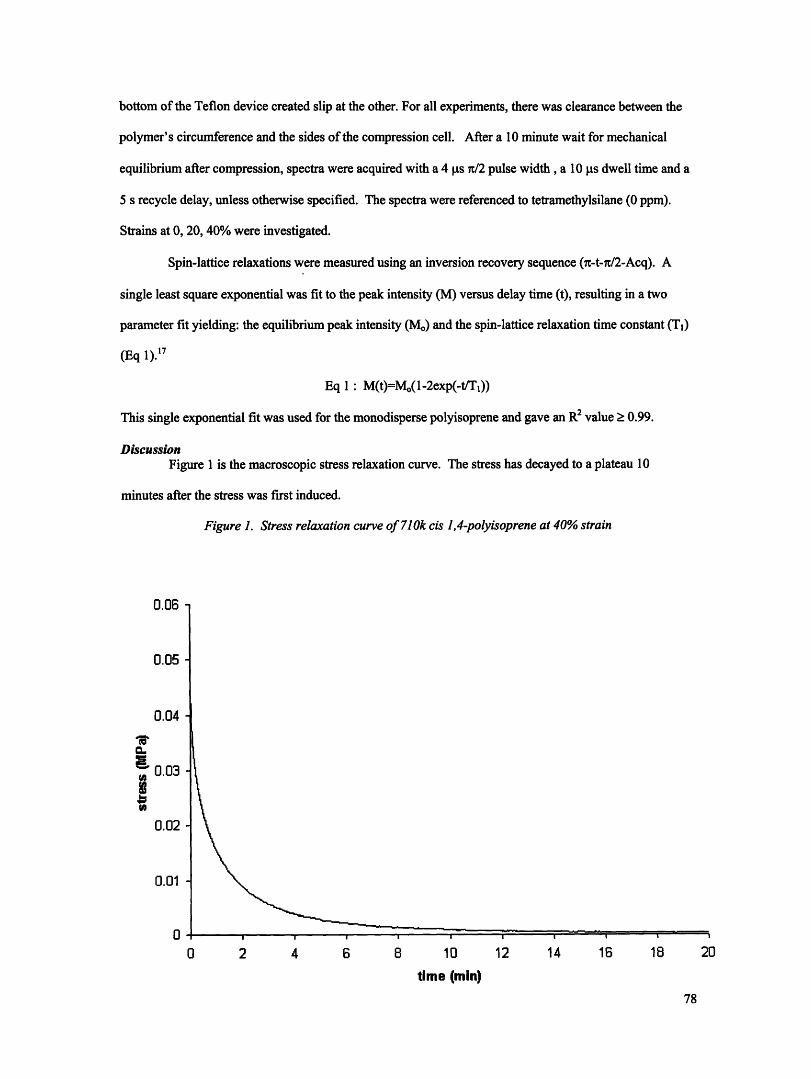
bottom of the Teflon device created slip at the other. For all experiments, there was clearance between the
polymer's circumference and the sides of the compression cell. After a 10 minute wait for mechanical
equilibrium after compression, spectra were acquired with a 4 p.s 7t/2 pulse width, a 10 Ags dwell time and a
5 s recycle delay, unless otherwise specified. The spectra were referenced to tetramethylsilane (0 ppm).
Strains at 0, 20, 40% were investigated.
Spin-lattice relaxations were measured using an inversion recovery sequence (-t-n/2-Acq). A
single least square exponential was fit to the peak intensity (M) versus delay time (t), resulting in a two
parameter fit yielding: the equilibrium peak intensity (Mo) and the spin-lattice relaxation time constant (T1)
(Eq 1).' 7
Eq 1: M(t)=M(1-2exp(-t/T 1))
This single exponential fit was used for the monodisperse polyisoprene and gave an R2 value > 0.99.
DiscussionFigure 1 is the macroscopic stress relaxation curve. The stress has decayed to a plateau 10
minutes after the stress was first induced.
Figure 1. Stress relaxation curve of 710k cis 1,4-polyisoprene at 40% strain
f' lf U.Uu
0.05
0.04
e
_W
0.02
0.01
00 2 4 6 8 10 12 14 16 18 20
time (min)78
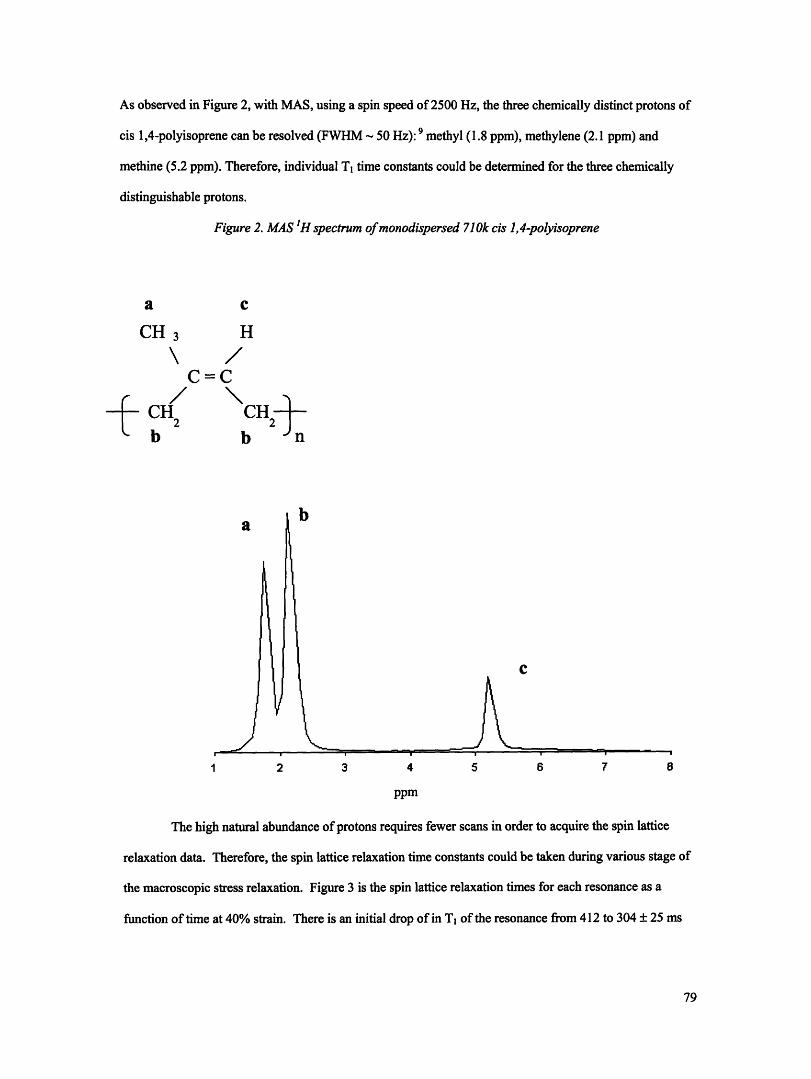
As observed in Figure 2, with MAS, using a spin speed of 2500 Hz, the three chemically distinct protons of
cis 1,4-polyisoprene can be resolved (FWHM - 50 Hz): 9 methyl (1.8 ppm), methylene (2.1 ppm) and
methine (5.2 ppm). Therefore, individual T1 time constants could be determined for the three chemically
distinguishable protons.
Figure 2. MAS 'H spectrum of monodispersed 710k cis 1,4-polyisoprene
a
CH 3
/CH2
b
c
H
C=C
CH b n
aL
c
82 3 4 5 6 7
ppm
1
The high natural abundance of protons requires fewer scans in order to acquire the spin lattice
relaxation data. Therefore, the spin lattice relaxation time constants could be taken during various stage of
the macroscopic stress relaxation. Figure 3 is the spin lattice relaxation times for each resonance as a
function of time at 40% strain. There is an initial drop of in T1 of the resonance from 412 to 304 ± 25 ms
79
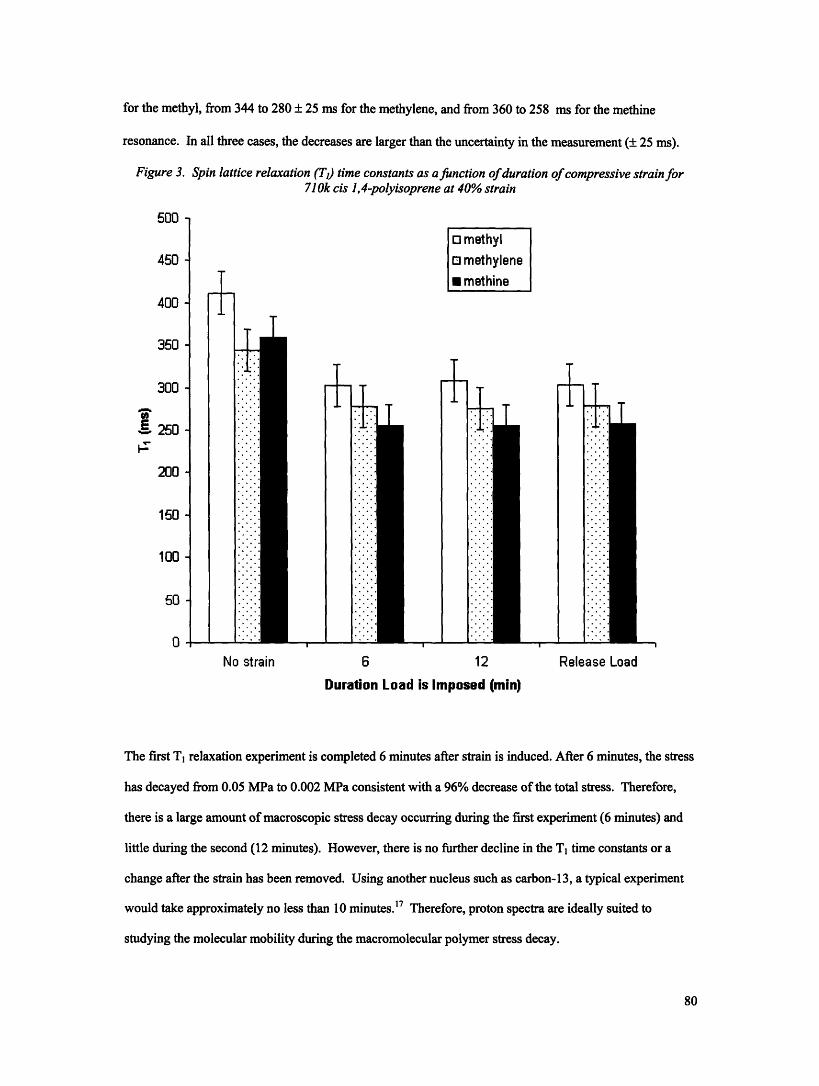
for the methyl, from 344 to 280 + 25 ms for the methylene, and from 360 to 258 ms for the methine
resonance. In all three cases, the decreases are larger than the uncertainty in the measurement (± 25 ms).
Figure 3. Spin lattice relaxation (T,) time constants as afunction of duration of compressive strain for710k cis 1,4-polyisoprene at 40% strain
500 -
450 -
400 -
350 -
300 -
E 250 -
200 -
150 -
100 -
50-
0-
T
0 methylo methylene* methine
T
6 12
Duration Load is Imposed (min)Release Load
The first T1 relaxation experiment is completed 6 minutes after strain is induced. After 6 minutes, the stress
has decayed from 0.05 MPa to 0.002 MPa consistent with a 96% decrease of the total stress. Therefore,
there is a large amount of macroscopic stress decay occurring during the first experiment (6 minutes) and
little during the second (12 minutes). However, there is no further decline in the T1 time constants or a
change after the strain has been removed. Using another nucleus such as carbon-13, a typical experiment
would take approximately no less than 10 minutes.l7 Therefore, proton spectra are ideally suited to
studying the molecular mobility during the macromolecular polymer stress decay.
80
No strain-
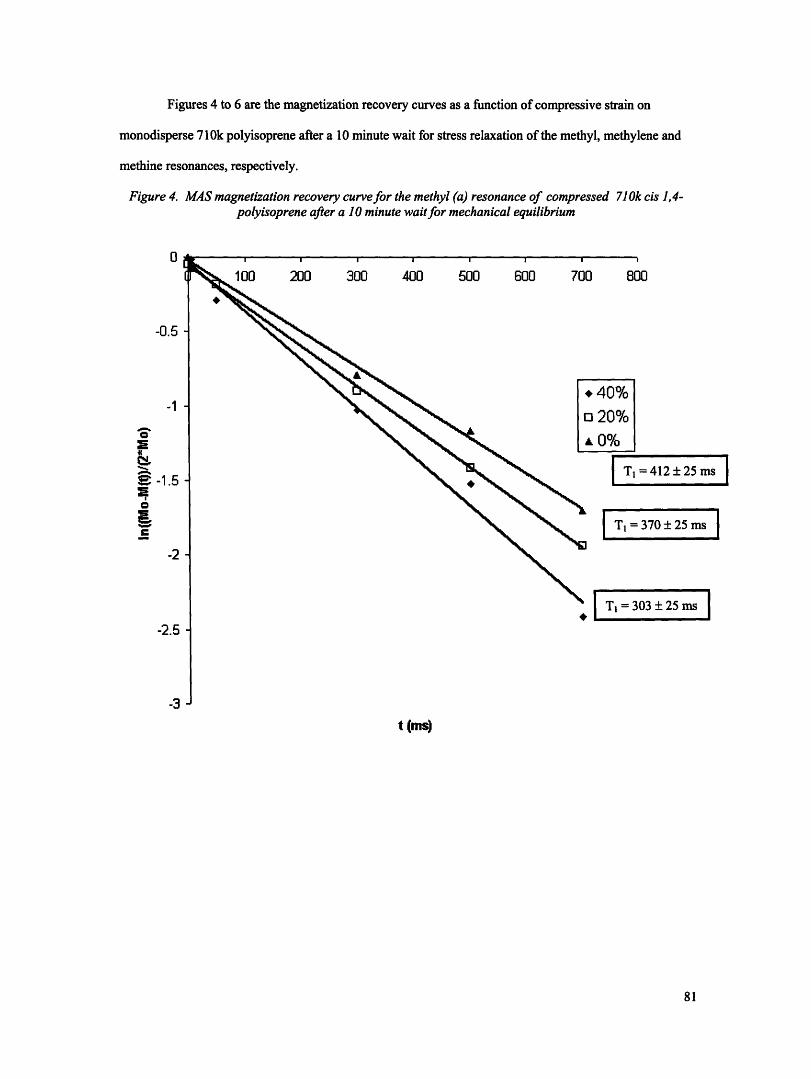
Figures 4 to 6 are the magnetization recovery curves as a function of compressive strain on
monodisperse 710k polyisoprene after a 10 minute wait for stress relaxation of the methyl, methylene and
methine resonances, respectively.
Figure 4. MAS magnetization recovery curve for the methyl (a) resonance of compressed 710k cis 1,4-polyisoprene after a 10 minute waitfor mechanical equilibrium
10
=412 25 ms
370 ± 25 ms
03 + 25 ms
t (ms)
81
U
-0.5
-1
-241e -1.5E
-2
-2.5
.e-J
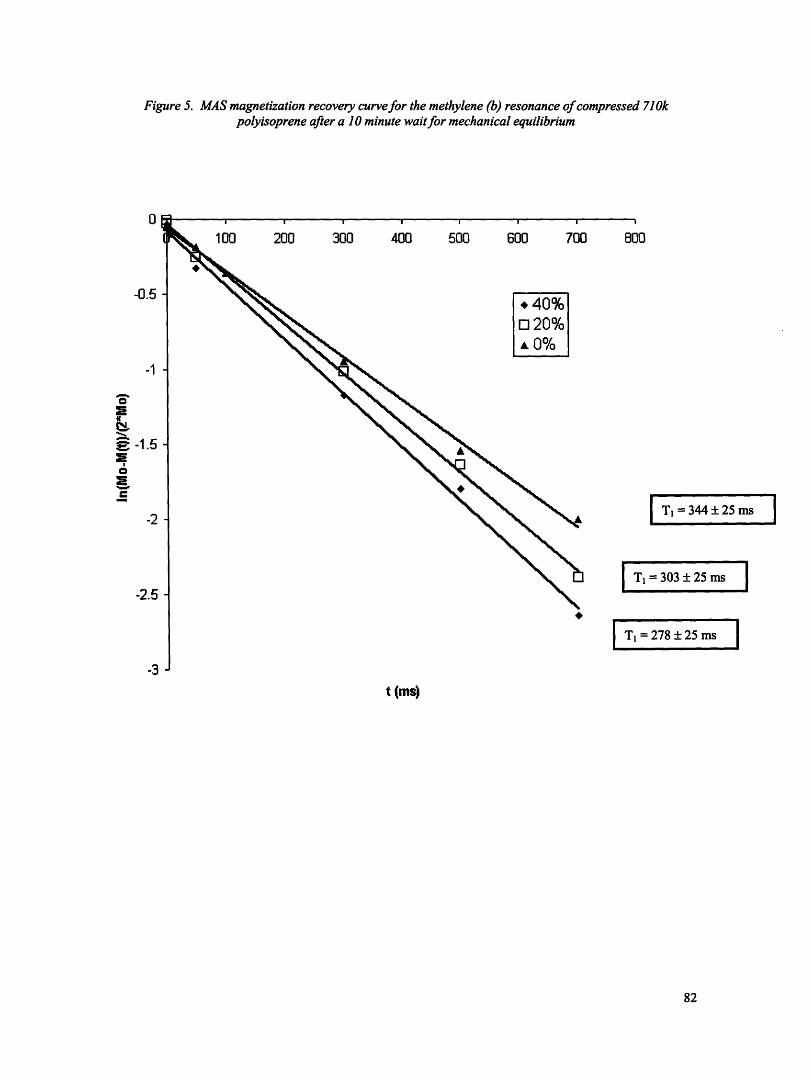
Figure 5. MAS magnetization recovery curvefor the methylene (b) resonance of compressed 710kpolyisoprene after a 10 minute waitfor mechanical equilibrium
10
303 25 ms
= 278 + 25 ms
t (ms)
82
3000
-0.5
-1
i
Z -1.5
-2
-2.5
-3
T, = 344 ± 25 ms
=
!II
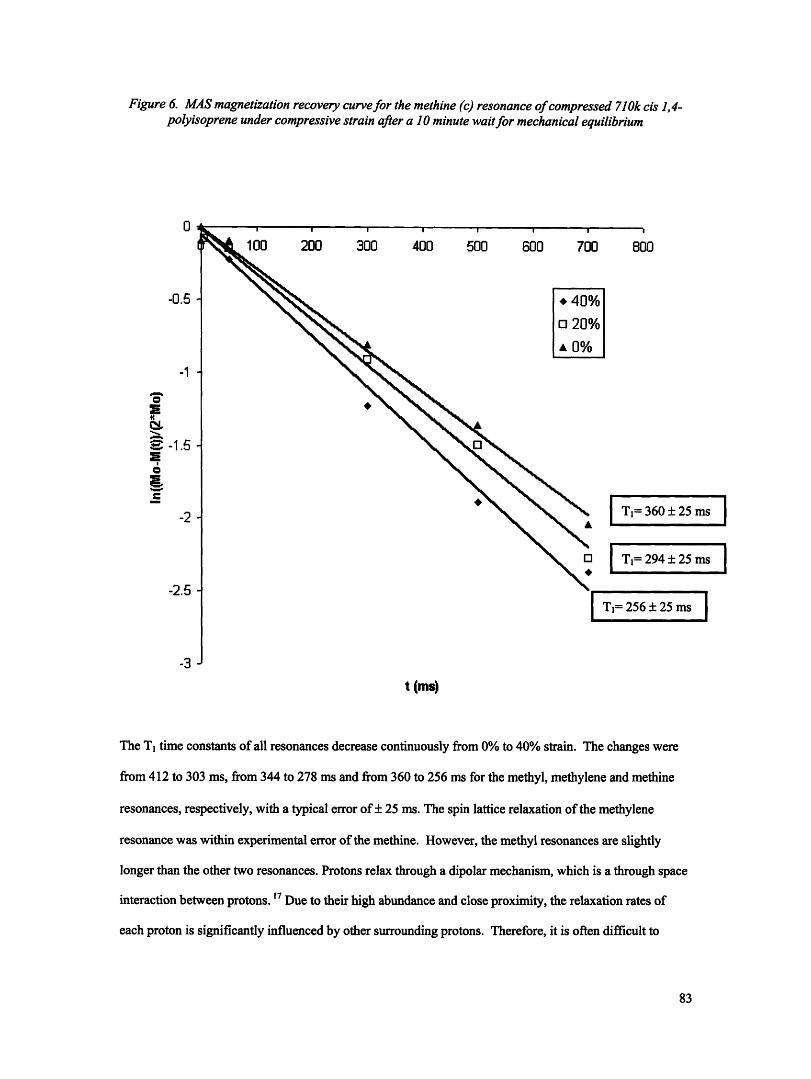
Figure 6. MAS magnetization recovery curve for the methine (c) resonance of compressed 710k cis 1,4-polyisoprene under compressive strain after a 10 minute waitfor mechanical equilibrium
300 400 500 600 700 800
+ 40%
o 20%
[%
jI
t (ms)
The T1 time constants of all resonances decrease continuously from 0% to 40% strain. The changes were
from 412 to 303 ms, from 344 to 278 ms and from 360 to 256 ms for the methyl, methylene and methine
resonances, respectively, with a typical error of + 25 ms. The spin lattice relaxation of the methylene
resonance was within experimental error of the methine. However, the methyl resonances are slightly
longer than the other two resonances. Protons relax through a dipolar mechanism, which is a through space
interaction between protons. 17 Due to their high abundance and close proximity, the relaxation rates of
each proton is significantly influenced by other surrounding protons. Therefore, it is often difficult to
83
0
-0.5
-1
E
41
.1.5
-2
-2.5
-3
=
identify individual behaviors of each chemically distinguishable proton.'7 Since the methylene and methine
resonances are within error of one another it is likely that the dipolar communication between the moieties
lead to the same relaxation rate. The methyl group is known to rotate so quickly that it inefficiently
couples with surrounding nuclei resulting in a longer relaxation than other protons.18 Therefore, the longer
relaxation for the methyl group most likely is the result of a faster rotation in comparison to the other
protons.
There are numerous conditions which can change the observed spin lattice relaxation time
constant that can be categorized as changes in either chain mobility or the surrounding chain environment.
Most commonly, changes in spin lattice relaxations are associated with changes in the mobility of the
chemical moieties. For this study, polyisoprene's relaxations are in the x<<l region of the spectral
density curve since the measured T2 was less than T.. 17 This means that a shorter T1 time constant implies
a faster correlation time for molecular motion, at the Larmor frequency (270 MHz) time scale. The spin
lattice relaxation can be caused by dipolar mechanism mitigated by motional averaging of the chains
(Tldipolar), or by the presence of other faster relaxation modes in the protons environment (TIcenter) (Eq 2).
Eq 2: /Tlobserved = /Tcenter + l/Tldipolar
Therefore, there are a variety of explanations for the observed decrease in the spin lattice relaxation time
constants with an increase in strain. They include a situation in which there are no fast relaxing centers and
the observed T, decreases simply because of faster segmental mobility. Or it could be a situation where
there is an additive contribution that includes fast relaxing centers from more mobile chain ends or the
formation of dangling bond paramagnetic centers.
Argon and coworkers simulated the deformation mechanics of glassy solids, such as copper and
zirconium alloys.20 Small strains on the solid create plastic flow leading to local dilation of the atoms.
Furthermore, this dilation is followed by a local incremental increase in the maximum shear strain. Given a
constant volume there are local regions of inelastic dilation due to an increased flow concentration creating
a shear activity in the range of 0.5-0.1 for a macroscopic external strain of 5x10' 4. 20 Therefore, plastic flow
caused by strain results in localized dilation which increases the mobility of the atoms. Furthermore, they
found that once strain was released plastic flow ceased and the dilation was removed. For an elastomer, the
plastic flow can result in the mobility of the internuclear vector associated with the individual repeat
84
units.21 The compressive strain disturbs the chains from their equilibrium configuration, causing the
polymer to flow and resulting in localized increase in dilation and shear strain.
Under this mechanism, the decrease in the spin lattice relaxation time constant results from the
plastic flow of the polymer chains increasing their molecular mobility. This is consistent with the
observations in Figure 4 to 6. Furthermore, presumably the larger the macroscopic strain the larger the
local shear activity and dilation creating a larger mobility and lower spin lattice relaxation time constant.
However, the large differences in the spin lattice relaxation observed in Figures 4 to 6, are unparalleled in
comparison to observation of other in situ compression experiments. 9 In addition, one would expect the
spin lattice relaxation time constant to return to its original value after the mechanical strain has been
removed. As seen in Figure 3 ,the spin lattice relaxation time constant does not change after the strain is
removed.
Nakaoki and coworkers, using methyl terminated monodisperse polyethylene (MN=1138 g/mol),
were able to distinguish the relaxation of the end groups from the internal repeat units of the polymer.
Using MAS carbon-13 NMR, they found a faster spin lattice relaxation of methyl terminated end caps (Tl=
1.6 s) compared to the internal repeat units of the chain (T,=32 s).19 This suggests that NMR spin lattice
relaxation times may decrease if a sufficient concentration of highly mobile chain ends are present in order
to decrease the expected value from that of the more immobile repeat units.
Therefore, it is possible that these faster motions of the chain ends act as centers for relaxation for
the chain segments. In the presence of rapidly rotating chain ends, the observed spin lattice relaxation
should be an additive effect of the motionally averaged dipolar (Tldipolr) and the chain ends contribution
(Ticter) (Eq 2).26 The observed spin lattice relaxation time constant would decrease only if the chain ends
came into closer proximity to the segments causing an increased communication between the two moieties.
However, the chain ends are likely randomly distributed throughout the polymer. Upon compression the
chain ends should maintain their same spatial distribution with surrounding segments. Therefore, the spin
lattice relaxation is not likely to change due to the chain ends.
Chain rupture due to deformation has been experimentally and theoretically investigated for a
variety of semicrystalline and rubbery polymers. 22 24 Theoretically, chain rupture is likely to occur when
the chain has been fully extended from its Gaussian configuration to its extended end-to-end length. For
85
elastomers chemical crosslinks limit the extensibility of the chain to dimensions less than the theoretical
end-to-end distance. Case and coworkers found that the extensibility of an elastomer is inversely related to
the crosslink density and degree of functionality of the crosslinks. 25 These results have been verified by
Mead and coworkers who found that peroxide crosslinked polyisoprene and polybutadiene were susceptible
to chain scission at high tensile strains (100%).24 Using electron spin resonance, it was determined that the
allylic radical decays rapidly to a peroxy radical due to recombination with atmospheric oxygen, when the
polymer is held above T. 25
Using this mechanism, the T1 time constants would decrease due to chain rupture with increasing
compressive strain. As the chains ruptures, the dangling bonds act as paramagnetic centers for more
efficient spin lattice relaxation of the protons on the polymer. The expected amount of chain rupture can be
determined by finding the expected concentration of paramagnetic chain ends.
The paramagnetic contribution for a system with spin diffusion has been worked out by others, 2627
who have found an inverse dependence of the spin lattice relaxation time constant with the concentration of
paramagnetic centers. This implies that as the polymer is exposed to more paramagnetic centers the spin
lattice relaxation time constant would decrease. From Figures 4 to 6, with a 40% compressive strain, there
is a 26 + 8%, 19 + 9% and 27 + 9% decrease in the T1 of the methyl, methylene and methine resonances,
respectively. In the presence of paramagnetic centers the observed spin lattice relaxation should be an
additive effect of the motionally averaged dipolar (Tldipolr) and paramagnetic contributions (T1p,, Tl,, )
(Eq 2).26 The changes observed in Figures 4 to 6 for the T, time constant are more reasonable for what
would be expected from the formation of paramagnetic centers.27 It is expected there would be no preferred
interaction of each chemically distinguishable proton with the paramagnetic centers. Therefore, as seen in
Figures 4 to 6, each proton responds to the strain with a decrease in T, time constants. Furthermore, if the
chains ruptured we would expect there would be no reversible change in the T1 after releasing the load. As
seen in Figure 3 there was no change in the T1 time constant when strain was released, or as a function of
time. Even if the radicals on the chain ends terminated, it is plausible that the decreased molecular weight
of the polyisoprene could cause a decrease in the observed spin lattice relaxation time constant since
molecular mobility of the shorter chains is greater and there is an increased concentration of chain ends.
86
Although the formation of paramagnetic centers is qualitatively consistent with the observed
trends, additional experiments need to be undertaken in order to fully validate this mechanism. Principally,
fracture mechanics is most commonly explored using electron spin resonance (ESR) in order to identify
and quantify the presence of free radicals. The unique compression device used in these NMR experiments
could be easily modified to be used in ESR measurements.
Conclusion
These are the first experiments to be reported on the high frequency motions occurring during
stress relaxation. Magic angle spinning allowed us to reduce the effect of dipolar coupling and observe
each proton on the cis 1,4-polyisoprene backbone. There was a decrease in the T1 time constants with an
increase in compressive strain for each resonance. There was no change in the proton spin lattice relaxation
time constants as a function of time suggesting the change in relaxation was caused by an irreversible
mechanism. We hypothesize that these faster relaxations are most likely the result of chain rupture which
creates paramagnetic centers. This explanation creates an irreversible change in the observed mobility, as
evidenced in the spin lattice relaxation time constant once the load is released.
87
References:
1.Erman, B.; Mark, J.E. Structures and Properties of Rubberlike Networks Oxford University:Oxford1997.
2.Torchia, D.A. J Magn Reson 1982, 49, 107.
3. Sato, H.; Tanka, Y. J Polym Sci Pol Chem 1979, 17 3551
4. Blumberg, W.E. Phys Rev 1960, 119, 79.
5. Kessemeier, H.; Norberg, R.E. Phys Rev 1967, 155, 321.
6. Salamon, M.B. Phys Rev 1967, 155, 224.
7. Mooney, M.; Wolstenholme, W.E; Villars, D.S. J. Appl. Phys. 1994, 15, 324.
8. Tobolsky, A.V.; Prettyman, F.B.; Dillon, J.H. J. Appl. Phys. 1944, 15, 324.
9. Von Meerwall, E; Ferguson, R.D. J. Poly. Sci. 1981, 19, 77.
10. Oshima, K.; Kusumuto, H. . J.Chem.Phys. 1956, 24, 913.
11. Gutowsky, H.S.; Meyer, L.H. J.Chem.Phys. 1953, 21, 2122.
12. Flory, P.J. Principles of Polymer Chemistry Cornell University Press: New York 1953.
13. Loo, S.S.; Cohen, R.E.; Gleason, K.K. Macromolecules 1998, 31, 8907.
14. Di Marzio, E.A.; Guttman, C.M. Macromolecules 1987, 20, 1403.
15. Brown, S; Lenczycki, T.; Szamel, G. Phys Rev E 2001, 63, 52801.
16. Komoroski, R.A; Mandelkern, L. J. Polym. Sci. Symp. 1976, 54, 227.
17. Tyco, R. Nuclear Magnetic Resonance Probes of Molecular Dynamics Kluwer Acedemic Publishers:Boston 1994.
18.Faller, R.; Muller-Plathe, F.; Doxastakis, M.; Theodorou, D. Macromolecules 2001, 34, 1436.
19. Nakaoki, T.; Kitamoru, R.; Alamo, R.G; Huang, W.; Mandelkern, L. Polymer 2000, 37, 876.
20. Argon; Deng, D. Phil. Trans. Royal Soc. London 1989, 329, 613.
21.Kimmich, R.; Weber, H.W. J. Chem. Phys. 1993, 98, 5847.
22.Nagamura, T. J. Poly. Sci.; Poly. Pys. Ed. 1974, 12, 2019.
23.Treloan, L. Trans. Faraday Soc. 1946, 42, 83.
24.Mead, W.T.; Reed, P.E. Poly. Eng. Sci. 1974, 14, 22.
25.Case, L.C. Die Makromoleculare Chemie 1960, 37, 243.
26. Abragam, A. Principles of Nuclear Magnetic Resonance; Oxford University Press: Oxford, 1961.
88

27. Labouriau, A.; Kim, Y.; Earl, L. Phys Rev B 1996, 54, 9952.
28. Torchia, D.A. J Magn Reson 1982, 49, 107.
89

Chapter 6
Summary and Future Work
90
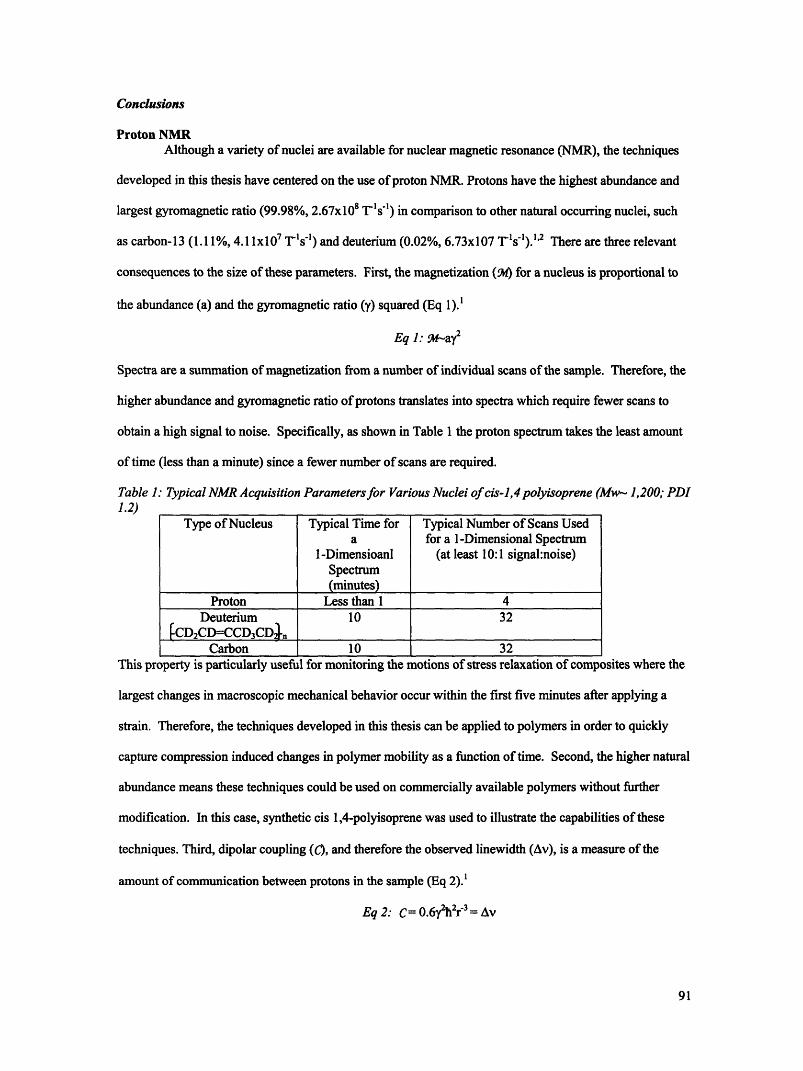
Conclusions
Proton NMRAlthough a variety of nuclei are available for nuclear magnetic resonance (NMR), the techniques
developed in this thesis have centered on the use of proton NMR. Protons have the highest abundance and
largest gyromagnetic ratio (99.98%, 2.67x10⁸ T's ) in comparison to other natural occurring nuclei, such
as carbon-13 (1.11%, 4.1 lx107 T-ls') and deuterium (0.02%, 6.73x10⁷ T-ls').' 2 There are three relevant
consequences to the size of these parameters. First, the magnetization (9) for a nucleus is proportional to
the abundance (a) and the gyromagnetic ratio (y) squared (Eq 1).1
Eq 1: 9W-ay2
Spectra are a summation of magnetization from a number of individual scans of the sample. Therefore, the
higher abundance and gyromagnetic ratio of protons translates into spectra which require fewer scans to
obtain a high signal to noise. Specifically, as shown in Table 1 the proton spectrum takes the least amount
of time (less than a minute) since a fewer number of scans are required.
Table 1: Typical NMR Acquisition Parametersfor Various Nuclei of cis-1,4 polyisoprene (Mw- 1,200; PDI1.2)
Type of Nucleus Typical Time for Typical Number of Scans Useda for a 1-Dimensional Spectrum
l-Dimensioanl (at least 10:1 signal:noise)Spectrum(minutes)
Proton Less than 1 4Deuterium 10 32
[CD2CD=CCD3CDj nCarbon 10 32
This property is particularly useful for monitoring the motions of stress relaxation of composites where the
largest changes in macroscopic mechanical behavior occur within the first five minutes after applying a
strain. Therefore, the techniques developed in this thesis can be applied to polymers in order to quickly
capture compression induced changes in polymer mobility as a function of time. Second, the higher natural
abundance means these techniques could be used on commercially available polymers without further
modification. In this case, synthetic cis 1,4-polyisoprene was used to illustrate the capabilities of these
techniques. Third, dipolar coupling (C), and therefore the observed linewidth (Av), is a measure of the
amount of communication between protons in the sample (Eq 2).1
Eq 2: C= 0.6y2 h2r3= Av
91
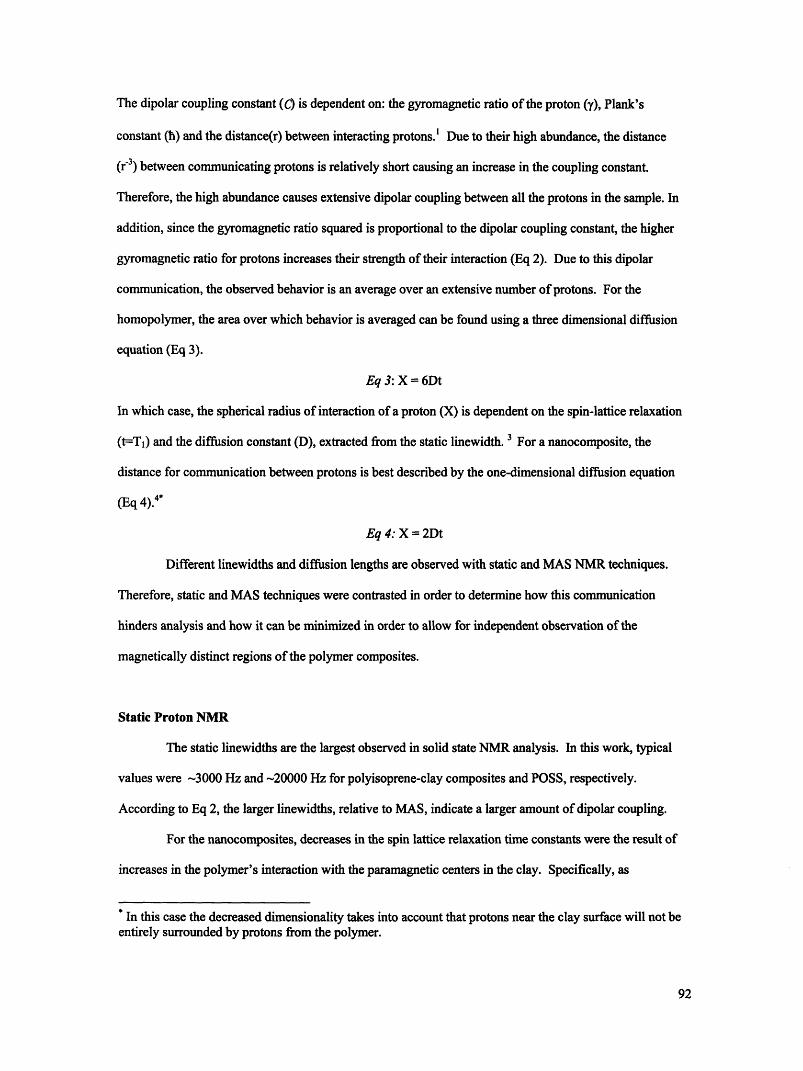
The dipolar coupling constant (C) is dependent on: the gyromagnetic ratio of the proton (), Plank's
constant (h) and the distance(r) between interacting protons.' Due to their high abundance, the distance
(r-3) between communicating protons is relatively short causing an increase in the coupling constant.
Therefore, the high abundance causes extensive dipolar coupling between all the protons in the sample. In
addition, since the gyromagnetic ratio squared is proportional to the dipolar coupling constant, the higher
gyromagnetic ratio for protons increases their strength of their interaction (Eq 2). Due to this dipolar
communication, the observed behavior is an average over an extensive number of protons. For the
homopolymer, the area over which behavior is averaged can be found using a three dimensional diffusion
equation (Eq 3).
Eq 3: X = 6Dt
In which case, the spherical radius of interaction of a proton (X) is dependent on the spin-lattice relaxation
(t-TI) and the diffusion constant (D), extracted from the static linewidth. 3 For a nanocomposite, the
distance for communication between protons is best described by the one-dimensional diffusion equation
(Eq 4). 4
Eq 4: X = 2Dt
Different linewidths and diffusion lengths are observed with static and MAS NMR techniques.
Therefore, static and MAS techniques were contrasted in order to determine how this communication
hinders analysis and how it can be minimized in order to allow for independent observation of the
magnetically distinct regions of the polymer composites.
Static Proton NMR
The static linewidths are the largest observed in solid state NMR analysis. In this work, typical
values were -3000 Hz and -20000 Hz for polyisoprene-clay composites and POSS, respectively.
According to Eq 2, the larger linewidths, relative to MAS, indicate a larger amount of dipolar coupling.
For the nanocomposites, decreases in the spin lattice relaxation time constants were the result of
increases in the polymer's interaction with the paramagnetic centers in the clay. Specifically, as
In this case the decreased dimensionality takes into account that protons near the clay surface will not beentirely surrounded by protons from the polymer.
92
compressive strain was increased the clay aggregate sheared apart increasing the polymer's contact with the
natural occurring paramagnetic iron in the clay structure. The breadth of the peak prevented the spin lattice
relaxation time constants from being assigned to a particular moiety. For the nanocomposites, each proton
had a distance of interaction of 3.1 nm (Eq 4). Therefore, due to this extensive communication between
protons, changes in the spin lattice relaxation time constants described a change in the average proton
behavior in the composite.
Finally, abrupt changes in the static proton spin-lattice relaxation time constants marked a change
in the molecular mobility caused by phase changes in POSS crystals. However, intramolecular
interactions, between protons on the same molecule, and intermolecular interactions, between protons on
adjacent molecules, both dictated the relaxation. Using Eq 3, the spherical radius of interaction for an
average proton was 26.3 nm and 27.7 nm for fully protonated and partially deuterated POSS, respectively.
Therefore, due to the extensive dipolar coupling, the effect of these two mechanisms was averaged when
observed with static proton NMR.
Magic Angle Spinning (MAS) Proton NMR
Although static in situ NMR compression measurements have been previously reported, these are
the first to be done while acquiring spectra under MAS. In order to remove some of the ambiguity caused
by the extensive dipolar coupling, the in situ compression device was modified to fit in a ceramic MAS
rotor. By spinning at a frequency larger than the static linewidth at the magic angle (0=54.740) the dipolar
coupling is averaged to zero during the cycle of a rotor period. As a result, the resonances were resolved to
the isotropic chemical shifts causing typical linewidths of -50 Hz, for both the polyisoprene and
polyisoprene-clay composites.
Using MAS, the observed resonances of polyisoprene were further refined to the chemical shifts
of the three chemically distinguishable protons: the methyl, methylene and methine. This allowed for
individual spin-lattice relaxation time constants for each distinguishable proton to be monitored,
independently. Each distinguishable proton was equally sensitive changes in compressive strain. Using
Eq 3, the changes in linewidth translates into a 0.7 nm spherical radius of interaction for each proton. This
identical behavior of each proton suggests that all the dipolar communication was not completely disrupted
93
with MAS. The distance between protons on the same repeat unit are likely to be less than 0.7 nm apart
leading to communication and identical spin lattice relaxation time constants for the methylene and methine
resonances.
Similar to the homopolymer, the nanocomposite spectra could be resolved to the isotropic
chemical shifts of the chemically distinguishable protons. However, there were no observed differences in
the behavior of each moiety with compressive strain. Using Eq 4, the changes in linewidth translates into a
1.1 nm distance of interaction. Therefore, MAS could be used to independently monitor polymer close to
the clay surface and polymer far removed from the clay aggregate. Furthermore, it was found that only the
polymer within 1.1 nm of the clay surface responded to the changes in interfacial area of the aggregate.
The static POSS experiments illustrate the limitations of the MAS technique. The linewidths for
these spectra were between 16000-20000 Hz depending on the labeling of the ethyl substituent. The
maximum spin speed for the Chemagnetic's 7.5 mm probe is 6000 Hz. Therefore, it was not possible to
spin outside the static linewidth to fully resolve these spectra. In effect, these MAS techniques are only
useful for polymers which have a static linewidth less than 6000 Hz. This limits the possible materials to
those with high intrinsic mobility, such as elastomers.
Observations of the Materials: Polyisoprene, Clay-Polyisoprene Nanocomposites, POSS Crystals
Magic angle spinning proton NMR was used to measure the strain dependent spin lattice
relaxation behavior of cis 1,4-polyisoprene. The spin lattice relaxation time constants continually
decreased with an increase in compressive strain. Furthermore, the use of proton NMR allowed us to
monitor the spin lattice relaxation at various points during the macroscopic stress relaxation. We found that
the spin lattice relaxation time constants did not changes as a function of time or when the load was
released from the sample. Therefore, we conclude that this irreversible deformation is consistent with the
possibility of strain induced chain rupture.
Using these NMR techniques, increases in polymer-clay interfacial area were observed with
increased clay dispersion and increased compressive strain. As the chemistry of the surfactant matched that
of the homopolymer, there was an increase in the polymer-clay interfacial area identified by a decrease in
the spin lattice relaxation time constant. In terms of the observed mechanical behavior, the spin lattice
94
relaxation time constants decreased as the polymer-clay interfacial area increased due to the shearing of
clay aggregates. Most composites showed at least a doubling of interfacial area after 40% compressive
strain. For polyisoprene-laponite composites, the changes in interfacial area were verified with optical
microscopy. As opposed to microscopy techniques, NMR allows for observations of the bulk behavior
without the need for statistical sampling.
Finally, phase transitions were identified and the changes in molecular mobility were
characterized, with static proton and deuterium NMR, for fully protonated (253 K) and partially deuterated
(258 K) ethyl POSS. A change in isotropic labeling resulted in an increase in the transition temperature.
Both derivatives experience fast molecular tumbling at high temperatures and slow molecular tumbling past
their respective transitions. Specifically, past their respective transitions there is an increase in correlation
time and activation energy for molecular tumbling observed with solid state NMR. Calorimetry and
powder diffraction were used to corroborate a first order solid-solid phase transition occur for both
derivatives of ethyl POSS. Further work on materials with a clean addition of the deuterium isotope would
aid in further characterizing the motions and changes in the transition point.
Future Work
Further improvements in minimizing dipolar coupling could lead to refinement of some of the
conclusions made on the materials used in this thesis. One of the advantages of the designed MAS
compression device is that the isotropic chemical shift of the chemically distinguishable resonances of
other nuclei can be observed while the polymer is compressed. The carbon-13 nucleus could be an
enlightening alternative to proton NMR. Carbon-13 is less abundant and therefore would require more
scans to obtain a comparable signal-to-noise to these proton spectra. However, the decreased natural
abundance also decreases dipolar coupling perhaps allowing for a more detailed analysis of the changes in
mobility. In the case of polyisoprene, other authors have identified differences in the mobility of
chemically distinguishable carbons using MAS solid state NMR. For instance, Schaefer found that the
methyl carbon (T1= 52 ms) has a shorter relaxation than the alkene carbons (T1= 95 ms). 5 Likewise, there
may be differences in the response of each chemically distinguishable carbon to changes in compressive
strain.
95
We have found in the context of this work, that magic angle spinning allows for isolated
observation of different regions of a polymer composite while under mechanical deformation. Therefore,
these techniques could be applied to other composites in order to identify changes in molecular level
mobility at the interface. One attractive alternative is epoxidized polyisoprene blended with monodispersed
silica beads. Cataldo found improved mechanical strength of epoxidized polyisoprene when the polymer
was blended with untreated silica. He hypothesized this improvement in macroscopic mechanical
properties was the result of the polymer hydrogen bonding with the silica surface.6 Using the MAS
technique, the polyisoprene adjacent to the surface could be monitored separately from the bulk. The
strength of the hypothesized hydrogen bonding could be identified using variable temperature NMR. At
higher temperatures the spin lattice relaxation should decrease due to a decrease in hydrogen bonding as a
result of increased molecular mobility. Similarly under compressive strain, the interactions of the interface
may decrease as the mobility of the polymer increases.
Traditional fillers, such as glass fibers and carbon black, are often crosslinked to the matrix.7
Increases in mechanical behavior is the result of the energy dissipation caused by breaking the covalent
bonds between the interface of the polymer and inorganic filler. Likewise it is anticipated that if
polyisoprene were covalently bonded to the clay surface there would be an improvement in the mechanical
modulus. This work has indicated that shearing of clay aggregates is a mechanism of deformation at
relatively low amount of compressive strain in samples which are not covalently bonded to the matrix.
These developed techniques could be used to determine if the same mechanism occurs in a polymer system
where the polymer chains are directly bonded to the composite or if the same mechanism occurs at a higher
level of strain. The changes in mechanism can then be related to any observed changes in the macroscopic
mechanical properties. Based on the work of traditional fillers it is anticipated that halting the shearing
mechanism may result in improved mechanical strength.
The composites studied in this thesis was considered to be randomly oriented. According to
Mohr's circle, the largest amount of shearing should occur for the clay aggregates which are oriented at a
45 ° angle to the principle axis of deformation.8 The orientation of the clay aggregates could be controlled
by spin casting multiple layers and allowing them to fuse into a contiguous sample. After spin casting the
clay aggregates would be aligned parallel with the surface of the spin coater. The aggregates can be
96
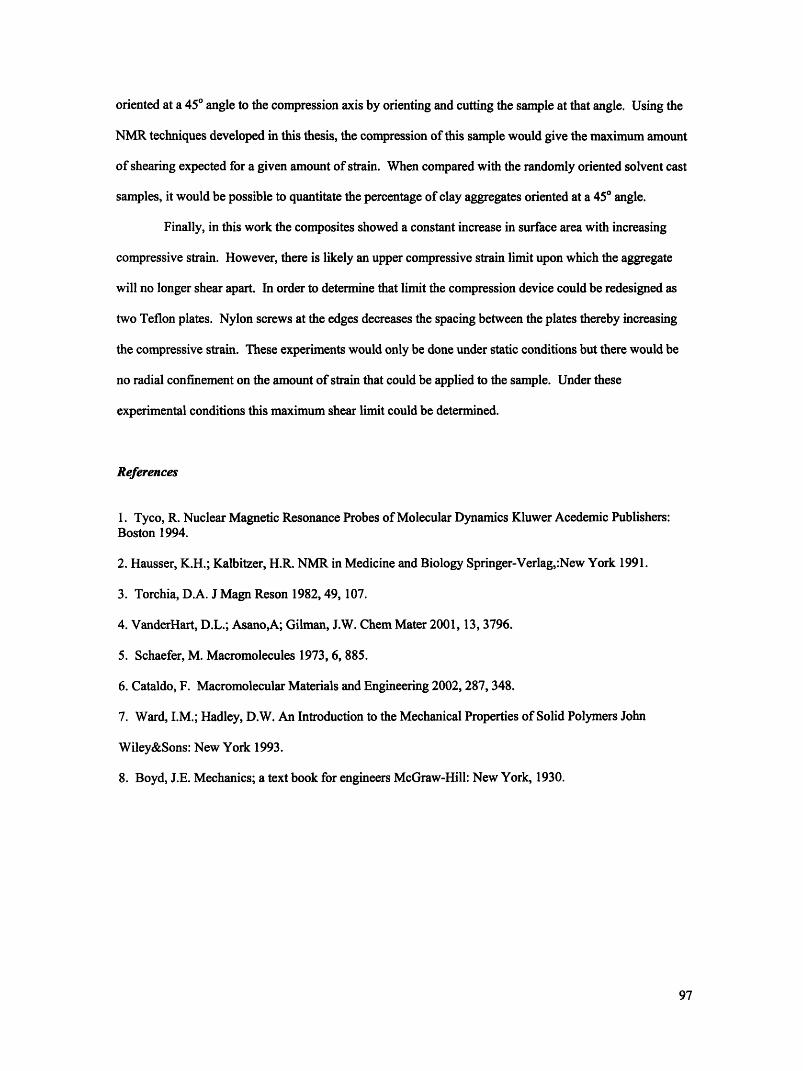
oriented at a 450 angle to the compression axis by orienting and cutting the sample at that angle. Using the
NMR techniques developed in this thesis, the compression of this sample would give the maximum amount
of shearing expected for a given amount of strain. When compared with the randomly oriented solvent cast
samples, it would be possible to quantitate the percentage of clay aggregates oriented at a 450 angle.
Finally, in this work the composites showed a constant increase in surface area with increasing
compressive strain. However, there is likely an upper compressive strain limit upon which the aggregate
will no longer shear apart. In order to determine that limit the compression device could be redesigned as
two Teflon plates. Nylon screws at the edges decreases the spacing between the plates thereby increasing
the compressive strain. These experiments would only be done under static conditions but there would be
no radial confinement on the amount of strain that could be applied to the sample. Under these
experimental conditions this maximum shear limit could be determined.
References
1. Tyco, R. Nuclear Magnetic Resonance Probes of Molecular Dynamics Kluwer Acedemic Publishers:Boston 1994.
2. Hausser, K.H.; Kalbitzer, H.R. NMR in Medicine and Biology Springer-Verlag,:New York 1991.
3. Torchia, D.A. J Magn Reson 1982, 49, 107.
4. VanderHart, D.L.; Asano,A; Gilman, J.W. Chem Mater 2001, 13, 3796.
5. Schaefer, M. Macromolecules 1973, 6, 885.
6. Cataldo, F. Macromolecular Materials and Engineering 2002, 287, 348.
7. Ward, I.M.; Hadley, D.W. An Introduction to the Mechanical Properties of Solid Polymers John
Wiley&Sons: New York 1993.
8. Boyd, J.E. Mechanics; a text book for engineers McGraw-Hill: New York, 1930.
97

Appendices
98
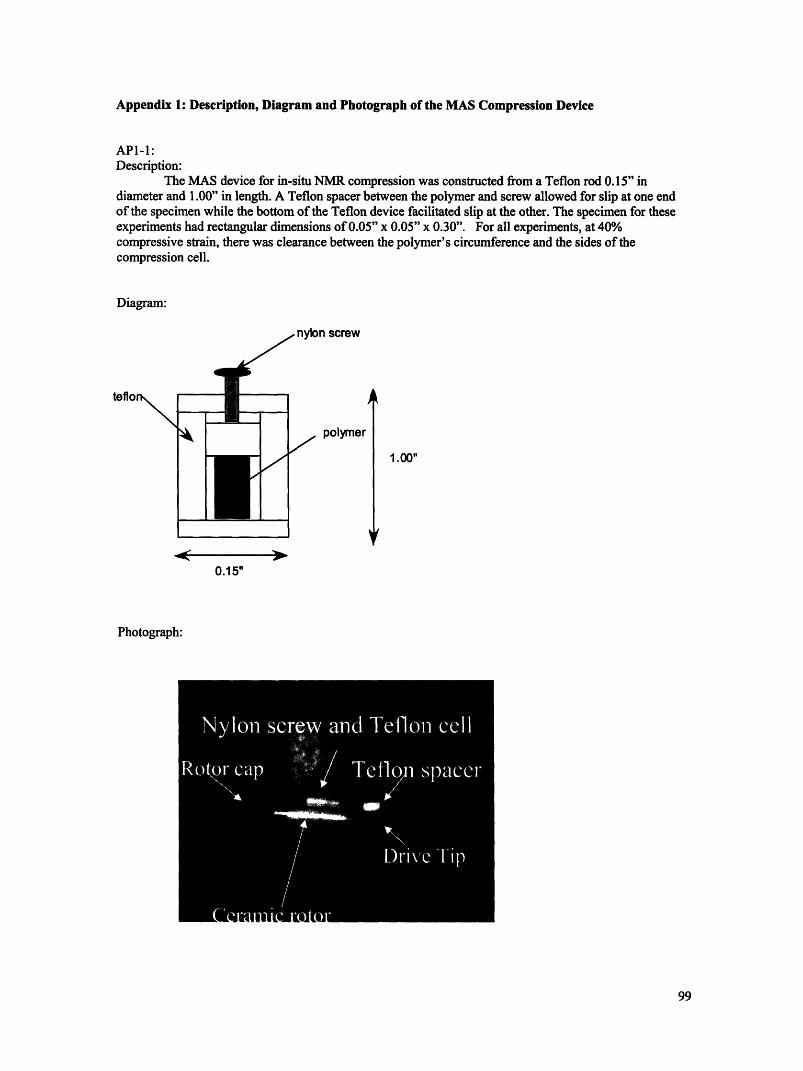
Appendix 1: Description, Diagram and Photograph of the MAS Compression Device
API-1:Description:
The MAS device for in-situ NMR compression was constructed from a Teflon rod 0.15" indiameter and 1.00" in length. A Teflon spacer between the polymer and screw allowed for slip at one endof the specimen while the bottom of the Teflon device facilitated slip at the other. The specimen for theseexperiments had rectangular dimensions of 0.05" x 0.05" x 0.30". For all experiments, at 40%compressive strain, there was clearance between the polymer's circumference and the sides of thecompression cell.
Diagram:
nurln Draw·
polymer
1.00"
f
J
0.15"
Photograph:
99
ill1.~~
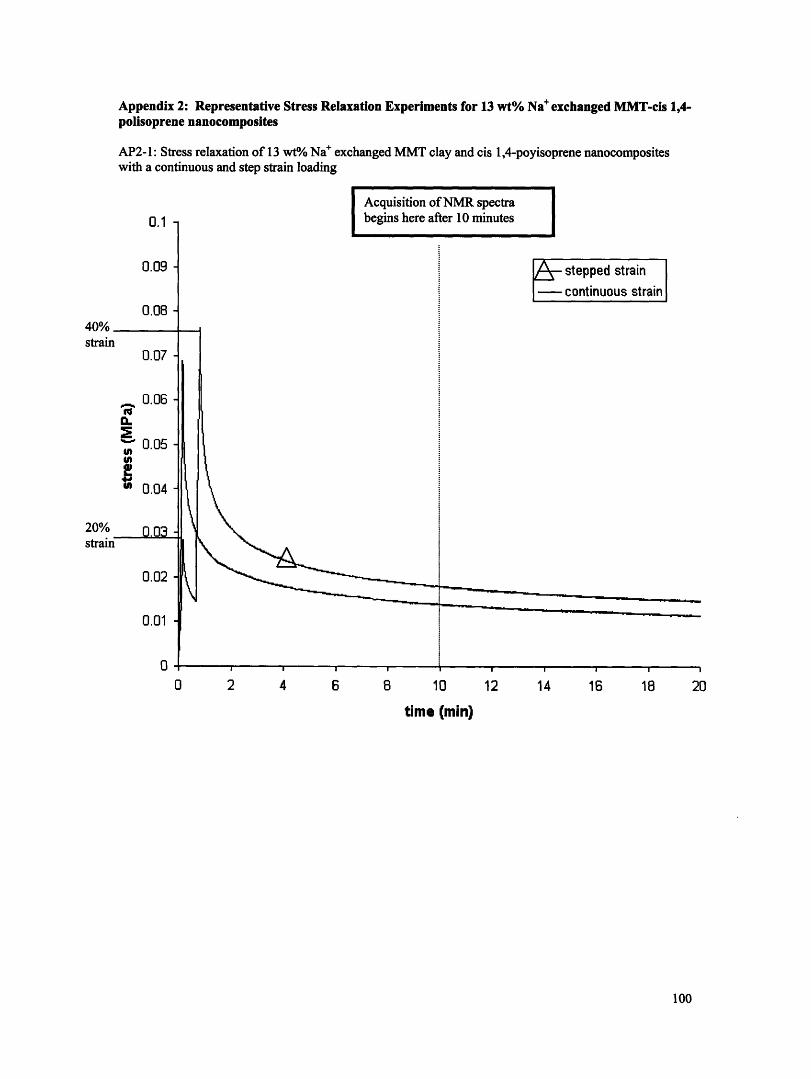
Appendix 2: Representative Stress Relaxation Experiments for 13 wt% Na+exchanged MMT-cis 1,4-polisoprene nanocomposites
AP2-1: Stress relaxation of 13 wt/o Na+ exchanged MMT clay and cis 1,4-poyisoprene nanocompositeswith a continuous and step strain loading
I Acquisition of NMR spectrabegins here after 10 minutes I
By stepped strain- continuous strain
0 2 4 6 8 10 12 14 16 18 20
time (min)
100
nI4
0.07
.06
Em
4i nnm, nnAi
40%strain
20%strain
U.Uq'
0.02
0.01
0
Appendix 3: Representative MAS 1H Compression Studies of MMT-Polyisoprene Samples
AP3-1: Plot of normalized magnetization versus the square root of the delay time for the methylene
resonance of 25A modified MMT-polyisoprene composite as a function of compressive strain
U.4
0.2
0
-0.2
-0.40
a -0.6
-0.8
-1
-1.2
-1.4
1 A
% strain
5
% strain
strain
AP3- 2: Bar graph of the coefficient (s of the 25A modified MMT-polyisoprene
AP3- 2: Bar graph of the coefficient (slope) for the protons of the 25A modified MMT-polyisoprenecomposite
Change in Interfacial Area: 100-120% |
0 20 40strain (%)
0.45
0.4
E 0.35
0.3
c. 0.25
0.2
.' 0.15
o0.1
0.05
0
* methylo methineo methylene
.,,-_
101
ii
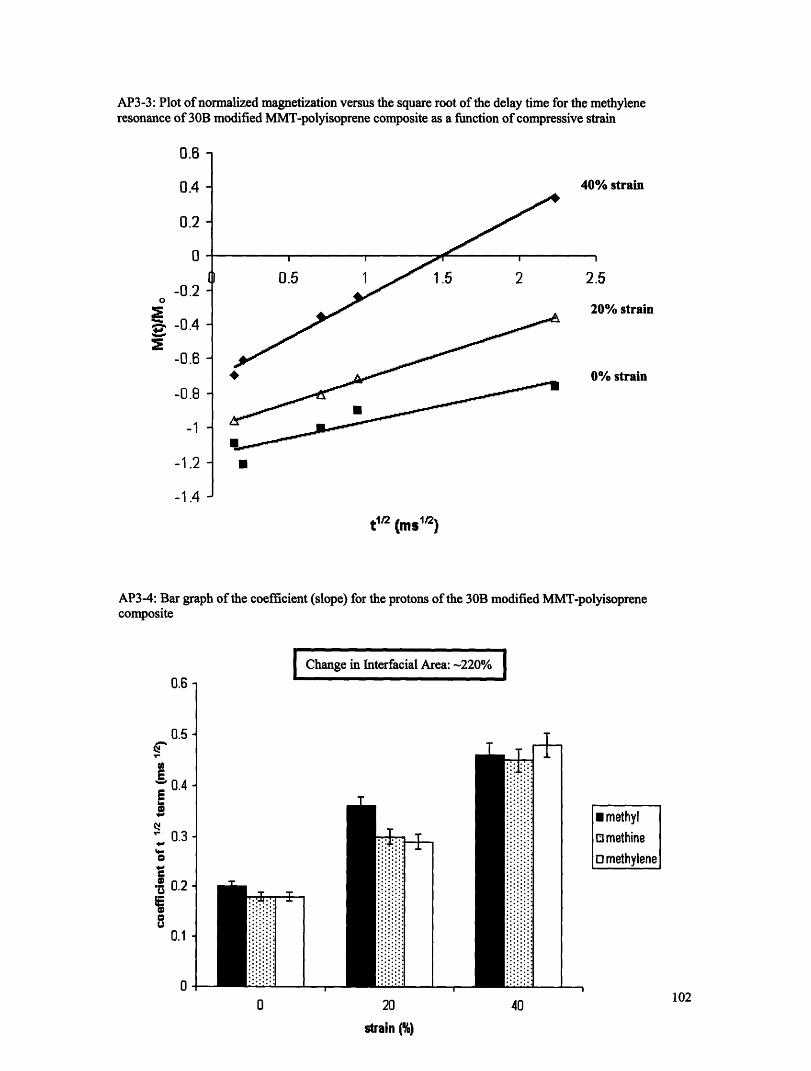
AP3-3: Plot of normalized magnetization versus the square root of the delay time for the methyleneresonance of 30B modified MMT-polyisoprene composite as a function of compressive strain
Yo strain
5
0% strain
% strain
U
.
t' (mslt)
AP3-4: Bar graph of the coefficient (slope) for the protons of thecomposite
30B modified MMT-polyisoprene
Change in Interfacial Area: -220%
T
T
0 20
strain (%)
+
40
* methylo methineo methylene
102
0.6
0.4
0.2
0
0o
2S,2
-0.2
-0.4
-0.6
-0.8
-1
-1.2
-1.4
0.6 -
0.5 -
- 0.4-E
' 0.3-
0.1 -
0
m
lr ,m. .l
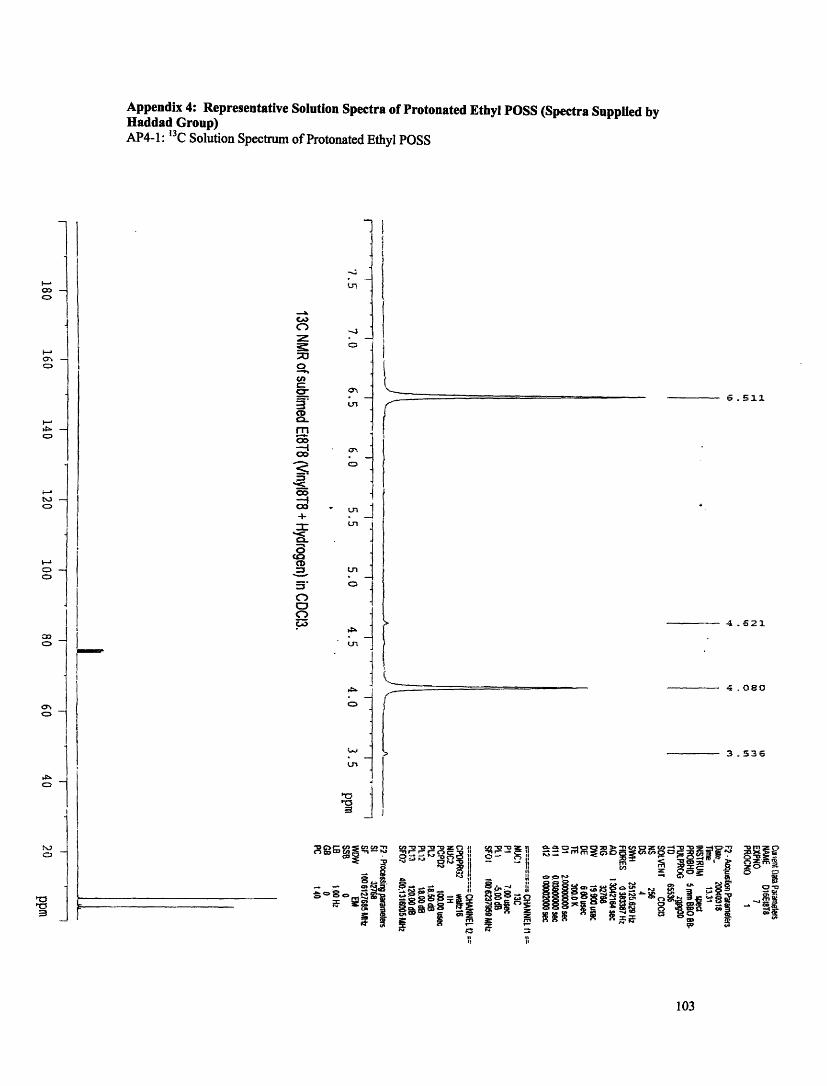
Appendix 4: Representative Solution Spectra of Protonated Ethyl POSS (Spectra Supplied byHaddad Group)AP4-1: 3C Solution Spectrum of Protonated Ethyl POSS
6 . 513.
-- 4 .621
4 .080
3 .536
5;s^va l o $R gCC3g .i { Rci-_ |j - o d-RIP
II1
rm w Z
103
~1tn I. i
uO l.
C i
Lnj0,]c> -W pRni
i
i
ICt:
wl
10l
3_:/
C
-.
CD
Ij
NoC.-
oC-
a'CD
COcoCo
5.C)
CD-
nc
2t s C C,¢ t
- I .- RTZ SP 9& IP
:: --
- -
>
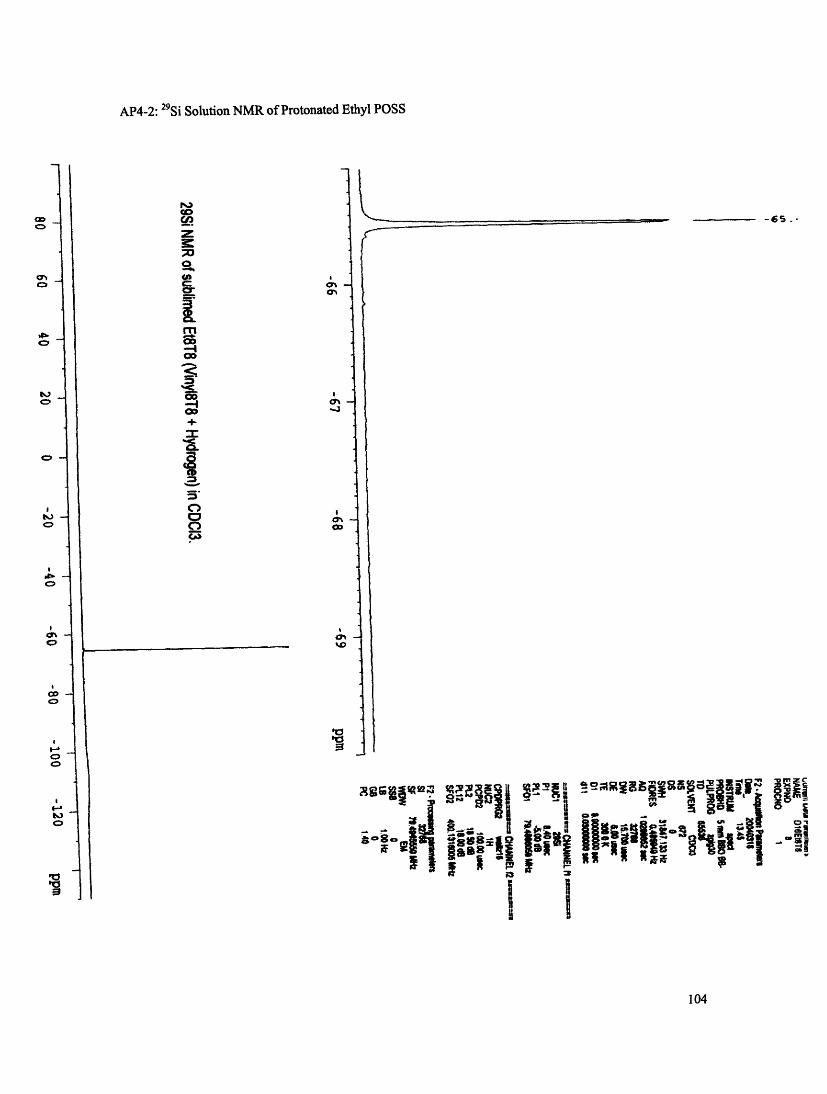
AP4-2: 29Si Solution NMR of Protonated Ethyl POSS
IQIi
O -O~
M
&_
O3
0
-65.
-"
I FT
II
a
n -
0
oO
Os-CO
C6
C:>
C)
0
*T
I i'W-Ima -2 v
104
Iw
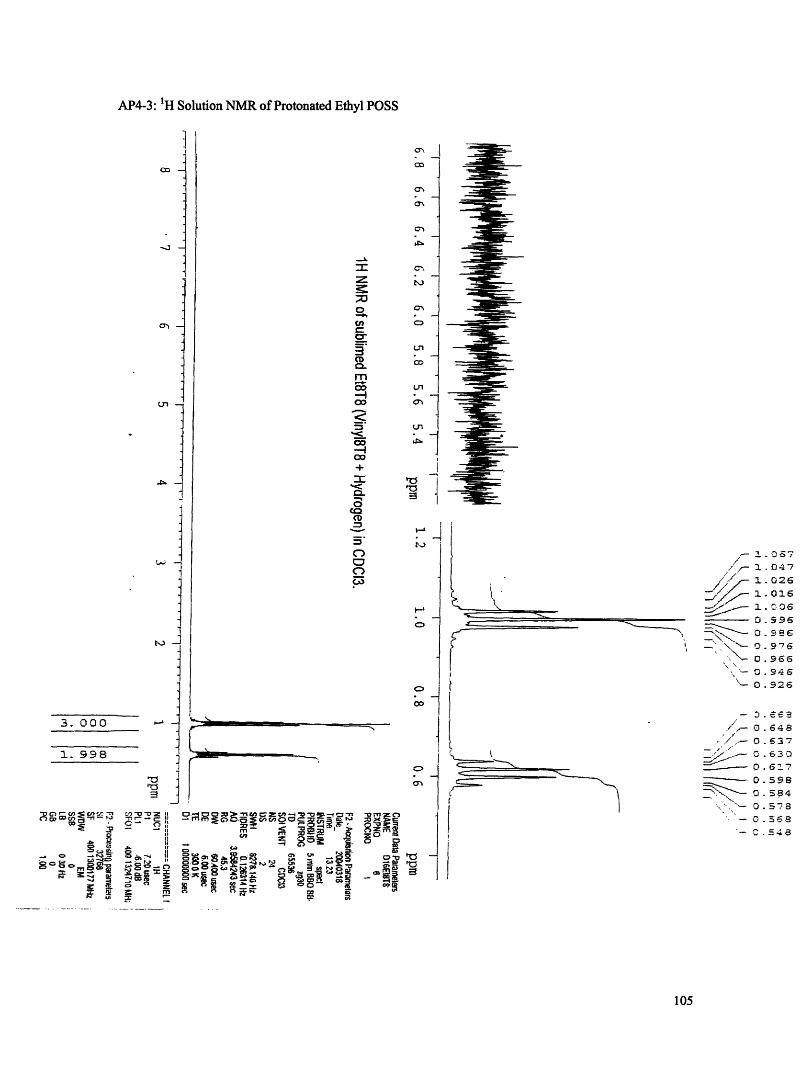
AP4-3: H Solution NMR of Protonated Ethyl POSS
r=
co
-h -
0T~ -ctn _
3. 00
1. 998
jw 1
!
: iI
IIU
m - I,H, 9X' Em-w Ij'!
8 Z ° BG t s 0 in
ff........
all
0\
0Co
C0
3CD
m
co-roo
0,-I0<
ICL
a
5.
C)
C)U
Ln
U,
;-71
mn
4e-
OO
01
'o. i: _6
/,, 1.t047
-'/ 1 -026
/ 0 16
1 06_ - o. 9965
- I- 3 996
C-0 .966. -- O. 946
'- 0.926
64-- 0 . 637
'- o. 30
0 . I 7
------- ' 0. 598
-0. 584
C .5-8
._ O -
coa
105
tI
I~!I'= _I
11·-1~ ~ _ _
p---
., ........
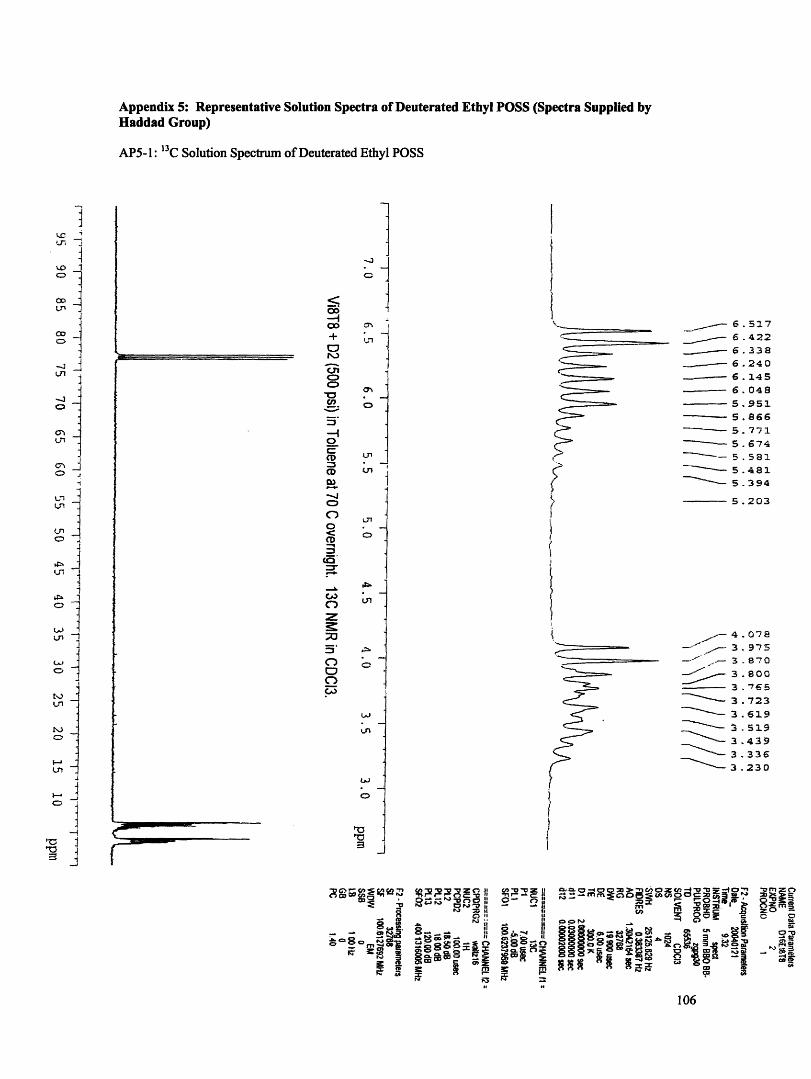
Appendix 5: Representative Solution Spectra of Deuterated Ethyl POSS (Spectra Supplied byHaddad Group)
AP5-1: '3C Solution Spectrum of Deuterated Ethyl POSS
-jIc I
C ciI~~~~~~~~-
co _
C 3+ "- I .. r
Cn . --4O
_.-I
(D U,
(D Ln
O
c)
< 0CD
CMr 1
C) Ln
O
Ln
U.j
0
-i
I" i r-i0n E
.
08°rnq
C I1* ..
___-_-_ 6. 51 7
~-c 6.422
-- 6. 338
- _ --- 6.240
--- 6.145
____ 5.951
--- 5. 866
---- 5. 771
--- 5.674C-- 5 . 581-,--- 5.481
---- 5.394
i
/
(t
..-- 4. 0'78- -- 3. 975-_"' ,- 3 . 870
-- 3.8003. 7 65
3 .723
3 . 19
3.519
3.439
--- 3. 336- 3.230
0- U214
is aW gC 'Ix
1 r Om
NO
C "0r
106
I1-1i
co>w .
_
co
-
Cn i-,r _
O
I
4.1
U ,
I
01
w
tm
.n
n
5j I= . J
; 7 _
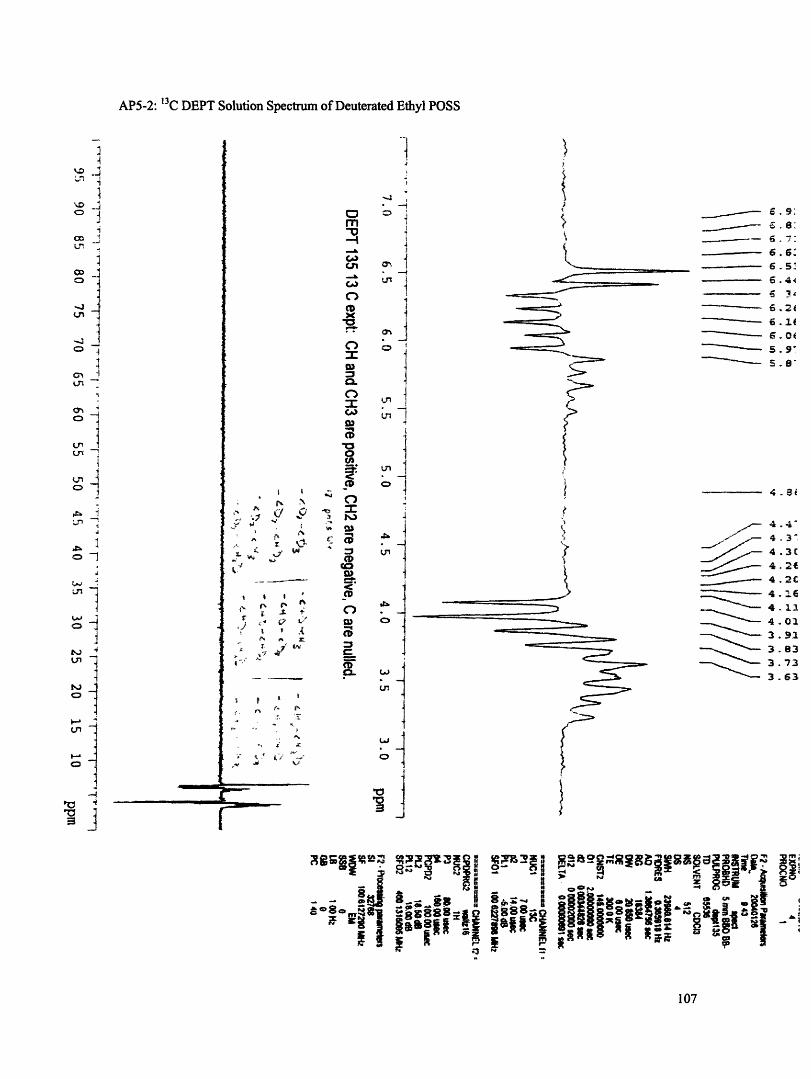
AP5-2: 3C DEPT Solution Spectrum of Deuterated Ethyl POSS
6.9:
... - 6.6
6.5:
6 II
--- 6.16.0
5.8'
4-@
4.3
~=-F/ 4 3'
4 3C- -- 4.114.01
3 .91
-- -- 3.83
_ 3.73
3 .63
?
I
f
I
%%
'i..
- Iaa
I~g8f =o t tf
107
.1
-4
0
a.'cm
t.n-
o3cn
.l
Qno .
o 1
.t
4
N a
Ij
i
Om
t-4
c'a
C)
-o
IC)C)
DJIc)
2:
0CD
C)a)c-
i
.A.
.t
W
Un
r
4 -
6 1
* I..sk v
I Ir. L
4 I I
9. f "._t 1 '
.4f, P t r 'x
0Cl
I-_I ;
I_ I
4
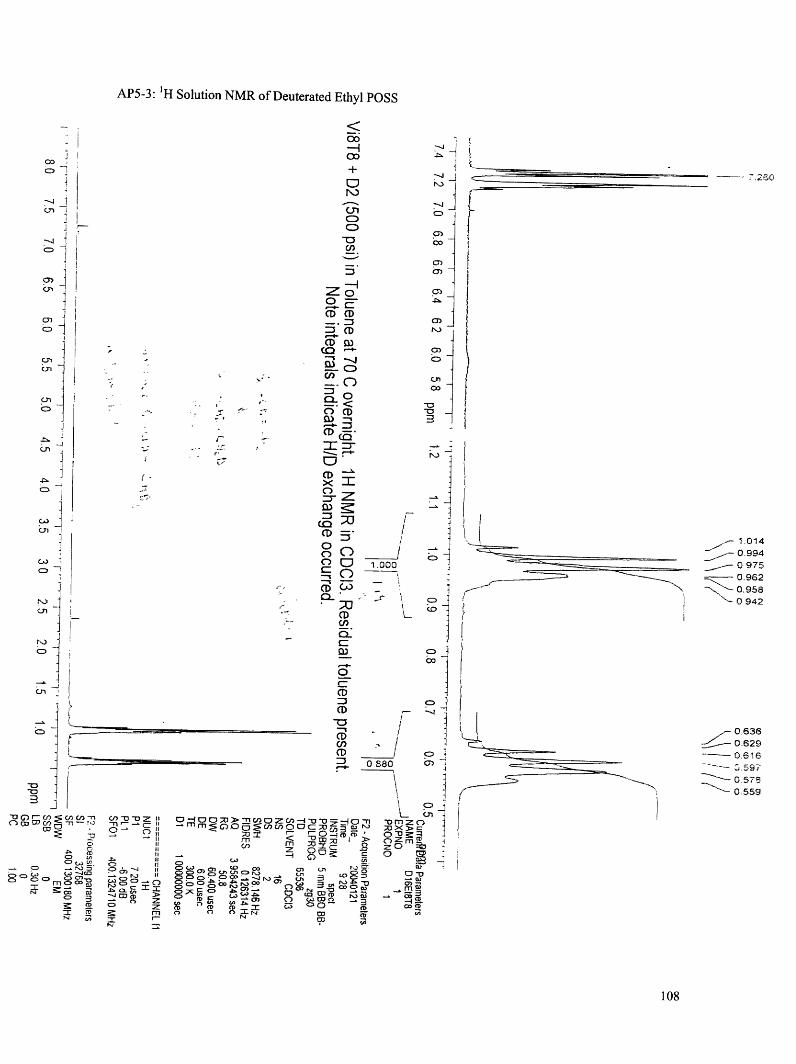
AP5-3: 'H Solution NMR of Deuterated Ethyl POSS
-.o
0
cn_.
0.,) r-CD CD_. _
CD
=
O CDCO -1CD M.
cC
I
0CD
O
.
c2 -a oo > -n cn c: C -- u o:M x r- r--
0M <M Mfrfm
0
CD CD Z - Z ctQ6 CCm m "Po
C> ?K C ND VM--4
(D coo c C)o~X IE" O 3m
--4jI
0,
0)oO
Cto) I
aaER
- I
o 1000
C'DC 03
CDoCoO)
CD
D0 880
o
-- M~ P~
C,
i
-J
_J
o~ I
-i
ii
O
i
1C-O j :' J _
On ,1
]jC>
l
cnj
I ,
.tQ
V.
0 a
no
nO O M cC -, --':
,1
' .
o _o -
_ ,- t0140.994
_--- 0 9750.9620.958
- 0 942
0,636•- 0.629
----- 0.6163--.. 5.597
%-- 0,5750559
II
-r - IIIII
rnN C-
108
I
I
I-I
..... I r
I
I
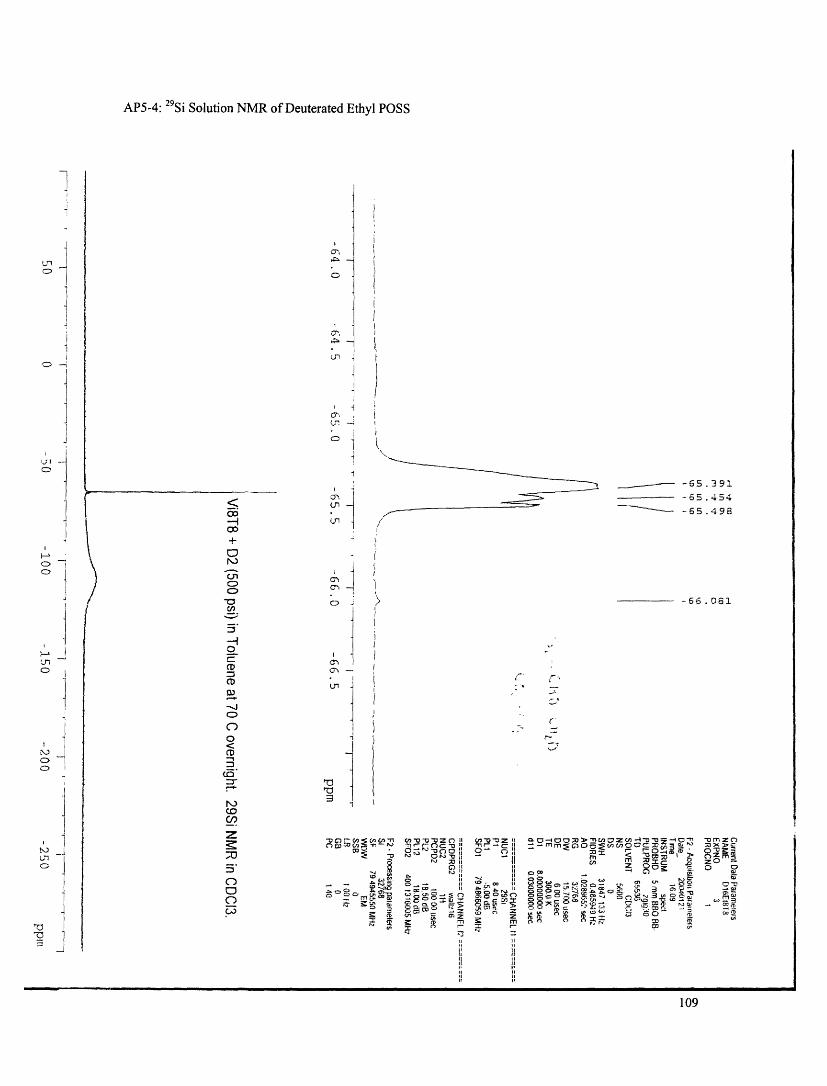
iII
- 65.391
-65.454---- -65.498
I
jI
Jii
Ii
,, I .
i
I~~~~~~~~~~~~~~~~~
I~~~
- 66.081
MO-w::EOO- Ommu OZO W,1 C) |1 UmZO
°_ o :E r c 0- - 8 8 c g- O -43)3) 3~ -u " Zo~ c ~ 3 < n z3 3 .. c
109
AP5-4: 29Si Solution NMR of Deuterated Ethyl POSS
,I
Ln
i
°1
i
i
Lno
.1
C3o
I
to
ODco
O
CDJC,_0._.
or-
CD
(DCO
CD
:r
cn)
z
iC7
C)c0
--
IJ7
Ci- L(:: I
a
Appendix 6: X-ray Data of Ethyl Substituted Polyhedral Oligomeric SilSesquioxane (POSS)
Experimental: Wide angle x-ray diffraction (WAXD) measurements were made on a SMART APEX x-raygenerator with Mo Ka radiation. The operating voltage was 50 kV with a current of 35 mA. Spectra weretaken from powder, placed in a borosilicate capillary (I.D. =0.05 mm, O.D.=0.50 mm), mounted in thebeam path.
AP6- 1: WAXD Spectra at Various Temperatures for Fully Protonated Ethyl POSS
-----JUUUU
25000
r 20000
:, 15000
-4 10000
5000
03 5 7 9 11 13 15 17 19
20 ()
110
AP6-2: WAXD Spectra at Various Temperatures for Partially Deuterated Ethyl POSS
YUUUU
80000
70000
4a 60000
6 50000
- 40000
U0
$ 30000
20000
10000
02 4 6 8 10 12 14 16 18 20
20 ()Results: The shifts in the positions of the peaks in the above spectra illustrates that a crystallographicphase transition occurs. However, the Mo source causes the reflections at low angles to overlap making aunit cell determination for each phase unreliable with this data.
111
-----
Appendix 7: Representative MAS H Compression Studies Polydisperse Polyisoprene
Experimental:Polydisperse (PDI=3.40, Mw= 938,000 g/mol, MN=276,000 g/mol) 97% cis 1,4-polyisoprene was
purchased from Aldrich.The mechanical data were acquired with an Instron Model 4201 operated in compression mode at
room temperature. The specimens were rectangular with dimensions: 0.2 in. x 0.2 in. x 0.4 in. Both the topand bottom of the polymer specimen had a Teflon-polymer interface allowing for equal slip on both sides.A 5 kN compression load cell was used for all tests. The stress relaxation in the polymer was measured,meaning a strain of 40% was placed on the polymer sample and the stress was monitored as a function oftime.
All NMR spectra were taken with an Oxford 6.3 T magnet (with a 270 MHz H resonancefrequency) using a Tecmag dual resonance pulse generator and receiver. Static H experiments wereperformed on a home built probe with a 2 Uts n/2 pulse width. The magic angle spinning (MAS) spectrawere taken with a Chemagnetic 7.5 mm probe with a 4 Us n/2 pulse width and a spin speed of 2500 Hz.Spectra were acquired with a 10 gs dwell time and a 5 s recycle delay and taken after a 10 minute wait formechanical equilibrium.
The compression device, used for static spectra, was a Teflon rod 0.25 in. in diameter and1.00 in. in length. The polymer was placed in a threaded hole 0.18 in. in diameter and compression wasinduced by successive turns of a nylon screw. The polymer specimens were rectangular with thedimensions: 0.09 in. x 0.09 in. x 0.30 in.. The device for MAS spectra was constructed from a Teflon rod0.15 in. in diameter and 1.00 in. in length. The specimen for these experiments had rectangulardimensions: 0.05 in. x 0.05 in. x 0.30 in.. A Teflon spacer between the polymer and screw allowed forslip at one end of the specimen while the bottom of the Teflon device created slip at the other. For allexperiments, there was always clearance between the polymer's circumference and the sides of thecompression cell.
Spin-lattice relaxations were measured using an inversion recovery sequence (- -/2-Acq). A single least square exponential was fitted to the peak intensity (M) versus delay time (t), resultingin a two parameter fit yielding: the equilibrium peak intensity (MO) and the spin-lattice relaxation timeconstant (T!) (Eq 1).
Eq 1: M(t)=Mo(1-2exp(-t/Tl))
This single exponential fit was used for the monodispersed polyisoprene and the static spectra of thepolydispersed polyisoprene with an R2 value > 0.99. A two exponential fit was appropriate for the MASspectra of the polydispersed polyisoprene. In this case, the data was fit to four parameters (Eq 2):equilibrium peak intensity (MO), spin-lattice relaxation time constants (Tls, TIL), and proportion of spinsexperiencing each relaxation (FL, (1-FL)). I
Eq 2: M(t)=(-FL)*Mo(1-2exp(-t/Tls)) + FL*Mo(1-2exp(-t/TlL))
112
Results:
AP7-1. Static and MAS H spectrum of polydisperse cis 1,4-polyisoprene
a C~~~~~a ~~c~~~~~~ __A static
CH 3 H a M -- AS
\ /C=C
CH2 CHb b n
I .......... , .... - 3 I 7 - -·
-5 -3 -1 1 3 5 7 9 11
ppm
Figure AP7-1 is the proton ('H) spectrum of polydispersed cis 1,4-polyisoprene under static and MASconditions. In the static spectrum, the methine resonances can be differentiated from the overlappingresonances of the methyl and methylene protons. Under MAS conditions the three chemicallydistinguishable protons can be isolated at there isotropic chemical shifts: 2 methyl (1.8 ppm), methylene(2.1 ppm) and methine (5.2 ppm). As seen in Figure 1, prior to magic angle spinning there was enoughmolecular mobility to resolve the methine resonance from the overlapping methyl and methyleneresonance. Therefore, individual T, time constants could be assigned to the methine resonance and thecombined methyl and methylene resonance. The static spectrum was further narrowed to the isotropicchemical shift values upon spinning at the magic angle. Therefore, with MAS, individual T, time constantscould be assigned to the three chemically distinguishable protons: the methyl (a), methylene (b) andmethine (c).
113
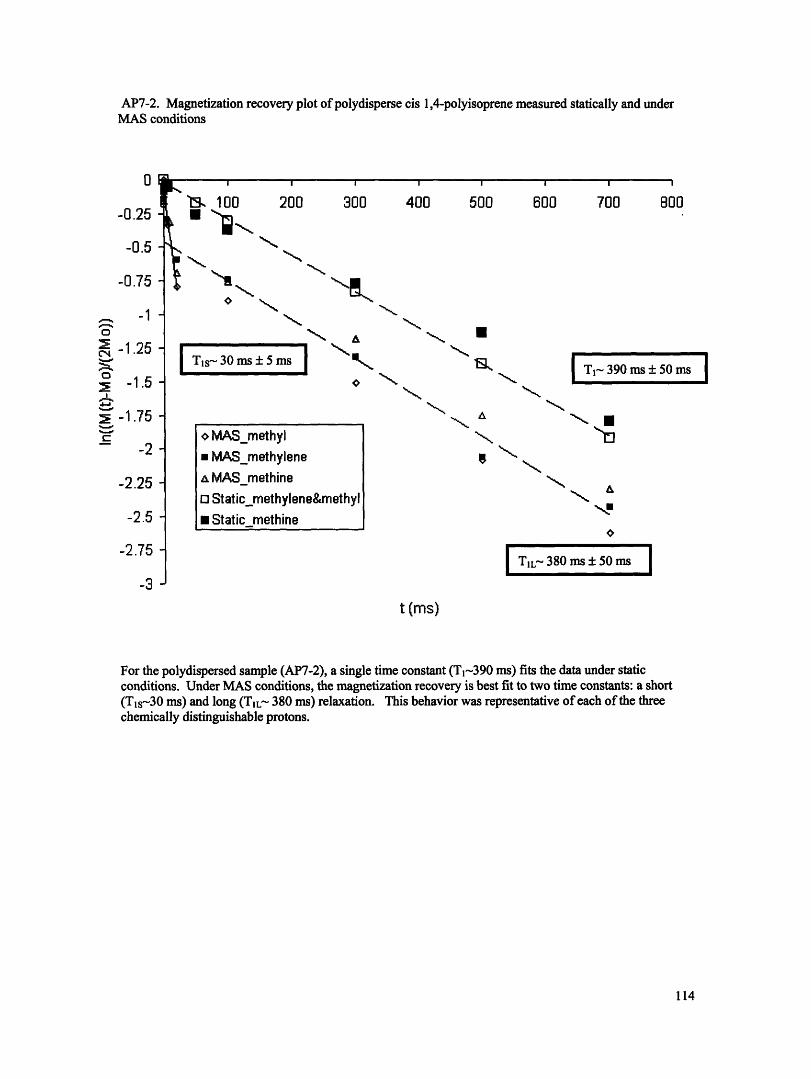
AP7-2. Magnetization recovery plot of polydisperse cis 1,4-polyisoprene measured statically and underMAS conditions
-0.251
-0.5 -
-0.75 -
-V - - -I
', 100 200 300I400
400 500 600 700800
800
-,,,
|Tls- 30ms 5 ms
.A
"-,1-T 390 ms ± 50 ms
N-1 AN-,
s
N E
N1 A
-2.75 -
-3
I TL-380 ms ± 50ms It (ms)
For the polydispersed sample (AP7-2), a single time constant (T1-390 ms) fits the data under staticconditions. Under MAS conditions, the magnetization recovery is best fit to two time constants: a short(TIs-30 ms) and long (TIL- 380 ms) relaxation. This behavior was representative of each of the threechemically distinguishable protons.
114
0MCNI
0I1
M
C:
-1 -
-1.25 -
-1.5 -
-1.75-
-2 -
-2.25 -
-2.5 -
o MAS_methyl* MAS_methylene, MASmethine
o Static_methylene&methyl* Staticmethine
. .
II
I- T-
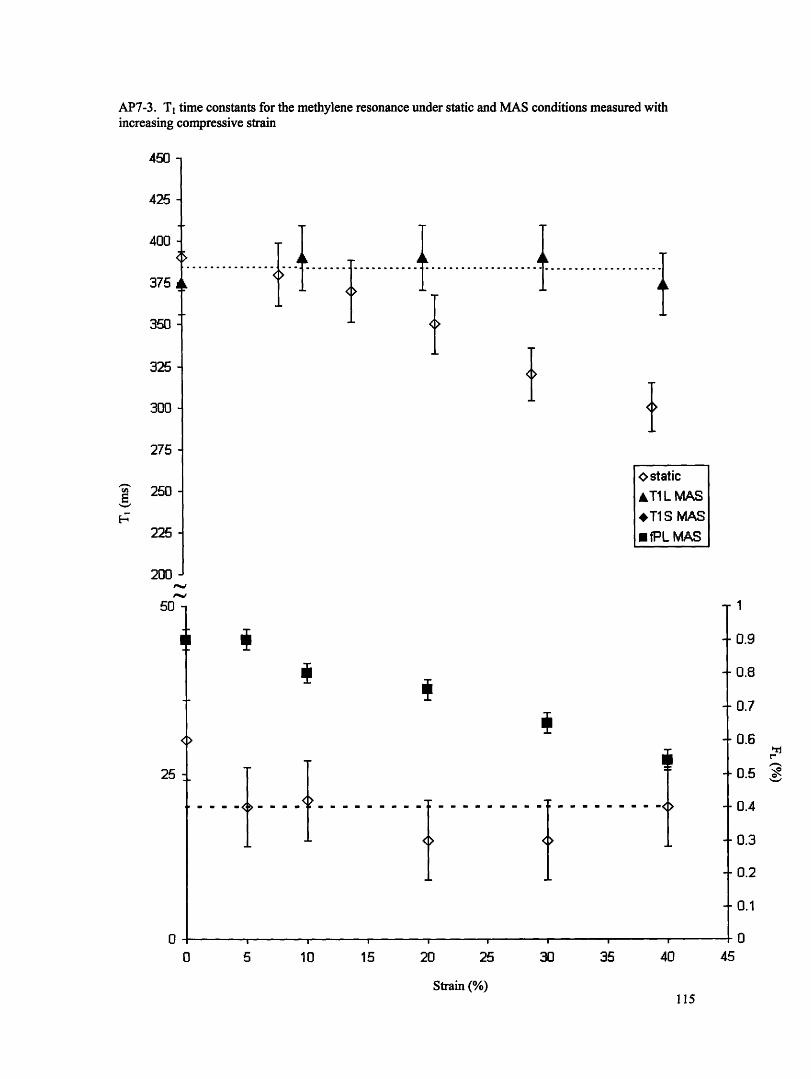
AP7-3. T time constants for the methylene resonance under static and MAS conditions measured withincreasing compressive strain
450
425
400 i i { .4. 4
350 }325
300
275
o statE 250 AT1 L
*T1 E225 *·fPL
200
50 ,
I
25
I
. i i -.. . ...... .{
5 10 15 20
Strain (0
25 30 35 40
ticMASMAS
MAS
1
* 0.9
0.8
0.7
0.6l
-0.5 S
0.4
0.3
0.2
0.1
-O00 45
115
l_ · · r
I
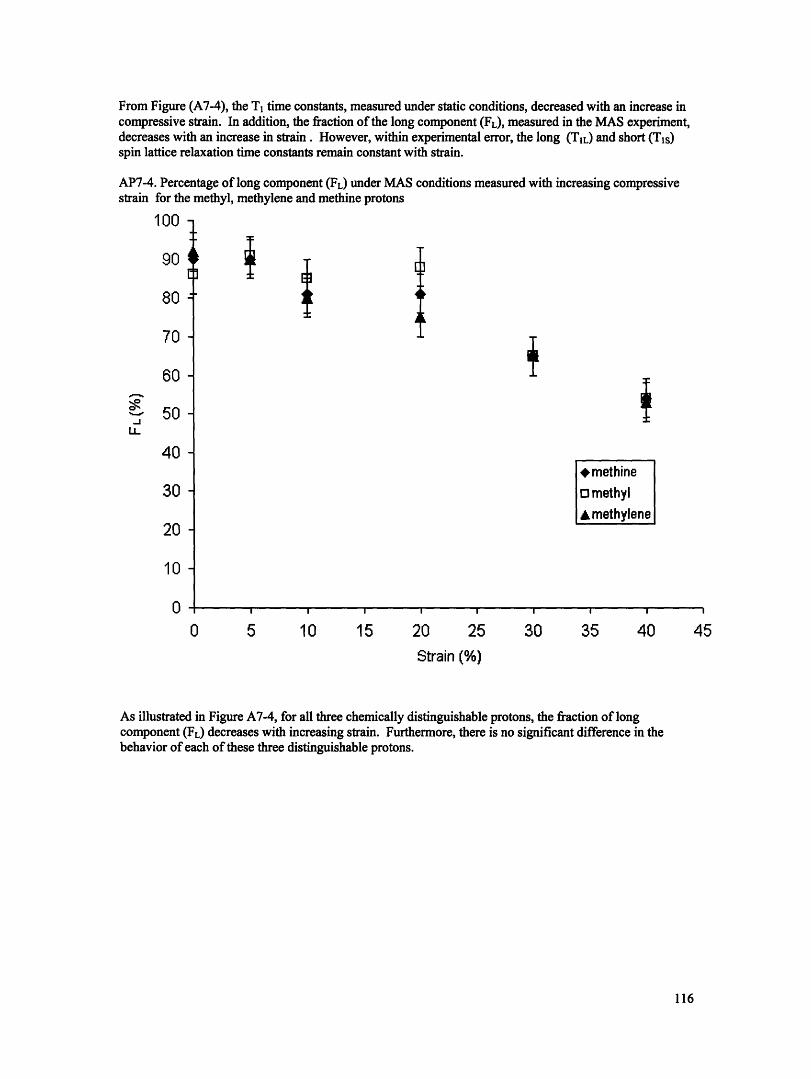
From Figure (A7-4), the T1 time constants, measured under static conditions, decreased with an increase incompressive strain. In addition, the fraction of the long component (FL), measured in the MAS experiment,decreases with an increase in strain . However, within experimental error, the long (TIL) and short (Tls)spin lattice relaxation time constants remain constant with strain.
AP7-4. Percentage of long component (FL) under MAS conditions measured with increasing compressivestrain for the methyl, methylene and methine protons
4e 'n
LLU-
IUU -
90 4
80 -
70 -
Rn -
50
40 -
30 -
20 -
10-
0
It iI
* methineo methyl
A methylene
0 5 10 15 20 25 30 35 40 45Strain (%)
As illustrated in Figure A7-4, for all three chemically distinguishable protons, the fraction of longcomponent (FL) decreases with increasing strain. Furthermore, there is no significant difference in thebehavior of each of these three distinguishable protons.
116
·
WW
I I I I I I I I I
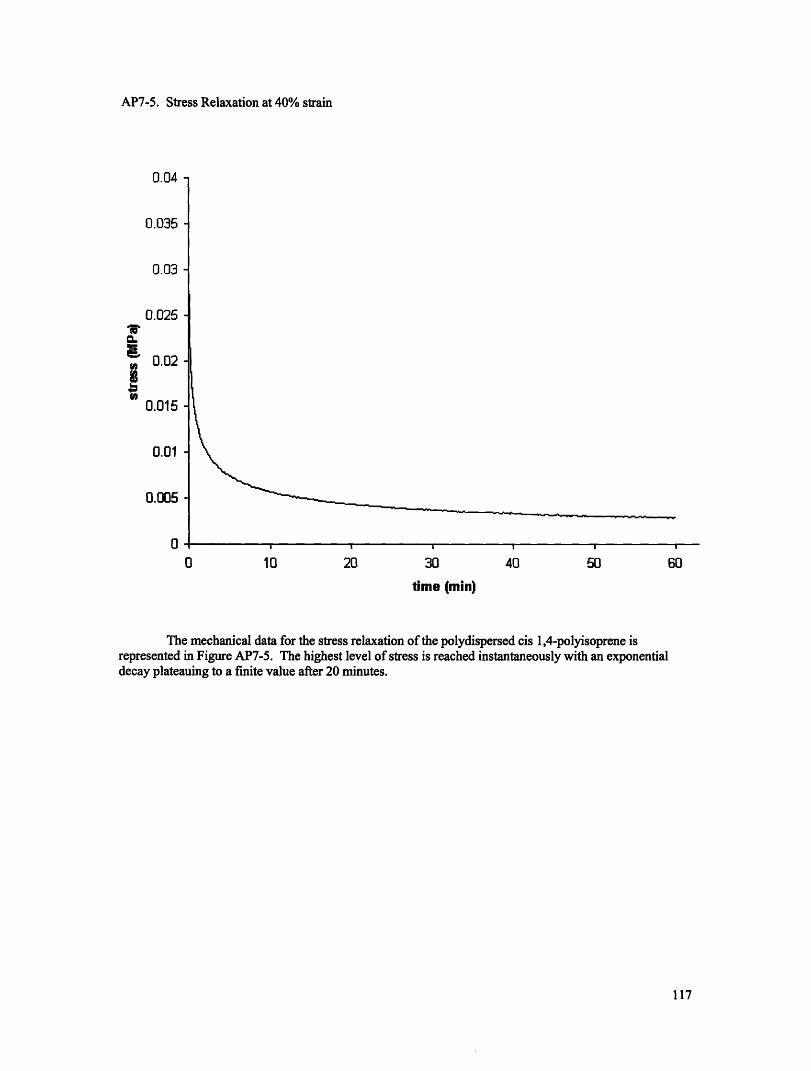
AP7-5. Stress Relaxation at 40% strain
n fnl U.U
0.035
0.03
0.025
- 0.02
0.015
0.01
0.005
00 10 20 30 40 50
time (min)
The mechanical data for the stress relaxation of the polydispersed cis 1,4-polyisoprene isrepresented in Figure AP7-5. The highest level of stress is reached instantaneously with an exponentialdecay plateauing to a finite value after 20 minutes.
117
60
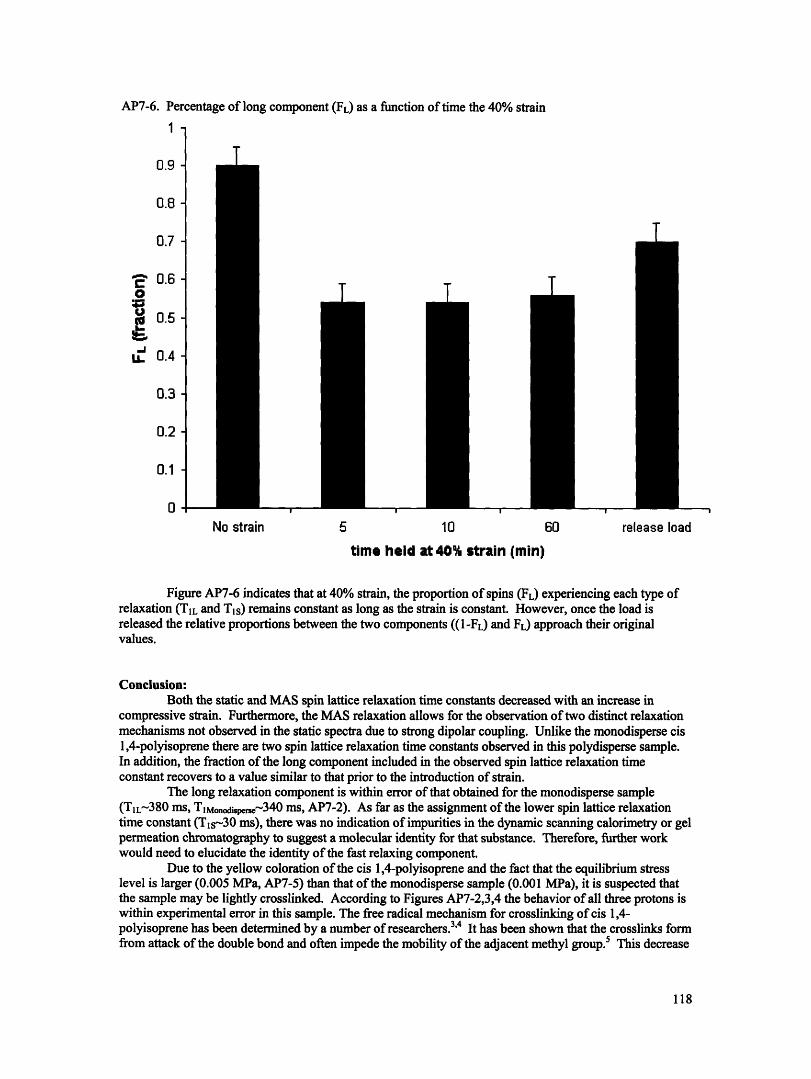
AP7-6. Percentage of long component (FL) as a function of time the 40% strain41I -
0.9 -
0.8 -
0.7 -
- 0.6-
o 0.5-.
L 0.4-
0.3 -
0.2 -
0.1-
0-
T
T
T T TI I
-l
No strain 5 10 60 release load
time held at 40% strain (min)
Figure AP7-6 indicates that at 40% strain, the proportion of spins (FL) experiencing each type ofrelaxation (TIL and Tls) remains constant as long as the strain is constant. However, once the load isreleased the relative proportions between the two components ((1-FL) and FL) approach their originalvalues.
Conclusion:Both the static and MAS spin lattice relaxation time constants decreased with an increase in
compressive strain. Furthermore, the MAS relaxation allows for the observation of two distinct relaxationmechanisms not observed in the static spectra due to strong dipolar coupling. Unlike the monodisperse cis1,4-polyisoprene there are two spin lattice relaxation time constants observed in this polydisperse sample.In addition, the fraction of the long component included in the observed spin lattice relaxation timeconstant recovers to a value similar to that prior to the introduction of strain.
The long relaxation component is within error of that obtained for the monodisperse sample(TIL-380 ms, T1Monodispr,,- 34 0 ms, AP7-2). As far as the assignment of the lower spin lattice relaxationtime constant (Tls-30 ms), there was no indication of impurities in the dynamic scanning calorimetry or gelpermeation chromatography to suggest a molecular identity for that substance. Therefore, further workwould need to elucidate the identity of the fast relaxing component.
Due to the yellow coloration of the cis 1,4-polyisoprene and the fact that the equilibrium stresslevel is larger (0.005 MPa, AP7-5) than that of the monodisperse sample (0.001 MPa), it is suspected thatthe sample may be lightly crosslinked. According to Figures AP7-2,3,4 the behavior of all three protons iswithin experimental error in this sample. The free radical mechanism for crosslinking of cis 1,4-polyisoprene has been determined by a number of researchers.3 4 It has been shown that the crosslinks formfrom attack of the double bond and often impede the mobility of the adjacent methyl group.5 This decrease
118
in mobility would make this group more susceptible to dipolar communication with surrounding protonscausing an identical relaxation to be observed for each proton. Therefore, this identical behavior of allthree distinguishable protons is a spectroscopic conformation that there may be crosslinks in this sample.This may be a source for the different spin lattice relaxation behavior for polydisperse versus themonodisperse samples.
Provided the polydisperse sample is crosslinked, it would be more susceptible to chain rupturethan the monodisperse sample. It is plausible that like the monodisperse sample the polydisperse sampleundergoes chain rupture during compressive strain causing an increasing in the spins which relax through afaster mechanism due to the increased concentration of paramagnetic centers. This could be why thismaterial never fully recovers to it initial values after the load is removed; however, some crosslinks remainintact allowing for partial recovery of the initial spin lattice relaxation behavior.
References:1. Tyco, R. Nuclear Magnetic Resonance Probes of Molecular Dynamics Kluwer Acedemic Publishers:Boston 1994.
2.Sato, H.; Tanka, Y. J Polym Sci Pol Chem 1979, 17 3551
3.Boochathum, P.; Prajudtake, W. European Poly. J. 2001, 37, 417.
4.0h, S.J.; Koenig, J.L. Polymer 1999, 40, 4703.
5.Gutowsky, H.S.; Meyer, L.H. J Chem Phys 1953, 21, 2122.
119
Appendix 8: Representative MAS 1H Spin Lattice Relaxation Behavior of MonodispersePolyisoprene
Experimental:
Various monodisperse 97% cis 1,4-polyisoprene (PDI=1.02, MN= 710,000, 56,000, 3,620 and1,400 g/mol) were purchased from Polymer Source Standards and used without further purification. Thesewill be referred to as 710k, 56k, 3.6k and 1.4k, respectively.
All NMR spectra were taken with an Oxford 6.3 T magnet (270 MHz H resonance frequency)using a Tecmag dual resonance pulse generator and receiver. The magic angle spinning (MAS) spectrawere taken with a Chemagnetics 3.2 mm probe with a 2 gts n/2 pulse width at a spin speed of 2500 Hz.
To obtain spin-lattice relaxation parameters an inversion recovery sequence (-t-n7/2-Acq) wasused. A single least squares exponential was fitted to the peak intensity (M) versus delay time (t) accordingto Eq. 1, resulting in a two parameter fit yielding: the equilibrium peak intensity (Mo) and the spin-latticerelaxation time constant (Tl).'
Eq I: M(t)=M(1-2exp(-t/T 1))This single exponential fit was used for the monodispersed polyisoprene and the static spectra of thepolydispersed polyisoprene with an R2 value 2 0.99.
Results:AP-1. Spin lattice relaxation time constants as a function of an inversus number average molecular weight
for monodisperse polyisoprene for MAS Proton Spectra
440
420 -
400 -
380 -
t 360 -
320 -
280 -o methyl (a)* methylene (b)Amethine (c) 240 -
I I -
-2 -1.5
log (Mn x 103) (g-'mol)
I
-0.5
I
E
Fr
4
--3.5 -3
-2.5I-2.5
I
-1ZZU
0
120
d
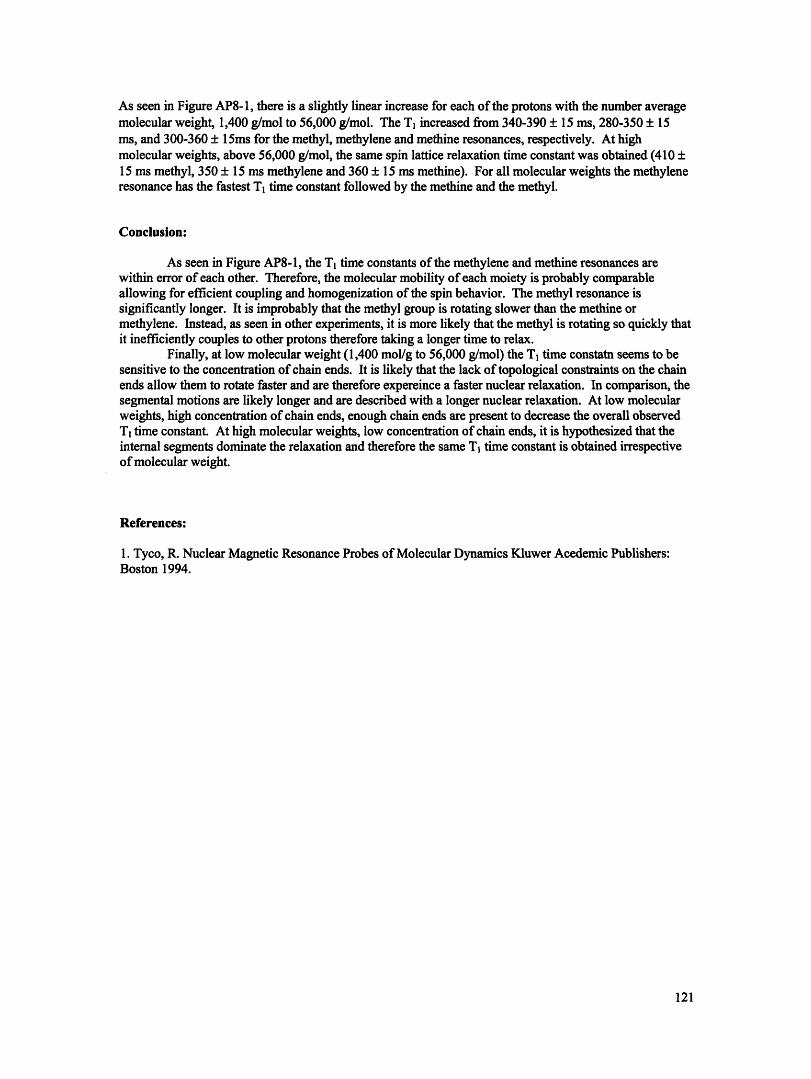
As seen in Figure AP8-1, there is a slightly linear increase for each of the protons with the number averagemolecular weight, 1,400 g/mol to 56,000 g/mol. The T1 increased from 340-390 ± 15 ms, 280-350 ± 15ms, and 300-360 ± 15ms for the methyl, methylene and methine resonances, respectively. At highmolecular weights, above 56,000 g/mol, the same spin lattice relaxation time constant was obtained (410 +15 ms methyl, 350 ± 15 ms methylene and 360 ± 15 ms methine). For all molecular weights the methyleneresonance has the fastest T1 time constant followed by the methine and the methyl.
Conclusion:
As seen in Figure AP8-1, the T1 time constants of the methylene and methine resonances arewithin error of each other. Therefore, the molecular mobility of each moiety is probably comparableallowing for efficient coupling and homogenization of the spin behavior. The methyl resonance issignificantly longer. It is improbably that the methyl group is rotating slower than the methine ormethylene. Instead, as seen in other experiments, it is more likely that the methyl is rotating so quickly thatit inefficiently couples to other protons therefore taking a longer time to relax.
Finally, at low molecular weight (1,400 mol/g to 56,000 g/mol) the T1 time constatn seems to besensitive to the concentration of chain ends. It is likely that the lack of topological constraints on the chainends allow them to rotate faster and are therefore expereince a faster nuclear relaxation. In comparison, thesegmental motions are likely longer and are described with a longer nuclear relaxation. At low molecularweights, high concentration of chain ends, enough chain ends are present to decrease the overall observedT1 time constant. At high molecular weights, low concentration of chain ends, it is hypothesized that theinternal segments dominate the relaxation and therefore the same T1 time constant is obtained irrespectiveof molecular weight.
References:
1. Tyco, R. Nuclear Magnetic Resonance Probes of Molecular Dynamics Kluwer Acedemic Publishers:Boston 1994.
121


![-4 02 O x o 13 +1-6 +6 IJ Iffi 1110 ff6 -kLl * Iffi IkK] 14 (Ill klqL * 'J 1 …/media/Files/shiga/... · 2019-11-10 · -4 02 O x o 13 +1-6 +6 IJ Iffi 1110 ff6 -kLl_ * Iffi IkK]](https://img.pdfslide.net/doc/110x75/5e422425ac97fb550f32a86f/4-02-o-x-o-13-1-6-6-ij-iffi-1110-ff6-kll-iffi-ikk-14-ill-klql-j-1-mediafilesshiga.jpg)