Embed Size (px)
Citation preview

WEIR MOUNTAIN REPORT NUMBER 5
GEOLOGY, GEOPHYSICS AND GEOCHEMISTRY
CLAIMS CY 1 - 8, CY 9, ENG 1 - 3
RECORD NUMBERS 224 t o 231, 479, 221 t o 223
WEIR MOUNTAIN AREA
59'39 N , 132'59 I W
NTS 104N 1OW
ATLIN M I N I N G DISTRICT
Owner: Noranda Mines L i m i t e d
Author : John Biczok, B.Sc.
S u p e r v i s o r : W . Mercer, Ph.D.
Date: August 1979
ABSTRACT
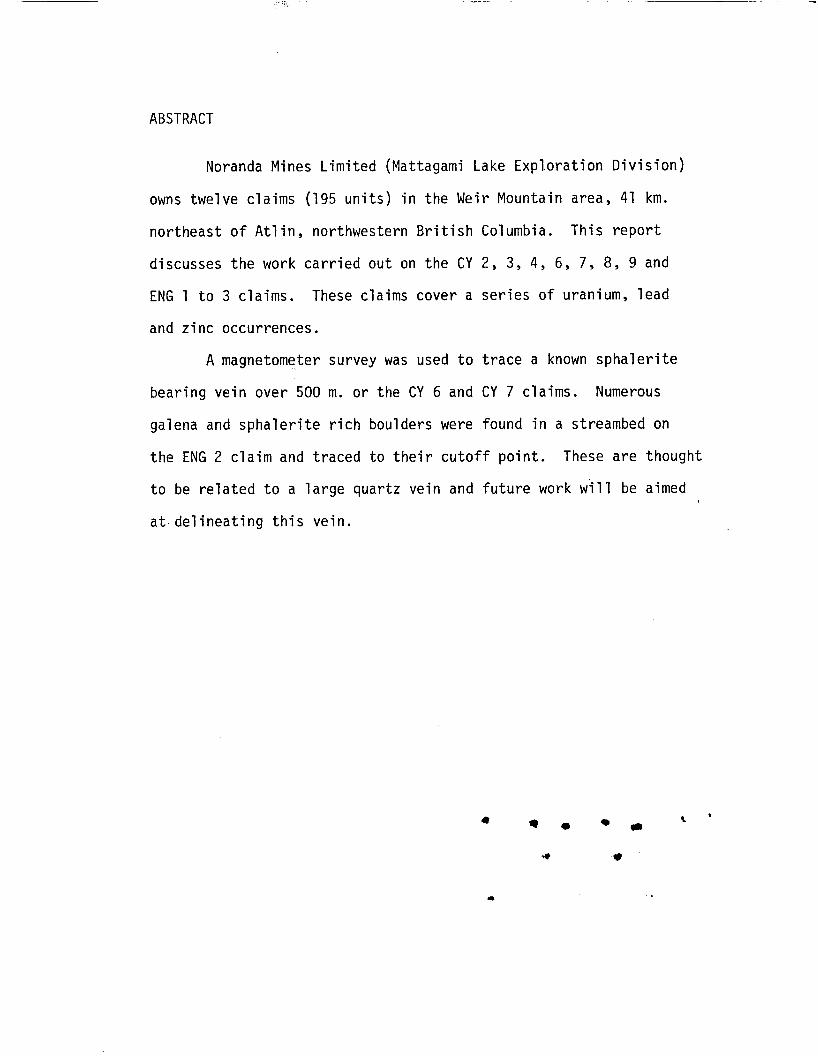
Noranda Mines Limited (Mattagami Lake Exploration Division)
owns twelve claims (195 units) in the Weir Mountain area, 41 km.
northeast of Atlin, northwestern British Columbia. This report
discusses the work carried out on the CY 2, 3 , 4, 6, 7, 8, 9 and
ENG 1 to 3 claims. These claims cover a series of uranium, lead
and zinc occurrences.
A magnetometer survey was used to trace a known sphalerite
bearing vein over 500 m. or the CY 6 and CY 7 claims.
galena and sphalerite rich boulders were found in a streambed on
the ENG 2 claim and traced to their cutoff point.
to be related to a large quartz vein and future work will be aimed
Numerous
These are thought
at. delineating this vein.
a

CONTENTS
CHAPTER ONE INTRODUCTION 1-1 Property and Ownership 1-2 Location and Access 1-3 Physiography 1-4 C1 imate 1-5 Hi story 1-6 Purpose o f the Program CHAPTER TWO GEOLOGY CHAPTER THREE MINERALIZATION 3-1 Base Metal Mineralization 3-2 Uranium Mineralization CHAPTER FOUR GEOCHEMISTRY CHAPTER FIVE GEOPHYSICS 5-1 Introduction 5-2 Magnetometer Survey 5-3 Radon in Soil Survey CHAPTER SIX CONCLUSIONS AND RECOMMENDATIONS 6-1 Concl usions 6-2 Recommendations
REFERENCES
APPENDIX I Rock Sample Analyses APPENDIX I1 Rock Sample Assays APPENDIX I11 Soil Sample Analyses APPENDIX IV Stream Sediment Sample Analyses APPENDIX V Panned Stream Sediment Analyses APPENDIX VI Description of Thin and Polished
Sect i ons Rocks from Mineralized Zone
CERTIFICATE - J. Biczok CERTIFICATE - W. Mercer STATEMENT OF COSTS
MAPS
Map 1 Mineralization Zones Map 2 Geology Map, ENG 1-3, CY 5-9
1 1 1 1 3 3 4 5 8
8 12 15 24 24 24 26 27 27 27
29 41 44 53 55
57 59 60 61
all in pockets

-7- " '
CONTENTS - Continued
MAPS - continued
Map 3 Soil Samples, Blue Sky Grid a l l in pockets
Map 4 Geophysical Results - Blue Sky Grid
Map 5 Magnetometer Survey, F Zone
Map 6 Radon i n Soil Measurements ( C Y 6 )
1
FIGURES
Figure 1
Figure 2
Figure 3
Figure 4
Figure 5
Figure 6
Figure 6a
Figure 6b
Figure 6c
Figure 6d
Figure 6e
Figure 7
Figure 7a
Figure 7 b
Figure 7c
Figure 7d
Figure 8
Location Map (CY and ENG Claims)
Claim Map (CY-ENG Claims)
Sphalerite-Magnetite Rich Veins
Rock Sample Locations ( E N G 1-3, CY 8, CY 9 )
Rock Sample Locations ( C Y 2 , CY 4 )
Soil and Stream Sediment Samples ( E N G 1-3, CY 8-9)
Copper
Zinc
Lead
Molybdenum
T i n , Tungsten and Uranium
Soil Sample Location Map ( C Y 4 , CY 6)
Copper
Lead
Zinc
Uran i um
Grid and Sphaler i te Veins (CY 7 )
2
i n pocket
9
11
13
16
16a
16b
16c
16d
16e
17
18
1 9
20
21
25

CHAPTER ONE - INTRODUCTION 1
1-1 PROPERTY AND OWNERSHIP
Noranda Mines L im i ted (Mattagami Lake E x p l o r a t i o n D i v i s i o n ) i s
the owner o f minera l c la ims CY 2 t o CY 4, CY 6 t o CY 9 and ENG 1 t o
ENG 3, reco rd numbers 224 t o 231, 479, 221 t o 223. These c la ims
were s taked f o r t he company by F. Morra and W. Howard and were recorded
i n A t l i n , B r i t i s h Columbia, on t h e 26 th o f Ju l y , 1977.
The c la ims cover 169 u n i t s o r about 4150 hectares.
1-2 LOCATION AND ACCESS (F igure 1)
The c la ims a re loca ted i n t h e Weir Mountain area, no r the rn
B r i t i s h Columbia, NTS 104N (F igures 1 and 2 ) . The p r o p e r t y l i e s 41 km.
n o r t h e a s t o f t h e c o m u n i t y of A t l i n and i t s geographica l co-ord inates
a re 59'39" and 132'59'W.
There a re no roads t o the p roper t y . Access i s v i a h e l i c o p t e r
f rom A t l i n .
Su rp r i se Lake, 22 km. west o f Weir Mountain.
A gravel road connects A t l i n w i t h t h e west shore o f
1-3 PHYSIOGRAPHY
The area i s mountainous, w i t h g e n t l y s lop ing , vegeta t ion covered,
southeast f l a n k s and p r e c i p i t o u s c l i f f s on t h e nor thwest f l anks .
Recent g l a c i a t i o n has l e f t wide U-shaped v a l l e y s as w e l l as c i rques
and hanging va l l eys . The e l e v a t i o n i s 1,000 t o over 2,000 m. above
sea l e v e l .
Vegetat ion i s dense, sho r t , w i l l o w bush up t o 1,300 m. Above
t h i s e l e v a t i o n , t he re i s a very immature a lp ine - t ype o f s o i l , 10 t o
50 cm. t h i c k . Vegetat ion here c o n s t i t u t e s grass and l i chens .
V a l l e y bottoms are covered by ex tens i ve f l u v i a l and moraine deposi ts .

2 Figure I
LOCATION M A P
C Y & ENG CLAIMS, B.C.
W E I R MOUNTAIN AREA
YUKON
B R I T I S H COLUMBIA

1-4 CLIMATE 3
The CY and ENG claims are almost completely free of snow from
early July to the end of August although many cornices persist for
much of the summer.
The area is characterized by strong winds, generally from the
southwest.
common during the summer months, especially June and August.
Summer temperatures average +4OC and snow storms are
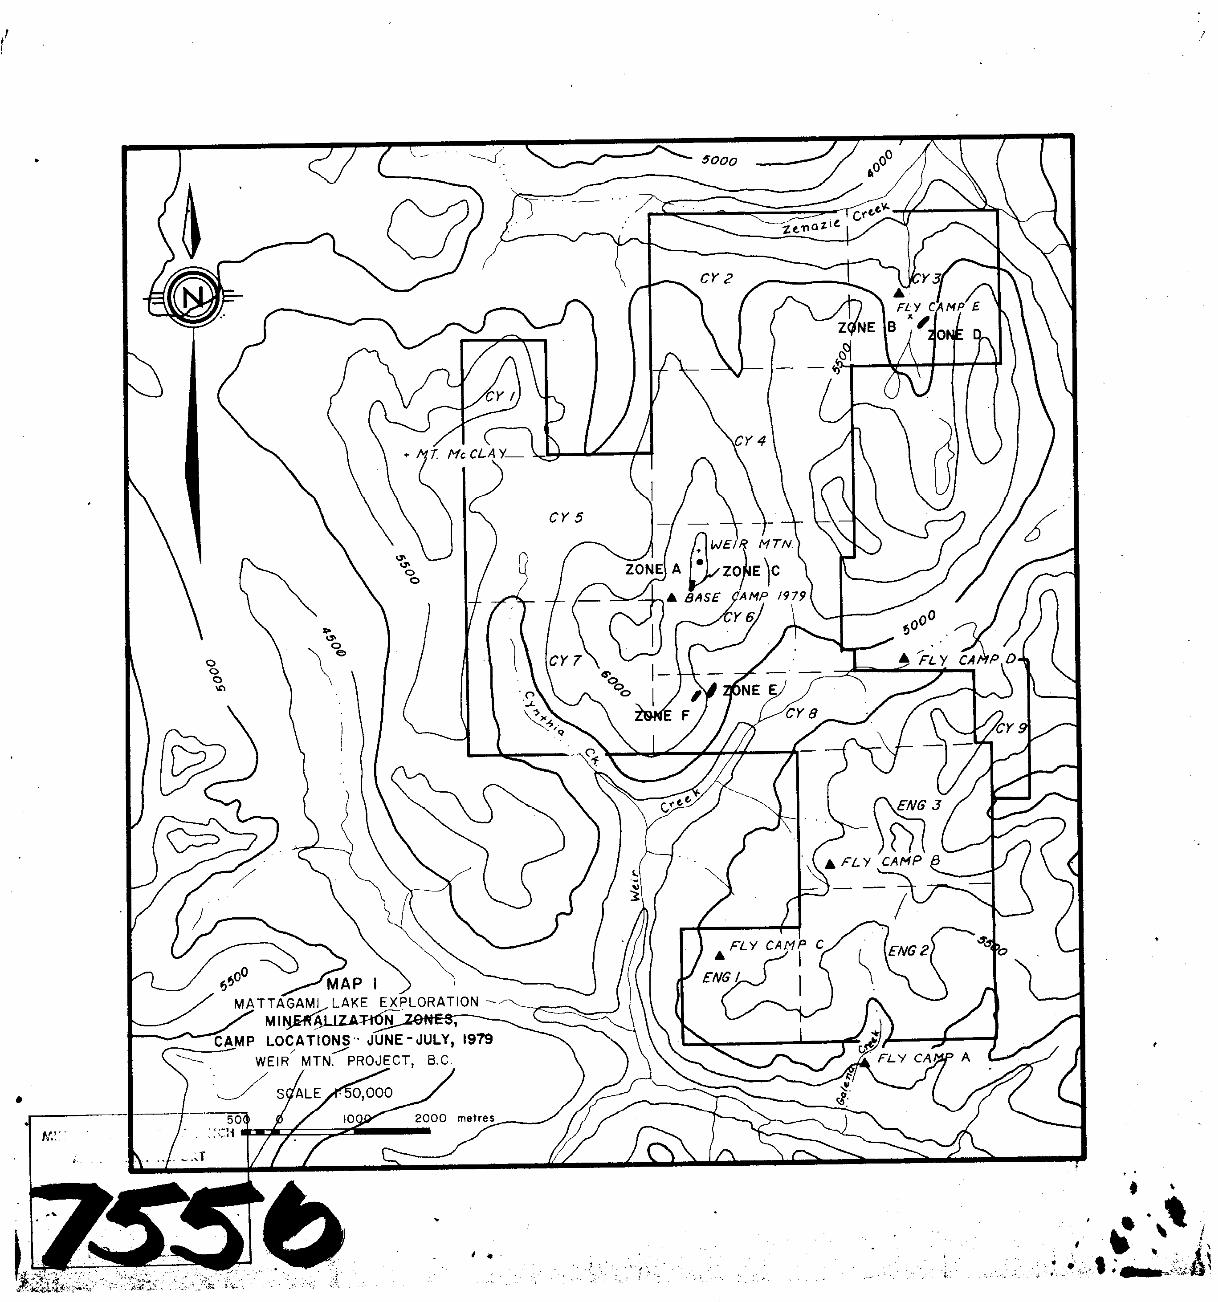
1-5 HISTORY (Figure 2) (Map 1)
During July 1977, eleven claims (187 units) were staked in the
Weir Mountain area for Mattagami Lake Mines Ltd. to cover a radioactive
area discovered by a regional he1 icopter-borne radiometric survey in
1977. One additional claim (CY 9, 8 units) was staked in 1978.
Geochemical sampling, radon detection in water and soil and
radiometric surveys were carried out to cover most o f the CY claims
in 1977 (Weir Mountain Report No. 2, F. Morra).
Detailed geochemical and geophysical surveys (magnetomer, RADEM,
VLF, I.P., Radiometric) were completed during the summer of 1978,
predominantly on the CY 3, CY 4 and CY 6 claims.
this work are presented in Weir Mountain Reports, Numbers 3 and 4,
the CEM Report, Weir Mountain (T. Gledhill and D. Sutherland, 1978)
and the I .P. Report (Phoenix Geophysics).
The results of
This work helped delineate the source of some of the geochemical
anomalies, namely 2 uranium occurrences and several sphalerite and
magnetite occurrences.
During the first part of the 1979 program (June and July) work
was concentrated on the CY 3 , CY 6 to CY 9, and ENG 1 to ENG 3 claims.

4 This included:
1. geological mapping and prospecting,
2. magnetometer survey,
3 . radon in soil survey,
4. ground radiometric surveys.
Personnel during the 1979 field season consisted of:
J. Biczok - party chief
P. Wagner - senior assistant
P. Lhotka - junior assistant
C. Stewart - junior assistant.
A base camp was established on Weir Mountain at the headwaters
of Cariboo Creek and fly camps were set up on ENG 1 , 2 and 3 , CY 3 and
CY 8 (Map 1) .
1-6 PURPOSE OF THE PROGRAM
The main purpose of the work carried out in June and July 1979
was to geologically map and prospect thoroughly the c aims.
was aimed at delineating the known mineral occurrence and discovering
new ones as well as formulating theories regarding the origin o f
these unique occurrences. Hopefully, this will aid in future
exploration.
This
The magnetometer survey was designed t o trace the length of 2
sphalerite-magnetite rich veins.
grid 500 rn. by 800 m., mainly within the CY 7 claim.
The survey was completed over a

5 CHAPTER TWO - GEOLOGY (Map 2)
The CY 1 to CY 8 and ENG 1 to ENG 3 claims lie almost entirely
within the Surprise Lake batholith, a Cretaceous lobe of the Coast Range
batholith.
phases of alaskite and granite.
cover the contact of the batholith with the Permian
which in this region consists of cherts, chert breccias, quartzites and
argillites.
the claim area.
The Surprise Lake batholith consists predominantly of various
The southernmost claims, ENG 1 and 2,
Cache Creek group,
These have been recrystallized to the hornfels facies within
To date, a total of 11 different intrusive phases have been disting-
uished within the claims.
age relationships are not always certain.
Due to the paucity and blocky nature of outcrops,
From assumed youngest to oldest,
the phases are as follows:
Phase 1:
Phase 2:
Phase 3 : Potassium-feldspar-quartz porphyr tic aplite. Contains
Fine grained, equigranular aplite with no mafic minerals.
Fine grained, equigranular aplite with 5-7% biotite’.
15% quartz phenocrysts, 2-6 mm. plus 5% potassium-
feldspar phenocrysts up to 1.5 cm. in a fine grained
groundmass of potassium-feldspar greater than quartz,
plus minor biotite.
Phase 4: Potass ium-fe ldspar-quar tz porphyritic alaskite/granite.
Contains 15-20% potassium-feldspar phenocrysts 1-4 cm.
long; 10-15% quartz phenocrysts up to 3 m., locally
seriate porphyritic.
The groundmass is medium grained, approx. 2 mm.,
saccharoidal, with potassium-feldspar greater than
quartz and 3-4% biotite, 1-2 mm.

6 Phase 5: Coarse grained, brown, friable d ke on ENG 2.
Composition so far undetermined, possibly dioritic.
Medium grained, equigranular biotite alaskite/granite.
Occurs only as a dike cutting Phase 8.
Medium to coarse grained, equigranular biotite granite
with 5-7% biotite.
Coarse grained, equigranular to seriate porphyritic,
biotite granite.
20-30% quartz up to 5 mm., with the remainder being
predominantly potassium-feldspar, 1-2 cm. long.
Phase 6:
Phase 7:
Phase 8:
Contains 5% biotite, 3-6 mm.;
Phase 9: Coarse grained, pink, equigranular to porphyritic
quartz monzonite/granite.
quartz, 1540% coarse grained plagioclase, frequently
mantling potassium-feldspar, 0-10% acicular alkaline
Contains 10% medium grained
amphibole ( ? ) in radiating aggregates up to 1 cm.
across, with the remainder being coarse grained, pink
potassium-feldspar.
zone.
Possibly represents an a1 teration
Phase 10: Strongly porphyritic alaskite, medium grained ground-
mass. Contains 30-40% potassium-feldspar phenocrysts,
averaging 2-3 cm. in length, 25-30% quartz , equigranular
to seriate porphyritic up to 1 cm., plus 5% biotite
generally as anhedrql aggregates to 1 cm. The ground-
mass consists of medium grained potassium-feldspar
greater than quartz greater than biotite and minor
plagioclase.
*'I ~-
7
Phase 11: Medium to coarse grained, equigranular to porphyritic
alaskite/granite. Contains 0-20% potassium-feldspar
phenocrysts, 1-3 cm. in length, 25-30% equant quartz,
averaging 5 mm., 2-7% biotite generally less than 2 mm.
in a medi um grained groundmass of potassi urn-fel dspar
greater than quartz much greater than biotite.
Phenocrysts in all phases are subhedral to euhedral while groundmass
minerals are generally anhedral t o subhedral . All phases except for 5 and 9
are white-grey in colour. P
certainty in Phase 9 , but is
phases.
Outside of the mineral
relatively minor. Generally
rare sericitization. In the
agioclase could only be distinguished with
assumed to be present in minor amounts in all
zed zones, alteration of the alaskite is
only minor kaolinization is present, and possibly
Cariboo Creek area an apple yellow-green ,
coloured alteration is present along many of the fractures.
alteration reported on the nearby MIR claims and identified there by X-ray
techniques as the clay mineral tosudite, an aluminium silicate hydrate
with minor iron, magnesium, calcium, sodium and potassium.
This resembles
In sheared areas, amorphous Fe-Mn oxide coatings are common and can
contain significant amounts o f Zn (eg. R-14: greater than 2% Mn, 0.3% Zn).
An attempt has been made to determine whether or not the mineralization
Results to date are inconclusive in the area i s related to a specific phase.
and speculative at best, however, there are indications that the mineral-
ization may be related to the late stage aplitic phases. A more complete
assessment of this possibility will be attempted during the second part of
the program and will no doubt require petrographic and geochemical studies.

8
r -
CHAPTER THREE - MINERALIZATION (Map 1 )
3-1 BASE METAL MINERALIZATION
All s ignif icant mineralization encountered d u r i n g this work has
been described br ief ly i n previous reports.
d u r i n g June and July 1979, was aimed a t delineating these known
occurrences and developing ideas regarding t h e i r genesis.
The work carried out
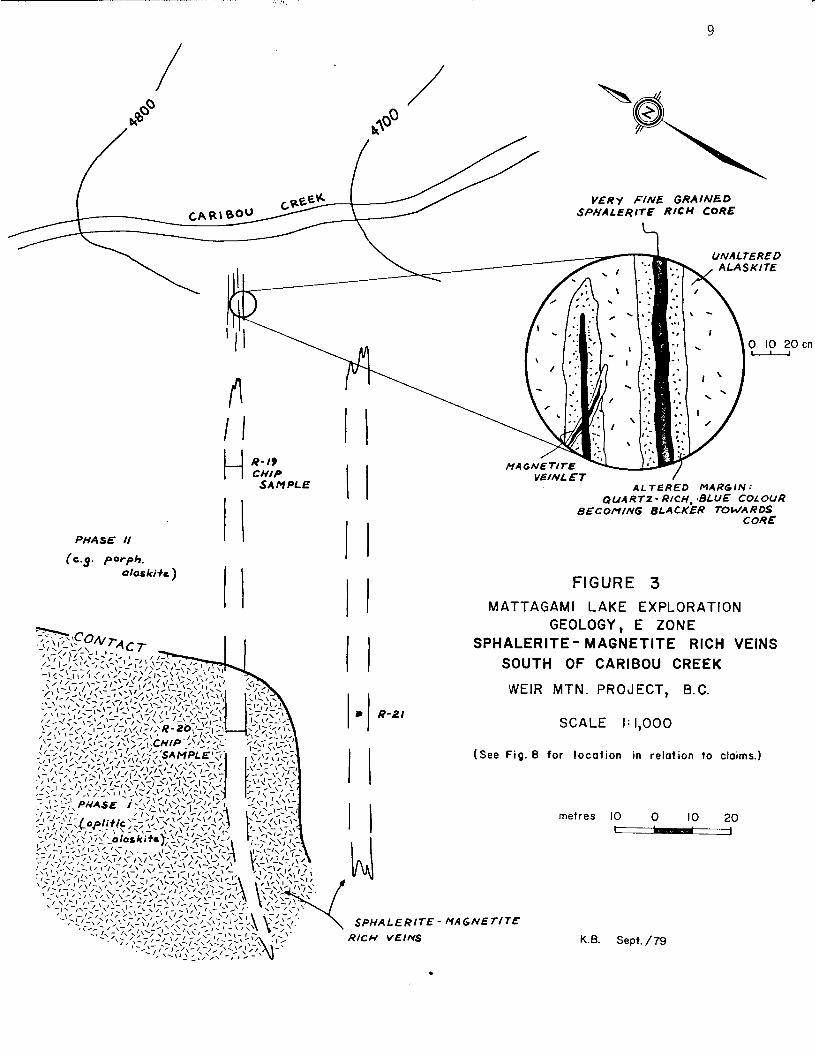
The most promising showing on the Weir Mountain property i s
"anomaly E " , on CY 6 and CY 7 , a l inear zone approx. 4-5 meters wide
containing abundant sphalerite.
ridge south of Caribou Creek over a s t r i k e length of approx. 180 meters
This zone i s exposed on a steep
and a ver t ical height of approx. 120 meters. Thirty meters southeast
of this main zone (Figure 3 ) i s a sub paral le l zone of a f ine
grained, granular, green rock w i t h up t o 15% medium t o coarse grained
magnetite and 20% medium grained sphaler i te . This second zone is
d i s t inc t ly d i f fe ren t from the f i r s t i n composition and could not be
mapped i n d e t a i l . I t i s very f r i ab le , ea s i ly weathered and exposed
i n only a few outcrops, however, mineralized ta lus from this zone i s
extensive and one analyzed sample contains 0.2% Pb, 0.18% Zn and
-55% F.
found on the property, mainly on CY 5 and CY 6.
Several other, smaller sphaler i te bearing zones have been
Previously these zones have been interpreted as mafic dikes
i n t r u d i n g the a lask i te .
theory has been dropped i n favour of a hydrothermal, vein type origin.
Based on the most recent mapping, this
The veins are characterized by very f ine grained, black cores,
containing abundant medium-coarse grained sphaler i te , local ly up t o
90%.
with cer ta in ty . Thin section study (Appendix VI) has suggested
t h a t the black mineral i s chlor i te . The sphaler i te bearing cores
can be up t o f ive meters wide and are bounded by mottled areas which appear
The composition of the black mineral has not been determined
9
A L T E R E D M A R G I N : QU4 R T Z - RICH, ,BLUE COLOUR
BECOMING 6LAtKER TOWARDS CORE
PHASE N
(c.9. p r p h . oloskitc ) FIGURE 3
MATTAGAMI LAKE EXPLORATION GEOLOGY, E ZONE
SPHALERITE - M A G N E T I T E RICH VEINS SOUTH OF CARIBOU CREEK
WEIR MTN. PROJECT, B.C.
SCALE I : 1,000
( S e e Fig. 8 for locat ion in relation to claims.)
metres 10 0 10 20 - K.B. Sept. /79
cn

10 t o be hydrothermally a l te red , a lask i te .
patches u p t o 2 cm. across have developed in the a lask i te , probably
replacing the groundmass minerals.
phenocrysts are common i n these mottled zones, which are generally
quite narrow ( less than 1/2 meter) and grade outwards into the
unaltered alaski te . I t appears tha t the hydrothermal a l te ra t ion does
not extend fo r more t h a n one meter beyond the sphaler i te bearing cores.
A t the base of the ridge, the main sphaler i te bearing vein pinches
Fine grained, green-black
Relict potassium-feldspar
out over less than 10 meters and i s replaced by a ser ies of pa ra l l e l ,
smaller veins, 4-70 cm wide. The same relationships observed i n the
large vein are found i n these smaller veins, t ha t i s , a l te ra t ion of
the a lask i te occurs over a short distance ( less than 20 cm) increasing
towards a black f ine grained, sphaler i te rich core. I n these smaller
veins, the cores are re la t ive ly narrow, ( less t h a n 20 cm) b u t contain
u p t o 20% sphaler i te .
developed and have a d i f fe ren t composition from the (a l te ra t ion zone
of the) large veins.
a l t e r a t ion , rare epidote veining and numerous cross-cutting magnetite
veinlets ( l e s s t h a n 1 cm wide).
veins were found on the CY 2 claim b u t no sphaler i te mineralization
has been located. One sample (115-R-9A) of the porphyritic a p l i t i c
a lask i te from th i s area assayed 130 ppm W although no mineralization
was v is ib le .
The adjacent a l te ra t ion zones a re much more
They are characterized by a blue-green, s i l iceous
Similar narrow, blue-green t o black
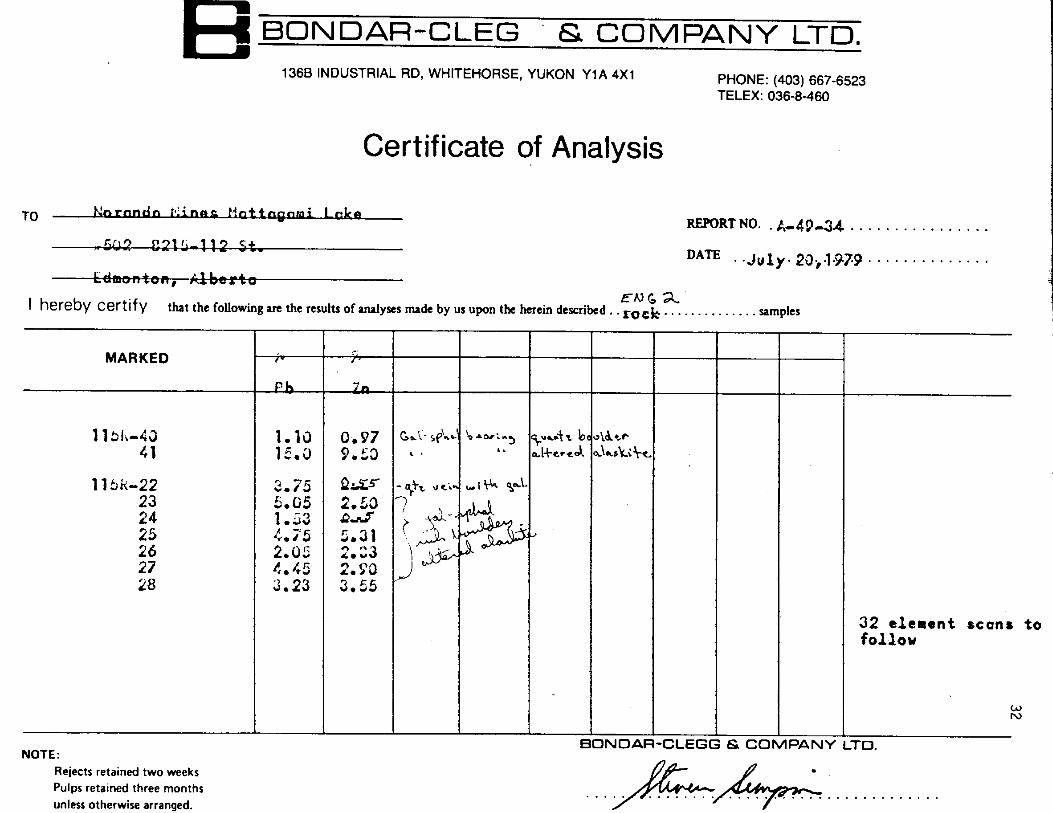
On the ENG 2 claim, prospecting confirmed the presence of numerous
mineralized boulders along a creek running n o r t h t o south through the
claim (Figure 4 ) .
and contain up t o 15% galena and 5-10% sphaler i te (115-R-41:15.0% Pb,
9.5% z n ) ,
These boulders appear t o be highly a1 tered a l a sk i t e

\ \ . \
I \
ENG 2 I *222
U - 4 9 8
R-62
R - S e f f - 6 9
A-&J A u
~ - a , a ) t ~ ; - - - - - - 0 1 1 FIGURE 4 a-UA
I * # - a t A - U . / R-60 MATTAGAMI LAKE EXPLORATION ; a-smr, b
L
K 8 Sepf /79 Boar Map Johna- Manvillr, A R 3731, Mop 8

1 2
generally as disseminated g ra ins b u t also as veinlets . The a l a sk i t e
has been a l te red to a f ine grained, white, earthy rock w i t h none of
the original mineralogy remaining.
The mineralized boulders were traced up the creek t o a cutoff
point near i t s headwaters.
of the creek d i d not reveal any d is t inc t cutoff fo r Pb or Zn. (Figure 6 ) .
Heavy mineral concentrates from p a n n i n g
Prospecting around t h i s area revealed the presence o f numerous heavily
a l tered a l a sk i t e boulders and quartz boulders while on a ridge about
250 meters t o the northwest, numerous qua r t z boulders a re concentrated
i n a zone 20-25 meters wide.
were located, two qua r t z boulders containing 3-5% galena plus
sphaler i te (1.1% Pb, 0.97% Z n ) were found.
While no mineralized a l a sk i t e boulders
I t i s f e l t by the author t h a t the hydrothermally al tered and
mineralized a lask i te i s related t o the mineralized quartz i n a manner
similar t o the showing on t o p of Weir Mountain.
20 cm. wide qua r t z vein consisting of c rys ta l s up t o 3 cm. long,
contains abundant galena , sphaler i te , magnetite and uranium (4 pounds
per ton U308, 1.65% Pb, 4% Z n ) .
a l tered and mineralized by the intrusion of the vein and a l so contains
abundant galena, u p t o 20%.
ENG 2 occurrence and the quartz vein i s 20 t o 25 meters wide, the
A t t h a t showing, a
The adjacent a l a sk i t e has been
I f indeed t h i s model applies t o the
area could have great potential .
sampling and various geophysical surveys will be required t o
Further work consisting of so i l
delineate the zone.
3-2 URAN I UPI PIN ERAL 1 ZATI ON
No new radioactive occurrences were found d u r i n g t h i s period.
Scinti l lometers were carried a t a l l times by the crew members d u r i n g
traverses.

FIGURE 5 MATTAGAMI LAKE EXPLORATION 13
ROCK SAMPLE LOCATIONS, CY-2, C Y - 4 I WEIR MTN. PROJECT, B.C.
SCALE 1:9600
5WIN - -
\ I ;to. 8
--- L -
I / ! i
1
0 100 200 400 metres
I I I C Y 2
0
I Q
7 s
I? Mt. McLay Mt.
I: 250,000
-- 0
I-
c 4 CL l M
I ,."I, I I !
\ / ; Ir' ! I
\ I Sfa. 2
K.B. Sept./79

1 4
The main uranium showing on Weir Mountain, "anomaly C " , consists
of Kasolite, (Pb(.U02)(Si03)(0H)2) , wulfenite, (PbMo04) , and minor
vandendriesscheite, (PbU702212H20) , which are precipi ta t ing from
groundwaters onto surface rocks. T h i s type of occurrence ex is t s
elsewhere i n the Surprise Lake batholith and has apparently been
d r i l l ed w i t h negative resu l t s (various geologists, B.C. Uranium
Inquiry, Atl in , B.C . , July 4 , 1979) .
has been reported i n these areas and i t seems t h a t the u r a n i u m may
simply be derived from leaching of the highly fractured a l a sk i t e ,
which has a very h i g h background uranium content.
t ha t the potential fo r primary Uranium mineralization i s low, i t
should n o t be overlooked. There are two potential primary Uranium
sources a t Weir Mountain, besides the a lask i te .
radioactive U-Pb-Zn bearing quartz vein such as the one occurring ,
on the t o p of Weir Mountain.
about 250 meters from the Kasolite showing.
towards the showing, under the t a lus , and though not radioactive
where exposed, i t i s quite possibly mineralized elsewhere along i t s
length. Another potential source i s a flourite rich a l te ra t ion zone,
which i s apparently associated w i t h a sphaler i te bearing vein near
the Kasolite showing.
a l a sk i t e w i t h u p t o 30-40% f lou r i t e and 30 ppm Uranium.
therefore make a more sui table source fo r the Uranium t h a n the
unaltered a lask i te . Further work, including detai led geophysical
surveys, will be required to ascertain the source of the Uranium i n
t h i s area.
No primary Uranium mineralization
While this suggests
The f i r s t i s a
Extensive q u a r t z v e i n i n g has been found
T h i s veining s t r ikes
This rock i s a very f r i a b l e , extremely al tered
I t would

15
CHAPTER FOUR - GEOCHEMISTRY (Figures 6, 7) Several methods of geochemical sampling were conducted in various
areas during this period. These consisted of soil sampling, talus fines
sampling and the panning of creeks to obtain heavy mineral concentrates.
Soil sampling was carried out along reconnaissance lines on the
ENG 1 , 2 and 3 claims and in a detailed manner over previously determined
anomalies on the Blue Sky Creek grid.
immature. The A horizon is poorly developed averaging 1 to 2 cm. in
thickness and reaching a maximum of approximately 20 cm. in isolated
areas of dense vegetation. The B horizon generally is light to dark
brown in colour and consists predominantly of coarse rock fragments
(less than 5 mm.1 with lesser amounts of sand and silt sized particles.
All samples were taken from the B horizon.
In most areas the soils are very
Talus fines sampling was carried out on CY 4 and CY 6 (Figure 7). I
Samples of the talus (or soil) were screened in the field to a size of
less than 1 mm. and analyzed for W , Sn, Cu, Pb, Zn and U among other elements.
Assays of these samples indicate an area of anomalous Zn and U
concentration up to (185 ppm Zn and 115 ppm U) at locations P535 and P536.
No known mineral occurrence can yet be related to these anomalies and
further geochemical and geophysical surveys will be required to define
the source.
On ENG 2 and 3 (Figure 6) soil sampling 2 anomalous areas west of
Galena Creek (samples P1023, P1024 and P1032) with up to 270 pprn Zn and
74 ppm Pb.
point of the galena-sphalerite rich boulders found in Galena Creek and
the area where numerous extremely hydrothermally altered alaskite boulders
were found.
Samples P1023 and P1024 coincide with the approximate cutoff
A small anomaly at P1012 and P1013 with 150 ppm Zn and 100
ppm Pb was also located but does not correspond to any known mineralization.

'.- \
\ - -- I
4\, \
I \
\ I
f P \
D- tni i
J /007,
r - w a y
\
f -' P-1002 - 1----- -I
P-I0321 A
3- ,009 Y P - 1%
\ I ,
I 'FIGURE 6' P- 1003 -S- 1001 S-IOOL I \
P S 4 4 \ a
\
P- 545 1 p- 1 5 4 I E N G 2 "222 I
13
M A T T A G A M I L A K E E X P L O R A T I O N / I I
SOIL AND STREAM SEDIMENT SAMPLES, ENG 1-3, WEIR M T N . PROJECT, B.C.\
SCALE I: 24,000
p- 559 500 500 1000 metres 0
p- 1600 1
0 P-540 1 p-542 P-641 0
I P- 643
Base Map: Johns-Manville, A.R. 3731, Map 8
K.B. Sept. /79
CY 8-'9

7,
14 14 24
40
33
18 18 l3 51
s10 814
r8
FIGURE 6a COPPER IN PPM
h 6 - panned sample s 8 - stream sample
12 - soil sample

392 :a160 a l l 0
a
? 52 3 0
35,52 a
34,40
270
0 h64 88
FIGURE 6b ZINC IN PPM
h 9 0 - panned sample s 5 0 - stream sample 78 - soil sample

a s18 ' 536 '$24 812
46
28
28
h16
I ' / I - c . . . i. .
FIGURE 6 c LEAD IN PPM
h28- panned sample s32- stream sample 46 - soil sample

836 9310
's14
FIGURE 6 d MOLYBDENUM IN PPM (OVER Spprn)
12 - soil sample s6 - s t r e a m sample

.s130u 0 5 3 4 0 U
' r340U s95W,42U
0
l3Sn 0 15U, 13%
2.2U, 18%
FIGURE 6 e TtN, TUNGSTEN AND URANIUM IN PPM
s95 - stream sample 15 - soil sample

I I
P-518 \ I I .
I P-521
\ I 5 W 2 S / i
P- 525
P-526.
P-521. P-511
P- 510
rn 0 0 0 P- so
P-529 - - P- 5 I
CY 4
P- 530
P-531
CL A/M I P- 532 P-505. \
k w 4 s 4w4s 0
---- - h 3 3 5 - - - 0
CY 6 4N4W P-503
P-502. CLAIM P- 534. I f .Mt. McLoy
Weir Mt.
AREA \
I: 250,000
1 7
FIGURE 7 M A T T A G A M I L A K E EXPLORATION
SOIL SAMPLE LOCATION MAP, CY-4, C Y - 6 WEIR MTN. PROJECT, B.C.
SCALE 1:9600
400 metres 200 50 0 100 200 r - m t

18 12
28 64
12 8 .
II
16 14
7 . 12 8
I
23 7 .
22 9 .
X . 16
b - - .
, X . 31
X @
16 X .
16 X .
16 X .
X . 14
X .
24 X
23 50
X .
FIGURE 7a COPPER IN PPM
x - no value
200 50 0 100 200 400 metres I - - 1

19
15 30
74 0 I 62
L - 45.
\ lk -..
16 7.
40
20 8
20
20
22
9 .
10
10
23
8 .
58
16
20
16
68
47 22
26
16 34
18
35
75 . 45
20
34
33
32
FIGURE 7 b LEAD IN PPM
200 50 0 100 200 400 metres I - - i

50 0
90 0
0 25 45 0
0 35
20 0 35
30 24
n o
46
28 0
28 0
62 0 35
0 37
105 0
47 42 0
46
I 58 0 0 87
48 38
80 0
60 0
170 0
185 88 0 a 105
FIGURE 7c ZINC IN PPM
I
2 00 50 0 100 200 400 metres 1 1 - 1

21
21 0 6.4
50.5 0 75 0
10.0 3.1
10.5
0 28.5 12.0
0 6.9
6.6
0 7.6 8.4
15.0 8.9 ' 9 0
5.2 8.4
0 12 .o 10.5 0
22.0. 6.9 '
13.5 0.
11.0 ' 23.0'
20.0 ' 9.2
13.0
' 12.0
0 5.6
18.0. 0
30.0 32.5
115.0 26.0'
72.0 '
FIGURE 7 d URANIUM IN PPM
200 50 0 100 200 400 metres r - - 1

22
To the north of Galena Creek and northeast o f fly camp 13, 2
parallel lines of soil samples were taken across the slope (P1051 to
P1069).
zinc (94-1200 ppm) and lead (30-300 ppm). Detailed grids in this area,
and the Galena Creek area, will be established over which soil sampling
and geophysical surveys will be carried out during the second half of
this year's program.
Virtually all samples on these lines are anomalously high in
Detailed soil sampling was carried out over selected areas of the
Blue Sky Creek grid (Map 3) where uranium anomalies were discovered in
1977 and 1978. This year's survey confirmed the extent of "anomaly D"
over 220 meters with uranium reaching 490 ppm in the soil.
proved t o be anomalous in zinc, up to 1100 ppm, copper, up to 62 ppm,
lead, up to 82 ppm and molybdenum, up to 20 ppm. A major anomaly was
delineated on lines 50E and lOOE from 2605 to 300s with up to 830 pprn
uranium, 390 pprn zinc, 120 ppm lead, 160 pprn copper and 110 ppm molybdenum.
Smaller anomalies were located on lines lOOW at 300S, 00 at OOS, 150S,
180s and 325s.
anomalies were inconclusive and further geophysical surveys (possibly EM 31)
are recommended.
This zone also
I
Magnetomer and radem surveys (Map 4) over these geochemical
HEAVY MINERAL CONCENTRATE RESULTS (Figure 6)
Analyses of the heavy mineral concentrates obtained by panning along
Galena Creek indicate only nominal variations in copper, zinc, lead,
silver and molybdenum. No clearly defined cutoff is evident in any of
the elements, however, there may be a weak cutoff in the concentration
of copper between H-1003 and H-1004.
4 pprn copper while those south of this point average 7 pprn.
Samples north of H-1003 average

23
STREAM SAMPLE RESULTS (Figure 6)
Only thirteen stream sediment samples were taken during this period
since most of the streams in this area have been sampled in previous
years.
did not reveal any anomalous areas. One sample, S-1500, was taken on
CY 9 and was anomalously high in tungsten - 95 ppm.
is known in this area and further work including soil sampling, geological
mapping and prospecting will be required to define the source.
A total of nine samples were taken on ENG 3 (S-1000-SlOO8) but
No mineralization

24 CHAPTER FIVE - GEOPHYSICS
5-1 INTRODUCTION
Only 2 detailed geophysical surveys were conducted d u r i n g this
program, namely a magnetometer survey and a radon i n so i l survey.
Scintillometers were carried by the crew members a t a l l times during
traverses and used not only to locate radioactive occurrences b u t
a lso as an aid i n mapping the various alaski te /grani te phases.
5-2 MAGNETOMETER SURVEY
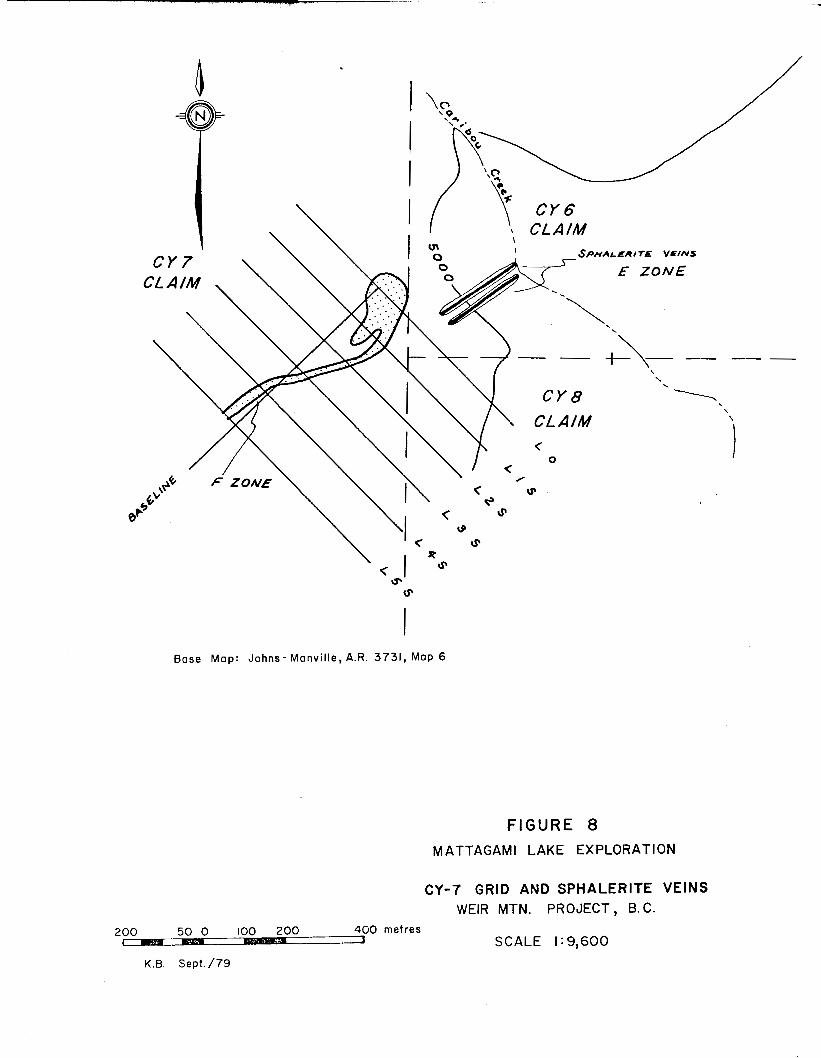
The survey was completed over a newly established gr id , (Figure 8)
Readings were taken a t 25 m intervals predominantly on the CY 7 claim.
over a to ta l of 5300 meters of l ine (Map No. 5 ) w i t h anomalous areas
being surveyed a t 6 m intervals.
magnetometer which was calibrated t o zero a t a base s ta t ion near the main
camp. All readings were taken a t waist level and facing magnetic north.
The instrument used was a McPhar M700
About 100 m t o the northeast of the gr id , two sphaler i te
magnetite bearing veins are exposed along a steep ridge face.
veins are each 2-5 m wide (about 30 meters apar t ) and roughly ver t ica l .
Only one magnetic anomaly could be traced across the g r i d .
the presence of a large cornice, the survey could n o t be extended
over the ridge and therefore i t i s uncertain as t o whether one o f
these veins a re producing the anomaly.
boulders are present i n one area of the g r i d , however, and although
these resemble the northernmost, more sphaler i te-r ich vein, the
anomaly does not appear t o coincide w i t h e i t h e r of the known veins
and probably represents a t h i r d vein. The survey will be extended
t o the NE d u r i n g the second p a r t of the program in order t o
The
Due to
Numerous sphaler i te-r ich
Base Map: Johns- Manvil le, A.R. 3731, Map 6
FIGURE 8 MATTAGAMI LAKE EXPLORATION
CY-7 GRID AND SPHALERITE VEINS WEIR MTN. PROJECT, B.C.
2 400 metres SCALE I : 9,600
K.B. Sept . /79
26 defini te ly correlate the magnetic anomaly w i t h one of the dikes.
The survey area will also be extended t o the SW t o fu l ly t race the
length of the anomaly. To date i t ~ a p p e a r s t o be over 500 meters long.
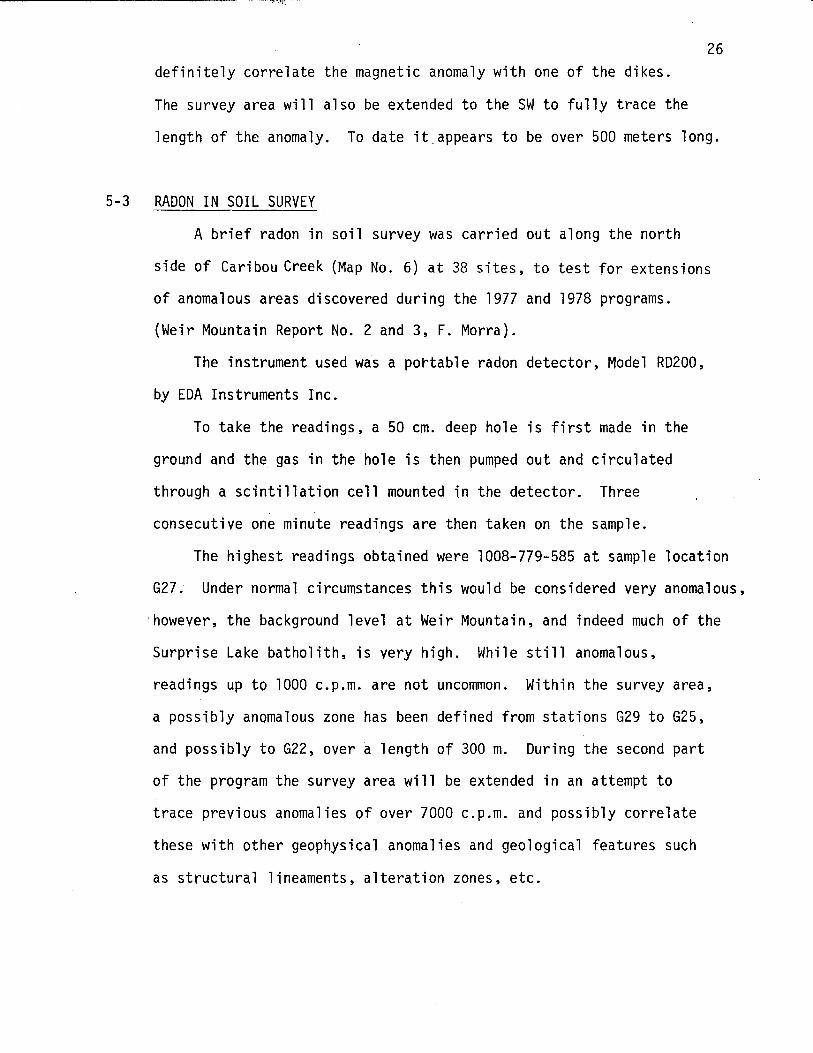
5-3 RADON IN SOIL SURVEY
A brief radon i n so i l survey was carried out along the nor th
side of Caribou Creek (Map No. 6) a t 38 s i t e s , t o t e s t for extensions
of anomalous areas discovered d u r i n g the 1977 and 1978 programs.
(Weir Mountain Report No. 2 and 3 , F. Morra).
The instrument used was a portable radon detector , Model RD200,
by EDA Instruments Inc.
To take the readings, a 50 cm. deep hole i s first made i n the
ground and the gas i n the hole is then pumped o u t and circulated
through a sc in t i l l a t i on ce l l mounted in the detector. Three
consecutive one minute readings a re then taken on the sample.
The highest readings obtained were 1008-779-585 a t sample location
627. Under normal circumstances t h i s would be considered very anomalous,
however, the background level a t Weir Mountain, and indeed much of the
Surprise Lake batholith, i s very h i g h . While s t i l l anomalous,
readings up t o 1000 c.p.m. a re not uncommon. Within the survey area,
a possibly anomalous zone has been defined from s ta t ions G29 t o 625,
and possibly t o 622, over a length of 300 m. During the second p a r t
of the program the survey area will be extended i n an attempt t o
t race previous anomalies of over 7000 c.p.m. and possibly correlate
these with other geophysical anomalies and geological features such
a s s t ructural lineaments, a l te ra t ion zones, e t c .

CHAPTER SIX - CONCLUSIONS AND RECOMMENDATIONS
6-1 CONCLUSIONS ------
Detailed mapping and sampling o f the main sphalerite rich zone
indicates that these zones are hydrothermal veins with only minor
associated alteration.
constant trend of these veins suggest that they were emplaced along
relatively early formed joint system, possibly as a result of volatiles
given o f f by a late crystallizing phase.
by their enrichment in Sn, Be, B i , U and F.
The linear nature, lack of shearing and apparent
This theory is supported
The galena and sphalerite rich boulders found on ENG 2 appear
The source to be hydrothermally altered and mineralized alaskite.
of this mineralizat
exposed) which itse
indicates that this
on i s presumed to be a large quartz vein (not
f is probably mineralized.
quartz vein may be 25 meters wide.
Talus distribution
The economjc
potential of this zone could be significant since some talus samples
contain up to 25% Pb and Zn and 1 oz/ton Ag.
6-2 RECOMMENDATIONS
On the basis o f the data obtained and
date, the following work is recommended: I
observations made to
1. Extension of the CY 7 magnetometer survey to trace
the entire length o f the magnetic anomaly and to cover
extensions o f the two known sphalerite rich veins.
Blast-trenching of the 2 sphalerite rich veins where
they outcrop south o f Caribou Creek to accurately
determine width and grade.
2.

28
3 . Blast-trenching along the CY 7 magnetic anomaly at
200 meter intervals to ascertain the width and grade
of this presumed 3rd sphalerite rich vein.
4. Detailed soil sampling and geophysical surveys on
ENG 2 to delineate the source of the galena-sphalerite
rich boulders.
trenching o f any anomalies.
This should be followed by blast-
5. Detailed mapping, soil sampling and possibly magnetometer
surveys on CY 2 to test for possible sphalerite rich
veins and tungsten mineralization.
6. Detailed mapping, soil sampling and geophysical surveys
(magnetometer, RADEM) on CY 6 to locate the source of
U and Zn in soil anomalies, I .P. anomalies and galena-
sphal eri te bearing tal us.

STATEMENT OF COSTS DETAILS
63
WAGES J. Biczok 1,862.69 June22 to P. Wagner 1,312.49 July 15 C. Stewart 1,083.76
P. Lhotka 1,232.18 5,491.12 CONSULTANT FEES
D. Sutherland 2 days (3 $150./day = $300.
TRANSPORTATION
Ground Tilden Truck Rental 2 mos. (3 $550./mo. = $1,100. Budget Truck Rental 6 days (3 $568./mo. = $113.60 Vehicle Operation = $335.61
He1 icopter Hughes 500 - 14.7 hours - $275.,+ fuel/hour =
INSTRUMENT RENTAL
Urtec UG130 scintillometer 1. month (3 $340./mo. Urtec UG135 spectrometer 1 month (3 $398./mo. = Geometrics GRSlOl scintillometer $238.16/month McPhar TVlA spectrometer 2 (3 29 days, $8.60/day + $7.98/mo insurance EDA RDX356 soil probe 1 (3 $35./month, 1.5 months McPhar fluxgate magnetometer 2 (3 $255. + $8.48/mo., 1 month Tundra Tech. Services 2 (SBX-11) radiophone (3 $180./mo.
&* ANALYSIS
FOOD AND ACCOMMODATION Nl(@M*h$ 'b/d
300.00
1,499.21
4,528.50
738.00
238.16
531.96
52.50
526.96
360.00
SUPERVISION
REPORT
2,447.58
3,175.65
4,187.66
999.45
494.34
$23,123.51

SAMPLE ANALYSES
Geochemical -
208 elements @ $1.50 =
382 elements @ $0.65 =
126 (U ) @ $2.90 =
149 elements @ $3.50 = 131 (W), 18 (Be)
36 elements @ $3.75 = 13 (Au), 23 (F)
175 (Cu) @ $1.00 = 794 elements (3 $0.60 =
Assays
81 (W) @ $2.00 =
13 (Cu), 94 (Ag), 84 (Pb), 17 (Zn)
124 (Mo), 16 (Ag), 43 (Pb), 115 (Zn), 1 (Mn), 83 (Cu) 7 (Bi) @ $2.50 =
59 (Sn) @ $3.25 =
2 (32 element scans) @ $25.00 =
94 ( U ) , 175 (Zn), 175 (Pb), 175 (Ag), 175 (Mo)
. -
i’. . 64 . ... . ..
. *
162.00 312.00
1 1 26
10 4
2
1 94 84 275
(Ag) @ $4.25 = (Cu) @ $5.00 = elements @ $5.50 = 15 (Zn), 11 (Pb) (Ag) @ $6.00 = elements @ $9.00 = 2 (sn), 1 (W), 1 (Mn) (F) @ $14.00 =
Heavy mineral preparation @ $1.00 = Rock sample preparations @ $1.75 =’ oil preparations @ $0.45 = Background corrections @ $0.15 =
$3,175.65
248.30
17.50 365.40 191.75 521.50
135.00
50.00 175.00 476.40
4.25 5.00
143.00
60. b0 36.00
28.00
1 .oo 164.50 37.80 41.25

~~ “‘I,
29
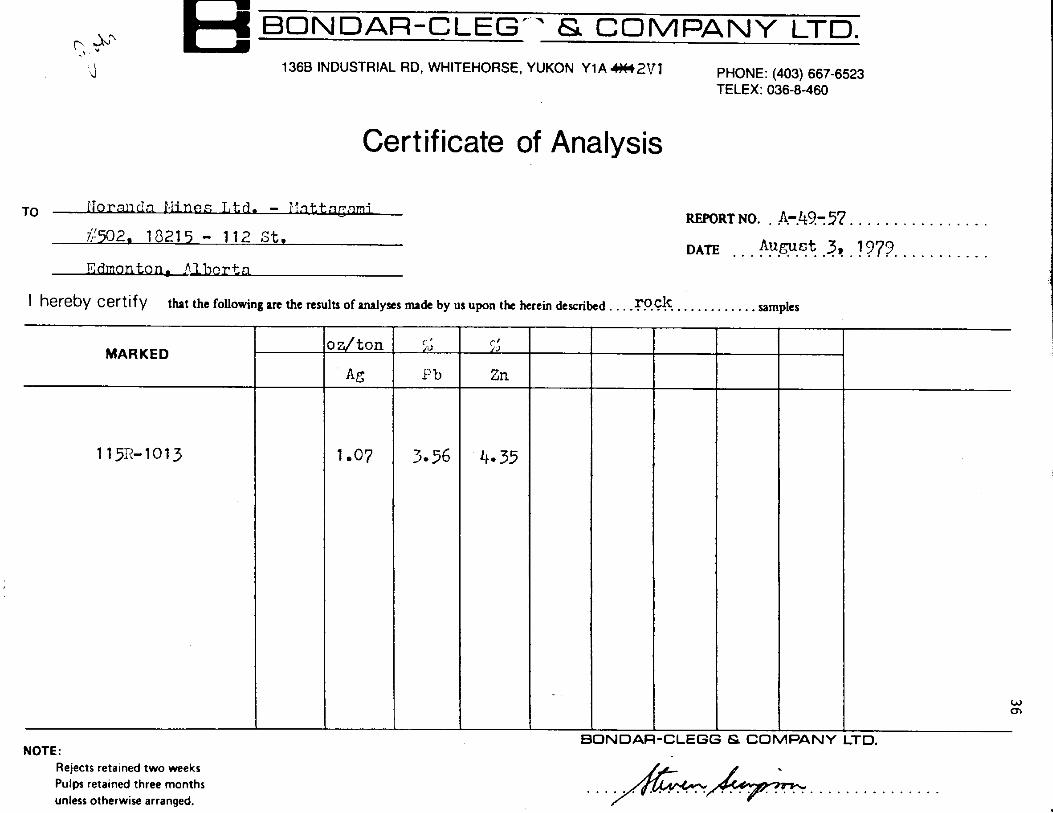
APPENDIX I
ROCK SAMPLE ANALYSES

BONDAR-CLEGT & COMPANY LTD. PHONE: (403) 667-6523 TELEX: 036-8-460
1368 INDUSTRIAL RD, WHITEHORSE, YUKON YlA4WZV1
Certificate of Analysis
TO
$502, 18215 - 112 St . REPORT NO. . . A4+9-.54 . . . . . . . . . . . . . . .
DATE . . .numst. 3.,. .?429. . . . . . . . . . .
MARKED
NOTE: Rejects retained two weeks Pulps retained three months unless otherwise arranged.
n/ 2U
cu
-1.1
r l /'O
Zn
'Yil & El t o follovr
... 2.96 -11.1)
.I)--
R
BONDAR-CLEGG 6 COI
w 0
Edmonton, Alberta
I hereby certify that the following are the results of analyses made by US upon the herein described .... .T'P.Ck ........... samples
. . . . . . . . . . . . . . . . .

BONDAAR-CLEG" 6; COMPANY LTD. 1366 INDUSTRIAL RD, WHITEHORSE, YUKON Y1A 4x1
Certificate of Analysis
Noranda M i n e s L t d . TO
M a t t a g a m i L a k e E x p l . D i v .
Suit e #502. 8 2 1 5 II 117 St.
PHONE: (403) 667-6523 TELEX: 036-8-460
REPORT NO. A-49-54
DATE
. . . . . . . . . . . . . . . . . . . . . . . . .
. .Au.SUSl:. 21 1 . .???? . . . . . . . . . . .
Edm t o n A l b e r t a T6 G 1C8 I hereby c ~ ? # y f . t the followmg an the results of analyses made by us upon the herein described ....... .W Gk ......... samples
MARKED
115R - 7
w 115-R-1003
NOTE: Rejects retained two weeks Pulps retained three months unless otherwise arranged.
% W
2.76
*
F
3 . 8 8
1.80
BONDAR-CLEGG 6r COMPANY LTD.
RONDAR-CLEG ' & COMPANY LTD.
1368 INDUSTRIAL RD, WHITEHORSE, YUKON Y1A 4x1 PHONE: (403) 667-6523 TELEX: 036-8-460
Certificate of Analysis
REPORT NO. . &.43..34 . . . . . . . . . . . . . . . .
DATE . .July. 2QJ.939 . . . . . . . . . . . . . .
€ M G a, I hereby certify that the following are the results of analyses made by us upon the herein described .. sock .............. samples
MARKED
1 15k-22 23 24 25 26 27 28
NOTE: Rejects retained two weeks Pulps retained three months unless otherwise arranged.
(Y
L
t.lr3 I K (J
2.75 5.65 1.53 4. r"5 2.05 4.45 3.23
.re
c
P
7n
oe97 9.53
QdiY 2 e 53 Qd 5.31 2. :3 2. FO 3.55
BONDAR-CLEGC
32 element scans follow
w N
& COMPANY LTD.
/ . . . . . . . . . . . . . . . .
I t o

e y . . n i
RONDAR-CLEG & COMPANY LTD. 136B INDUSTRIAL RD, WHITEHORSE, YUKON Y1A 4x1 PHONE: (403) 667-6523
TELEX: 036-8-460
Certificate of Analysis
REPORT NO. . A-.4.9.-.34 . . . . . . . . . . . . . . . .
DATE .Augus.t. .a,. .1979. . . . . . . . . . . . .
MARKED
-22
-23
- 24
-25
-26
-27 -28
i z / t o n
LO . 05 1.64
It. 38
0.50
0.35 0.69
0.16
0 74 0 . 11.8
Rejects retained two weeks Pulps retained three months unless otherwise arranged.
W W
BONDAR-CLEGG & COMPANY LTD.

'' c :I BONDAR-CLEGF 1c COMPANY LTD. 1366 INDUSTRIAL RD, WHITEHORSE, YUKON Y l A d V 1 PHONE: (403) 667-6523
TELEX: 036-8-460
Certificate
- _. N o r a n d a Mines Ltd . -Mat taaarn i Lk. l Y
...------- S u i t e #502, 8215-112 St.
Edrnon t o n I A 1 be r t a
of Analysis
REPORT NO. . . . A ? $?.-.89 . . . . . . . . . . . . . .
I hereby Certify that the foUowing are the results of analyses mabe by us upon tk herein describe(
MARKED
11 5R-I00 115R-1515
NOTE: Rejects retained two weeks Pulps retained three months unless otherwise arransed.
Sn
7.96 0.38
f
DATE . . . . : A Y g u 9 t.2.7: ,. . 1 9 79. . . . . . . .
. . . . .P u.1 P. ........... samples
BONDAR-CLEGG & COMPANY LTD.

n BONDAR-CLEGT 6; COMPANY LTD.
PHONE: (403) 667-6523 TELEX: 036-8-460
1368 INDUSTRIAL RD, WHITEHORSE, YUKON Y1 A 4x1
Certificate of Analysis
Noranda M i n e s L i m i t e d ( M a t t a g a m i )
S u i t e #502, 8215-112 St. TO
Edmonton, A l b e r t a T6G 1C8
REPORT NO. A-49-70
DATE
. . . . . . . . . . . . . . . . . . . . . . . . .
. .Ac! g v s ! . ! ?, . L??? . . . . . . . . . . .
1 hereby certify that the foilowing the results of mlyses made by US upon the herein described ... XO c.k ............. samples
MARKED
1 1 5-R-101 3 .63
% . Z n
Scans 6, W t o f o l l o w
w ul
NOTE: Rejects retained two weeks Pulps retained three months unless otherwise arranaed.
BONDAR-CLEGG G COMPANY LTD.
'3
RONDAR-CLEG" 6; COMPANY LTD.
1368 INDUSTRIAL RD, WHITEHORSE, YUKON Y1A W2V1 PHONE: (403) 667-6523 TELEX: 036-8-460
Certificate of Analysis
E w n t o n , J l b e r t n
I hereby certify that the fobwing uc the results of miy=s made by US upon the herein describe
MARKED
115~-1013
NOTE: Rejects retained two weeks Pulps retained three months unless otherwise arranged.
I .07
c'
REPORT NO. . Am.@-5'7. . . . . . . . . . . . . . . .
. . . nu!??Gt .3? . ????. . . . . . . . . . . DATE
. . . .rock ............ samples
4.35
BONDAR-CLEGG & COMPANY LTD.
. . . +&.... . . . . . . . . . .
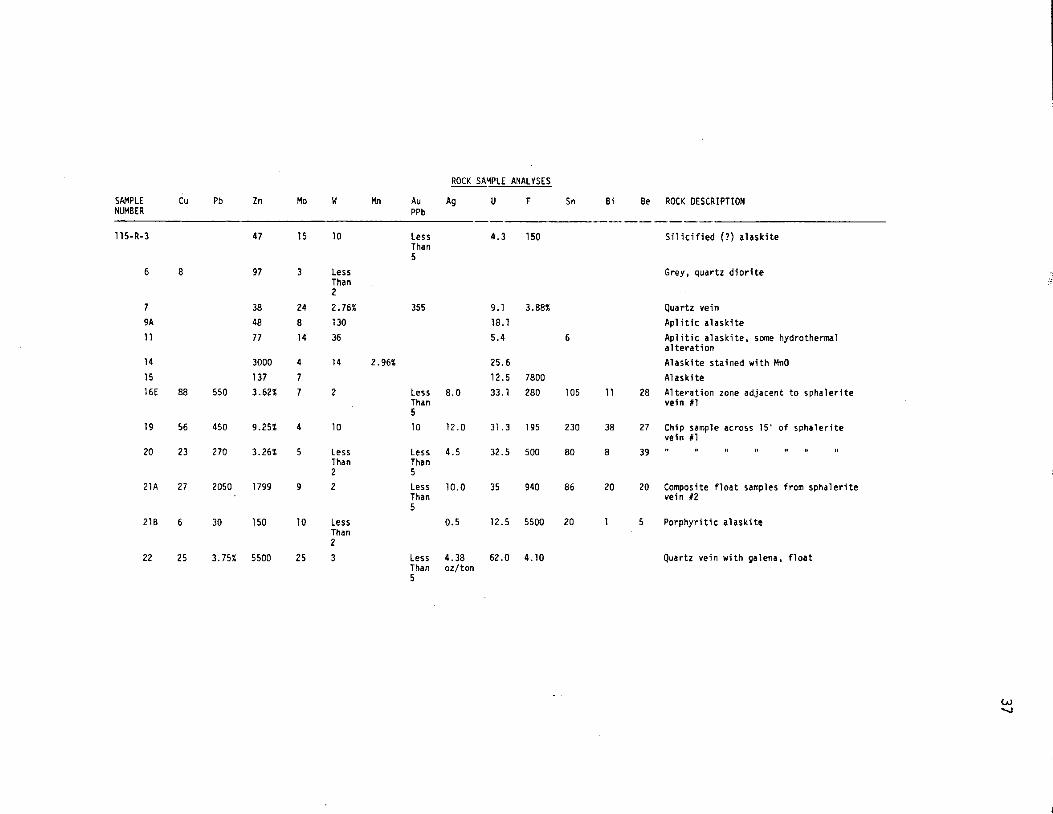
ROCK SAMPLE ANALYSES
SAMPLE Cu Pb Zn Mo W Mn Au Ag U F Sn B i Be ROCK DESCRIPTION NUMBER PPb ------------ 115-R-3
6
7 9A 11
14 15 16E
19
20
21A
21 B
22
8
88
56
23
27
6
25
550
450
270
2050
30
3.75%
47
97
38 48 77
3000 137 3.62%
9.25%
3.26%
1799
150
5500
15
3
24 8 14
4 7 7
4
5
9
10
25
10
Less Than 2 2.76% 130 36
14
2
10
Less Than 2 2
Less Than 2 3
2.96%
Less 4.3 150 Than 5
S i l i c i f i e d (? ) a l a s k i t e
Grey, quar tz d i o r i t e
355 9.1 3.88% Quar tz ve in 18.1 A p l i t i c a l a s k i t e 5.4 6
25.6 12.5 7800
A p l i t i c a l a s k i t e , some hydrothermal a1 t e r a t i o n A l a s k i t e s ta ined w i t h MnO A l a s k i t e
Less 8.0 33.1 280 105 11 28 A l t e r a t i o n zone ad jacent t o s p h a l e r i t e Than ve in U1 5 10 12.0 31.3 195 230 38 27 Chip sample across 15' of s p h a l e r i t e
Less 4.5 Than 5 Less 10.0 35 940 86 20 20 Composite f l o a t samples f rom s p h a l e r i t e Than ve in #2 5
ve in U1 32 . 5 500 80 8 39 I1 II II I 1 II 0 II
0.5 12.5 5500 20 1 5 P o r p h y r i t i c a l a s k i t e
Less 4.38 62.0 4.10 Than oz / ton 5
Quar tz ve in w i t h galena, f l o a t
w U
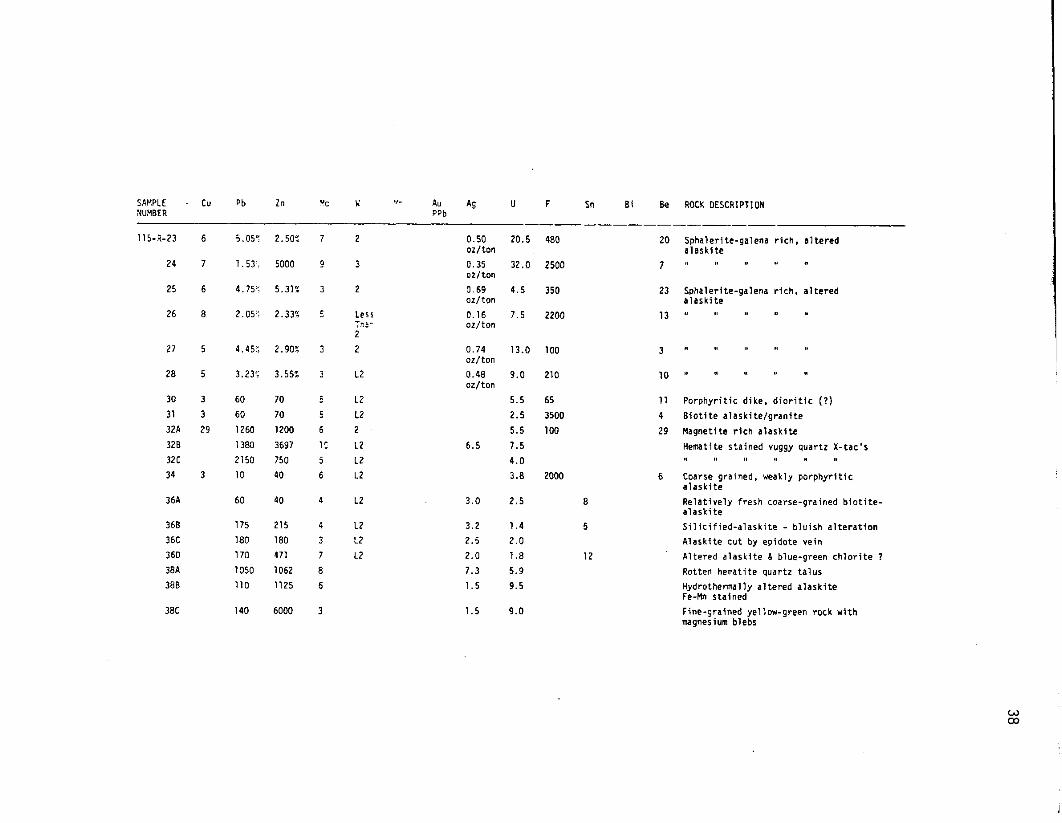
SAMPLE - Cu Pb Zn UC k‘ ‘I- Au Ag U F Sn Bi Be ROCK DESCRIPTION NUMBER PPb ------------- 1 1 5-R-23
24
25
26
27
28
30 31 32A 328 32C 34
36A
368 36C 36D 38A 388
38C
6
7
6
a
5
5
3 3 29
3
5.0%
1.53,
4.757
2.05’:
4.452
3.23’;
60 60 1260 1380 2150 10
60
175 180 170 1050 110
140
2.50:
5000
5.319:
2.33%
2.90%
3.55%
70 70 1200 3697 750 40
40
21 5 180 471 1062 1125
6000
7
9
3
5
3
3
5 5 6 1 t 5 6
4
4
3 7 a 6
3
2
3
2
Less ThE- 2 2
L2
L2 L2 2 L2 L2 L2
L2
L2 L2 L2
0.50 oz/ton 0.35 ot/ton 0.69 otlton 0.16 oz/ton
0.74 oz/ ton 0.48 oz/ton
6.5
3.0
3.2 2.5 2.0 7.3 1.5
1.5
20.5
32.0
4.5
7.5
13.0
9.0
5.5 2.5 5.5 7.5 4.0 3.8
2.5
1.4 2.0 1.8 5.9 9.5
9.0
480
2500
350
2200
100
210
65 3500 1 00
2000
8
5
12
20
7
23
13
3
10
1 1 4 29
6
Sphalerite-galena rich, altered a1 aski te
I 1
Sphalerfte-galena rich, altered alaski te II II II n II
II n II II 11
I1 tI II II II
Porphyritic dike, dioritic ( ? ) Biotite alaskite/granite Magnetite rich alaskite Hematite stained vuggy quartz X-tat’s
I1 n I1 I1 I1 II
Coarse grained, weakly porphyritic alaskite Re1 a ti vely fresh coa rse-gra i ned biotite- alaski te Sil ici f ied-alaski te - bluish a1 teration Alaskite cut by epidote vein Altered alaskite & blue-green chlorite ? Rotten hematite quartz talus Hydrothemally altered alaskite Fe-Mn stained Fine-grained ye1 low-green rock with magnesium blebs
i
w 03

SAMPLE Cu Pb Zn Mo W Mn Au Ag U F Sn B i Be ROCK DESCRIPTION NUMBER ----- PPb ---- -- 115-R-38D
39
40
41
43
49A 52 54 56 6lA 61 B 63 64 100 501
504A 5048 504C 529 531 1003
150
420
1.10%
15.0%
90
. 30 55 67 1050 61 7 60 58 40 1068
60 9 30 530 44 2800 6 230
81 9
979
.97%
9.50%
150
70 57 120 736 250 165 770 242 32 76
9.95% 1.18%
.loo0
223
2
1
2
5 9 8 8 3 10 3 4
5 6 5 6 3
L2
2 2 180 L2 L2 2 L2 6 80
L2 L2 L2
7.5
3.0
L .05 oz l t on 1.64 o z l t o n 1 .o
.8
.5 1 .o 5.0 6.0 1.7 4.0 1.5
.2
L5 2.2
L5
2.5
10.0
4.4
18.0 4.6 3.2 5.4 3.6 4.4 5.0 4.6
- 1
12.5
57.5
5
7.96%
Hydrothermal l y a1 te red a l a s k i t e - p o r p h y r i t i c Hydrothermal ly a1 te red a lask i t e - p o r p h y r i t i c L b l u e - c h l o r i t e ? Quar tz ve in w i t h galena and s p h a l e r i t e
Hydrothermal ly a l t e r e d a l a s k i t e - gqlena spha le r i t e "A1 ka l i n e amphi bo le rose t te " quar tz monzoni t e A l t e r e d a l a s k i t e - micacious H igh ly a l t e r e d wh i te a l a s k i t e Mgn. rep lac ing a l a s k i t e Mn-Fe coated quar tz Mgn. rep lac ing p o r p h y r i t i c a l a s k i t e Mgn. ve in ing i n a l a s k i t e Black, a l t e r e d a l a s k i t e Heav i l y a l t e r e d r o t t e n quartz ve in Gre i s in i zed a l a s k i t e h igh muscovi te
A1 te red ve in and spha le r i t e A1 te red a l a s k i t e
C lear t o m i l k y quar tz ve in 195 55 L1 10 Quar tz ve in
20 10 M i l k y wh i te quar tz ve in
1.80% B i o t i t e g r a n i t e and f l o u r i t e

SAMPLE NUMBER
11 5-R-1004
1005
10?3
1014
1513
1515 RT1
CU Pb Zn
15 230 3500
3.56? 4.35
1770 4531
6 545 1144
5400 36 436 .032 19.55%
M o w Mn Au Ag U PPb
L5 5 L2 L5 3.5 35.6
7 L2 33 7.0
1 L2 22.0 6.0
4 L2
4 L2
0.6 32.5 .25 oz/ ton
F Sn B i Be ROCK DESCRIPTION
---- -- -.- -.--
25 Quar tz v e i n I
195 55 L1 10 Hydro thermal ly a l t e r e d a l a s k i t e - s p h a l e r i t e Hydro thermal ly a l t e r e d a l a s k i t e w i t h hema t i t e , e p i do te Magnet i te v e i n r e p l a c i n g p o r p h y r i t i c a l a s k f t e A1 t e r e d g r a n i t e and magnet i te
A l t e r e d g r a n i t e and m a l a c h i t e Sample f rom anomaly E, v e i n X 1 approx imate ly 75% s p h a l e r i t e
20
A l l values are in ppm except where s t a t e d otherwise. Values i n % and oz / ton a r e assay r e s u l t s , which a r e more accura te than analyses.
P 0

APPEND~X r I
ROCK SAMPLE ASSAYS
41

42
. c..
.- a+

43

r
44
APPENDIX I 1 1
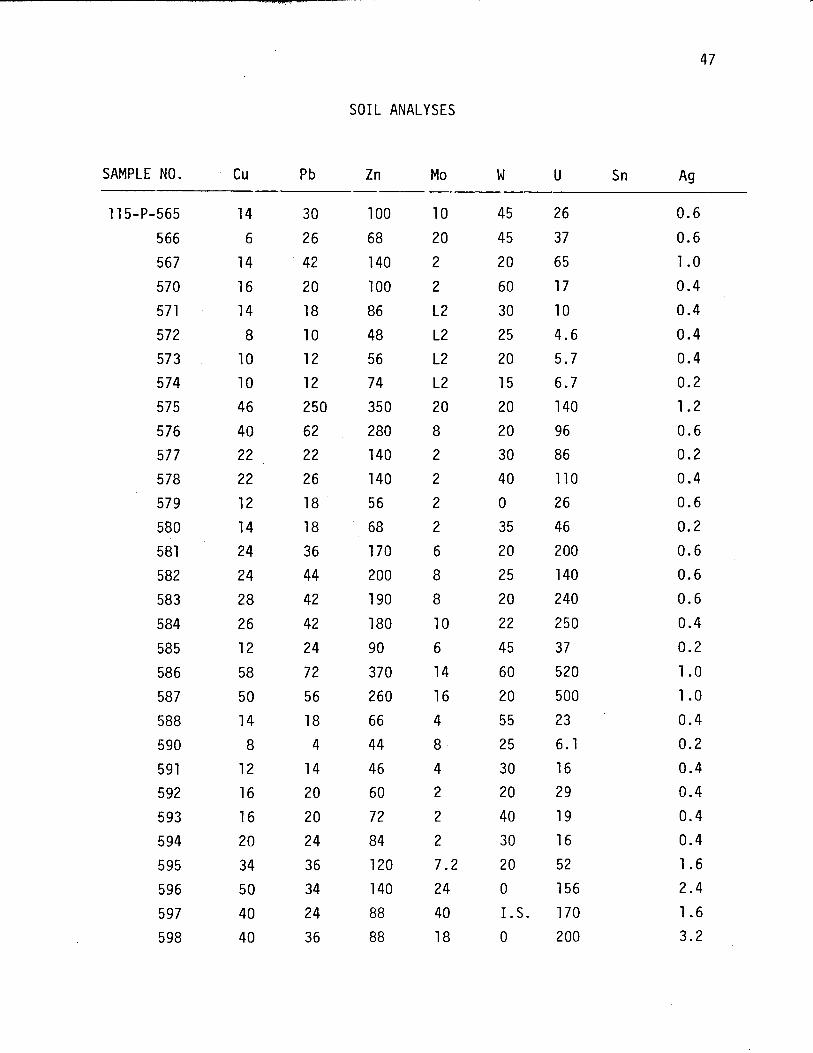
SOIL SAMPLE ANALYSES

. ,.. ,
45
SOIL ANALYSES
SAMPLE NO. cu Pb Zn Mo W U Sn Ag ---
11 5-P-501 32 88 1 4 26.0 0.6 502
503
504
5 05
506 507
5 08
509
51 0
51 1
51 2
51 3
51 4
51 5
51 6
51 7
51 8
51 9
520
52 1
522
523
524 525
526
.527
528
529
530
531
9
7
8
7
16
11
12
28
18
12
64
8
14
12
11 23 22
16
31
16
16
33
34
20
34
26 22
16
18
20
16
8
10
9 22
16
45
62
30
15
74
7
40
20
20 20
10 23
58
68
47
170 2
60 2
38 2
87 2
46 1 47 2
37 1 35 1 28 1 28 2
20 1 24 1
20 1 35 2
25 1 26 2
50 4
28 2
20 1 90 3 42 2
45 2
35 1 30 2
40 1
22 1 46 2
62 4
105 3
42 2
4
4
3
3
3
4 4 3
3
3 2
2
2
2
2
3
4
12
2
4
3
4
3
4 3
4 6
4
4
3
32.5 1.2
18.0 1.3
5.6 0.8
13.0 1.2
20.0 0.6
11 .o 0.4 6.9 0.6 7.6
10.5
8.4
8.9
8.4 6.6
28.5
10.5
10.0
50.5
6.4
21 .o 75.0
3.1 12.0
6.9
7.6
15.0 5.2
12.0
22.0
13.5
23.0
0.6
0.6
0.2
0.4
0.7
0.6
0.6
0.4
1.2
0.7
0.5
0.4 0.6
0.6
0.5
0.3
0.4
0.4
0.5

46
SOIL ANALYSES
SAMPLE NO. cu Pb Zn Mo W U Sn Ag
11 5-P-532 533 534 535 536 540 54 1 542 543 544A 544B 545 546 547 548 549 550 551 552 553 554 555 556 557 5 58 559
16 14 24 50 23 13 51 18 18 7 21 10 8
11 9 12 14 12 17 32 33 10 8 9 8
11
16 18 35 75 45 4 8 6 10 5 10 5 4 16 15 10 10 10 9 18 10 5 6 8 4 10
58 2 48 2 80 3 185 4 105 3 35 3 52 8 34 3 40 3 10 2 32 3 30 2 35 1 65 2 60 2 58 2 95 1 50 2 60 1 70 4 66 3 55 1 50 2 40 1 38 1 80 1
4 9.5 3 12.0 5 30.0 8 115.0 4 72.0 2 4.3 2 3.0 2 2.2 2 15.0 L2 1.8 2 4.5 L2 1.6 2 3.3 L2 4.9 2 3.9 L2 4.8 3 4.3 3 6.3 3 5.2 2 2.8 2 4.4 2 4.2 L2 5.2 L2 5.3 L2 5.8 3 5.0
13 13 18 13 8 15 L5 5 10 L5 10 L5 5 8 L5 8 13 8 10 10 10
0.4 0.2 0.5 0.4 0.7 0.2 0.6 0.8 0.4 0.4 0.3 0.3 0.4 0.6 0.4 0.6 0.2 0.3 0.2 0.3 0.6 0.4 0.5 0.3 0.4 0.2
560 12 12 60 1 L2 4.4 8 0.3 561 8 4 30 1 2 2.9 5 0.4 562 10 7 40 1 L2 1.5 10 0.2 563 12 10 78 1 2 7.5 13 0.2 564 16 24 58 2 2 4.7 L5 0.4
47
SOIL ANALYSES
SAMPLE NO. ' cu Pb Zn Mo W U Sn Ag
11 5-P-565 566 567 570 571 572 573 5 74 575 576 577 578 579 580 581 582 583 584 585 586 587 588 590 591 592 593 5 94 595 596 597 598
14 30 6 26 14 42 16 20 14 18 a 10 10 12 10 12 46 250 40 62 22 22 22 26 12 18 14 18 24 36 24 44 28 42 26 42 12 24 58 72 50 56 14 18 8 4 12 14 16 20 16 20 20 24 34 36 50 34 40 24 40 36
100 68 140 100 86 48 56 74 350 280 140 140 56 68 170 200 190 180 90 370 260 66 44 46 60 72 84 120 140 88 88
10 20 2 2 L2 L2 L2 L2 20 8 2 2 2 2 6 8 8 10 6
14 16 4 8 4 2 2 2 7.2 24 40 18
45 45 20 60 30 25 20 15 20 20 30 40 0 35 20 25 20 22 45 60 20 55 25 30 20 40 30 20 0 I .s 0
26 37 65 17 10 4.6 5.7 6.7 140 96 86 110 26 46 2 00 140 240 250 37 520 500 23 6.1 16 29 19 16 52 156 170 200
0.6 0.6 1.0 0.4 0.4 0.4 0.4 0.2 1.2 0.6 0.2 0.4 0.6 0.2 0.6 0.6 0.6 0.4 0.2 1 .o 1 .o 0.4 0.2 0.4 0.4 0.4 0.4 1.6 2.4 1.6 3.2
48
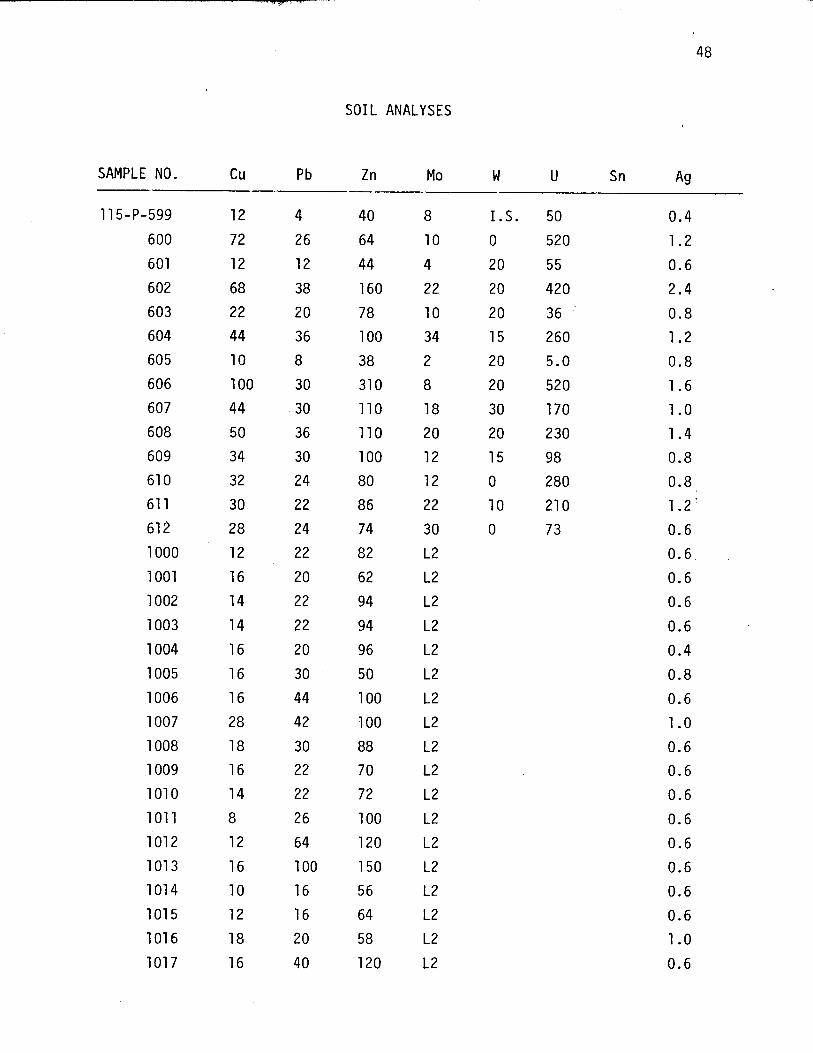
SOIL ANALYSES
cu Pb Zn Mo W U Sn Ag SAMPLE NO. --.__-
11 5-P-599
600
601
6 02
603
604
605
606
607
6 08
609
61 0
61 1
61 2
1000
1001
1002
1003
1004
1005
1006
1007
1008
1009
1010
1011
1012
1013
1014
1015
1016
1017
12
72
12
68
22
44
10
100
44
50
34
32
30
28
12
16
14
14
16
16
16
28
18
16
14
8 12
16
10
12
18
16
4
26
12
38
20
36
8
30
30
36
30
24 22
24
22
20
22
22
20
30
44
42
30 22
22
26
64
100
16
16
20
40
40
64
44
160
78
100
38
31 0 110
110
100
80
86
74
82
62
94
94
96
50
100
100
88
70
72
100
120
150
56
64
58
120
8
10
4
22
10 34
2
8
18
20 12
12
22
30
L2
L2
L2
L2
L2
L2
L2
L2
L2 L2
L2
L2
L2
L2
L2
L2
L2
L2
I.S. 50 0.4
0
20
20
20 15
20
20
30
20
15
0 10
0
520
55
420
36 260
5.0
520
170
230
98
280
21 0
73
1.2
0.6
2.4
0.8
1.2
0.8
1.6
1 .o 1.4
0.8
0.8
1 .2 '
0.6
0.6
0.6
0.6
0.6
0.4
0.8
0.6
1 .o 0.6
0.6
0.6
0.6
0.6
0.6
0.6
0.6
1 .o 0.6

SAMPLE NO. cu Pb
49
SOIL ANALYSES
Zn Mo W U Sn
115-P-1018 1019 1020 1021 1022 1023 1024 1025 1026 1027 1028 1029 1030 1031 1032 1033 1034 1035 1036 1037 1038 1039 1040 1041 1042 1043 044 045 04 6 04 7 048
18 22 10 20 10 16 14 14 14 14 10 10 12 12 12 20 16 14 18 16 16 12 12 16 14 34 28 20 16 20 16
28 24 12 12 20 74 56 20 28 20 10 26 28 28 46 22 16 20 20 12 22 14 14 24 12 20 30 28 18 24 20
78 82 76 88 86 270 180 52 120 74 52 64 78 66 130 82 68 62 76 56 72 58 58 66 56 78 88 78 64 78 68
L2 L2 L2 L2 2 L2 2 2 L2 2 2 2 2 L2 L2 L2 L2 L2 L2 L2 L2 L2 L2 2 L2 2 L2 L2 L2 L2 L2
0.8 0.6 0.4 0.4 0.4 1 .o 0.8 1 .o 0.6 0.8 0.4 0.4 0.6' 0.6 0.6 0.8 0.4 0.6 0.6 0.2 0.6 0.4 0.4 0.8 0.6 0.6 0.8 0.6 0.6 1 .o 0.8

7 - -
50
SOIL ANALYSES
SAMPLE NO. cu Pb Zn Mo W U Sn Ag --_
115-P- 049A
049B
049C
050
05 1 1052
1053
1054
1055
1056
1057
1058
1059
1060
1061
1062
1063
1064
1065
1066
1067
1068
1069
1070
1071
1072
1500
1501A
1501 B 1502
1503
12
22
8 8
8 12
8
10 10
12 22
14 18
20
16
16
16 22
10 8
10 12
16
30 8
8
40
15
24
24
14
18
30
28
88
50
12
66
72
120
30
84
160
300
110
180
42
36
48
32
28
26
100 38
28
110
150
10
5
11
10
10
56
100
64
130
94
120
130
150
230
110
380
230
1200
300
450
140
140
200
160
160
120
190
130
86
140
200
60 35
45
60
52
L2
L2
L2
L2
L2
L2
L2
L2
L2
L2
L2
L2
L2
L2
L2
L2
L2
L2
L2
L2
L2
L2
L2
L2
L2
L2
3 2
3 2
1
0.6
0.8
0.6
0.6
0.4
0.6
0.6
0.8
0.6
0.4
0.2
0.2
0.8'
0.4
0.6
0.4
0.4
0.8
0.4
0.4
0.2
0.2
0.2
0.2
0.4
0.4
3 5.0 5 0.5
L2 4.0 L5 0.5
L2 4.9 5 0.4
2 4.6 8 0.4
2 4.7 8 0.4

. .
SAMPLE NO.
.+ J;;
9 . SOIL ANALYSES
-..G
Cu % P b Zn Mo W U Sn A!3
51
11 5-P-1504
1505
. 1506
1507
1508
1509
1510
1511
1512
1513
1514B
1515B
151 6A
151 6B
1517A
1517B
15186
151 9B
15208
15218 15228
1523B
1524B
1525B
1526B
15278
1528A
1528B
1529A
1529B
14
10
11
10
11
8
10
10
11
13
16
18
30
26
8
10
10 14
20
16 16
14
36
16
44
20
62
40
10
12
11
10
9 8
5
20
10 25
14
10
18
90
34 32
20
20
18
14
34
26 18
18
62
20 82
26
76
50
12
14
55
48 50
38
50
92
60
80
52
50
84
280
1100
950
68
76
96
84
110
90 62
64
360
100 340
82 280
190
52
52
1
1 1
1
1 2
2
2
2
2
2
14
8
4
L2
8
2
2
2
6 2
2
6
L2
10 12
20
8
2
2
L2 3.0 L5
L2 3.3 10
L2 2.8 15
L2 4.3 8
L2 2.3 8
L2 4.2 13
2 2.6 L5
2 3.8 10
L2 2.6 8
2 2.6 5
10 13
10 51
0 490
0 270
1.5 22
1.5 7.0
20 1'9
10 13
5 27
5 20
15 19 0 15
20 130
20 14
25 110
10 72
15 41 0
20 290
1.5 18
25 10
0.2
0.3
0.3
0.3
0.4
0.4
0.3
0.4
0.3
0.4
0.4
0.8
1 .o' 1.2
1.2
0.4
0.2
0.2
0.6
0.2
0.2
0.2
1 .o 0.2
0.8
0.6
1.4
0.8
0.4
0.4 1530B 12 16 56 L2 20 7 0.4

. . 52 . ..
. , * SOIL ANALYSES
* .
SAMPLE NO. cu Pb Zn Mo W U Sn Ag
11 5-P-1531 B 20 26 4 0 58 0.6 1532A 68 30 120 32 0 650 1.8 1532B 58 72 260 52 5 170 2.0 15338 52 100 290 74 20 150 2.0 1534B 160 68 240 64 0 830 2.2 1535B 110 120 290 110 20 390 1.6 1536B 120 120 370 68 20 230 3.2 1537B 1538B 1539B 1540B 1541 B 1542B 1543B 1544B 1545B 15468 1547B 1548B
1549B 1550B
22 20 12 16 46 42 24 34 100 110 120 110 54 52 42 46 44 42 52 50 54 55 84 52
28 30 42 20
80 2 54 2 160 40 200 22 340 72 380 78 230 40 170 22 160 18 150 40 230 42 150 30
74 20 150 24
5 15 30 6 15 140 15 31 30 2 00 30 180 15 110 15 73 10 96 10 100 20 87 15 640
20 73 10 73
(Clay)
0.4 0.2 1.6 0.8 2.4 2.0' 1.2 1.4 1.2 1.2 2.4 1.4
0.8 1.2
1551 B 18 16 52 6 15 5.6 0.6 1552B 62 46 140 22 15 630 1.4 1553B 120 120 390 86 30 220 3.2

53
APPENDIX I V
STREAM SEDIMENT SAMPLE ANALYSES

54
APPENDIX I V
STREAM SEDIMENT ANALYSES
SAMPLE NO. cu Zn Pb Ag Mo W U
11 5-S-500 14 160 36 1 .o 31 0 0 340
1000 12 86 22 0.6 L2
1001 22 100 24 0.6 L2
1002 10 88 18 0.4 L2
1003
1004
1005
1006 1007
8 72 22 0.6 L2
8 94 34 0.6 L2
6 90 24 0.8 L2
4 92 24 0.8 L2
6 120 32 0.8 L2
1008 10 130 110 0.2 L2
1500 8 50 12 0.4 6 95 42 1501 8 110 24 0.8 14 0 340
1502 10 92 18 1 .o 36 0 130

55
APPENDIX V
PANNED STREAM SEDIMENT ANALYSES

56
APPENDIX V
ANALYSES OF HEAVY MINERAL CONCENTRATES FROM GALENA CREEK,
ENG 2
SAMPLE NO. cu Zn Pb Ag Mo Panned
.-.--
H- 1000 6 90 28 L0.2 L2 H-1 001 4 64 20 L0.2 L2 H-1002 4 66 20 L0.2 L2 I
H-1003 4 82 26 L0.2 L2 H-1004 6 42 14 0.2 L2 H-1005 6 58 16 LO. 2 L2 H- 1 006 8 70 28 0.2 L2 H-1007 6 64 14 L0.2 L2 H-1008 6 130 14 0.2 L2 H-1009 8 64 16 L0.2 L2
-- ---

APPENDIX V I
DESCRIPTION OF THIN AND POLISHED SECTIONS
57
ROCK FROM MINERALIZED ZONE

1153 1035 Sphalerite Rich Vein
c n l o r i t e ? r a d i a t i n g p a t c h e s f i n e g ra ined disserni-
Rated i n q u a r t z q u a r t z ( c l e a r b o r d e r s
s p h a l e r i t e (honey) m g n e ti t e herr.ati te( s p e c u l a r i t e ) p y r i t e Ti-oxide
of g r a i n s )
58
30-35%
30-35 ( i n c l u d e s q u a r t z , p robably 60/40 ch/qz)
5-10 15-20
7-10 3- 5
minor minor
q u a r t z - ca rbona te ve i n l e t t ra ce
The o r i g i n a l t e x t u r e of t h e h o s t rock ( i f a n y ) i s comple te ly ' d e s t r o y e d . The p r e s e n t assemblage w a s formed by replacement of a lbw- d e n s i t y rock or by p r e c i p i t a t i o n i n t o open cav i t i e s ; t h e former a p p e a r s more probable because o f t h e l a c k of many e u h e d r a l c r y s t a l s .
C h l o r i t e ? occur s i n two modes: 1) as p a t c h e s of r a d i a t i n g t o f i b r o u s grains up t o 0.05 mm l o n g ,
i n t e r g r o w n w i t h very f i n e g ra ined equan t g r a i n s of t h e same m i n e r a l . Pleochroism i s ve ry s t r o n g from p a l e yel low g r e e n t o deep f o r e s t green. B i r e f r i n g e n c e i s masked by t h e mine ra l c o l o r , b u t a p p e a r s t o be h i g h e r than normal f o r - . c h l o r i t e . The m i n e r a l may be a h igh- i ron c h l o r i t e o r p o s s i b l y s t i l pnomelane (The book s a y s s t i lpnomelane can be g reen , b u t a l l t h a t I have, s e e n h a s been brown). Patches a r e i n t e r s t i t i a l i n part t o o t h e r i n t e r - growths of q u a r t z and c h l o r i t e ? , and commonly c o n t a i n s p h a l e - r i t e and magnet i te .
grains (0.2-0.7 mm a v e r a g e ) . The c h l o r i t e does n o t occur i n t h e o u t e r zones of t h e q u a r t z grains , b u t i s s t r o n g l y concen t r a - t e d i n t h e c e n t e r s , g i v i n g a t h i n r i m of c h l o r i t e - f r e e q u a r t z , g r a d i n g r a p i d l y i n t o what appea r s t o be massive c h l o r i t e , b u t wh ich probably s t i l l c o n t a i n s some q u a r t z masked by t h e d a r k g r e e n c h l o r i t e . Q u a r t z grains have i r r e g u l a r rounded b o r d e r s , w i t h o v e r a l l s ca l loped c o n t a c t s against t h e pa t ches of f i b r o u s c h l o r i t e .
Q u a r t z grains f r e e o f c h l o r i t e h o s t t h e h e m a t i t e ; q u a r t z a p p e a r s t o form r i m s zround t h e hemat i te up t o 0 .2 mm t h i c k . Beyond t h i s d i s - tance c h l o r i t e becomes abundant i n t h e q u a r t z .
S p h a l e r i t e , w i th b r i g h t orange c o l o r i n t r a n s m i t t e d l i g h t forms i r r e g u l a r equan t g r a i n s ave rag ing 0 . 2 t o 1 mm i n s i z e . Good c leavage i s developed i n some c o a r s e r g r a i n s . Gra ins a r e a s s o c i a t e d i n t i m a t e l y w i t h m a g n e t i t e , and appear more common i n r z d i a t i n g t o f i b r ' o u s c h l o r i t e t h a n i n q u a r t z - c h l o r i t e . T h i s p re fe rence i s n o t s t r o n g .
N a g n e t i t e forms subhedra l t o euhedra l grair ,s ave rag ing 0 . 2 mm i n s i z e .
P l a t e y hemat'ite ( s p e c u l a r ? ) forms a g g r e g a t e s up t o 0.5 mm t h i c k , w p la t e s up t o 1 mm a c r o s s , Some a g g r e g a t e s a r e s l i g h t l y r a d i a t i n g .
P y r i t e f o r m s a few g r a i n s 0.01 mm a c r o s s i n s p h a l e r i t e . Ti-oxide f o r m s a few c l u s t e r s of l a t h s up t o 0 . 2 mm a c r o s s . The rock i s c u t by a narrow ( 0 . 0 2 m m ) qua r t z -ca rbona te s t r i n g e r .
2 ) as f i n e g ra ined (0.02 m m ) equant g r a i n s i n c o a r s e r q u a r t z

59
CERTIFICATE
I, John Biczok, of Kenora, Province
c e r t i f y t h a t :
1.
2.
3 .
4.
I am a, geologist residing
of Ontario, do hereby
a t 612 - 4th Avenue North,
Kenora, Province of Ontario.
I am a graduate of Lakehead University, Ontario
w i t h a H. B.Sc. (1976) i n geology and am presently
completing an M.Sc. a t the University of Manitoba, 7
Winnipeg.
I have been practising my profession since 1973 and
am a t present Exploration Geologist with Noranda
Mines Limited i n Edmonton.
I was party chief fo r the crew t h a t conducted the
work in t h i s report and the report is correct t o
the best of my knowledge and a b i l i t y .
Dated: &$. 4, 1974 1 2 . d
ok, H. g.Sc.

CERTIFICATE
I, William Mercer, o f the City of Edmonton, Province of
A1 berta , do hereby certify that:
1.
2.
3.
4.
5.
I am a geologist residing at 6814 - 110 Street, Edmonton.
I am a graduate of Edinburgh University, Scotland,
with a B.Sc. Hons (1968) in geology and McMaster
University, Ontario, with a Ph.D. (1975) in geology.
I have been practicing my profession since 1974 and
am at present District Geologist for Noranda Mines
Limited in Edmonton.
1 am a fellow of the Geological Association o f
Canada and a member o f the Society o f Economic
Geologists and the Canadian Institute of Mining
and Metallurgy.
I supervised the work that i s described in this
report.

61
STATEMENT OF COSTS

3. Biczok P. Wagner C. Stewart P. Lhotka June 5-7, 1979 June 22 to July 15, 1979 July 28-30, 1979
62
WORK PERFORMED IN THE
EXPLORATION OF OUR WEIR MOUNTAIN PROJECT
JUNE/JULY 1979
$1,440.00/month 1 ,080.OO/mon t h 885.00/month
1 ,OlO.OO/month Mobilization Grid location, electromagnetic survey, geochemical survey, and geological survey. Report writing
All above salaries are subject to bush bonus and vacation pay.
STATEMENT OF COSTS
Gri d Location 2 man days 11.5 km ($25.45/km)
--
Magnetometer 2 man days 11.5 km ($99.88/km)
cost $ 292.70
cost 1,148.61
Geology Prospecting, Radiometrics, Radon, Soil Sampling 84 man days cost 15,731.60
Geochemical (Soil Sampling, Stream Sediment Sampling) 8 man days 242 soil samples ($18.42/sample) Cost 4,456.81
General Supervision costs
Report- Writing
999.45
costs 494.34
September 18, ,1979 District Geologist ,.., .,