Embed Size (px)
Citation preview
I-4 SAMR Update Technical Memorandum #1: D Factor Development for East-North Section FDOT District 5
July 5 2012
I-4 SAMR Update Technical Memorandum #1: D Factor Development for East-North Section
Atkins I-4 SAMR Update: Tech Memorandum #1: D Factor Development for East-North Section | Version 1.0 | July 5 2012
Table of contents
Chapter Pages 1. Introduction 3
2. Data Collection 3 2.1. Traffic Count Station Data 3 2.2. Functional Classification and Lane Data 4 2.3. Spreadsheets from FDOT Central Office Transportation Statistics 4 2.4. Florida Turnpike Enterprise Regional Model Data sets 4
3. Data Analysis 4 3.1. Count Station Data Analysis 4 3.2. FTE Regional Model Data set Analysis 15 3.3. Comparison to FDOT Recommended D-Factors 15
4. Recommendations 17
Appendices 18
Appendix A. FDOT Central Office Transportation Statistics Data 19 A.1. Seminole County Count Station Data 19 A.2. Volusia County Count Station Data 19
Tables Table 1. Traffic Count Stations by County 3 Table 2. Seminole County Non I-4 Count Stations 5 Table 3. Volusia County Non I-4 Count Stations 8 Table 4. I-4 Count Stations 10 Table 5. Summary of Volusia County Data from the FTE Regional Model 15 Table 6. Arterial D-Factor Averages for Non I-4 Facilities 16 Table 7. D-Factor Averages for I-4 16 Table 8. Recommended D-Factors 17
Figures Figure 1. Figure 2.9 Recommended D-Factors for Traffic Forecasting 15
I-4 SAMR Update Technical Memorandum #1: D Factor Development for East-North Section
Atkins I-4 SAMR Update: Tech Memorandum #1: D Factor Development for East-North Section | Version 1.0 | July 5 2012 3
1. Introduction This technical memorandum will discuss the development of the “D” factors for the I-4 SAMR Update for the East-North Section of the project area from SR434 in Seminole County to Orange Camp Road in Volusia County. The Florida Department of Transportation’s (FDOT) 2012 Project Traffic Forecasting Handbook (PTFH) Sections 2.6.3.3 – 2.6.3.5 were used as the basis for the methodology discussed below.
2. Data Collection Per the FDOT 2012 PTFH, data dating back as far back as 20 years when possible, was gathered for count stations in Seminole and Volusia counties for Intrastate 4 (I-4) and cross streets. Data sources that were used included:
FDOT 2011 Florida Transportation Information (FTI) DVD, The GIS layers for Functional Classification and Lanes from the FDOT website
http://www.dot.state.fl.us/planning/statistics/gis/roaddata.shtm, and Spreadsheets obtained from the FDOT Central Office Transportation Statistics Office with 20 years
worth of AADT and D Factor data. Florida Turnpike Enterprise Regional Model Data sets for 2010 and 2040.
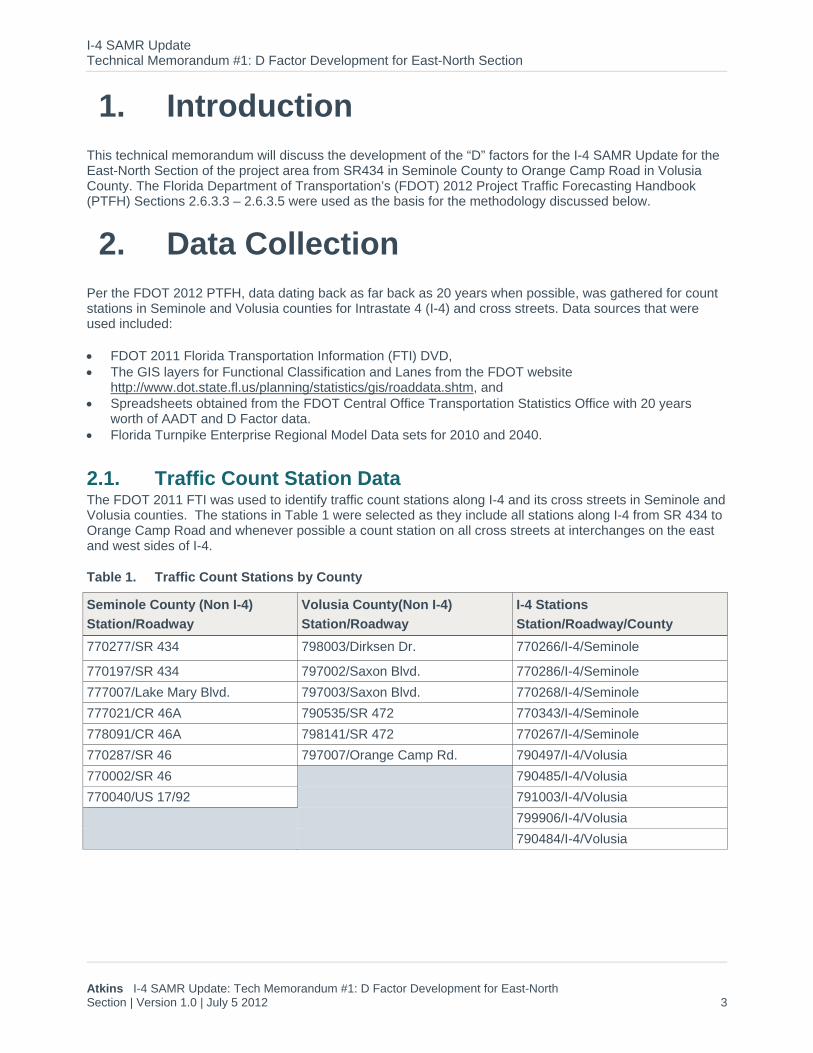
2.1. Traffic Count Station Data The FDOT 2011 FTI was used to identify traffic count stations along I-4 and its cross streets in Seminole and Volusia counties. The stations in Table 1 were selected as they include all stations along I-4 from SR 434 to Orange Camp Road and whenever possible a count station on all cross streets at interchanges on the east and west sides of I-4.
Table 1. Traffic Count Stations by County
Seminole County (Non I-4)
Station/Roadway
Volusia County(Non I-4)
Station/Roadway
I-4 Stations
Station/Roadway/County
770277/SR 434 798003/Dirksen Dr. 770266/I-4/Seminole
770197/SR 434 797002/Saxon Blvd. 770286/I-4/Seminole
777007/Lake Mary Blvd. 797003/Saxon Blvd. 770268/I-4/Seminole
777021/CR 46A 790535/SR 472 770343/I-4/Seminole
778091/CR 46A 798141/SR 472 770267/I-4/Seminole
770287/SR 46 797007/Orange Camp Rd. 790497/I-4/Volusia
770002/SR 46 790485/I-4/Volusia
770040/US 17/92 791003/I-4/Volusia
799906/I-4/Volusia
790484/I-4/Volusia
I-4 SAMR Update Technical Memorandum #1: D Factor Development for East-North Section
Atkins I-4 SAMR Update: Tech Memorandum #1: D Factor Development for East-North Section | Version 1.0 | July 5 2012 4
2.2. Functional Classification and Lane Data The GIS layers for Functional Classification and Lane data were obtained from the FDOT website as shown in section 2.0. The layer for the PTMS and TTMS sites was also loaded in order to ensure accuracy when looking up the number of lanes and functional classifications. Appendix A 1 shows the tables for all of the websites showing the Station Number, Location, Functional Classification, Number of Lanes, Year, AADT and D Factor for up to the past 20 years. The functional class and number of lanes data was only shown for the current condition.
2.3. Spreadsheets from FDOT Central Office Transportation Statistics
The spreadsheets that were obtained from FDOT Central Office Transportation Statistics contain up to 20 years worth of data for all count stations in Seminole and Volusia counties. These were used to look up the AADT and D Factors by year for the count stations from Table 1. The spreadsheet files are too large to be printed as appendices so they are sent electronically with this document.
2.4. Florida Turnpike Enterprise Regional Model Data sets Traffic Analysis Zone (TAZ) data from the Florida Turnpike Enterprise (FTE) Regional Model for 2010 and 2040 were obtained for Households and Employment. The FTE model data set was brought into ArcGIS along with a shapefile of the Volusia County Boundary. The files were intersected and the Volusia County data was extracted from the FTE data set.
3. Data Analysis There were two main parts to the data analysis, looking at the count station data from FDOT over the 20 year period by count station and looking at the FTE data for Volusia County.
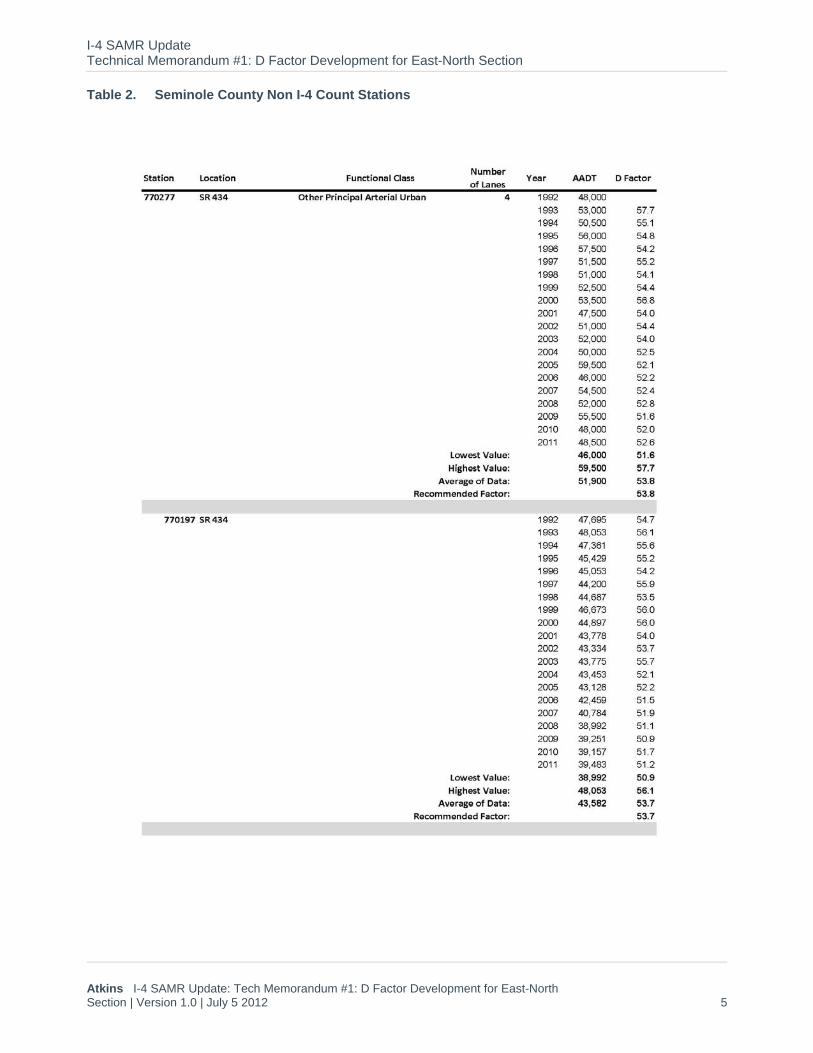
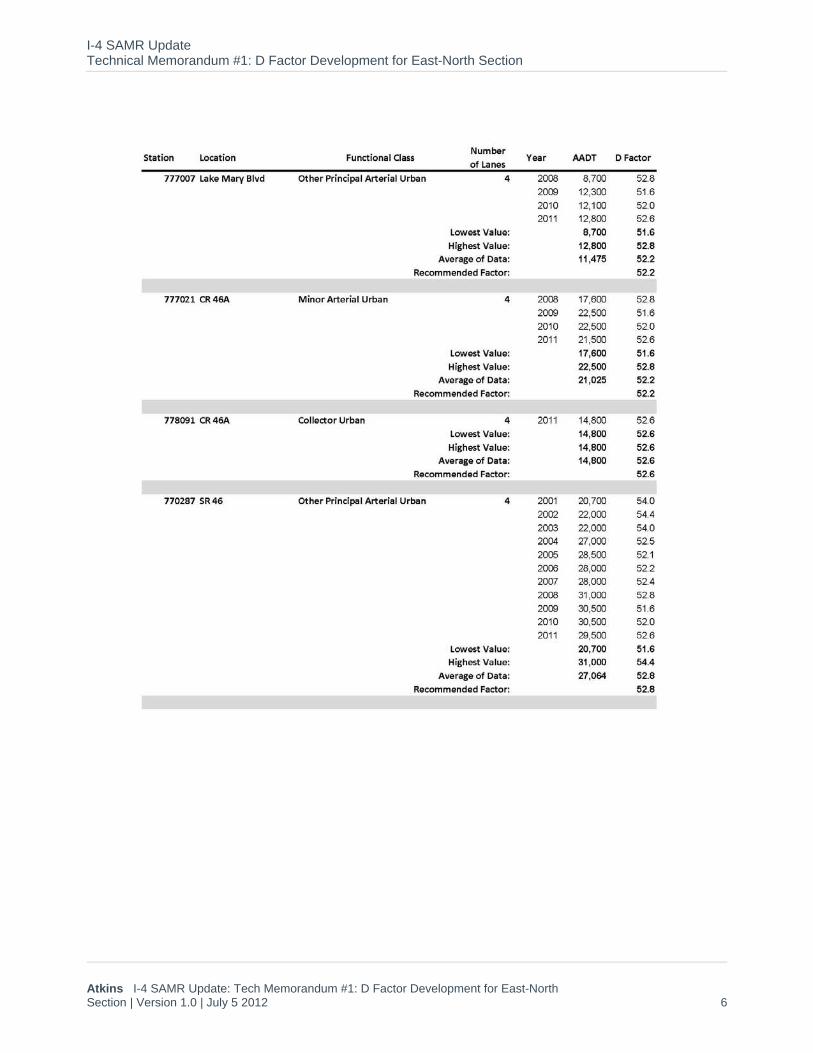
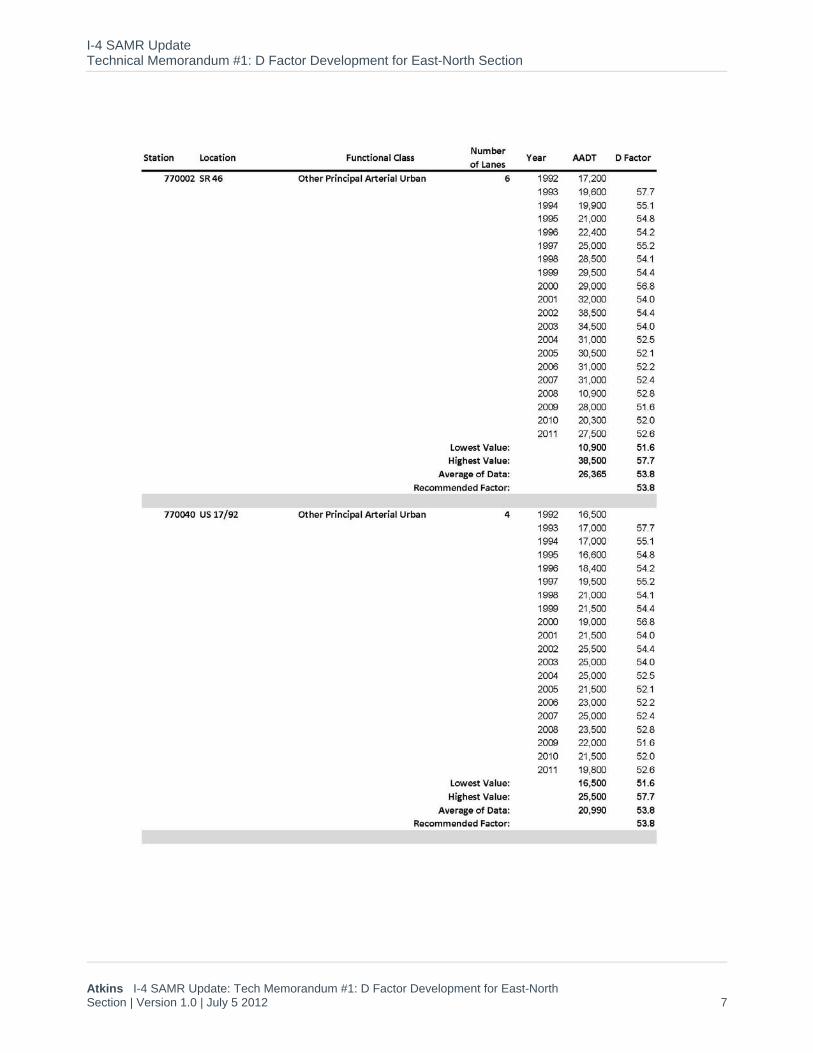
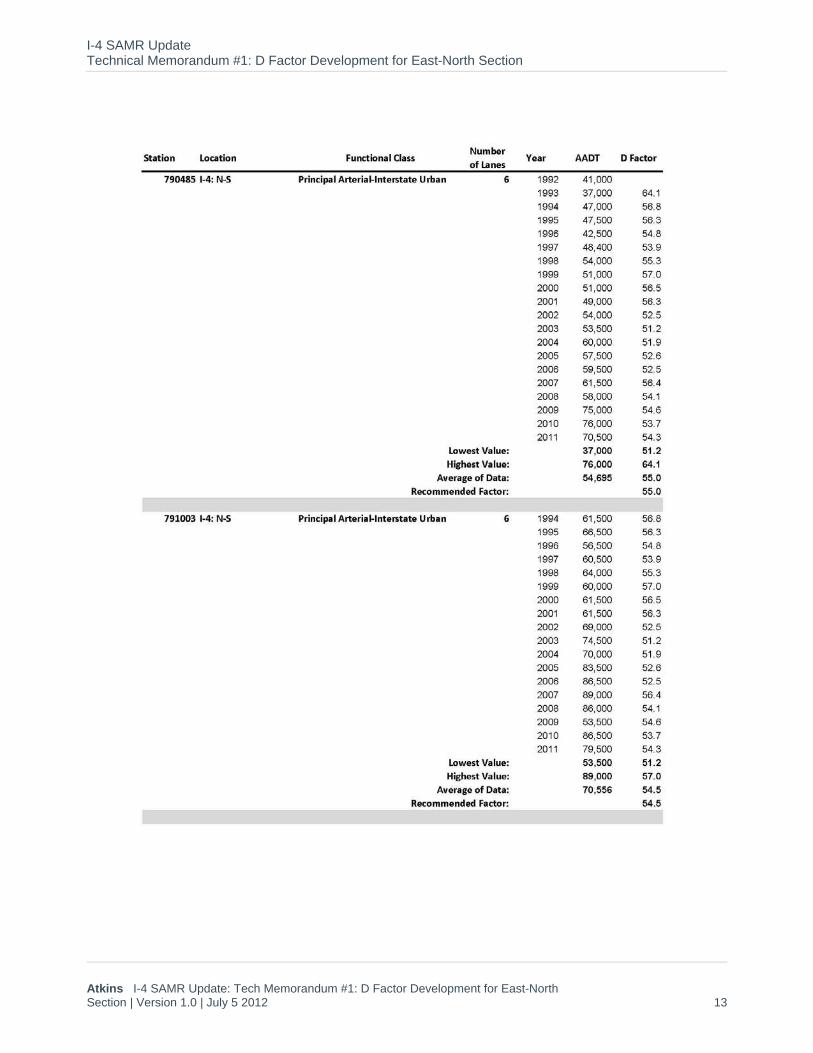
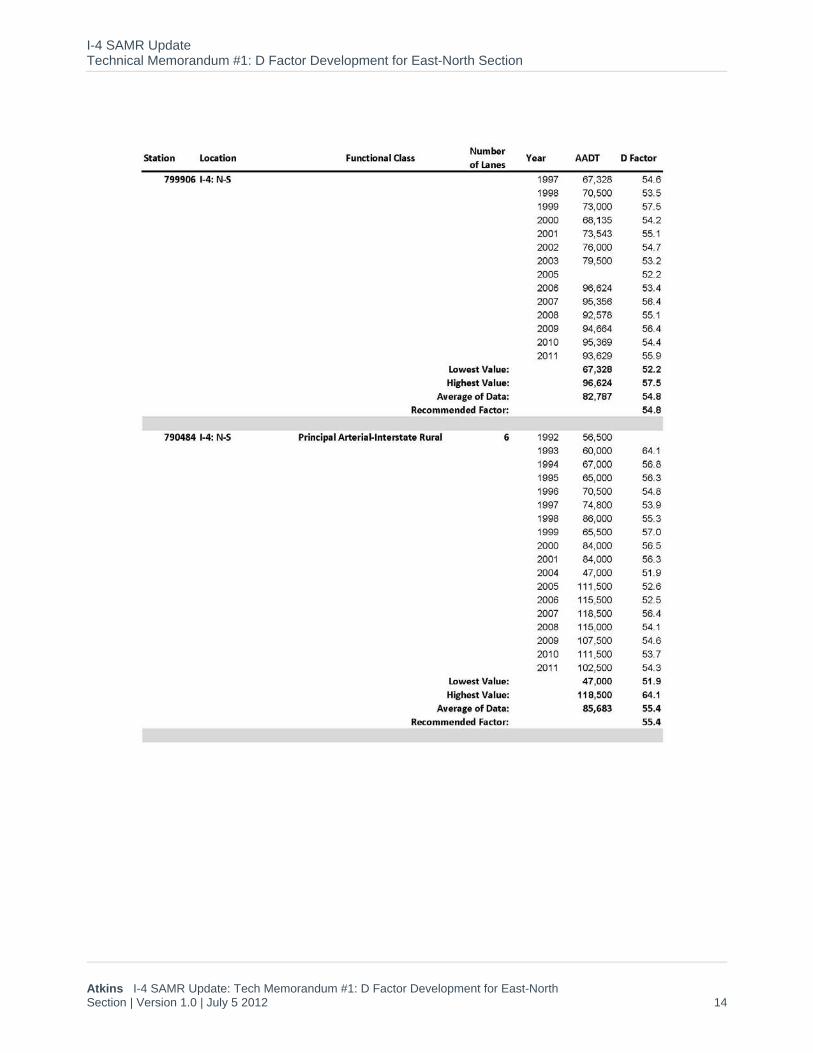
3.1. Count Station Data Analysis Per the FDOT 2012 FTI the data collected in section 2 above was combined by count station into tables containing the Station Number, Location, Functional Classification, Number of Lanes, Year, AADT and D Factor for up to the past 20 years. These full tables are shown in Appendix A 1. Also included in these tables are the lowest values, the highest values, and the average values for the AADTs and D factors by station, the recommended D Factor by station.
The full tables of these values are shown in Tables 2 – 4.
I-4 SAMR Update Technical Memorandum #1: D Factor Development for East-North Section
Atkins I-4 SAMR Update: Tech Memorandum #1: D Factor Development for East-North Section | Version 1.0 | July 5 2012 5
Table 2. Seminole County Non I-4 Count Stations
I-4 SAMR Update Technical Memorandum #1: D Factor Development for East-North Section
Atkins I-4 SAMR Update: Tech Memorandum #1: D Factor Development for East-North Section | Version 1.0 | July 5 2012 6
I-4 SAMR Update Technical Memorandum #1: D Factor Development for East-North Section
Atkins I-4 SAMR Update: Tech Memorandum #1: D Factor Development for East-North Section | Version 1.0 | July 5 2012 7
I-4 SAMR Update Technical Memorandum #1: D Factor Development for East-North Section
Atkins I-4 SAMR Update: Tech Memorandum #1: D Factor Development for East-North Section | Version 1.0 | July 5 2012 8
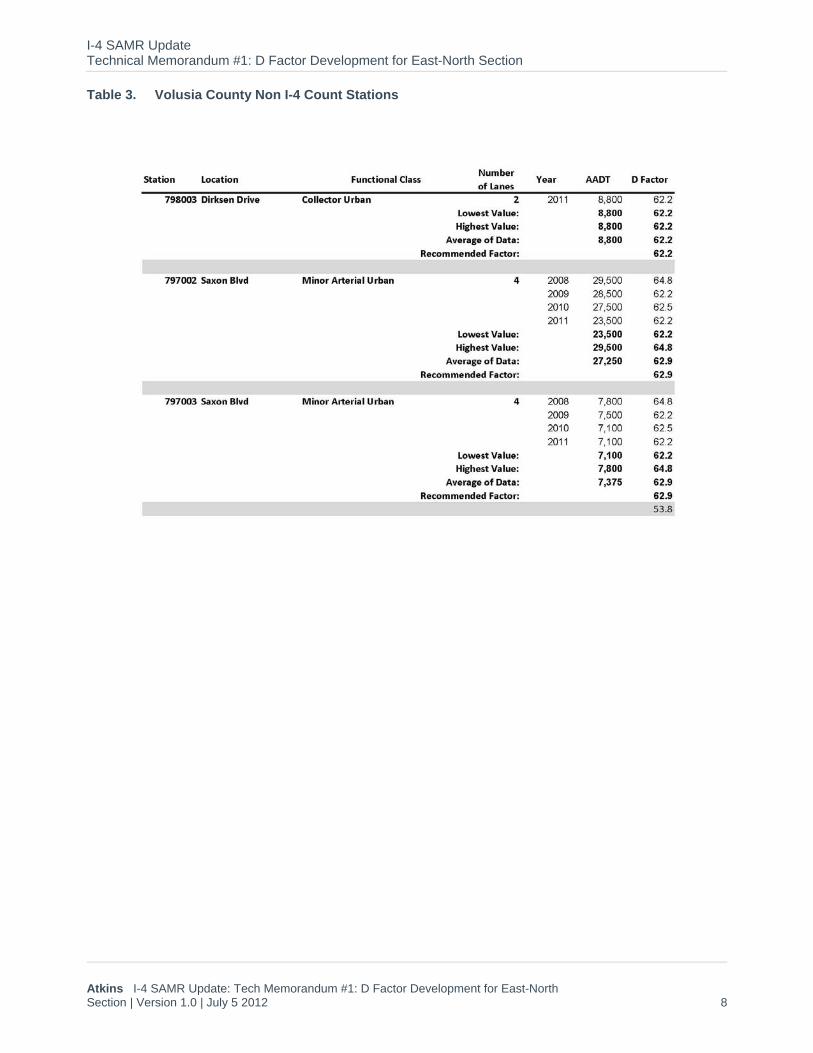
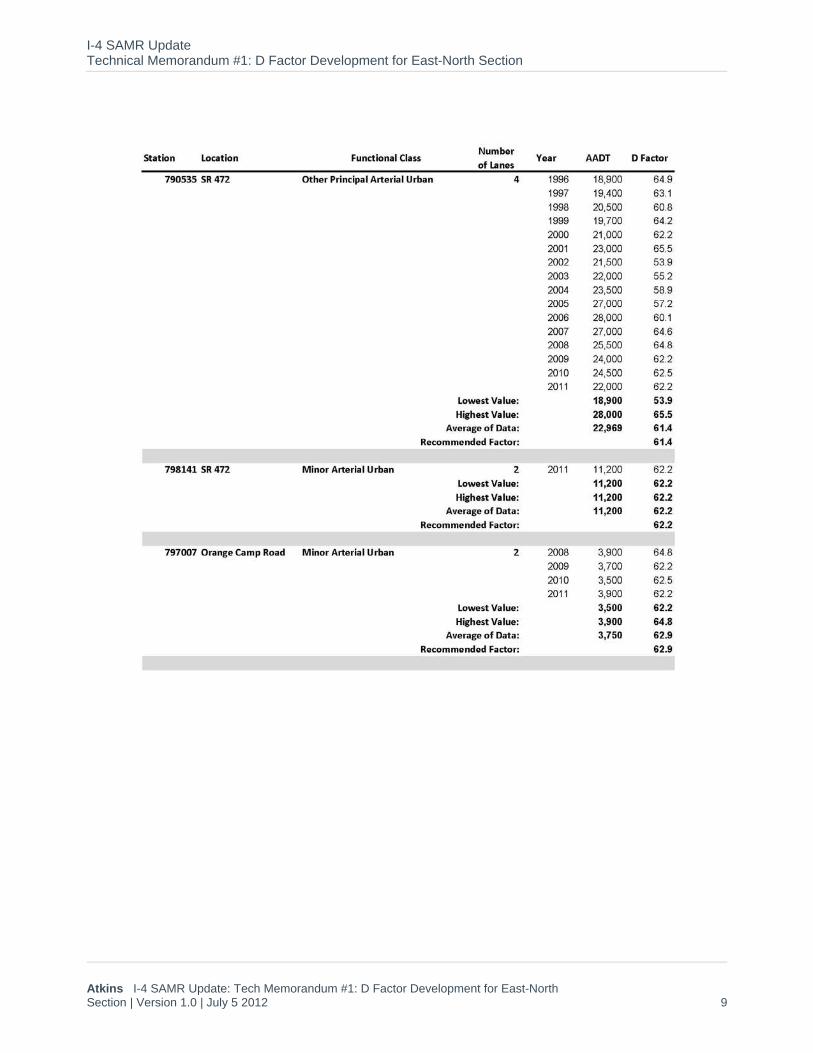
Table 3. Volusia County Non I-4 Count Stations
I-4 SAMR Update Technical Memorandum #1: D Factor Development for East-North Section
Atkins I-4 SAMR Update: Tech Memorandum #1: D Factor Development for East-North Section | Version 1.0 | July 5 2012 9
I-4 SAMR Update Technical Memorandum #1: D Factor Development for East-North Section
Atkins I-4 SAMR Update: Tech Memorandum #1: D Factor Development for East-North Section | Version 1.0 | July 5 2012 10
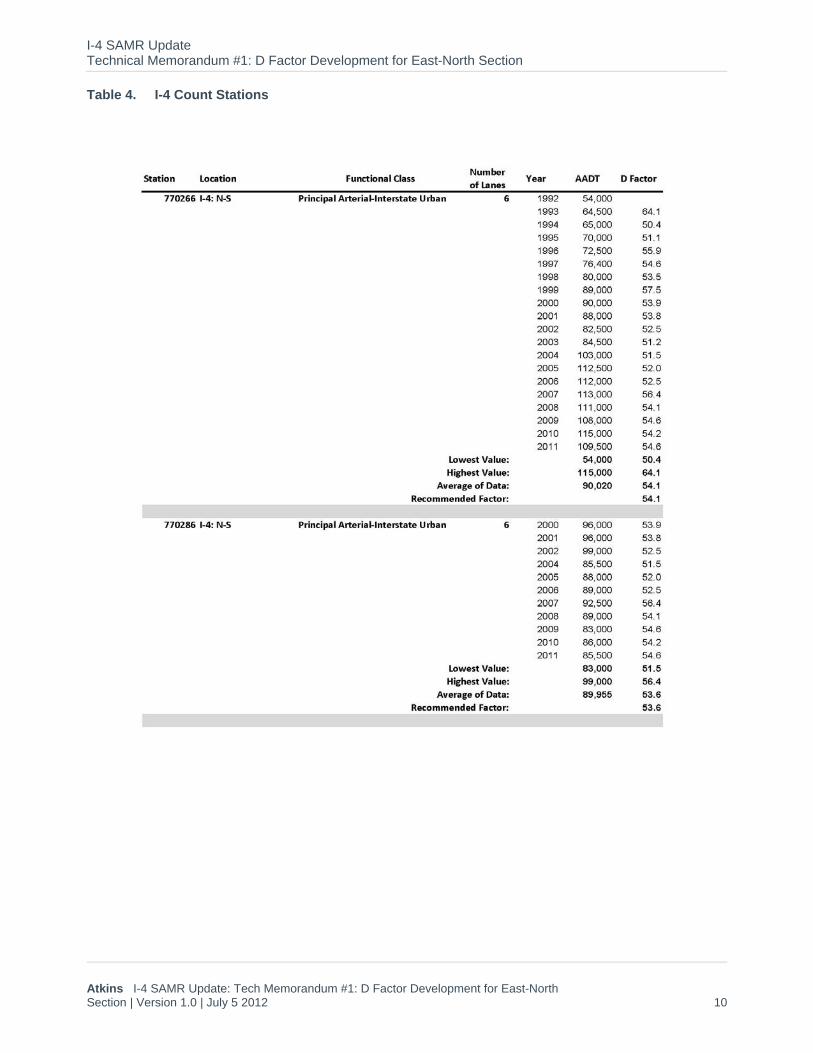
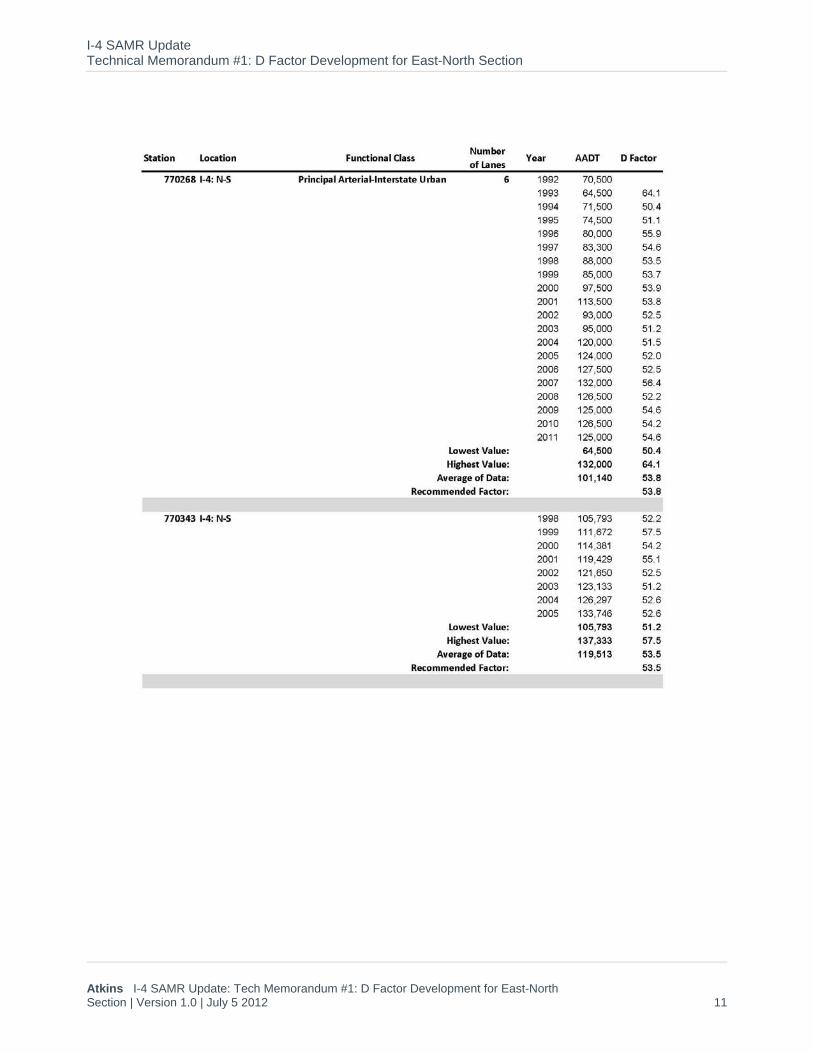
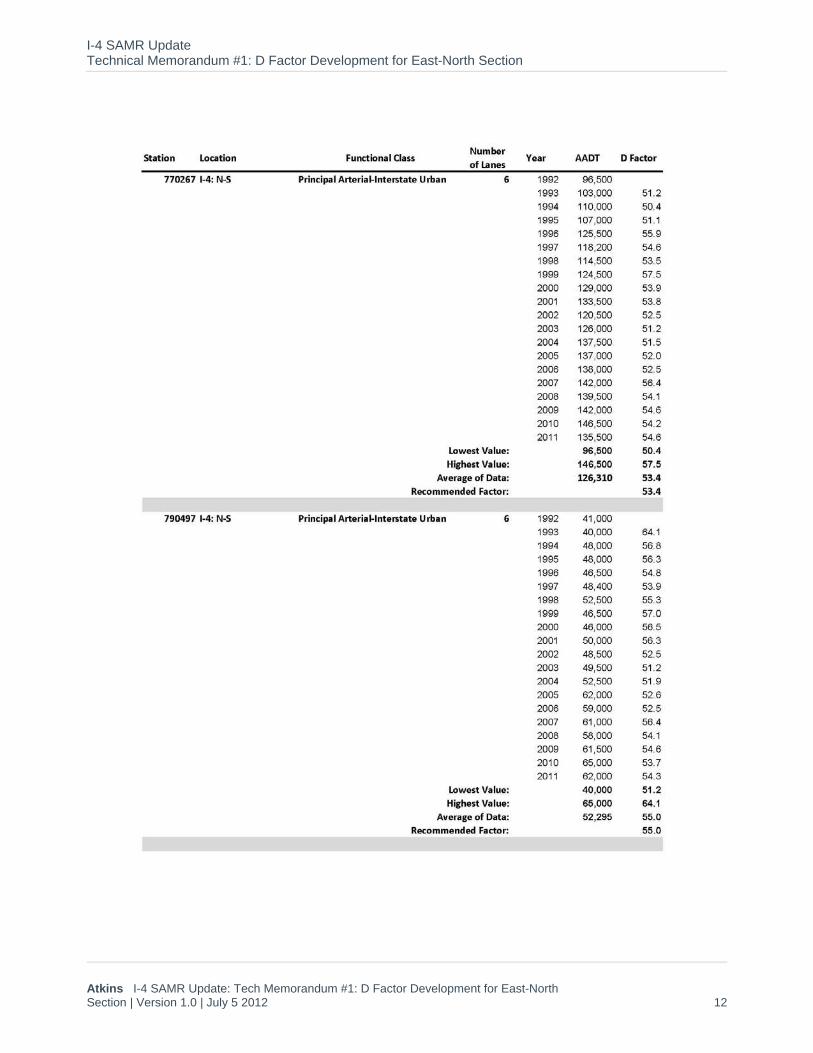
Table 4. I-4 Count Stations
I-4 SAMR Update Technical Memorandum #1: D Factor Development for East-North Section
Atkins I-4 SAMR Update: Tech Memorandum #1: D Factor Development for East-North Section | Version 1.0 | July 5 2012 11
I-4 SAMR Update Technical Memorandum #1: D Factor Development for East-North Section
Atkins I-4 SAMR Update: Tech Memorandum #1: D Factor Development for East-North Section | Version 1.0 | July 5 2012 12
I-4 SAMR Update Technical Memorandum #1: D Factor Development for East-North Section
Atkins I-4 SAMR Update: Tech Memorandum #1: D Factor Development for East-North Section | Version 1.0 | July 5 2012 13
I-4 SAMR Update Technical Memorandum #1: D Factor Development for East-North Section
Atkins I-4 SAMR Update: Tech Memorandum #1: D Factor Development for East-North Section | Version 1.0 | July 5 2012 14
I-4 SAMR Update Technical Memorandum #1: D Factor Development for East-North Section
Atkins I-4 SAMR Update: Tech Memorandum #1: D Factor Development for East-North Section | Version 1.0 | July 5 2012 15
After a review of each of the traffic count stations individually, it was decided that each stations’ D factor would be best represented by the average of the available data for that station which is shown in the tables above.
The number of years of data, AADT and change in AADT over time were all considerations in the decision to use the average of all data points.
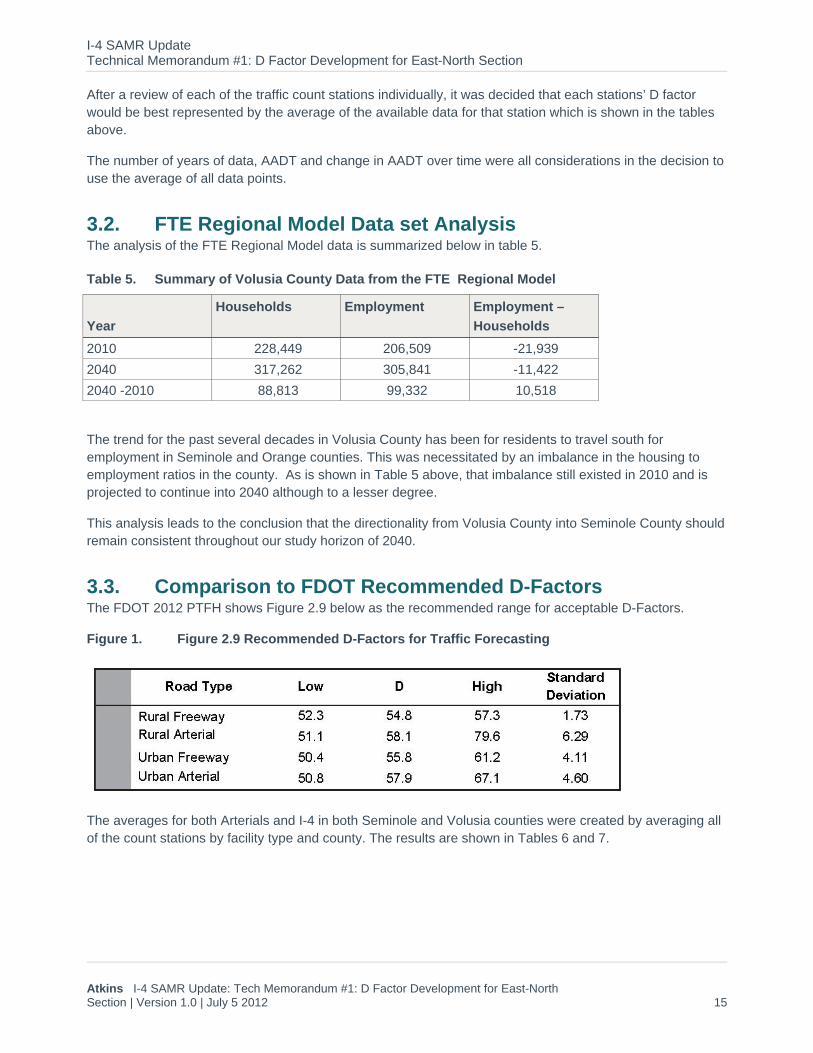
3.2. FTE Regional Model Data set Analysis The analysis of the FTE Regional Model data is summarized below in table 5.
Table 5. Summary of Volusia County Data from the FTE Regional Model
Year
Households Employment Employment –
Households
2010 228,449 206,509 -21,939
2040 317,262 305,841 -11,422
2040 -2010 88,813 99,332 10,518
The trend for the past several decades in Volusia County has been for residents to travel south for employment in Seminole and Orange counties. This was necessitated by an imbalance in the housing to employment ratios in the county. As is shown in Table 5 above, that imbalance still existed in 2010 and is projected to continue into 2040 although to a lesser degree.
This analysis leads to the conclusion that the directionality from Volusia County into Seminole County should remain consistent throughout our study horizon of 2040.
3.3. Comparison to FDOT Recommended D-Factors The FDOT 2012 PTFH shows Figure 2.9 below as the recommended range for acceptable D-Factors.
Figure 1. Figure 2.9 Recommended D-Factors for Traffic Forecasting
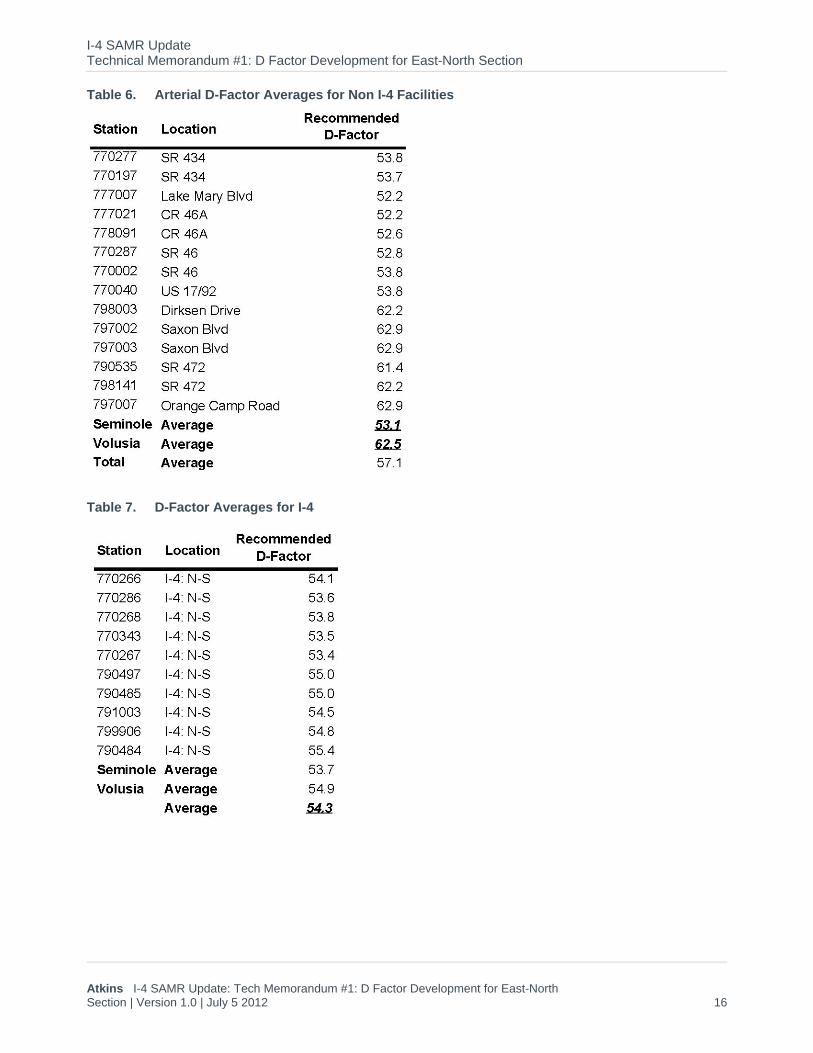
The averages for both Arterials and I-4 in both Seminole and Volusia counties were created by averaging all of the count stations by facility type and county. The results are shown in Tables 6 and 7.
I-4 SAMR Update Technical Memorandum #1: D Factor Development for East-North Section
Atkins I-4 SAMR Update: Tech Memorandum #1: D Factor Development for East-North Section | Version 1.0 | July 5 2012 16
Table 6. Arterial D-Factor Averages for Non I-4 Facilities
Table 7. D-Factor Averages for I-4
I-4 SAMR Update Technical Memorandum #1: D Factor Development for East-North Section
Atkins I-4 SAMR Update: Tech Memorandum #1: D Factor Development for East-North Section | Version 1.0 | July 5 2012 17
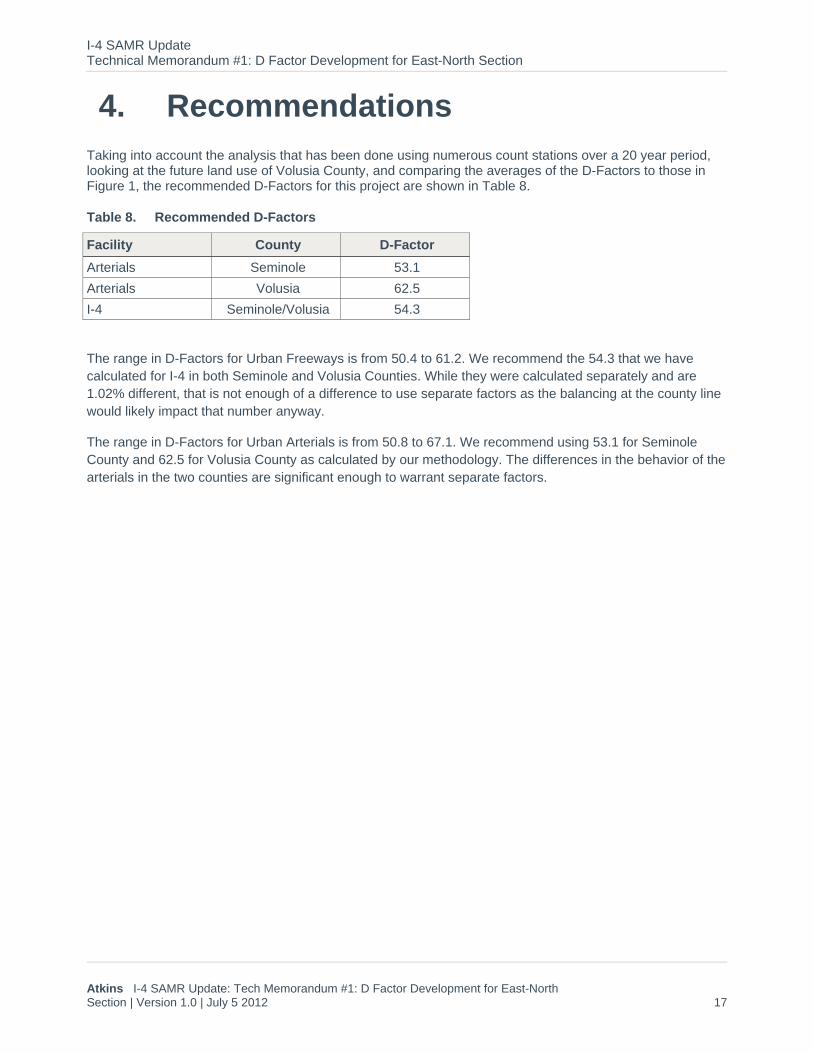
4. Recommendations Taking into account the analysis that has been done using numerous count stations over a 20 year period, looking at the future land use of Volusia County, and comparing the averages of the D-Factors to those in Figure 1, the recommended D-Factors for this project are shown in Table 8.
Table 8. Recommended D-Factors
Facility County D-Factor
Arterials Seminole 53.1
Arterials Volusia 62.5
I-4 Seminole/Volusia 54.3
The range in D-Factors for Urban Freeways is from 50.4 to 61.2. We recommend the 54.3 that we have calculated for I-4 in both Seminole and Volusia Counties. While they were calculated separately and are 1.02% different, that is not enough of a difference to use separate factors as the balancing at the county line would likely impact that number anyway.
The range in D-Factors for Urban Arterials is from 50.8 to 67.1. We recommend using 53.1 for Seminole County and 62.5 for Volusia County as calculated by our methodology. The differences in the behavior of the arterials in the two counties are significant enough to warrant separate factors.

Appendices
I-4 SAMR Update Technical Memorandum #1: D Factor Development for East-North Section
Atkins I-4 SAMR Update: Tech Memorandum #1: D Factor Development for East-North Section | Version 1.0 | July 5 2012 19
Appendix A. FDOT Central Office Transportation Statistics Data
A.1. Seminole County Count Station Data Sent Electronically due to size
A.2. Volusia County Count Station Data Sent Electronically due to size

© Atkins Ltd except where stated otherwise. The Atkins logo, ‘Carbon Critical Design’ and the strapline ‘Plan Design Enable’ are trademarks of Atkins Ltd.
Daniel J. Beaty, AICP Atkins, NA 2639 N Monroe Street, Building C Tallahassee, Florida 32303
[email protected] (850) 575-1800 Ext: 4097914 (850) 580-7914 (850) 574-2428