Embed Size (px)
Citation preview

Last Modified 4/13/2015
I-4-1
I-4. Semi-Quantitative Risk Analysis
Key Concepts
In some cases, qualitative or semi-quantitative risk assessments are desirable:
Non-dam structures, such as canal embankments, tunnels, levees, etc. where it is
desired to apply risk assessment principles to the decision making without the
time, cost, and data/analysis requirements associated with a full blown
quantitative risk analysis.
Portfolio assessments where it is desired to get a quick evaluation of the risks so
that risk reduction studies and actions can be prioritized.
Sensitive cases that involve the public to a high degree whereby those involved
(including reviewers) are more likely to understand general descriptors than full
blown numerical analyses.
As a high level screening to determine which potential failure modes should be
carried forward for quantitative analysis.
This method is used as the primary means of assessing risks in the USACE ongoing dam
safety Periodic Assessment (PA) program. USACE also uses this methodology for some
projects at the beginning of an Issue Evaluation Study (IES) to reevaulate the incremental
risk and urgency of action, to justify the need for an IES, and to identify the significant
potential failure modes to be evaluated as part of the IES quantitative risk assessment.
Since information on the probability of floods and earthquakes that are likely to lead to
failure are noted, historical dam failure rates are used, and consequences are generally
categorized, the risk assessment is referred to as semi-quantitative.
Failure Likelihood
One component or measure of risk is the probability of failure. Failure is typically
defined as an uncontrolled, potentially life-threatening release of the reservoir due to
breach. While this is applicable for high hazard projects, failure for navigation projects
also includes loss of navigable pool or lock closure. The likelihood of failure is a function
of both the likelihood of the loading condition that could lead to failure and the likelihood
of failure given the loading condition. For normal operating conditions, the likelihood of
the loading is high. However, for floods or earthquakes, the likelihood of the loading
could be small. Therefore, the likelihood of the loading needs to be considered in the risk
assessment. First, teams should discuss the critical load level for the potential failure
mode under consideration. Tailwater can significantly affect the critical load level. For
example, the maximum high pool may result in a lower differential hydraulic head for
initiation of a potential failure mode, and breach at that reservoir level may result in
lower incremental life loss due to warning and evacuation of the population at risk (PAR)
for uncontrolled spillway releases prior to breach. In this case, a reservoir level at the
spillway crest may be more critical for differential hydraulic head and result in higher
incremental life loss. If the annual chance exceedance (ACE) of the flood for the critical
load level (from a reservoir stage-frequency relationship) is virtually certain to cause
failure, then the annual probability of failure is essentially equal to the ACE of that flood.

I-4-2
It is suggested that teams start the discussions for failure likelihood with the ACE of the
critical load level, and then reduce that probability based on the likelihood of the step-by-
step progression leading to failure (i.e., subsequent nodes in an event tree have
probabilities less than one).
Anchoring to Historical Failure Rates for Normal Operations Examination of historical dam failure rates indicates that dams have failed at a rate of
roughly 1 in 10,000 per dam year of operation, depending on the failure mode and age of
the structure: Douglas et al. (1998), Foster et al. (1998), Hatem (1985), Von Thun (1985),
and Whitman (1984). This forms the basis for evaluating failure likelihood for a given
potential failure mode that could occur under normal operating conditions. For example,
if the key factors affecting the potential failure mode are weighted toward adverse (more
likely), the annual failure likelihood is probably greater than 1/10,000. If weighted
toward favorable (less likely), then the annual failure likelihood is probably less than
1/10,000.
Note: While anchoring to historical rates for dams is possible due to the availability
of such data, the same is not possible at the present time for other structures such as
canals and levees. In such cases, this approach can still be used to provide a relative
ranking of potential failure modes considering both likelihood of failure and
consequences should failure occur. Comparing the risks for non-dam structures to
dam safety risk guidelines may not be appropriate. For non-dam structures, the
tolerable risk levels should be defined prior to the risk assessment. The risks of non-
dam structures will then be compared to those tolerable risk levels.
Seismic Hazard An estimate of the seismic hazard at a dam site is typically needed to assess the
probability of earthquakes that are likely to lead to dam failure. If a detailed probabilistic
seismic hazard study is available for a site, it would be used in the assessment. However,
if such a study is not available, screening-level seismic hazard curves such as those
available from the USGS website are used. Typically, hazard curves with annual
exceedance probabilities out to 1/10,000 to 1/50,000 are needed, with the more remote
values needed for higher consequence projects. Hazard curves representing peak
horizontal ground acceleration are typically considered. For some concrete and steel
structures, hazard curves corresponding to the spectral acceleration at the natural period
of the structure may be more useful. The estimated annual exceedance probability of an
earthquake that is likely to cause failure indicates the approximate likelihood of seismic
failure. However, since failure must include life-threatening release of the reservoir, for
some flood risk management and water supply projects, where the reservoir level can
vary significantly throughout the year, the probability of the initial reservoir level at the
time of the earthquake (from a reservoir stage-duration relationship) must also be
considered.
Hydrologic Hazard Hydrologic hazard curves for these types of analyses are usually developed from
simplified screening processes and typically take the form of annual chance exceedance
(ACE) for increasing reservoir levels or flood inflows. In some cases, ACE as a function
of release flows, such as for spillway erosion potential failure modes, is also developed.
Curves should extend out to a flood representing the threshold of overtopping, or to a
flood approaching the Probable Maximum Flood (PMF) if the dam does not overtop

I-4-3
under such an event. There are various ways in which such curves can be developed.
They typically rely on statistical evaluation of historical information and some method to
estimate loading levels for more extreme flood events, possibly performing some limited
flood routing using reservoir operating rule curves. The estimated ACE of a flood that is
likely to cause failure indicates the approximate likelihood of hydrologic failure.
However, for flood risk management dams, it may be necessary to subdivide some
potential failure modes to capture the entire range of loading in the case of potentially
large increases in pool elevation. For qualitative assessments, flood loading is typically
limited to existing information, or information that can be easily obtained from sources
such as the USGS websites (although data from the USGS websites will be limited to
about a flood with an ACE of 1/500).
Failure Likelihood Categories Given this background information, the following failure likelihood categories and
descriptors are used for semi-quantitative risk assessments for dam safety. For non-dam
structures, it may be appropriate to modify the category descriptors, tailoring them
to the project being evaluated.
Remote: The annual failure likelihood is more remote than 1/1,000,000.Several
events must occur concurrently or in series to cause failure, and most, if not all,
have negligible likelihood such that the failure likelihood is negligible.
Low: The annual failure likelihood is between 1/100,000 and 1/1,000,000.The
possibility cannot be ruled out, but there is no compelling evidence to suggest it
has occurred or that a condition or flaw exists that could lead to initiation.
Moderate: The annual failure likelihood is between 1/100,000 and 1/10,000.The
fundamental condition or defect is known to exist; indirect evidence suggests it is
plausible; and key evidence is weighted more heavily toward “less likely” than
“more likely.”
High: The annual failure likelihood is between 1/10,000 and 1/1,000.The
fundamental condition or defect is known to exist; indirect evidence suggests it is
plausible; and key evidence is weighted more heavily toward “more likely” than
“less likely.”
Very High: The annual failure likelihood is more frequent (greater) than
1/1,000.There is direct evidence or substantial indirect evidence to suggest it has
initiated or is likely to occur in near future.
The dividing line between those failure modes with greater than a 1/10,000 chance and
those with less than a 1/10,000 chance of occurrence (on an annual basis) is between the
descriptors for Moderate and High. In a general sense, each category represents an order
of magnitude range in failure likelihood.
Notes: The potential for intervention to reduce the likelihood of failure must be
considered when assigning the failure likelihood category. In some cases it may be
appropriate to consider categories with and without intervention. For non-breach
risks, the probability of the flood associated with maximum planned operational
releases is used to define the likelihood category. In this case it is referred to as the
Flood Likelihood rather than failure likelihood.

I-4-4
Consequences
The other component of risk is the magnitude of consequences should failure occur.
Failure consequences of flood risk management or water supply projects can take many
forms, including life loss, destruction of downstream property, loss of service (project
benefits), environmental damage, and socio-economic impacts. For semi-quantitative
evaluations, the focus is typically on the potential for life loss, with the idea that the
broader socio-economic, environmental, and property damages would be generally
commensurate. However, certain projects, such as navigation projects, require an explicit
treatment of economic consequences which may include costs associated with disruption
to navigation traffic and water supply, flood damage to property, damage to structures
along the navigation pool from loss of pool, and disruption to industry and facilities
dependent on navigation.
An evaluation of dam failure case histories (Graham, 1999) indicates that the number of
fatalities is primarily dependent on: 1) the population at risk (PAR) within the dam-break
inundation boundary; 2) the severity of the flooding; and 3) the amount of warning time
the PAR has to evacuate the area. Other significant considerations include the degree to
which the PAR understands what is about to descend upon them and the availability and
clarity of possible evacuation routes. The PAR can be broadly categorized by the size of
the towns and development within the inundation zone as well as transient activity. The
severity of flooding is a function of the potential destruction to structures and
infrastructure within the floodplain. The warning time is a function of when the warnings
are issued and the time it takes for the flood wave to reach the PAR. See Chapter III-1
Consequences Evaluation for additional discussion on estimating consequences.
Consequences Categories Considering all of these aspects of consequence evaluation, the following broad
consequence categories are used for semi-quantitative risk assessments for dam safety.
For non-dam structures, it may be appropriate to modify the category descriptors,
tailoring them to the project being evaluated.
Level 0: No significant impacts to the downstream population other than
temporary minor flooding of roads or land adjacent to the river.
Level 1: Downstream discharge results in limited property and/or environmental
damage. Although life-threatening releases occur, direct loss of life is unlikely
due to severity or location of the flooding, or effective detection and evacuation.
Level 2: Downstream discharge results in moderate property and/or
environmental damage. Some direct loss of life is likely, related primarily to
difficulties in warning and evacuating recreationists/travelers and small
population centers (incremental life loss in the range of 1 to 10).
Level 3: Downstream discharge results in significant property and/or
environmental damage. Large direct loss of life is likely, related primarily to
difficulties in warning and evacuating recreationists/travelers and smaller
population centers, or difficulties evacuating large population centers with
significant warning time (incremental life loss in the range of 10 to 100).
Level 4: Downstream discharge results in extensive property and/or
environmental damage. Extensive direct loss of life can be expected due to
limited warning for large population centers and/or limited evacuation routes
(incremental life loss in the range of 100 to 1,000).

I-4-5
Level 5: Downstream discharge results in extremely high property and/or
environmental damage. Extremely high direct loss of life can be expected due to
limited warning for very large population centers and/or limited evacuation
routes (incremental life loss greater than 1,000).
Separate categories for economic consequences are used by USACE for inland
navigation projects or other significant hazard projects where the economic consequences
may be the deciding factor on taking action or not. These are relative rankings and are not
necessarily tied to risk guidelines. They are not intended to be equated to the life loss
categories to arrive at a value for human life.
Level 1: Incremental economic loss is less than $10 million.
Level 2: Incremental economic loss is in the range of $10 million to $100 million
Level 3: Incremental economic loss is in the range of $100 million to $1 billion.
Level 4: Incremental economic loss is in the range of $1 billion to $10 billion.
Level 5: Incremental economic loss is greater than $10 billion.
In a general sense, each category represents an order of magnitude range in
consequences.
Notes: The potential for evacuation must be considered when assigning the life loss
consequence category. In the case of breach risks, incremental consequences
(consequences over and above those that would occur without failure) are
considered when assigning the consequence category. For non-breach risks
associated with planned operational releases, total consequences drive the
consequences category.
Confidence
An essential part of the evaluation is to capture the confidence that the team has in the
selected categories. The following qualitative descriptors are suggested:
High: The team is confident in the order of magnitude for the assigned category
and, it is unlikely that additional information would change the estimate.
Low: The team is not confident in the order of magnitude for the assigned
category, and it is entirely possible that additional information would change the
estimate.
Moderate: The team is relatively confident in the order of magnitude for the
assigned category, but key additional information might possibly change the
estimate.
A potential failure mode rated with Low confidence, particularly if risk-reduction actions
are indicated, would probably require additional investigations or analyses before taking
risk-reduction action. However, if it is rated with High confidence, it may be appropriate
to go directly to interim risk-reduction actions or in some cases long-term risk reduction
actions. In some cases, the team will have Low confidence in an assigned category but
cannot think of any additional information that could be collected to improve their
confidence. These cases are documented. When assigning confidence descriptors, the
reasoning behind the descriptor, and the information that could be gathered to improve
the rating should also be captured in the documentation.

I-4-6
Risk Matrices
A risk matrix can be established to portray the likelihood of failure and consequences due
to failure associated with the identified risk-driver (or significant) potential failure modes,
with likelihood of failure on the vertical axis (using cell divisions corresponding to the
failure likelihood categories) and the associated incremental consequences on the
horizontal axis (using cell divisions corresponding to the consequences categories)
similar to the f-Ñ diagram used to portray incremental risk from quantitative risk
assessments. For non-dam projects, category descriptors need to be set up ahead of time
and possibly tailored to the project being evaluated. Typically, at least four or five
categories are defined for each axis since three categories typically don’t provide enough
resolution when it comes to evaluating the risks.
Figure I-4-1 illustrates the risk matrix relative to risk guidelines (see Chapter IX-1 Risk
Guidelines) which are represented on Figure I-4-2 in an approximate sense for use in
semi-quantitative analyses. Although several potential failure modes may be identified by
the team, only potential failure modes judged to be potential risk-drivers are fully
evaluated (assigning failure likelihood and consequence category) and plotted on the risk
matrix. The potential failure modes that were excluded from further consideration (i.e.,
not plotted) because they were deemed non-credible or credible but non-risk-drivers are
captured, and the team’s rationale, assumptions, and understanding are clearly
documented so that a different team can review this information during the next
scheduled periodic review, or sooner if an incident occurs, and understand what the
original team was thinking and whether there are changed conditions, improved
knowledge, or improved state of practice that would affect the risk assessment.
For dam safety semi-quantitative analyses, the Annualized Life Loss or Societal Risk
guidelines are approximately represented by the diagonal dashed line. The Annual
Probability of Failure or Individual Risk guidelines (assuming that the most exposed
individual is exposed all the time) are approximately represented by the horizontal dashed
line between Moderate and High failure likelihood. Cells of the risk matrix, defining the
failure likelihood and consequence categories, correspond to order of magnitude
divisions on the f-Ñ diagram, and potential failure modes are plotted as boxes of the same
size as the grid to represent order of magnitude estimates made by the team.
In the case of semi-quantitative risk analyses, potential failure modes with estimated risks
plotting in cells entirely below both red dashed lines with high confidence should be kept
under review and properly managed. This requires continued monitoring and evaluation.
Similarly, potential failure modes with risks plotting in cells above the red dashed lines
represent risks that likely exceed risk guidelines and require action to reduce or better
define risk. “Line huggers” or potential failure modes plotting on cells representing the
approximate boundary of the risk guidelines likely require action to reduce or better
define risk, but the urgency compared to potential failure modes plotting above the
established guidelines may be lower.
Note: The risk guidelines on the matrix are not as meaningful for qualitative
analyses of non-dam structures because the tolerable risk levels for non-dam
structures may not be the same as for dams.

I-4-7
Figure I-4-1. Representation of Tolerable Risk Guidelines
Figure I-4-2. Incremental Risk Matrix
1E-07
1E-05
1E-04
1E-03
1E-02
1 10 100 1,000
Average Incremental Life Loss, N
1E-06Low
Probability –
High
Consequence Events
An
nu
al P
rob
ab
ility
of F
ailu
re (A
PF
), f
Consequence Category
Lik
elih
oo
d o
f F
ailu
re
Lo
wM
od
era
teH
igh
Ve
ry H
igh
Re
mo
te
Level 2Level 1 Level 3 Level 4 Level 5

I-4-8
Estimating Risks
Once the risk matrix is established for a qualitative or semi-quantitative assessment, the
results of the failure mode evaluation (see Chapter I-3 Potential Failure Mode Analysis)
can be used to place each potential failure mode in the appropriate failure likelihood and
consequence category (i.e., risk category). This requires a clear and complete description
of the potential failure modes and an evaluation of the adverse factors that make each
potential failure mode “more likely” to occur as well as the favorable factors that make it
“less likely” to occur. The rationale and key factors affecting the assigned failure
likelihood category are documented. Similarly, for consequences, the potential
incremental consequences are evaluated and assigned to the appropriate consequence
category, and the rationale for the assignment is documented. (See Chapter I-9 Building
the Case.) The confidence categories (and their rationale) are assigned to each, and then
each potential failure mode is plotted in the appropriate cell of the risk matrix.
The risk is evaluated against the approximate risk guidelines, and the risk from all risk-
driver potential failure modes should be added. Judgment is required for semi-
quantitative analyses. Experience with quantitative risk analyses has shown that it takes
many potential failure modes plotting in the area below established risk guidelines to
move an order of magnitude upward. Therefore, looking at individual potential failure
modes in the manner described above is generally adequate, although several borderline
potential failure modes would be of concern. Potential failure modes that plot in the
region with annual probabilities of failure less than 1/1,000,000 (i.e., remote) and
estimated incremental life loss greater than 1,000 are generally highlighted and carefully
considered in the prioritization process.
Qualitative or Semi-Quantitative Risk Estimating
Process
The basic steps taken during a typical qualitative or semi-quantitative risk assessment
workshop might resemble the following for each dam or feature.
Review basic statistics and key features of the dam or other structure (e.g., type
of dam or other structure, height of dam or other structure, reservoir volume, etc.)
and available construction photographs.
Review normal operating condition loadings (reservoir levels and freeboard).
Review available flood-frequency hazard curves and flood routings. Of particular
note are the frequency of the flood of record, the zero freeboard (spillway
capacity) flood frequency, the projected frequency of the Probable Maximum
Flood (PMF), and the peak inflow/projected reservoir level for the 1 in 10,000/yr
flood. If this information is not available, look for information from nearby
projects or from the USGS websites (although data from the USGS websites will
be limited to about a flood with an ACE of 1/500).
Review available seismic hazard curves. Of particular note are the ground
motions associated with the 1in 10,000/yr earthquake, the approximate return

I-4-9
period of the MCE ground motions, and the ground motions used in any seismic
analyses along with their approximate return period.
Review inundation studies (both “sunny day” and flood scenarios with and
without breach) including probable impacts to downstream dams, roads and
bridges, recreation areas, permanent structures, recreation areas, and other
property.
Then, the following steps are taken for each identified potential failure mode.
Develop the potential failure mode and its full description (see Chapter I-3
Potential Failure Mode Analysis). It is important to develop the failure mode
from initiation, through step-by-step development, to breach of the dam or other
structure so that all participants have a common understanding of what is being
estimated. It is also important to understand what the breach (or uncontrolled
release of the reservoir) entails, as this has a direct bearing on the consequences.
Develop the factors making the potential failure mode more likely and less likely
to occur, including analysis results and associated load probabilities where
applicable, and identify the key factors.
Ask each team member to make their individual estimate of the failure likelihood
category prior to further discussion, considering whether the evidence is
weighted more toward likely or unlikely, and then discuss.
Elicit failure likelihood categories from each team member, along with the
reasoning behind their estimate. This typically prompts discussion among team
members. After the discussion has died down, the facilitator summarizes what
has been said, proposing a “consensus” likelihood category and the reasoning
why it makes sense, and then asking if there are any objections. If objections are
raised, additional discussion ensues, and the process is repeated. If a consensus
cannot be reached, the range of categories is captured along with the reasons for
each.
The facilitator or designated recorder captures the information, including the
likelihood category and the rationale for its assignment. The confidence in the
rating is also captured, along with the rationale for its assignment and what
additional information could be gathered to improve the confidence rating, if
applicable.
A similar elicitation process is repeated to arrive at a consequence category for
each potential failure mode. It is especially important during this process to note
differences between the likely breach flows associated with a potential failure
mode, and what has been assumed in the breach inundation studies. In many
cases, the breach outflow associated with a potential failure mode would be
considerably less than assumed in the inundation studies.
Once a potential failure mode has been discussed and classified according to likelihood
and consequences, it is often useful to list it on a “sticky note” and place it on a large
I-4-10
blank risk matrix posted on the wall. Different colors help to differentiate different
structures or elements.
Example
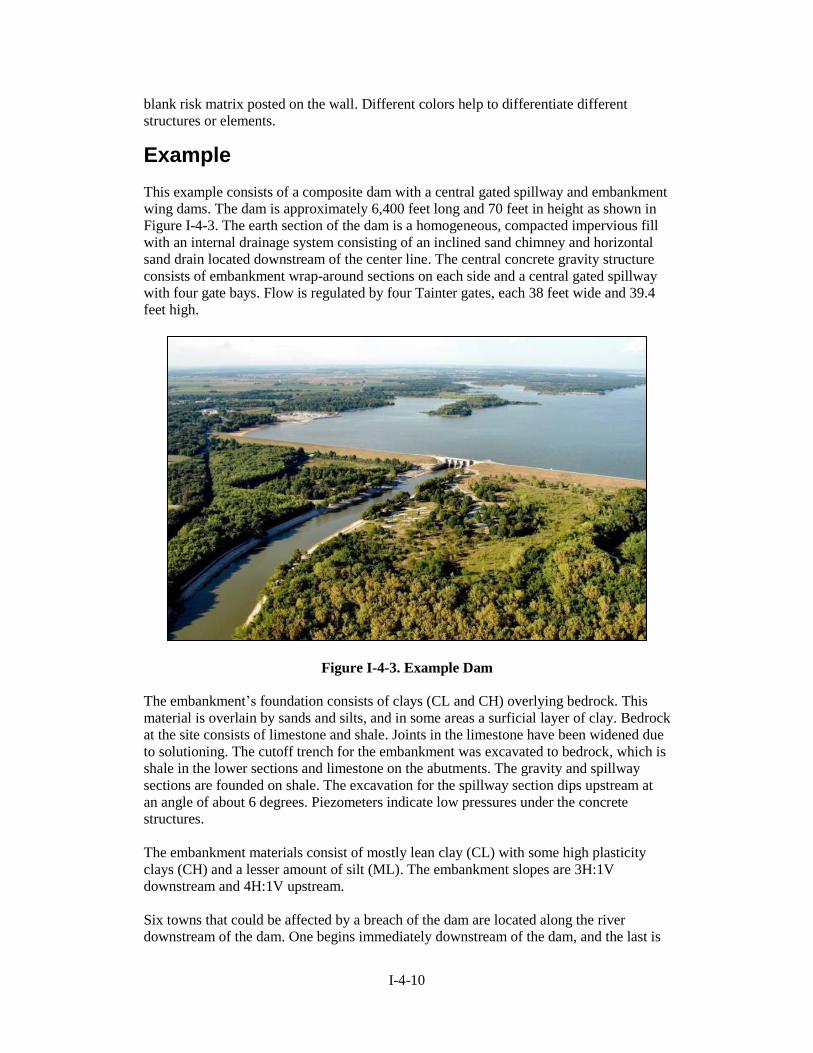
This example consists of a composite dam with a central gated spillway and embankment
wing dams. The dam is approximately 6,400 feet long and 70 feet in height as shown in
Figure I-4-3. The earth section of the dam is a homogeneous, compacted impervious fill
with an internal drainage system consisting of an inclined sand chimney and horizontal
sand drain located downstream of the center line. The central concrete gravity structure
consists of embankment wrap-around sections on each side and a central gated spillway
with four gate bays. Flow is regulated by four Tainter gates, each 38 feet wide and 39.4
feet high.
Figure I-4-3. Example Dam
The embankment’s foundation consists of clays (CL and CH) overlying bedrock. This
material is overlain by sands and silts, and in some areas a surficial layer of clay. Bedrock
at the site consists of limestone and shale. Joints in the limestone have been widened due
to solutioning. The cutoff trench for the embankment was excavated to bedrock, which is
shale in the lower sections and limestone on the abutments. The gravity and spillway
sections are founded on shale. The excavation for the spillway section dips upstream at
an angle of about 6 degrees. Piezometers indicate low pressures under the concrete
structures.
The embankment materials consist of mostly lean clay (CL) with some high plasticity
clays (CH) and a lesser amount of silt (ML). The embankment slopes are 3H:1V
downstream and 4H:1V upstream.
Six towns that could be affected by a breach of the dam are located along the river
downstream of the dam. One begins immediately downstream of the dam, and the last is

I-4-11
about 80 miles downstream. Breach inundation mapping shows only the outskirts of the
towns nearest the river would be flooded by breach inundation flows, with a PAR of
approximately 250 people.
An initial screening-level evaluation conducted 3 years prior to the semi-quantitative
evaluation suggested the potential failure modes of most concern involved the potential
for arm buckling of the Tainter gates during flood operations, internal erosion through the
foundation or abutments, and embankment erosion due to wave overtopping (freeboard
requirements are not met for Probable Maximum Flood) during large floods.
An evaluation of the potential for Tainter gate arm buckling due to moments induced by
trunnion friction during flood operations resulted in a Moderate failure likelihood
category. The bushings have become misaligned requiring redrilling and tapping for
greasing, and original analyses show combined (axial and bending) stress ratios
approaching unity for normal water loading and “cable load.” However, the project
maintenance staff has kept the trunnions greased. This factor tipped the evaluation to the
“less likely” side. The confidence was rated as Low since the gates have not been
analyzed with trunnion friction using modern methods and the long-term effectiveness of
the trunnion greasing is uncertain. Since this potential failure mode is likely to result in
the loss of only one gate, with mangled debris remaining in the opening to throttle flow, it
is likely this uncontrolled release of the reservoir would not exceed the downstream the
channel capacity (i.e., would remain within the banks). If there were any fishermen
downstream, they could be caught by surprise and subjected to life-threatening flows, but
it is likely they could get out of the way since the distance to safety is likely to be short.
Therefore, a Level 1 consequence category was assigned with a High confidence rating.
Solutioned joints exist downstream of the cutoff trench, and a potential failure mode
related to internal erosion of the foundation and embankment soils along these features
could not be ruled out. There is no evidence to suggest it has occurred or is likely to
occur. The cavity filling material was removed, and the voids backfilled with concrete at
the cutoff trench contact, as shown in Figures I-4-4 and I-4-5. The cavities tightened with
depth and the material in the cavities was found to be clay that required some effort to
remove. The embankment soils have some plasticity and are not highly erodible.
Therefore, the key evidence was weighted fairly heavily toward unlikely. However, since
there are limited exposures and instruments (piezometers) with which to observe
potential development of the failure mode and it was recognized there are considerable
uncertainties with the geologic conditions downstream of the cutoff trench, a dual failure
likelihood category of Low to Moderate was assigned. Although the evidence was fairly
compelling for the failure likelihood category, additional information about foundation
pore pressures and geology downstream of the trench might show unexpected conditions
in these areas. Therefore, a Moderate confidence level was assigned.

I-4-12
Figure I-4-4. Typical Limestone Foundation Joints
Figure I-4-5. Rock Foundation in Cutoff Trench after Dental Concrete Treatment

I-4-13
It is expected a breach under this failure scenario would take some time to develop due to
the plasticity of the soils such that detection and evacuation would be likely. There is also
a river gage at a downstream highway that may show increasing flows above the
expected spillway discharge and trigger action. Only a small part of nearby communities
would be inundated along with a few low lying farm houses. Some fatalities would be
expected (i.e., less than 10). Since there isn’t much difference between maximum
spillway releases and dam breach inundation boundaries according to the inundation
maps, it is doubtful additional information would reduce the uncertainty or change the
consequence category. Therefore, a Level 2 consequence category was assigned with
High confidence.
Using a reservoir stage-frequency relationship based on data from 1975 to present and
available flood routings, the confidence limits for a pool reaching the crest of the
embankments ranges from an ACE of 1/10,000 to much less than 1/100,000. Although
freeboard requirements were not met for the PMF, an average ACE of less than
1/100,000 prior to overtopping led to a Low to Remote failure likelihood category, since
breach under minor overtopping would not be a certainty due to the plasticity of the
embankment soils. The uncertainty associated with estimating frequencies based on a
short period of record is not low. Therefore, the confidence rating was Moderate. Failure
of the dam during an extreme event would potentially only harm those individuals not
evacuated from a normal spillway release. The incremental PAR (after evacuations for
maximum spillway releases) would be about 60 individuals with a potential incremental
life loss of 1 to 2 people. Therefore, a Level 2 consequences category was assigned.
There is uncertainty as to where the dam would breach and how quickly the breach would
develop. Additional information may change the uncertainty or consequence rating or it
may not. Therefore, a Moderate confidence level was assigned.
The most critical potential failure mode identified relates to internal erosion through an
area where closure was made in the embankment between Phase 1 and Phase 3
construction contracts, which was not identified by the initial evaluation. The
embankment was constructed considerably differently between these two sections. The
portion to the right of the closure section does not contain a chimney drain, has a thinner
blanket drain (18 inches compared to 36 inches to the left), has a narrower cutoff trench
bottom width (15 feet compared to 25 feet to the left), and the cutoff trench is offset
further upstream. The Phase 1 embankment was exposed for up to 5 years before closure
was made. There is no evidence to suggest special treatment or construction methods
were used at the embankment closure section. In addition, the trace of the interface is still
slightly visible on aerial photography, as shown in Figure I-4-6, and some wet areas were
observed on the downstream face in this area. There is more potential for a problematic
defect near the top of the dam due in part due to the fact the embankment gets narrower
and the stresses that would tend to close up a defect are lower. Therefore, the estimated
failure likelihood of failure category was considered High under normal high pool levels.
A Low confidence level was assigned mainly since there is no compelling evidence to
suggest the wet areas are the result of seepage through the interface between the Phase 1
and Phase 3 embankments. Key additional information could very well change the
assigned category. A Level 2 consequence category was assigned with High confidence
since some minor life loss might be expected due to a slug of unexpected water
inundating portions of the downstream communities.

I-4-14
Figure I-4-6. Area of Phase 1 and Phase 3 Embankment Interface
Other potential failure modes were evaluated in a similar manner. The risk matrix shown
in Figure I-4-7 only portrays the potential failure modes thought to control the
incremental risk prior to the semi-quantitative evaluation and the potential failure mode
that actually seems to control the incremental risk after this evaluation. As a result of this
exercise, additional monitoring and exploration is planned for the embankment interface
area, stemming from the high estimated incremental risk but low confidence in that
assessment. In addition, due to the Low confidence rating on the Tainter gate evaluation,
additional analyses of the gates are planned to verify the failure likelihood categories.
Embankment Interface
Embankment Interface

I-4-15
Figure I-4-7. Incremental Risk Matrix for Above Example
Accounting for Uncertainty
Since each potential failure mode is placed into broad categories during a qualitative or
semi-quantitative risk assessment, there is little need to account for uncertainty. However,
if a failure mode could fall into more than one category based on uncertainty, this can be
easily noted, and the failure mode plotted in more than one box or at the border of two
boxes.
Non-Breach Risk
A requirement of all USACE risk assessments is to identify and portray the non-breach
risks. These are risks associated with planned operations, typically involving release of
large quantities of water through spillways in order to prevent the dam from overtopping.
In some cases, the planned releases are large enough to cause damage and threaten lives.
However, risks associated with these conditions are smaller than if the dam were not
there. In general, evaluating these risks involves identifying the maximum releases and
available freeboard that would occur during the Inflow Design Flood (IDF) if the dam is
not expected to overtop (or the dam crest elevation if the IDF cannot be passed), the
frequency of the flood associated with those releases, and the consequences associated
with those releases. For risk communication, it is also helpful to identify the downstream
non-damaging discharge and the maximum spillway discharge, along with the ACE of
the uncontrolled spillway crest or top of flood control pool for gated spillways. The
frequency of the flood drives the likelihood category. Warnings that would go out prior to
impacting the PAR with planned releases must be taken into account in assessing the
Consequence Category
Lik
elih
oo
d o
f F
ailu
re
Lo
wM
od
era
teH
igh
Ve
ry H
igh
Re
mo
te
Level 2Level 1 Level 3 Level 4 Level 5
Gate Arm
Buckling:
Trunnion
FrictionInternal
Erosion:
Solution
Features
Embankment Overtopping
Erosion
Internal
Erosion:
Closure
Section

I-4-16
consequences. Total consequences are typically estimated. Thus, the incremental risks of
comparing to the case of no dam are not captured. The results are plotted on a separate
non-breach risk matrix. This is similar to the incremental risk matrix described
previously, but the vertical axis is labeled “likelihood of flood” and no tolerable risk limit
lines are shown since they are not applicable to non-breach conditions. If the dam does
not overtop, the IDF is plotted based on its ACE and non-breach consequences. If the
dam is overtopped, the flood associated with the top of dam (TOD) is plotted, in addition
to the IDF, using the ACE of the dam crest flood elevation and non-breach consequences
associated with maximum non-overtopping spillway releases, as shown in Figure I-4-8.
For overtopping, the non-breach consequences for the IDF include the non-breach
overtopping discharge in addition to maximum spillway releases. If there is downstream
flood risk management or water supply infrastructure (e.g., dams or levees) that could be
overtopped by operational spillway releases, the frequency of the flood that would
overtop those structures and the consequences resulting from overtopping (but not due to
failure) of those structures are included.
Figure I-4-8. Non-Breach Risk Portrayal for Overtopping Scenario
For the example described above, during the spillway design flood with an ACE of
approximately 1/10,000, releases of 160,000 cfs would occur. Under these conditions, the
inundated area would be only slightly smaller than under breach of the dam, but the
warning would be much longer since inflows would be forecast and releases ramped up
gradually. Although life-threatening flows would occur, loss of life would be unlikely.
The non-breach risks are therefore portrayed in Figure 3-9 as a likelihood of flood of
Moderate to High with a Level 1 consequence category.
Lo
wM
od
era
teH
igh
Ve
ry H
igh
Re
mo
te
Level 2Level 1 Level 3 Level 4 Level 5
Lik
elih
oo
d o
f F
loo
d
Consequence Category
IDF
TOD

I-4-17
Figure I-4-9. Non-Breach Risk Matrix for Above Example
Exercise
Take one of the potential failure modes you developed for Evans Creek Dam in an earlier
exercise (see Chapter I-3 Potential Failure Mode Analysis) and place it into the
appropriate risk category in the risk matrix shown in Figure I-4-2. Justify your result.
Note: If the class did the Cobb Creek Levee exercise, the matrix can be used as a relative
ranking tool, but cannot be used to compare to risk guidelines (unless based on a flood or
earthquake frequency) since the likelihood category descriptors are anchored to dam
historical failure rates and not levee historical failure rates. If Cobb Creek Levee was
evaluated, rank the potential failure modes from most risky to least risky considering both
likelihood and consequences.
Lo
wM
od
era
teH
igh
Ve
ry H
igh
Re
mo
te
Level 2Level 1 Level 3 Level 4 Level 5
Lik
elih
oo
d o
f F
loo
d
Consequence Category
IDF

I-4-18
References
Douglas, K.J., M. Spannagle, and R. Fell (1998), “Analysis of Concrete and Masonry
Incidents,” UNICIV Report No. R-373, The University of New South Wales, Sydney,
Australia.
Foster, M.A., R. Fell, and M. Spannagle (1998), “Analysis of Embankment Dam
Incidents,” UNICIV Report No. R-374, The University of New South Wales, Sydney,
Australia.
Graham, W.J. (1999), “A procedure for estimating loss of life caused by dam failure.”
Report DSO-99-06, U.S. Department of the Interior, Bureau of Reclamation, Denver,
Colorado.
Hatem, G.A. (1985), “Development of a Data Base on Dam Failures in the U.S. –
Preliminary Results,” Thesis, Stanford University, Palo Alto, CA.
U.S. Army Corps of Engineers (2011), “ Safety of Dams – Policy and Procedures,” ER
1110-2-1156, Washington, DC.
Von Thun, J.L. (1985), “Application of Statistical Data from Dam Failures and Accidents
to Risk-Based Decision Analysis on Existing Dams,” Bureau of Reclamation, Denver,
CO.
Whitman, R.V. (1984). “Evaluating calculated risk in geotechnical engineering.” J.
Geotechnical Engineering, ASCE, Reston, Virginia, Vol. 110 (2): 145-188.