Embed Size (px)
Citation preview
I-405 Traffic Data and Corridor
Performance Study
Presentation to the Joint Transportation Committee
Olympia, WA
December 14, 2017
Draft Findings and Recommendations
• “Independent and objective analysis”
• “Describe performance on various segments of the
corridor that represent segments used by typical
drivers, and describe where the corridor is working, and
where it is not working”
• What evidence (i.e. performance measures) can be
obtained from the data about the effectiveness of the
ETL corridor during its pilot phase?
2
Study Objectives
Washington state statute RCW 47.56.880 lists several general
performance measures for the I-405 ETL facility. Of these, three
measures are of primary interest to this study:
• Whether the express toll lanes generate sufficient revenue to pay for all I-
405 express toll lane-related operating costs;
• Whether the express toll lanes maintain speeds of 45 miles per hour
(mph) at least 90 percent of the time during peak periods; and
• Whether the average traffic speed changed in the general purpose lanes.
3
Statutory Performance Measures
Financial Performance Measure Met. The I-405 ETL facility is achieving the first primary performance measure the Washington Legislature set for the facility – to be financially self-sufficient.
ETL Speed Performance Measure Not Met. The I-405 ETL facility is not meeting the second primary performance measure the Washington Legislature set for the facility – to have vehicles on the ETL averaging 45 mph at least 90 percent of the time. This study finds that on average the amount of time in peak period where ETL speed is above the 45 mph statutory goal is 85 percent in the northbound direction and 78 percent in the southbound direction (Jan 2017 – Jun 2017).
GPL Speeds Showed No Significant Change. Average GPL speeds during the peak period were not dramatically different before and after opening of the ETL facility. Improved speed was recorded immediately following opening of the paved GPL shoulder, but that improvement returned to pre-ETL levels as time passed.
4
Key Findings
5
Study Process
• Six month study (began June, 2017)
• Extensive work with staff workgroup (staff from JTC, Legislature, OFM,
WSDOT, Transportation Commission)
• Data transfer from WSDOT completed in August, 2017
• Developed database and computer programs specifically for this study
6
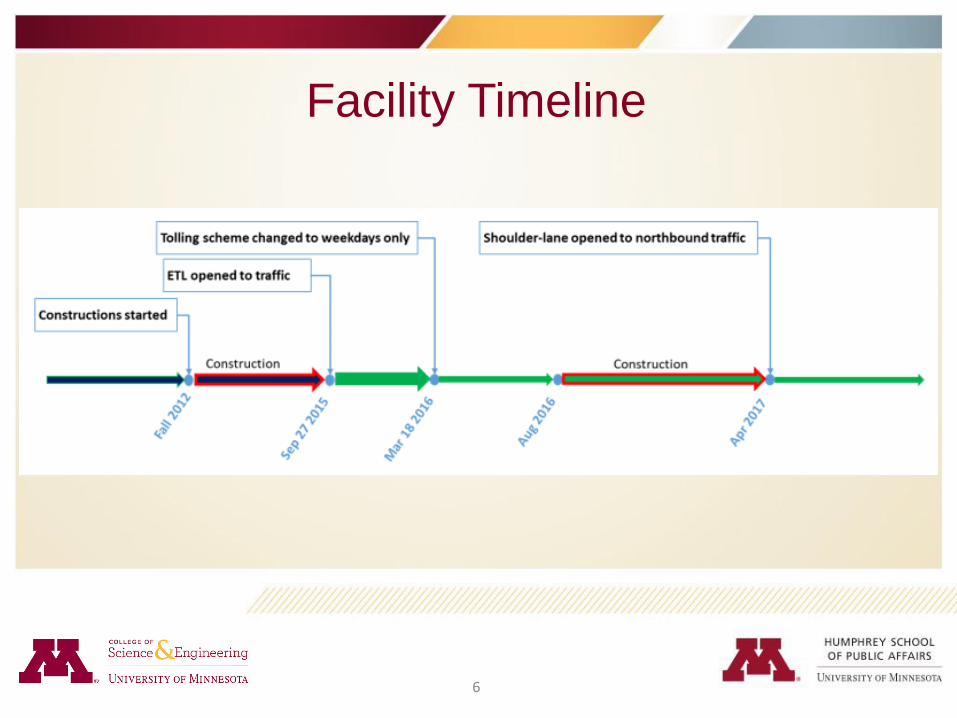
Facility Timeline
• Three potential sources of data: WSDOT loop detectors, ETL toll transaction data, HERE/INRIX cell-phone derived data
• Analysis involved:
– Understanding corridor attributes, facility timeline, and policy/facility changes
– Key metrics
– Data sources
– Application of analytical tools
7
Approach to Data Analysis
• Availability (over given time frame)
• Content
– Density
– Volume
– Speed
– Travel time
– Lane differentiation (GP vs ETL)
• Sample rate (resolution)
8
Data Source Characteristics
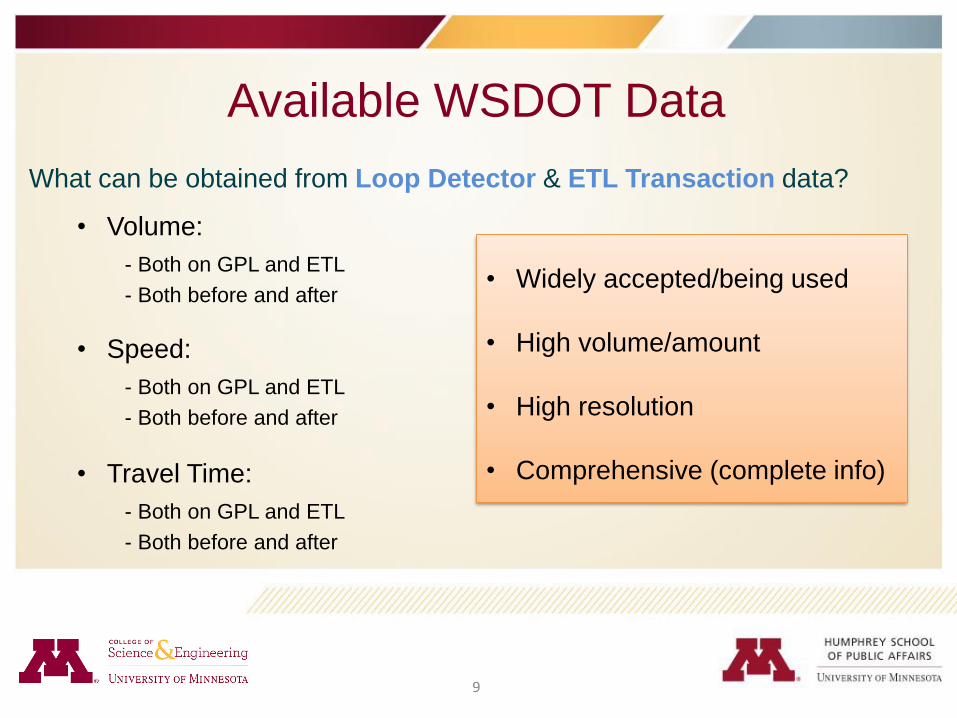
What can be obtained from Loop Detector & ETL Transaction data?
• Volume:
- Both on GPL and ETL
- Both before and after
• Speed:
- Both on GPL and ETL
- Both before and after
• Travel Time:
- Both on GPL and ETL
- Both before and after
• Widely accepted/being used
• High volume/amount
• High resolution
• Comprehensive (complete info)
9
Available WSDOT Data
• We developed database systems and computer programs
to undertake our analysis in this study
• We calculated traffic measures on ETL and GPL separately
and independently
• We calculated volume, speed and travel time:
– In peak and off peak periods
– For every month
10
Data Analysis Methodology
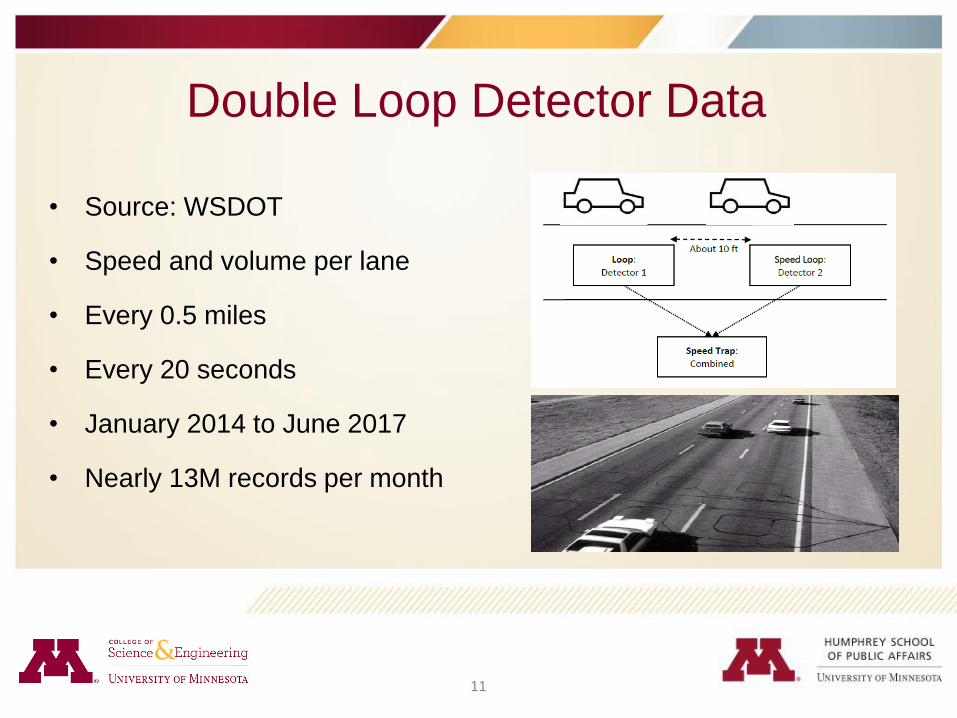
• Source: WSDOT
• Speed and volume per lane
• Every 0.5 miles
• Every 20 seconds
• January 2014 to June 2017
• Nearly 13M records per month
11
Double Loop Detector Data
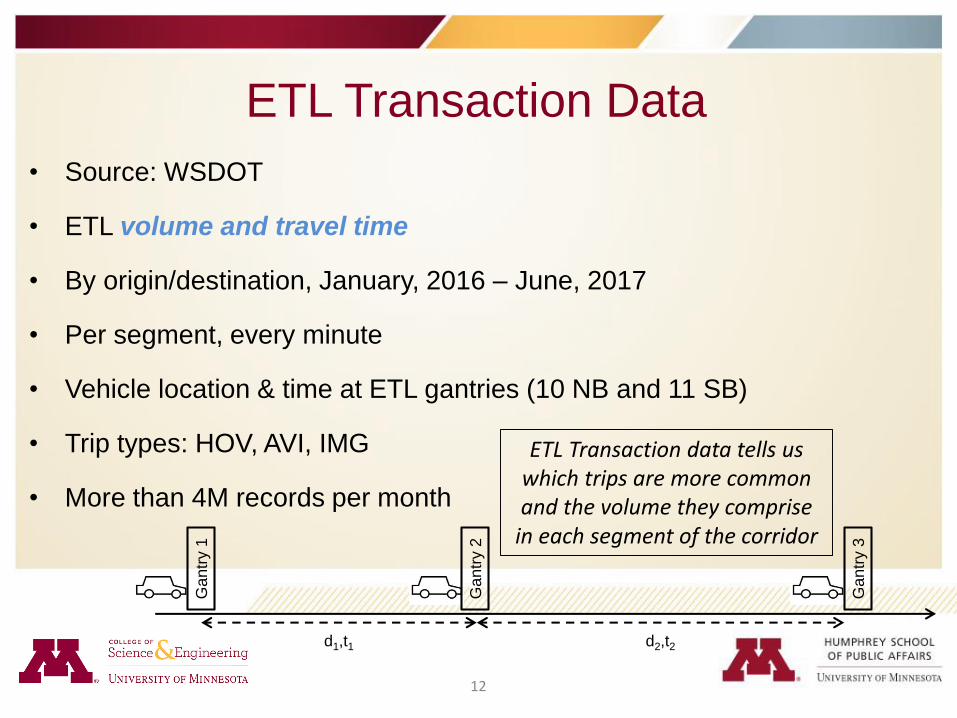
• Source: WSDOT
• ETL volume and travel time
• By origin/destination, January, 2016 – June, 2017
• Per segment, every minute
• Vehicle location & time at ETL gantries (10 NB and 11 SB)
• Trip types: HOV, AVI, IMG
• More than 4M records per month
d1,t1 d2,t2
Ga
ntr
y 1
Ga
ntr
y 2
Ga
ntr
y 3
ETL Transaction data tells us which trips are more common and the volume they comprise
in each segment of the corridor
12
ETL Transaction Data
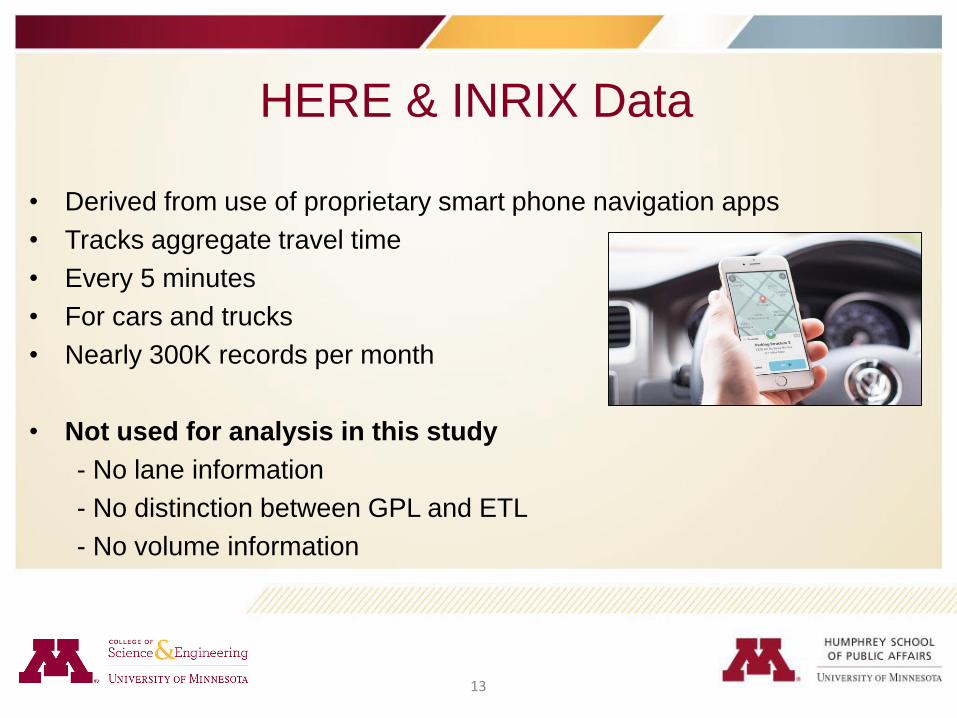
• Derived from use of proprietary smart phone navigation apps
• Tracks aggregate travel time
• Every 5 minutes
• For cars and trucks
• Nearly 300K records per month
• Not used for analysis in this study
- No lane information
- No distinction between GPL and ETL
- No volume information
13
HERE & INRIX Data
14
Data Summary & Comparison
15
NB Monthly Travel Times, Jan 2014 – June 2017
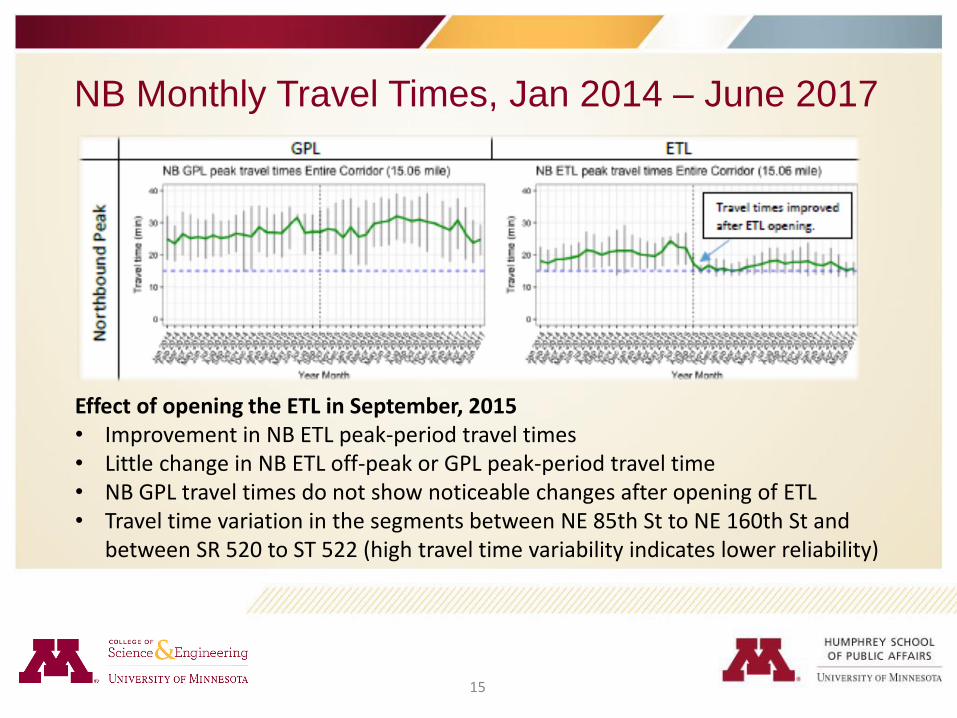
Effect of opening the ETL in September, 2015• Improvement in NB ETL peak-period travel times• Little change in NB ETL off-peak or GPL peak-period travel time• NB GPL travel times do not show noticeable changes after opening of ETL• Travel time variation in the segments between NE 85th St to NE 160th St and
between SR 520 to ST 522 (high travel time variability indicates lower reliability)
16
SB Monthly Travel Times, Jan 2014 – June 2017
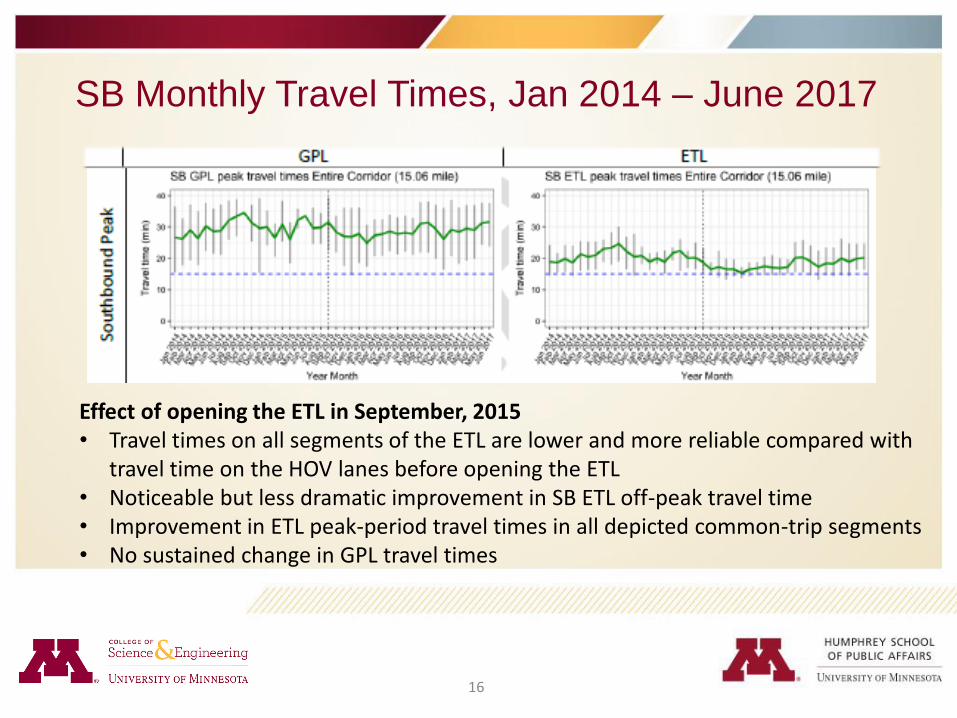
Effect of opening the ETL in September, 2015• Travel times on all segments of the ETL are lower and more reliable compared with
travel time on the HOV lanes before opening the ETL• Noticeable but less dramatic improvement in SB ETL off-peak travel time• Improvement in ETL peak-period travel times in all depicted common-trip segments• No sustained change in GPL travel times
17
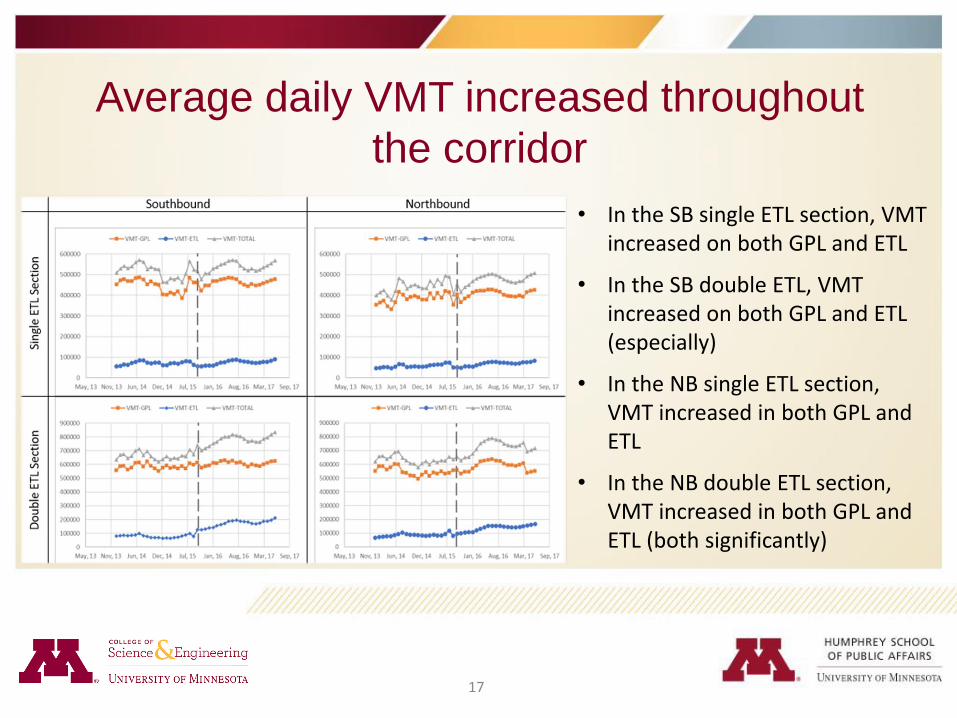
Average daily VMT increased throughout
the corridor
• In the SB single ETL section, VMT increased on both GPL and ETL
• In the SB double ETL, VMT increased on both GPL and ETL (especially)
• In the NB single ETL section, VMT increased in both GPL and ETL
• In the NB double ETL section, VMT increased in both GPL and ETL (both significantly)
18
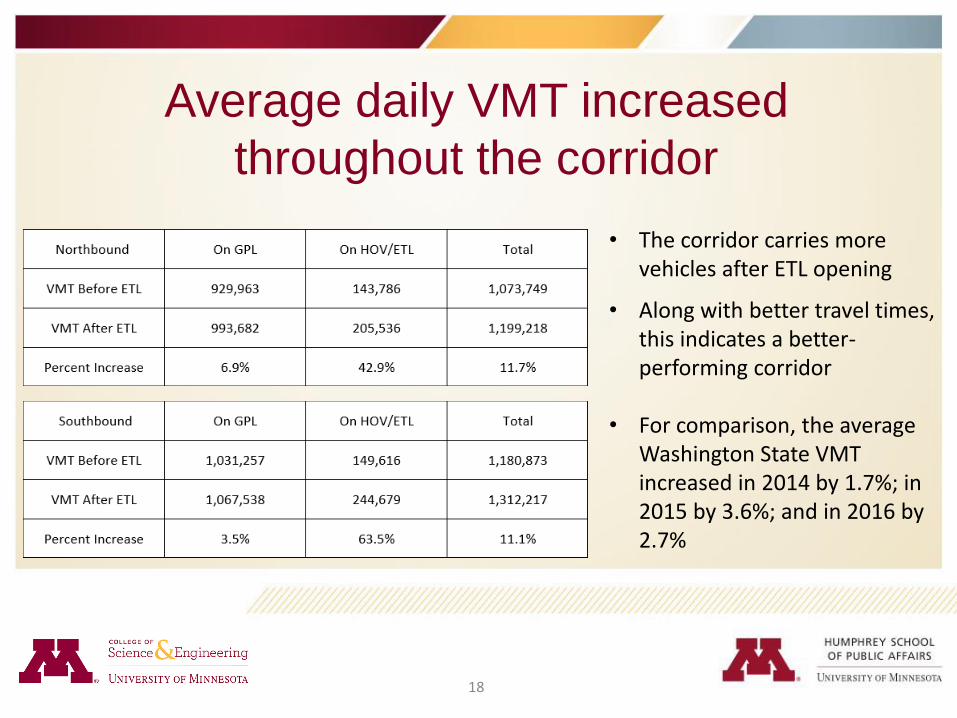
Average daily VMT increased
throughout the corridor
• The corridor carries more vehicles after ETL opening
• Along with better travel times, this indicates a better-performing corridor
• For comparison, the average Washington State VMT increased in 2014 by 1.7%; in 2015 by 3.6%; and in 2016 by 2.7%
19
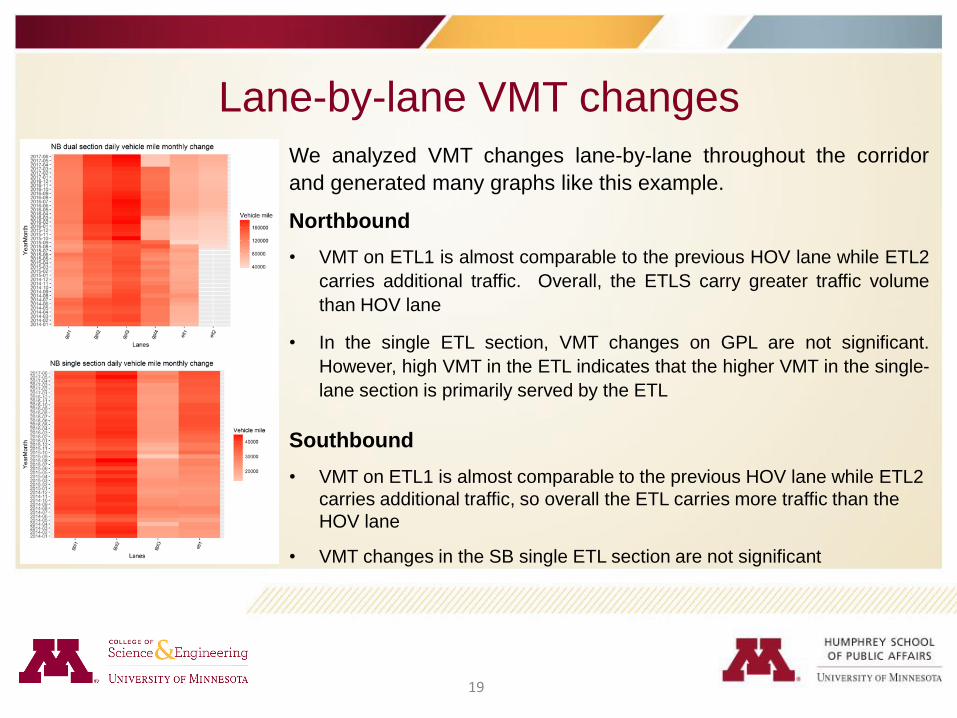
Lane-by-lane VMT changes
We analyzed VMT changes lane-by-lane throughout the corridor
and generated many graphs like this example.
Northbound
• VMT on ETL1 is almost comparable to the previous HOV lane while ETL2
carries additional traffic. Overall, the ETLS carry greater traffic volume
than HOV lane
• In the single ETL section, VMT changes on GPL are not significant.
However, high VMT in the ETL indicates that the higher VMT in the single-
lane section is primarily served by the ETL
Southbound
• VMT on ETL1 is almost comparable to the previous HOV lane while ETL2
carries additional traffic, so overall the ETL carries more traffic than the
HOV lane
• VMT changes in the SB single ETL section are not significant
20
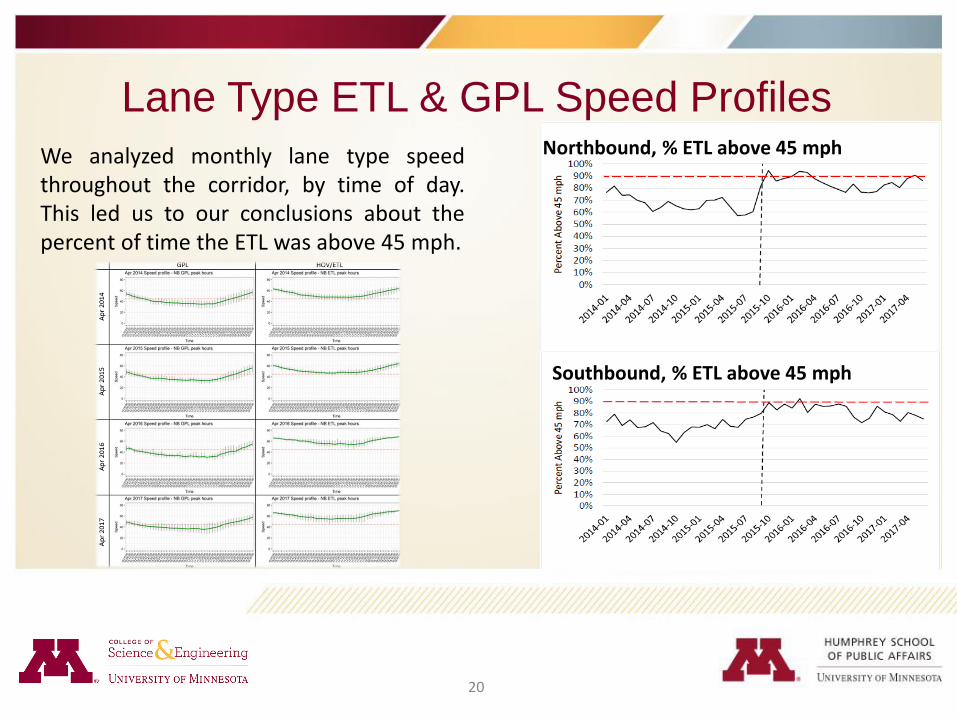
Lane Type ETL & GPL Speed Profiles
We analyzed monthly lane type speedthroughout the corridor, by time of day.This led us to our conclusions about thepercent of time the ETL was above 45 mph.
Northbound, % ETL above 45 mph
Southbound, % ETL above 45 mph
21
0%
5%
10%
15%
20%
25%
30%
Oct
-15
No
v-1
5
De
c-1
5
Jan
-16
Feb
-16
Mar
-16
Ap
r-1
6
May
-16
Jun
-16
Jul-
16
Au
g-1
6
Sep
-16
Oct
-16
No
v-1
6
De
c-1
6
Jan
-17
Feb
-17
Mar
-17
Ap
r-1
7
May
-17
Jun
-17
NB SB
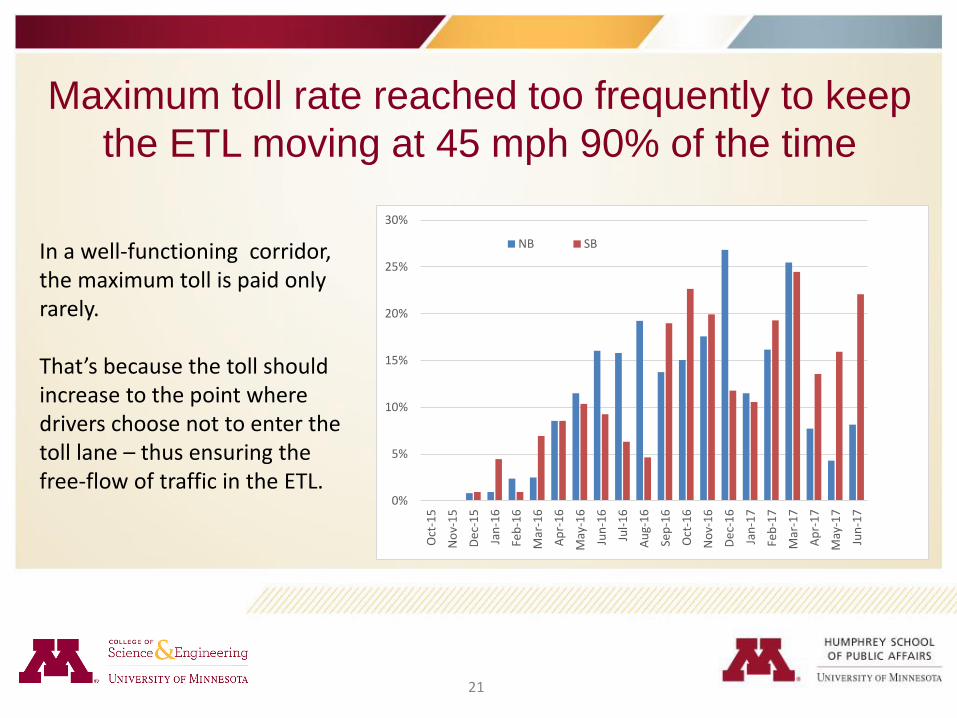
Maximum toll rate reached too frequently to keep
the ETL moving at 45 mph 90% of the time
In a well-functioning corridor, the maximum toll is paid only rarely.
That’s because the toll should increase to the point where drivers choose not to enter the toll lane – thus ensuring the free-flow of traffic in the ETL.
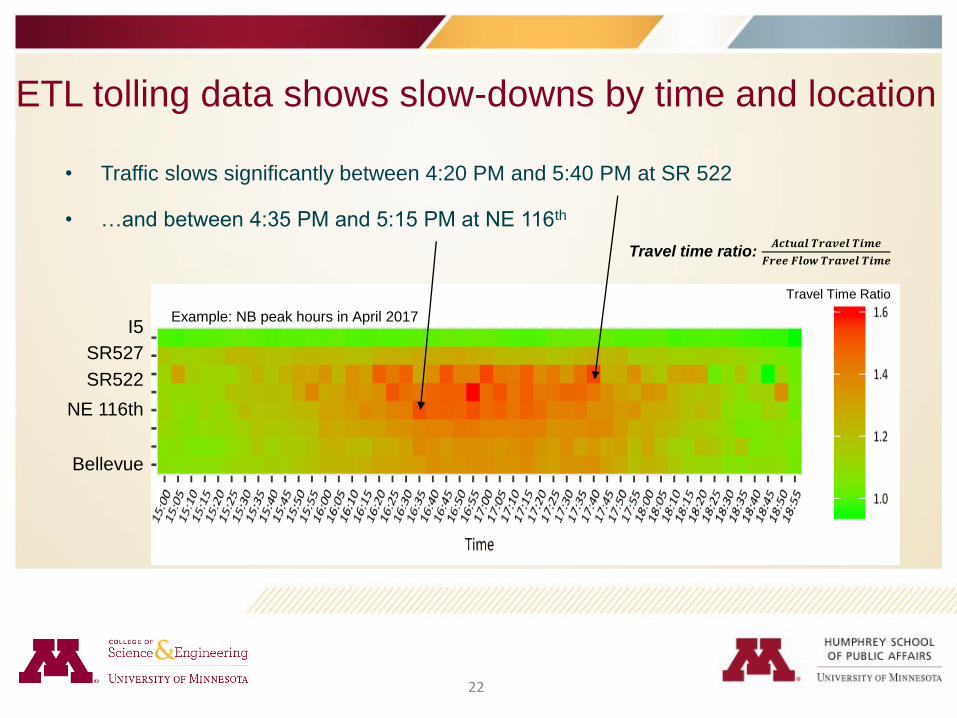
• Traffic slows significantly between 4:20 PM and 5:40 PM at SR 522
• …and between 4:35 PM and 5:15 PM at NE 116th
Travel time ratio: 𝑨𝒄𝒕𝒖𝒂𝒍 𝑻𝒓𝒂𝒗𝒆𝒍 𝑻𝒊𝒎𝒆
𝑭𝒓𝒆𝒆 𝑭𝒍𝒐𝒘 𝑻𝒓𝒂𝒗𝒆𝒍 𝑻𝒊𝒎𝒆
Travel Time Ratio
Bellevue
SR522
SR527
NE 116th
I5
22
ETL tolling data shows slow-downs by time and location
Example: NB peak hours in April 2017
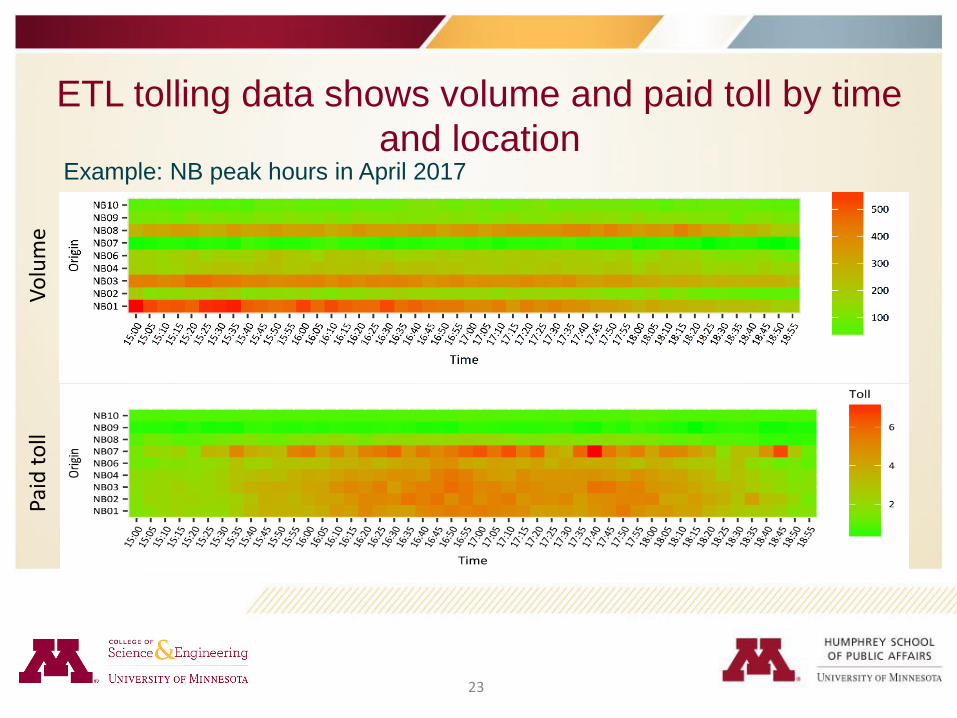
Example: NB peak hours in April 2017
23
ETL tolling data shows volume and paid toll by time
and location
Paid
to
ll
Vo
lum
e
24
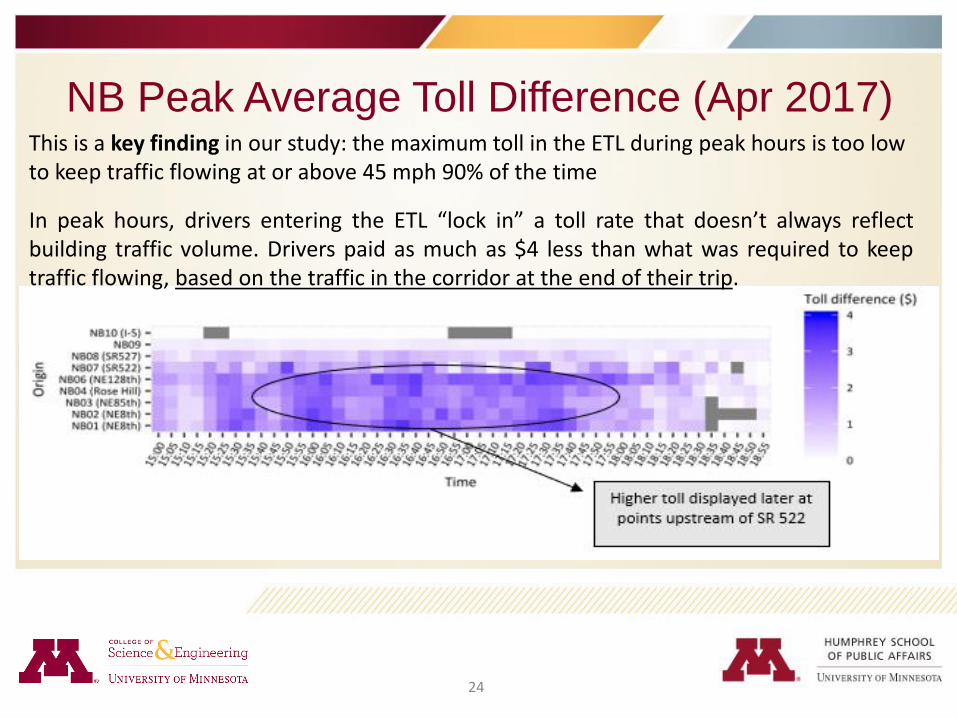
NB Peak Average Toll Difference (Apr 2017)This is a key finding in our study: the maximum toll in the ETL during peak hours is too low to keep traffic flowing at or above 45 mph 90% of the time
In peak hours, drivers entering the ETL “lock in” a toll rate that doesn’t always reflectbuilding traffic volume. Drivers paid as much as $4 less than what was required to keeptraffic flowing, based on the traffic in the corridor at the end of their trip.
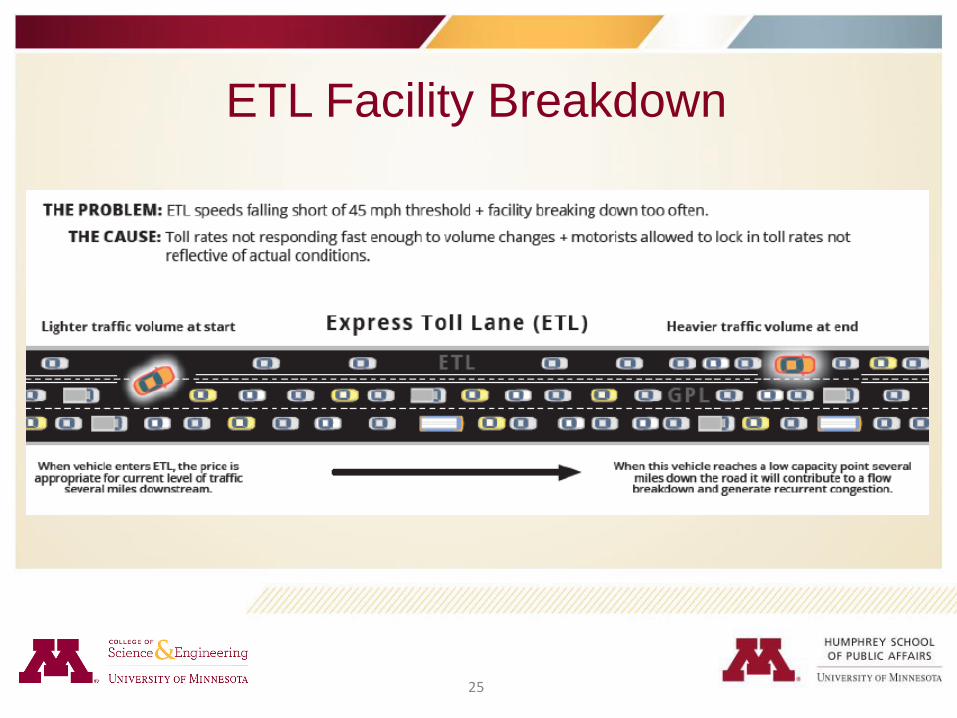
25
ETL Facility Breakdown
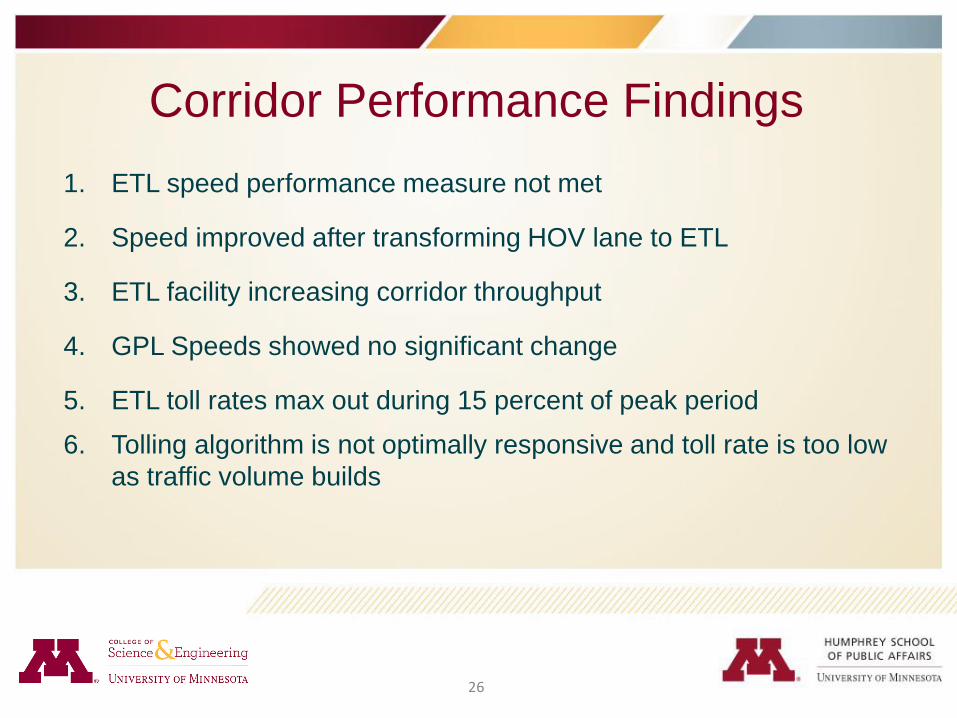
1. ETL speed performance measure not met
2. Speed improved after transforming HOV lane to ETL
3. ETL facility increasing corridor throughput
4. GPL Speeds showed no significant change
5. ETL toll rates max out during 15 percent of peak period
6. Tolling algorithm is not optimally responsive and toll rate is too low
as traffic volume builds
26
Corridor Performance Findings
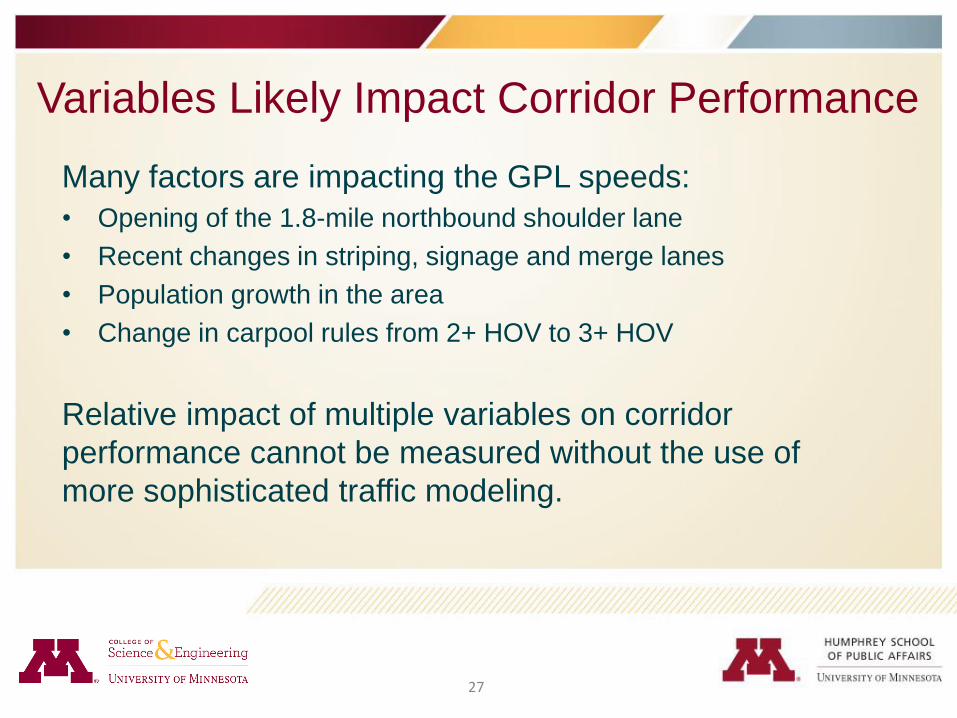
Many factors are impacting the GPL speeds:
• Opening of the 1.8-mile northbound shoulder lane
• Recent changes in striping, signage and merge lanes
• Population growth in the area
• Change in carpool rules from 2+ HOV to 3+ HOV
Relative impact of multiple variables on corridor
performance cannot be measured without the use of
more sophisticated traffic modeling.
27
Variables Likely Impact Corridor Performance
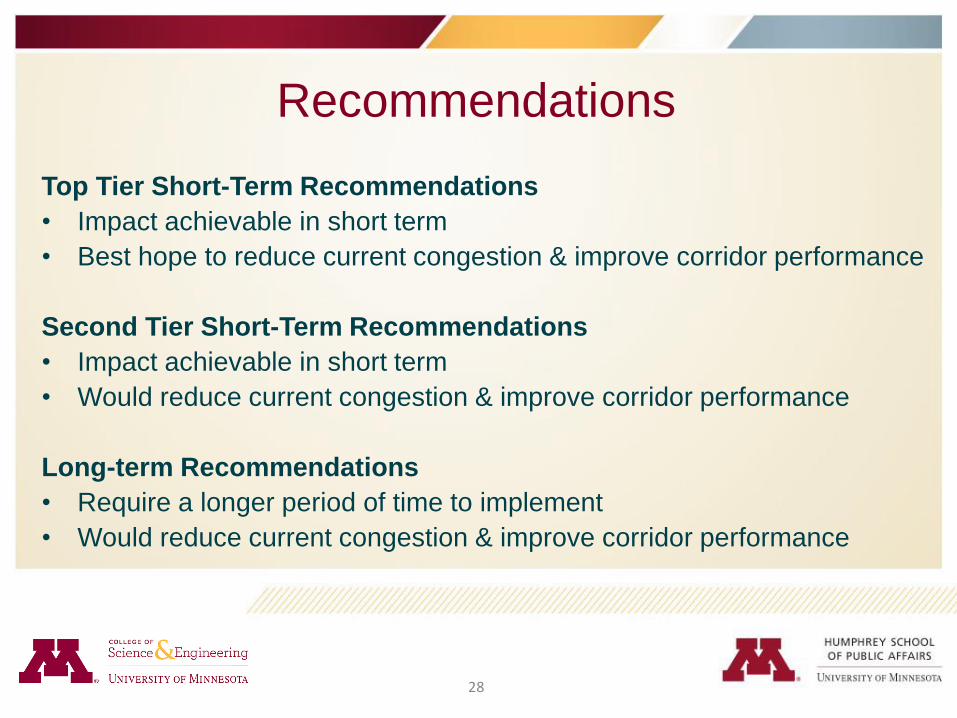
Top Tier Short-Term Recommendations
• Impact achievable in short term
• Best hope to reduce current congestion & improve corridor performance
Second Tier Short-Term Recommendations
• Impact achievable in short term
• Would reduce current congestion & improve corridor performance
Long-term Recommendations
• Require a longer period of time to implement
• Would reduce current congestion & improve corridor performance
28
Recommendations
1) Improve ETL speed though a more responsive dynamic toll algorithm
The tolling algorithm is not optimally responsive and is too low as ETL traffic volume builds.
Particularly during peak travel times, the toll algorithm and pricing is not adequately controlling input traffic along the ETL, which in turn can result in unmanageable ETL congestion and break down – and thus unacceptably low average ETL vehicle speeds.
This is a short-term recommendation. It could be implemented without new infrastructure investment. However, it may require additional study focused on the specifics how WSDOT would make its toll algorithm more responsive to volume changes.
• Impact achievable in short term
• Additional study recommended
• $ (relatively low cost compared with other recommendations)
29
Recommendations (Top Tier)
2) Improve ETL speed through segmented corridor tollingTraffic conditions and volumes can change considerably along the 17-mile tolled corridor – especially during peak periods.
Applying tolls on a segment-by-segment basis, with segment-specific toll rates that are more reflective of real-time traffic conditions and volumes, will improve ETL speeds and corridor performance overall.
An electronic dynamic pricing sign would advise motorists entering the facility of segment-specific toll rates. The toll rates for each segment would be updated every few minutes based upon the volume in each segment.
Although it would involve certain infrastructure enhancements, such as additional dynamic pricing signs and access points through striping, these changes are relatively simple compared to past facility adjustments. However, this change in WSDOT’s business rule would require clear communication with motorists who currently expect to lock in a corridor-long toll rate.
• Impact achievable in short term
• Additional study recommended
• $$ (relatively moderate cost compared with other recommendations)
30
Recommendations (Top Tier)
3) Move toward an “open access” ETL facility to smooth lane transferThe ETL facility currently is striped to limit entrance from and exit to the GPL. Controlling the flow of traffic between lanes has advantages, especially in situations where prevailing lane speed can contrast considerably.
Limiting the number of entrance and exit points can concentrate lane transfer and actually impede traffic flow and reduce speed overall. Therefore, we believe that implementing an open access strategy on some parts of the ETL facility could improve traffic flow and throughput.
Although this recommendation can be considered short-term in nature, further study of how best to apply an open access approach may reveal corridor segments where restricted ETL access remains beneficial.
• Impact achievable in short term
• Additional study recommended
• $$ (relatively moderate cost compared with other recommendations)
31
Recommendations (Top Tier)
4) Increase maximum toll rate to reduce ETL breakdownAnalysis reveals that the maximum toll rate was applied on average 15 percent of the time in either direction during the study period. The maximum toll rate set in administrative rule is $10.
For dynamically-priced toll facilities such as the I-405 ETL, the goal is to reach the maximum toll rate only rarely. Reaching the maximum toll rate is problematic from a traffic management standpoint, because once the maximum is reached the lane volume can no longer be managed through pricing to ensure ETL speed. This phenomenon is known as a facility breakdown.
The combination of a more responsive dynamic toll algorithm and application of toll rates by segment should significantly reduce congestion in the ETL, and thus reduce the frequency the $10 maximum toll rate is charged. However, to ensure ETL speed and facility performance during the most adverse traffic conditions, an increased maximum toll rate is recommended.
• Impact achievable in short term
• Additional study recommended
• $ (relatively low cost compared with other recommendations)
32
Recommendations (Top Tier)
5) Adjust AM peak period times to increase ETL speedExtending the AM peak period for an additional hour in order to remove 2+ HOVs during this time would improve ETL performance by reducing the frequency and/or intensity of ETL breakdown.
The AM peak period is currently defined as 5AM to 9AM, Monday through Friday. However, analysis reveals that traffic volumes along the corridor are consistent with peak period condition between 9AM and 10AM – and significantly greater between 9AM and 10AM than between 5AM and 6AM.
Although ETL toll rates apply to motorists in these lanes throughout each weekday, 2+ HOV motorists are allowed into the ETL facility without paying a toll during non-peak hours. As such, the current AM peak period hours restrict free use of the ETL facility for 2+ HOV motorists at a time when the facility could support them (5-6AM), and they permit 2+ HOV motorists to use the facility for free at a time when the facility is congested, and therefore doesn’t have the capacity to support them (9-10AM).
Either recommendation would help alleviate AM peak period congestion in the ETL.
• Impact achievable in short term
• Additional study recommended
• $ (relatively low cost compared with other recommendations)
33
Recommendations (Second Tier)

6) Extend second full ETL in each direction to improve ETL speedCongestion pricing approaches such as the ETL facility offer the dual promise of predictable ETL drive time and increased throughput.
Extending two full ETLs from 160 Street NE in Woodinville to I-5 in Lynnwood should remove current ETL bottleneck conditions and improve the flow of traffic along the ETL facility – likely producing improved ETL speeds and overall corridor traffic throughput.
Optimal design of the additional ETLs would require in-depth traffic modeling and scenario analysis, and construction would take additional time. Nonetheless, congestion pricing has and will continue to improve traffic performance along and the I-405 corridor.
• Impact achievable in long term
• Additional study recommended
• $$$ (relatively high cost compared with other recommendations)
34
Recommendations (Long Term)
7) Add Capacity to Ensure Lane Continuity and Ease Bottlenecks
Bottlenecks occur in areas where traffic volumes converge – be it through lane loss, on
ramps, etc. The I-405 corridor includes a number of bottlenecks in both the GPL and ETL,
and it may be beneficial to add lane capacity in areas with bottlenecks to improve corridor
continuity. We recommend studying this issue to better inform a final decision on the
question.
This is a long-term recommendation, because it would require time to study where and
how GPLs should be expanded, and additional time to construct GPL expansions.
• Impact achievable in long term
• Additional study recommended
• $$$ (relatively high cost compared with other recommendations)
35
Recommendations (Long Term)
8) Increase transit options to improve throughput and speed
VMT growth along the I-405 corridor is well outpacing statewide and national averages.
Maintaining and improving long-term corridor performance requires a balanced approach
of roadway infrastructure improvements and transit options. Research conducted by
others has found that well-designed transit options can help move more people through a
corridor in fewer vehicles.
Implementation of I-405 master plan transit improvements will reduce congestion and
increase passenger throughput in the high-growth corridor. Impact achievable in long
term.
• Full impact achievable in long term
• Additional study recommended
• $$ (relatively moderate cost compared with other recommendations)
36
Recommendations (Long Term)
The I-405 ETL facility is meeting statutory performance measure related to financial sustainability, but not the performance measure related to average ETL speeds.
• Due in part to overall traffic volume growth and a toll rate algorithm and pricing not adequately responsive to rapidly-increasing traffic volume during peak periods
• Findings suggest that a number of adjustments could be made that should lead to both of the primary statutory performance measures being met
As time passes and conditions change, even the most sophisticated ETL facilities require regular adjustments.
• Particularly true of those operating in traffic corridors like the I-405 corridor that serve rapidly growing regions.
• Recommendations should be considered part of the natural evolution of the corridor, not criticisms of work that has been done in the past.
• Implementation of recommendations should improve I-405 ETL performance and significantly increase throughput and efficiency
37
Conclusion

Matt Schmit, MPP (Project & Policy)
State & Local Policy Program
Humphrey School of Public Affairs
651-283-8404
Dr. Alireza Khani (Data)
Department of Civil, Environmental, and Geo-Engineering
University of Minnesota
612-624-4411
38
Questions?