Embed Size (px)
Citation preview

20120618

Table of Contents
i
Table of Contents
Acknowledgements ......................................................................................................................... xi
Executive Summary ......................................................................................................................... ES-1 Path to Study Recommendations ........................................................................................... ES-1 Recommendations for Enhanced Mobility on I-66 Inside the Beltway ............................ ES-6 Conclusions ............................................................................................................................... ES-7
1.0 Introduction .............................................................................................................................. 1-1 1.1 Project Goal ..................................................................................................................... 1-1 1.2 Oversight and Coordination ......................................................................................... 1-3 1.3 Overview of Work Program ......................................................................................... 1-4 1.4 Summary of the Interim Report ................................................................................... 1-6 1.5 Organization of the Final Report ................................................................................. 1-6
2.0 Mobility Options ...................................................................................................................... 2-1 2.1 Approach to Selecting Mobility Options .................................................................... 2-1 2.2 Evaluation Process for the Mobility Options ............................................................. 2-8 2.3 Evaluation of Mobility Options .................................................................................... 2-15 2.4 Mobility Option Summary Findings ........................................................................... 2-33
3.0 Multimodal Packages .............................................................................................................. 3-1 3.1 Approach to Building Multimodal Packages ............................................................. 3-1 3.2 Approach to Evaluating Multimodal Packages ......................................................... 3-4 3.3 Baseline Assumptions for 2040 ..................................................................................... 3-11 3.4 Package 1 – Support of I-66 HOT/HOV/Bus Lanes ................................................. 3-22 3.5 Package 2 – Support of Widen I-66 HOT/HOV/Bus Lanes .................................... 3-31 3.6 Package 3 – Support of Added HOV/Bus Lane to I-66 ............................................ 3-41 3.7 Package 4 – Support of Enhanced Bus Service ........................................................... 3-49 3.8 Integrated Corridor Management ................................................................................ 3-59 3.9 Transportation Demand Management ........................................................................ 3-67 3.10 Bicycle and Pedestrian System Enhancements .......................................................... 3-75 3.11 Multimodal Packages Summary Findings .................................................................. 3-97 3.12 Sensitivity Tests .............................................................................................................. 3-101
4.0 Recommendations .................................................................................................................... 4-1 4.1 Core Recommendations ................................................................................................ 4-2 4.2 Package Recommendations .......................................................................................... 4-3 4.3 Bicycle and Pedestrian System Enhancements .......................................................... 4-17 4.4 Transportation Demand Management ........................................................................ 4-20
Table of Contents
ii I-66 Multimodal Study
Table of Contents (continued)
4.5 Integrated Corridor Management ................................................................................ 4-21 4.6 Conclusion ....................................................................................................................... 4-22
5.0 Potential Funding Approaches .............................................................................................. 5-1 5.1 Summary of Revenue Options ..................................................................................... 5-1 5.2 Summary of Financing Options ................................................................................... 5-7 5.3 Evaluating Funding Options ........................................................................................ 5-7
Appendix A – Public Information and Participation Report ..................................................... A-1
Appendix B – Market Research Final Report ............................................................................... B-1
Appendix C – Travel Demand Forecasting Model Validation .................................................. C-1
Appendix D – Package Component Costs .................................................................................... D-1
Appendix E – Existing and Potential Funding Options ............................................................. E-1
List of Tables
I-66 Multimodal Study iii
List of Tables
ES.1 Mobility Options ................................................................................................................... ES-4
ES.2 Recommended Multimodal Packages ............................................................................... ES-5
1.1 PARC Member Agencies ..................................................................................................... 1-3
2.1 Mobility Solutions and Mobility Option Elements .......................................................... 2-4
2.2 Mobility Options Determination ........................................................................................ 2-7
2.3 Mobility Options Measures of Effectiveness .................................................................... 2-34
3.1 Measures of Effectiveness Directional Overview ............................................................. 3-2
3.2 Recommended Packages ..................................................................................................... 3-4
3.3 BLOS Model Version 2.0 Components .............................................................................. 3-10
3.4 CLRP and CLRP+/Baseline Improvements ...................................................................... 3-12
3.5 Package 1 Transit Load Factors for the Morning Peak Period ....................................... 3-26
3.6 Package 1 Cost Summary .................................................................................................... 3-31
3.7 Package 2 Transit Load Factors for the Morning Peak Period ....................................... 3-35
3.8 Package 2 Cost Summary .................................................................................................... 3-40
3.9 Package 3 Transit Load Factors for the Morning Peak Period ....................................... 3-44
3.10 Package 3 Cost Summary .................................................................................................... 3-49
3.11 U.S. 50 Morning Peak-Period Transit Ridership by Cutline ........................................... 3-53
3.12 Package 4 Transit Load Factors for the Morning Peak Period ....................................... 3-54
3.13 Package 4 Cost Summary .................................................................................................... 3-59
3.14 ICM Pioneer Sites Summary Results .................................................................................. 3-67
3.15 I-66 Multimodal Study TDM Option Program Expenditures ........................................ 3-71
List of Tables
iv I-66 Multimodal Study
List of Tables (continued)
3.16 Annual Regional TDM Program Expenditures – Existing and Proposed .................... 3-72
3.17 Daily Trips with Origin or Destination in the Study Area (2040) .................................. 3-72
3.18 TDM Strategy Evaluation Parameters ............................................................................... 3-73
3.19 TDM 2040 Results ................................................................................................................. 3-74
3.20 Map Key for Bicycle and Pedestrian System Enhancements .......................................... 3-76
3.21 2040 Benefit Calculations for Bicycle and Pedestrian System Enhancements.............. 3-85
3.22 2040 Cost Estimates for Bicycle and Pedestrian System Enhancements ....................... 3-88
3.23 Bicycle and Pedestrian Prioritization Criteria and Tiered Scoring ................................ 3-91
3.24 Prioritized Bicycle and Pedestrian System Enhancements ............................................. 3-92
3.25 Bicycle Projects Grouped by Trip Orientation Served ..................................................... 3-95
3.26 Measures of Effectiveness Summary ................................................................................. 3-98
3.27 Sensitivity Tests Measures of Effectiveness Summary .................................................... 3-103
4.1 Multimodal Package Summary Selection of Measures ................................................... 4-12
4.2 Multimodal Package Summary Recommendations Framework ................................... 4-14
4.3 Bicycle Projects Prioritized by Combined Score ............................................................... 4-19
4.4 TDM Recommendation Priority Groups ........................................................................... 4-21
5.1 Current Rates and Estimates Yields for State User Fees ................................................. 5-3
5.2 Projected Revenues to the Transportation Trust Fund (FY 2012) .................................. 5-3
5.3 Summary of Agencies Planning, Operating, and Funding Public Transit in the I-66 Corridor, Inside the Beltway ....................................................................................... 5-4
5.4 Potential Revenue Options for I-66 Multimodal Study Recommendations ................. 5-6
List of Tables
I-66 Multimodal Study v
List of Tables (continued)
5.5 National Experience with Revenue Options for I-66 Multimodal Study Recommendations ..................................................................................................... 5-10
5.6 Rating Definitions for Revenue Evaluation Criteria ........................................................ 5-11

List of Tables
vi I-66 Multimodal Study
This page intentionally left blank.
List of Figures
I-66 Multimodal Study vii
List of Figures
ES.1 Path to Recommendations ................................................................................................. ES-2
ES.2 Process to Identify Issues and Needs ............................................................................... ES-3
2.1 Issues and Needs Translation to Mobility Solutions ...................................................... 2-2
2.2 Abbreviated Model Process for Testing Mobility Options ........................................... 2-10
2.3 Cutline Locations................................................................................................................. 2-12
2.4 Peak-Hour Metrorail Service Supplied by Cutline ......................................................... 2-14
2.5 Peak-Hour Bus Service Supplied by Cutline ................................................................... 2-14
2.6 HOV Restrictions – Option A ............................................................................................ 2-15
2.7 Daily PMT – Option A ........................................................................................................ 2-16
2.8 I-66 Bus/HOV/HOT Lane System – Option B1 ............................................................. 2-17
2.9 Daily PMT – Option B1 ...................................................................................................... 2-18
2.10 I-66 Bus/HOV/HOT Lane System – Option B2 ............................................................. 2-19
2.11 Morning Peak Period VMT by Level of Service – Option B2 ........................................ 2-20
2.12 I-66 Capacity Enhancement – Option C1 ......................................................................... 2-21
2.13 Daily PMT – Option C1 ...................................................................................................... 2-22
2.14 I-66 Capacity Enhancement – Option C2 ......................................................................... 2-23
2.15 Morning Peak Period VMT by Level of Service – Option C2 ....................................... 2-24
2.16 Morning Peak Period VMT by Level of Service – Option E .......................................... 2-26
2.17 Interline Connection – Option F ........................................................................................ 2-28
2.18 Daily PMT – Option F ......................................................................................................... 2-29
2.19 Person Throughput at Clarendon Cutline – Option G .................................................. 2-32
List of Figures
viii I-66 Multimodal Study
List of Figures (continued)
3.1 Travel Demand Forecasting Model Process Overview .................................................. 3-6
3.2 CLRP+ Baseline VMT by Level of Service ....................................................................... 3-14
3.3 CLRP+ Baseline Daily PMT ............................................................................................... 3-15
3.4 CLRP+ Baseline Improved Travel Time by Mode Compared to Existing 2007 ......... 3-15
3.5 CLRP+ Baseline I-66 Level of Service Morning Peak Hour .......................................... 3-17
3.6 CLRP+ Baseline Arterial Level of Service Morning Peak Hour Inbound ................... 3-18
3.7 CLRP+ Baseline Arterial Level of Service Morning Peak Hour Outbound ................ 3-19
3.8 CLRP+ Baseline Inbound Trains Per Hour in the Morning Peak Hour ...................... 3-20
3.9 CLRP+ Baseline Inbound Buses Per Hour in the Morning Peak Hour ....................... 3-21
3.10 Package 1 I-66 HOT/HOV/Bus Lanes ............................................................................. 3-22
3.11 Package 1 Peak Periods VMT by Level of Service .......................................................... 3-23
3.12 Package 1 Daily PMT .......................................................................................................... 3-24
3.13 Package 1 Improved Travel Time by Mode Compared to CLRP+ .............................. 3-24
3.14 Package 1 I-66 Level of Service Morning Peak Hour ..................................................... 3-27
3.15 Package 1 Arterial Level of Service Morning Peak Hour Inbound .............................. 3-28
3.16 Package 1 Arterial Level of Service Morning Peak Hour Outbound ........................... 3-29
3.17 Package 1 Inbound Buses Per Hour in the Morning Peak Hour .................................. 3-30
3.18 Package 2 Widen I-66 HOT/HOV/Bus Lanes ................................................................ 3-32
3.19 Package 2 Peak Periods VMT by Level of Service .......................................................... 3-33
3.20 Package 2 Daily PMT .......................................................................................................... 3-33
3.21 Package 2 Improved Travel Time by Mode Compared to CLRP+ .............................. 3-34
3.22 Package 2 I-66 Level of Service Morning Peak Hour ..................................................... 3-36
List of Figures
I-66 Multimodal Study ix
List of Figures (continued)
3.23 Package 2 Arterial Level of Service Morning Peak Hour Inbound ............................ 3-37
3.24 Package 2 Arterial Level of Service Morning Peak Hour Outbound ........................... 3-38
3.25 Package 2 Inbound Buses per Hour in the Morning Peak Hour .................................. 3-39
3.26 Package 3 Added HOV/Bus Lane to I-66 ........................................................................ 3-41
3.27 Package 3 Peak Periods VMT by Level of Service .......................................................... 3-42
3.28 Package 3 Daily PMT .......................................................................................................... 3-43
3.29 Package 3 Improved Travel Time by Mode Compared to CLRP+ .............................. 3-43
3.30 Package 3 I-66 Level of Service Morning Peak Hour ..................................................... 3-45
3.31 Package 3 Arterial Level of Service Morning Peak Hour Inbound ............................ 3-46
3.32 Package 3 Arterial Level of Service Morning Peak Hour Outbound ........................... 3-47
3.33 Package 3 Inbound Buses per Hour in the Morning Peak Hour .................................. 3-48
3.34 Package 4 Peak Periods VMT by Level of Service .......................................................... 3-51
3.35 Package 4 Daily PMT .......................................................................................................... 3-52
3.36 Package 4 Improved Travel Time by Mode Compared to CLRP+ .............................. 3-52
3.37 Package 4 I-66 Level of Service Morning Peak Hour ..................................................... 3-55
3.38 Package 4 Arterial Level of Service Morning Peak Hour Inbound ............................ 3-56
3.39 Package 4 Arterial Level of Service Morning Peak Hour Outbound ........................... 3-57
3.40 Package 4 Inbound Buses per Hour in the Morning Peak Hour .................................. 3-58
3.41 Multimodal Travel Times on Dynamic Message Signs ................................................. 3-61
3.42 I-66 ATM Project Segments and Treatments ................................................................... 3-63
3.43 Bicycle and Pedestrian Facilities ....................................................................................... 3-80
3.44 2040 BLOS Without Improvements .................................................................................. 3-82
List of Figures
x I-66 Multimodal Study
List of Figures (continued)
3.45 2040 BLOS With Improvements ........................................................................................ 3-83
3.46 Map of Bicycle Projects Grouped by Trip Orientation Served ..................................... 3-94
3.47 Sensitivity Test 1: Modified Configuration for Package 1 ............................................ 3-101
3.48 Sensitivity Test 2: Modified Configuration for Package 3 ............................................ 3-102
4.1 Map of Bicycle Projects Prioritized by Combined Score ............................................... 4-18
5.1 Virginia Transportation Finance Map .............................................................................. 5-2
Acknowledgments
I-66 Multimodal Study xi
Acknowledgments
The I-66 Multimodal Study is the product of contributions by a large number of individuals. Significant contributions included those made by the following employees of the Lead Agencies and Consultant Team.
LEAD AGENCIES Virginia Department of Transportation Valerie Pardo, Project Manager Bud Siegel, P.E. Kanathur (Kanti) Srikanth Bahram Jamei, Ph.D, P.E. Robert Moore Cindy Engelhart, P.E.
Virginia Department of Rail and Public Transportation Anthony Foster Amy Inman, M.S.
CONSULTANT TEAM Cambridge Systematics, Inc. John (Jay) Evans, P.E., AICP, Project Manager Jack Henneman, Principal-in-Charge Daniel Goldfarb, P.E., Deputy Project Manager Jocelyn Hoffman Dalia Leven, AICP Nicole Waldheim and Susan Binder Stacy Cook Rosemary Dolphin Nathan Hutson David Jackson, AICP Jennifer Moynihan Christopher Porter Nikhil Puri Elizabeth Sanford KFH Group, Inc. Sue Knapp Jill Stober MCV Associates, Inc. Joe Mehra, P.E., PTOE Reju Radhakrishnan
Rummel, Klepper, & Kahl, LLP Tom Heil, P.E. Anand Patel, P.E. Kavya Sambana, EIT Govind Vadakpat, P.E., PTOE Alan Cunningham, AICP, LEED-AP Jingui Hwang Sharp & Company, Inc. Susan Sharp Mary Arzt Charise Geiling Shelley Johnson Southeastern Institute of Research, Inc. Karen Smith, Ph.D. Toole Design Group LLC R.J. Eldridge Trevor Griffiths, GISP
OTHERS Special thanks also to the members of the Participating Agency Representatives Committee, stakeholder interviewees, and involved members of the public.

Acknowledgements
xii I-66 Multimodal Study
This page intentionally left blank.
Executive Summary
ES-1
Executive Summary
The Virginia Department of Transportation (VDOT) and the Department of Rail and Public Transportation (DRPT) commissioned the I-66 Multimodal Study to address long-term multimodal needs within the I-66 corridor inside the Beltway. This study builds on the recommendations of the 2005 Idea-66 Study and the 2009 I-66 Transit/TDM Study, and fulfills the commitment made to the National Capital Regional Transportation Planning Board (TPB) in TPB Resolution R12-2009.1
The goal of the I-66 Multimodal Study was to:
Identify a range of current and visionary multimodal and corridor management solutions (operational, transit, bike, and pedestrian, in addition to highway improvements) that can be implemented to reduce highway and transit congestion and improve overall mobility within the corridor and along major arterial roadways and bus routes within the study area.
Building on the region’s 2011 Financially Constrained Long Range Plan (CLRP), the study considered a wide range of complementary and mutually supportive multimodal improvement options, balancing the needs and priorities of users and nearby residents. A multitude of options for improvement were considered, including expanded public transportation, additional highway lane capacity, transportation demand management (TDM), high-occupancy vehicle (HOV) policies, high-occupancy/toll (HOT) policies, congestion pricing, managed lanes, integrated corridor management (ICM), and bicycle and pedestrian corridor access.
This final report provides a summary of the year-long I-66 Multimodal Study and includes recommendations and actions that address the study goals. An interim report was published in December 2011 that documents the long-term issues and needs of the corridor, the market research key findings, and the development of an evaluation methodology to formulate and assess the mobility options and multimodal mobility option packages.
Path to Study Recommendations
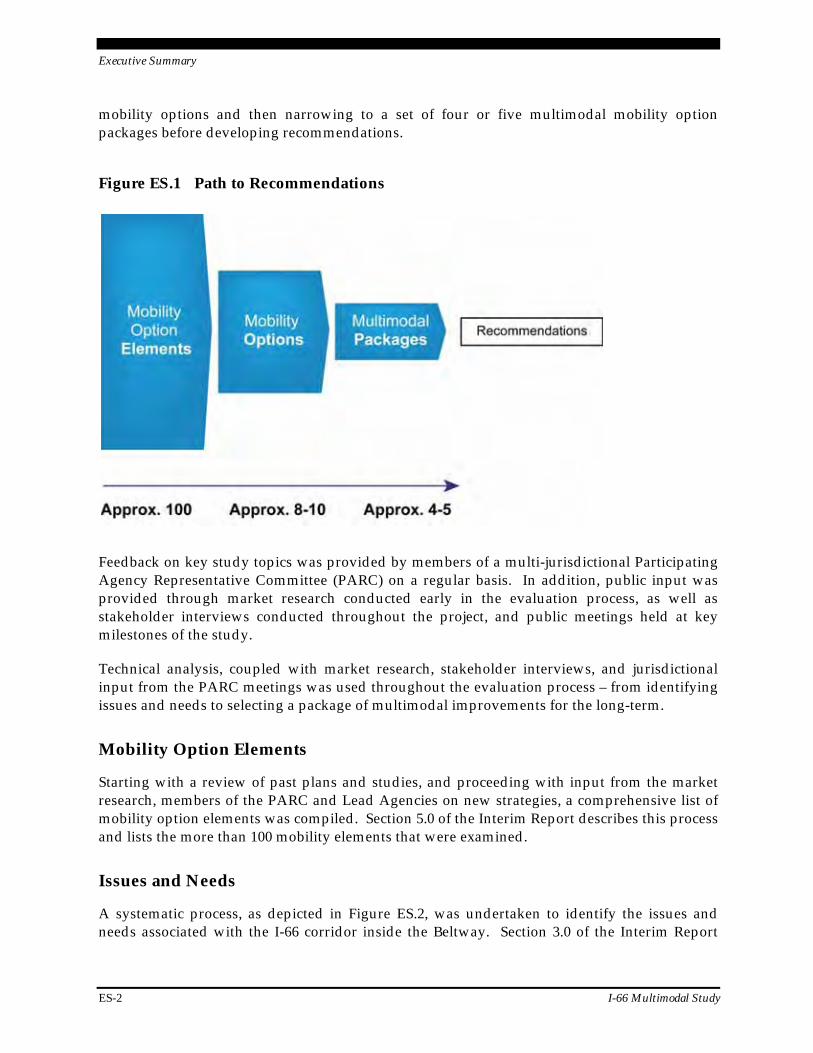
The path to developing a final set of recommendations was organized around a structured process for arriving at a set of multimodal solutions. Issues and needs germane to the study area were identified. Subsequently, an evaluation process, illustrated in Figure ES.1, provided a means to move from a starting point of numerous ideas – referred to as mobility option elements – down a path to recommendations, considering first a set of eight to ten discrete
1 National Capital Region Transportation Planning Board, Resolution on Inclusion in Air Quality
Conformity Analysis of Submissions for the 2009 Constrained Long Rang Plan (CLRP) and FY 2010-2015 Transportation Improvement program (TIP). TPB Resolution R12-2009, March 18, 2009.
Executive Summary
ES-2 I-66 Multimodal Study
mobility options and then narrowing to a set of four or five multimodal mobility option packages before developing recommendations.
Figure ES.1 Path to Recommendations
Feedback on key study topics was provided by members of a multi-jurisdictional Participating Agency Representative Committee (PARC) on a regular basis. In addition, public input was provided through market research conducted early in the evaluation process, as well as stakeholder interviews conducted throughout the project, and public meetings held at key milestones of the study.
Technical analysis, coupled with market research, stakeholder interviews, and jurisdictional input from the PARC meetings was used throughout the evaluation process – from identifying issues and needs to selecting a package of multimodal improvements for the long-term.
Mobility Option Elements
Starting with a review of past plans and studies, and proceeding with input from the market research, members of the PARC and Lead Agencies on new strategies, a comprehensive list of mobility option elements was compiled. Section 5.0 of the Interim Report describes this process and lists the more than 100 mobility elements that were examined.
Issues and Needs
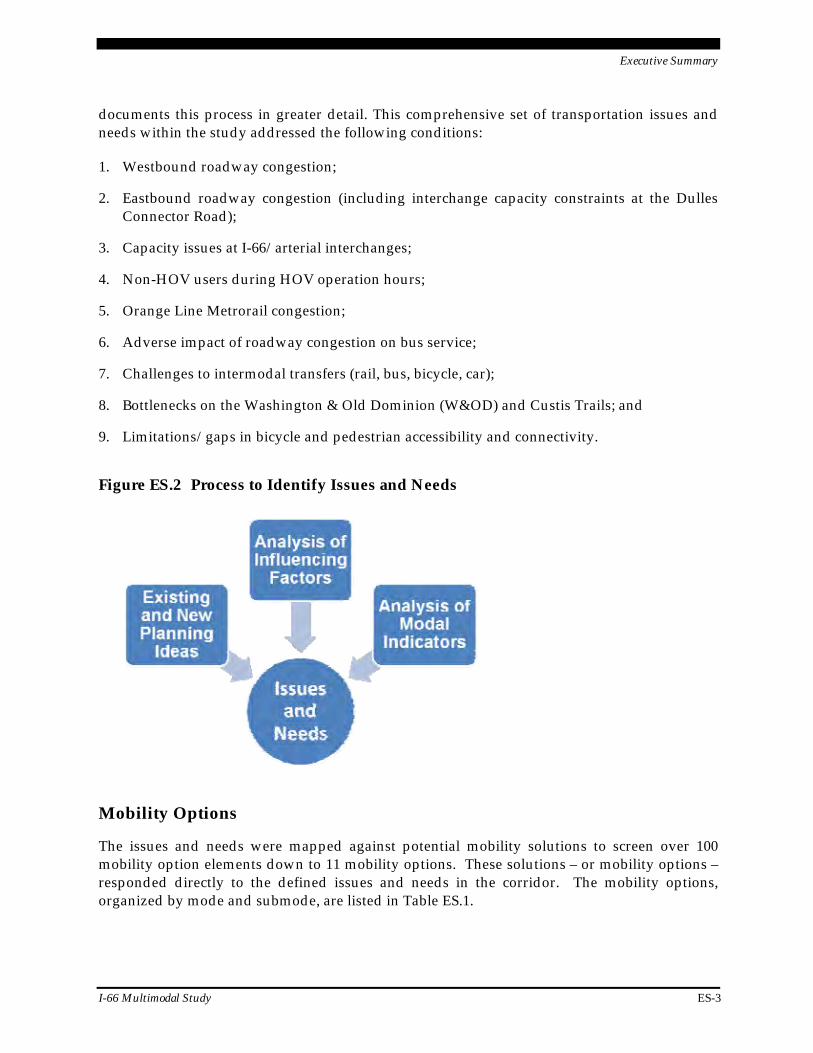
A systematic process, as depicted in Figure ES.2, was undertaken to identify the issues and needs associated with the I-66 corridor inside the Beltway. Section 3.0 of the Interim Report
Executive Summary
I-66 Multimodal Study ES-3
documents this process in greater detail. This comprehensive set of transportation issues and needs within the study addressed the following conditions:
1. Westbound roadway congestion;
2. Eastbound roadway congestion (including interchange capacity constraints at the Dulles Connector Road);
3. Capacity issues at I-66/arterial interchanges;
4. Non-HOV users during HOV operation hours;
5. Orange Line Metrorail congestion;
6. Adverse impact of roadway congestion on bus service;
7. Challenges to intermodal transfers (rail, bus, bicycle, car);
8. Bottlenecks on the Washington & Old Dominion (W&OD) and Custis Trails; and
9. Limitations/gaps in bicycle and pedestrian accessibility and connectivity.
Figure ES.2 Process to Identify Issues and Needs
Mobility Options
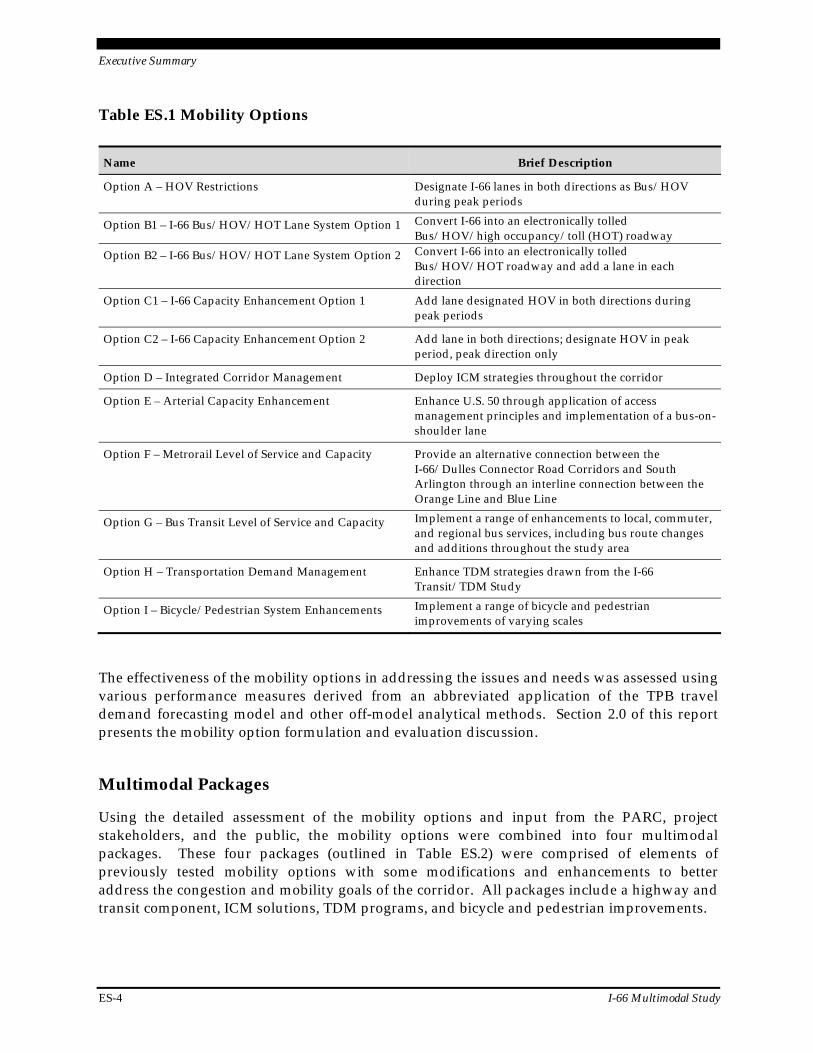
The issues and needs were mapped against potential mobility solutions to screen over 100 mobility option elements down to 11 mobility options. These solutions – or mobility options – responded directly to the defined issues and needs in the corridor. The mobility options, organized by mode and submode, are listed in Table ES.1.
Executive Summary
ES-4 I-66 Multimodal Study
Table ES.1 Mobility Options
Name Brief Description
Option A – HOV Restrictions Designate I‐66 lanes in both directions as Bus/HOV during peak periods
Option B1 – I-66 Bus/HOV/HOT Lane System Option 1 Convert I‐66 into an electronically tolled Bus/HOV/high occupancy/toll (HOT) roadway
Option B2 – I-66 Bus/HOV/HOT Lane System Option 2 Convert I‐66 into an electronically tolled Bus/HOV/HOT roadway and add a lane in each direction
Option C1 – I-66 Capacity Enhancement Option 1 Add lane designated HOV in both directions during peak periods
Option C2 – I-66 Capacity Enhancement Option 2 Add lane in both directions; designate HOV in peak period, peak direction only
Option D – Integrated Corridor Management Deploy ICM strategies throughout the corridor
Option E – Arterial Capacity Enhancement Enhance U.S. 50 through application of access management principles and implementation of a bus-on-shoulder lane
Option F – Metrorail Level of Service and Capacity Provide an alternative connection between the I-66/Dulles Connector Road Corridors and South Arlington through an interline connection between the Orange Line and Blue Line
Option G – Bus Transit Level of Service and Capacity Implement a range of enhancements to local, commuter, and regional bus services, including bus route changes and additions throughout the study area
Option H – Transportation Demand Management Enhance TDM strategies drawn from the I-66 Transit/TDM Study
Option I – Bicycle/Pedestrian System Enhancements Implement a range of bicycle and pedestrian improvements of varying scales
The effectiveness of the mobility options in addressing the issues and needs was assessed using various performance measures derived from an abbreviated application of the TPB travel demand forecasting model and other off-model analytical methods. Section 2.0 of this report presents the mobility option formulation and evaluation discussion.
Multimodal Packages
Using the detailed assessment of the mobility options and input from the PARC, project stakeholders, and the public, the mobility options were combined into four multimodal packages. These four packages (outlined in Table ES.2) were comprised of elements of previously tested mobility options with some modifications and enhancements to better address the congestion and mobility goals of the corridor. All packages include a highway and transit component, ICM solutions, TDM programs, and bicycle and pedestrian improvements.
Executive Summary
I-66 Multimodal Study ES-5
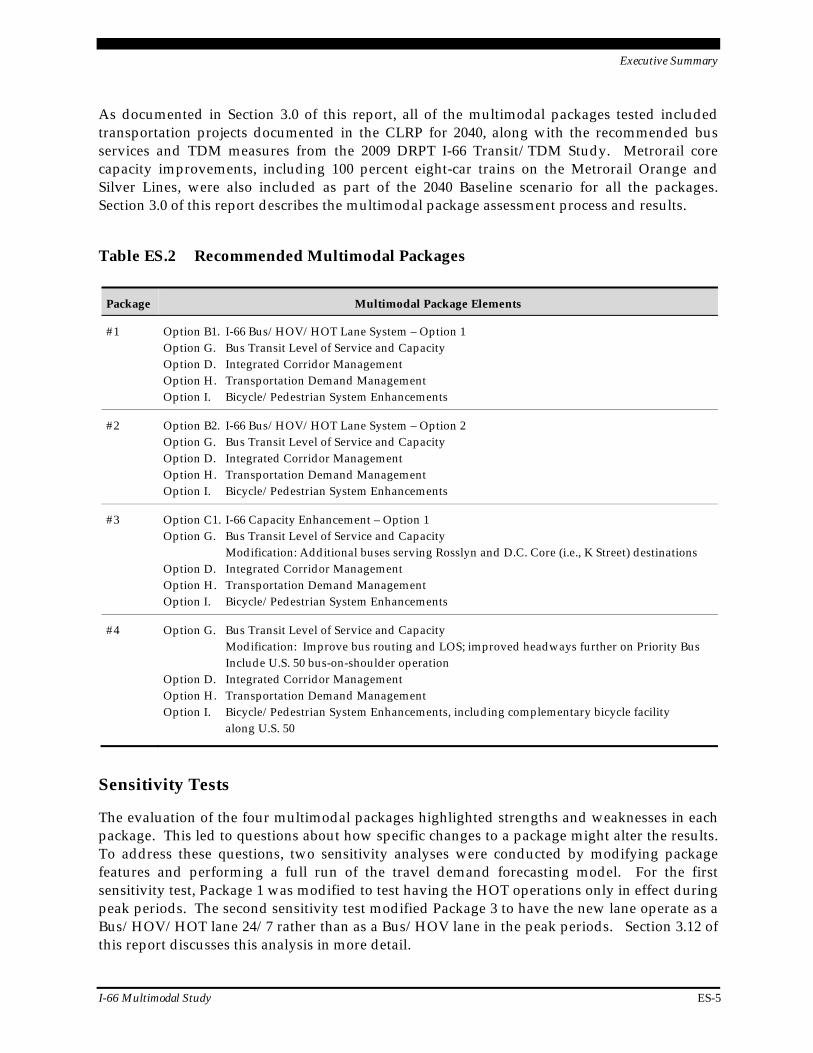
As documented in Section 3.0 of this report, all of the multimodal packages tested included transportation projects documented in the CLRP for 2040, along with the recommended bus services and TDM measures from the 2009 DRPT I-66 Transit/TDM Study. Metrorail core capacity improvements, including 100 percent eight-car trains on the Metrorail Orange and Silver Lines, were also included as part of the 2040 Baseline scenario for all the packages. Section 3.0 of this report describes the multimodal package assessment process and results.
Table ES.2 Recommended Multimodal Packages
Package Multimodal Package Elements
#1 Option B1. I-66 Bus/HOV/HOT Lane System – Option 1 Option G. Bus Transit Level of Service and Capacity Option D. Integrated Corridor Management Option H. Transportation Demand Management Option I. Bicycle/Pedestrian System Enhancements
#2 Option B2. I-66 Bus/HOV/HOT Lane System – Option 2 Option G. Bus Transit Level of Service and Capacity Option D. Integrated Corridor Management Option H. Transportation Demand Management Option I. Bicycle/Pedestrian System Enhancements
#3 Option C1. I-66 Capacity Enhancement – Option 1 Option G. Bus Transit Level of Service and Capacity Modification: Additional buses serving Rosslyn and D.C. Core (i.e., K Street) destinations Option D. Integrated Corridor Management Option H. Transportation Demand Management Option I. Bicycle/Pedestrian System Enhancements
#4 Option G. Bus Transit Level of Service and Capacity Modification: Improve bus routing and LOS; improved headways further on Priority Bus Include U.S. 50 bus-on-shoulder operation Option D. Integrated Corridor Management Option H. Transportation Demand Management Option I. Bicycle/Pedestrian System Enhancements, including complementary bicycle facility
along U.S. 50
Sensitivity Tests
The evaluation of the four multimodal packages highlighted strengths and weaknesses in each package. This led to questions about how specific changes to a package might alter the results. To address these questions, two sensitivity analyses were conducted by modifying package features and performing a full run of the travel demand forecasting model. For the first sensitivity test, Package 1 was modified to test having the HOT operations only in effect during peak periods. The second sensitivity test modified Package 3 to have the new lane operate as a Bus/HOV/HOT lane 24/7 rather than as a Bus/HOV lane in the peak periods. Section 3.12 of this report discusses this analysis in more detail.
Executive Summary
ES-6 I-66 Multimodal Study
Recommendations for Enhanced Mobility on I-66 Inside the Beltway
To formulate the final set of project recommendations, the study team considered the technical analysis, the market research, the stakeholder interviews, PARC input and public comments received at the public meetings and via webpage, email, and phone line. Recommendations were organized into two categories:
Core Recommendations that are considered top priority; and
Package Recommendations that are derived specifically from the multimodal packages evaluated in this study.
Section 3.0 of this report provides the detailed assessment of the multimodal packages. Section 4.0 provides a more robust discussion of overall study recommendations.
Core Recommendations
The first tier of recommended improvements for the I-66 corridor inside the Beltway consists of the improvements in the corridor as included in the 2011 CLRP for 2040, including spot improvements along westbound I-66, increasing the HOV occupancy restriction on I-66 from HOV 2+ to HOV 3+, completing the Silver Line Metrorail extension to Loudoun County, and implementing the Active Traffic Management element of an ICM system.
The second tier of recommended improvements include the new transit services and TDM programs recommended by the 2009 DRPT I-66 Transit/TDM Study along with components of the WMATA enhancement plan deemed necessary to address Metrorail core capacity concerns in the I-66 corridor. The I-66 Multimodal Study did not evaluate the effectiveness of these improvements independently nor did it examine the timing and phasing strategy for them. It is assumed that the region will prepare a more rigorous implementation plan for these improvements as the travel conditions in the corridor warrant.
Package Recommendations
A hybrid or composite package of elements from several packages is recommended for consideration as the third tier and end-state set of multimodal improvements (joining the first and second tier articulated as core recommendations). Outlined below are the elements of the proposed hybrid package of improvements. The scope, timing, and phasing of these elements should be reassessed and/or refined in the future in response to changing demographics, travel patterns and conditions in the corridor, and/or the implementation of the core recommendations of this study. The package recommendations include:
Completion of the elements of the bicycle and pedestrian network as detailed in Section 4.3, to enhance service as a viable alternative to motorized trip making in the corridor. Consideration should be given to the priority determination in Section 4.3 as funding becomes available.
Executive Summary
I-66 Multimodal Study ES-7
Full operability of an ICM system inside the Beltway as detailed in Section 4.5. These strategies maximize the use, operations, and safety of the multimodal network within the study corridor.
Addition and enhancement to the suite of TDM programs in the corridor as detailed in Section 4.4. As funding becomes available for TDM, consideration should be given to the priority grouping established in this study for implementation.
Implementation of the best performing transit recommendations from Multimodal Package 4. This involves examination of all the transit service improvements in Multimodal Package 4 to determine those with the highest ridership in the corridor.
Implementation of HOT lanes on I-66, potentially during peak periods only, to: provide new travel options in the corridor; utilize available capacity on I-66; provide congestion relief on the arterials; and provide new transit services as an alternative to tolled travel.
Addition of a third through lane on selected segment(s) of I-66, depending on the monitored traffic flow conditions and demand both on I-66 and the parallel arterials.
Explore the full use of commonly used or proven design waivers/exceptions to enable remaining within the existing right-of-way for I-66.
Conclusions
While there is significant growth forecast for Northern Virginia between now and 2040, the multimodal transportation infrastructure, programs, and services defined in this report provide the means to accommodate the forecast growth and associated travel demand. The spectrum of recommendations – both core and package – covers a range of timeframes to 2040. The timing and phasing of implementation of the recommendations will require significant consideration of funding availability, progress against core recommendations, and the quality of operations and conditions on the existing key infrastructure assets.
The implementation of the recommendations will most likely require funding beyond existing and anticipated resources that are already committed to other state and local transportation priorities. Section 5.0 of this report provides a summary of a wide array of revenue options to fund the study recommendations. They include revenue sources associated with user fees, general taxes and specialized taxes or fees. Financing options are also considered that could include private equity investment in surface transportation through Public-Private Partnerships (P3), with financing packages that combine public and private debt, equity, and public funding.

Executive Summary
ES-8 I-66 Multimodal Study
This page intentionally left blank.
Introduction
1-1
1.0 Introduction
The Virginia Department of Transportation (VDOT) and the Department of Rail and Public Transportation (DRPT) commissioned the I-66 Multimodal Study to address long-term multi-modal needs within the I-66 corridor inside the Beltway. This study builds on the suggestions made during the 2005 Idea-66 Study workshops and fulfills the commitment made to the National Capital Regional Transportation Planning Board (TPB) in TPB Resolution R12-2009.1 As part of a comprehensive assessment, VDOT and DRPT committed to completing a long-term multimodal study that would examine, in greater detail, a wide range of multimodal options and alternatives to address mobility and congestion in the I-66 corridor.
In December 2009, DRPT completed the I-66 Transit/TDM Study, which developed a recom-mended plan for short- and medium-term transit and TDM service improvements in the I-66 corridor between Haymarket, Virginia and Washington, D.C. The I-66 Multimodal Study effort was designed to complement the short- and medium-term recommendation documented in the I-66 Transit/TDM Study and expand upon prospective long-term recommendations and actions that maximize mobility within the I-66 corridor. This Final Report provides a summary of the year-long I-66 Multimodal Study and includes recommendations and actions that address the study goals and fulfill the requirements articulated in TPB Resolution R12-2009.
1.1 Project Goal
The goal of the I-66 Multimodal Study was to:
Identify a range of current and visionary multimodal and corridor management solutions (operational, transit, bicycle, and pedestrian, in addition to highway improvements) that can be implemented to reduce highway and transit congestion and improve overall mobility within the corridor and along major arte-rial roadways and bus routes within the study area.
The I-66 Multimodal Study was initiated in July 2011 by VDOT and DRPT as an examination of the future transportation needs for the I-66 corridor inside the Beltway. The study’s aim was to comprehensively evaluate the long-term congestion and mobility needs of the I-66 corridor inside the Capital Beltway, between I-495 and the Theodore Roosevelt Bridge through the year 2040. Building on the 2011 Financially Constrained Long-Range Plan (CLRP), the study consi-dered a wide range of complementary and mutually supportive multimodal improvement options balancing the needs and priorities of users and nearby residents. A multitude of options for improvement were considered, including expanded public transportation, addi-tional highway lane capacity, transportation demand management, high-occupancy vehicle
1 National Capital Region Transportation Planning Board, Resolution on Inclusion in Air Quality
Conformity Analysis of Submissions for the 2009 Constrained Long-Rang Plan (CLRP) and FY 2010-2015 Transportation Improvement program (TIP). TPB Resolution R12-2009, March 18, 2009.
Introduction
1-2 I-66 Multimodal Study
(HOV) policies, high-occupancy/toll (HOT) policies, congestion pricing, managed lanes, active traffic management, and bicycle and pedestrian corridor access. By using a broad approach, the I-66 Multimodal Study focused on identifying and analyzing effective options for improving mobility along the corridor.
Corridor Description
The initial study area for the I-66 Multimodal Study was defined as bounded by the Potomac River to the east, Columbia Pike (VA Route 244) to the south, I-495 to the west, and Dolley Madison Boulevard/Chain Bridge Road (VA Route 123) to the north, with a study focus on the I-66 corridor from the Capital Beltway (I-495) east to the Theodore Roosevelt Bridge border. The study area was refined to have a primary focus on the I-66 facility and nearby parallel facilities, including U.S. Route 29 (Lee Highway), U.S. Route 50 (Arlington Boulevard), and Washington Boulevard (VA Route 237) (see Section 2.0 of the Interim Report).
The I-66 corridor includes a complex mix of transportation facilities and services. Inside the Beltway, I-66 itself has two through lanes in each direction. All lanes on I-66 in the peak direc-tion during the peak period (inbound in the morning, between 6:30 a.m. and 9:00 a.m.; out-bound in the evening, between 4:00 p.m. and 6:30 p.m.) are designated as HOV only (with some authorized exceptions). The study corridor includes parallel arterials that serve non-HOV tra-vel during the peak periods when single-occupancy vehicles are restricted from using I-66 in the peak direction. Mass transit within the corridor includes the Metrorail Orange Line (and future Silver Line) as well as local and express bus services. The corridor also includes a net-work of on- and off-road bicycle facilities.
Transit services in the corridor include the Metrorail Orange Line, which currently serves loca-tions in the corridor, with stations at Rosslyn, Court House, Clarendon, Virginia Square-GMU, Ballston-MU, East Falls Church, and West Falls Church-VT/UVA. Upon completion of Phase I and Phase II of the Metrorail Silver Line as called for in the CLRP, there also will be direct Metrorail service serving Tysons Corner, Reston, Herndon, Dulles Airport, and Loudoun County. A number of transit operators provide local and express bus services in the corridor. These include the Potomac and Rappahannock Transportation Commission (PRTC), Arlington Transit (ART), WMATA Metrobus, Loudoun County Commuter Bus, and Fairfax Connector.
Bicyclists and pedestrians also can travel along the I-66 corridor using two primary off-road routes – the Washington & Old Dominion (W&OD) Trail and the Custis Trail. The W&OD Trail starts in Purcellville, Virginia and extends to Shirlington, Virginia. The Custis Trail inter-sects the W&OD Trail in Bon Air Park in western Arlington County and parallels I-66 to the eastern edge of Arlington County at the intersection of Lynn Street and Lee Highway, at the Virginia entrance to the Key Bridge. In addition to the bicycle travel facilities, there are four Capital Bikeshare locations in the study area, located towards the eastern end of the Rosslyn-Ballston Corridor.
With these considerations in mind, the I-66 Multimodal Study identified potential mobility enhancements to alleviate current and projected future congestion within the study area. The identified combinations of multimodal improvements could have a significant impact on mobility when compared with the baseline projections for the study year, 2040.
Introduction
I-66 Multimodal Study 1-3
1.2 Oversight and Coordination
The lead agencies for this study were VDOT and DRPT. The technical and administrative work conducted for this study was managed and led by Cambridge Systematics, Inc. (CS), with sup-port from a team of subconsultants. The KFH Group, Inc. provided transit expertise; MCV Associates, Inc. performed data collection; Rummel, Klepper & Kahl, LLP (RK&K) provided technical analysis of the highway mobility needs; Sharp & Company, Inc. supported the public information activities; the Southeastern Institute of Research, Inc. (SIR) led the market research; and Toole Design Group LLC provided bicycle and pedestrian expertise.
To ensure that the study used a broad lens to evaluate options, the lead agencies formed a Participating Agency Representative Committee (PARC). The PARC met with VDOT, DRPT, and the project consulting team on a monthly basis to provide input on draft materials and advise the study. In addition, representatives served as liaisons with their respective agencies and elected officials and helped to distribute study information to constituents and interested citizens. The member agencies of the PARC committee are listed in Table 1.1.
Table 1.1 PARC Member Agencies
Agency
Arlington County
City of Alexandria
City of Fairfax
City of Falls Church
District Department of Transportation (DDOT)
Fairfax County
Federal Highway Administration (FHWA)
Federal Transit Administration (FTA)
Loudoun County
Metropolitan Washington Council of Governments (MWCOG)
Northern Virginia Transportation Commission (NVTC)
Potomac and Rappahannock Transportation Commission (PRTC)
Prince William County
Town of Vienna
Virginia Railway Express (VRE)
Washington Metropolitan Area Transit Authority (WMATA)
Introduction
1-4 I-66 Multimodal Study
1.3 Overview of Work Program
The work program was designed to produce recommendations for alleviating congestion and mobility issues in the study area that would be supportable by stakeholders. This section high-lights key activities in the final work program, which provided a step-by-step process used by the consulting team for identifying future mobility solutions in the study area.
Identify Key Corridor Issues and Needs
Key indicators of study area issues and needs included forecasted changes in land use, popula-tion, households, and employment. Other inputs included travel patterns for the different modes, modal split, network gap analysis, recurrent congestion, and any other known issues within the corridor. Technical analysis, coupled with market research, stakeholder interviews, and jurisdictional input from the PARC meetings were used to organize a defined set of study area transportation system issues and needs. This work program element is covered in Section 3.0 of the Interim Report, published in December 2011.
Develop Option Elements to Address Congestion, Reliability, and Mobility
An early and ongoing task of the I-66 Multimodal Study was the development of a comprehen-sive inventory of mobility option elements. Element types include highway, transit, bicycle/pedestrian, transportation demand management (TDM), and intelligent transportation systems (ITS). Eligible project types included improved transit facilities and/or services (e.g., priority bus, dedicated lane, new service), modifications to highway facilities and/or operating policies (e.g., high-occupancy vehicle lanes, high-occupancy toll lanes, arterial road widening), intelli-gent transportation systems (e.g., signal timing optimization and dynamic message signs), intermodal access (e.g., bus bays, bicycle parking, access to transit), ridesharing, and bicycle and pedestrian mobility enhancements (e.g., new trail connectors, on-road facilities, and trail widening). The mobility option elements are closely related to the study area issues and needs, as many of the elements have been previously identified by agencies and jurisdictions to address known transportation deficiencies in the study area. Section 5.0 of the Interim Report documents the mobility option elements.
Formulate and Evaluate Mobility Options and Multimodal Packages
A set of nine mobility options for testing was formulated through a process of relating potential mobility option elements to the list of issues and needs. As noted above, Section 3.0 of the Interim Report documented these issues and needs. An evaluation methodology was estab-lished in Section 4.0 of the Interim Report and refined as work progressed to formulate multimodal packages and ultimately recommendations. Section 2.0 of this Final Report describes the synthesis of the mobility option elements into a set of mobility options and the evaluation that then led to selection of four multimodal packages. Section 3.0 of this Final Report describes the evaluation of the multimodal packages, including travel demand fore-casting using the adopted regional model and preparing cost estimates. The process of moving from a list of more than 100 multimodal mobility option elements to a set of four multimodal packages represented the core effort of the I-66 Multimodal Study.
Introduction
I-66 Multimodal Study 1-5
Develop Recommendations for Enhanced Mobility on I-66 Inside the Beltway
Section 4.0 of this Final Report describes the development of recommendations based on the evaluation of the multimodal packages. A recommendations framework was established which identified meritorious aspects as well as unique issues associated with each package. Section 5.0 of this Final Report provides a discussion of potential funding approaches for improvements in not only the corridor, but also the region. A full range of approaches, including Federal, state, local, and private funding sources are explored.
Public Information
Both internal and external communication was a key component of the I-66 Multimodal Study. The intent of the public information and outreach program was to: 1) solicit input and opinions to inform the multimodal mobility study options; 2) disseminate timely information about the study; and 3) provide effective methods and mechanisms to address stakeholder issues and ensure two-way communication. Throughout the course of the study, a variety of tools were used to either obtain appropriate input or disseminate information. These included market research, public meetings, stakeholder interviews, a study webpage, and project factsheets.
Market Research
Market research informed the project team and the PARC of the dominant perceptions, needs, and preferences of commuters using the I-66 corridor when considering the potential mobility options and formulation of multimodal packages. Data tabulation along with a thorough mul-tivariate statistical analysis of the results was performed. Key findings from the market research were published in Section 6.0 of the Interim Report. A draft market research study report was provided as Appendix B of the Interim Report. The final market research study report is provided in Appendix B of this report.
Public Meetings
Two rounds of public meetings were held at locations in both Arlington and Fairfax Counties. The first round of public meetings in December 2011 presented general information about the study and sought input on corridor needs and conditions, mobility options for consideration, and market research results illustrating preferences in the study area. The second round of public meetings in April 2012 presented preliminary findings of the multimodal packages and sought public input on the findings and level of service (LOS) maps showing network and modal performance.
Stakeholder Interviews
Staff from VDOT, DRPT, and the consultant team conducted interviews with 28 public agency representatives and elected officials to discuss the I-66 corridor transportation issues important to them and their constituents. Stakeholder interviews accomplished several objectives. First, they were used to engage and inform community leaders about the study and to disseminate information. Second, they served as an additional source of stakeholder input for the formula-tion of multimodal packages. Lastly, they helped the project team identify stakeholder issues.
Introduction
1-6 I-66 Multimodal Study
Study Webpage
The I-66 Multimodal Study webpage can be found on the VDOT web site at http://www.virginiadot.org/projects/northernvirginia/i-66_multimodal_study.asp. A short cut was provided via the domain name www.i66multimodalstudy.com. The webpage was a repository for the factsheets and major study deliverables. It also provided contact infor-mation, including a study telephone number and e-mail address to facilitate public comment throughout the study. The telephone number was 855-STUDY66 (788-3966) and the e-mail address was [email protected]. Each were active and monitored from the beginning of the study through the conclusion of the final study comment period.
Project Factsheets
Four factsheets were prepared over the course of the study and were released at key mile-stones. These factsheets were intended for public consumption and were used to inform the public and other stakeholders about study progress and key findings. They were made availa-ble on the study webpage, and are included in Appendix A.
1.4 Summary of the Interim Report
The Interim Report released in December of 2011 documented the initial data collection and forecasting efforts. The Interim Report is intended as a companion piece to this Final Report. It was released in advance of the initial round of public meetings and formed the principal basis of discussion at these meetings. The Interim Report is broken into seven sections, some of which already have been referenced above. Following an introductory section, Section 2.0, Study Area Definition, defines and describes the refinement of the study area, taking into account consultations with project advisors and the PARC. Section 3.0, Issues and Needs, identifies issues and needs, including regional factors that influence travel and key indicators. Section 4.0, Evaluation Methodology, covers the methods for identification of mobility option elements, the formulation of and assessment of mobility options, and the formulation and assessment of mobility option packages. Section 5.0, Mobility Options Elements, presents the full list of mobility option elements by category. Section 6.0, Market Research, presents key findings from the market research effort. Section 7.0, Next Steps, presents the key near-term work items at the time of the report publication that were required to move the study to completion.
1.5 Organization of the Final Report
The remainder of this Final Report builds on and complements the Interim Report. Section 2.0, Mobility Options, describes the approach to selecting mobility options, the evaluation process applied for the mobility options, and the evaluation findings for each of the mobility options. Section 3.0, Multimodal Packages, describes how the study team used the output from testing the mobility options to assemble four multimodal packages and presents the evaluation results for each package. Section 4.0, Recommendations, discusses conclusions drawn from the evalu-ation of the multimodal packages. Section 5.0, Potential Funding Approaches, provides a
Introduction
I-66 Multimodal Study 1-7
qualitative assessment of existing funding approaches for multimodal transportation invest-ments as well as a discussion of potential options that could be considered to fund improvements.
Five appendices provide supplemental documentation to support the study findings. Appendix A includes the public information and participation activities. Appendix B presents the market research findings. Appendix C discusses the travel demand forecasting model validation. Appendix D provides cost estimate details. Appendix E provides potential funding approach details.

Introduction
1-8 I-66 Multimodal Study
This page intentionally left blank.
Mobility Options
2-1
2.0 Mobility Options
Section 4.0 of the Interim Report, Evaluation Methodology, provides the overall decision-making framework used to address the issues and needs identified in the I-66 corridor. The evolution from mobility option elements to mobility options is an important step in developing alternatives, known as multimodal packages, for the I-66 corridor.
2.1 Approach to Selecting Mobility Options
Definition of Mobility Options
The issues and needs and mobility option elements serve as the basis for formulating mobility options. The issues and needs were developed based on the findings of a transportation and land use systems analysis, as well as stakeholder input and Lead Agency and Participating Agency Representatives Committee (PARC) input. The comprehensive set of transportation issues and needs identified for the study area are as follows:
1. Westbound roadway congestion;
2. Eastbound roadway congestion (including interchange capacity constraints at the Dulles Connector Road);
3. Capacity issues at I-66/arterial interchanges;
4. Non-HOV users during HOV operation hours;
5. Orange Line Metrorail congestion;
6. Adverse impact of roadway congestion on bus service;
7. Challenges to intermodal transfers (rail, bus, bicycle, car);
8. Bottlenecks on W&OD and Custis Trails; and
9. Limitations/gaps in bicycle and pedestrian accessibility and connectivity.
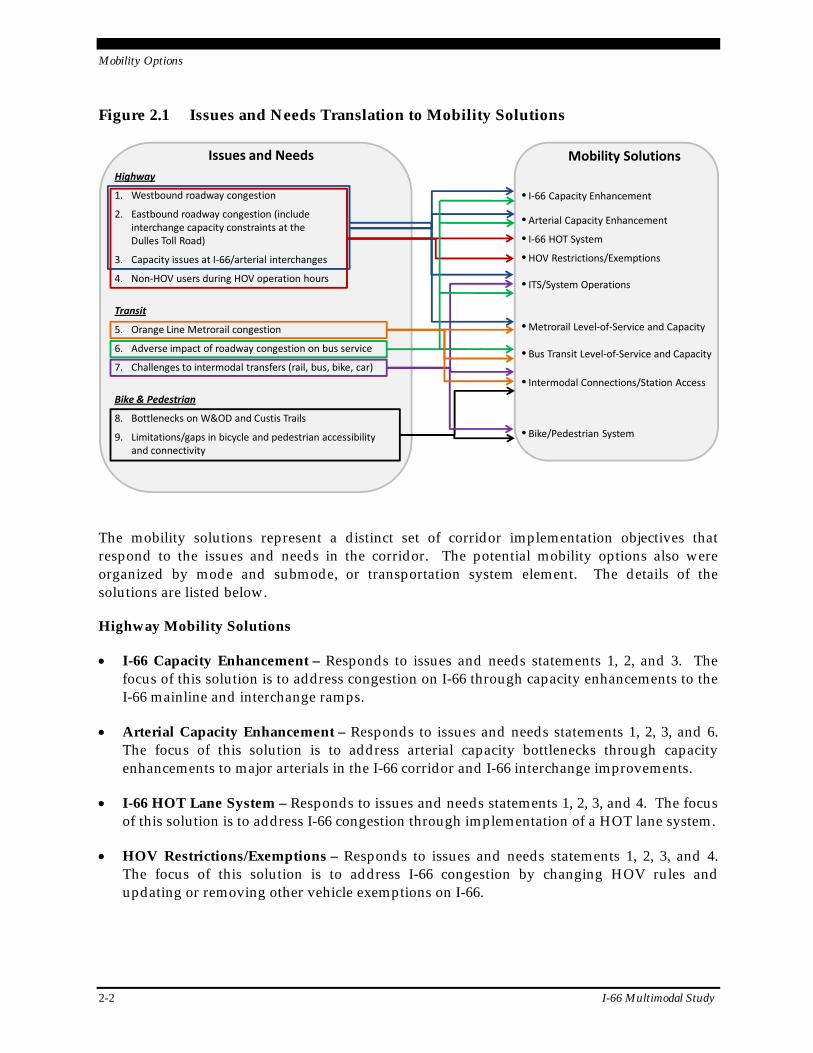
Defining the mobility option began by comparing the issues and needs against potential solu-tions. Some issues and needs can be grouped together to reflect overlaps in potential imple-mentation actions. Potential solutions were grouped into logical implementation actions that all support a single need or group of needs. A visual representing this transition is presented in Figure 2.1.
The identification and development process of formulating mobility options was initially informed by market research, stakeholder interviews, previous studies, the technical study team, and members of the PARC. The translation from issues and needs to potential mobility options is based on an organization of the issues and needs aligned with potential solutions.
Mobility Options
2-2 I-66 Multimodal Study
Figure 2.1 Issues and Needs Translation to Mobility Solutions
Issues and Needs
Highway
1. Westbound roadway congestion
2. Eastbound roadway congestion (include interchange capacity constraints at the Dulles Toll Road)
3. Capacity issues at I‐66/arterial interchanges
4. Non‐HOV users during HOV operation hours
Transit
5. Orange Line Metrorail congestion
6. Adverse impact of roadway congestion on bus service
7. Challenges to intermodal transfers (rail, bus, bike, car)
Bike & Pedestrian
8. Bottlenecks on W&OD and Custis Trails
9. Limitations/gaps in bicycle and pedestrian accessibility and connectivity
Mobility Solutions
• I‐66 Capacity Enhancement
• Arterial Capacity Enhancement
• I‐66 HOT System
• HOV Restrictions/Exemptions
• ITS/System Operations
•Metrorail Level‐of‐Service and Capacity
• Bus Transit Level‐of‐Service and Capacity
• Intermodal Connections/Station Access
• Bike/Pedestrian System
The mobility solutions represent a distinct set of corridor implementation objectives that respond to the issues and needs in the corridor. The potential mobility options also were organized by mode and submode, or transportation system element. The details of the solutions are listed below.
Highway Mobility Solutions
I-66 Capacity Enhancement – Responds to issues and needs statements 1, 2, and 3. The focus of this solution is to address congestion on I-66 through capacity enhancements to the I-66 mainline and interchange ramps.
Arterial Capacity Enhancement – Responds to issues and needs statements 1, 2, 3, and 6. The focus of this solution is to address arterial capacity bottlenecks through capacity enhancements to major arterials in the I-66 corridor and I-66 interchange improvements.
I-66 HOT Lane System – Responds to issues and needs statements 1, 2, 3, and 4. The focus of this solution is to address I-66 congestion through implementation of a HOT lane system.
HOV Restrictions/Exemptions – Responds to issues and needs statements 1, 2, 3, and 4. The focus of this solution is to address I-66 congestion by changing HOV rules and updating or removing other vehicle exemptions on I-66.
Mobility Options
I-66 Multimodal Study 2-3
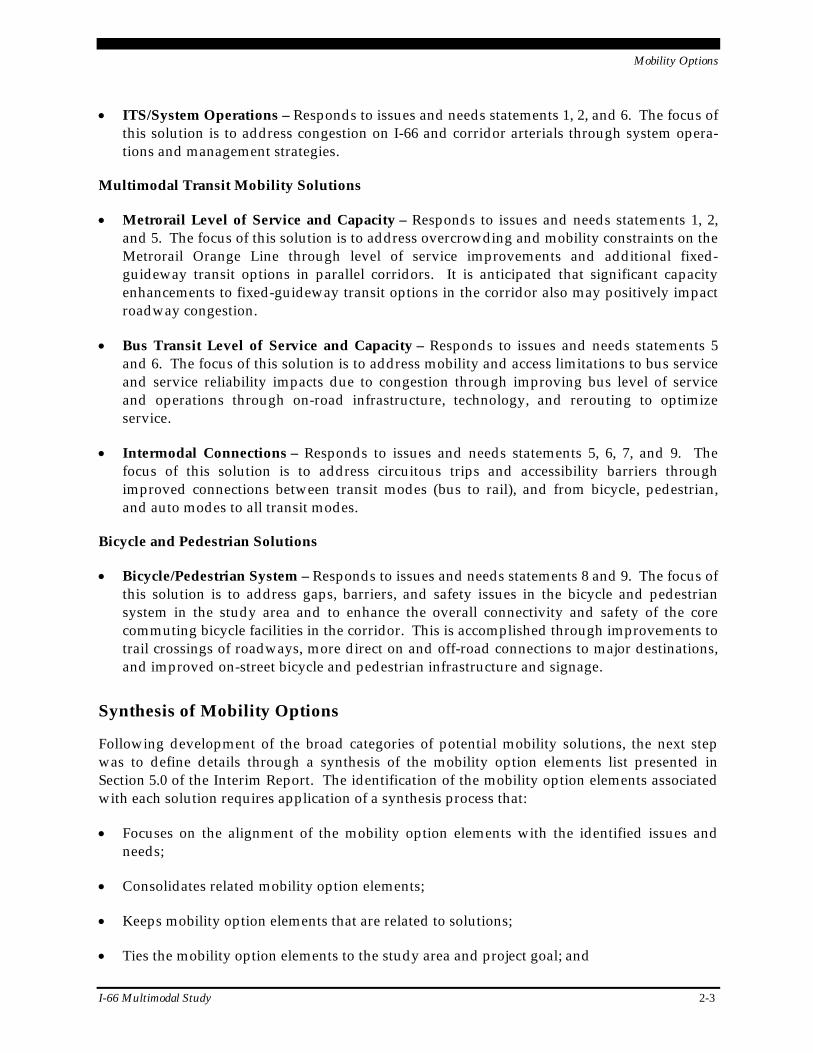
ITS/System Operations – Responds to issues and needs statements 1, 2, and 6. The focus of this solution is to address congestion on I-66 and corridor arterials through system opera-tions and management strategies.
Multimodal Transit Mobility Solutions
Metrorail Level of Service and Capacity – Responds to issues and needs statements 1, 2, and 5. The focus of this solution is to address overcrowding and mobility constraints on the Metrorail Orange Line through level of service improvements and additional fixed-guideway transit options in parallel corridors. It is anticipated that significant capacity enhancements to fixed-guideway transit options in the corridor also may positively impact roadway congestion.
Bus Transit Level of Service and Capacity – Responds to issues and needs statements 5 and 6. The focus of this solution is to address mobility and access limitations to bus service and service reliability impacts due to congestion through improving bus level of service and operations through on-road infrastructure, technology, and rerouting to optimize service.
Intermodal Connections – Responds to issues and needs statements 5, 6, 7, and 9. The focus of this solution is to address circuitous trips and accessibility barriers through improved connections between transit modes (bus to rail), and from bicycle, pedestrian, and auto modes to all transit modes.
Bicycle and Pedestrian Solutions
Bicycle/Pedestrian System – Responds to issues and needs statements 8 and 9. The focus of this solution is to address gaps, barriers, and safety issues in the bicycle and pedestrian system in the study area and to enhance the overall connectivity and safety of the core commuting bicycle facilities in the corridor. This is accomplished through improvements to trail crossings of roadways, more direct on and off-road connections to major destinations, and improved on-street bicycle and pedestrian infrastructure and signage.
Synthesis of Mobility Options
Following development of the broad categories of potential mobility solutions, the next step was to define details through a synthesis of the mobility option elements list presented in Section 5.0 of the Interim Report. The identification of the mobility option elements associated with each solution requires application of a synthesis process that:
Focuses on the alignment of the mobility option elements with the identified issues and needs;
Consolidates related mobility option elements;
Keeps mobility option elements that are related to solutions;
Ties the mobility option elements to the study area and project goal; and
Mobility Options
2-4 I-66 Multimodal Study
Keeps mobility option elements without fatal implementation constraints. Potential fatal flaws are considered to be those that would severely limit the ability to implement (e.g., cost prohibitive, right-of-way (ROW) prohibitive).
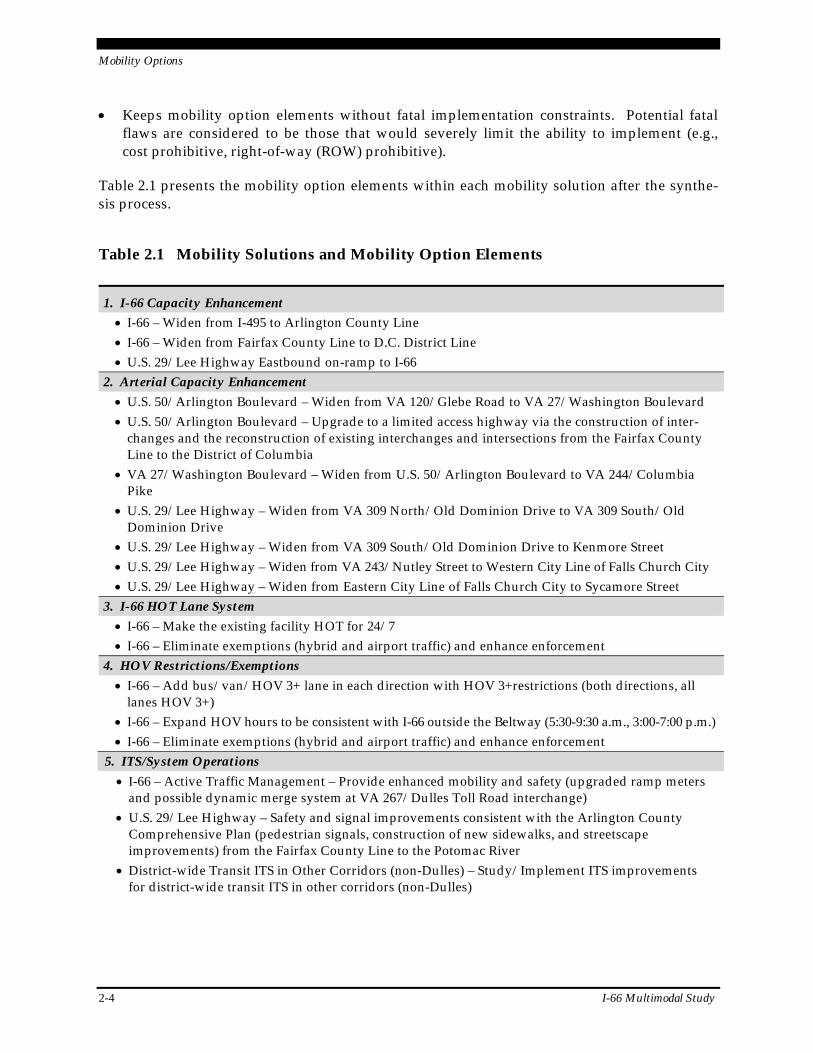
Table 2.1 presents the mobility option elements within each mobility solution after the synthe-sis process.
Table 2.1 Mobility Solutions and Mobility Option Elements
1. I-66 Capacity Enhancement I-66 – Widen from I-495 to Arlington County Line I-66 – Widen from Fairfax County Line to D.C. District Line U.S. 29/Lee Highway Eastbound on-ramp to I-66
2. Arterial Capacity Enhancement U.S. 50/Arlington Boulevard – Widen from VA 120/Glebe Road to VA 27/Washington Boulevard U.S. 50/Arlington Boulevard – Upgrade to a limited access highway via the construction of inter-
changes and the reconstruction of existing interchanges and intersections from the Fairfax County Line to the District of Columbia
VA 27/Washington Boulevard – Widen from U.S. 50/Arlington Boulevard to VA 244/Columbia Pike
U.S. 29/Lee Highway – Widen from VA 309 North/Old Dominion Drive to VA 309 South/Old Dominion Drive
U.S. 29/Lee Highway – Widen from VA 309 South/Old Dominion Drive to Kenmore Street U.S. 29/Lee Highway – Widen from VA 243/Nutley Street to Western City Line of Falls Church City U.S. 29/Lee Highway – Widen from Eastern City Line of Falls Church City to Sycamore Street
3. I-66 HOT Lane System I-66 – Make the existing facility HOT for 24/7 I-66 – Eliminate exemptions (hybrid and airport traffic) and enhance enforcement
4. HOV Restrictions/Exemptions I-66 – Add bus/van/HOV 3+ lane in each direction with HOV 3+restrictions (both directions, all
lanes HOV 3+) I-66 – Expand HOV hours to be consistent with I-66 outside the Beltway (5:30-9:30 a.m., 3:00-7:00 p.m.) I-66 – Eliminate exemptions (hybrid and airport traffic) and enhance enforcement
5. ITS/System Operations I-66 – Active Traffic Management – Provide enhanced mobility and safety (upgraded ramp meters
and possible dynamic merge system at VA 267/Dulles Toll Road interchange) U.S. 29/Lee Highway – Safety and signal improvements consistent with the Arlington County
Comprehensive Plan (pedestrian signals, construction of new sidewalks, and streetscape improvements) from the Fairfax County Line to the Potomac River
District-wide Transit ITS in Other Corridors (non-Dulles) – Study/Implement ITS improvements for district-wide transit ITS in other corridors (non-Dulles)
Mobility Options
I-66 Multimodal Study 2-5
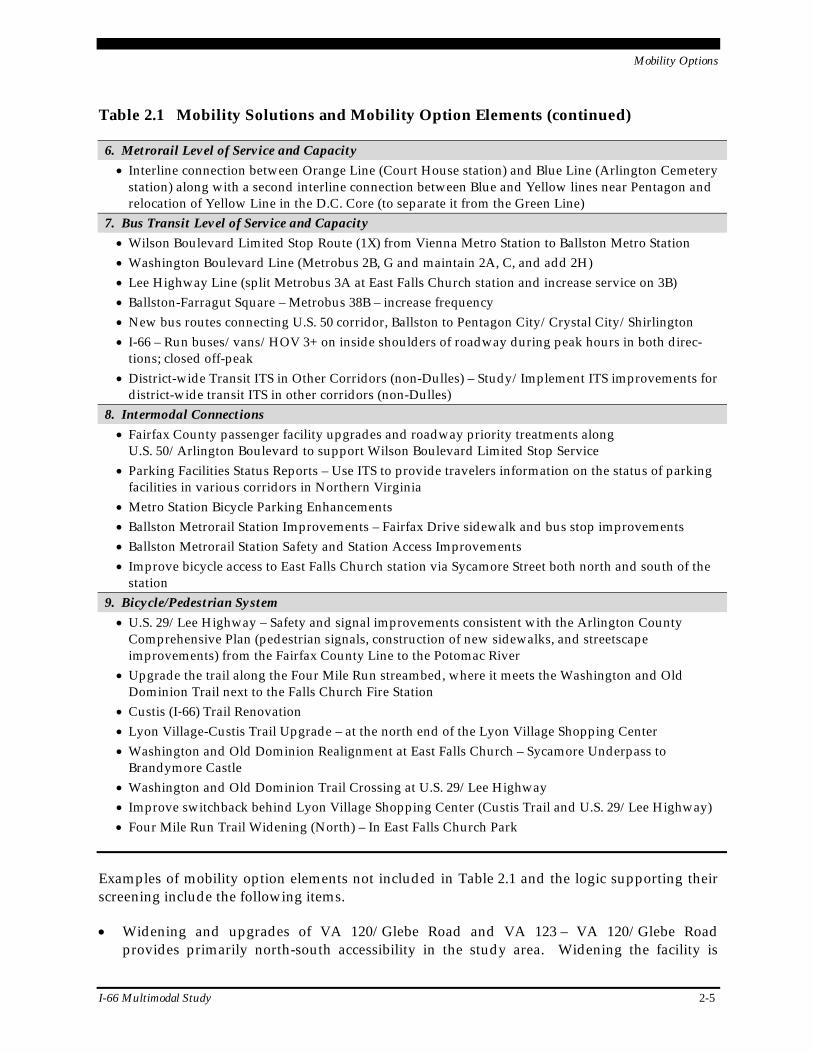
Table 2.1 Mobility Solutions and Mobility Option Elements (continued)
6. Metrorail Level of Service and Capacity Interline connection between Orange Line (Court House station) and Blue Line (Arlington Cemetery
station) along with a second interline connection between Blue and Yellow lines near Pentagon and relocation of Yellow Line in the D.C. Core (to separate it from the Green Line)
7. Bus Transit Level of Service and Capacity Wilson Boulevard Limited Stop Route (1X) from Vienna Metro Station to Ballston Metro Station Washington Boulevard Line (Metrobus 2B, G and maintain 2A, C, and add 2H) Lee Highway Line (split Metrobus 3A at East Falls Church station and increase service on 3B) Ballston-Farragut Square – Metrobus 38B – increase frequency New bus routes connecting U.S. 50 corridor, Ballston to Pentagon City/Crystal City/Shirlington I-66 – Run buses/vans/HOV 3+ on inside shoulders of roadway during peak hours in both direc-
tions; closed off-peak District-wide Transit ITS in Other Corridors (non-Dulles) – Study/Implement ITS improvements for
district-wide transit ITS in other corridors (non-Dulles) 8. Intermodal Connections Fairfax County passenger facility upgrades and roadway priority treatments along
U.S. 50/Arlington Boulevard to support Wilson Boulevard Limited Stop Service Parking Facilities Status Reports – Use ITS to provide travelers information on the status of parking
facilities in various corridors in Northern Virginia Metro Station Bicycle Parking Enhancements Ballston Metrorail Station Improvements – Fairfax Drive sidewalk and bus stop improvements Ballston Metrorail Station Safety and Station Access Improvements Improve bicycle access to East Falls Church station via Sycamore Street both north and south of the
station 9. Bicycle/Pedestrian System U.S. 29/Lee Highway – Safety and signal improvements consistent with the Arlington County
Comprehensive Plan (pedestrian signals, construction of new sidewalks, and streetscape improvements) from the Fairfax County Line to the Potomac River
Upgrade the trail along the Four Mile Run streambed, where it meets the Washington and Old Dominion Trail next to the Falls Church Fire Station
Custis (I‐66) Trail Renovation Lyon Village-Custis Trail Upgrade – at the north end of the Lyon Village Shopping Center Washington and Old Dominion Realignment at East Falls Church – Sycamore Underpass to
Brandymore Castle Washington and Old Dominion Trail Crossing at U.S. 29/Lee Highway Improve switchback behind Lyon Village Shopping Center (Custis Trail and U.S. 29/Lee Highway) Four Mile Run Trail Widening (North) – In East Falls Church Park
Examples of mobility option elements not included in Table 2.1 and the logic supporting their screening include the following items.
Widening and upgrades of VA 120/Glebe Road and VA 123 – VA 120/Glebe Road provides primarily north-south accessibility in the study area. Widening the facility is
Mobility Options
2-6 I-66 Multimodal Study
anticipated to have only minimal impact on congestion on I-66. VA 123 is on the border of the study area, and the provision of additional capacity on this facility is not anticipated to have a substantial impact on I-66 congestion.
Orange Line Extension to Centerville – The effects of this Metrorail extension have been analyzed by MWCOG staff. This analysis indicated that the extension would have a minimal impact on Metrorail ridership and volumes on study area roadways inside the Beltway and would therefore not relieve congestion in the study corridor.
BRT on I-66 – The I-66 Transit/ Transportation Demand Management (TDM) Study investigated a number of potential transit options for the I-66 corridor. This study determined that express bus/Priority Bus1 is the preferred transit option that attracts the most ridership. Therefore the Priority Bus element was carried forward instead of BRT.
Streetcar from Rosslyn to Georgetown – This service would replicate existing bus service, and is not expected to attract significantly higher ridership than the bus service. Without a substantial increase in ridership, this element is therefore expected to have minimal impact on I-66 congestion or the Orange Line.
Light rail on U.S. 50 – This element was not carried forward into the testing phase for a number of reasons. In lieu of testing a full-blown light rail system along U.S. 50, the mobility options included testing enhanced Priority Bus along U.S. 50 to determine whether the land use and travel markets exist to support high capacity transit in this corridor. The Priority Bus was assumed to run on a shoulder lane reserved for buses during the peak periods, to minimize friction with general traffic and provide a faster travel time for transit.
VRE extension of Manassas Line – Similar to the extension of Metrorail, most of the effects of this project would be outside the study area. This element would therefore have minimal impact on congestion on I-66.
VRE on I-66 inside the Beltway – There are currently no plans by VRE or any other agency to implement commuter rail service on I-66 inside the Beltway. Since no planning has been done, it would be difficult to accurately test this element within the scope of this study. In addition, an initial review of the corridor indicates that steep grades and sharp curves would make construction of this element cost prohibitive.
West Falls Church to Tysons Corner bus service – Bus services linking these two areas are included in the Baseline scenario. Additional or increased service between West Falls Church and Tysons Corner were not carried forward into testing because they duplicate the Silver Line service and are unlikely to attract additional transit riders in the corridor. No impact on I-66 congestion would be likely.
1 Priority Bus service includes BRT or elements of BRT that improve the quality and dependability of
transit service, including frequent service, substantial stations, improved reliability, advanced technology and information systems, direct access to stations, modern vehicles, and distinct branding.
Mobility Options
I-66 Multimodal Study 2-7
Mobility Options Selected for Testing
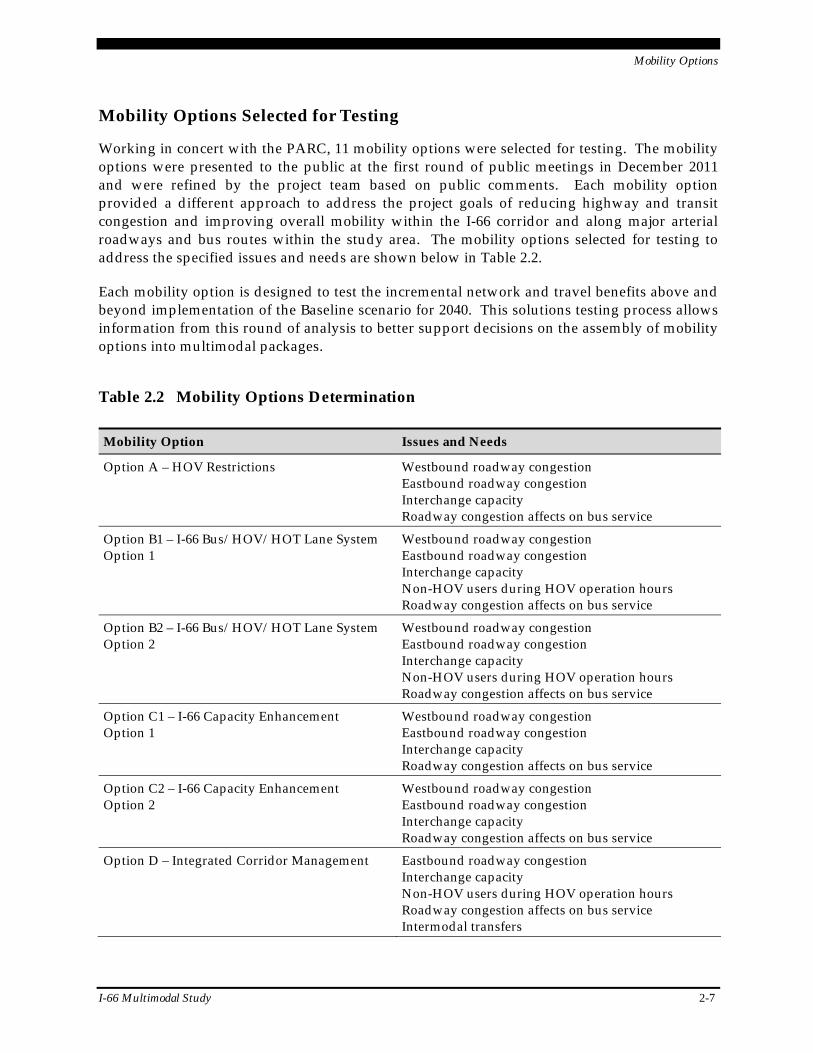
Working in concert with the PARC, 11 mobility options were selected for testing. The mobility options were presented to the public at the first round of public meetings in December 2011 and were refined by the project team based on public comments. Each mobility option provided a different approach to address the project goals of reducing highway and transit congestion and improving overall mobility within the I-66 corridor and along major arterial roadways and bus routes within the study area. The mobility options selected for testing to address the specified issues and needs are shown below in Table 2.2.
Each mobility option is designed to test the incremental network and travel benefits above and beyond implementation of the Baseline scenario for 2040. This solutions testing process allows information from this round of analysis to better support decisions on the assembly of mobility options into multimodal packages.
Table 2.2 Mobility Options Determination
Mobility Option Issues and Needs
Option A – HOV Restrictions Westbound roadway congestion Eastbound roadway congestion Interchange capacity Roadway congestion affects on bus service
Option B1 – I-66 Bus/HOV/HOT Lane System Option 1
Westbound roadway congestion Eastbound roadway congestion Interchange capacity Non-HOV users during HOV operation hours Roadway congestion affects on bus service
Option B2 – I-66 Bus/HOV/HOT Lane System Option 2
Westbound roadway congestion Eastbound roadway congestion Interchange capacity Non-HOV users during HOV operation hours Roadway congestion affects on bus service
Option C1 – I-66 Capacity Enhancement Option 1
Westbound roadway congestion Eastbound roadway congestion Interchange capacity Roadway congestion affects on bus service
Option C2 – I-66 Capacity Enhancement Option 2
Westbound roadway congestion Eastbound roadway congestion Interchange capacity Roadway congestion affects on bus service
Option D – Integrated Corridor Management Eastbound roadway congestion Interchange capacity Non-HOV users during HOV operation hours Roadway congestion affects on bus service Intermodal transfers
Mobility Options
2-8 I-66 Multimodal Study
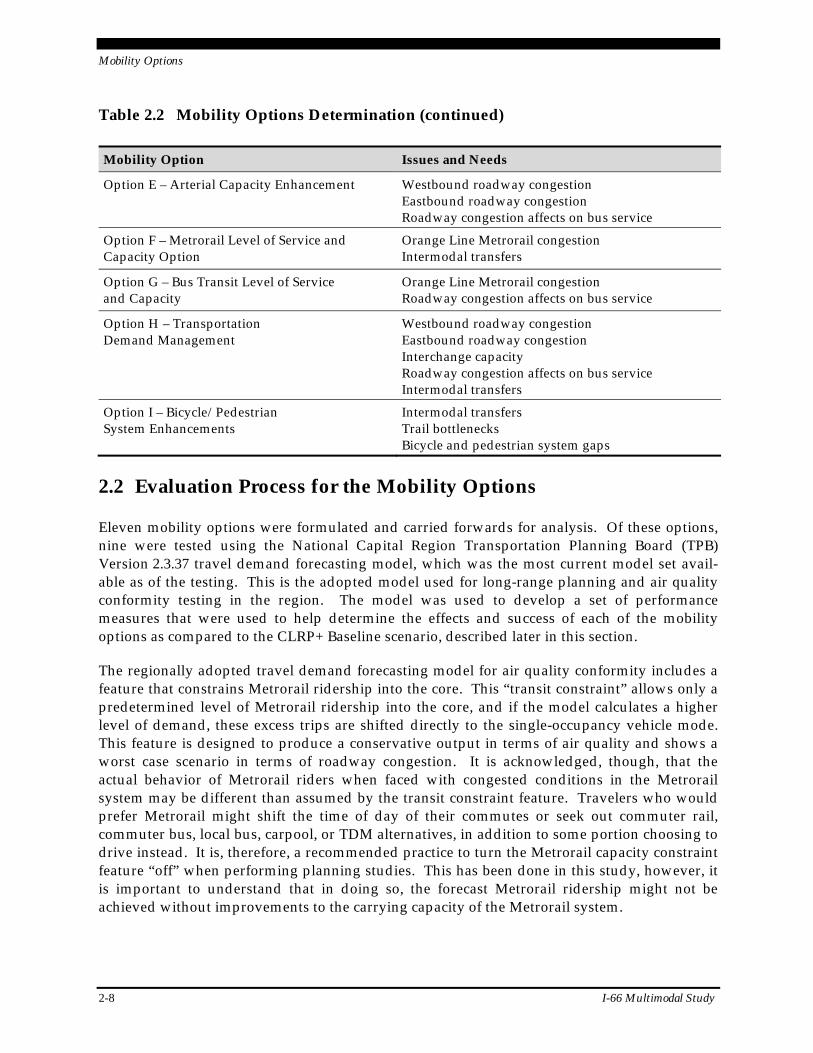
Table 2.2 Mobility Options Determination (continued)
Mobility Option Issues and Needs
Option E – Arterial Capacity Enhancement Westbound roadway congestion Eastbound roadway congestion Roadway congestion affects on bus service
Option F – Metrorail Level of Service and Capacity Option
Orange Line Metrorail congestion Intermodal transfers
Option G – Bus Transit Level of Service and Capacity
Orange Line Metrorail congestion Roadway congestion affects on bus service
Option H – Transportation Demand Management
Westbound roadway congestion Eastbound roadway congestion Interchange capacity Roadway congestion affects on bus service Intermodal transfers
Option I – Bicycle/Pedestrian System Enhancements
Intermodal transfers Trail bottlenecks Bicycle and pedestrian system gaps
2.2 Evaluation Process for the Mobility Options
Eleven mobility options were formulated and carried forwards for analysis. Of these options, nine were tested using the National Capital Region Transportation Planning Board (TPB) Version 2.3.37 travel demand forecasting model, which was the most current model set avail-able as of the testing. This is the adopted model used for long-range planning and air quality conformity testing in the region. The model was used to develop a set of performance measures that were used to help determine the effects and success of each of the mobility options as compared to the CLRP+ Baseline scenario, described later in this section.
The regionally adopted travel demand forecasting model for air quality conformity includes a feature that constrains Metrorail ridership into the core. This “transit constraint” allows only a predetermined level of Metrorail ridership into the core, and if the model calculates a higher level of demand, these excess trips are shifted directly to the single-occupancy vehicle mode. This feature is designed to produce a conservative output in terms of air quality and shows a worst case scenario in terms of roadway congestion. It is acknowledged, though, that the actual behavior of Metrorail riders when faced with congested conditions in the Metrorail system may be different than assumed by the transit constraint feature. Travelers who would prefer Metrorail might shift the time of day of their commutes or seek out commuter rail, commuter bus, local bus, carpool, or TDM alternatives, in addition to some portion choosing to drive instead. It is, therefore, a recommended practice to turn the Metrorail capacity constraint feature “off” when performing planning studies. This has been done in this study, however, it is important to understand that in doing so, the forecast Metrorail ridership might not be achieved without improvements to the carrying capacity of the Metrorail system.
Mobility Options
I-66 Multimodal Study 2-9
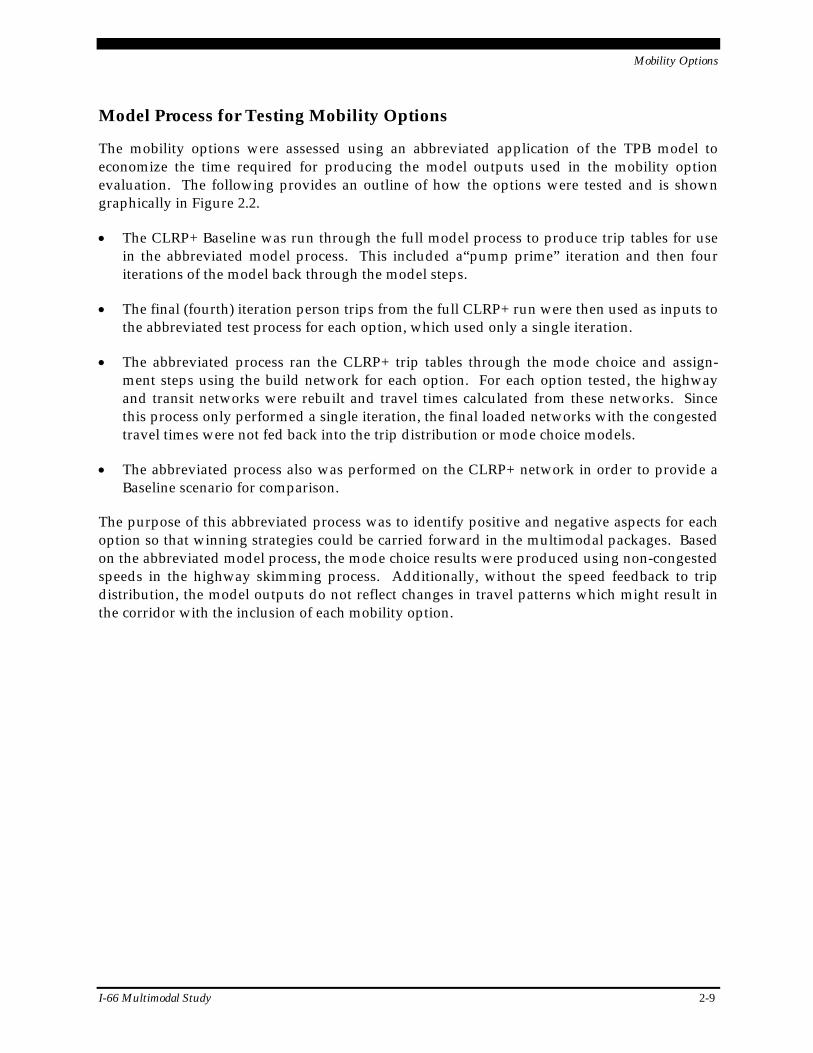
Model Process for Testing Mobility Options
The mobility options were assessed using an abbreviated application of the TPB model to economize the time required for producing the model outputs used in the mobility option evaluation. The following provides an outline of how the options were tested and is shown graphically in Figure 2.2.
The CLRP+ Baseline was run through the full model process to produce trip tables for use in the abbreviated model process. This included a“pump prime” iteration and then four iterations of the model back through the model steps.
The final (fourth) iteration person trips from the full CLRP+ run were then used as inputs to the abbreviated test process for each option, which used only a single iteration.
The abbreviated process ran the CLRP+ trip tables through the mode choice and assign-ment steps using the build network for each option. For each option tested, the highway and transit networks were rebuilt and travel times calculated from these networks. Since this process only performed a single iteration, the final loaded networks with the congested travel times were not fed back into the trip distribution or mode choice models.
The abbreviated process also was performed on the CLRP+ network in order to provide a Baseline scenario for comparison.
The purpose of this abbreviated process was to identify positive and negative aspects for each option so that winning strategies could be carried forward in the multimodal packages. Based on the abbreviated model process, the mode choice results were produced using non-congested speeds in the highway skimming process. Additionally, without the speed feedback to trip distribution, the model outputs do not reflect changes in travel patterns which might result in the corridor with the inclusion of each mobility option.
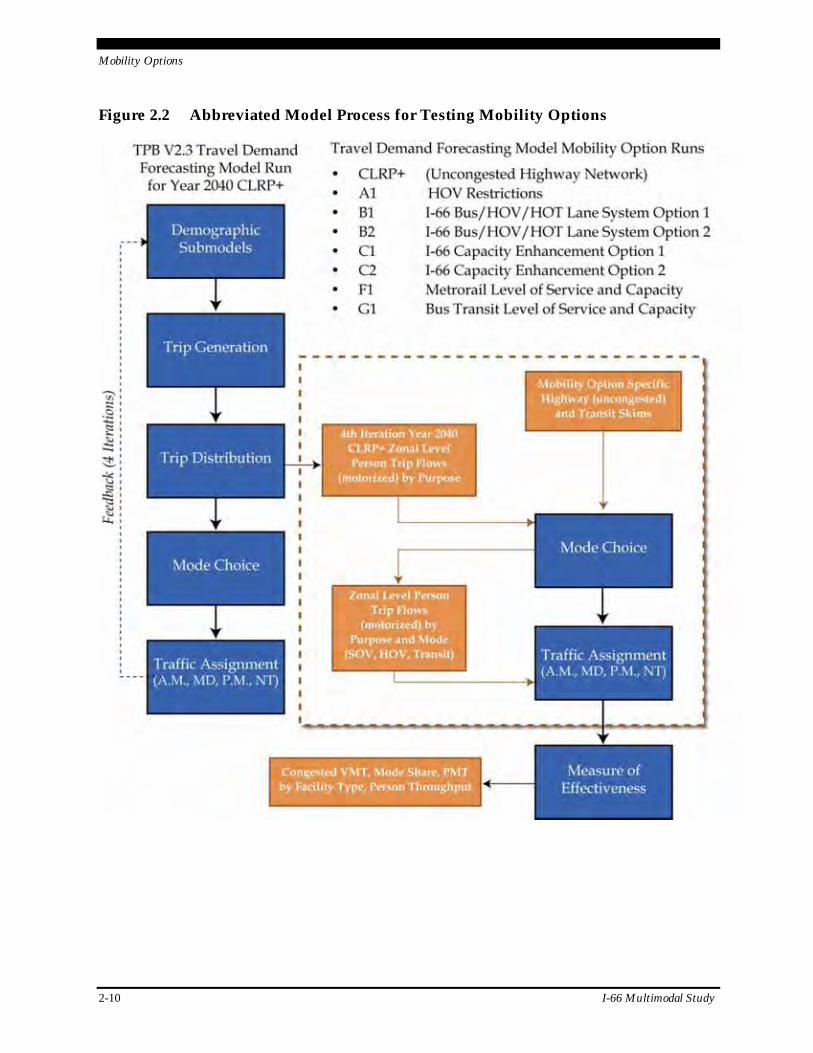
Mobility Options
2-10 I-66 Multimodal Study
Figure 2.2 Abbreviated Model Process for Testing Mobility Options
Mobility Options
I-66 Multimodal Study 2-11
Measures of Effectiveness
The regional travel demand forecasting model was used in the process outlined above to develop a set of performance measures or measures of effectiveness (MOE) for each of the options. The measures help assess how well the mobility options address issues and needs. The following measures of effectiveness were produced to assess the options.
Vehicle Miles of Travel (VMT) – VMT quantifies the amount of travel by vehicles in the study area. Nonmotorized travel is not included in this measure. VMT was calculated in the study area during the morning and evening peak periods and divided into three categories based on congestion levels: uncongested, near capacity, and over capacity (based on volume to capacity ratios). Preferred are mobility options that reduce congested VMT in the study area, both in quantity and percentage.
Person Miles of Travel (PMT) – PMT quantifies the amount of travel by people in the study area, and does include travel on transit, although nonmotorized travel is still not included. Daily PMT was calculated for three facility types in the study area: rail, free-ways, and arterials. The PMT numbers for freeways and arterials include travel by bus passengers on those facilities as well as automobile drivers and passengers. Preferred are options that increase PMT in the study area, especially options in which the PMT increases more than the VMT. This indicates a mobility option which has a higher use of transit and other shared ride modes.
Non-SOV Mode Share – Daily mode share was calculated for home-based work (HBW) trips starting or ending in the study area. Preferred are mobility options that increase the share of non-SOV travel (Transit, HOV 2, and HOV 3+) in the study area.
Person Throughput – This measure was evaluated at four cutlines along the corridor, shown in Figure 2.3. Person throughput is calculated as the number of people crossing a cutline by rail, bus, or auto daily, in either direction. Preferred are mobility options that increase person throughput regardless of mode.
These measures were used to inform which options best address the mobility and congestion goals of the study. The measures are calculated and compared to the CLRP+ Baseline scenario, which includes the 2011 CLRP and transit and TDM improvements from the I-66 Transit/TDM Study.
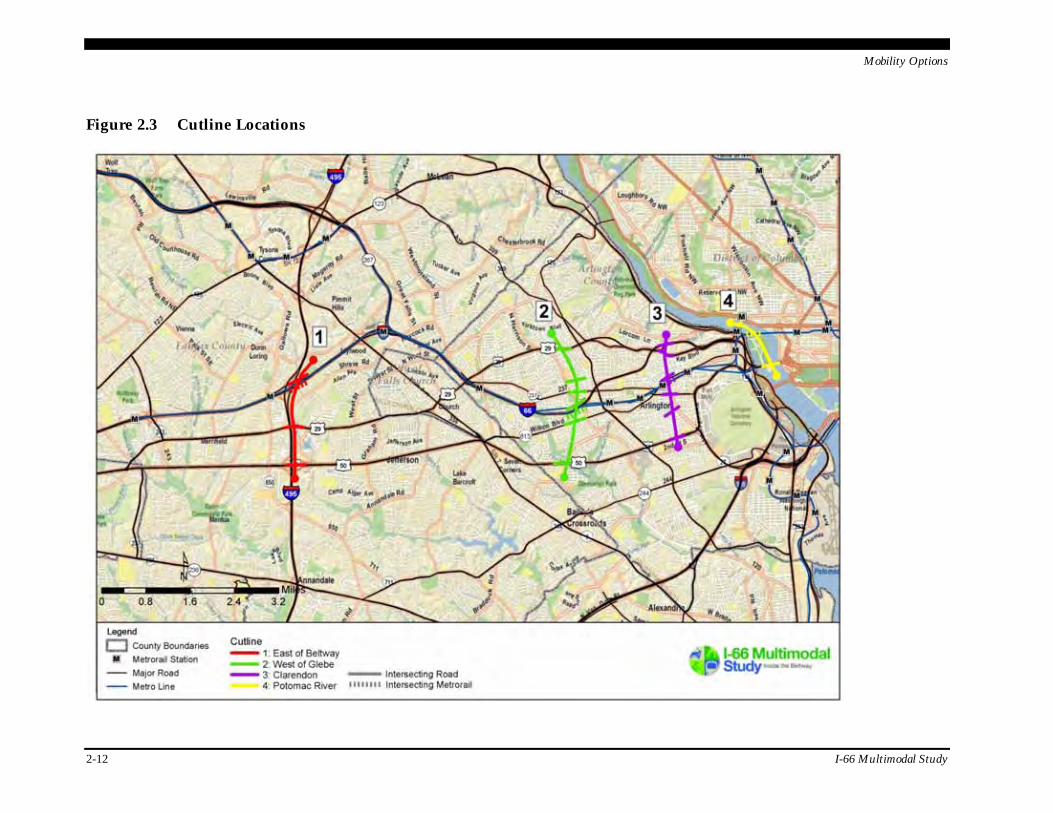
Mobility Options
2-12 I-66 Multimodal Study
Figure 2.3 Cutline Locations
Mobility Options
I-66 Multimodal Study 2-13
Baseline Assumptions for 2040
The 2040 Baseline for the I-66 Multimodal Study is called the CLRP+ Baseline and is comprised of the 2011 Fiscally Constrained Long-Range Plan (CLRP) plus the recommended bus services and TDM measures from the 2009 Virginia Department of Rail and Public Transportation (DRPT) I-66 Transit/TDM Study. The CLRP is developed cooperatively by governmental bodies and agencies represented on the National Capital Region TPB and identifies all region-ally significant transportation projects and programs that are planned and funded in the Washington metropolitan area between 2011 and 2040. Projects are identified for inclusion in the CLRP individually by Virginia, Maryland, and the District of Columbia. Because the CLRP is updated each year to include new projects and programs, and analyzed to ensure that it meets Federal requirements relating to funding and air quality, it represents the most up-to-date programming of projects in the region.
CLRP+ improvements (i.e., CLRP projects for 2040 plus recommendations from the I-66 Transit/TDM Study) are detailed later in this report, in Section 3.3. Key assumptions included in the CLRP+ Baseline are:
I-66 restricted to Bus/HOV 3+ in the peak direction;
I-66 westbound spot improvements #1, #2, #3;
Same I-66 HOV hours of operation as today;
Silver Line Phase I (to Wiehle Avenue) and Silver Line Phase II (to Dulles);
New and enhanced Priority Bus services on I-66, U.S. 29, and U.S. 50;
TDM elements from the I-66 Transit/TDM Study; and
Metrorail core capacity improvements, including eight-car trains.
Previous investment in Metrorail has resulted in a high-capacity transit service in the study area. Although funding is not provided in the CLRP for the additional rail cars and power-system upgrades required to operate 100 percent eight-car trains, the additional Metrorail core capacity improvements bring corridor Metrorail service in the CLRP+ Baseline scenario to the maximum level possible without construction of major additional physical infrastructure. As shown in Figure 2.4, this represents a major increase in Metrorail service supplied in the corri-dor between 2007 and the 2040 CLRP+ Baseline scenario. More frequent rail service is not pos-sible on the existing tracks, as the CLRP+ Baseline already assumes 26 trains per hour at the Rosslyn Tunnel, the maximum that can be accommodated.
The I-66 Multimodal Study was designed to build on previous studies in the corridor, princi-pally the recent DRPT I-66 Transit/TDM Study completed in 2009. Given the relevance of the I-66 Transit/TDM Study and the jurisdictional buy-in that resulted from that effort, recom-mendations for bus service and TDM were carried forward into the Baseline scenario. The CLRP+ Baseline scenario includes a substantial increase in bus services over the existing condi-tions, as shown in Figure 2.5. The majority of the increase in bus service supply at the cutlines is due to Priority Bus services on I-66, U.S. 29, and U.S. 50 recommended in the I-66 Transit/TDM Study.
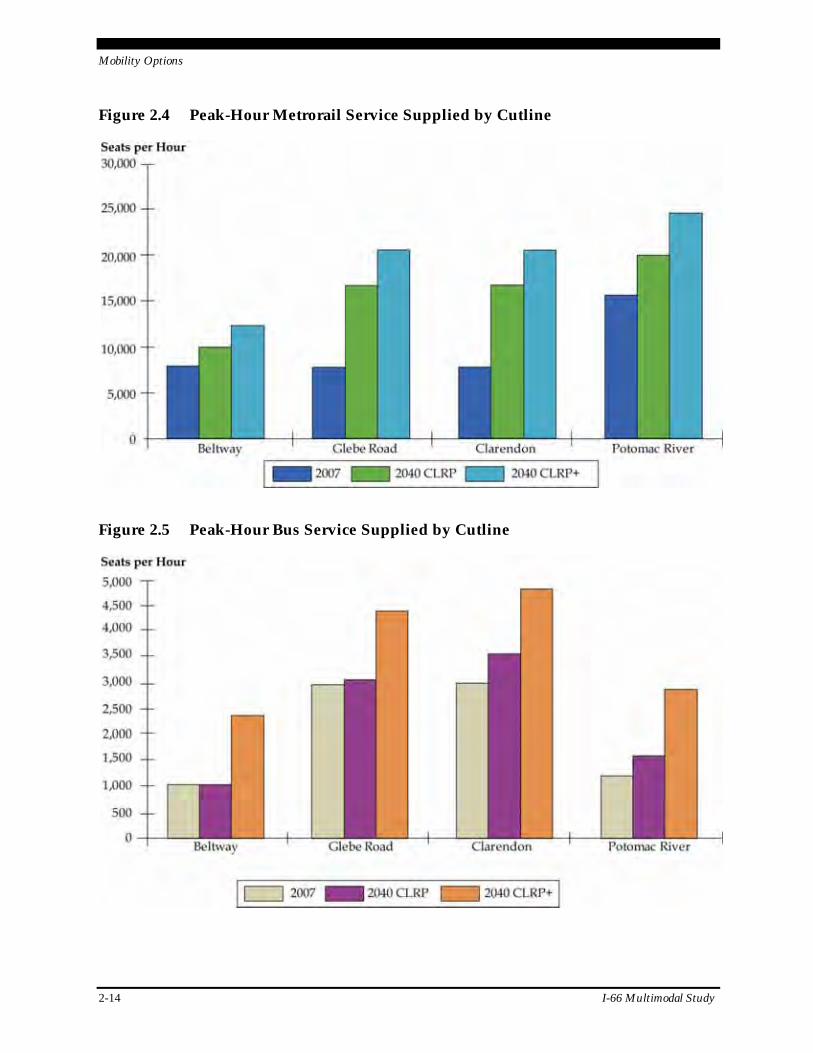
Mobility Options
2-14 I-66 Multimodal Study
Figure 2.4 Peak-Hour Metrorail Service Supplied by Cutline
Figure 2.5 Peak-Hour Bus Service Supplied by Cutline
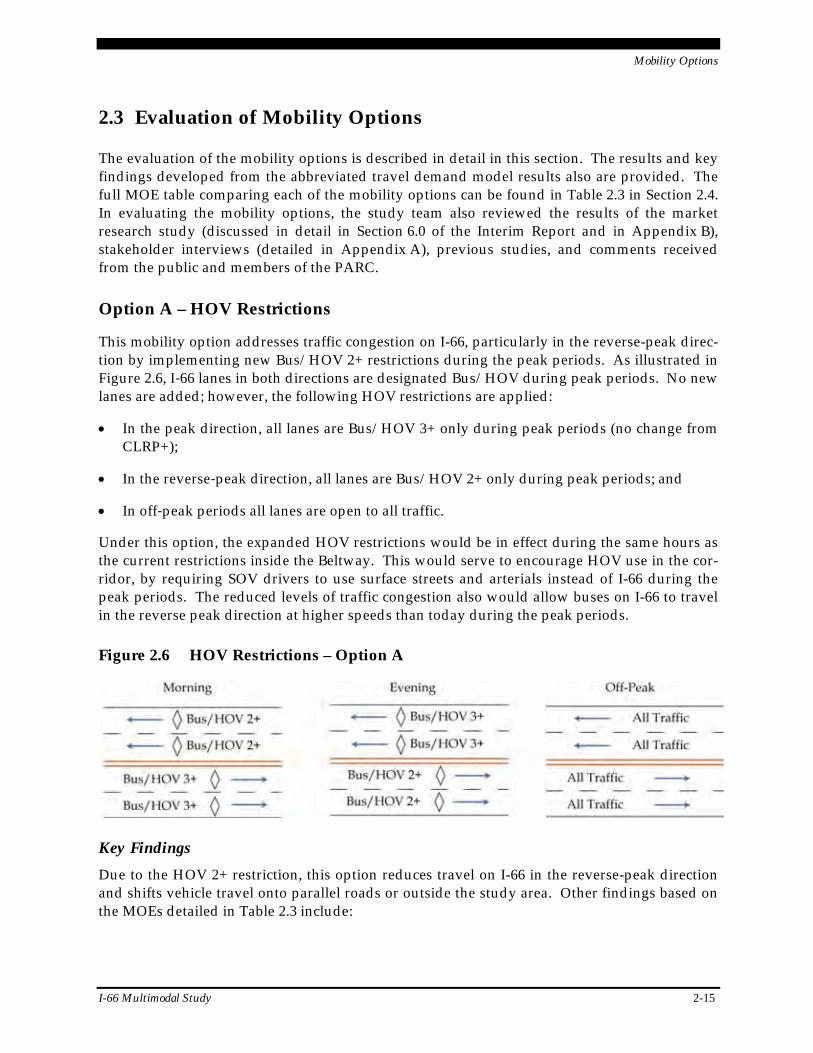
Mobility Options
I-66 Multimodal Study 2-15
2.3 Evaluation of Mobility Options
The evaluation of the mobility options is described in detail in this section. The results and key findings developed from the abbreviated travel demand model results also are provided. The full MOE table comparing each of the mobility options can be found in Table 2.3 in Section 2.4. In evaluating the mobility options, the study team also reviewed the results of the market research study (discussed in detail in Section 6.0 of the Interim Report and in Appendix B), stakeholder interviews (detailed in Appendix A), previous studies, and comments received from the public and members of the PARC.
Option A – HOV Restrictions
This mobility option addresses traffic congestion on I-66, particularly in the reverse-peak direc-tion by implementing new Bus/HOV 2+ restrictions during the peak periods. As illustrated in Figure 2.6, I‐66 lanes in both directions are designated Bus/HOV during peak periods. No new lanes are added; however, the following HOV restrictions are applied:
In the peak direction, all lanes are Bus/HOV 3+ only during peak periods (no change from CLRP+);
In the reverse‐peak direction, all lanes are Bus/HOV 2+ only during peak periods; and
In off‐peak periods all lanes are open to all traffic.
Under this option, the expanded HOV restrictions would be in effect during the same hours as the current restrictions inside the Beltway. This would serve to encourage HOV use in the cor-ridor, by requiring SOV drivers to use surface streets and arterials instead of I-66 during the peak periods. The reduced levels of traffic congestion also would allow buses on I-66 to travel in the reverse peak direction at higher speeds than today during the peak periods.
Figure 2.6 HOV Restrictions – Option A
Key Findings
Due to the HOV 2+ restriction, this option reduces travel on I-66 in the reverse-peak direction and shifts vehicle travel onto parallel roads or outside the study area. Other findings based on the MOEs detailed in Table 2.3 include:
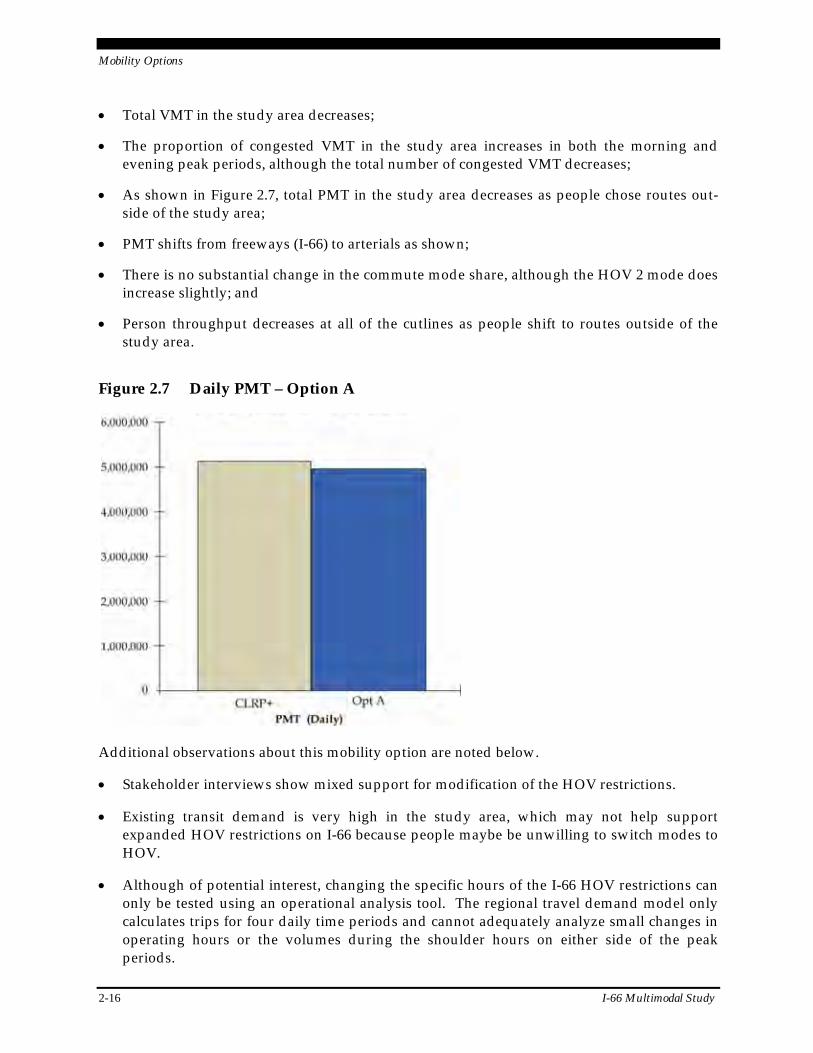
Mobility Options
2-16 I-66 Multimodal Study
Total VMT in the study area decreases;
The proportion of congested VMT in the study area increases in both the morning and evening peak periods, although the total number of congested VMT decreases;
As shown in Figure 2.7, total PMT in the study area decreases as people chose routes out-side of the study area;
PMT shifts from freeways (I-66) to arterials as shown;
There is no substantial change in the commute mode share, although the HOV 2 mode does increase slightly; and
Person throughput decreases at all of the cutlines as people shift to routes outside of the study area.
Figure 2.7 Daily PMT – Option A
Additional observations about this mobility option are noted below.
Stakeholder interviews show mixed support for modification of the HOV restrictions.
Existing transit demand is very high in the study area, which may not help support expanded HOV restrictions on I-66 because people maybe be unwilling to switch modes to HOV.
Although of potential interest, changing the specific hours of the I-66 HOV restrictions can only be tested using an operational analysis tool. The regional travel demand model only calculates trips for four daily time periods and cannot adequately analyze small changes in operating hours or the volumes during the shoulder hours on either side of the peak periods.
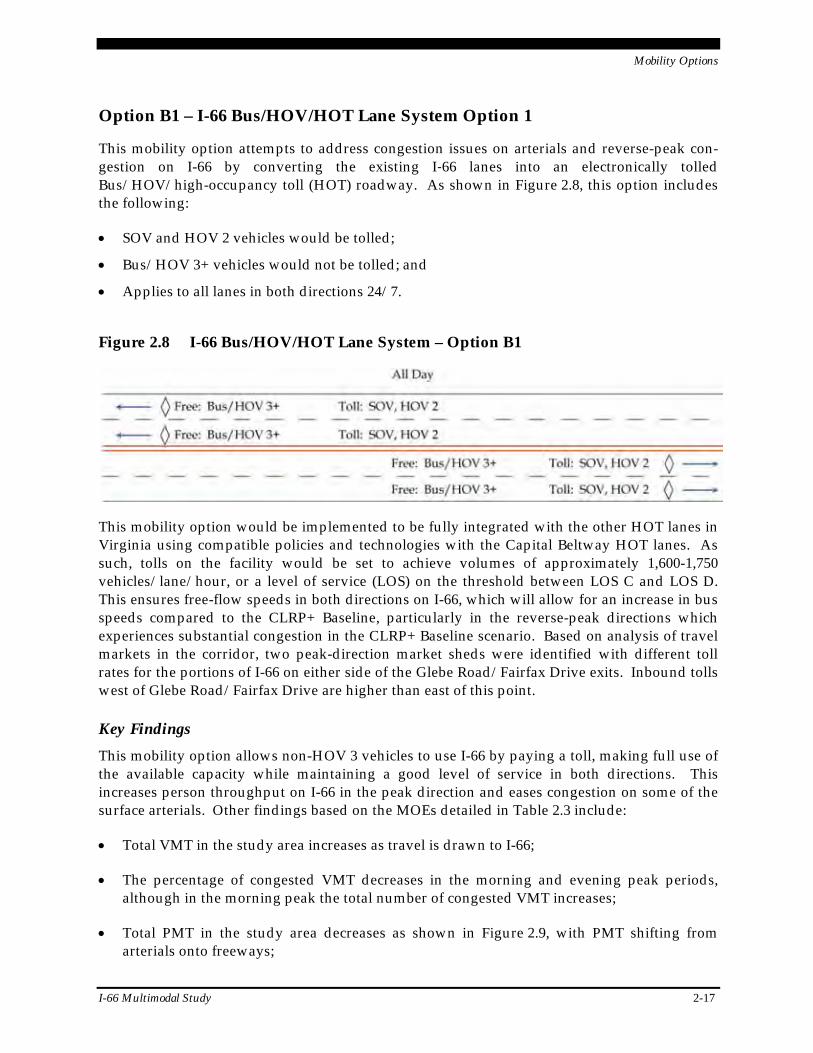
Mobility Options
I-66 Multimodal Study 2-17
Option B1 – I-66 Bus/HOV/HOT Lane System Option 1
This mobility option attempts to address congestion issues on arterials and reverse-peak con-gestion on I-66 by converting the existing I‐66 lanes into an electronically tolled Bus/HOV/high-occupancy toll (HOT) roadway. As shown in Figure 2.8, this option includes the following:
SOV and HOV 2 vehicles would be tolled;
Bus/HOV 3+ vehicles would not be tolled; and
Applies to all lanes in both directions 24/7.
Figure 2.8 I-66 Bus/HOV/HOT Lane System – Option B1
This mobility option would be implemented to be fully integrated with the other HOT lanes in Virginia using compatible policies and technologies with the Capital Beltway HOT lanes. As such, tolls on the facility would be set to achieve volumes of approximately 1,600-1,750 vehicles/lane/hour, or a level of service (LOS) on the threshold between LOS C and LOS D. This ensures free-flow speeds in both directions on I-66, which will allow for an increase in bus speeds compared to the CLRP+ Baseline, particularly in the reverse-peak directions which experiences substantial congestion in the CLRP+ Baseline scenario. Based on analysis of travel markets in the corridor, two peak-direction market sheds were identified with different toll rates for the portions of I-66 on either side of the Glebe Road/Fairfax Drive exits. Inbound tolls west of Glebe Road/Fairfax Drive are higher than east of this point.
Key Findings
This mobility option allows non-HOV 3 vehicles to use I-66 by paying a toll, making full use of the available capacity while maintaining a good level of service in both directions. This increases person throughput on I-66 in the peak direction and eases congestion on some of the surface arterials. Other findings based on the MOEs detailed in Table 2.3 include:
Total VMT in the study area increases as travel is drawn to I-66;
The percentage of congested VMT decreases in the morning and evening peak periods, although in the morning peak the total number of congested VMT increases;
Total PMT in the study area decreases as shown in Figure 2.9, with PMT shifting from arterials onto freeways;
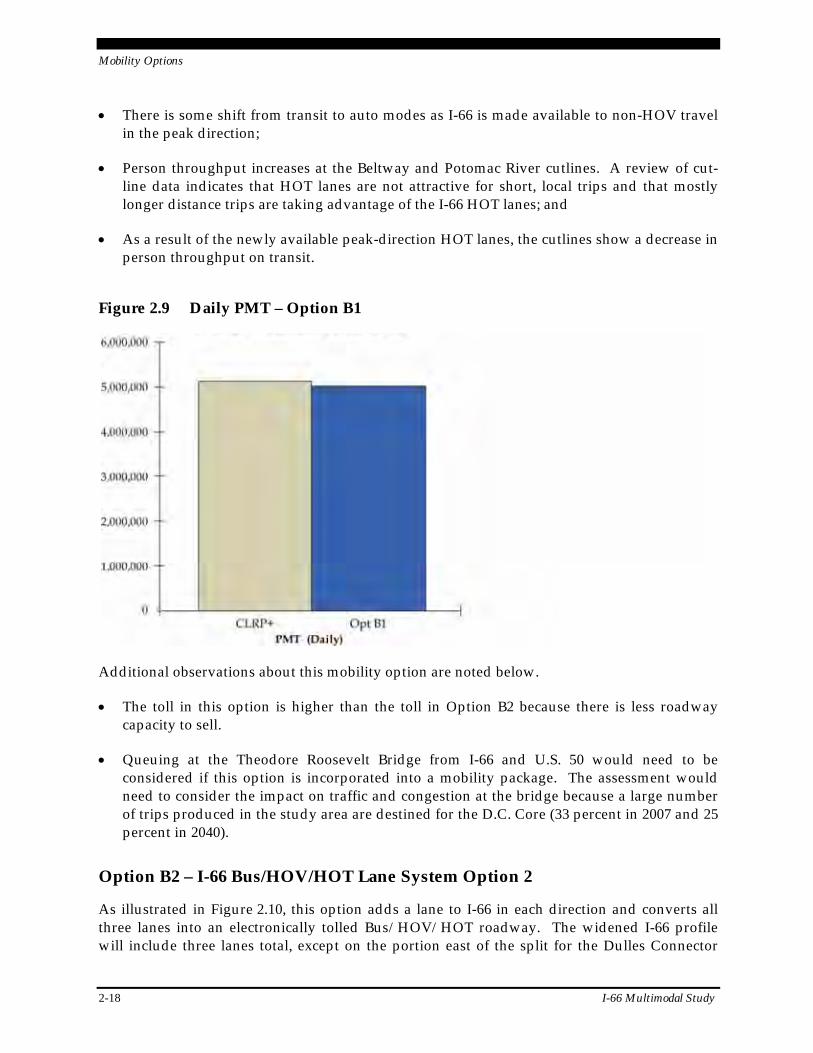
Mobility Options
2-18 I-66 Multimodal Study
There is some shift from transit to auto modes as I-66 is made available to non-HOV travel in the peak direction;
Person throughput increases at the Beltway and Potomac River cutlines. A review of cut-line data indicates that HOT lanes are not attractive for short, local trips and that mostly longer distance trips are taking advantage of the I-66 HOT lanes; and
As a result of the newly available peak-direction HOT lanes, the cutlines show a decrease in person throughput on transit.
Figure 2.9 Daily PMT – Option B1
Additional observations about this mobility option are noted below.
The toll in this option is higher than the toll in Option B2 because there is less roadway capacity to sell.
Queuing at the Theodore Roosevelt Bridge from I-66 and U.S. 50 would need to be considered if this option is incorporated into a mobility package. The assessment would need to consider the impact on traffic and congestion at the bridge because a large number of trips produced in the study area are destined for the D.C. Core (33 percent in 2007 and 25 percent in 2040).
Option B2 – I-66 Bus/HOV/HOT Lane System Option 2
As illustrated in Figure 2.10, this option adds a lane to I-66 in each direction and converts all three lanes into an electronically tolled Bus/HOV/HOT roadway. The widened I-66 profile will include three lanes total, except on the portion east of the split for the Dulles Connector
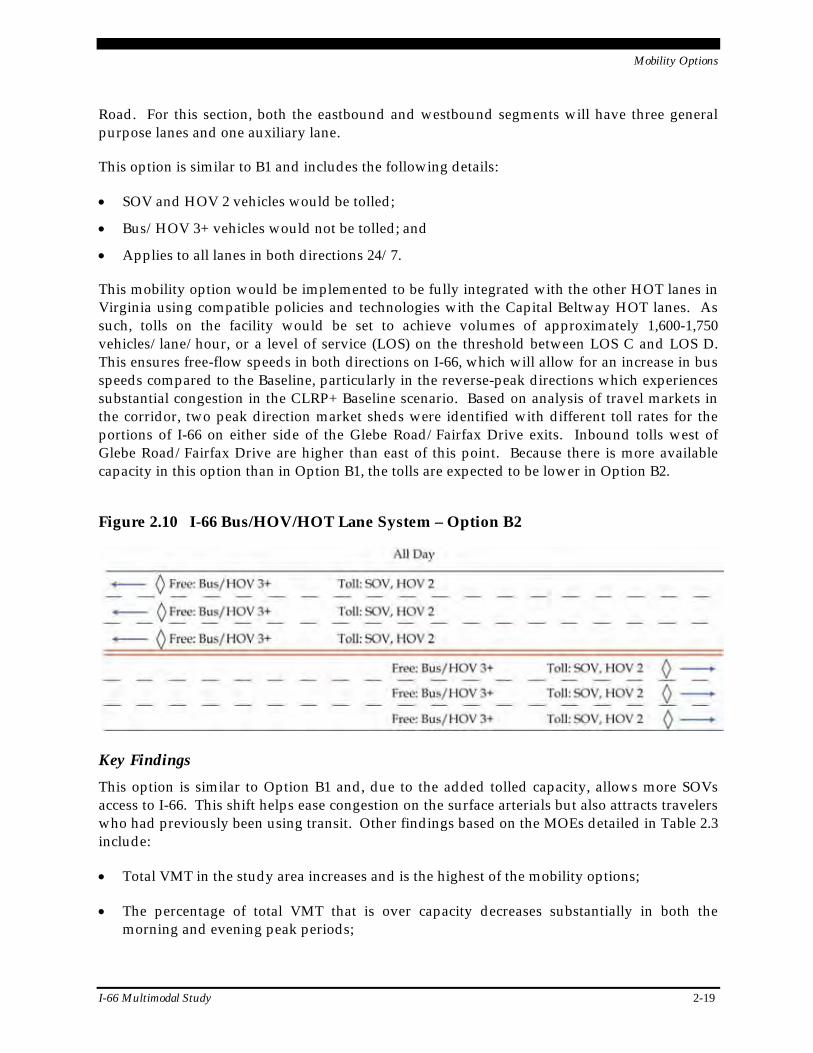
Mobility Options
I-66 Multimodal Study 2-19
Road. For this section, both the eastbound and westbound segments will have three general purpose lanes and one auxiliary lane.
This option is similar to B1 and includes the following details:
SOV and HOV 2 vehicles would be tolled;
Bus/HOV 3+ vehicles would not be tolled; and
Applies to all lanes in both directions 24/7.
This mobility option would be implemented to be fully integrated with the other HOT lanes in Virginia using compatible policies and technologies with the Capital Beltway HOT lanes. As such, tolls on the facility would be set to achieve volumes of approximately 1,600-1,750 vehicles/lane/hour, or a level of service (LOS) on the threshold between LOS C and LOS D. This ensures free-flow speeds in both directions on I-66, which will allow for an increase in bus speeds compared to the Baseline, particularly in the reverse-peak directions which experiences substantial congestion in the CLRP+ Baseline scenario. Based on analysis of travel markets in the corridor, two peak direction market sheds were identified with different toll rates for the portions of I-66 on either side of the Glebe Road/Fairfax Drive exits. Inbound tolls west of Glebe Road/Fairfax Drive are higher than east of this point. Because there is more available capacity in this option than in Option B1, the tolls are expected to be lower in Option B2.
Figure 2.10 I-66 Bus/HOV/HOT Lane System – Option B2
Key Findings
This option is similar to Option B1 and, due to the added tolled capacity, allows more SOVs access to I-66. This shift helps ease congestion on the surface arterials but also attracts travelers who had previously been using transit. Other findings based on the MOEs detailed in Table 2.3 include:
Total VMT in the study area increases and is the highest of the mobility options;
The percentage of total VMT that is over capacity decreases substantially in both the morning and evening peak periods;
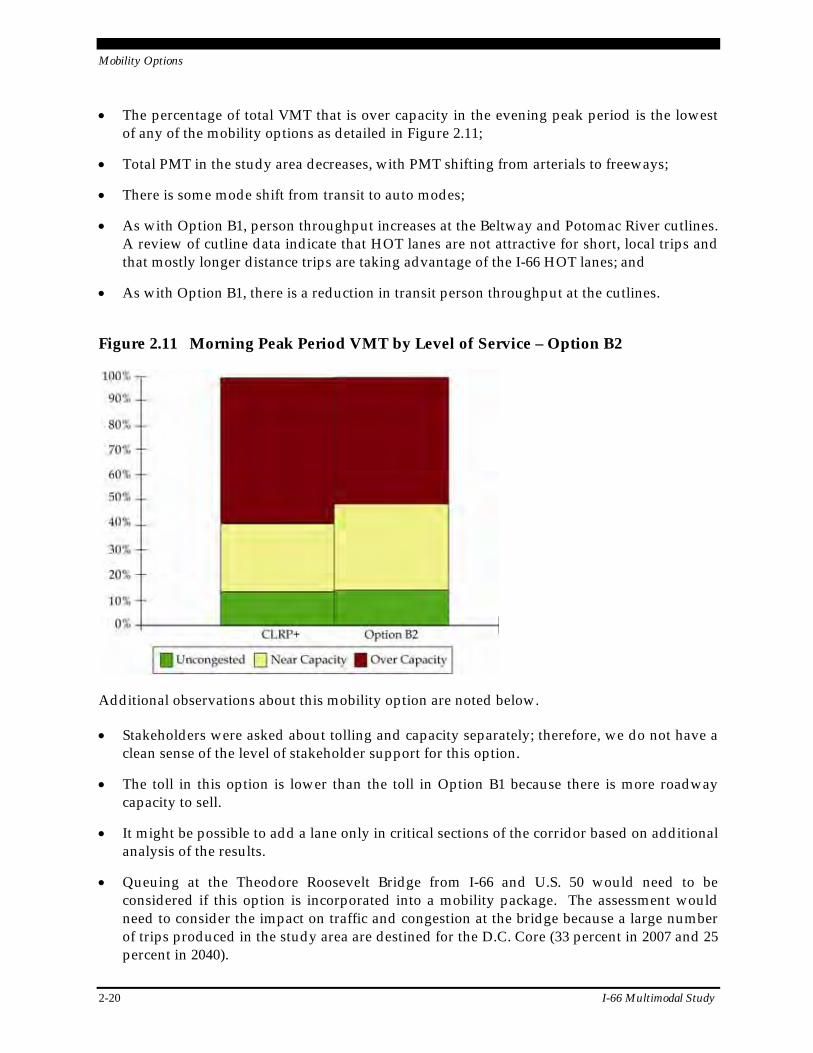
Mobility Options
2-20 I-66 Multimodal Study
The percentage of total VMT that is over capacity in the evening peak period is the lowest of any of the mobility options as detailed in Figure 2.11;
Total PMT in the study area decreases, with PMT shifting from arterials to freeways;
There is some mode shift from transit to auto modes;
As with Option B1, person throughput increases at the Beltway and Potomac River cutlines. A review of cutline data indicate that HOT lanes are not attractive for short, local trips and that mostly longer distance trips are taking advantage of the I-66 HOT lanes; and
As with Option B1, there is a reduction in transit person throughput at the cutlines.
Figure 2.11 Morning Peak Period VMT by Level of Service – Option B2
Additional observations about this mobility option are noted below.
Stakeholders were asked about tolling and capacity separately; therefore, we do not have a clean sense of the level of stakeholder support for this option.
The toll in this option is lower than the toll in Option B1 because there is more roadway capacity to sell.
It might be possible to add a lane only in critical sections of the corridor based on additional analysis of the results.
Queuing at the Theodore Roosevelt Bridge from I-66 and U.S. 50 would need to be considered if this option is incorporated into a mobility package. The assessment would need to consider the impact on traffic and congestion at the bridge because a large number of trips produced in the study area are destined for the D.C. Core (33 percent in 2007 and 25 percent in 2040).
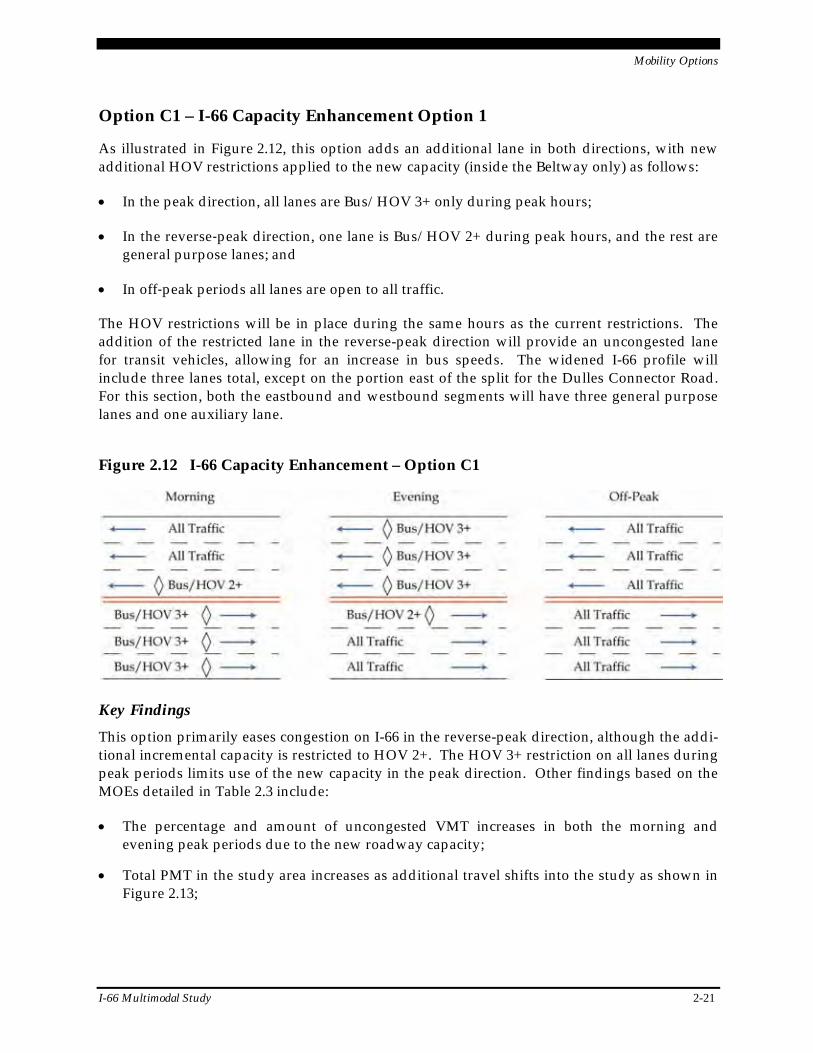
Mobility Options
I-66 Multimodal Study 2-21
Option C1 – I-66 Capacity Enhancement Option 1
As illustrated in Figure 2.12, this option adds an additional lane in both directions, with new additional HOV restrictions applied to the new capacity (inside the Beltway only) as follows:
In the peak direction, all lanes are Bus/HOV 3+ only during peak hours;
In the reverse‐peak direction, one lane is Bus/HOV 2+ during peak hours, and the rest are general purpose lanes; and
In off‐peak periods all lanes are open to all traffic.
The HOV restrictions will be in place during the same hours as the current restrictions. The addition of the restricted lane in the reverse-peak direction will provide an uncongested lane for transit vehicles, allowing for an increase in bus speeds. The widened I-66 profile will include three lanes total, except on the portion east of the split for the Dulles Connector Road. For this section, both the eastbound and westbound segments will have three general purpose lanes and one auxiliary lane.
Figure 2.12 I-66 Capacity Enhancement – Option C1
Key Findings
This option primarily eases congestion on I-66 in the reverse-peak direction, although the addi-tional incremental capacity is restricted to HOV 2+. The HOV 3+ restriction on all lanes during peak periods limits use of the new capacity in the peak direction. Other findings based on the MOEs detailed in Table 2.3 include:
The percentage and amount of uncongested VMT increases in both the morning and evening peak periods due to the new roadway capacity;
Total PMT in the study area increases as additional travel shifts into the study as shown in Figure 2.13;
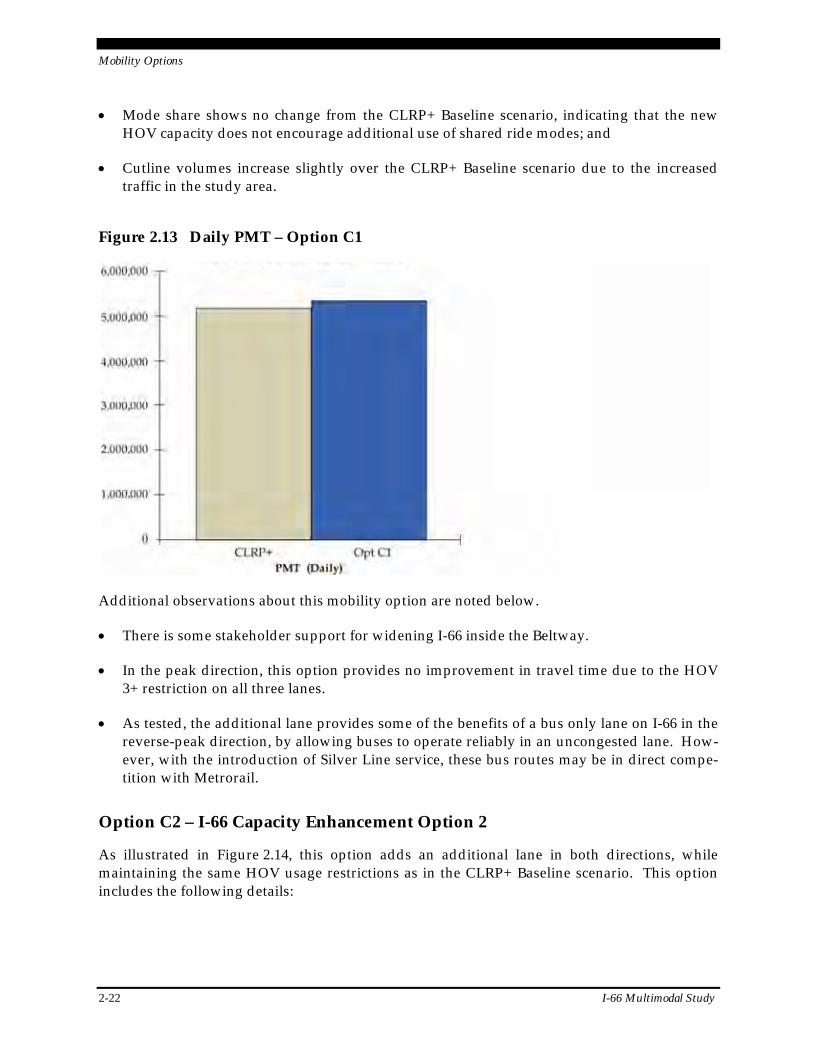
Mobility Options
2-22 I-66 Multimodal Study
Mode share shows no change from the CLRP+ Baseline scenario, indicating that the new HOV capacity does not encourage additional use of shared ride modes; and
Cutline volumes increase slightly over the CLRP+ Baseline scenario due to the increased traffic in the study area.
Figure 2.13 Daily PMT – Option C1
Additional observations about this mobility option are noted below.
There is some stakeholder support for widening I-66 inside the Beltway.
In the peak direction, this option provides no improvement in travel time due to the HOV 3+ restriction on all three lanes.
As tested, the additional lane provides some of the benefits of a bus only lane on I-66 in the reverse-peak direction, by allowing buses to operate reliably in an uncongested lane. How-ever, with the introduction of Silver Line service, these bus routes may be in direct compe-tition with Metrorail.
Option C2 – I-66 Capacity Enhancement Option 2
As illustrated in Figure 2.14, this option adds an additional lane in both directions, while maintaining the same HOV usage restrictions as in the CLRP+ Baseline scenario. This option includes the following details:
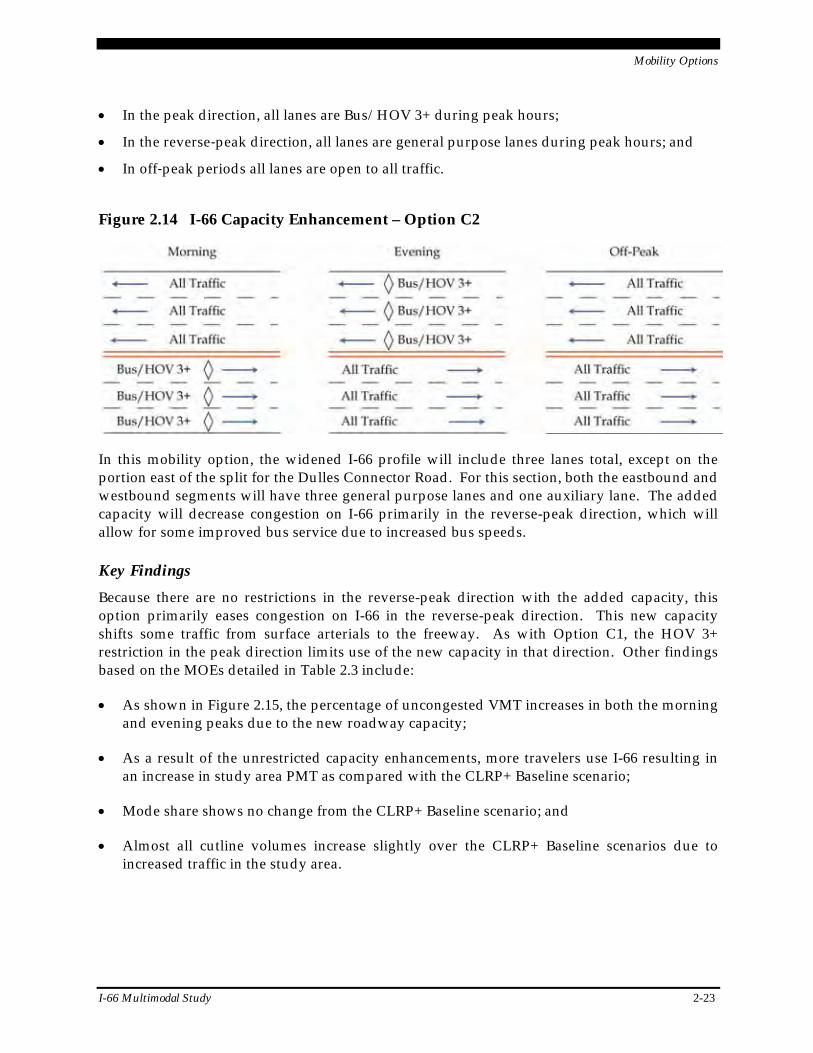
Mobility Options
I-66 Multimodal Study 2-23
In the peak direction, all lanes are Bus/HOV 3+ during peak hours;
In the reverse‐peak direction, all lanes are general purpose lanes during peak hours; and
In off‐peak periods all lanes are open to all traffic.
Figure 2.14 I-66 Capacity Enhancement – Option C2
In this mobility option, the widened I-66 profile will include three lanes total, except on the portion east of the split for the Dulles Connector Road. For this section, both the eastbound and westbound segments will have three general purpose lanes and one auxiliary lane. The added capacity will decrease congestion on I-66 primarily in the reverse-peak direction, which will allow for some improved bus service due to increased bus speeds.
Key Findings
Because there are no restrictions in the reverse-peak direction with the added capacity, this option primarily eases congestion on I-66 in the reverse-peak direction. This new capacity shifts some traffic from surface arterials to the freeway. As with Option C1, the HOV 3+ restriction in the peak direction limits use of the new capacity in that direction. Other findings based on the MOEs detailed in Table 2.3 include:
As shown in Figure 2.15, the percentage of uncongested VMT increases in both the morning and evening peaks due to the new roadway capacity;
As a result of the unrestricted capacity enhancements, more travelers use I-66 resulting in an increase in study area PMT as compared with the CLRP+ Baseline scenario;
Mode share shows no change from the CLRP+ Baseline scenario; and
Almost all cutline volumes increase slightly over the CLRP+ Baseline scenarios due to increased traffic in the study area.
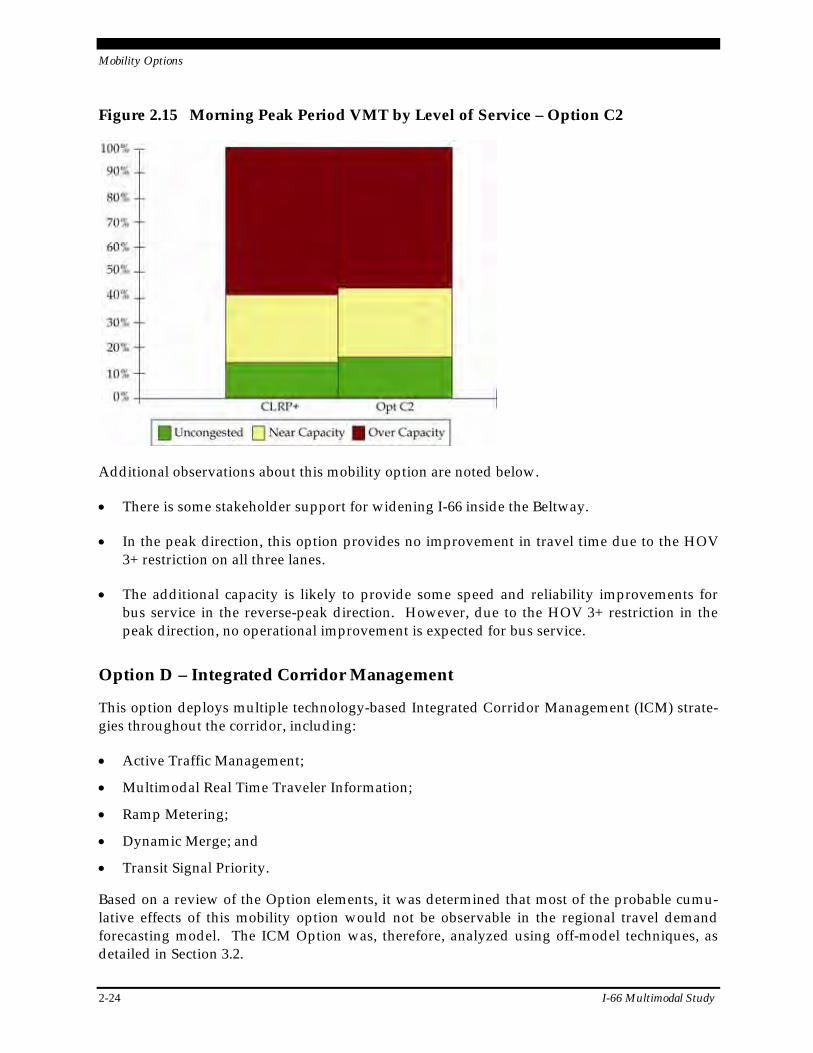
Mobility Options
2-24 I-66 Multimodal Study
Figure 2.15 Morning Peak Period VMT by Level of Service – Option C2
Additional observations about this mobility option are noted below.
There is some stakeholder support for widening I-66 inside the Beltway.
In the peak direction, this option provides no improvement in travel time due to the HOV 3+ restriction on all three lanes.
The additional capacity is likely to provide some speed and reliability improvements for bus service in the reverse-peak direction. However, due to the HOV 3+ restriction in the peak direction, no operational improvement is expected for bus service.
Option D – Integrated Corridor Management
This option deploys multiple technology-based Integrated Corridor Management (ICM) strate-gies throughout the corridor, including:
Active Traffic Management;
Multimodal Real Time Traveler Information;
Ramp Metering;
Dynamic Merge; and
Transit Signal Priority.
Based on a review of the Option elements, it was determined that most of the probable cumu-lative effects of this mobility option would not be observable in the regional travel demand forecasting model. The ICM Option was, therefore, analyzed using off-model techniques, as detailed in Section 3.2.
Mobility Options
I-66 Multimodal Study 2-25
Key Findings
The technology-based improvements implemented in this mobility option will affect both automobiles and buses, making travel in the corridor easier at key locations, such as the I-66/Dulles Connector Road merge.
Option E – Arterial Capacity Enhancement
This mobility option seeks to address arterial congestion in the study area by implementing a range of improvements to U.S. 50 inside the Beltway. This option includes a range of comple-mentary strategies and improvements designed to improve travel in the U.S. 50 corridor and increase the use of transit in the corridor. Enhancements to U.S. 50 include the following:
Application of access management principles specifically aimed at removing obstacles to high-speed travel on U.S. 50; and
Implementation of bus‐only lanes in each direction by adding new shoulders or modifying the existing shoulders to improve bus service in the corridor.
Access management along U.S. 50 would take several forms, all designed to increase speeds and roadway capacity along the facility to be similar to an expressway. This requires the con-solidation of direct access points onto U.S. 50, including commercial driveways and an increased reliance on the parallel access roads, where they exist. Based on the project team’s initial review of traffic conditions, land use, and roadway geometry along U.S. 50 and in the surrounding neighborhoods, access management changes were assumed, such as the construc-tion of grade separated interchanges, closing intersections, implementation of right-in/right-out restrictions, closing of duplicate shopping center driveways, and the provision of grade separated pedestrian facilities as appropriate. Many of these types of small-scale improve-ments cannot be represented in the regional travel demand model, but were assumed by changing operating characteristics of the facility in the model.
Bus-only lanes also were added to U.S. 50 in the study area by constructing new shoulders or modifying the existing shoulders. These bus lanes will allow buses to travel faster along U.S. 50 during the peak periods, making transit a more attractive option in the corridor. These bus lanes would operate as true shoulders during nonpeak periods, and would not be open to general traffic. To further take advantage of the new uncongested bus facility, some changes to transit service on U.S. 50 also are included as part of mobility Option E. These new routes replace the U.S. 50 Priority Bus service included in the CLRP+ Baseline scenario:
A new Express Route from Fair Lakes direct to D.C. along U.S. 50 will be implemented at 24-minute frequencies in both directions; and
A new Express Route from Tysons Corner to D.C. along Gallows Road and U.S. 50 will be implemented at 24-minute frequencies in both directions.
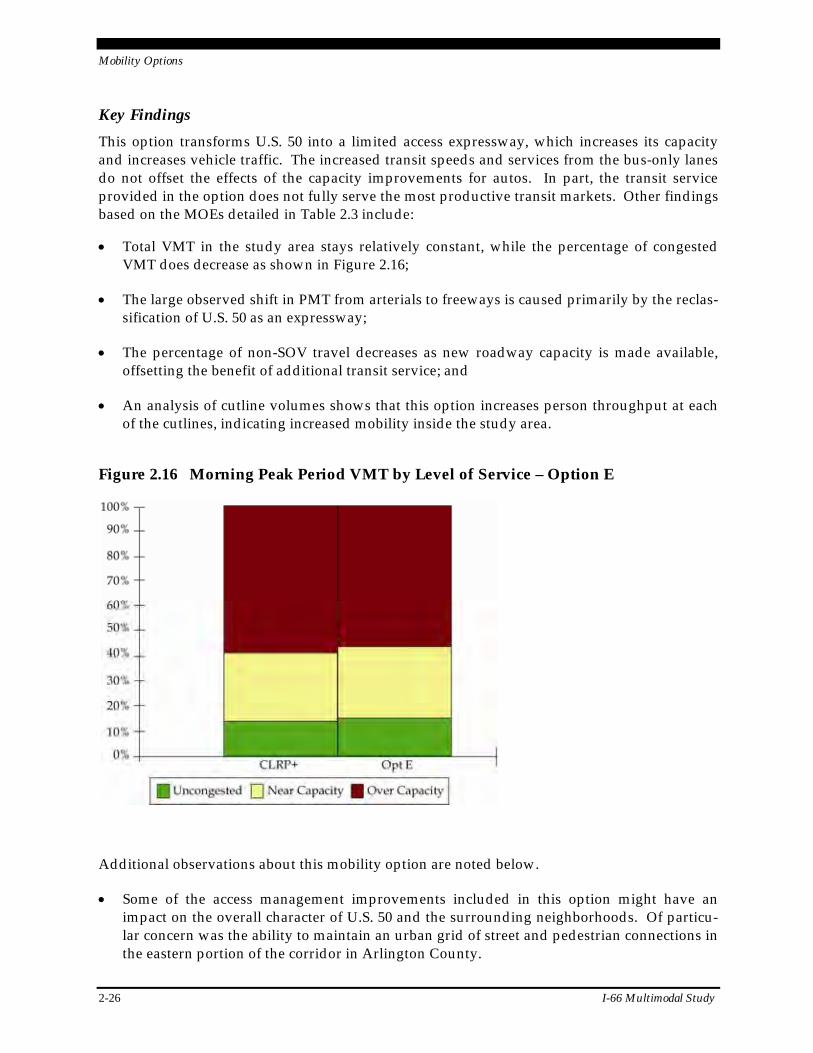
Mobility Options
2-26 I-66 Multimodal Study
Key Findings
This option transforms U.S. 50 into a limited access expressway, which increases its capacity and increases vehicle traffic. The increased transit speeds and services from the bus-only lanes do not offset the effects of the capacity improvements for autos. In part, the transit service provided in the option does not fully serve the most productive transit markets. Other findings based on the MOEs detailed in Table 2.3 include:
Total VMT in the study area stays relatively constant, while the percentage of congested VMT does decrease as shown in Figure 2.16;
The large observed shift in PMT from arterials to freeways is caused primarily by the reclas-sification of U.S. 50 as an expressway;
The percentage of non-SOV travel decreases as new roadway capacity is made available, offsetting the benefit of additional transit service; and
An analysis of cutline volumes shows that this option increases person throughput at each of the cutlines, indicating increased mobility inside the study area.
Figure 2.16 Morning Peak Period VMT by Level of Service – Option E
Additional observations about this mobility option are noted below.
Some of the access management improvements included in this option might have an impact on the overall character of U.S. 50 and the surrounding neighborhoods. Of particu-lar concern was the ability to maintain an urban grid of street and pedestrian connections in the eastern portion of the corridor in Arlington County.
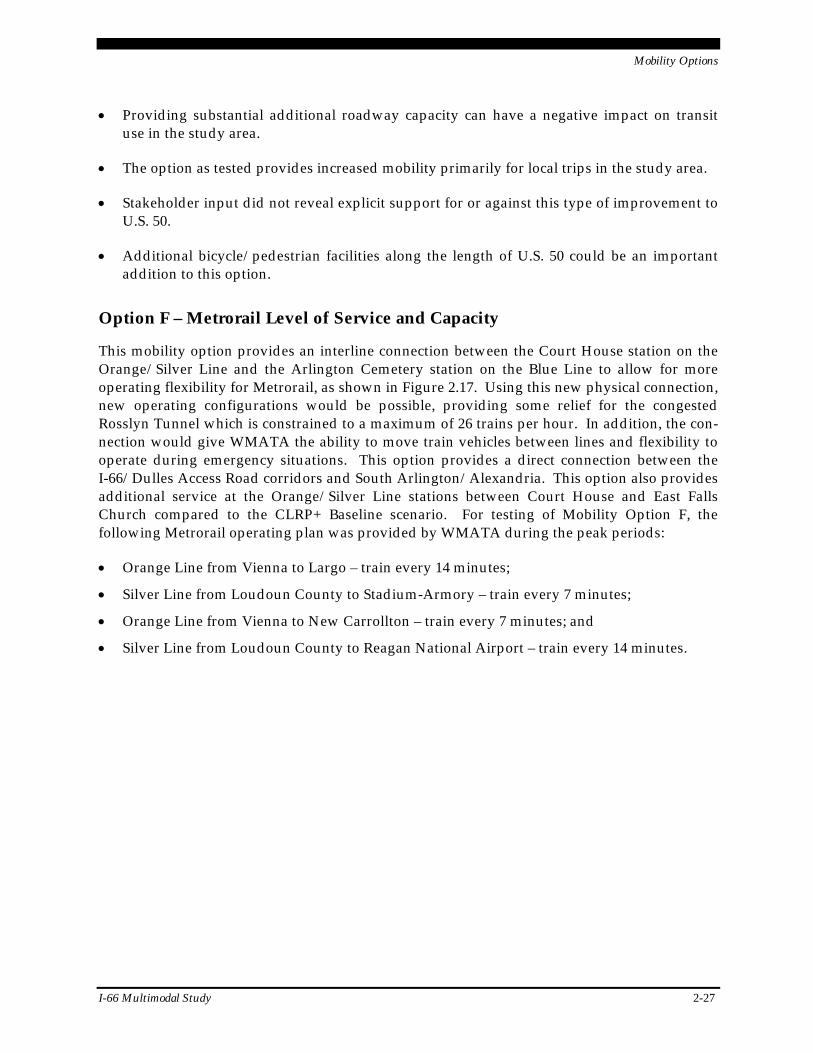
Mobility Options
I-66 Multimodal Study 2-27
Providing substantial additional roadway capacity can have a negative impact on transit use in the study area.
The option as tested provides increased mobility primarily for local trips in the study area.
Stakeholder input did not reveal explicit support for or against this type of improvement to U.S. 50.
Additional bicycle/pedestrian facilities along the length of U.S. 50 could be an important addition to this option.
Option F – Metrorail Level of Service and Capacity
This mobility option provides an interline connection between the Court House station on the Orange/Silver Line and the Arlington Cemetery station on the Blue Line to allow for more operating flexibility for Metrorail, as shown in Figure 2.17. Using this new physical connection, new operating configurations would be possible, providing some relief for the congested Rosslyn Tunnel which is constrained to a maximum of 26 trains per hour. In addition, the con-nection would give WMATA the ability to move train vehicles between lines and flexibility to operate during emergency situations. This option provides a direct connection between the I-66/Dulles Access Road corridors and South Arlington/Alexandria. This option also provides additional service at the Orange/Silver Line stations between Court House and East Falls Church compared to the CLRP+ Baseline scenario. For testing of Mobility Option F, the following Metrorail operating plan was provided by WMATA during the peak periods:
Orange Line from Vienna to Largo – train every 14 minutes;
Silver Line from Loudoun County to Stadium-Armory – train every 7 minutes;
Orange Line from Vienna to New Carrollton – train every 7 minutes; and
Silver Line from Loudoun County to Reagan National Airport – train every 14 minutes.

Mobility Options
2-28 I-66 Multimodal Study
Figure 2.17 Interline Connection – Option F
Key Findings
This option changes the operating plan for Metrorail to provide direct service between the Ronald Reagan Washington National Airport, South Arlington, the Rosslyn‐Ballston corridor, and points west along the Silver Line. This option provides additional service on the Orange/Silver Lines between Court House and East Falls Church and direct connections to new mar-kets. Flexibility of Metrorail is enhanced, but ridership effects in the study area are modest. Other findings based the MOEs detailed in Table 2.3 include:
Levels of congestion remain relatively constant when compared with the CLRP+ Baseline scenario;
Total PMT in the study area increases over the CLRP+ Baseline scenario as shown in Figure 2.18, with the largest increase of PMT occurring on freeways;
Transit mode share increases slightly over the CLRP+ Baseline scenario, with about 300 more transit trips to and from the corridor. The majority of these trips are within the study area or from the west of the study area; and
Metrorail throughput increases slightly at all of the cutlines, except the Potomac River cut-line which is probably related to the new direct rail service to points south.
An alternative Metrorail operating plan for the corridor also was studied, in which half of the eastbound Orange and Silver Line trains made use of a second interline connection between Arlington Cemetery on the Blue Line and L’Enfant Plaza on the Yellow/Green Lines. This plan
Mobility Options
I-66 Multimodal Study 2-29
performed poorly in initial testing because the routing does not serve several key stops, including Rosslyn, Pentagon, Metro Center, and the K Street area at Farragut Square.
Figure 2.18 Daily PMT – Option F
Additional observations about this mobility option are noted below.
Interline connections open opportunities to run trains to different markets, but can result in reduced frequencies for some established markets.
Station operations, specifically boarding and alightings of passengers at the core downtown stations determine the number of trains that can serve a station in a given amount of time. The current train car configurations (placement of seating and the number and placement of doors) limit dwell time at stations.
Other Metrorail improvements that were not tested in this study but which may show a more substantial impact on ridership include skip stop services, express trains, and separation of the Orange and Blue Lines. These changes are beyond the scope of this study and would have impacts throughout the metropolitan area, not just in the I-66 corridor.
As part of the 2002 Core Capacity Study, WMATA previously studied possibilities for expanding the number of tracks in this corridor. Two projects outlined in the corridor were:
1. Orange Line Virginia Express Track. This project would add a third track from the point where the Orange Line and future Silver Line meet near West Falls Church, to the point where the Orange Line converges/diverges with I-66 near Ballston. The single track would continue eastward along I-66 to Rosslyn, and tie into the Blue Line between the Rosslyn and Arlington Cemetery stations.
Mobility Options
2-30 I-66 Multimodal Study
2. Orange Line Bypass. This project would add a fourth track from the same point on the west end near West Falls Church, and continue eastward along I-66 east of Ballston as two tracks, adding a second track to the Orange Line Virginia Express Track. Approaching Rosslyn, there would be two tracks splitting off from the single Orange Line Virginia Express Track that would continue along I-66, and these two tracks would transition from an aerial structure to a tunnel to enter Rosslyn and continue under the Potomac River and into D.C. Implementation of this pair of projects would result in four tracks between West Falls Church and Ballston.
As part of WMATA’s Regional Transit System Plan (RTSP) effort, forecasts indicated that while the combination of Orange and Silver Lines will be highly utilized in the I-66 corridor and there will be a need to increase capacity in the D.C./Arlington core, assuming that WMATA can operate eight-car trains at 26 trains per hour, additional tracks in the corridor were not required until after 2040.
The I-66 Multimodal Study did confirm the horizontal clearance feasibility of a pocket track in the median east of the East Falls Church station to accommodate short-turns of Silver Line trains during off-peak periods. Such a pocket track would primarily provide operational flexibility.
Previous investment in Metrorail has resulted in a high-capacity transit service in the study area. The CLRP+ Baseline scenario already assumes that this service is operating at its full capacity in the peak periods, with 26 eight-car trains per hour. Without major additional infra-structure improvements inside and outside the study area, such as a new Metrorail Potomac River crossing, no additional Metrorail capacity improvements are possible. As such, it is unlikely that any changes in an operating plan not associated with major infrastructure improvements in the region will result in major increases in Metrorail ridership levels within the time horizon of the I-66 Multimodal Study.
Option G – Bus Transit Level of Service and Capacity
This mobility option includes a range of enhancements to local, commuter, and regional bus services, including bus route changes and additions throughout the study area. These enhancements are based on previous planning studies, including jurisdictional Transit Development Plans and the I-66 Transit/TDM Study. Option G includes the following enhancements to bus service in the study area above the service in the CLRP+ Baseline scenario:
Improve the I-66 Priority Bus between Haymarket and the D.C. Core to 10-minute frequen-cies in both directions during the peak and off-peak periods;
Improve the I-66 Priority Bus between Centreville and the D.C. Core to 10-minute frequen-cies in both directions during the peak and off-peak periods;
Increase frequency on U.S. 29 Priority Bus from Fair Lakes to the D.C. Core to 10 minutes in both directions during the peak and off-peak periods;
Mobility Options
I-66 Multimodal Study 2-31
Increase the frequency on U.S. 50 Priority Bus from Fair Lakes to the D.C. Core via Ballston to 10-minute frequencies in both directions during the peak and off-peak periods;
New Route 1X: Limited stop service from Ballston to Vienna along Wilson Boulevard and U.S. 50 at 12-minute peak and 20-minute off-peak frequencies;
New Route 28E: Weekdays only between Skyline Plaza and East Falls Church station at 30-minute peak and 60-minute off-peak frequencies;
Restructuring of routes 2A, 2B, 2C, and 2G primarily affects routing outside the Beltway;
Split Route 3A at East Falls Church station with a 20-minute frequency;
Increase frequency on Route 3B to 20 minutes during the peak and 30 minutes during the off-peak;
Terminate Route 4A at Seven Corners resulting in the 4-line service operating at 10-minute peak period and 20-minute off-peak period frequencies along VA 7;
Add a new ART route between Arlington Hall and Crystal City;
Add a new ART route between Pentagon City and Court House station;
Expand service on ART#75 to include more late night and weekend service;
Improvement to ART#77, including extending to the Rosslyn Metro station, adding week-end service, and increasing the weekday frequency to 20 minutes;
Increase peak period frequency on Route 38B to 10 minutes;
Coordinate improvements to the Loudoun County Cascade route with the start of Metrorail Silver Line service; and
Implement several new Loudoun County Commuter Bus routes with new park-and-ride lots and service on I-66, including Ashburn North, Route 15 North, Landsdowne, and One Loudoun.
Key Findings
This option substantially increases bus service in the corridor and has the most positive impact on reducing the level of congestion in the study area. The increased transit service also attracts new transit riders and reduces the single-occupancy vehicle commuter mode share in the study area. Other findings based on the MOEs detailed in Table 2.3 include:
Option G has the lowest VMT of any of the mobility options;
Both the number and percentage of congested VMT decreases during the morning and evening peak periods;
PMT on Metrorail decreases as improved bus services attract transit riders;
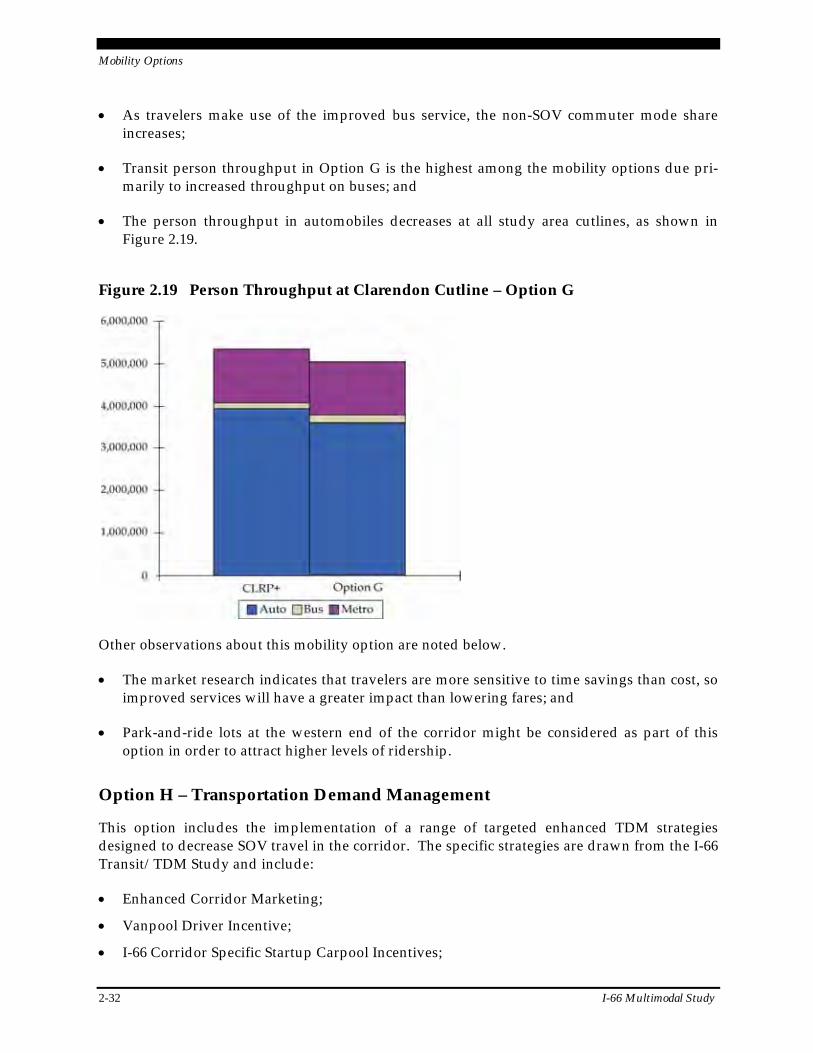
Mobility Options
2-32 I-66 Multimodal Study
As travelers make use of the improved bus service, the non-SOV commuter mode share increases;
Transit person throughput in Option G is the highest among the mobility options due pri-marily to increased throughput on buses; and
The person throughput in automobiles decreases at all study area cutlines, as shown in Figure 2.19.
Figure 2.19 Person Throughput at Clarendon Cutline – Option G
Other observations about this mobility option are noted below.
The market research indicates that travelers are more sensitive to time savings than cost, so improved services will have a greater impact than lowering fares; and
Park-and-ride lots at the western end of the corridor might be considered as part of this option in order to attract higher levels of ridership.
Option H – Transportation Demand Management
This option includes the implementation of a range of targeted enhanced TDM strategies designed to decrease SOV travel in the corridor. The specific strategies are drawn from the I-66 Transit/TDM Study and include:
Enhanced Corridor Marketing;
Vanpool Driver Incentive;
I-66 Corridor Specific Startup Carpool Incentives;
Mobility Options
I-66 Multimodal Study 2-33
Rideshare Program Operational Support;
Carsharing at Priority Bus Activity Nodes;
Enhanced Virginia Vanpool Insurance Pool and
Enhanced Telework!VA.
Based on a review of the likely effects of enhanced TDM programs and the focus of the regional travel demand forecasting model, it was determined that these strategies should be analyzed using off-model techniques. More details about program specifics and the analysis can be found in the TDM portion of Section 3.2.
Key Findings
A range of improved TDM strategies and programs, including marketing and outreach, vanpool programs, and financial incentives will be able to attract some new commuters to alternative modes, decreasing the SOV mode share for work trips. The success of this option is dependent on the level of investment, as detailed in Section 3.2.
Option I – Bicycle/Pedestrian System Enhancements
This mobility option includes the implementation of a range of bicycle and pedestrian improvements of varying scales. These elements will add new connections (on- and off-road) to address gaps in the nonmotorized network in the study area. It also improves bicycle/pedestrian access to transit (bus and rail), expands bicycle parking at transit stations, and expands the bikesharing program. Because the TPB regional travel demand forecasting model is not sensitive to changes in the physical bicycle and pedestrian networks, this mobility was evaluated using off-model techniques. More detail about the analysis and the proposed improvements included as part of this mobility option can be found in Section 3.2.
Key Findings
This option includes many improvements to the pedestrian and bicycle systems designed to make nonmotorized travel in the study area easier and more appealing. The improvements are especially focused on improving access to Metrorail stations and encouraging more transit use.
2.4 Mobility Option Summary Findings
Table 2.3 provides the detailed MOE results for each of the nine mobility options that were tested using the regional travel demand forecasting model. The results of each option can be compared to the results of using the CLRP+ network with the abbreviated process outlined in Section 2.2. This Baseline scenario is shown in the tables below. As previously noted, the mode choice results of the mobility options and the CLRP+ Baseline shown in Table 2.3 should be viewed with the understanding that non-congested road speeds were used as inputs to the mode choice model. Additionally, without the speed feedback to trip distribution, the results shown do not reflect any changes in travel patterns which might result from the proposed options.
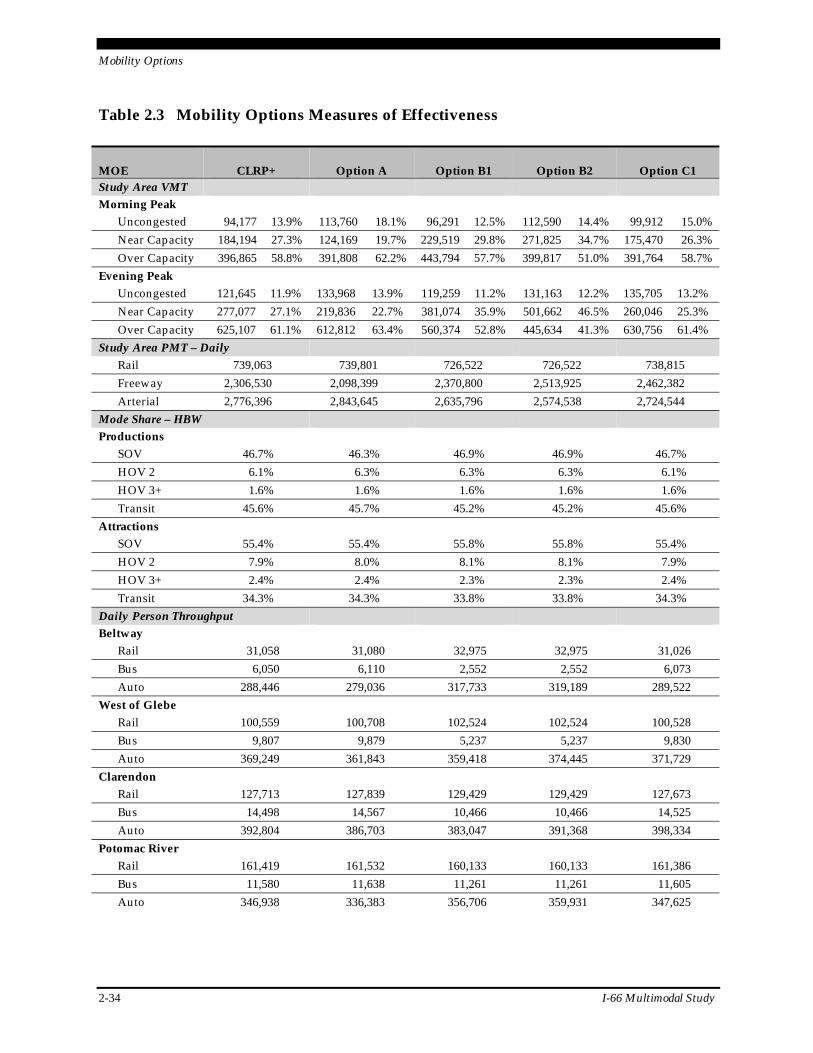
Mobility Options
2-34 I-66 Multimodal Study
Table 2.3 Mobility Options Measures of Effectiveness
MOE CLRP+ Option A Option B1 Option B2 Option C1 Study Area VMT Morning Peak
Uncongested 94,177 13.9% 113,760 18.1% 96,291 12.5% 112,590 14.4% 99,912 15.0%
Near Capacity 184,194 27.3% 124,169 19.7% 229,519 29.8% 271,825 34.7% 175,470 26.3%
Over Capacity 396,865 58.8% 391,808 62.2% 443,794 57.7% 399,817 51.0% 391,764 58.7% Evening Peak
Uncongested 121,645 11.9% 133,968 13.9% 119,259 11.2% 131,163 12.2% 135,705 13.2%
Near Capacity 277,077 27.1% 219,836 22.7% 381,074 35.9% 501,662 46.5% 260,046 25.3%
Over Capacity 625,107 61.1% 612,812 63.4% 560,374 52.8% 445,634 41.3% 630,756 61.4% Study Area PMT – Daily
Rail 739,063 739,801 726,522 726,522 738,815
Freeway 2,306,530 2,098,399 2,370,800 2,513,925 2,462,382
Arterial 2,776,396 2,843,645 2,635,796 2,574,538 2,724,544 Mode Share – HBW Productions
SOV 46.7% 46.3% 46.9% 46.9% 46.7%
HOV 2 6.1% 6.3% 6.3% 6.3% 6.1%
HOV 3+ 1.6% 1.6% 1.6% 1.6% 1.6%
Transit 45.6% 45.7% 45.2% 45.2% 45.6% Attractions
SOV 55.4% 55.4% 55.8% 55.8% 55.4%
HOV 2 7.9% 8.0% 8.1% 8.1% 7.9%
HOV 3+ 2.4% 2.4% 2.3% 2.3% 2.4%
Transit 34.3% 34.3% 33.8% 33.8% 34.3% Daily Person Throughput Beltway
Rail 31,058 31,080 32,975 32,975 31,026
Bus 6,050 6,110 2,552 2,552 6,073
Auto 288,446 279,036 317,733 319,189 289,522 West of Glebe
Rail 100,559 100,708 102,524 102,524 100,528
Bus 9,807 9,879 5,237 5,237 9,830
Auto 369,249 361,843 359,418 374,445 371,729 Clarendon
Rail 127,713 127,839 129,429 129,429 127,673
Bus 14,498 14,567 10,466 10,466 14,525
Auto 392,804 386,703 383,047 391,368 398,334
Potomac River Rail 161,419 161,532 160,133 160,133 161,386
Bus 11,580 11,638 11,261 11,261 11,605
Auto 346,938 336,383 356,706 359,931 347,625
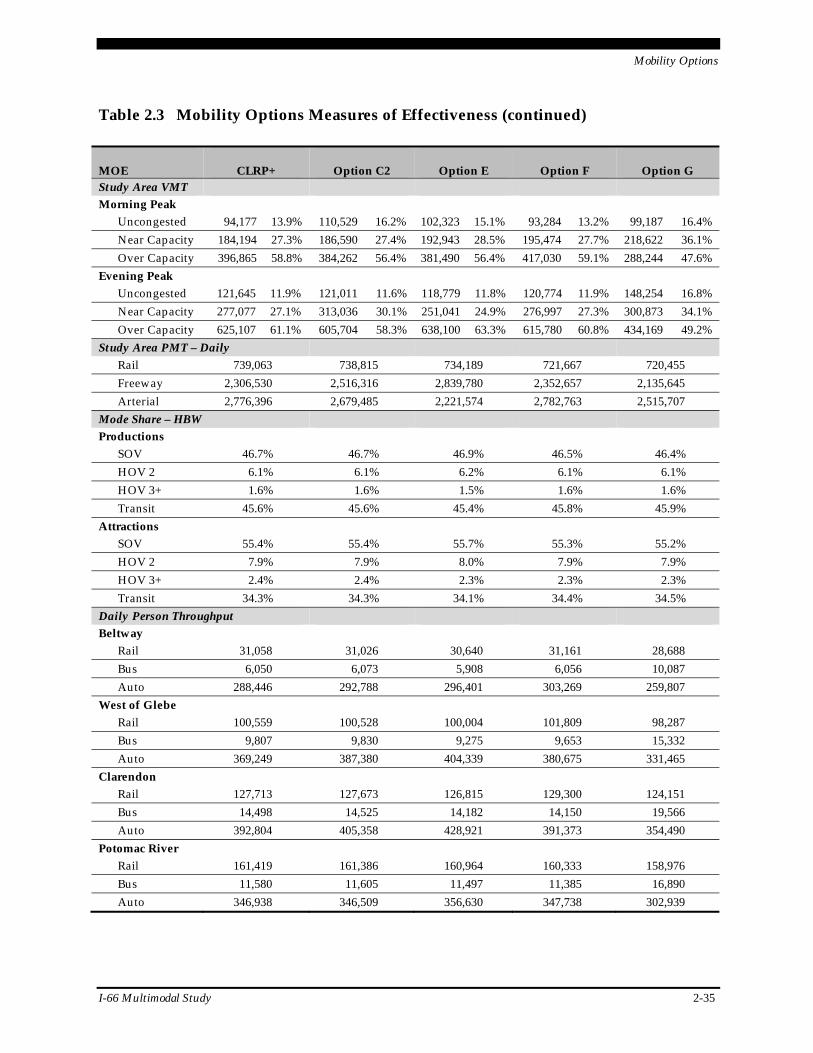
Mobility Options
I-66 Multimodal Study 2-35
Table 2.3 Mobility Options Measures of Effectiveness (continued)
MOE CLRP+ Option C2 Option E Option F Option G Study Area VMT Morning Peak
Uncongested 94,177 13.9% 110,529 16.2% 102,323 15.1% 93,284 13.2% 99,187 16.4%
Near Capacity 184,194 27.3% 186,590 27.4% 192,943 28.5% 195,474 27.7% 218,622 36.1%
Over Capacity 396,865 58.8% 384,262 56.4% 381,490 56.4% 417,030 59.1% 288,244 47.6% Evening Peak
Uncongested 121,645 11.9% 121,011 11.6% 118,779 11.8% 120,774 11.9% 148,254 16.8%
Near Capacity 277,077 27.1% 313,036 30.1% 251,041 24.9% 276,997 27.3% 300,873 34.1%
Over Capacity 625,107 61.1% 605,704 58.3% 638,100 63.3% 615,780 60.8% 434,169 49.2% Study Area PMT – Daily
Rail 739,063 738,815 734,189 721,667 720,455
Freeway 2,306,530 2,516,316 2,839,780 2,352,657 2,135,645
Arterial 2,776,396 2,679,485 2,221,574 2,782,763 2,515,707 Mode Share – HBW Productions
SOV 46.7% 46.7% 46.9% 46.5% 46.4%
HOV 2 6.1% 6.1% 6.2% 6.1% 6.1%
HOV 3+ 1.6% 1.6% 1.5% 1.6% 1.6%
Transit 45.6% 45.6% 45.4% 45.8% 45.9% Attractions
SOV 55.4% 55.4% 55.7% 55.3% 55.2%
HOV 2 7.9% 7.9% 8.0% 7.9% 7.9%
HOV 3+ 2.4% 2.4% 2.3% 2.3% 2.3%
Transit 34.3% 34.3% 34.1% 34.4% 34.5% Daily Person Throughput Beltway
Rail 31,058 31,026 30,640 31,161 28,688
Bus 6,050 6,073 5,908 6,056 10,087
Auto 288,446 292,788 296,401 303,269 259,807 West of Glebe
Rail 100,559 100,528 100,004 101,809 98,287
Bus 9,807 9,830 9,275 9,653 15,332
Auto 369,249 387,380 404,339 380,675 331,465 Clarendon
Rail 127,713 127,673 126,815 129,300 124,151
Bus 14,498 14,525 14,182 14,150 19,566
Auto 392,804 405,358 428,921 391,373 354,490
Potomac River Rail 161,419 161,386 160,964 160,333 158,976
Bus 11,580 11,605 11,497 11,385 16,890
Auto 346,938 346,509 356,630 347,738 302,939

Mobility Options
2-36 I-66 Multimodal Study
This page intentionally left blank.
Multimodal Packages
3-1
3.0 Multimodal Packages
Based on the analysis of the mobility options, described in Section 2.0, and input from the Participating Agency Representatives Committee (PARC) and stakeholders, four multimodal packages were developed. Each package included a variety of projects and programs to reduce congestion and improve mobility within the study area.
These four packages were comprised of elements of previously tested mobility options with some modifications and enhancements to address the congestion and mobility goals of the corridor. All packages include a highway and transit component, integrated corridor manage-ment (ICM) solutions, transportation demand management (TDM) programs, and a range of pedestrian and bicycle improvements.
3.1 Approach to Building Multimodal Packages
The assessment of the mobility options described in Section 2.0 was advanced for more detailed evaluation and included both qualitative and quantitative analyses.
Facilitated Workshop to Determine Packages
To move from mobility options to multimodal packages, a facilitated workshop with the Public Agency Representative Committee (PARC) was conducted to collaboratively formulate pack-ages, giving consideration to the following aspects of each mobility option:
Technical analysis of the measures of effectiveness;
Market research findings;
Stakeholder and elected official interview input; and
Public comments.
This approach expanded the travel demand forecasting model evaluation that was applied for the mobility options and allowed an opportunity for a variety of perspectives to be considered in formulating the packages.
As described in Section 2.0, the process of testing solutions for addressing congestion and mobility in the I-66 corridor uses information generated from the mobility option technical analysis to organize mobility options into multimodal packages. The purpose of the abbre-viated modeling process described in Section 2.3 was to evaluate each mobility option so that strategies could be carried forward into the multimodal packages. Overall, the technical analy-sis was focused on:
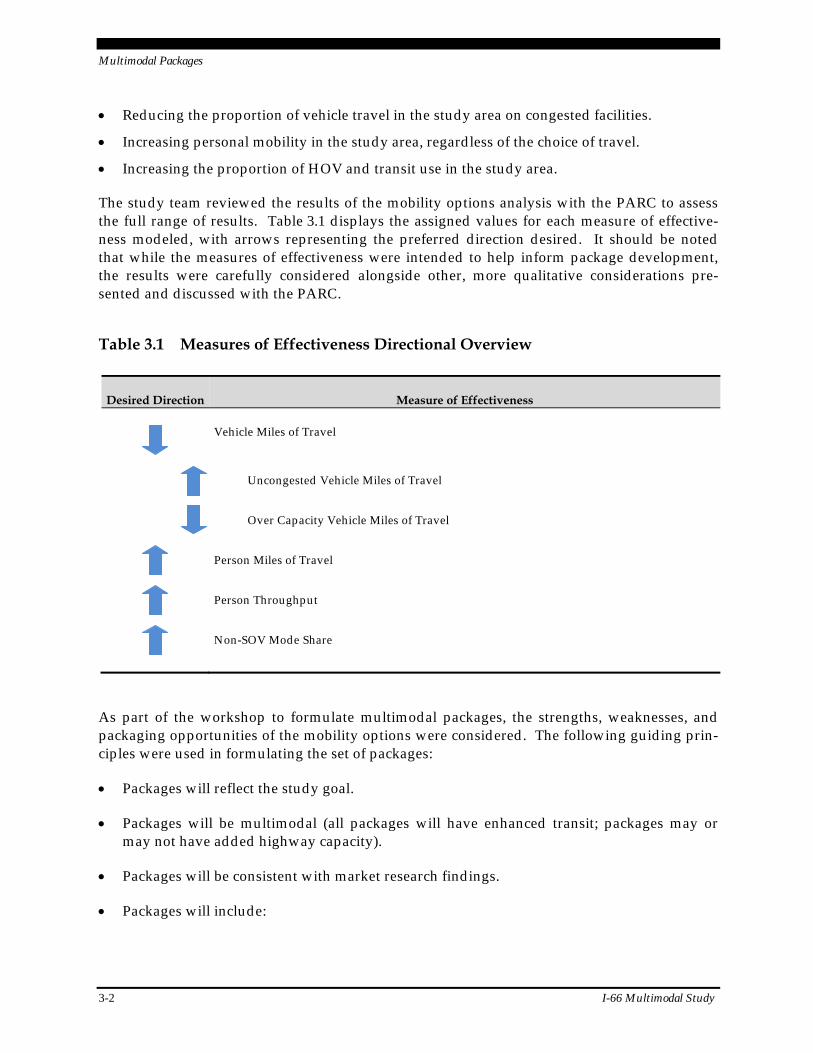
Multimodal Packages
3-2 I-66 Multimodal Study
Reducing the proportion of vehicle travel in the study area on congested facilities.
Increasing personal mobility in the study area, regardless of the choice of travel.
Increasing the proportion of HOV and transit use in the study area.
The study team reviewed the results of the mobility options analysis with the PARC to assess the full range of results. Table 3.1 displays the assigned values for each measure of effective-ness modeled, with arrows representing the preferred direction desired. It should be noted that while the measures of effectiveness were intended to help inform package development, the results were carefully considered alongside other, more qualitative considerations pre-sented and discussed with the PARC.
Table 3.1 Measures of Effectiveness Directional Overview
Desired Direction Measure of Effectiveness
Vehicle Miles of Travel
Uncongested Vehicle Miles of Travel
Over Capacity Vehicle Miles of Travel
Person Miles of Travel
Person Throughput
Non-SOV Mode Share
As part of the workshop to formulate multimodal packages, the strengths, weaknesses, and packaging opportunities of the mobility options were considered. The following guiding prin-ciples were used in formulating the set of packages:
Packages will reflect the study goal.
Packages will be multimodal (all packages will have enhanced transit; packages may or may not have added highway capacity).
Packages will be consistent with market research findings.
Packages will include:
Multimodal Packages
I-66 Multimodal Study 3-3
CLRP+ improvements (CLRP projects for 2040 and recommendations from the I-66 Transit/TDM Study);
Option D, Integrated Corridor Management;
Option H, Transportation Demand Management; and
Option I, Bicycle/Pedestrian System Enhancements, with specific system and/or transit access project(s) as appropriate.
Multimodal Packages Determination
As a result of the workshop, four multimodal packages were assembled to address specific capacity needs and congestion issues in the corridor as shown in Table 3.2. Two mobility options were not carried forward to the packages: Option E – Arterial Capacity Enhancement and Option F – Metrorail Level of Service and Capacity.
Based on input from the PARC and various stakeholders, Option E was seen as being particu-larly difficult to implement at the scale proposed, although elements of Option E were carried forward into other packages.
With regard to Option F, previous and already planned investment in the Metrorail Orange and Silver Lines has resulted in a high-capacity transit service in the corridor and study area. Option F was initially conceived as a means of enhancing the Metrorail service in the corridor and/or increasing Metrorail ridership. However, initial forecasting results and subsequent dis-cussions with WMATA revealed that, while interline connections might provide improved ser-vice for some transit markets; they would not increase the total capacity of the Orange Line, but would rather substitute some rail trips for others. In fact, WMATA indicated that significant infrastructure improvements would be needed inside and/or adjacent to the study area to pro-vide more capacity for Metrorail in this corridor. As indicated elsewhere in this report, provi-sion of 100 percent eight-car trains at the headways assumed in this study represents the maximum Metrorail capacity that can be achieved without major infrastructure enhancements, such as an additional Metrorail Potomac River crossing.
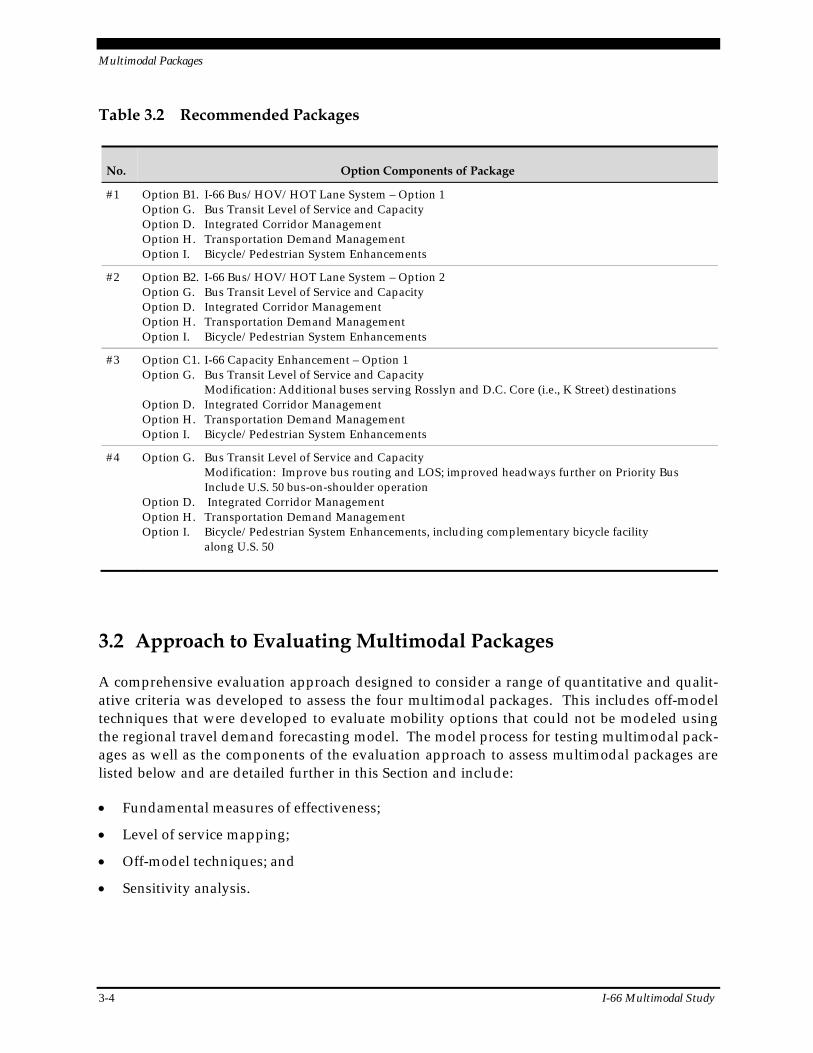
Multimodal Packages
3-4 I-66 Multimodal Study
Table 3.2 Recommended Packages
No. Option Components of Package
#1 Option B1. I-66 Bus/HOV/HOT Lane System – Option 1 Option G. Bus Transit Level of Service and Capacity Option D. Integrated Corridor Management Option H. Transportation Demand Management Option I. Bicycle/Pedestrian System Enhancements
#2 Option B2. I-66 Bus/HOV/HOT Lane System – Option 2 Option G. Bus Transit Level of Service and Capacity Option D. Integrated Corridor Management Option H. Transportation Demand Management Option I. Bicycle/Pedestrian System Enhancements
#3 Option C1. I-66 Capacity Enhancement – Option 1 Option G. Bus Transit Level of Service and Capacity Modification: Additional buses serving Rosslyn and D.C. Core (i.e., K Street) destinations Option D. Integrated Corridor Management Option H. Transportation Demand Management Option I. Bicycle/Pedestrian System Enhancements
#4 Option G. Bus Transit Level of Service and Capacity Modification: Improve bus routing and LOS; improved headways further on Priority Bus Include U.S. 50 bus-on-shoulder operation Option D. Integrated Corridor Management Option H. Transportation Demand Management Option I. Bicycle/Pedestrian System Enhancements, including complementary bicycle facility
along U.S. 50
3.2 Approach to Evaluating Multimodal Packages
A comprehensive evaluation approach designed to consider a range of quantitative and qualit-ative criteria was developed to assess the four multimodal packages. This includes off-model techniques that were developed to evaluate mobility options that could not be modeled using the regional travel demand forecasting model. The model process for testing multimodal pack-ages as well as the components of the evaluation approach to assess multimodal packages are listed below and are detailed further in this Section and include:
Fundamental measures of effectiveness;
Level of service mapping;
Off-model techniques; and
Sensitivity analysis.
Multimodal Packages
I-66 Multimodal Study 3-5
Model Process for Testing Multimodal Packages
As described in Section 2.2, the earlier technical analysis conducted for the mobility options utilized an abbreviated model approach that did not include a feedback loop in the modeling process. For the multimodal package testing, the full model process was used. Figure 3.1 shows an overview of the full modeling process, including a feedback loop to trip distribution and trip generation. The feedback loop allows for congestion on the transportation network to be incorporated into travel decisions. Congestion on the network can impact the distance a trip travels, the mode of travel, and the path taken. Incorporating the feedback loop impacts the origin and destination, mode choice, and, ultimately, the travel path selected as part of the assignment model.
The full model included running a “pump prime” iteration which is completed to develop base congested speeds. The “pump prime” iteration is followed by four full iterations of the model. For the package assessment phase, full model runs of the regional travel demand forecasting model were conducted, including all of the feedback loops resulting in the final fourth iteration trip tables and loaded transportation networks. Lead Agency and PARC input was reflected in the modeling details and each package was coded into the TPB Version 2.3 travel demand fore-casting model and a forecast was generated. As with the mobility option analysis in Section 2.0, the results focus on comparisons between the CLRP+ Baseline scenario and each package.
Limitations of the regional travel demand forecasting model necessitated the adoption of off-model techniques to evaluate the Integrated Corridor Management, Transportation Demand Management, and bicycle/pedestrian system components of each multimodal package.
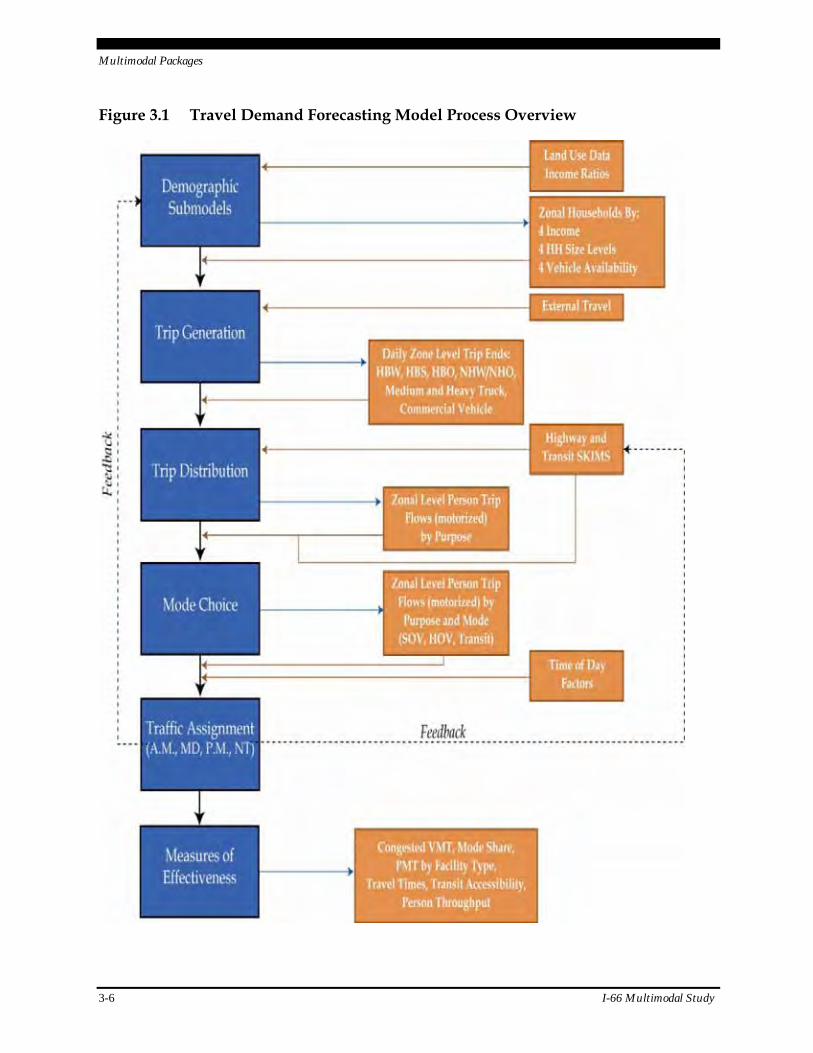
Multimodal Packages
3-6 I-66 Multimodal Study
Figure 3.1 Travel Demand Forecasting Model Process Overview
Multimodal Packages
I-66 Multimodal Study 3-7
Measures of Effectiveness
Performance measures or measures of effectiveness, which were generated for each of the mobility options, were produced for each package as well as some additional measures. As in the options analysis, these measures help assess how well packages address issues and needs and the study goals. Emphasis was on the following parameters, which are outputs from the travel demand forecasting model:
Vehicle Miles of Travel (VMT) – VMT quantifies the amount of travel by motorized vehicles in the study area. VMT was calculated in the study area during the morning and evening peak periods and divided into three categories based on congestion levels: uncon-gested, near capacity, and over capacity. The division into these categories was based on volume to capacity ratios. Preferred are packages that reduce congested VMT in the study area, both in quantity and percentage.
Person Miles of Travel (PMT) – PMT quantifies the amount of travel by people in the study area, and does include travel on transit, although nonmotorized travel is not included. Daily PMT was calculated for three facility types in the study area: rail, free-ways, and arterials. The PMT numbers for freeways and arterials include travel by bus passengers on those facilities as well as automobile drivers and passengers. Preferred are packages that increase PMT in the study area, especially packages in which the PMT increases more than the VMT. This condition indicates packages which have higher use of transit and other shared ride modes.
Non-SOV Mode Share – Daily mode shares were calculated for all trip purposes starting or ending in the study area. Focus was given to the commuting trips from home to work and from work to home. This trip purpose contributes to the majority of transit trips. These trips tend to be longer than other trip purposes and have greater impact on the network. They are defined in the model as Home-Based Work (HBW) trips. Preferred are packages that increase the HBW share of non-SOV travel (Transit, HOV 2, and HOV 3+) in the study area. For the multimodal packages, the mode share was also calculated for all trip purposes combined.
Person Throughput – Person throughput is calculated as the number of people crossing a cutline by rail, bus, or auto daily, in either direction. This measure was evaluated at four cutlines along the corridor, (shown in Section 2.0, Figure 2.2). Preferred are packages that increase person throughput.
Travel Time – Travel time differences within the corridor were calculated for highway (bro-ken out by SOV and HOV) and for transit. The travel times were calculated for the following select origin and destination pairs: Rosslyn, Ballston, and the D.C. core, Pentagon, Seven Corners, Tysons Corner, Reston, Manassas, Merrifield, and the City of Fairfax. Changes reflect improved (or degraded) mobility and accessibility only within the corridor, including improved (or degraded) connections to activity centers that are located in or near the study area. This comparison does not include changes in travel times beyond the study area.
Multimodal Packages
3-8 I-66 Multimodal Study
Transit Accessibility – Transit accessibility was measured as the number of households and jobs with access to bus service in the study area. Given the high level of transit service in the study area this measure did not change very much between alternatives.
Nonmotorized Travel – Nonmotorized travel was measured by looking at the number of nonmotorized trips generated by the model for the defined study area. This measure included walk access transit trips for both the production end and the attraction end in the defined study area.
Level of Service Mapping
For each multimodal package, level of service (LOS) maps were generated to illustrate the effect of the transportation improvements within each package on network and modal performance. LOS maps were produced for the highway facilities, arterials, transit service, and bicycle facili-ties (on- and off-road) in the study area. An overview of the methodologies used for producing the LOS maps and transit evaluations are detailed below.
Freeway Facilities
For I-66, the LOS was calculated using procedures outlined in the 2000 Highway Capacity Manual (HCM). This included mainline segments, weave segments, and merge and diverge segments. The traffic volume output from the travel demand forecast model was post-processed based on the procedures outlined in National Cooperative Highway Research Program (NCHRP) Technical Report 255 “Highway Traffic Data for Urbanized Area Project Planning and Design.” Freeway LOS maps were generated representing the following scenarios:
Eastbound and westbound peak hour (morning and evening) existing conditions;
Eastbound and westbound peak hour (morning and evening) CLRP+ Baseline; and
Eastbound and westbound peak hour (morning and evening) for Package 1 through 4.
For all freeway LOS maps, I-66 conditions are displayed for eastbound and westbound together on each map.
Arterial Roadways
Arterial level of service was calculated based on the volume to capacity ratio calculated by the regional travel demand forecasting model on four major east/west arterial corridors in the study area. The volume to capacity ratios were then equated to a specific LOS based on criteria outline in the 1985 HCM. Arterial LOS maps were generated representing the following scenarios:
Eastbound and westbound peak hour (morning and evening) existing conditions;
Eastbound and westbound peak hour (morning and evening) CLRP+ Baseline; and
Eastbound and westbound peak hour (morning and evening) for Package 1 through 4.

Multimodal Packages
I-66 Multimodal Study 3-9
Transit (Bus and Rail)
Transit Level of Service is calculated based on a number of different, related factors. This study focused on two specific transit LOS factors to illustrate the availability and efficiency of transit service (bus and rail) in each of the packages. The LOS factor values are shown in the maps and tables below and should be compared to the values in the CLRP+ Baseline scenario.
Frequency – Availability of transit service was calculated based on frequency of service for inbound transit (bus and rail) during the morning peak period in the study area. These service frequencies are used as an input to the travel demand forecasting process. Bus frequencies were calculated for all types of bus service (e.g., local, express) and shown on maps for each of the packages. Metrorail frequency, as measured by the number of Metrorail trains per peak hour, also is shown in Figure 3.4. It should be noted that since none of the multimodal packages make any changes to the Metrorail service, this LOS factor remains constant across all of the options.
Load Factor – Load factors are an output of the travel demand forecasting model and are calculated by dividing the total number of transit passengers by the available transit capacity. This measures the quality of transit service by capturing changes in convenience and comfort for transit riders. Transit load factors were calculated for the CLRP+ Baseline and for each package for inbound transit (bus and rail) during the morning peak period in the study area. Metrorail and bus load factors were generated at four cutlines along the corridor, (shown in Section 2.0, Figure 2.2). For Metrorail, this measure is calculated as the number of passengers per car crossing a cutline by rail in the peak direction. Railcars are assumed to have a maxi-mum capacity of 120 passengers. For bus, this measure is calculated as the number of passen-gers per bus crossing a cutline by bus in the peak direction. A standard 40-foot bus is assumed to have 40 seats. Metrorail and bus load factors are shown for each package and in Section 3.4, Table 3.23 and Table 3.24.
Bicycle and Pedestrian
Bicycle and pedestrian projects were evaluated for their potential to improve the functionality and comfort of the study area bicycle network for nonmotorized travelers. Because different models are used to evaluate on-road and off-road bicycle facilities, the LOS techniques applied are described separately. LOS was generated for linear improvements (on-road bicycle routes and off-road trails and shared use paths) only, as projects are intended to focus on access to transit and east/west linear movement in the study area.
Bicycle LOS
Bicycle Level of Service (BLOS) is used for on-road (e.g., bicycle lanes, wide shoulders) level of service analysis. The resulting score reflects a typical bicyclist’s level of comfort with the riding conditions. Essentially, BLOS identifies the quality of service for bicyclists that exists within the roadway environment – currently, or based on future improvements being incorporated into the model.
The BLOS Model Version 2.0 (BLOS Model) was used for the evaluation of bicycling conditions in shared roadway environments. The BLOS Model is based on research documented in
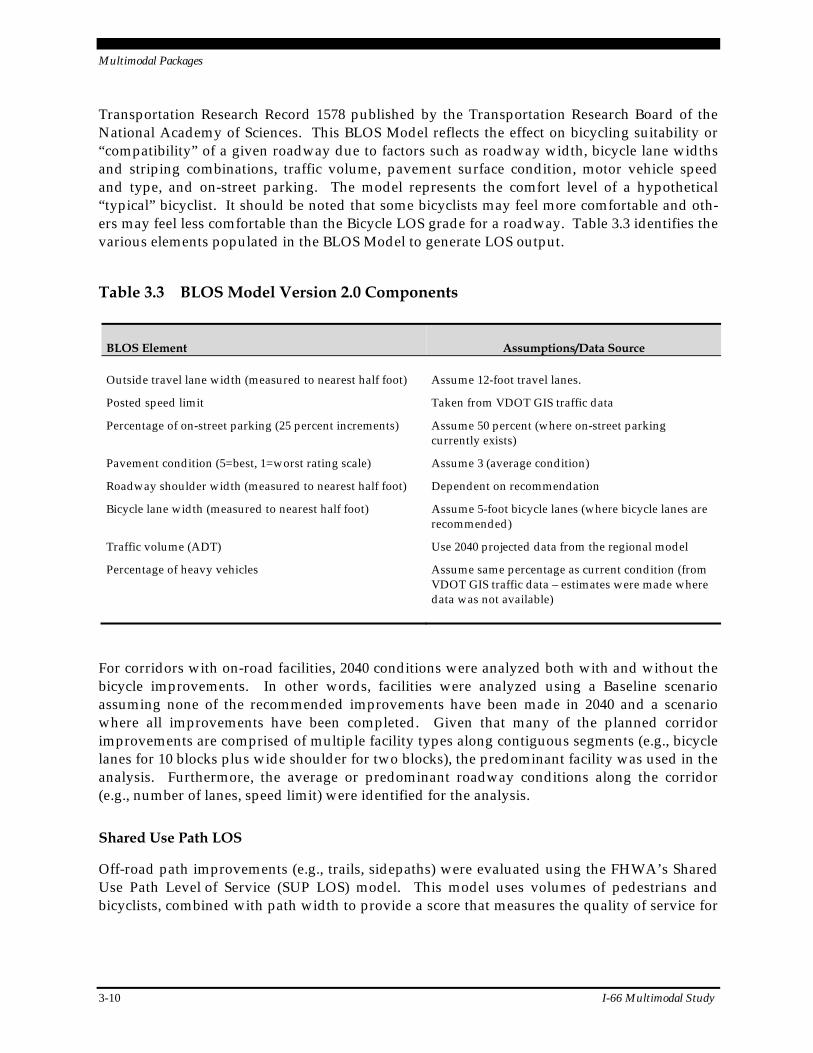
Multimodal Packages
3-10 I-66 Multimodal Study
Transportation Research Record 1578 published by the Transportation Research Board of the National Academy of Sciences. This BLOS Model reflects the effect on bicycling suitability or “compatibility” of a given roadway due to factors such as roadway width, bicycle lane widths and striping combinations, traffic volume, pavement surface condition, motor vehicle speed and type, and on-street parking. The model represents the comfort level of a hypothetical “typical” bicyclist. It should be noted that some bicyclists may feel more comfortable and oth-ers may feel less comfortable than the Bicycle LOS grade for a roadway. Table 3.3 identifies the various elements populated in the BLOS Model to generate LOS output.
Table 3.3 BLOS Model Version 2.0 Components
BLOS Element Assumptions/Data Source
Outside travel lane width (measured to nearest half foot) Assume 12-foot travel lanes.
Posted speed limit Taken from VDOT GIS traffic data
Percentage of on-street parking (25 percent increments) Assume 50 percent (where on-street parking currently exists)
Pavement condition (5=best, 1=worst rating scale) Assume 3 (average condition)
Roadway shoulder width (measured to nearest half foot) Dependent on recommendation
Bicycle lane width (measured to nearest half foot) Assume 5-foot bicycle lanes (where bicycle lanes are recommended)
Traffic volume (ADT) Use 2040 projected data from the regional model
Percentage of heavy vehicles Assume same percentage as current condition (from VDOT GIS traffic data – estimates were made where data was not available)
For corridors with on-road facilities, 2040 conditions were analyzed both with and without the bicycle improvements. In other words, facilities were analyzed using a Baseline scenario assuming none of the recommended improvements have been made in 2040 and a scenario where all improvements have been completed. Given that many of the planned corridor improvements are comprised of multiple facility types along contiguous segments (e.g., bicycle lanes for 10 blocks plus wide shoulder for two blocks), the predominant facility was used in the analysis. Furthermore, the average or predominant roadway conditions along the corridor (e.g., number of lanes, speed limit) were identified for the analysis.
Shared Use Path LOS
Off-road path improvements (e.g., trails, sidepaths) were evaluated using the FHWA’s Shared Use Path Level of Service (SUP LOS) model. This model uses volumes of pedestrians and bicyclists, combined with path width to provide a score that measures the quality of service for
Multimodal Packages
I-66 Multimodal Study 3-11
bicyclists on a hard-surface, multiuse (e.g., pedestrians, roller bladers, and bicyclists) path or trail. Bicyclist’s perceived SUP LOS is affected by four main factors:1
Path width;
Active passes (frequency of encountering and passing other users in the same direction);
Meetings (frequency of encountering other users in the opposite direction); and
The presence of a striped centerline.
For off-road facilities, 2040 conditions were analyzed both with and without the bicycle improvements. In other words, facilities were analyzed using a Baseline scenario assuming none of the recommended improvements were made and a scenario where all improvements have been completed. Unless otherwise specified, all pathways were assumed to be 10 feet in width. Pathway user/rider volumes were assumed to be the current pathway volumes (where available) multiplied by the regional model’s projected increase in nonmotorized travel by 2040 (51.8 percent) for the region. Where existing pathway user counts were unavailable, pathway user counts from facilities in similar contexts (similar density and land use) were used.
Off-Model Techniques
As described in Section 2.0, due to limitations of the regional travel demand forecasting model, off-model techniques were applied to evaluate the ICM, TDM, and Bicycle/Pedestrian System Enhancements aspects of the multimodal packages. Further detail on these evaluation tech-niques are described in Section 3.8 through Sections 3.10.
Sensitivity Testing
With input from the PARC, two sensitivity analyses were defined and selected for testing. The sensitivity tests were conducted using the travel demand forecasting model and are described in further detail in Section 3.5.
3.3 Baseline Assumptions for 2040
As noted in Section 2.2, the 2040 Baseline for the I-66 Multimodal Study is called the CLRP+ Baseline and is comprised of the 2011 CLRP plus the recommended bus services and TDM measures from the 2009 I-66 Transit/TDM study. Specifically, the planned improvements in the study area which are included in the 2011 CLRP are indicated in Table 3.4 (designated as CLRP). The table also indicates improvements that were recommended in the I-66 Transit/TDM Study (designated as CLRP+). The CLRP+ Baseline scenario also includes Metrorail core capacity improvements, including 100 percent eight-car trains.
1 FHWA-HRT-05-138, Shared-Use Path Level of Service Calculator—A User’s Guide, July 2006, U.S.
DOT/FHWA.
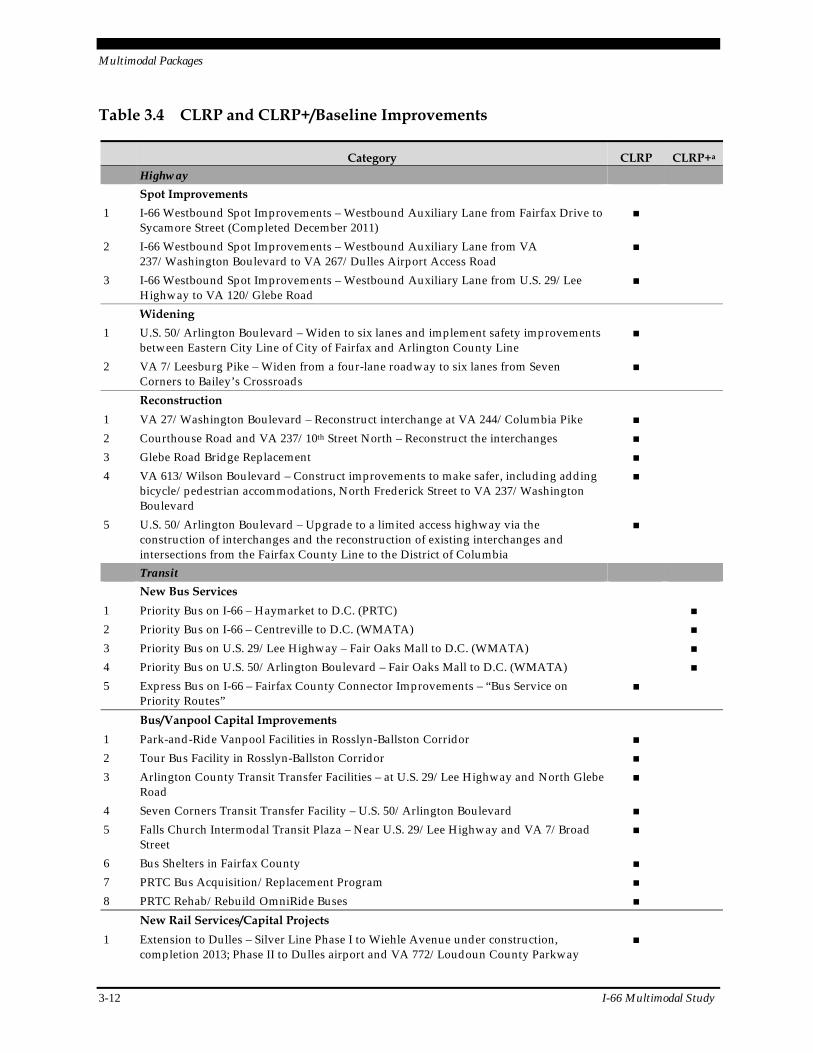
Multimodal Packages
3-12 I-66 Multimodal Study
Table 3.4 CLRP and CLRP+/Baseline Improvements
Category CLRP CLRP+a Highway
Spot Improvements
1 I-66 Westbound Spot Improvements – Westbound Auxiliary Lane from Fairfax Drive to Sycamore Street (Completed December 2011)
■
2 I-66 Westbound Spot Improvements – Westbound Auxiliary Lane from VA 237/Washington Boulevard to VA 267/Dulles Airport Access Road
■
3 I-66 Westbound Spot Improvements – Westbound Auxiliary Lane from U.S. 29/Lee Highway to VA 120/Glebe Road
■
Widening
1 U.S. 50/Arlington Boulevard – Widen to six lanes and implement safety improvements between Eastern City Line of City of Fairfax and Arlington County Line
■
2 VA 7/Leesburg Pike – Widen from a four-lane roadway to six lanes from Seven Corners to Bailey’s Crossroads
■
Reconstruction
1 VA 27/Washington Boulevard – Reconstruct interchange at VA 244/Columbia Pike ■
2 Courthouse Road and VA 237/10th Street North – Reconstruct the interchanges ■
3 Glebe Road Bridge Replacement ■
4 VA 613/Wilson Boulevard – Construct improvements to make safer, including adding bicycle/pedestrian accommodations, North Frederick Street to VA 237/Washington Boulevard
■
5 U.S. 50/Arlington Boulevard – Upgrade to a limited access highway via the construction of interchanges and the reconstruction of existing interchanges and intersections from the Fairfax County Line to the District of Columbia
■
Transit
New Bus Services
1 Priority Bus on I-66 – Haymarket to D.C. (PRTC) ■
2 Priority Bus on I-66 – Centreville to D.C. (WMATA) ■
3 Priority Bus on U.S. 29/Lee Highway – Fair Oaks Mall to D.C. (WMATA) ■
4 Priority Bus on U.S. 50/Arlington Boulevard – Fair Oaks Mall to D.C. (WMATA) ■
5 Express Bus on I-66 – Fairfax County Connector Improvements – “Bus Service on Priority Routes”
■
Bus/Vanpool Capital Improvements
1 Park-and-Ride Vanpool Facilities in Rosslyn-Ballston Corridor ■
2 Tour Bus Facility in Rosslyn-Ballston Corridor ■
3 Arlington County Transit Transfer Facilities – at U.S. 29/Lee Highway and North Glebe Road
■
4 Seven Corners Transit Transfer Facility – U.S. 50/Arlington Boulevard ■
5 Falls Church Intermodal Transit Plaza – Near U.S. 29/Lee Highway and VA 7/Broad Street
■
6 Bus Shelters in Fairfax County ■
7 PRTC Bus Acquisition/Replacement Program ■
8 PRTC Rehab/Rebuild OmniRide Buses ■
New Rail Services/Capital Projects
1 Extension to Dulles – Silver Line Phase I to Wiehle Avenue under construction, completion 2013; Phase II to Dulles airport and VA 772/Loudoun County Parkway
■
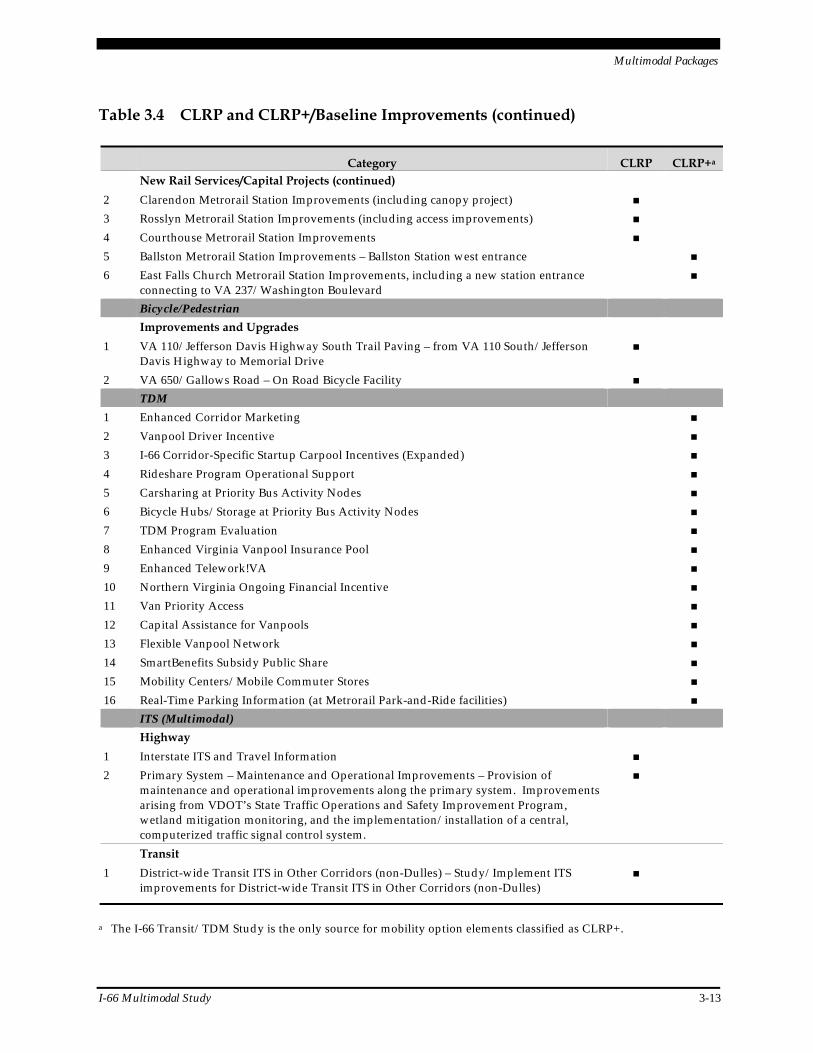
Multimodal Packages
I-66 Multimodal Study 3-13
Table 3.4 CLRP and CLRP+/Baseline Improvements (continued)
Category CLRP CLRP+a New Rail Services/Capital Projects (continued)
2 Clarendon Metrorail Station Improvements (including canopy project) ■
3 Rosslyn Metrorail Station Improvements (including access improvements) ■
4 Courthouse Metrorail Station Improvements ■
5 Ballston Metrorail Station Improvements – Ballston Station west entrance ■
6 East Falls Church Metrorail Station Improvements, including a new station entrance connecting to VA 237/Washington Boulevard
■
Bicycle/Pedestrian
Improvements and Upgrades
1 VA 110/Jefferson Davis Highway South Trail Paving – from VA 110 South/Jefferson Davis Highway to Memorial Drive
■
2 VA 650/Gallows Road – On Road Bicycle Facility ■
TDM
1 Enhanced Corridor Marketing ■
2 Vanpool Driver Incentive ■
3 I-66 Corridor-Specific Startup Carpool Incentives (Expanded) ■
4 Rideshare Program Operational Support ■
5 Carsharing at Priority Bus Activity Nodes ■
6 Bicycle Hubs/Storage at Priority Bus Activity Nodes ■
7 TDM Program Evaluation ■
8 Enhanced Virginia Vanpool Insurance Pool ■
9 Enhanced Telework!VA ■
10 Northern Virginia Ongoing Financial Incentive ■
11 Van Priority Access ■
12 Capital Assistance for Vanpools ■
13 Flexible Vanpool Network ■
14 SmartBenefits Subsidy Public Share ■
15 Mobility Centers/Mobile Commuter Stores ■
16 Real-Time Parking Information (at Metrorail Park-and-Ride facilities) ■
ITS (Multimodal)
Highway
1 Interstate ITS and Travel Information ■
2 Primary System – Maintenance and Operational Improvements – Provision of maintenance and operational improvements along the primary system. Improvements arising from VDOT’s State Traffic Operations and Safety Improvement Program, wetland mitigation monitoring, and the implementation/installation of a central, computerized traffic signal control system.
■
Transit
1 District-wide Transit ITS in Other Corridors (non-Dulles) – Study/Implement ITS improvements for District-wide Transit ITS in Other Corridors (non-Dulles)
■
a The I-66 Transit/TDM Study is the only source for mobility option elements classified as CLRP+.
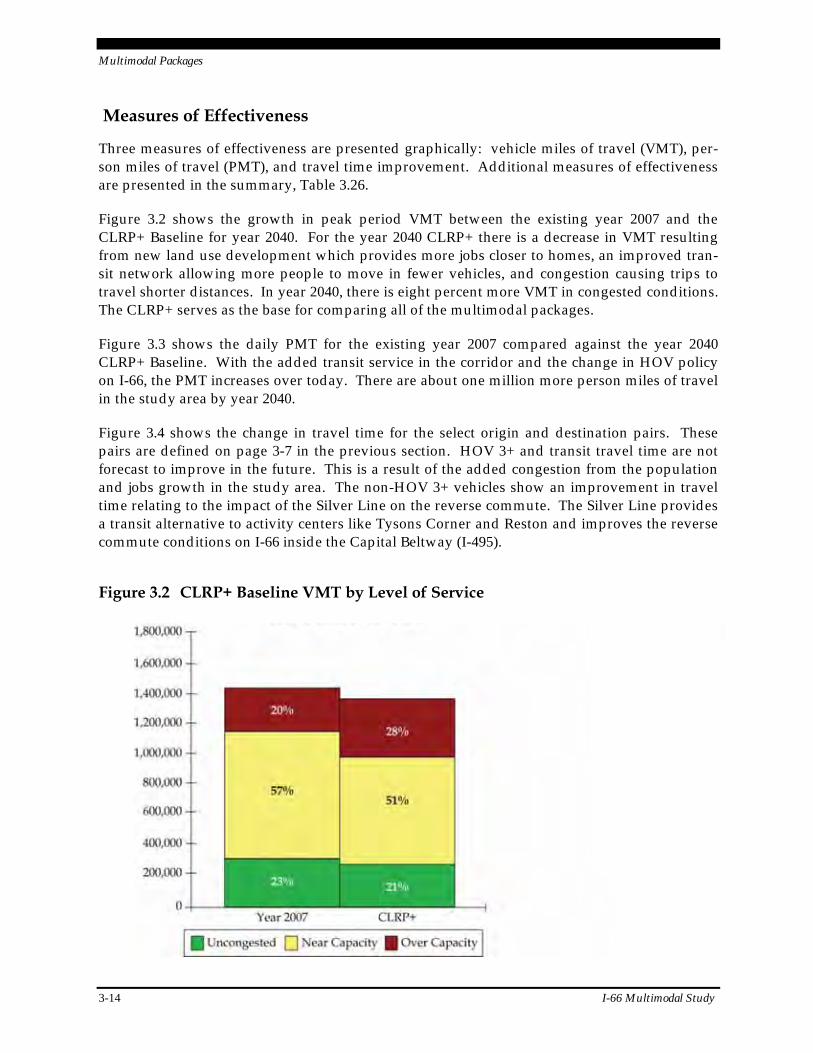
Multimodal Packages
3-14 I-66 Multimodal Study
Measures of Effectiveness
Three measures of effectiveness are presented graphically: vehicle miles of travel (VMT), per-son miles of travel (PMT), and travel time improvement. Additional measures of effectiveness are presented in the summary, Table 3.26.
Figure 3.2 shows the growth in peak period VMT between the existing year 2007 and the CLRP+ Baseline for year 2040. For the year 2040 CLRP+ there is a decrease in VMT resulting from new land use development which provides more jobs closer to homes, an improved tran-sit network allowing more people to move in fewer vehicles, and congestion causing trips to travel shorter distances. In year 2040, there is eight percent more VMT in congested conditions. The CLRP+ serves as the base for comparing all of the multimodal packages.
Figure 3.3 shows the daily PMT for the existing year 2007 compared against the year 2040 CLRP+ Baseline. With the added transit service in the corridor and the change in HOV policy on I-66, the PMT increases over today. There are about one million more person miles of travel in the study area by year 2040.
Figure 3.4 shows the change in travel time for the select origin and destination pairs. These pairs are defined on page 3-7 in the previous section. HOV 3+ and transit travel time are not forecast to improve in the future. This is a result of the added congestion from the population and jobs growth in the study area. The non-HOV 3+ vehicles show an improvement in travel time relating to the impact of the Silver Line on the reverse commute. The Silver Line provides a transit alternative to activity centers like Tysons Corner and Reston and improves the reverse commute conditions on I-66 inside the Capital Beltway (I-495).
Figure 3.2 CLRP+ Baseline VMT by Level of Service
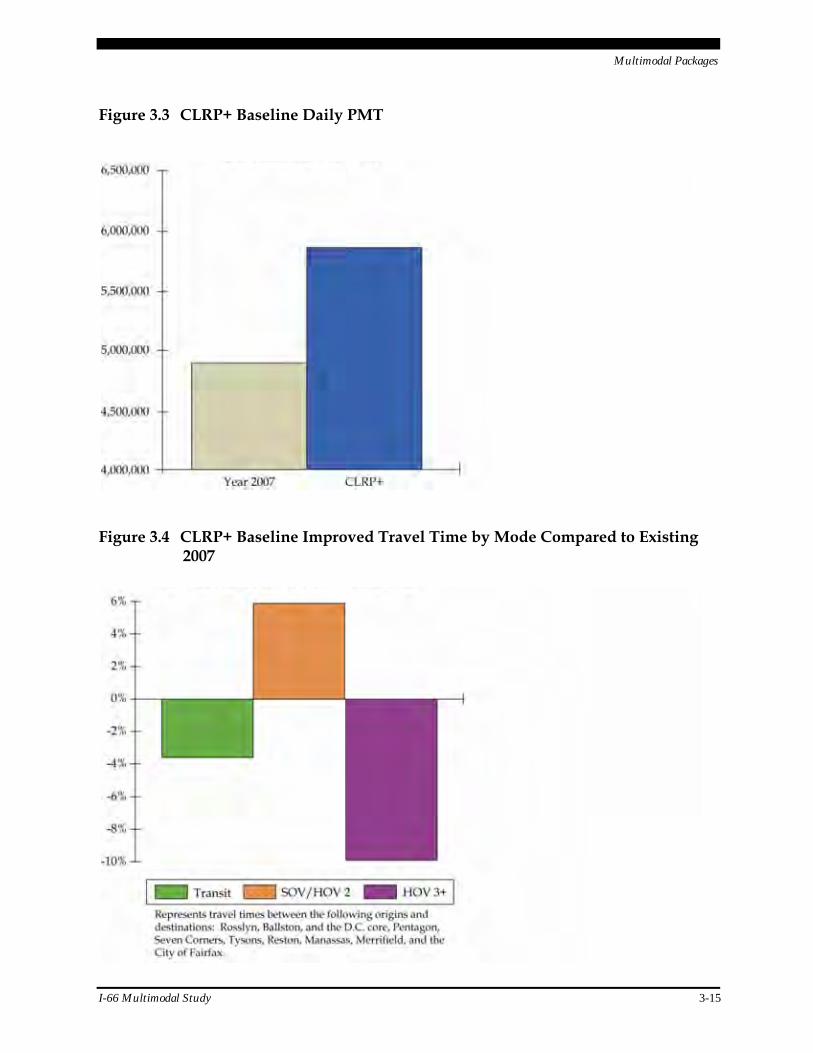
Multimodal Packages
I-66 Multimodal Study 3-15
Figure 3.3 CLRP+ Baseline Daily PMT
Figure 3.4 CLRP+ Baseline Improved Travel Time by Mode Compared to Existing 2007
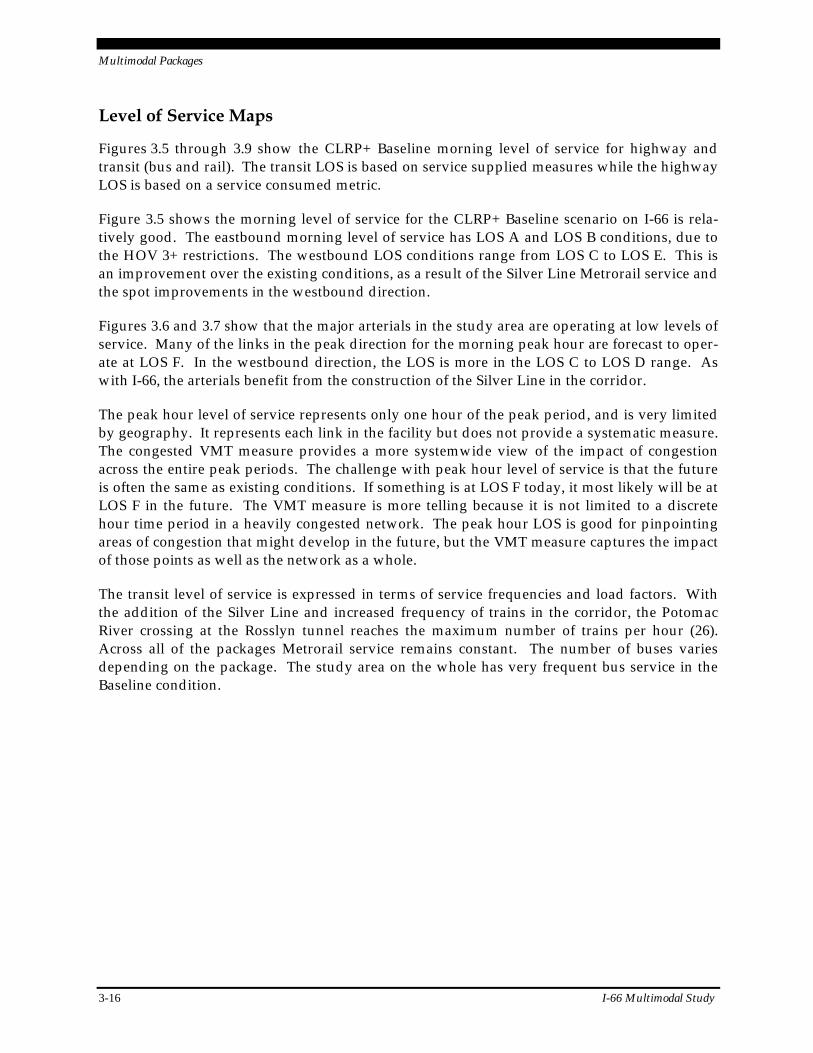
Multimodal Packages
3-16 I-66 Multimodal Study
Level of Service Maps
Figures 3.5 through 3.9 show the CLRP+ Baseline morning level of service for highway and transit (bus and rail). The transit LOS is based on service supplied measures while the highway LOS is based on a service consumed metric.
Figure 3.5 shows the morning level of service for the CLRP+ Baseline scenario on I-66 is rela-tively good. The eastbound morning level of service has LOS A and LOS B conditions, due to the HOV 3+ restrictions. The westbound LOS conditions range from LOS C to LOS E. This is an improvement over the existing conditions, as a result of the Silver Line Metrorail service and the spot improvements in the westbound direction.
Figures 3.6 and 3.7 show that the major arterials in the study area are operating at low levels of service. Many of the links in the peak direction for the morning peak hour are forecast to oper-ate at LOS F. In the westbound direction, the LOS is more in the LOS C to LOS D range. As with I-66, the arterials benefit from the construction of the Silver Line in the corridor.
The peak hour level of service represents only one hour of the peak period, and is very limited by geography. It represents each link in the facility but does not provide a systematic measure. The congested VMT measure provides a more systemwide view of the impact of congestion across the entire peak periods. The challenge with peak hour level of service is that the future is often the same as existing conditions. If something is at LOS F today, it most likely will be at LOS F in the future. The VMT measure is more telling because it is not limited to a discrete hour time period in a heavily congested network. The peak hour LOS is good for pinpointing areas of congestion that might develop in the future, but the VMT measure captures the impact of those points as well as the network as a whole.
The transit level of service is expressed in terms of service frequencies and load factors. With the addition of the Silver Line and increased frequency of trains in the corridor, the Potomac River crossing at the Rosslyn tunnel reaches the maximum number of trains per hour (26). Across all of the packages Metrorail service remains constant. The number of buses varies depending on the package. The study area on the whole has very frequent bus service in the Baseline condition.
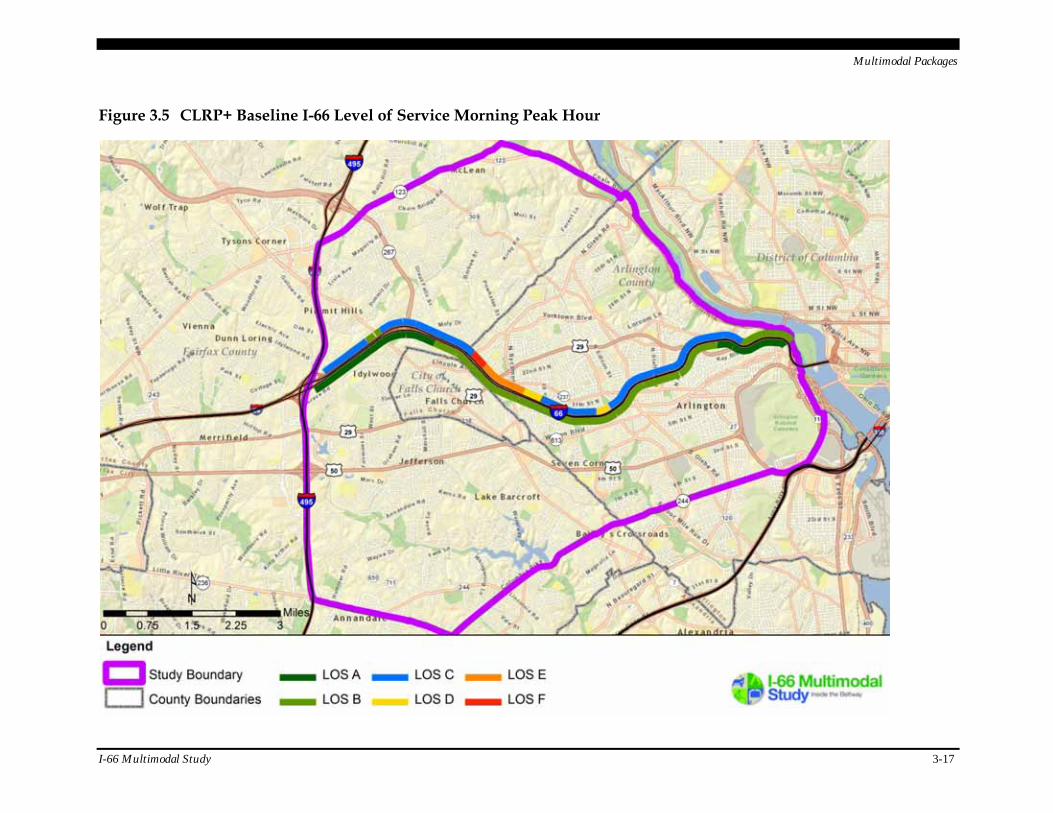
Multimodal Packages
I-66 Multimodal Study 3-17
Figure 3.5 CLRP+ Baseline I-66 Level of Service Morning Peak Hour
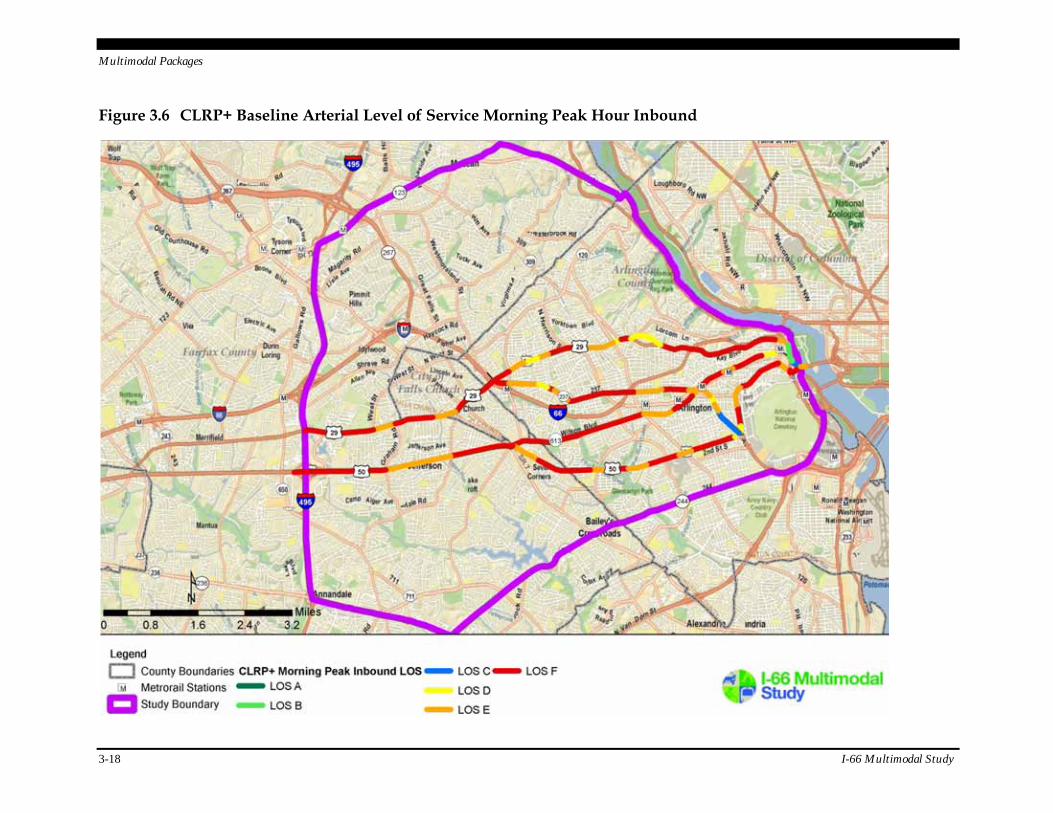
Multimodal Packages
3-18 I-66 Multimodal Study
Figure 3.6 CLRP+ Baseline Arterial Level of Service Morning Peak Hour Inbound
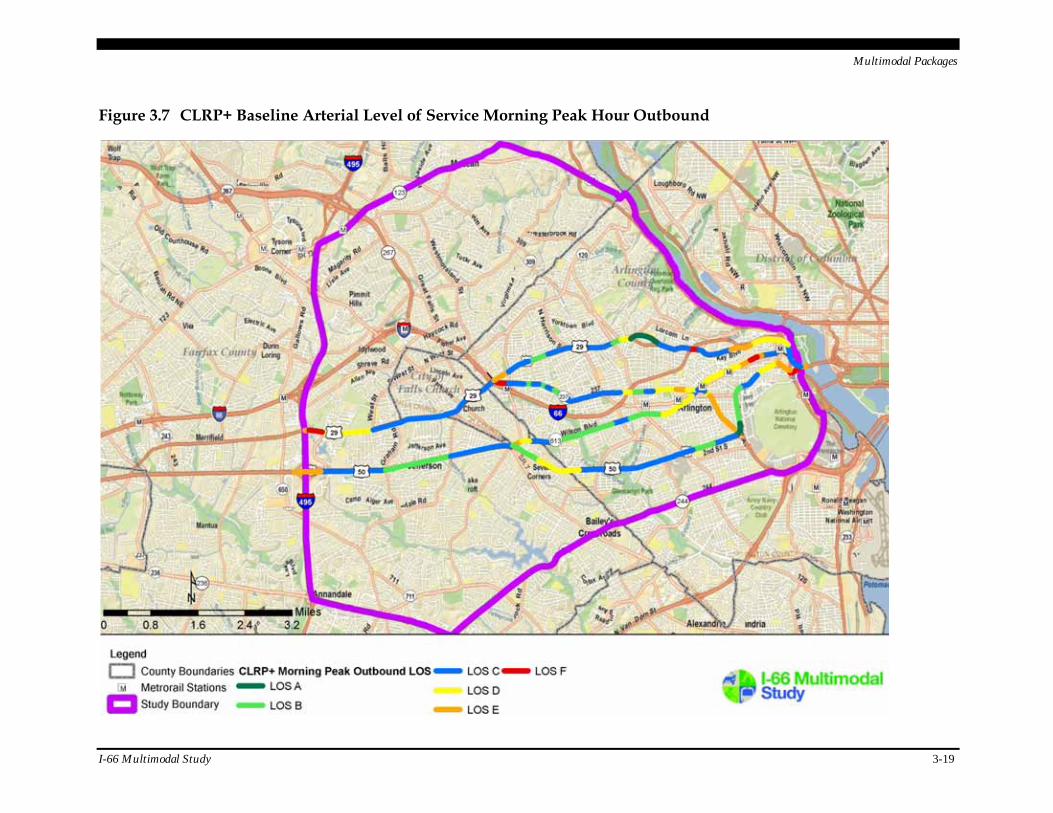
Multimodal Packages
I-66 Multimodal Study 3-19
Figure 3.7 CLRP+ Baseline Arterial Level of Service Morning Peak Hour Outbound
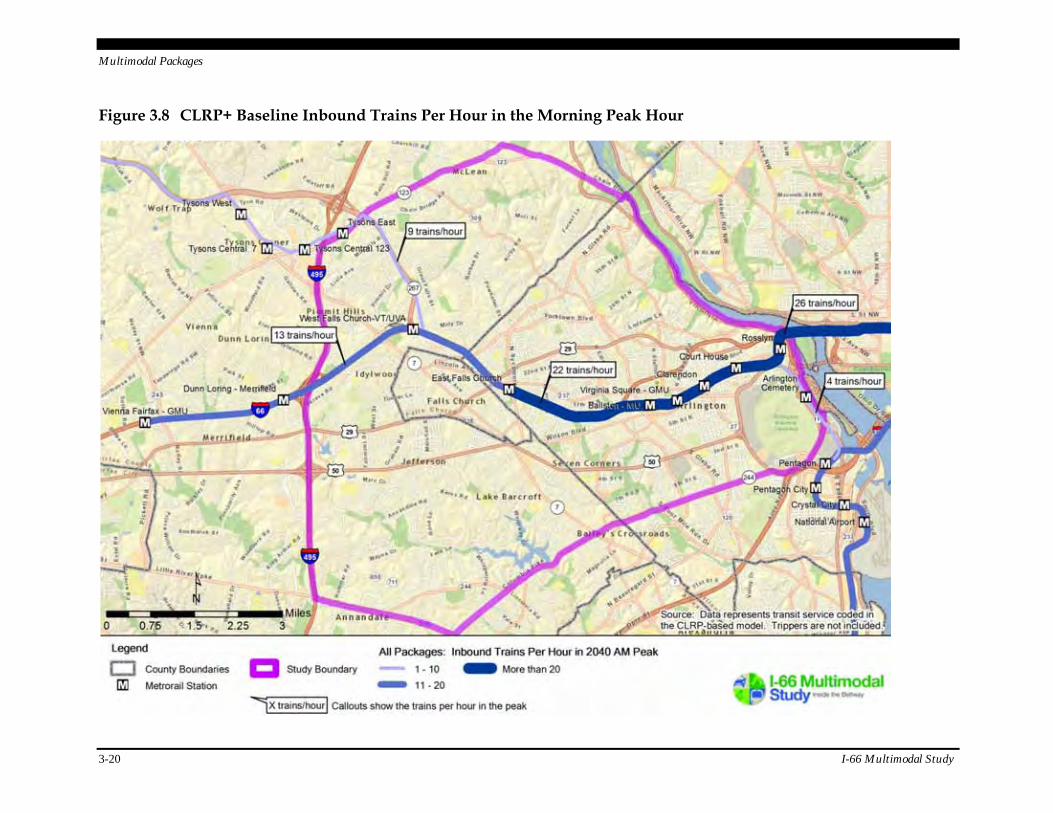
Multimodal Packages
3-20 I-66 Multimodal Study
Figure 3.8 CLRP+ Baseline Inbound Trains Per Hour in the Morning Peak Hour
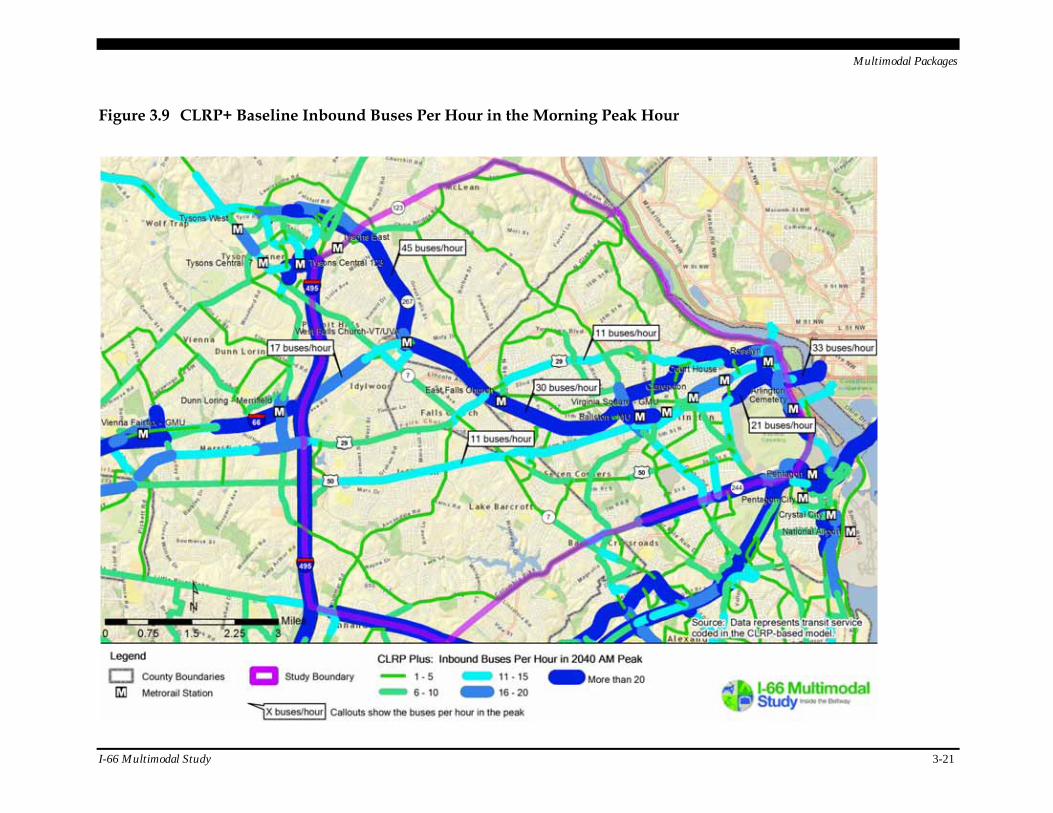
Multimodal Packages
I-66 Multimodal Study 3-21
Figure 3.9 CLRP+ Baseline Inbound Buses Per Hour in the Morning Peak Hour
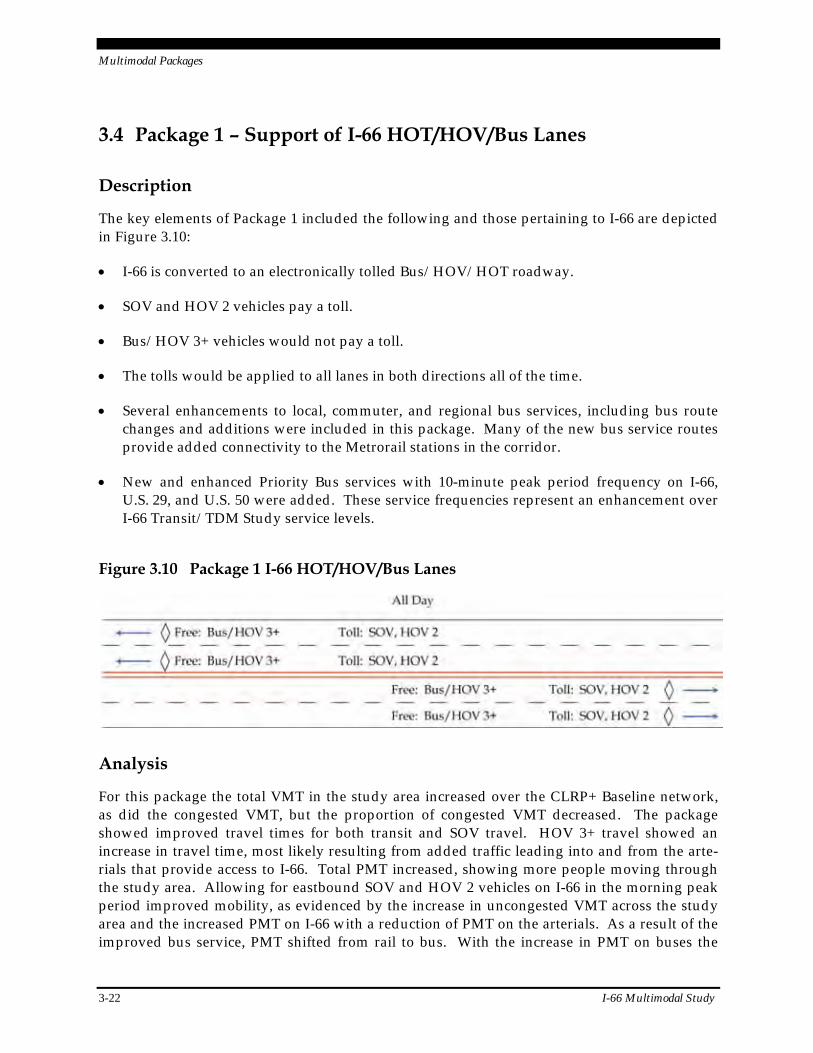
Multimodal Packages
3-22 I-66 Multimodal Study
3.4 Package 1 – Support of I-66 HOT/HOV/Bus Lanes
Description
The key elements of Package 1 included the following and those pertaining to I-66 are depicted in Figure 3.10:
I-66 is converted to an electronically tolled Bus/HOV/HOT roadway.
SOV and HOV 2 vehicles pay a toll.
Bus/HOV 3+ vehicles would not pay a toll.
The tolls would be applied to all lanes in both directions all of the time.
Several enhancements to local, commuter, and regional bus services, including bus route changes and additions were included in this package. Many of the new bus service routes provide added connectivity to the Metrorail stations in the corridor.
New and enhanced Priority Bus services with 10-minute peak period frequency on I-66, U.S. 29, and U.S. 50 were added. These service frequencies represent an enhancement over I-66 Transit/TDM Study service levels.
Figure 3.10 Package 1 I-66 HOT/HOV/Bus Lanes
Analysis
For this package the total VMT in the study area increased over the CLRP+ Baseline network, as did the congested VMT, but the proportion of congested VMT decreased. The package showed improved travel times for both transit and SOV travel. HOV 3+ travel showed an increase in travel time, most likely resulting from added traffic leading into and from the arte-rials that provide access to I-66. Total PMT increased, showing more people moving through the study area. Allowing for eastbound SOV and HOV 2 vehicles on I-66 in the morning peak period improved mobility, as evidenced by the increase in uncongested VMT across the study area and the increased PMT on I-66 with a reduction of PMT on the arterials. As a result of the improved bus service, PMT shifted from rail to bus. With the increase in PMT on buses the
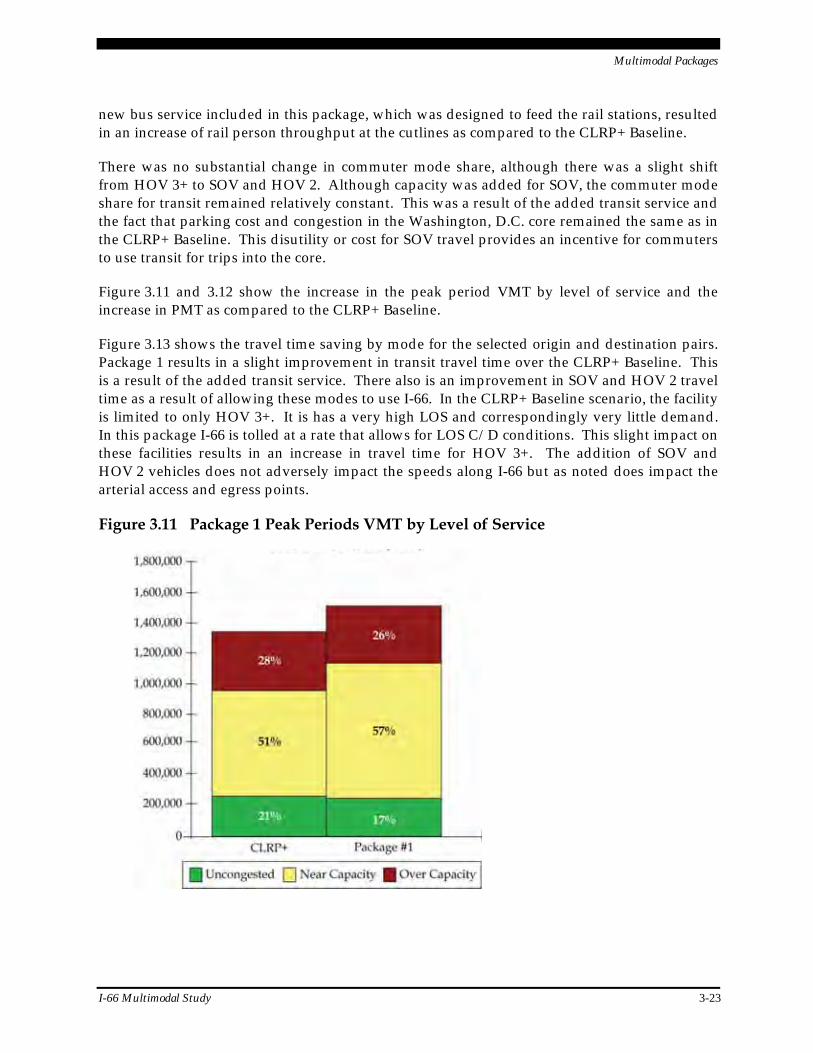
Multimodal Packages
I-66 Multimodal Study 3-23
new bus service included in this package, which was designed to feed the rail stations, resulted in an increase of rail person throughput at the cutlines as compared to the CLRP+ Baseline.
There was no substantial change in commuter mode share, although there was a slight shift from HOV 3+ to SOV and HOV 2. Although capacity was added for SOV, the commuter mode share for transit remained relatively constant. This was a result of the added transit service and the fact that parking cost and congestion in the Washington, D.C. core remained the same as in the CLRP+ Baseline. This disutility or cost for SOV travel provides an incentive for commuters to use transit for trips into the core.
Figure 3.11 and 3.12 show the increase in the peak period VMT by level of service and the increase in PMT as compared to the CLRP+ Baseline.
Figure 3.13 shows the travel time saving by mode for the selected origin and destination pairs. Package 1 results in a slight improvement in transit travel time over the CLRP+ Baseline. This is a result of the added transit service. There also is an improvement in SOV and HOV 2 travel time as a result of allowing these modes to use I-66. In the CLRP+ Baseline scenario, the facility is limited to only HOV 3+. It is has a very high LOS and correspondingly very little demand. In this package I-66 is tolled at a rate that allows for LOS C/D conditions. This slight impact on these facilities results in an increase in travel time for HOV 3+. The addition of SOV and HOV 2 vehicles does not adversely impact the speeds along I-66 but as noted does impact the arterial access and egress points.
Figure 3.11 Package 1 Peak Periods VMT by Level of Service
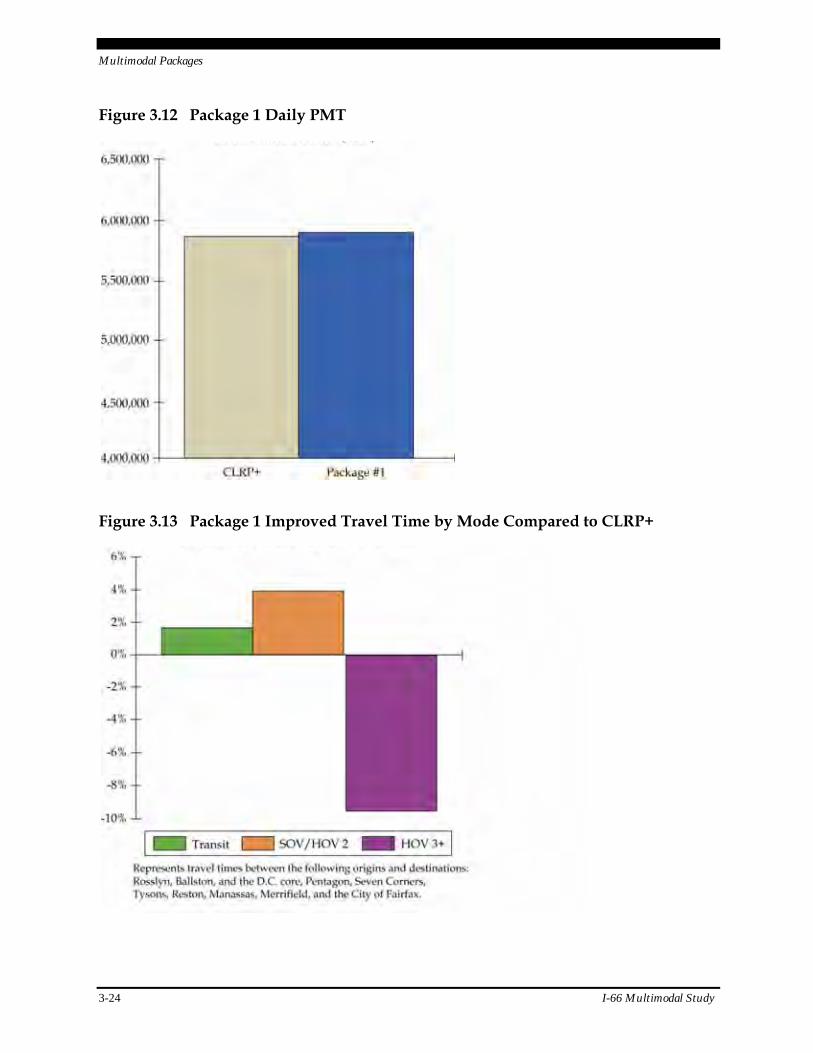
Multimodal Packages
3-24 I-66 Multimodal Study
Figure 3.12 Package 1 Daily PMT
Figure 3.13 Package 1 Improved Travel Time by Mode Compared to CLRP+
Multimodal Packages
I-66 Multimodal Study 3-25
Package 1 included a tolling strategy on I-66. For model purposes the toll was set to keep the traffic levels on I-66 from reaching a congested state. The tolls were set separately for the peak periods and the off-peak periods. The off-peak tolls were pivoted from the peak tolls. Because the off-peak period covers hours outside of the peak when demand is much more variable, the toll price is more of a rough approximation. In the peak periods the demand is much more uni-form and the toll is easier to model as a congestion pricing strategy. The toll for the peak periods in the peak direction for Package 1 was set at 15 to 20 cents per mile (in 2007 dollars), depending on the demand in each segment. In the reverse-peak direction for the peak periods the toll was about 20 percent lower than the peak.
The tolling was set to achieve the particular flow rate on the facility within the model framework. This does not necessarily represent the same goal or objective of toll setting for a traffic and revenue study, and thus care should be taken when reviewing the revenue figures. An estimate of $23 million in annual revenue was calculated, determined solely by multiplying the toll rate needed to maintain uncongested flow on I-66 as assumed in the model by the num-ber of non-HOV 3+ vehicles forecast to use the facility.
Level of Service Performance
The following figures show the levels of service for the highways and transit systems assumed in Package 1. For the highways, the freeway level of service reflects the managed lane pricing strategy of ensuring uncongested conditions. LOS on the arterials reflects the general level of congestion on the network in the peak directions. The transit frequencies and load factors reflect the high level of service being provided. Table 3.23 and Table 3.24 provide the load fac-tors at each of the cutlines for Package 1.
In this package, I-66 in the inbound direction has a lower level of service than the CLRP+ Baseline scenario. The eastbound direction has LOS C to LOS D conditions. This reflects the added SOV and HOV 2 traffic using the HOT facility. The congestion pricing strategy keeps the LOS at a threshold where traffic still moves at an acceptable level. The westbound lanes also include congestion pricing and show some improvement over the CLRP+ Baseline scenario with mostly LOS C operations.
The major arterials in the study area show improved levels of service with more links operating at LOS E and fewer at LOS F. This is a result of the added paid capacity on I-66. There is some traffic that moves from the arterials to the freeway with the relaxing of the HOV restriction on I-66.
The transit service shows improved frequency for buses. The coverage area is the same as in the CLRP+ Baseline scenario, with added levels of service feeding into the Metrorail system along existing bus routes. The load factors for Package 1 are show in Table 3.5. Package 1 shows lower load factors on Metrorail at each of the cutlines, consistent with an increase in bus and SOV travel. Meanwhile, the bus load factors are higher for Package 1 at all cutlines than in the CLRP+ Baseline scenario.
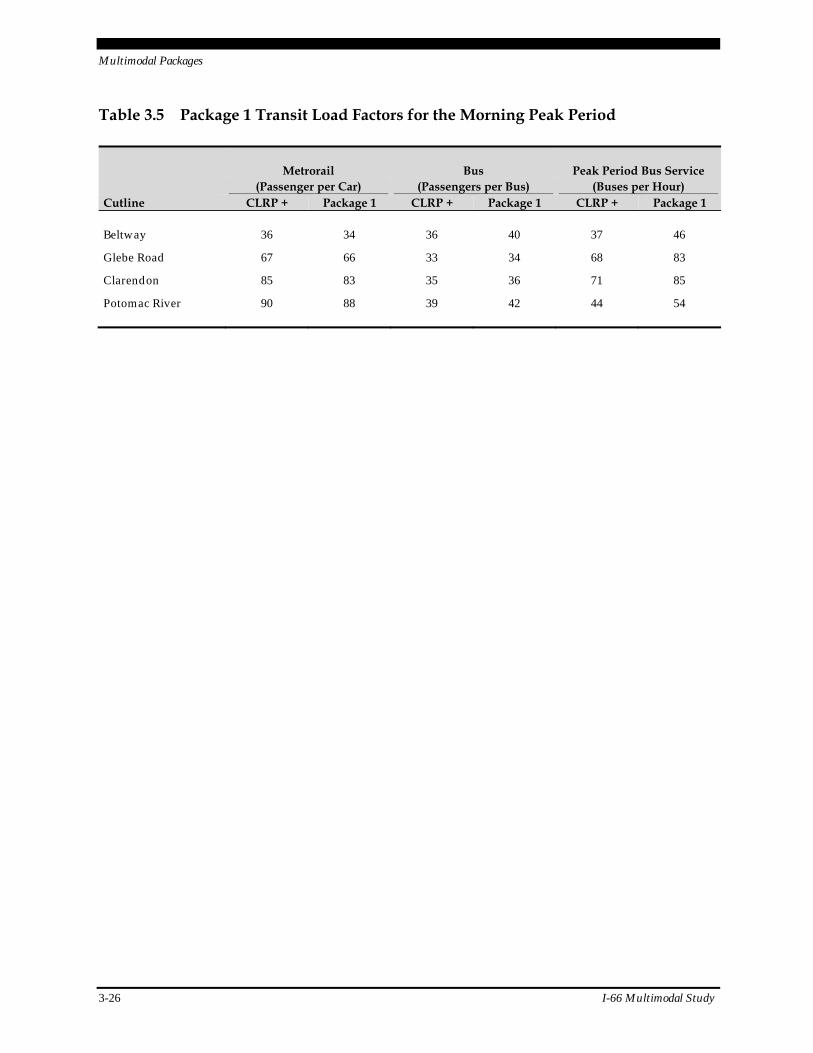
Multimodal Packages
3-26 I-66 Multimodal Study
Table 3.5 Package 1 Transit Load Factors for the Morning Peak Period
Metrorail Bus Peak Period Bus Service (Passenger per Car) (Passengers per Bus) (Buses per Hour) Cutline CLRP + Package 1 CLRP + Package 1 CLRP + Package 1
Beltway 36 34 36 40 37 46
Glebe Road 67 66 33 34 68 83
Clarendon 85 83 35 36 71 85
Potomac River 90 88 39 42 44 54
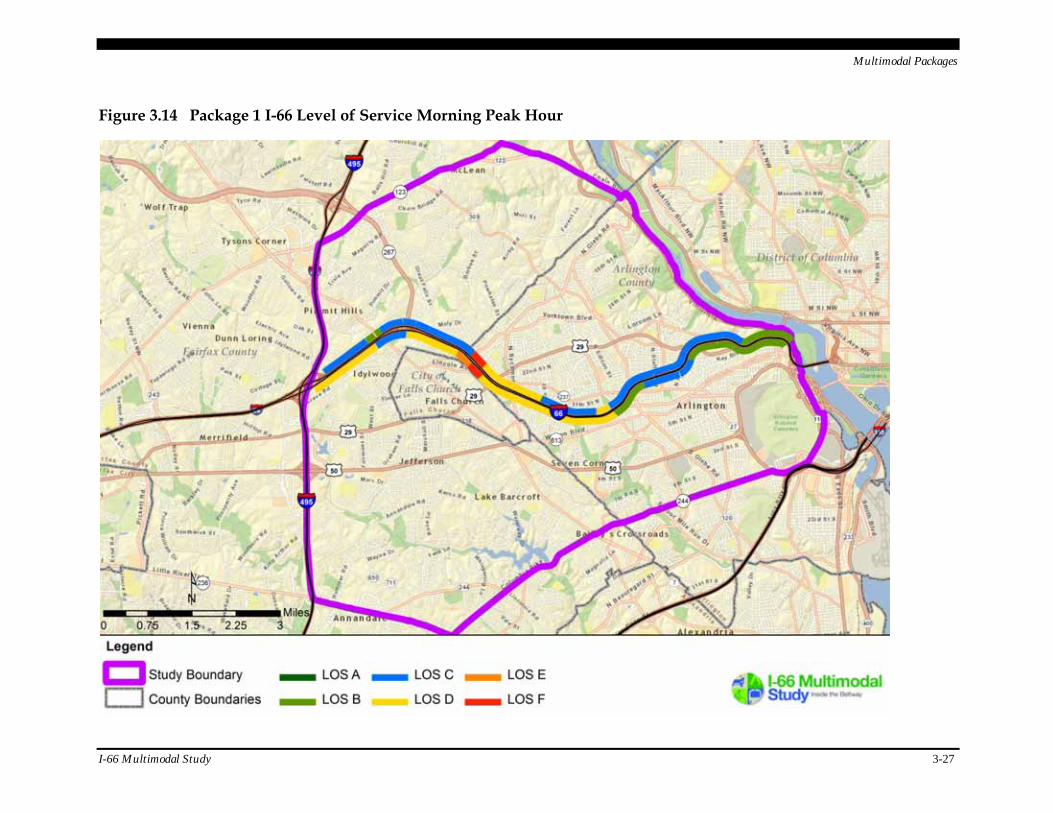
Multimodal Packages
I-66 Multimodal Study 3-27
Figure 3.14 Package 1 I-66 Level of Service Morning Peak Hour

Multimodal Packages
3-28 I-66 Multimodal Study
Figure 3.15 Package 1 Arterial Level of Service Morning Peak Hour Inbound
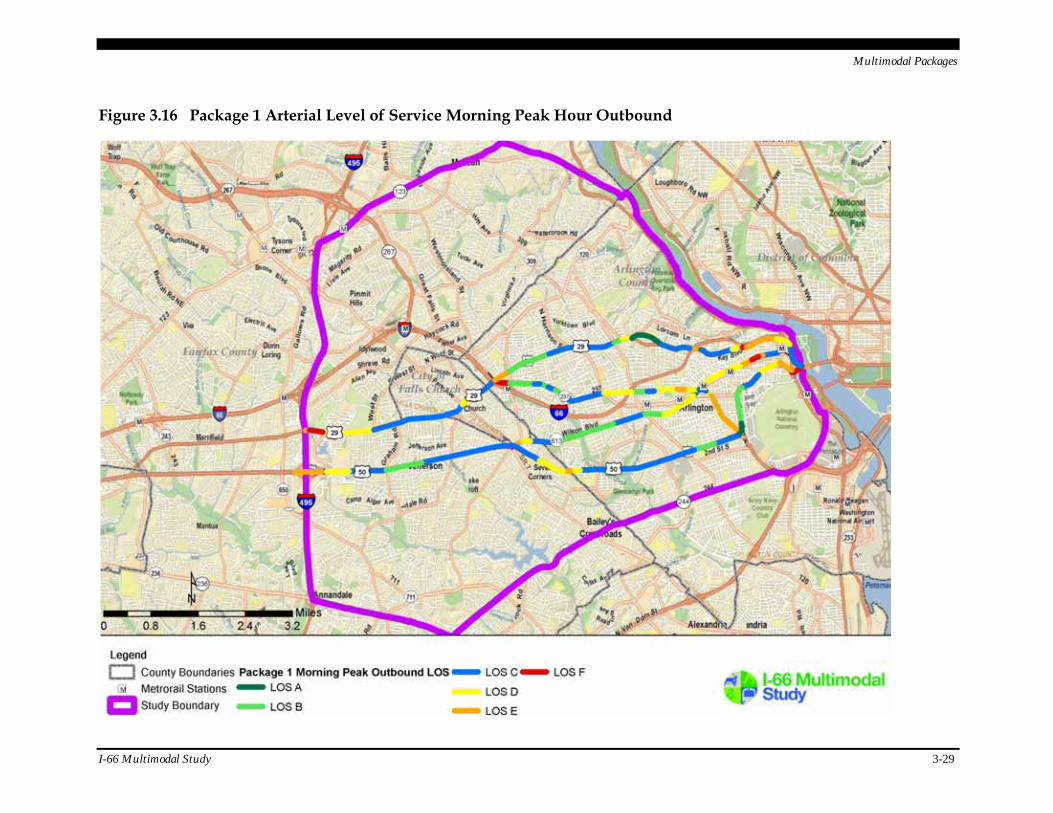
Multimodal Packages
I-66 Multimodal Study 3-29
Figure 3.16 Package 1 Arterial Level of Service Morning Peak Hour Outbound
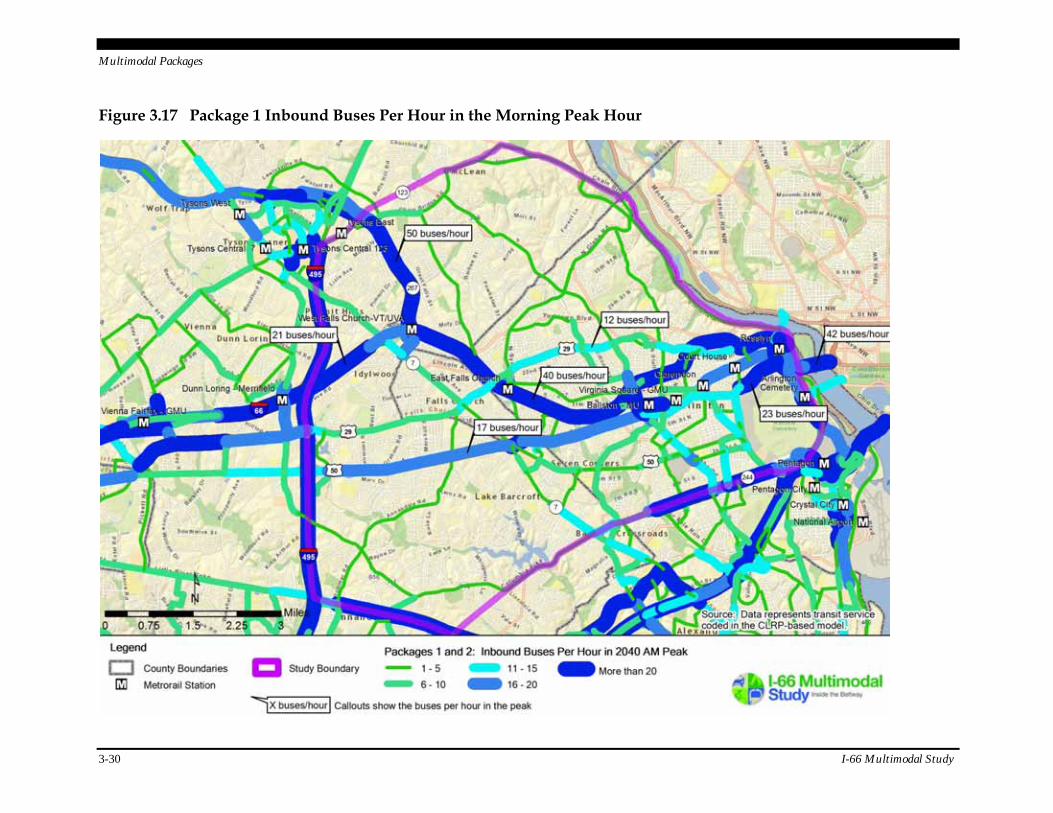
Multimodal Packages
3-30 I-66 Multimodal Study
Figure 3.17 Package 1 Inbound Buses Per Hour in the Morning Peak Hour
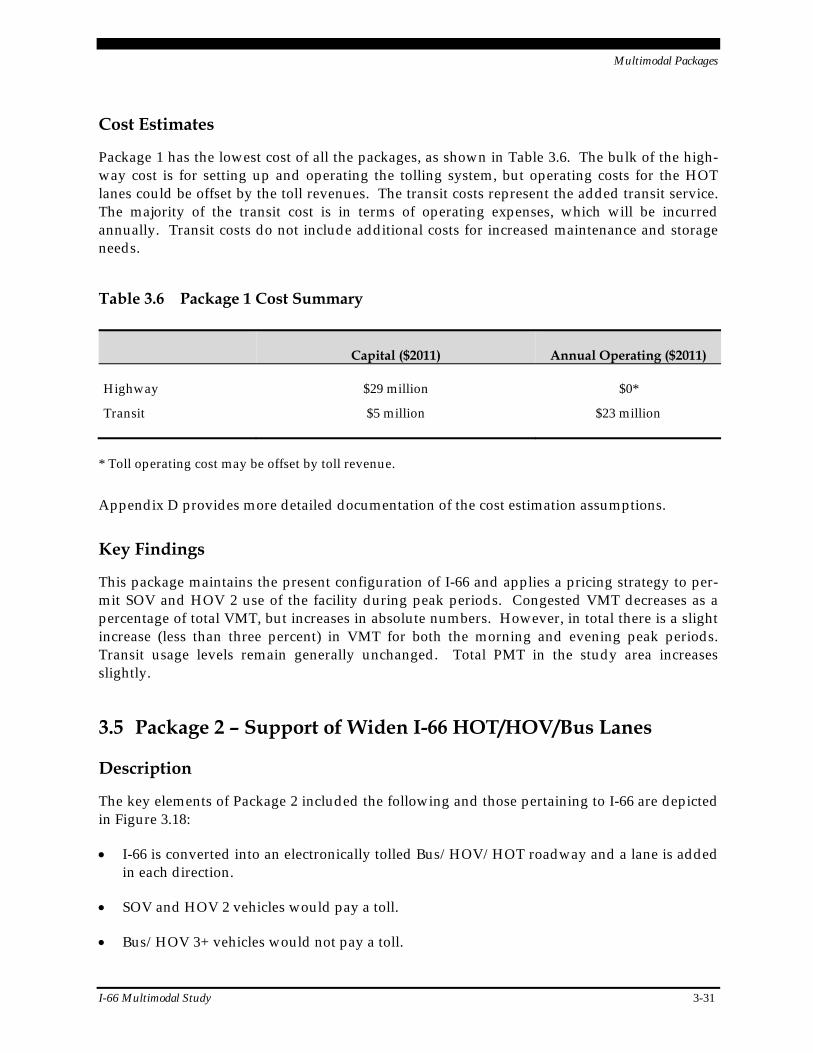
Multimodal Packages
I-66 Multimodal Study 3-31
Cost Estimates
Package 1 has the lowest cost of all the packages, as shown in Table 3.6. The bulk of the high-way cost is for setting up and operating the tolling system, but operating costs for the HOT lanes could be offset by the toll revenues. The transit costs represent the added transit service. The majority of the transit cost is in terms of operating expenses, which will be incurred annually. Transit costs do not include additional costs for increased maintenance and storage needs.
Table 3.6 Package 1 Cost Summary
Capital ($2011) Annual Operating ($2011)
Highway $29 million $0*
Transit $5 million $23 million
* Toll operating cost may be offset by toll revenue.
Appendix D provides more detailed documentation of the cost estimation assumptions.
Key Findings
This package maintains the present configuration of I-66 and applies a pricing strategy to per-mit SOV and HOV 2 use of the facility during peak periods. Congested VMT decreases as a percentage of total VMT, but increases in absolute numbers. However, in total there is a slight increase (less than three percent) in VMT for both the morning and evening peak periods. Transit usage levels remain generally unchanged. Total PMT in the study area increases slightly.
3.5 Package 2 – Support of Widen I-66 HOT/HOV/Bus Lanes
Description
The key elements of Package 2 included the following and those pertaining to I-66 are depicted in Figure 3.18:
I-66 is converted into an electronically tolled Bus/HOV/HOT roadway and a lane is added in each direction.
SOV and HOV 2 vehicles would pay a toll.
Bus/HOV 3+ vehicles would not pay a toll.
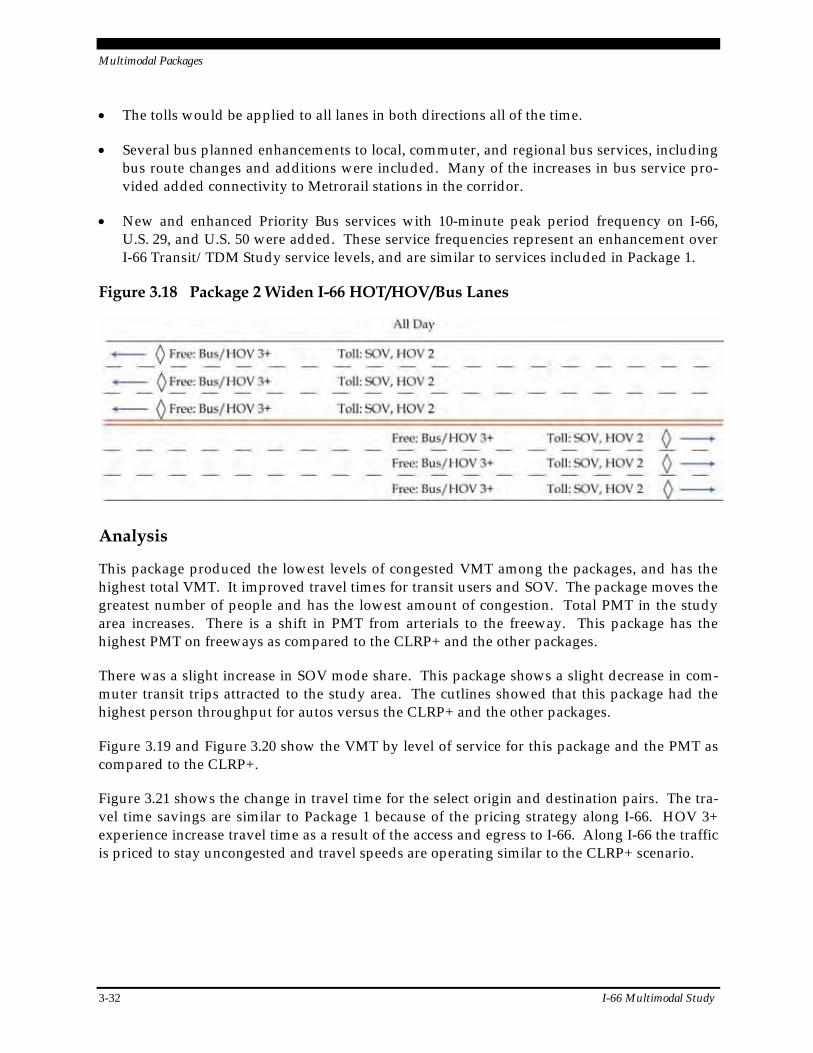
Multimodal Packages
3-32 I-66 Multimodal Study
The tolls would be applied to all lanes in both directions all of the time.
Several bus planned enhancements to local, commuter, and regional bus services, including bus route changes and additions were included. Many of the increases in bus service pro-vided added connectivity to Metrorail stations in the corridor.
New and enhanced Priority Bus services with 10-minute peak period frequency on I-66, U.S. 29, and U.S. 50 were added. These service frequencies represent an enhancement over I-66 Transit/TDM Study service levels, and are similar to services included in Package 1.
Figure 3.18 Package 2 Widen I-66 HOT/HOV/Bus Lanes
Analysis
This package produced the lowest levels of congested VMT among the packages, and has the highest total VMT. It improved travel times for transit users and SOV. The package moves the greatest number of people and has the lowest amount of congestion. Total PMT in the study area increases. There is a shift in PMT from arterials to the freeway. This package has the highest PMT on freeways as compared to the CLRP+ and the other packages.
There was a slight increase in SOV mode share. This package shows a slight decrease in com-muter transit trips attracted to the study area. The cutlines showed that this package had the highest person throughput for autos versus the CLRP+ and the other packages.
Figure 3.19 and Figure 3.20 show the VMT by level of service for this package and the PMT as compared to the CLRP+.
Figure 3.21 shows the change in travel time for the select origin and destination pairs. The tra-vel time savings are similar to Package 1 because of the pricing strategy along I-66. HOV 3+ experience increase travel time as a result of the access and egress to I-66. Along I-66 the traffic is priced to stay uncongested and travel speeds are operating similar to the CLRP+ scenario.
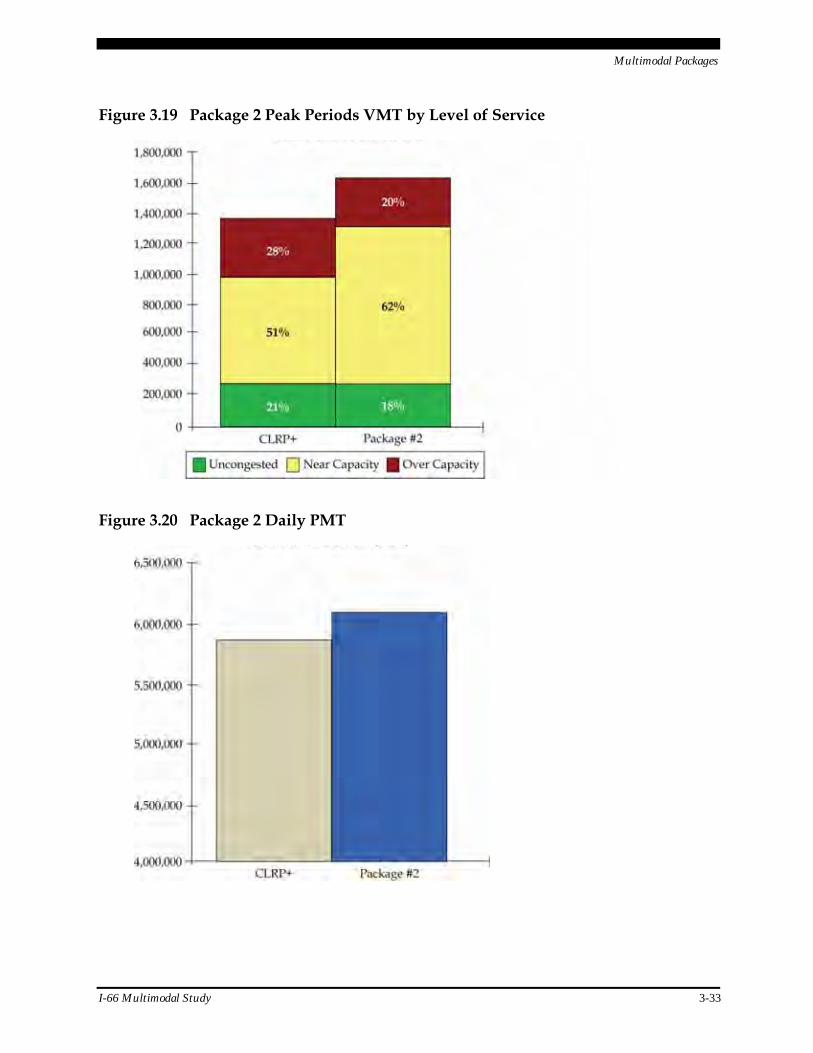
Multimodal Packages
I-66 Multimodal Study 3-33
Figure 3.19 Package 2 Peak Periods VMT by Level of Service
Figure 3.20 Package 2 Daily PMT
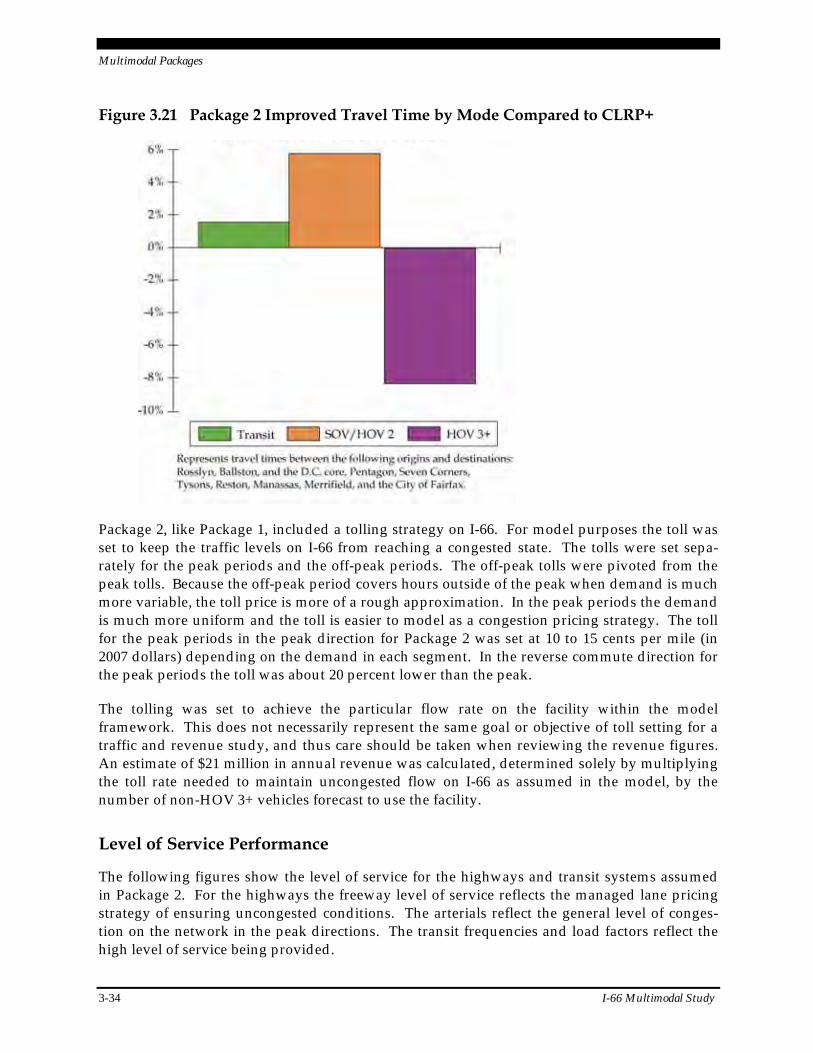
Multimodal Packages
3-34 I-66 Multimodal Study
Figure 3.21 Package 2 Improved Travel Time by Mode Compared to CLRP+
Package 2, like Package 1, included a tolling strategy on I-66. For model purposes the toll was set to keep the traffic levels on I-66 from reaching a congested state. The tolls were set sepa-rately for the peak periods and the off-peak periods. The off-peak tolls were pivoted from the peak tolls. Because the off-peak period covers hours outside of the peak when demand is much more variable, the toll price is more of a rough approximation. In the peak periods the demand is much more uniform and the toll is easier to model as a congestion pricing strategy. The toll for the peak periods in the peak direction for Package 2 was set at 10 to 15 cents per mile (in 2007 dollars) depending on the demand in each segment. In the reverse commute direction for the peak periods the toll was about 20 percent lower than the peak.
The tolling was set to achieve the particular flow rate on the facility within the model framework. This does not necessarily represent the same goal or objective of toll setting for a traffic and revenue study, and thus care should be taken when reviewing the revenue figures. An estimate of $21 million in annual revenue was calculated, determined solely by multiplying the toll rate needed to maintain uncongested flow on I-66 as assumed in the model, by the number of non-HOV 3+ vehicles forecast to use the facility.
Level of Service Performance
The following figures show the level of service for the highways and transit systems assumed in Package 2. For the highways the freeway level of service reflects the managed lane pricing strategy of ensuring uncongested conditions. The arterials reflect the general level of conges-tion on the network in the peak directions. The transit frequencies and load factors reflect the high level of service being provided.

Multimodal Packages
I-66 Multimodal Study 3-35
In this package, I-66 in the inbound direction has lower level of service compared to CLRP+ Baseline. For Package 2, the inbound has mostly LOS C conditions with some LOS D links. This reflects the added SOV and HOV 2 traffic using the HOT facility. The congestion pricing strategy keeps the LOS at a threshold where traffic still moves at an acceptable level. The out-bound direction also is operating under congestion pricing and shows some improvement over the CLRP+ Baseline scenario with similar levels of service as the inbound direction.
The major arterials in the study area show more improved levels of service, with more LOS D conditions. There are still links with LOS E but very few with LOS F conditions. This is a result of the added paid capacity on I-66.
The transit service shows improved frequency for buses. The coverage area is the same as in the CLRP+ Baseline scenario, with added levels of service feeding into the Metrorail system along existing bus routes. Load factors are summarized for Package 2 in Table 3.7. Package 2 shows lower load factors on Metrorail at each of the cutlines, consistent with an increase in bus and SOV travel. Meanwhile, the bus load factors are higher for Package 2 at all cutlines than in the CLRP+ Baseline scenario.
Table 3.7 Package 2 Transit Load Factors for the Morning Peak Period
Metrorail Bus Peak Period Bus Service (Passenger per Car) (Passengers per Bus) (Buses per Hour) Cutline CLRP + Package 2 CLRP + Package 2 CLRP + Package 2
Beltway 36 34 36 41 37 46
Glebe Road 67 67 33 34 68 83
Clarendon 85 84 35 36 71 85
Potomac River 90 88 39 42 44 54
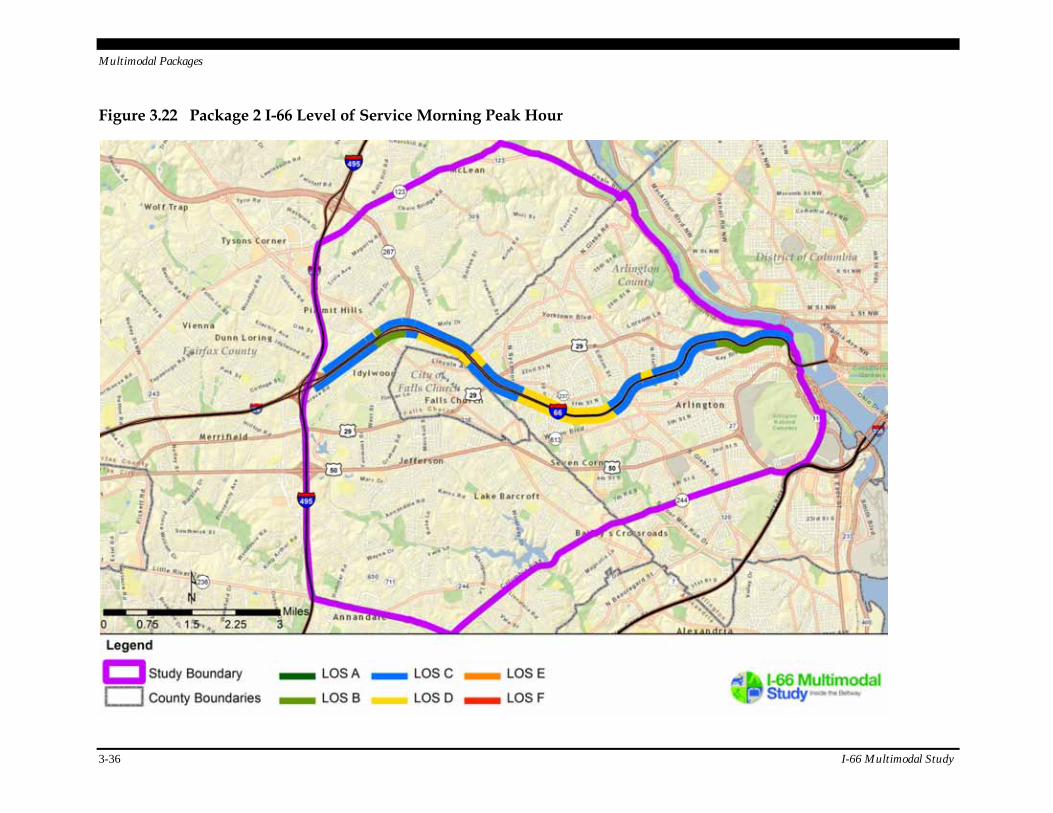
Multimodal Packages
3-36 I-66 Multimodal Study
Figure 3.22 Package 2 I-66 Level of Service Morning Peak Hour

Multimodal Packages
I-66 Multimodal Study 3-37
Figure 3.23 Package 2 Arterial Level of Service Morning Peak Hour Inbound

Multimodal Packages
3-38 I-66 Multimodal Study
Figure 3.24 Package 2 Arterial Level of Service Morning Peak Hour Outbound
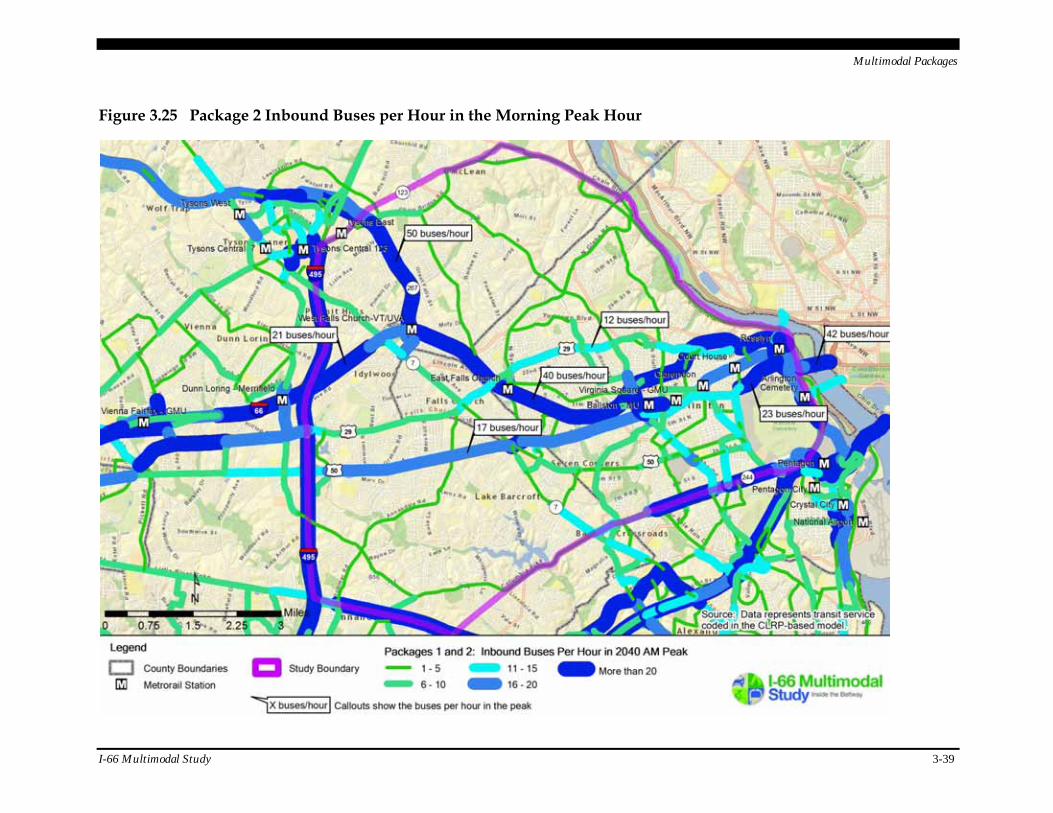
Multimodal Packages
I-66 Multimodal Study 3-39
Figure 3.25 Package 2 Inbound Buses per Hour in the Morning Peak Hour
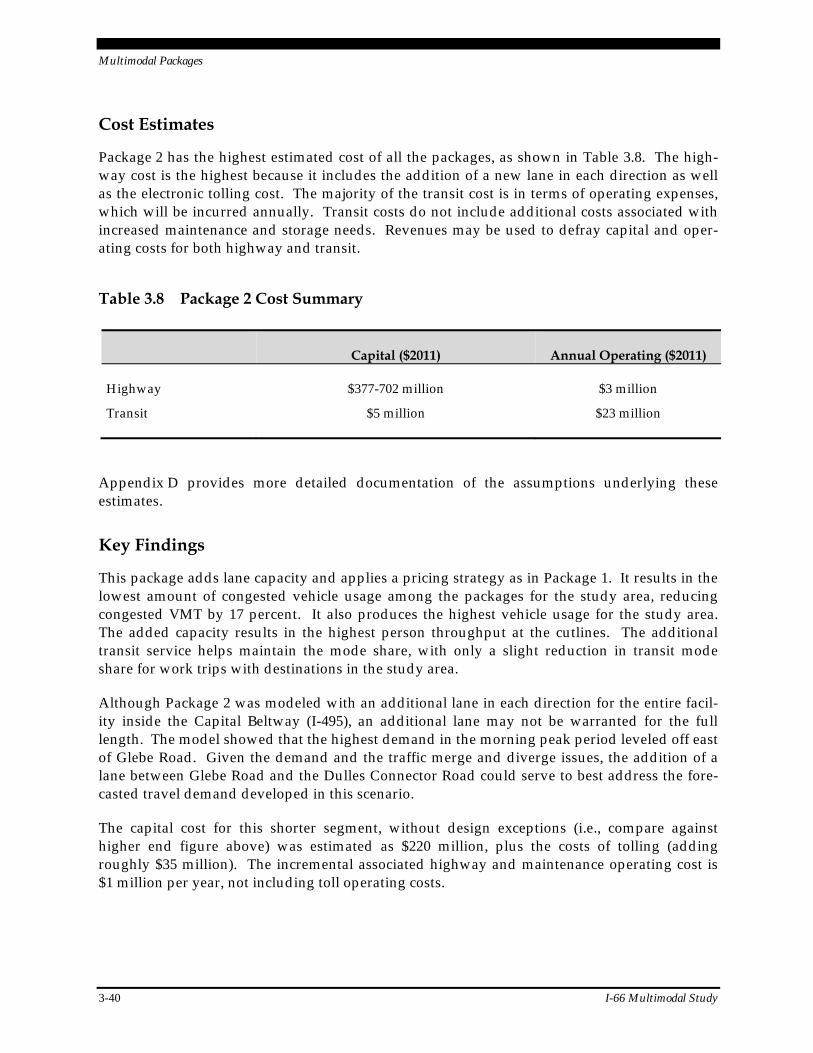
Multimodal Packages
3-40 I-66 Multimodal Study
Cost Estimates
Package 2 has the highest estimated cost of all the packages, as shown in Table 3.8. The high-way cost is the highest because it includes the addition of a new lane in each direction as well as the electronic tolling cost. The majority of the transit cost is in terms of operating expenses, which will be incurred annually. Transit costs do not include additional costs associated with increased maintenance and storage needs. Revenues may be used to defray capital and oper-ating costs for both highway and transit.
Table 3.8 Package 2 Cost Summary
Capital ($2011) Annual Operating ($2011)
Highway $377-702 million $3 million
Transit $5 million $23 million
Appendix D provides more detailed documentation of the assumptions underlying these estimates.
Key Findings
This package adds lane capacity and applies a pricing strategy as in Package 1. It results in the lowest amount of congested vehicle usage among the packages for the study area, reducing congested VMT by 17 percent. It also produces the highest vehicle usage for the study area. The added capacity results in the highest person throughput at the cutlines. The additional transit service helps maintain the mode share, with only a slight reduction in transit mode share for work trips with destinations in the study area.
Although Package 2 was modeled with an additional lane in each direction for the entire facil-ity inside the Capital Beltway (I-495), an additional lane may not be warranted for the full length. The model showed that the highest demand in the morning peak period leveled off east of Glebe Road. Given the demand and the traffic merge and diverge issues, the addition of a lane between Glebe Road and the Dulles Connector Road could serve to best address the fore-casted travel demand developed in this scenario.
The capital cost for this shorter segment, without design exceptions (i.e., compare against higher end figure above) was estimated as $220 million, plus the costs of tolling (adding roughly $35 million). The incremental associated highway and maintenance operating cost is $1 million per year, not including toll operating costs.
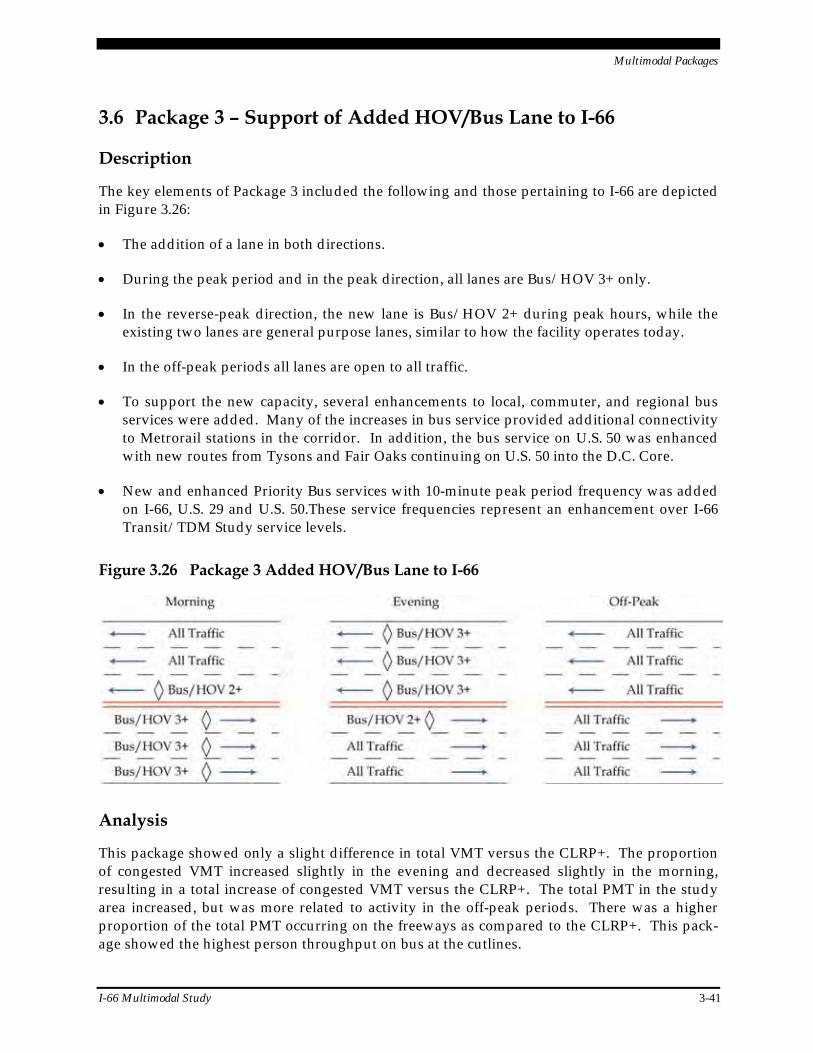
Multimodal Packages
I-66 Multimodal Study 3-41
3.6 Package 3 – Support of Added HOV/Bus Lane to I-66
Description
The key elements of Package 3 included the following and those pertaining to I-66 are depicted in Figure 3.26:
The addition of a lane in both directions.
During the peak period and in the peak direction, all lanes are Bus/HOV 3+ only.
In the reverse-peak direction, the new lane is Bus/HOV 2+ during peak hours, while the existing two lanes are general purpose lanes, similar to how the facility operates today.
In the off-peak periods all lanes are open to all traffic.
To support the new capacity, several enhancements to local, commuter, and regional bus services were added. Many of the increases in bus service provided additional connectivity to Metrorail stations in the corridor. In addition, the bus service on U.S. 50 was enhanced with new routes from Tysons and Fair Oaks continuing on U.S. 50 into the D.C. Core.
New and enhanced Priority Bus services with 10-minute peak period frequency was added on I-66, U.S. 29 and U.S. 50.These service frequencies represent an enhancement over I-66 Transit/TDM Study service levels.
Figure 3.26 Package 3 Added HOV/Bus Lane to I-66
Analysis
This package showed only a slight difference in total VMT versus the CLRP+. The proportion of congested VMT increased slightly in the evening and decreased slightly in the morning, resulting in a total increase of congested VMT versus the CLRP+. The total PMT in the study area increased, but was more related to activity in the off-peak periods. There was a higher proportion of the total PMT occurring on the freeways as compared to the CLRP+. This pack-age showed the highest person throughput on bus at the cutlines.
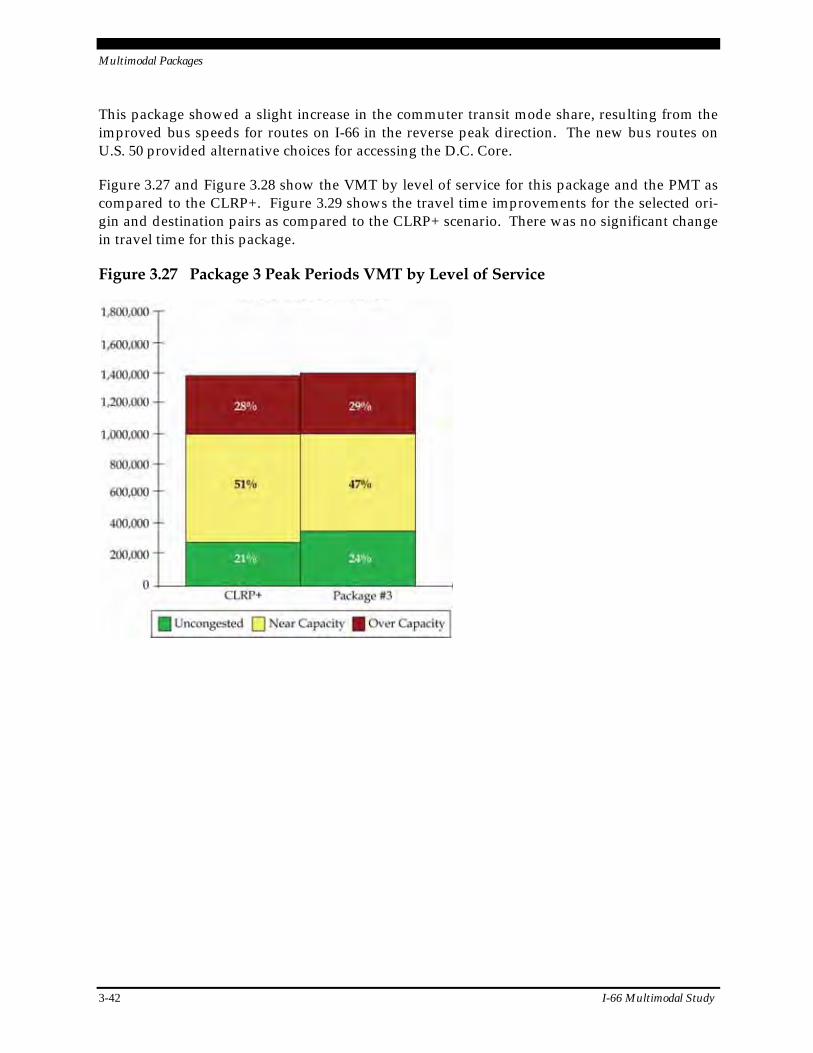
Multimodal Packages
3-42 I-66 Multimodal Study
This package showed a slight increase in the commuter transit mode share, resulting from the improved bus speeds for routes on I-66 in the reverse peak direction. The new bus routes on U.S. 50 provided alternative choices for accessing the D.C. Core.
Figure 3.27 and Figure 3.28 show the VMT by level of service for this package and the PMT as compared to the CLRP+. Figure 3.29 shows the travel time improvements for the selected ori-gin and destination pairs as compared to the CLRP+ scenario. There was no significant change in travel time for this package.
Figure 3.27 Package 3 Peak Periods VMT by Level of Service
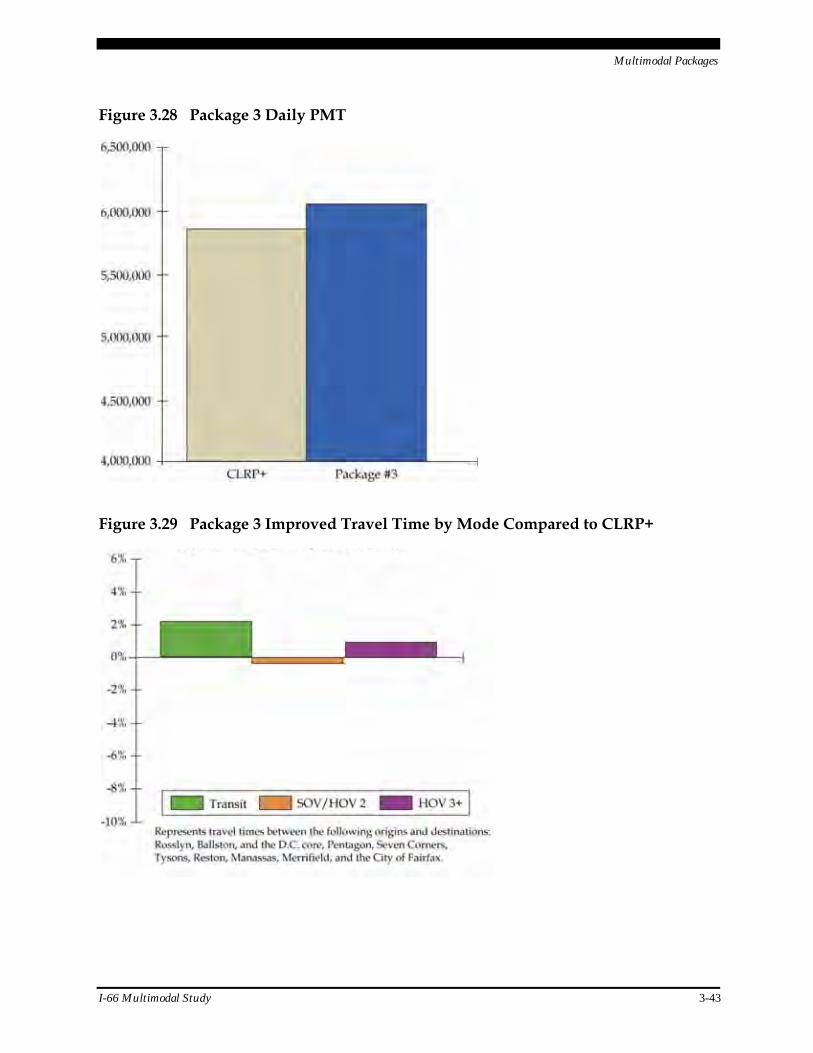
Multimodal Packages
I-66 Multimodal Study 3-43
Figure 3.28 Package 3 Daily PMT
Figure 3.29 Package 3 Improved Travel Time by Mode Compared to CLRP+
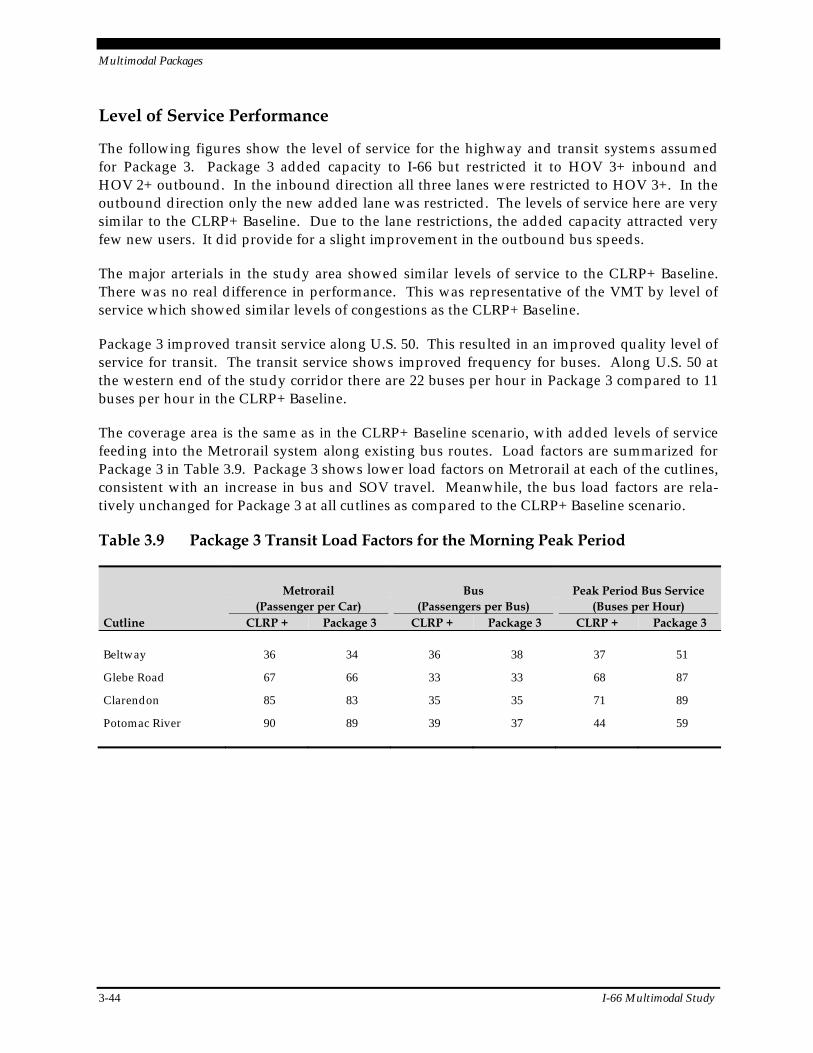
Multimodal Packages
3-44 I-66 Multimodal Study
Level of Service Performance
The following figures show the level of service for the highway and transit systems assumed for Package 3. Package 3 added capacity to I-66 but restricted it to HOV 3+ inbound and HOV 2+ outbound. In the inbound direction all three lanes were restricted to HOV 3+. In the outbound direction only the new added lane was restricted. The levels of service here are very similar to the CLRP+ Baseline. Due to the lane restrictions, the added capacity attracted very few new users. It did provide for a slight improvement in the outbound bus speeds.
The major arterials in the study area showed similar levels of service to the CLRP+ Baseline. There was no real difference in performance. This was representative of the VMT by level of service which showed similar levels of congestions as the CLRP+ Baseline.
Package 3 improved transit service along U.S. 50. This resulted in an improved quality level of service for transit. The transit service shows improved frequency for buses. Along U.S. 50 at the western end of the study corridor there are 22 buses per hour in Package 3 compared to 11 buses per hour in the CLRP+ Baseline.
The coverage area is the same as in the CLRP+ Baseline scenario, with added levels of service feeding into the Metrorail system along existing bus routes. Load factors are summarized for Package 3 in Table 3.9. Package 3 shows lower load factors on Metrorail at each of the cutlines, consistent with an increase in bus and SOV travel. Meanwhile, the bus load factors are rela-tively unchanged for Package 3 at all cutlines as compared to the CLRP+ Baseline scenario.
Table 3.9 Package 3 Transit Load Factors for the Morning Peak Period
Metrorail Bus Peak Period Bus Service (Passenger per Car) (Passengers per Bus) (Buses per Hour) Cutline CLRP + Package 3 CLRP + Package 3 CLRP + Package 3
Beltway 36 34 36 38 37 51
Glebe Road 67 66 33 33 68 87
Clarendon 85 83 35 35 71 89
Potomac River 90 89 39 37 44 59
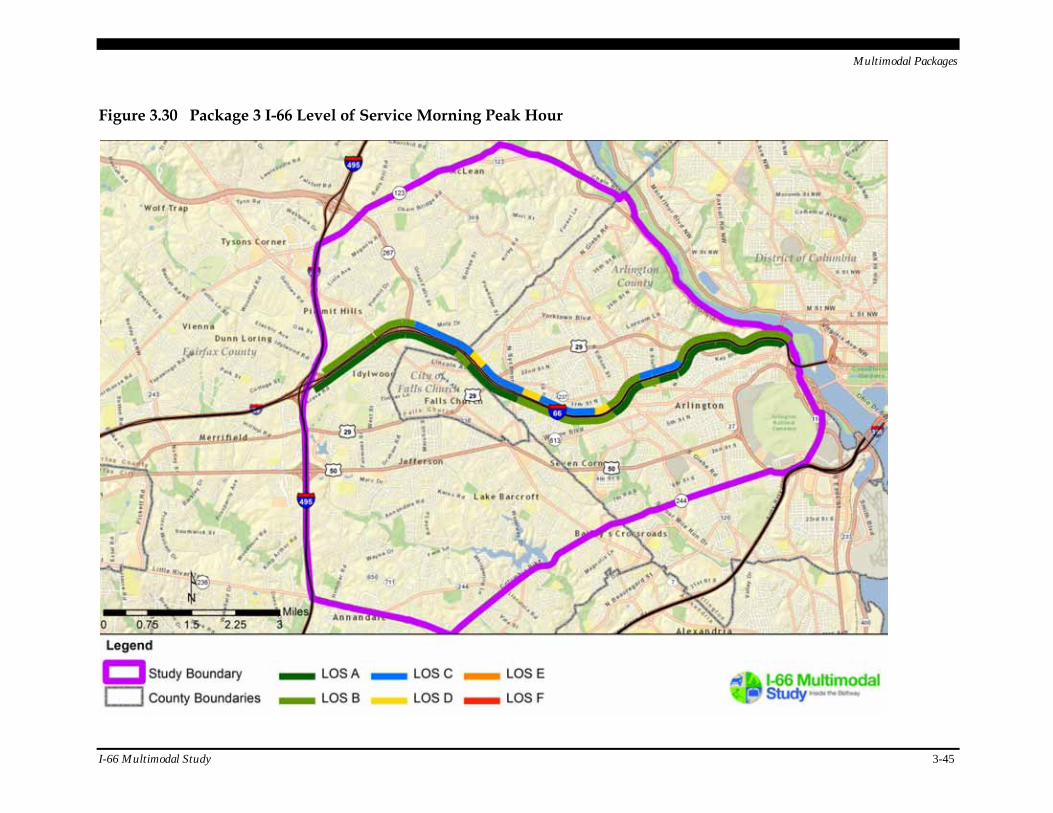
Multimodal Packages
I-66 Multimodal Study 3-45
Figure 3.30 Package 3 I-66 Level of Service Morning Peak Hour
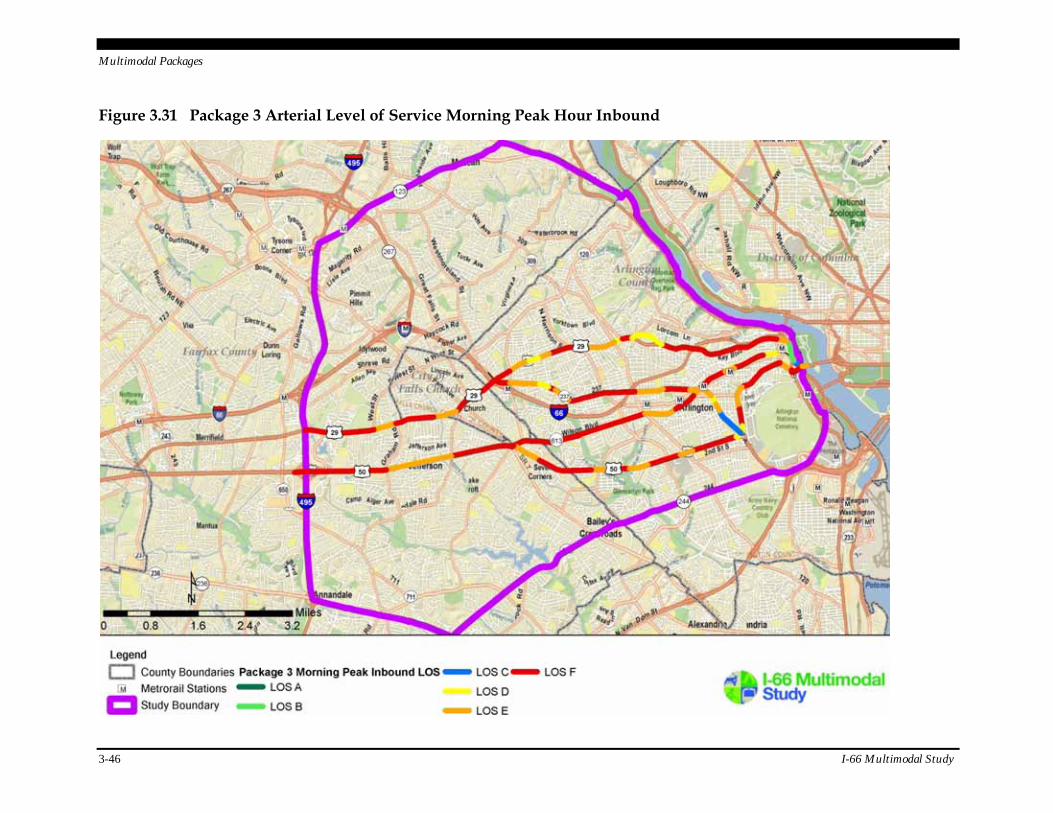
Multimodal Packages
3-46 I-66 Multimodal Study
Figure 3.31 Package 3 Arterial Level of Service Morning Peak Hour Inbound

Multimodal Packages
I-66 Multimodal Study 3-47
Figure 3.32 Package 3 Arterial Level of Service Morning Peak Hour Outbound
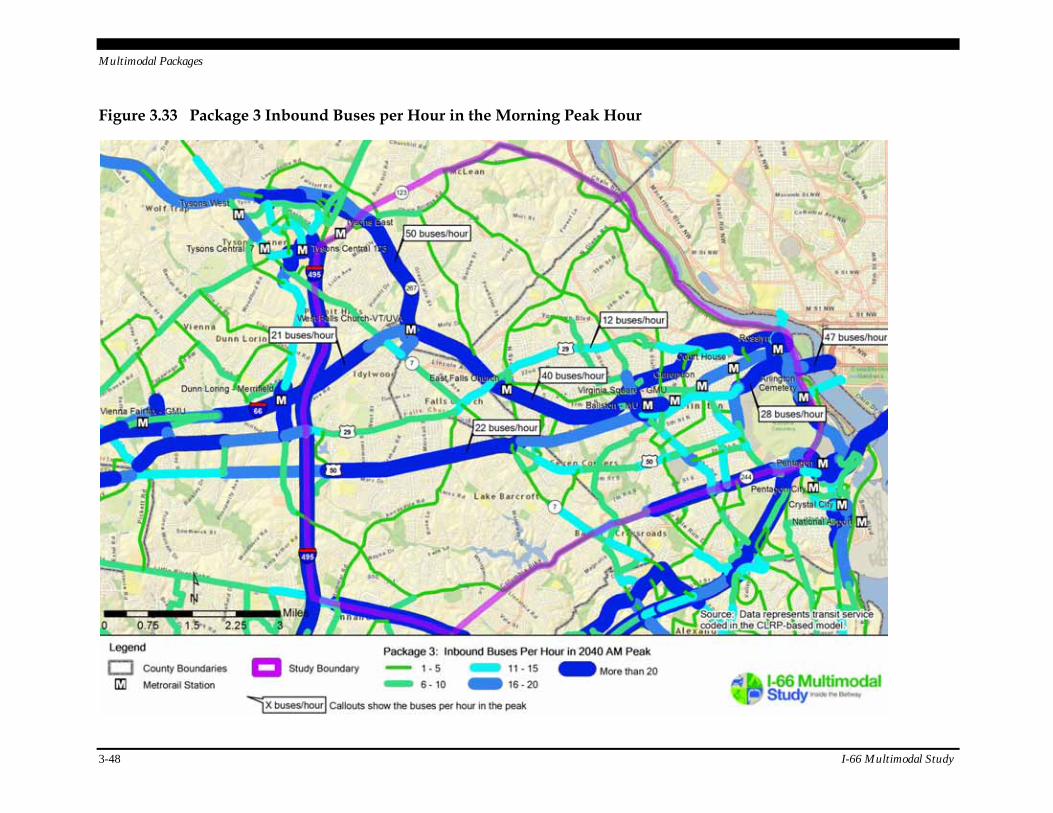
Multimodal Packages
3-48 I-66 Multimodal Study
Figure 3.33 Package 3 Inbound Buses per Hour in the Morning Peak Hour
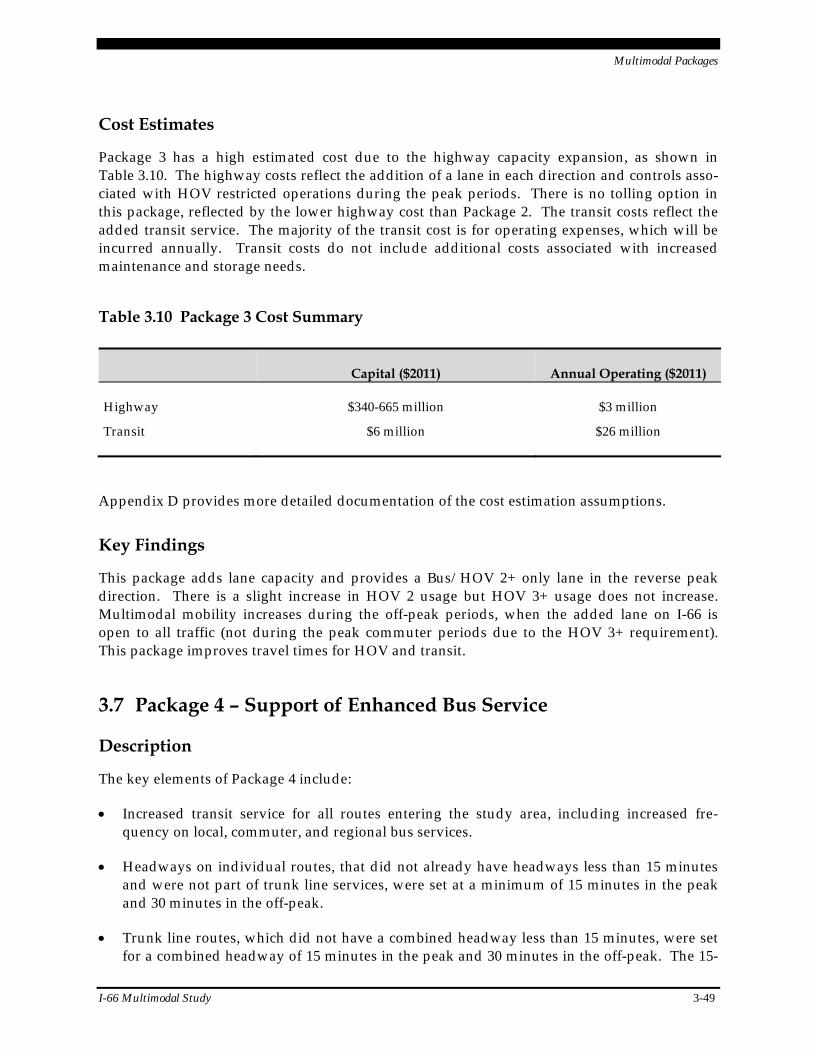
Multimodal Packages
I-66 Multimodal Study 3-49
Cost Estimates
Package 3 has a high estimated cost due to the highway capacity expansion, as shown in Table 3.10. The highway costs reflect the addition of a lane in each direction and controls asso-ciated with HOV restricted operations during the peak periods. There is no tolling option in this package, reflected by the lower highway cost than Package 2. The transit costs reflect the added transit service. The majority of the transit cost is for operating expenses, which will be incurred annually. Transit costs do not include additional costs associated with increased maintenance and storage needs.
Table 3.10 Package 3 Cost Summary
Capital ($2011) Annual Operating ($2011)
Highway $340-665 million $3 million
Transit $6 million $26 million
Appendix D provides more detailed documentation of the cost estimation assumptions.
Key Findings
This package adds lane capacity and provides a Bus/HOV 2+ only lane in the reverse peak direction. There is a slight increase in HOV 2 usage but HOV 3+ usage does not increase. Multimodal mobility increases during the off-peak periods, when the added lane on I-66 is open to all traffic (not during the peak commuter periods due to the HOV 3+ requirement). This package improves travel times for HOV and transit.
3.7 Package 4 – Support of Enhanced Bus Service
Description
The key elements of Package 4 include:
Increased transit service for all routes entering the study area, including increased fre-quency on local, commuter, and regional bus services.
Headways on individual routes, that did not already have headways less than 15 minutes and were not part of trunk line services, were set at a minimum of 15 minutes in the peak and 30 minutes in the off-peak.
Trunk line routes, which did not have a combined headway less than 15 minutes, were set for a combined headway of 15 minutes in the peak and 30 minutes in the off-peak. The 15-
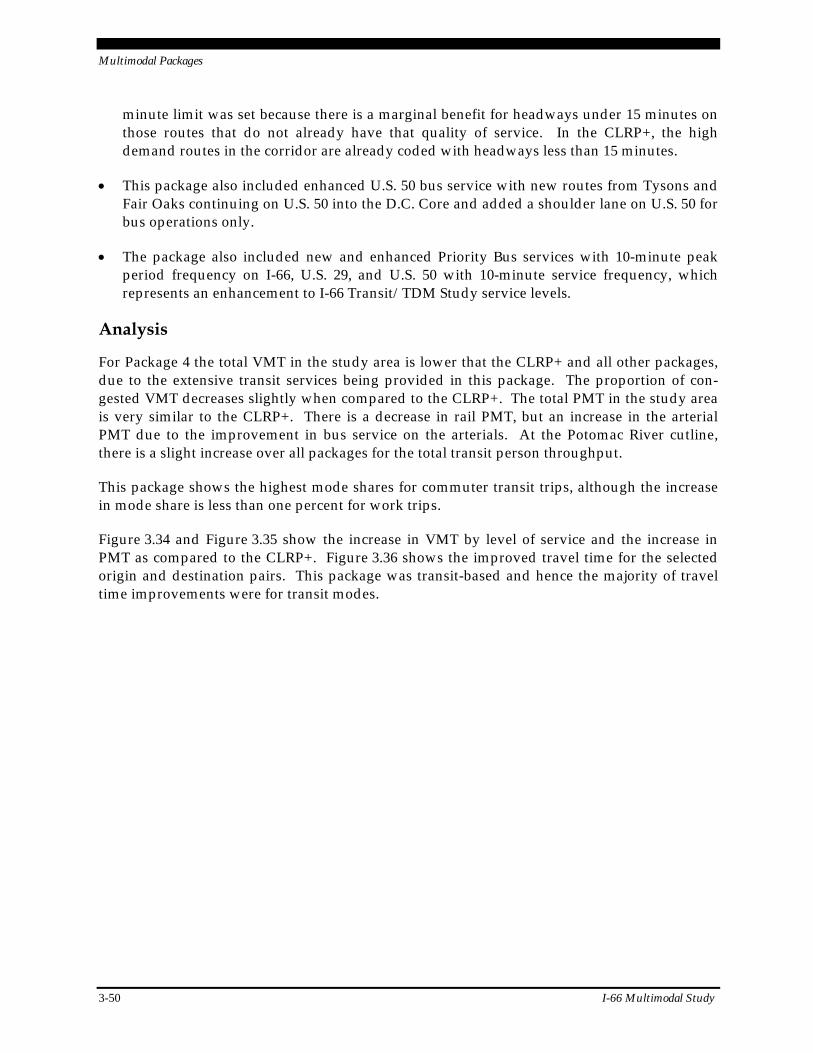
Multimodal Packages
3-50 I-66 Multimodal Study
minute limit was set because there is a marginal benefit for headways under 15 minutes on those routes that do not already have that quality of service. In the CLRP+, the high demand routes in the corridor are already coded with headways less than 15 minutes.
This package also included enhanced U.S. 50 bus service with new routes from Tysons and Fair Oaks continuing on U.S. 50 into the D.C. Core and added a shoulder lane on U.S. 50 for bus operations only.
The package also included new and enhanced Priority Bus services with 10-minute peak period frequency on I-66, U.S. 29, and U.S. 50 with 10-minute service frequency, which represents an enhancement to I-66 Transit/TDM Study service levels.
Analysis
For Package 4 the total VMT in the study area is lower that the CLRP+ and all other packages, due to the extensive transit services being provided in this package. The proportion of con-gested VMT decreases slightly when compared to the CLRP+. The total PMT in the study area is very similar to the CLRP+. There is a decrease in rail PMT, but an increase in the arterial PMT due to the improvement in bus service on the arterials. At the Potomac River cutline, there is a slight increase over all packages for the total transit person throughput.
This package shows the highest mode shares for commuter transit trips, although the increase in mode share is less than one percent for work trips.
Figure 3.34 and Figure 3.35 show the increase in VMT by level of service and the increase in PMT as compared to the CLRP+. Figure 3.36 shows the improved travel time for the selected origin and destination pairs. This package was transit-based and hence the majority of travel time improvements were for transit modes.
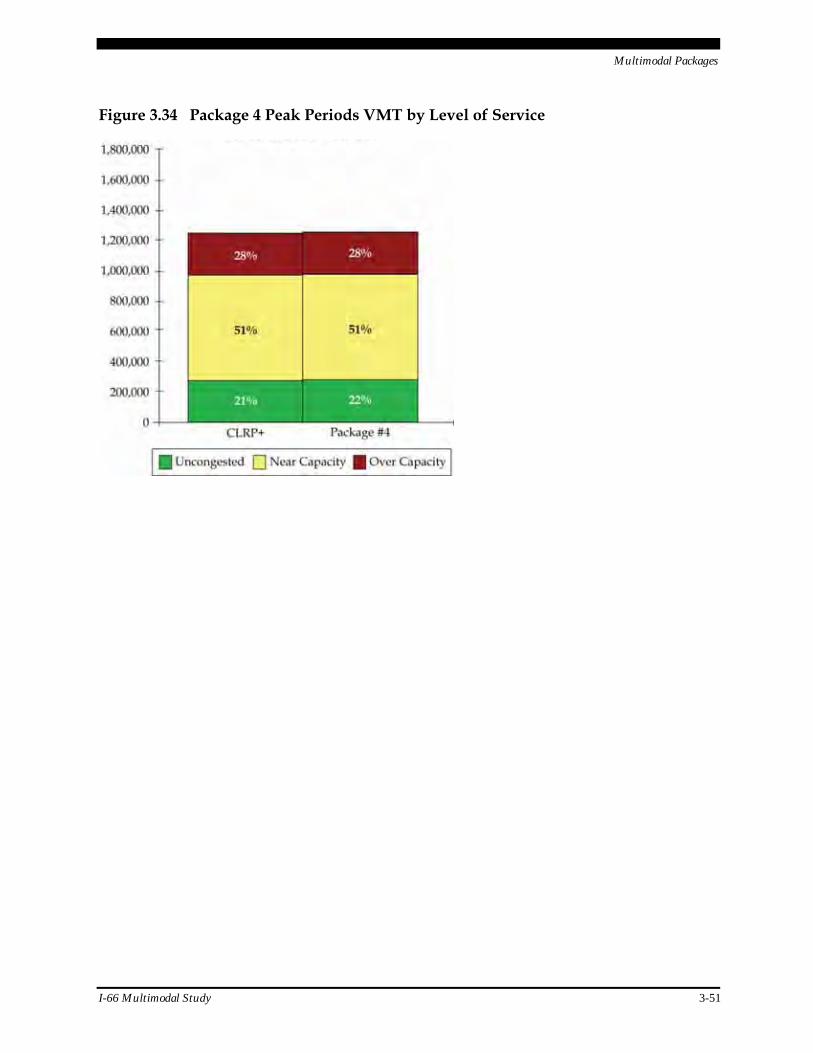
Multimodal Packages
I-66 Multimodal Study 3-51
Figure 3.34 Package 4 Peak Periods VMT by Level of Service
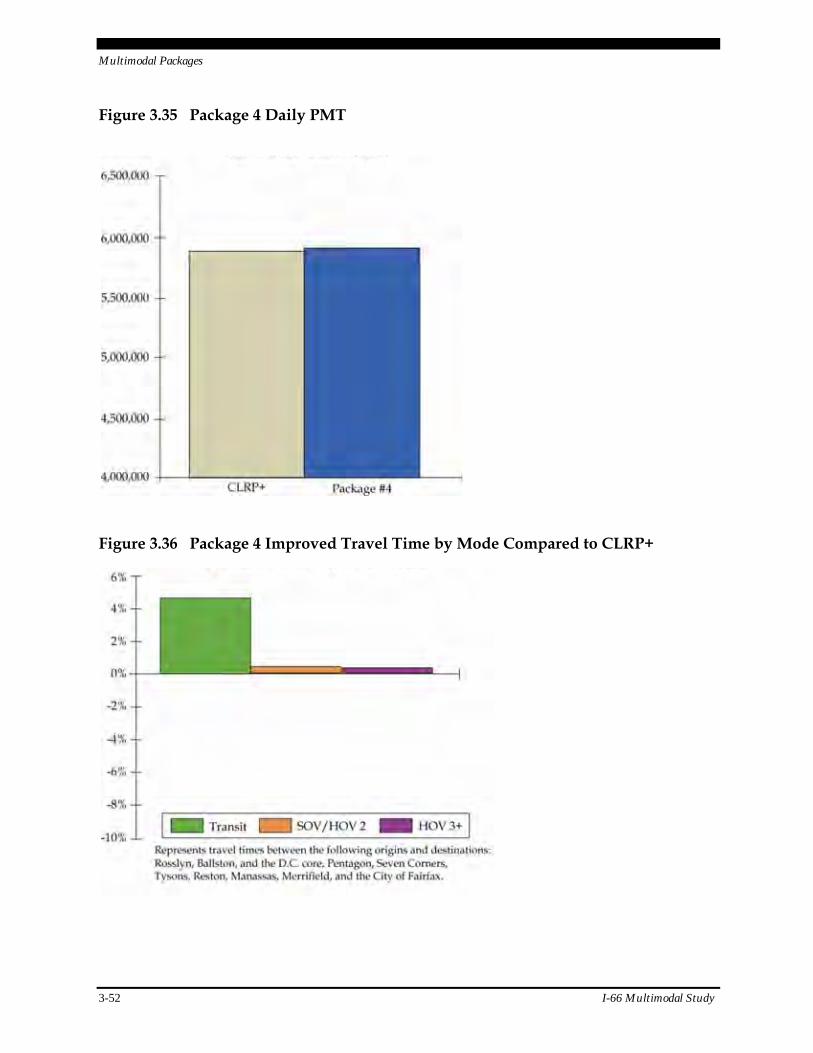
Multimodal Packages
3-52 I-66 Multimodal Study
Figure 3.35 Package 4 Daily PMT
Figure 3.36 Package 4 Improved Travel Time by Mode Compared to CLRP+
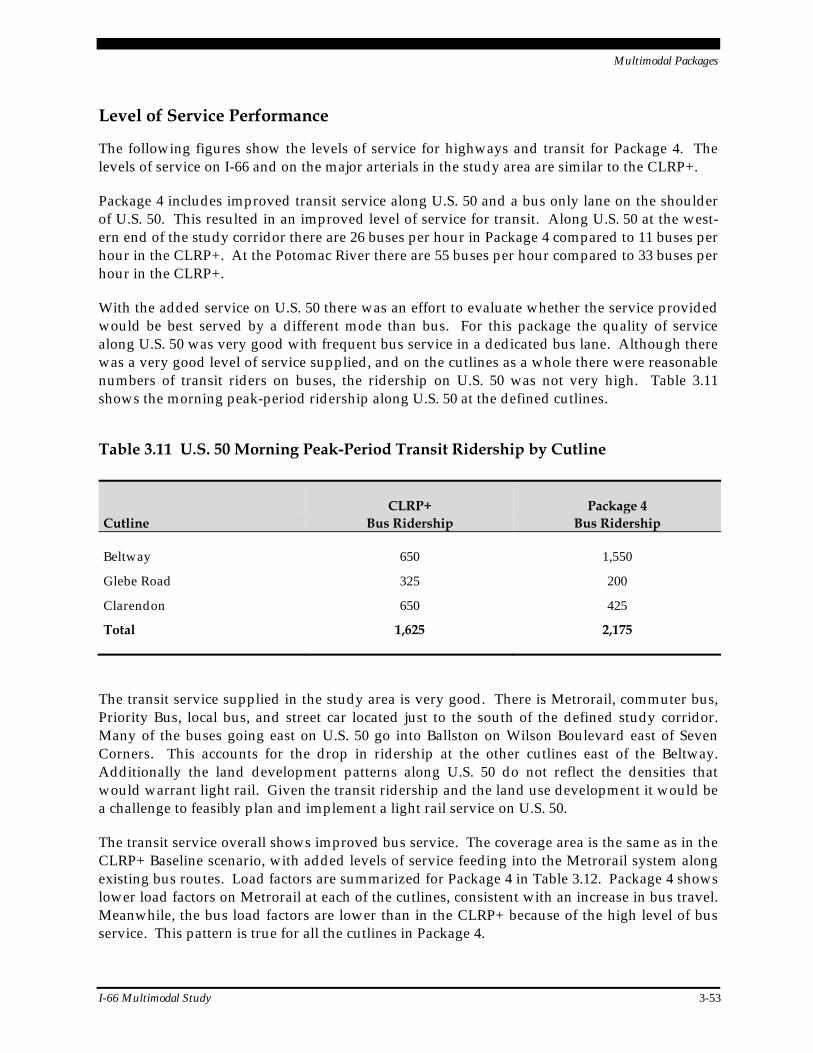
Multimodal Packages
I-66 Multimodal Study 3-53
Level of Service Performance
The following figures show the levels of service for highways and transit for Package 4. The levels of service on I-66 and on the major arterials in the study area are similar to the CLRP+.
Package 4 includes improved transit service along U.S. 50 and a bus only lane on the shoulder of U.S. 50. This resulted in an improved level of service for transit. Along U.S. 50 at the west-ern end of the study corridor there are 26 buses per hour in Package 4 compared to 11 buses per hour in the CLRP+. At the Potomac River there are 55 buses per hour compared to 33 buses per hour in the CLRP+.
With the added service on U.S. 50 there was an effort to evaluate whether the service provided would be best served by a different mode than bus. For this package the quality of service along U.S. 50 was very good with frequent bus service in a dedicated bus lane. Although there was a very good level of service supplied, and on the cutlines as a whole there were reasonable numbers of transit riders on buses, the ridership on U.S. 50 was not very high. Table 3.11 shows the morning peak-period ridership along U.S. 50 at the defined cutlines.
Table 3.11 U.S. 50 Morning Peak-Period Transit Ridership by Cutline
CLRP+ Package 4 Cutline Bus Ridership Bus Ridership
Beltway 650 1,550
Glebe Road 325 200
Clarendon 650 425
Total 1,625 2,175
The transit service supplied in the study area is very good. There is Metrorail, commuter bus, Priority Bus, local bus, and street car located just to the south of the defined study corridor. Many of the buses going east on U.S. 50 go into Ballston on Wilson Boulevard east of Seven Corners. This accounts for the drop in ridership at the other cutlines east of the Beltway. Additionally the land development patterns along U.S. 50 do not reflect the densities that would warrant light rail. Given the transit ridership and the land use development it would be a challenge to feasibly plan and implement a light rail service on U.S. 50.
The transit service overall shows improved bus service. The coverage area is the same as in the CLRP+ Baseline scenario, with added levels of service feeding into the Metrorail system along existing bus routes. Load factors are summarized for Package 4 in Table 3.12. Package 4 shows lower load factors on Metrorail at each of the cutlines, consistent with an increase in bus travel. Meanwhile, the bus load factors are lower than in the CLRP+ because of the high level of bus service. This pattern is true for all the cutlines in Package 4.
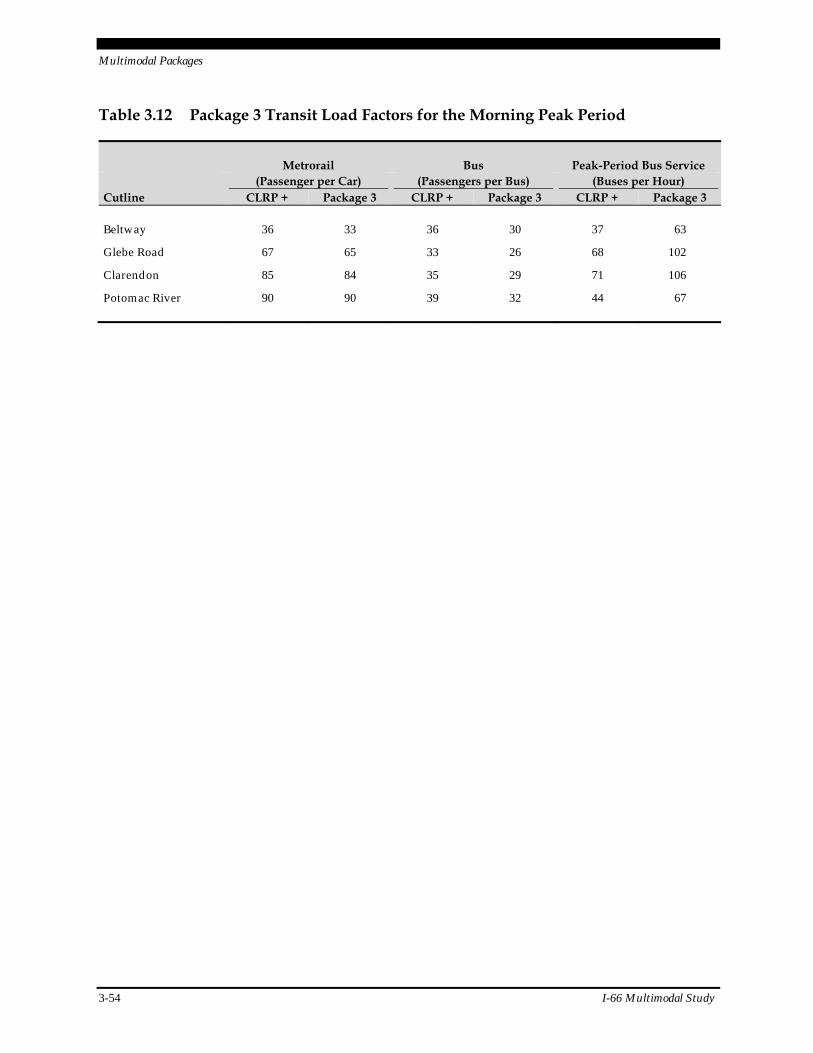
Multimodal Packages
3-54 I-66 Multimodal Study
Table 3.12 Package 3 Transit Load Factors for the Morning Peak Period
Metrorail Bus Peak-Period Bus Service (Passenger per Car) (Passengers per Bus) (Buses per Hour) Cutline CLRP + Package 3 CLRP + Package 3 CLRP + Package 3
Beltway 36 33 36 30 37 63
Glebe Road 67 65 33 26 68 102
Clarendon 85 84 35 29 71 106
Potomac River 90 90 39 32 44 67
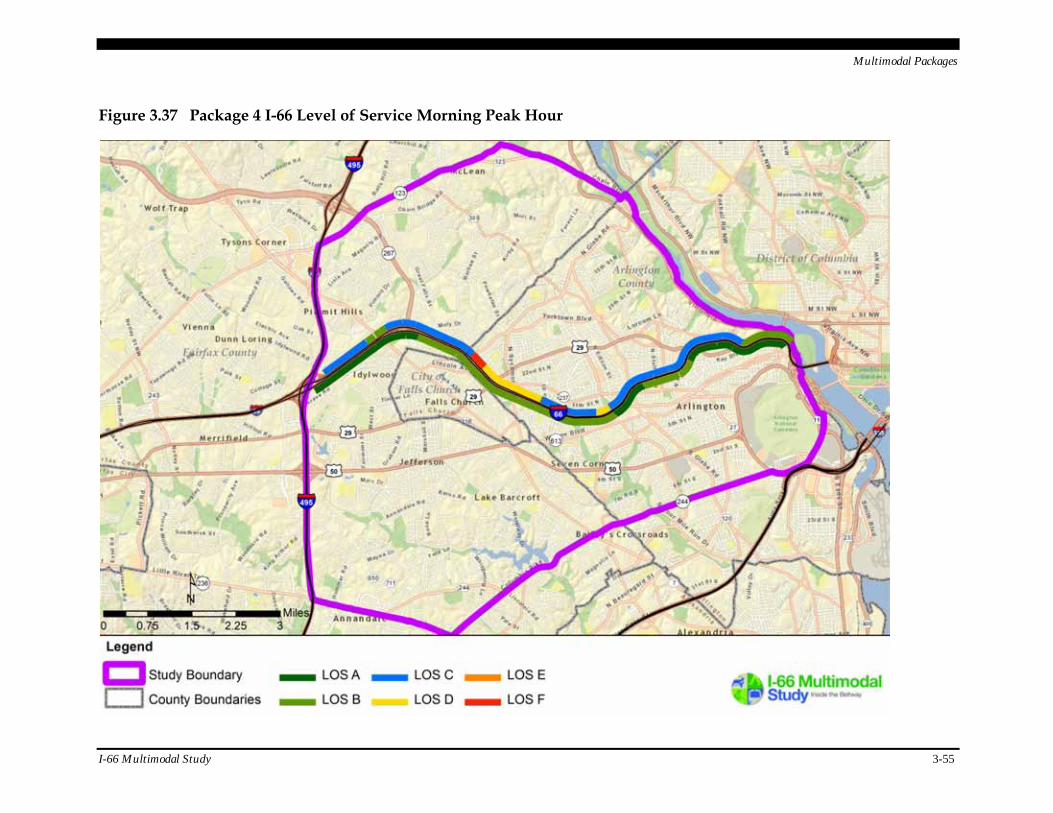
Multimodal Packages
I-66 Multimodal Study 3-55
Figure 3.37 Package 4 I-66 Level of Service Morning Peak Hour
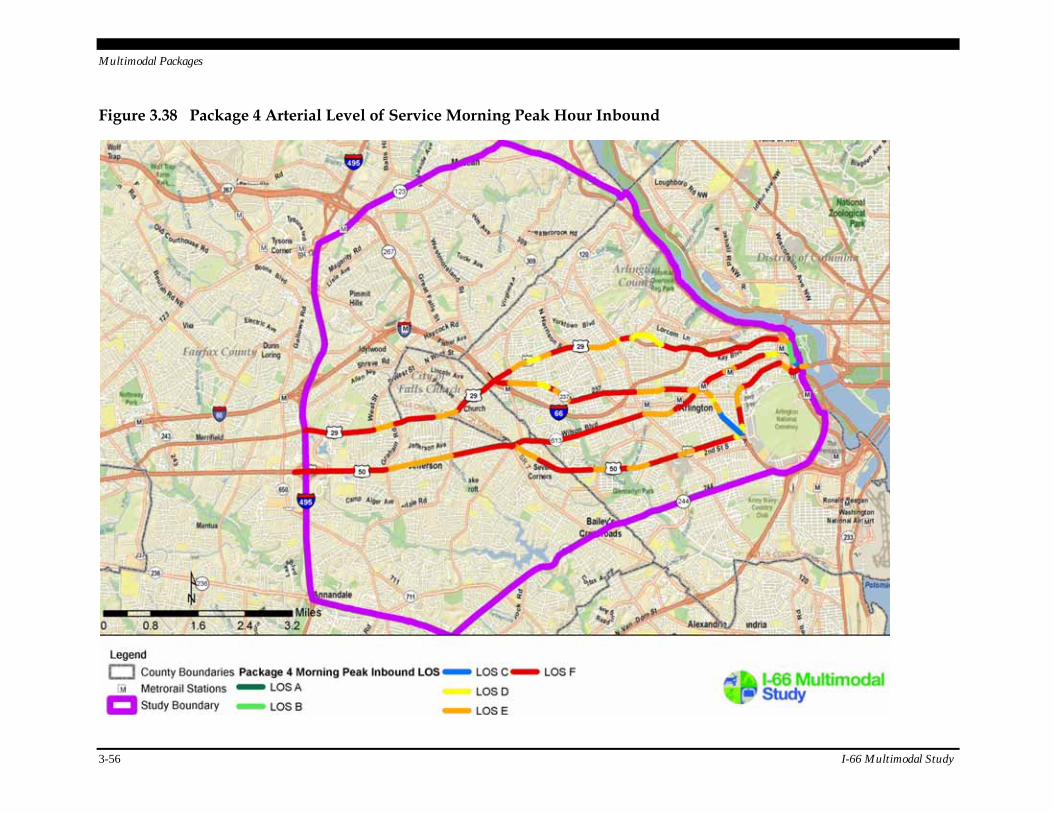
Multimodal Packages
3-56 I-66 Multimodal Study
Figure 3.38 Package 4 Arterial Level of Service Morning Peak Hour Inbound
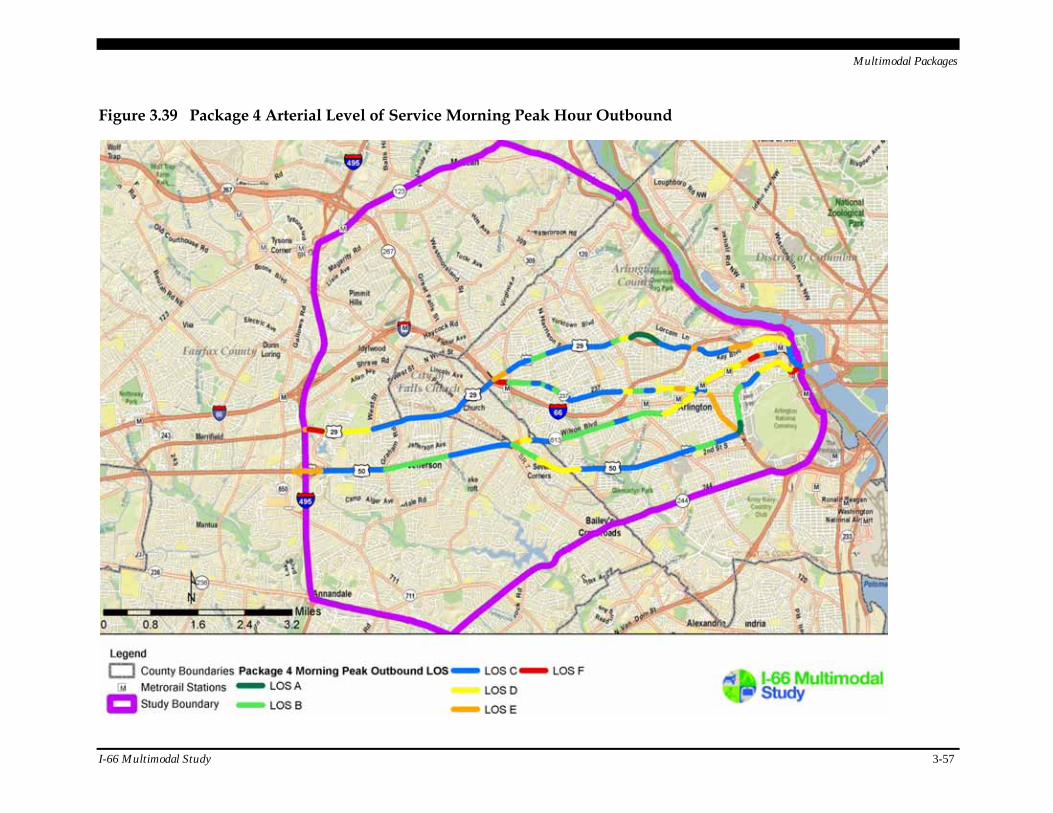
Multimodal Packages
I-66 Multimodal Study 3-57
Figure 3.39 Package 4 Arterial Level of Service Morning Peak Hour Outbound
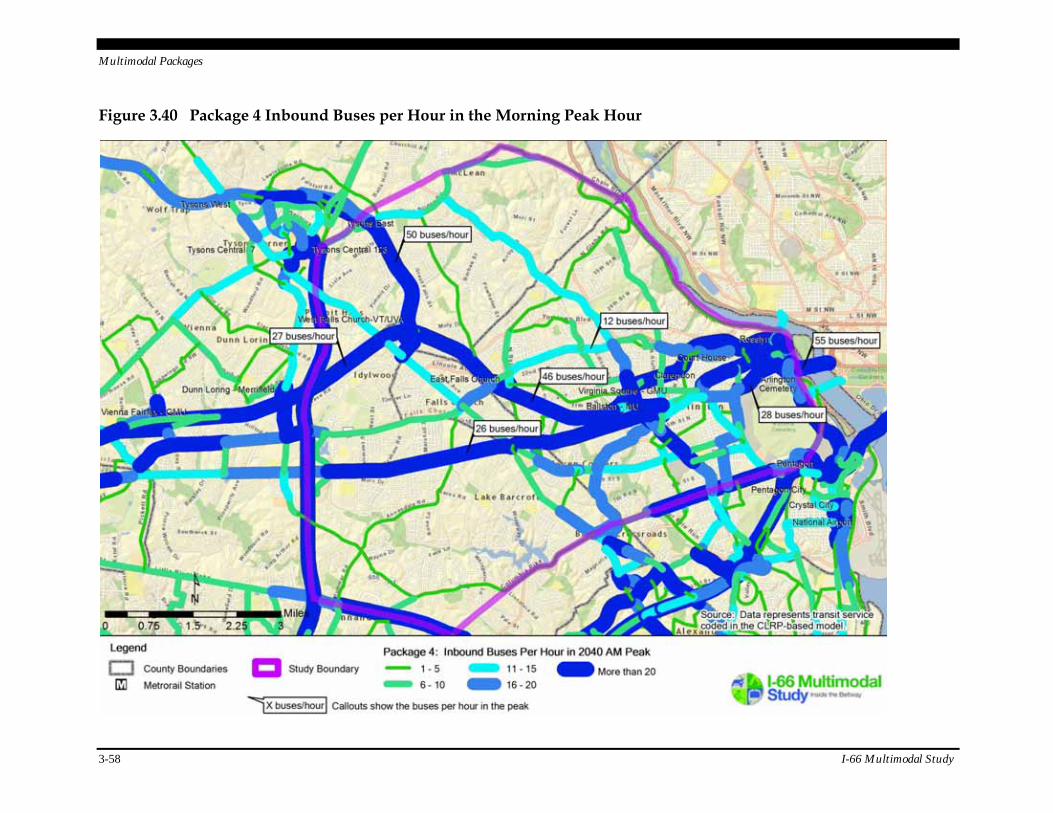
Multimodal Packages
3-58 I-66 Multimodal Study
Figure 3.40 Package 4 Inbound Buses per Hour in the Morning Peak Hour
Multimodal Packages
I-66 Multimodal Study 3-59
Cost Estimates
Package 4 has the highest transit capital and operating cost, which reflects the high level of transit service programmed for this alternative, as shown in Table 3.13. Transit operating expenses are incurred annually. Transit costs do not include additional costs associated with increased maintenance and storage needs. The highway cost reflects the construction of the shoulder lane along U.S. 50, which is designed as a bus only lane.
Table 3.13 Package 4 Cost Summary
Capital ($2011) Annual Operating ($2011)
Highway $211 million $1
Transit $9 million $46 million
Appendix D provides more detailed documentation of the cost estimation assumptions.
Key Findings
This package focused on enhancing transit service throughout the study area. It had the high-est number of commuters using transit and the lowest number using single occupant automo-biles. It produces slight decreases in overall vehicle travel (VMT) and congested VMT.
3.8 Integrated Corridor Management
ICM brings together a variety of technology elements, providing drivers, transit users, carpoo-lers, and bicyclists with information to be able to make informed transportation decisions in advance or in real time. When ICM elements are implemented, users can expect greater travel time reliability and more efficient use of corridor infrastructure. The I-66 Active Traffic Management (I-66 ATM) project is addressing several such improvements. Specific elements of ICM considered in the I-66 Multimodal Study include:
Enhanced Ramp Metering (I-66 ATM);
Dynamic Merge (Junction Control) (I-66 ATM);
Enhanced Dynamic Message Signs (I-66 ATM);
Continuous Closed-Circuit Television Coverage (I-66 ATM);
Speed Harmonization;
Advanced Parking Management System;
Multimodal Packages
3-60 I-66 Multimodal Study
Multimodal Traveler Information; and
Signal Priority for Transit Vehicles.
Performance Measures
FHWA suggests that ICM strategies should be assessed using four primary performance measures:2
Safety: The number and severity of crashes (fatal, injury, property damage);
Mobility: How well the corridor moves people and freight;
Reliability: The relative predictability of the public’s travel times; and
Emissions and fuel consumption: Impacts of ICM strategies on fuel use and emissions.
ICM strategies act on these measures in several ways. Extensive and dynamic traveler infor-mation can be used to encourage motorists to shift their trip departure times, routes, and modal choices. Vehicle speeds and facility capacity can be addressed using adaptive ramp metering, adjusting traffic signal timings to accommodate demand fluctuations, or through direct regula-tion of speed limits. ICM provides a means to adjust travel patterns and trip characteristics prior to, or even during the course of trips, in response to changing traffic conditions. Thus, through ICM the transportation system can be more efficiently utilized and provide safer, more reliable, and less polluting travel.
Integrated Corridor Approach
An integrated approach to the I-66 corridor could be modeled on the ongoing efforts to design and implement ICM in the I-95/395 corridor. Strategies include providing real-time traveler information, improving alternative arterial routes, hard shoulder running, and various parking system enhancements.
Providing real-time traveler information would include disseminating information to patrons using all transportation facilities in the vicinity via mobile devices, dynamic signs, and through web sites. Drivers, transit users, carpoolers, and bicyclists can be provided information to be able to make informed decisions in advance or in real time.
Improved alternative arterial route operations, including traffic-adaptive signal control, traffic signal priority for express buses, and optimized operations to reduce or eliminate back-ups on ramps or approaches to signalized junctions are important ICM strategies.
Hard shoulder running and dynamic traffic management in specific route segments can be used as a strategy to reduce bottlenecks and increase capacity on existing facilities. Enhanced traffic flow and incident management throughout the corridor, including incident detection, also can enhance safety, mobility, reliability, and emission levels. 2 FHWA, Volume 74. No. 3, Public Roads, Integrated Corridor Management.
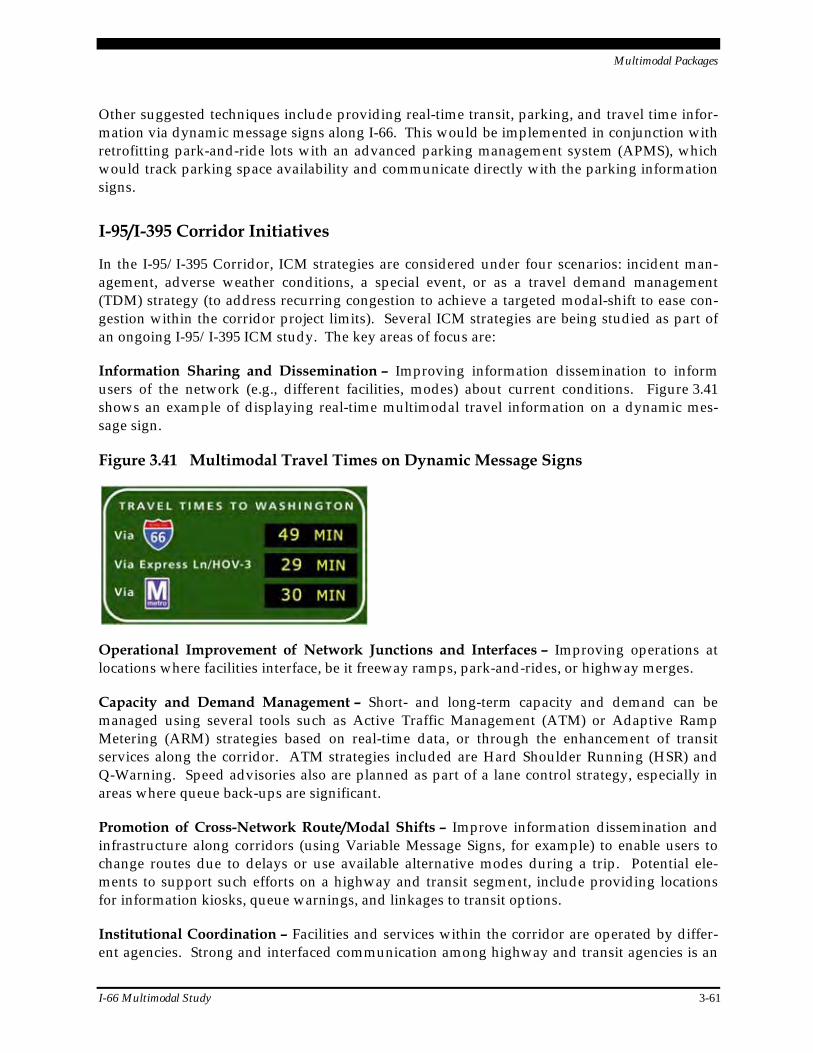
Multimodal Packages
I-66 Multimodal Study 3-61
Other suggested techniques include providing real-time transit, parking, and travel time infor-mation via dynamic message signs along I-66. This would be implemented in conjunction with retrofitting park-and-ride lots with an advanced parking management system (APMS), which would track parking space availability and communicate directly with the parking information signs.
I-95/I-395 Corridor Initiatives
In the I-95/I-395 Corridor, ICM strategies are considered under four scenarios: incident man-agement, adverse weather conditions, a special event, or as a travel demand management (TDM) strategy (to address recurring congestion to achieve a targeted modal-shift to ease con-gestion within the corridor project limits). Several ICM strategies are being studied as part of an ongoing I-95/I-395 ICM study. The key areas of focus are:
Information Sharing and Dissemination – Improving information dissemination to inform users of the network (e.g., different facilities, modes) about current conditions. Figure 3.41 shows an example of displaying real-time multimodal travel information on a dynamic mes-sage sign.
Figure 3.41 Multimodal Travel Times on Dynamic Message Signs
Operational Improvement of Network Junctions and Interfaces – Improving operations at locations where facilities interface, be it freeway ramps, park-and-rides, or highway merges.
Capacity and Demand Management – Short- and long-term capacity and demand can be managed using several tools such as Active Traffic Management (ATM) or Adaptive Ramp Metering (ARM) strategies based on real-time data, or through the enhancement of transit services along the corridor. ATM strategies included are Hard Shoulder Running (HSR) and Q-Warning. Speed advisories also are planned as part of a lane control strategy, especially in areas where queue back-ups are significant.
Promotion of Cross-Network Route/Modal Shifts – Improve information dissemination and infrastructure along corridors (using Variable Message Signs, for example) to enable users to change routes due to delays or use available alternative modes during a trip. Potential ele-ments to support such efforts on a highway and transit segment, include providing locations for information kiosks, queue warnings, and linkages to transit options.
Institutional Coordination – Facilities and services within the corridor are operated by differ-ent agencies. Strong and interfaced communication among highway and transit agencies is an
Multimodal Packages
3-62 I-66 Multimodal Study
emerging focus area. Communicating with other partners such as police, fire, and other emer-gency responders continues to be important. For this purpose, an institutional framework is developed to promote improved coordination among key stakeholders for effective imple-mentation of ICM strategies in the corridor.
I- 66 Corridor Initiatives
The I-66 Active Traffic Management (ATM) Initiative is underway in the I-66 Corridor and will comprise an important element of the I-66 ICM. Figure 3.42 illustrates the strategies under con-sideration in this program for I-66 inside and outside the Beltway. The objective of the strate-gies recommended as a part of the ATM initiative was to facilitate dynamic transportation network management based on prevailing traffic conditions. This initiative is anticipated to be operational in December 2013.
Inside the Beltway
Specific treatments being implemented as part of the ATM inside the Beltway are as follows.
Upgrading of Existing Ramp Metering – Ramp metering maintains smooth freeway mainline flow by breaking up platoons of entering vehicles and/or limiting vehicle entry at entrance ramps and is a treatment used to mitigate freeway congestion due to merging vehicles. The primary objectives of ramp metering include managing traffic demand to reduce congestion, improving the efficiency of merging, and reducing accidents – all of which lead to improved mainline freeway flow. In some situations, high-volume freeway mainline flow can accommo-date disbursed merging vehicles, but often cannot handle groups of vehicles at once. Ramp meters may control ramp traffic based on conditions in the field or manually to optimize the release of vehicles entering the freeway facility.
Ramp metering currently is operational at the following locations inside the Beltway along the I-66 corridor:
I-66 Eastbound and VA Route 7;
I-66 Eastbound and Sycamore Street;
I-66 Eastbound and Glebe Road;
I-66 Westbound and Fairfax Drive;
I-66 Westbound and Lee Hwy; and
I-66 Westbound and Scott Street.
The existing ramp metering inside the Beltway will be upgraded so that the metering considers the flow of traffic on I-66, rather than metering the merging traffic at set intervals.
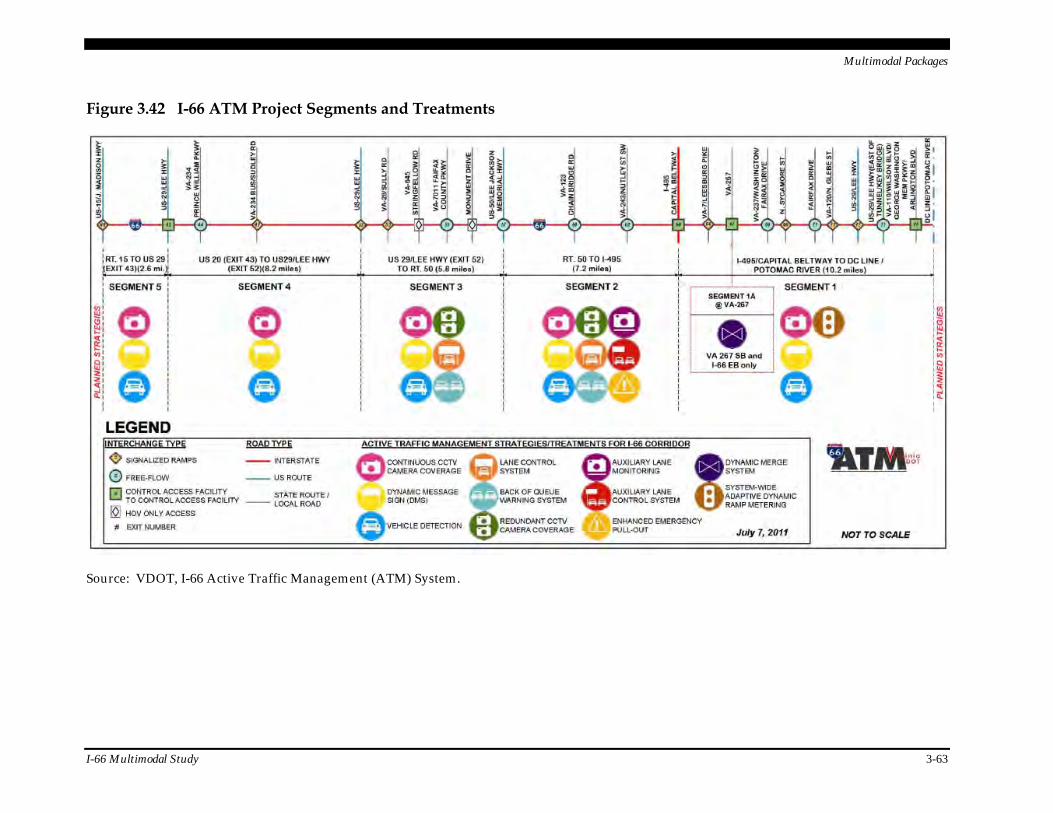
Multimodal Packages
I-66 Multimodal Study 3-63
Figure 3.42 I-66 ATM Project Segments and Treatments
Source: VDOT, I-66 Active Traffic Management (ATM) System.
Multimodal Packages
3-64 I-66 Multimodal Study
Dynamic Merge (Junction Control) – As defined by the FHWA, this is a method to dynami-cally change lane allocation at an interchange. It can be used at freeway off-ramps or on-ramps; particularly for high-volume ramps often associated with major freeway-to-freeway interchanges. This treatment is being implemented as part of the ATM at the junction of VA-267 and I-66 eastbound.
Junction control would be used to “close” the right lane of the mainline upstream of the ramp through the use of lane-control signs in order to give ramp traffic a near free-flow onto the mainline. Junction control provides priority to the facility with the higher volume and allows a lane drop to the lesser volume roadway. In addition to improving the flow conditions on the ramp, it could improve safety, as the hesitation of ramp drivers looking for gaps increases the propensity of rear-end collisions. The final cost of implementing this treatment, including installation of gantries, lane-control signs, and software integration is undetermined. Annual operations and maintenance costs are estimated at approximately 10 percent of the estimated capital costs.
Outside the Beltway
The following treatments will be implemented outside the Beltway as part of the ATM:
Speed Management – Speed advisories are provided based on observed traffic conditions;
Queue Warning – Dynamic message signs inform travelers of approaching queues/bottle-necks; and;
Hard Shoulder Running – Lane-control signs manage the use of shoulders as a travel lane.
Additional ICM Strategies
To expand the Active Traffic Management (ATM) to a fully integrated corridor management strategy for I-66, the following improvements could be implemented:
Speed Harmonization – Although not included in the I-66 ATM project inside the Beltway, speed harmonization is a possible strategy for use in this segment of I-66, particularly under managed lane scenarios. Speed harmonization systems use changeable speed limit signs posted over each lane to regulate freeway speeds based on prevailing traffic conditions.
This strategy can be used:
To control traffic speeds during adverse weather conditions as a safety measure;
When there is an incident or congestion on specific segments in order to reduce the chances of secondary accidents and facilitate a smoother flow of traffic; and
To improve the overall efficiency of a freeway network.
The I-66 corridor is potentially a good candidate for this strategy, given the numerous locations along the corridor with heavy traffic merges.
Multimodal Packages
I-66 Multimodal Study 3-65
Advanced Parking Management System (APMS) – Advanced Parking Management System (APMS) provide real-time information about park-and-ride facility utilization to corridor trav-elers, to help them plan their trips more efficiently, and improve their travel experience by helping reduce parking-related congestion and travel time, if applicable. These systems also encourage transit use.
As recommended in the 2009 WMATA Feasibility Study of Real-Time Parking Information, a pilot project of real-time parking information system is recommended for implementation at the West Falls Church Metrorail station. This system is estimated to cost $955,000 for capital expenses and $237,000 for annual maintenance and operating costs.
Multimodal Traveler Information – An important aspect of ICM strategies is dissemination of multimodal information to users, allowing them to change modes during their trip. This could be an effective mechanism to reduce congestion. From the users standpoint it gives the user modal choices that could particularly be effective in the event of an incident. The benefits of this strategy:
Potentially increase transit use and therefore improve person throughput;
Reduce travel time in the event of an incident; and
Improve the efficiency of the network as a whole.
Signal Priority for Transit Vehicles – Signal priority for transit vehicles is an effective ICM strategy. This would involve giving transit priority at freeway entrances and merges, which would allow buses to bypass ramp meter signals at freeway entrances. Buses could be given the same priority treatment on arterials. Transit vehicle priority and TSP technology would improve transit access to freeway entrances, increase transit efficiency, and encourage the use of transit.
Other Improvements
Through ICM strategies lane closures, variable speed limit signs, and adaptive ramp metering on the freeway could be integrated with traffic signal coordination improvements on arterials to improve local traffic flow. Coordinating these different elements of the corridor could improve access to the freeway for first responders, transit users, and drivers. Lane closures, lane use signal signs, and variable speed limit signs will allow vehicles to reduce speeds ahead of congestion, or an incident on the freeway, to balance traffic flow. Adaptive ramp metering functions meter the number of vehicles entering the freeway so that there is balanced traffic flow on the local arterials and the freeway. Traffic signal timing on the arterials and freeway entrances will be synchronized to accommodate traffic demand and reduce congestion throughout the I-66 corridor.
ICM Strategy Effectiveness Estimates
The benefits of instituting ICM strategies are multifold. Listed below are benefits that the ICM strategies recommended as part of the I-66 Multimodal Study are expected to produce:
Multimodal Packages
3-66 I-66 Multimodal Study
Improved network operations resulting in travel time savings, increased system reliability and overall emissions reductions;
Safer conditions, including quicker emergency response;
Reducing queuing and delays during incidents by rerouting highway traffic;
Providing multimodal options by dissemination of timely information (improving park-and-ride access, for example) and potentially utilizing unused capacity; and
Improving reliability and quality of ride by prioritizing transit.
The I-66 corridor has existing infrastructure which can be used for both the ATM and ICM strategies, including CCTV’s, detectors, and fiber-optic cable along the corridor. A preliminary cost estimate which includes the upgrade and purchase of hardware and software, for pro-posed ATM infrastructure inside the Beltway along I-66, is approximately $300,000 per mile (approximately 10 miles in both directions). The annual operating cost is assumed to be approximately 10 percent of the capital cost. Approximately $6 million in capital expenditures are required to implement ICM in the study area, with approximately $1 million per year assumed in operating costs.
ICM strategies were not modeled as part of the study; therefore, assessing benefits and costs of the ICM strategy would not be precise. There is, however, useful benefit/cost information related to ICM projects from around the country that can serve as reference, to better inform the decision-making process of this study.
A significant amount of experience has been gained at the three ICM pioneer sites – U.S. 75 in Dallas, Texas, I-394 in Minneapolis, Minnesota, and I-15 Corridor in San Diego, California. U.S. 75 is a north-south radial corridor that serves commuter, commercial, and regional trips, and is the primary connector from downtown Dallas to the cities to the north. The I-394 corri-dor stretching from the Minneapolis central business district to the Hennepin County line with Trunk Highway (TH) 55 to the north and TH 7 to the south. The third site is I-15, which is a north-south corridor that runs from SR 78 in the north to the SR 163 interchange in the south. I-15 is a primary artery for the movement of commuters, goods, and services from inland northern San Diego County to downtown San Diego. Listed below are preliminary results from the U.S. DOT pioneer ICM sites initiative:
ICM is a positive investment for all three sites. Both benefit/cost ratios and 10-year net benefits are positive and significant across all three sites;
Improved travel time reliability is the largest benefit of ICM. Reduced travel time is the second largest benefit, followed by fuel consumption and emissions benefits; and
ICM strategies produce more benefits at higher levels of travel demand and during nonrecurrent congestion.
Table 3.14 shows benefits calculated using consistent methodologies involving analysis, mod-eling, and simulation across the three sites. Ten-year net benefits are larger in Dallas than in
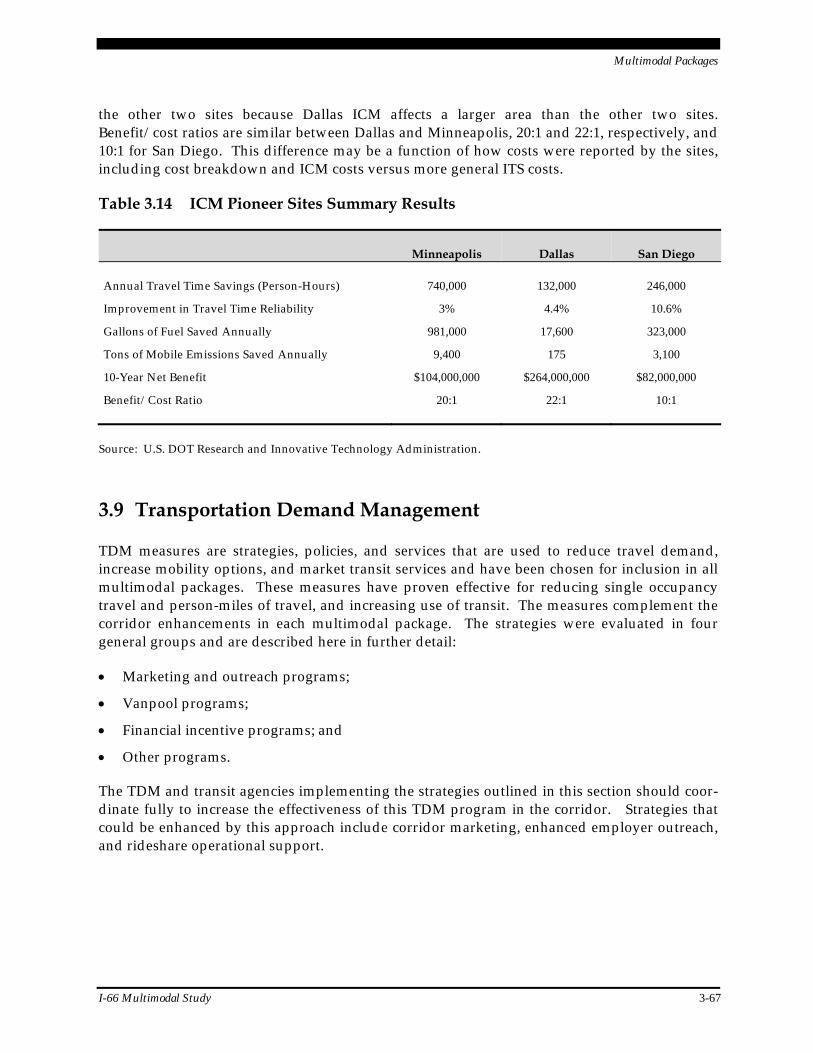
Multimodal Packages
I-66 Multimodal Study 3-67
the other two sites because Dallas ICM affects a larger area than the other two sites. Benefit/cost ratios are similar between Dallas and Minneapolis, 20:1 and 22:1, respectively, and 10:1 for San Diego. This difference may be a function of how costs were reported by the sites, including cost breakdown and ICM costs versus more general ITS costs.
Table 3.14 ICM Pioneer Sites Summary Results
Minneapolis Dallas San Diego
Annual Travel Time Savings (Person-Hours) 740,000 132,000 246,000
Improvement in Travel Time Reliability 3% 4.4% 10.6%
Gallons of Fuel Saved Annually 981,000 17,600 323,000
Tons of Mobile Emissions Saved Annually 9,400 175 3,100
10-Year Net Benefit $104,000,000 $264,000,000 $82,000,000
Benefit/Cost Ratio 20:1 22:1 10:1
Source: U.S. DOT Research and Innovative Technology Administration.
3.9 Transportation Demand Management
TDM measures are strategies, policies, and services that are used to reduce travel demand, increase mobility options, and market transit services and have been chosen for inclusion in all multimodal packages. These measures have proven effective for reducing single occupancy travel and person-miles of travel, and increasing use of transit. The measures complement the corridor enhancements in each multimodal package. The strategies were evaluated in four general groups and are described here in further detail:
Marketing and outreach programs;
Vanpool programs;
Financial incentive programs; and
Other programs.
The TDM and transit agencies implementing the strategies outlined in this section should coor-dinate fully to increase the effectiveness of this TDM program in the corridor. Strategies that could be enhanced by this approach include corridor marketing, enhanced employer outreach, and rideshare operational support.
Multimodal Packages
3-68 I-66 Multimodal Study
Marketing and Outreach Programs
Enhanced Corridor Marketing
This strategy includes targeted marketing (direct mail, newspaper advertisements) for TDM and transit along the corridor and in feeder markets, including reverse flow markets. The strat-egy would increase awareness of transit options and supportive TDM program elements and encourage mode shift.
Rideshare Program Operational Support
This strategy provides for additional staff for commuter assistance programs in the corridor to promote carpooling and transit services. The staff is assumed to be primarily assigned to Arlington and Fairfax County.
Enhanced Telework!VA
The enhanced Telework!VA strategy adds new financial incentives for Virginia employers and/or extends the level of assistance previously available. With an infusion of $500,000 per year, the incentive can be used to assist 20 employers with setting up a telework program.
Enhanced Employer Outreach
Employer Outreach programs act as the linchpin through which most of the other TDM ser-vices are provided or promoted. These programs typically include marketing of all modes, telework assistance, transit benefit program assistance, and vanpool and carpool program promotion. This strategy increases the funding to Fairfax and Arlington County to increase their outreach and assistance services to employers within the study area. This could include:
Staff support for outreach and assistance to employers;
Financial incentives/cost-sharing for employer-provided worksite services; and
Marketing programs and materials to communicate and encourage use of the full range of transportation options available in the corridor.
Vanpool Programs
Vanpool Driver Incentive
This strategy provides incentives to attract new drivers and retain existing drivers for vanpools. The subsidy assumed for this strategy would be small, but it would still serve to encourage new vanpools, particularly in combination with other vanpool-supportive strategies. Since the vanpool rider would not receive this incentive, it is assumed to have a minimal trip reduction benefit separate from other vanpool strategies.
Enhanced Virginia Vanpool Insurance Pool
This strategy was part of the I-66 Transit/TDM study and provides affordable insurance cover-age for vanpools by increasing the insurance premium buy-down for vanpools. By making
Multimodal Packages
I-66 Multimodal Study 3-69
insurance more affordable, an important financial incentive is provided to encourage vanpool formation. The additional funding provided by this study includes marketing the existing Virginia insurance pool to increase the user base of the pool.
Capital Assistance for Vanpools
This strategy provides financial assistance for the purchase or lease of vanpool vans.
Van Priority Access
This strategy allows vanpool vans to access bus-only infrastructure in the I-66 corridor.
Flexible Vanpool Network
This strategy develops and operates a network of overlapping vanpool routes which permit part-time ridership and flexibility for full-time riders to modify their vanpool schedule with a one-day advance reservation. It is similar to dynamic ridesharing, but is exclusively applied to commuter vans in the corridor.
Financial Incentive Programs
I-66 Corridor-Specific Startup Carpool Incentives
This strategy provides a three- to six-month carpool startup incentive for participating com-muters along the I-66 corridor. Surveys conducted in Atlanta (“Cash for Commuter” program) and other regions have shown that startup incentives can generate new carpools with substan-tial retention – 65 percent continued carpool use after 12 months. It is assumed that participa-tion is capped at 1,500 new participants per year.
Northern Virginia Ongoing Financial Incentive
This strategy offers a small ongoing reward opportunity (e.g., prize drawings) as an incentive to commuters traveling to or from Northern Virginia using a non-SOV mode. The system would use Internet-based reporting/logging of days using non-SOV modes. The reward would be tied to the frequency of non-SOV use. Surveys conducted in Atlanta related to the “Commuter Prizes” program estimated that about 60 percent of participants switched from drive alone to a non-SOV mode.
Try Transit Subsidy and/or Direct Transit Subsidy
This strategy provides a transit subsidy to entice single auto drivers to try transit and in some cases to continue using transit. It is assumed to be offered to residents and employees in the I-66 study area.
Other Programs
Carsharing at Priority Bus Activity Nodes
This strategy expands the existing carshare program to include vehicles at Priority Bus activity nodes. Although not particularly useful for commute trips due to their daily costs and the
Multimodal Packages
3-70 I-66 Multimodal Study
round trip usage requirement, carsharing vehicles can provide flexibility to transit or carpool travelers and thus encourage transit use and ridesharing. This strategy was included in the I-66 Transit/TDM study at no cost, as costs are traditionally absorbed by the operator of the vehicles.
Dynamic Ridesharing
This strategy provides implementation and operational support for immediate, web-based ridematching of potential carpool riders and drivers for regular pooling or one-time/occasional pooling. The system will include options to match within preregistered affinity groups or company/area groups and will include smart phone and social media applications.
TDM-Related Programs not Included in the TDM Mobility Option
In addition to the strategies above that are evaluated as part of the TDM Mobility Option, a few strategies that may be considered TDM are included in other option packages. These include:
Bicycle hubs/storage at Priority Bus activity nodes (included in the Bicycle/Pedestrian System Enhancements Option);
Capital Bikeshare marketing (included in the Bicycle/Pedestrian System Enhancements Option);
On-line/mobile travel information applications (included in the Integrated Corridor Management Option).
TDM Evaluation Methodology
Many of the methods and data used in the TDM evaluation are adapted from the I-66 Transit/TDM Study, but some methods have been revised and some parameters updated. Performance is calculated in terms of change in non-SOV mode share and change in person-miles of travel (PMT). The change in vehicle-trips (VT) also is calculated. Total annual cost and cost-effectiveness (dollar per vehicle-trip reduced) also are provided as measures of effectiveness. Calculations and assumptions supporting the 2040 results are shown in Appendix D.
TDM Program Funding Levels
Table 3.15 displays the assumed expenditure levels for each measure, including levels of expenditure previously assumed in the I-66 Transit/TDM Study, plus additional expenditures assumed in this I-66 Multimodal Study. These expenditures are in addition to current program expenditures. All expenditures are shown in current year (2011) dollars. Table 3.16 compares proposed expenditures in both studies with existing levels of TDM program expenditures in Northern Virginia.
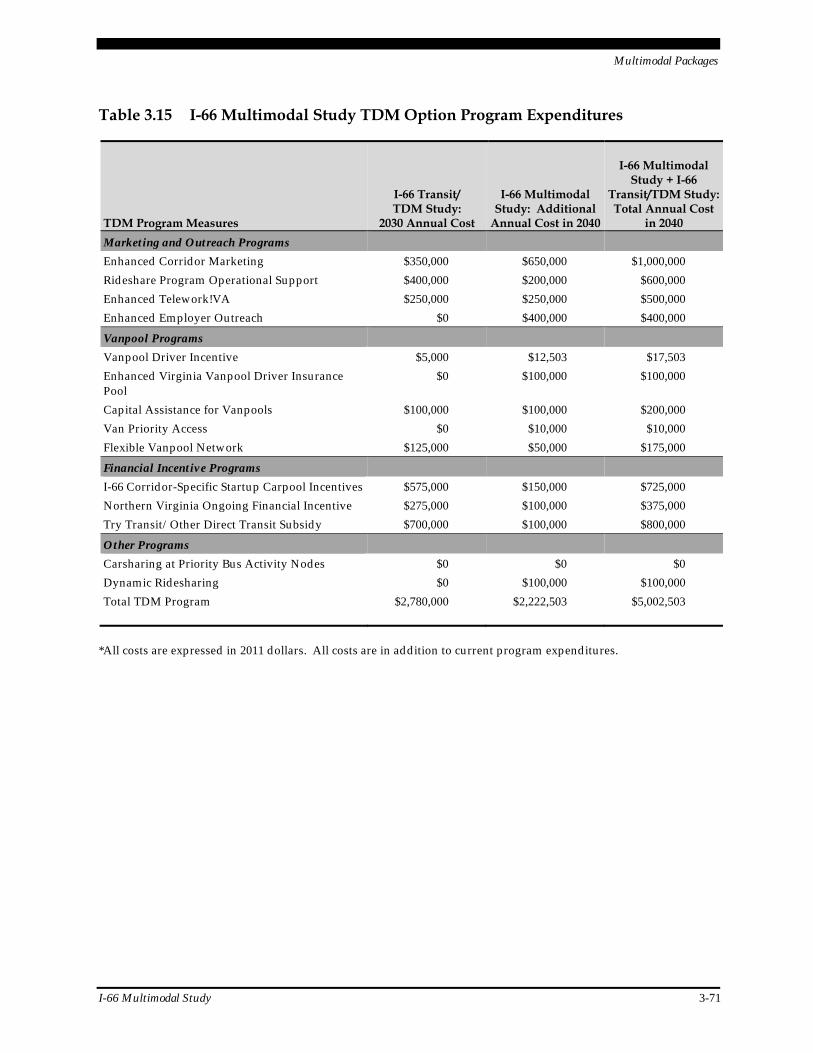
Multimodal Packages
I-66 Multimodal Study 3-71
Table 3.15 I-66 Multimodal Study TDM Option Program Expenditures
TDM Program Measures
I-66 Transit/ TDM Study:
2030 Annual Cost
I-66 Multimodal Study: Additional
Annual Cost in 2040
I-66 Multimodal Study + I-66
Transit/TDM Study: Total Annual Cost
in 2040
Marketing and Outreach Programs
Enhanced Corridor Marketing $350,000 $650,000 $1,000,000
Rideshare Program Operational Support $400,000 $200,000 $600,000
Enhanced Telework!VA $250,000 $250,000 $500,000
Enhanced Employer Outreach $0 $400,000 $400,000
Vanpool Programs
Vanpool Driver Incentive $5,000 $12,503 $17,503
Enhanced Virginia Vanpool Driver Insurance Pool
$0 $100,000 $100,000
Capital Assistance for Vanpools $100,000 $100,000 $200,000
Van Priority Access $0 $10,000 $10,000
Flexible Vanpool Network $125,000 $50,000 $175,000
Financial Incentive Programs
I-66 Corridor-Specific Startup Carpool Incentives $575,000 $150,000 $725,000
Northern Virginia Ongoing Financial Incentive $275,000 $100,000 $375,000
Try Transit/Other Direct Transit Subsidy $700,000 $100,000 $800,000
Other Programs
Carsharing at Priority Bus Activity Nodes $0 $0 $0
Dynamic Ridesharing $0 $100,000 $100,000
Total TDM Program $2,780,000 $2,222,503 $5,002,503
*All costs are expressed in 2011 dollars. All costs are in addition to current program expenditures.
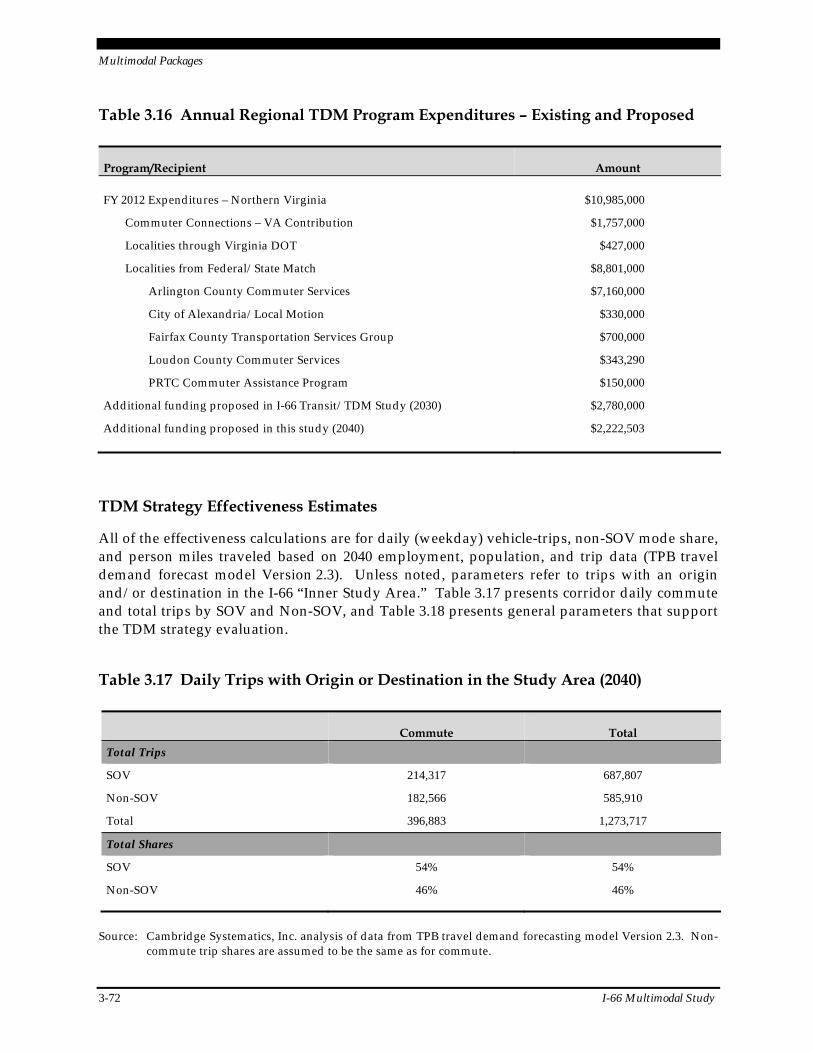
Multimodal Packages
3-72 I-66 Multimodal Study
Table 3.16 Annual Regional TDM Program Expenditures – Existing and Proposed
Program/Recipient Amount
FY 2012 Expenditures – Northern Virginia $10,985,000
Commuter Connections – VA Contribution $1,757,000
Localities through Virginia DOT $427,000
Localities from Federal/State Match $8,801,000
Arlington County Commuter Services $7,160,000
City of Alexandria/Local Motion $330,000
Fairfax County Transportation Services Group $700,000
Loudon County Commuter Services $343,290
PRTC Commuter Assistance Program $150,000
Additional funding proposed in I-66 Transit/TDM Study (2030) $2,780,000
Additional funding proposed in this study (2040) $2,222,503
TDM Strategy Effectiveness Estimates
All of the effectiveness calculations are for daily (weekday) vehicle-trips, non-SOV mode share, and person miles traveled based on 2040 employment, population, and trip data (TPB travel demand forecast model Version 2.3). Unless noted, parameters refer to trips with an origin and/or destination in the I-66 “Inner Study Area.” Table 3.17 presents corridor daily commute and total trips by SOV and Non-SOV, and Table 3.18 presents general parameters that support the TDM strategy evaluation.
Table 3.17 Daily Trips with Origin or Destination in the Study Area (2040)
Commute Total
Total Trips
SOV
Non-SOV
Total
214,317
182,566
396,883
687,807
585,910
1,273,717
Total Shares
SOV
Non-SOV
54%
46%
54%
46%
Source: Cambridge Systematics, Inc. analysis of data from TPB travel demand forecasting model Version 2.3. Non-commute trip shares are assumed to be the same as for commute.
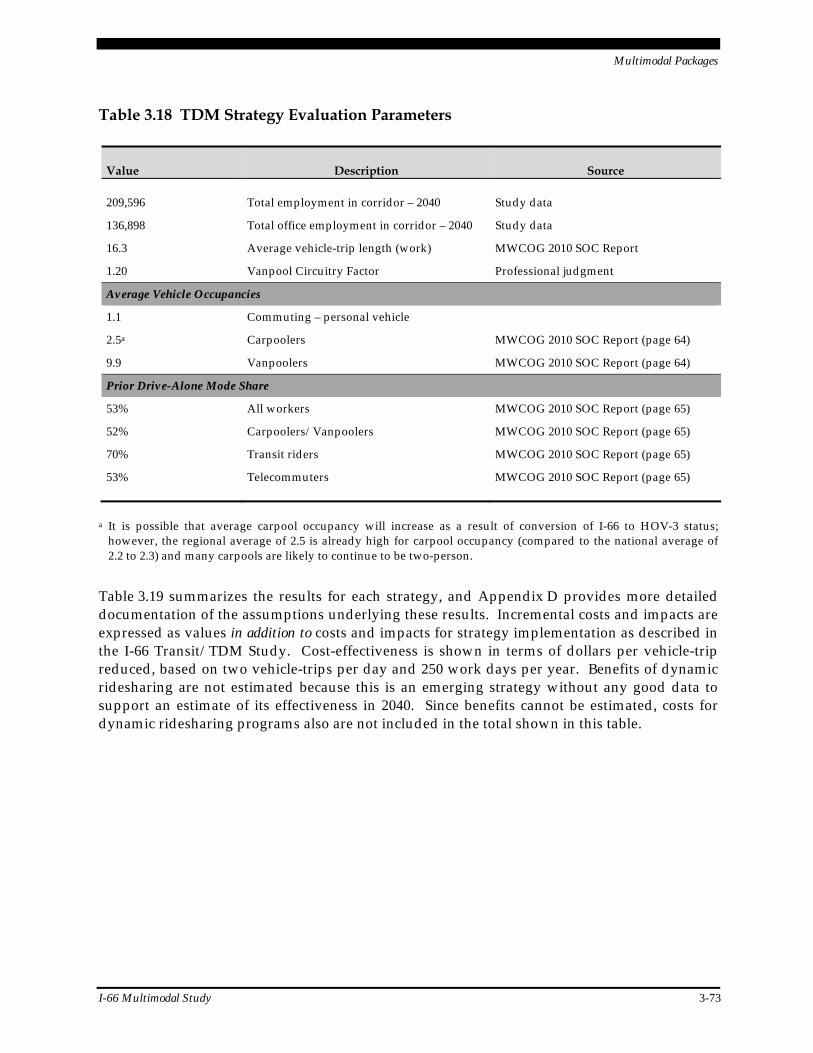
Multimodal Packages
I-66 Multimodal Study 3-73
Table 3.18 TDM Strategy Evaluation Parameters
Value Description Source
209,596 Total employment in corridor – 2040 Study data
136,898 Total office employment in corridor – 2040 Study data
16.3 Average vehicle-trip length (work) MWCOG 2010 SOC Report
1.20 Vanpool Circuitry Factor Professional judgment
Average Vehicle Occupancies
1.1 Commuting – personal vehicle
2.5a Carpoolers MWCOG 2010 SOC Report (page 64)
9.9 Vanpoolers MWCOG 2010 SOC Report (page 64)
Prior Drive-Alone Mode Share
53% All workers MWCOG 2010 SOC Report (page 65)
52% Carpoolers/Vanpoolers MWCOG 2010 SOC Report (page 65)
70% Transit riders MWCOG 2010 SOC Report (page 65)
53% Telecommuters MWCOG 2010 SOC Report (page 65)
a It is possible that average carpool occupancy will increase as a result of conversion of I-66 to HOV-3 status; however, the regional average of 2.5 is already high for carpool occupancy (compared to the national average of 2.2 to 2.3) and many carpools are likely to continue to be two-person.
Table 3.19 summarizes the results for each strategy, and Appendix D provides more detailed documentation of the assumptions underlying these results. Incremental costs and impacts are expressed as values in addition to costs and impacts for strategy implementation as described in the I-66 Transit/TDM Study. Cost-effectiveness is shown in terms of dollars per vehicle-trip reduced, based on two vehicle-trips per day and 250 work days per year. Benefits of dynamic ridesharing are not estimated because this is an emerging strategy without any good data to support an estimate of its effectiveness in 2040. Since benefits cannot be estimated, costs for dynamic ridesharing programs also are not included in the total shown in this table.
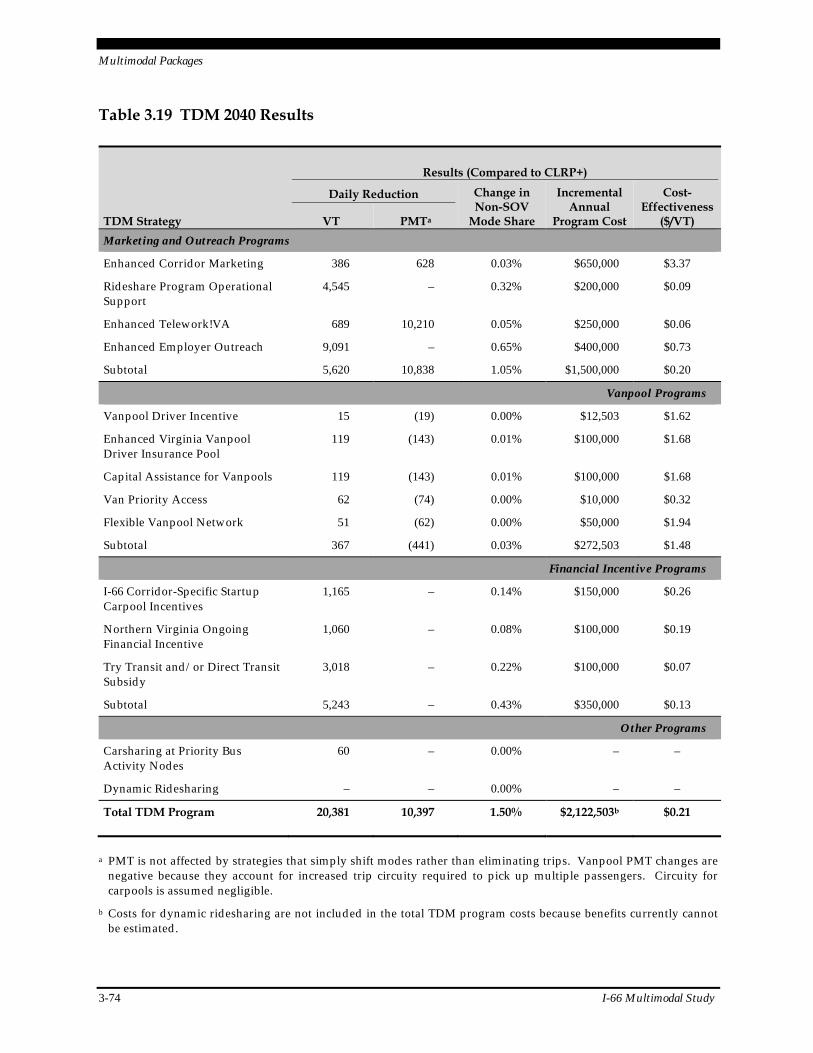
Multimodal Packages
3-74 I-66 Multimodal Study
Table 3.19 TDM 2040 Results
TDM Strategy
Results (Compared to CLRP+)
Daily Reduction Change in Non-SOV
Mode Share
Incremental Annual
Program Cost
Cost-Effectiveness
($/VT) VT PMTa
Marketing and Outreach Programs
Enhanced Corridor Marketing 386 628 0.03% $650,000 $3.37
Rideshare Program Operational Support
4,545 – 0.32% $200,000 $0.09
Enhanced Telework!VA 689 10,210 0.05% $250,000 $0.06
Enhanced Employer Outreach 9,091 – 0.65% $400,000 $0.73
Subtotal 5,620 10,838 1.05% $1,500,000 $0.20
Vanpool Programs
Vanpool Driver Incentive 15 (19) 0.00% $12,503 $1.62
Enhanced Virginia Vanpool Driver Insurance Pool
119 (143) 0.01% $100,000 $1.68
Capital Assistance for Vanpools 119 (143) 0.01% $100,000 $1.68
Van Priority Access 62 (74) 0.00% $10,000 $0.32
Flexible Vanpool Network 51 (62) 0.00% $50,000 $1.94
Subtotal 367 (441) 0.03% $272,503 $1.48
Financial Incentive Programs
I-66 Corridor-Specific Startup Carpool Incentives
1,165 – 0.14% $150,000 $0.26
Northern Virginia Ongoing Financial Incentive
1,060 – 0.08% $100,000 $0.19
Try Transit and/or Direct Transit Subsidy
3,018 – 0.22% $100,000 $0.07
Subtotal 5,243 – 0.43% $350,000 $0.13
Other Programs
Carsharing at Priority Bus Activity Nodes
60 – 0.00% – –
Dynamic Ridesharing – – 0.00% – –
Total TDM Program 20,381 10,397 1.50% $2,122,503b $0.21
a PMT is not affected by strategies that simply shift modes rather than eliminating trips. Vanpool PMT changes are negative because they account for increased trip circuity required to pick up multiple passengers. Circuity for carpools is assumed negligible.
b Costs for dynamic ridesharing are not included in the total TDM program costs because benefits currently cannot be estimated.
Multimodal Packages
I-66 Multimodal Study 3-75
3.10 Bicycle and Pedestrian System Enhancements
Bicycle and pedestrian improvements are incorporated as a common component to all multi-modal packages and are intended to provide increased accommodation for longer distance commute trips along the I-66 corridor, as well as shorter trips to access Metrorail stations and transit (bus) stops throughout the study area. Projects include a combination of on-road bicycle facilities (e.g., bicycle lanes and shared lane markings), signed bicycle routes, new or improved off-road trails and sidepaths, and intersection improvements to enhance crossing safety and comfort.
Additional bicycle parking in commercial areas and at transit stations, as well as expanded bikeshare facilities also are included to increase the utility and attractiveness of bicycling for transportation, for both routine as well as spontaneous trips.
Bicycle and Pedestrian Project Identification
The projects included in this study represent a subset of the larger bicycle and pedestrian improvement needs for the study area. Many projects are sourced from existing or ongoing planning activities in Fairfax County, the City of Falls Church, Arlington County, Northern Virginia Regional Park Authority (NVRPA), WMATA, and VDOT. Other projects were rec-ommended either explicitly by stakeholders and the community, or were included based on general needs (e.g., need better transit access) articulated by stakeholders at community meetings, during stakeholder interviews, or through the project survey. Lastly, a few projects necessary for overall network connectivity and system functionality were included based on the professional judgment of the project team, which may result in variations from local plans.
The selected projects were deemed to be of regional significance due to their function in the overall transportation system. For instance, a bicycle lane project on a road leading to a transit station is included in this analysis, but the ‘tributary’ facility improvements on side streets leading to this bicycle lane project may not be included. Table 3.20 and the corresponding map shown in Figure 3.43 present all bicycle and pedestrian system enhancements evaluated as part of this study. Some of the projects have moved past the project identification stage and are in planning or design phase by local jurisdictions. These projects are identified in Table 3.20 by an asterisk next to the project name.
It should be noted that given the relatively high-level nature of this study, a planning-level analysis has been applied to the included bicycle and pedestrian projects. In addition, projects were reviewed with planning staff in local jurisdictions and many of their comments have been incorporated. It is recognized that further analysis may be required to investigate the actual feasibility and design considerations (e.g., right-of-way impacts) for each project.
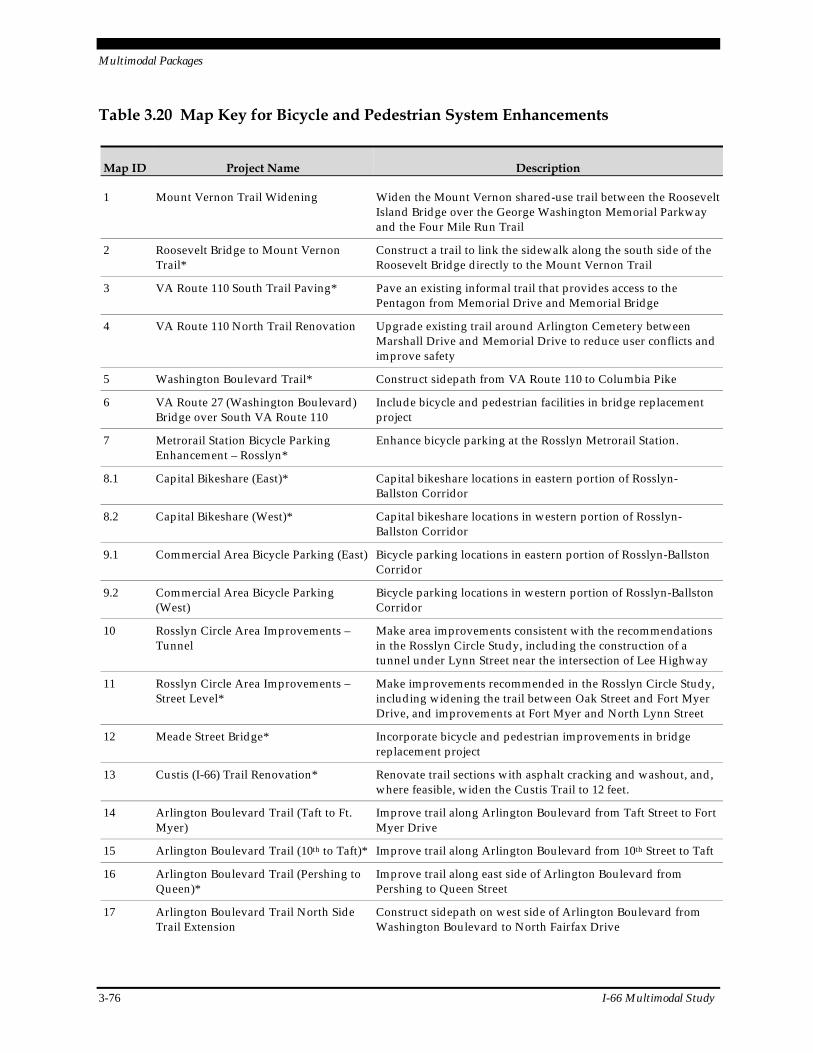
Multimodal Packages
3-76 I-66 Multimodal Study
Table 3.20 Map Key for Bicycle and Pedestrian System Enhancements
Map ID Project Name Description
1 Mount Vernon Trail Widening Widen the Mount Vernon shared-use trail between the Roosevelt Island Bridge over the George Washington Memorial Parkway and the Four Mile Run Trail
2 Roosevelt Bridge to Mount Vernon Trail*
Construct a trail to link the sidewalk along the south side of the Roosevelt Bridge directly to the Mount Vernon Trail
3 VA Route 110 South Trail Paving* Pave an existing informal trail that provides access to the Pentagon from Memorial Drive and Memorial Bridge
4 VA Route 110 North Trail Renovation Upgrade existing trail around Arlington Cemetery between Marshall Drive and Memorial Drive to reduce user conflicts and improve safety
5 Washington Boulevard Trail* Construct sidepath from VA Route 110 to Columbia Pike
6 VA Route 27 (Washington Boulevard) Bridge over South VA Route 110
Include bicycle and pedestrian facilities in bridge replacement project
7 Metrorail Station Bicycle Parking Enhancement – Rosslyn*
Enhance bicycle parking at the Rosslyn Metrorail Station.
8.1 Capital Bikeshare (East)* Capital bikeshare locations in eastern portion of Rosslyn-Ballston Corridor
8.2 Capital Bikeshare (West)* Capital bikeshare locations in western portion of Rosslyn-Ballston Corridor
9.1 Commercial Area Bicycle Parking (East) Bicycle parking locations in eastern portion of Rosslyn-Ballston Corridor
9.2 Commercial Area Bicycle Parking (West)
Bicycle parking locations in western portion of Rosslyn-Ballston Corridor
10 Rosslyn Circle Area Improvements – Tunnel
Make area improvements consistent with the recommendations in the Rosslyn Circle Study, including the construction of a tunnel under Lynn Street near the intersection of Lee Highway
11 Rosslyn Circle Area Improvements – Street Level*
Make improvements recommended in the Rosslyn Circle Study, including widening the trail between Oak Street and Fort Myer Drive, and improvements at Fort Myer and North Lynn Street
12 Meade Street Bridge* Incorporate bicycle and pedestrian improvements in bridge replacement project
13 Custis (I-66) Trail Renovation* Renovate trail sections with asphalt cracking and washout, and, where feasible, widen the Custis Trail to 12 feet.
14 Arlington Boulevard Trail (Taft to Ft. Myer)
Improve trail along Arlington Boulevard from Taft Street to Fort Myer Drive
15 Arlington Boulevard Trail (10th to Taft)* Improve trail along Arlington Boulevard from 10th Street to Taft
16 Arlington Boulevard Trail (Pershing to Queen)*
Improve trail along east side of Arlington Boulevard from Pershing to Queen Street
17 Arlington Boulevard Trail North Side Trail Extension
Construct sidepath on west side of Arlington Boulevard from Washington Boulevard to North Fairfax Drive
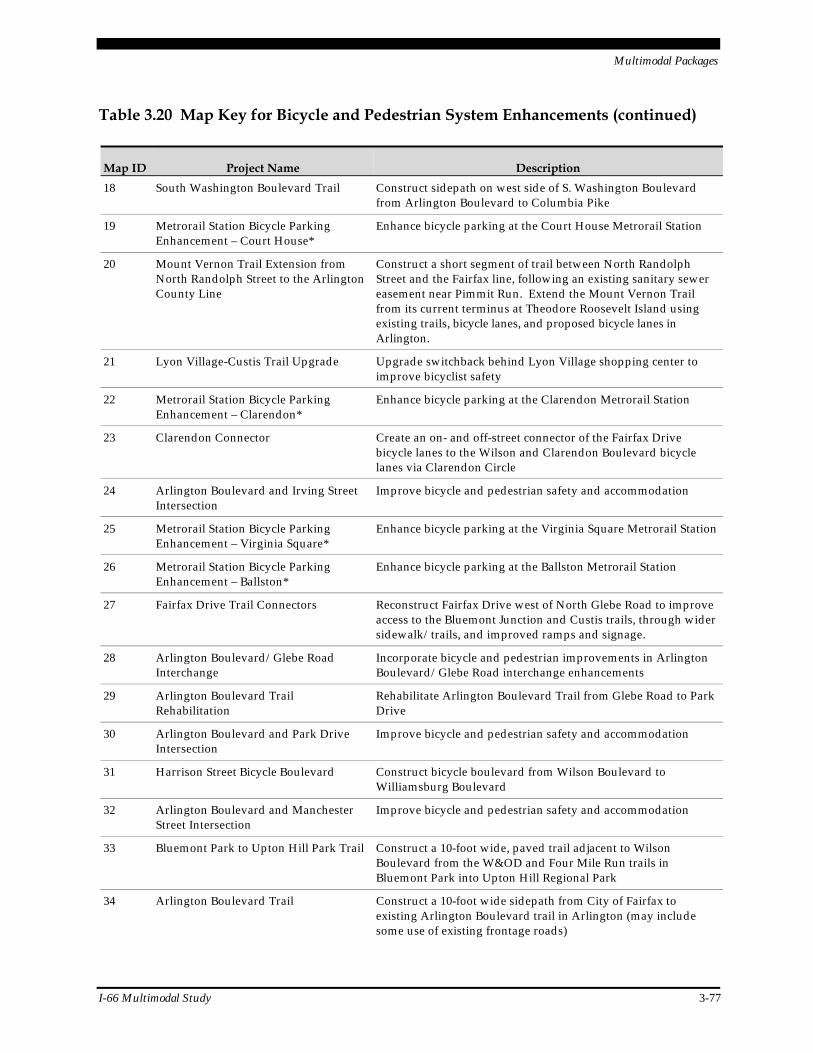
Multimodal Packages
I-66 Multimodal Study 3-77
Table 3.20 Map Key for Bicycle and Pedestrian System Enhancements (continued)
Map ID Project Name Description
18 South Washington Boulevard Trail Construct sidepath on west side of S. Washington Boulevard from Arlington Boulevard to Columbia Pike
19 Metrorail Station Bicycle Parking Enhancement – Court House*
Enhance bicycle parking at the Court House Metrorail Station
20 Mount Vernon Trail Extension from North Randolph Street to the Arlington County Line
Construct a short segment of trail between North Randolph Street and the Fairfax line, following an existing sanitary sewer easement near Pimmit Run. Extend the Mount Vernon Trail from its current terminus at Theodore Roosevelt Island using existing trails, bicycle lanes, and proposed bicycle lanes in Arlington.
21 Lyon Village-Custis Trail Upgrade Upgrade switchback behind Lyon Village shopping center to improve bicyclist safety
22 Metrorail Station Bicycle Parking Enhancement – Clarendon*
Enhance bicycle parking at the Clarendon Metrorail Station
23 Clarendon Connector Create an on- and off-street connector of the Fairfax Drive bicycle lanes to the Wilson and Clarendon Boulevard bicycle lanes via Clarendon Circle
24 Arlington Boulevard and Irving Street Intersection
Improve bicycle and pedestrian safety and accommodation
25 Metrorail Station Bicycle Parking Enhancement – Virginia Square*
Enhance bicycle parking at the Virginia Square Metrorail Station
26 Metrorail Station Bicycle Parking Enhancement – Ballston*
Enhance bicycle parking at the Ballston Metrorail Station
27 Fairfax Drive Trail Connectors Reconstruct Fairfax Drive west of North Glebe Road to improve access to the Bluemont Junction and Custis trails, through wider sidewalk/trails, and improved ramps and signage.
28 Arlington Boulevard/Glebe Road Interchange
Incorporate bicycle and pedestrian improvements in Arlington Boulevard/Glebe Road interchange enhancements
29 Arlington Boulevard Trail Rehabilitation
Rehabilitate Arlington Boulevard Trail from Glebe Road to Park Drive
30 Arlington Boulevard and Park Drive Intersection
Improve bicycle and pedestrian safety and accommodation
31 Harrison Street Bicycle Boulevard Construct bicycle boulevard from Wilson Boulevard to Williamsburg Boulevard
32 Arlington Boulevard and Manchester Street Intersection
Improve bicycle and pedestrian safety and accommodation
33 Bluemont Park to Upton Hill Park Trail Construct a 10-foot wide, paved trail adjacent to Wilson Boulevard from the W&OD and Four Mile Run trails in Bluemont Park into Upton Hill Regional Park
34 Arlington Boulevard Trail Construct a 10-foot wide sidepath from City of Fairfax to existing Arlington Boulevard trail in Arlington (may include some use of existing frontage roads)
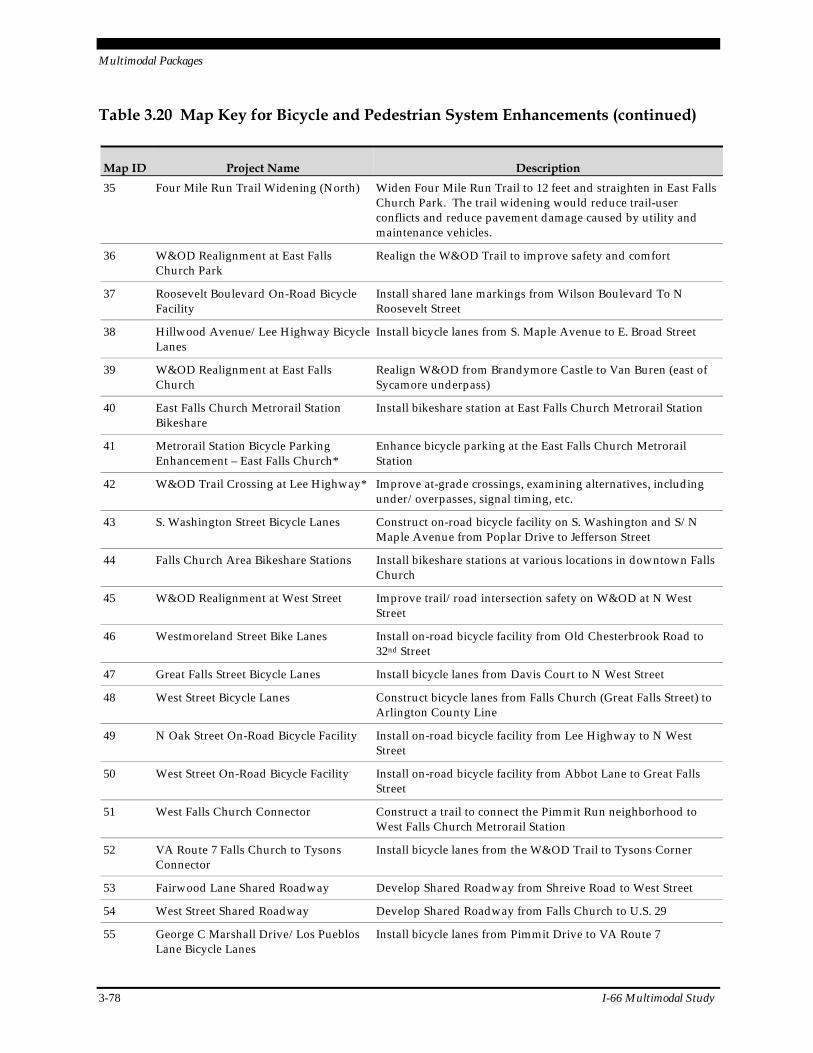
Multimodal Packages
3-78 I-66 Multimodal Study
Table 3.20 Map Key for Bicycle and Pedestrian System Enhancements (continued)
Map ID Project Name Description
35 Four Mile Run Trail Widening (North) Widen Four Mile Run Trail to 12 feet and straighten in East Falls Church Park. The trail widening would reduce trail-user conflicts and reduce pavement damage caused by utility and maintenance vehicles.
36 W&OD Realignment at East Falls Church Park
Realign the W&OD Trail to improve safety and comfort
37 Roosevelt Boulevard On-Road Bicycle Facility
Install shared lane markings from Wilson Boulevard To N Roosevelt Street
38 Hillwood Avenue/Lee Highway Bicycle Lanes
Install bicycle lanes from S. Maple Avenue to E. Broad Street
39 W&OD Realignment at East Falls Church
Realign W&OD from Brandymore Castle to Van Buren (east of Sycamore underpass)
40 East Falls Church Metrorail Station Bikeshare
Install bikeshare station at East Falls Church Metrorail Station
41 Metrorail Station Bicycle Parking Enhancement – East Falls Church*
Enhance bicycle parking at the East Falls Church Metrorail Station
42 W&OD Trail Crossing at Lee Highway* Improve at-grade crossings, examining alternatives, including under/overpasses, signal timing, etc.
43 S. Washington Street Bicycle Lanes Construct on-road bicycle facility on S. Washington and S/N Maple Avenue from Poplar Drive to Jefferson Street
44 Falls Church Area Bikeshare Stations Install bikeshare stations at various locations in downtown Falls Church
45 W&OD Realignment at West Street Improve trail/road intersection safety on W&OD at N West Street
46 Westmoreland Street Bike Lanes Install on-road bicycle facility from Old Chesterbrook Road to 32nd Street
47 Great Falls Street Bicycle Lanes Install bicycle lanes from Davis Court to N West Street
48 West Street Bicycle Lanes Construct bicycle lanes from Falls Church (Great Falls Street) to Arlington County Line
49 N Oak Street On-Road Bicycle Facility Install on-road bicycle facility from Lee Highway to N West Street
50 West Street On-Road Bicycle Facility Install on-road bicycle facility from Abbot Lane to Great Falls Street
51 West Falls Church Connector Construct a trail to connect the Pimmit Run neighborhood to West Falls Church Metrorail Station
52 VA Route 7 Falls Church to Tysons Connector
Install bicycle lanes from the W&OD Trail to Tysons Corner
53 Fairwood Lane Shared Roadway Develop Shared Roadway from Shreive Road to West Street
54 West Street Shared Roadway Develop Shared Roadway from Falls Church to U.S. 29
55 George C Marshall Drive/Los Pueblos Lane Bicycle Lanes
Install bicycle lanes from Pimmit Drive to VA Route 7
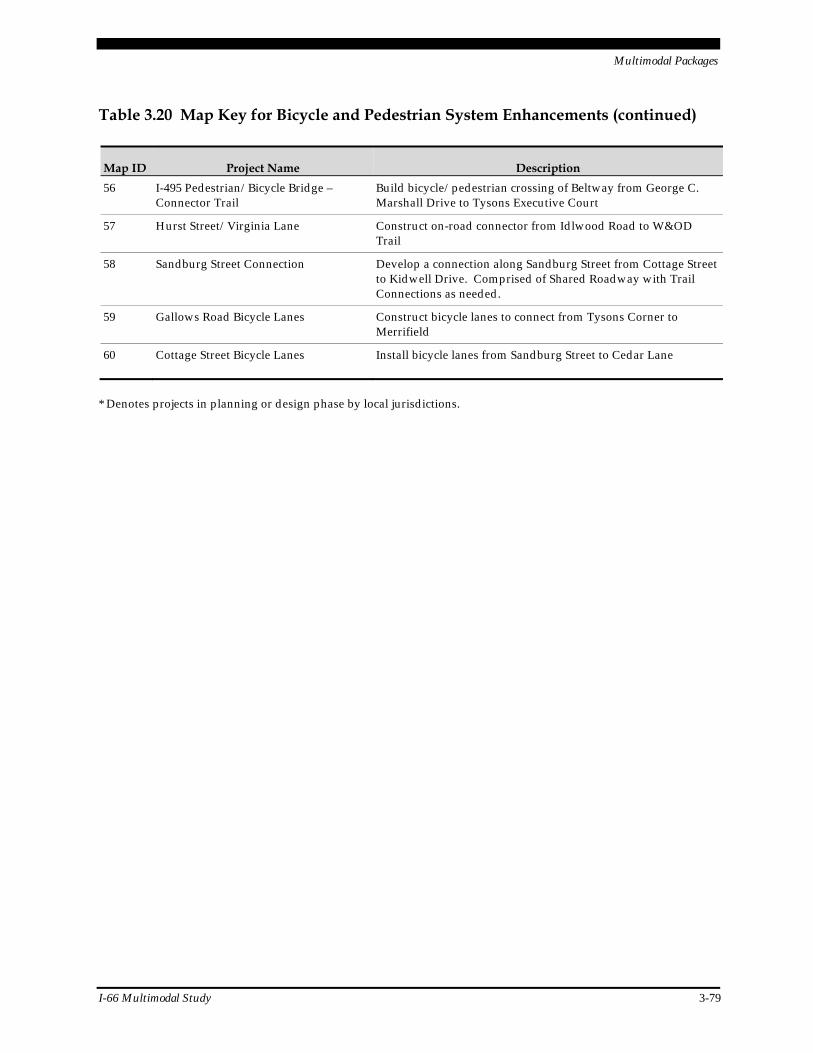
Multimodal Packages
I-66 Multimodal Study 3-79
Table 3.20 Map Key for Bicycle and Pedestrian System Enhancements (continued)
Map ID Project Name Description
56 I-495 Pedestrian/Bicycle Bridge – Connector Trail
Build bicycle/pedestrian crossing of Beltway from George C. Marshall Drive to Tysons Executive Court
57 Hurst Street/Virginia Lane Construct on-road connector from Idlwood Road to W&OD Trail
58 Sandburg Street Connection Develop a connection along Sandburg Street from Cottage Street to Kidwell Drive. Comprised of Shared Roadway with Trail Connections as needed.
59 Gallows Road Bicycle Lanes Construct bicycle lanes to connect from Tysons Corner to Merrifield
60 Cottage Street Bicycle Lanes Install bicycle lanes from Sandburg Street to Cedar Lane
* Denotes projects in planning or design phase by local jurisdictions.
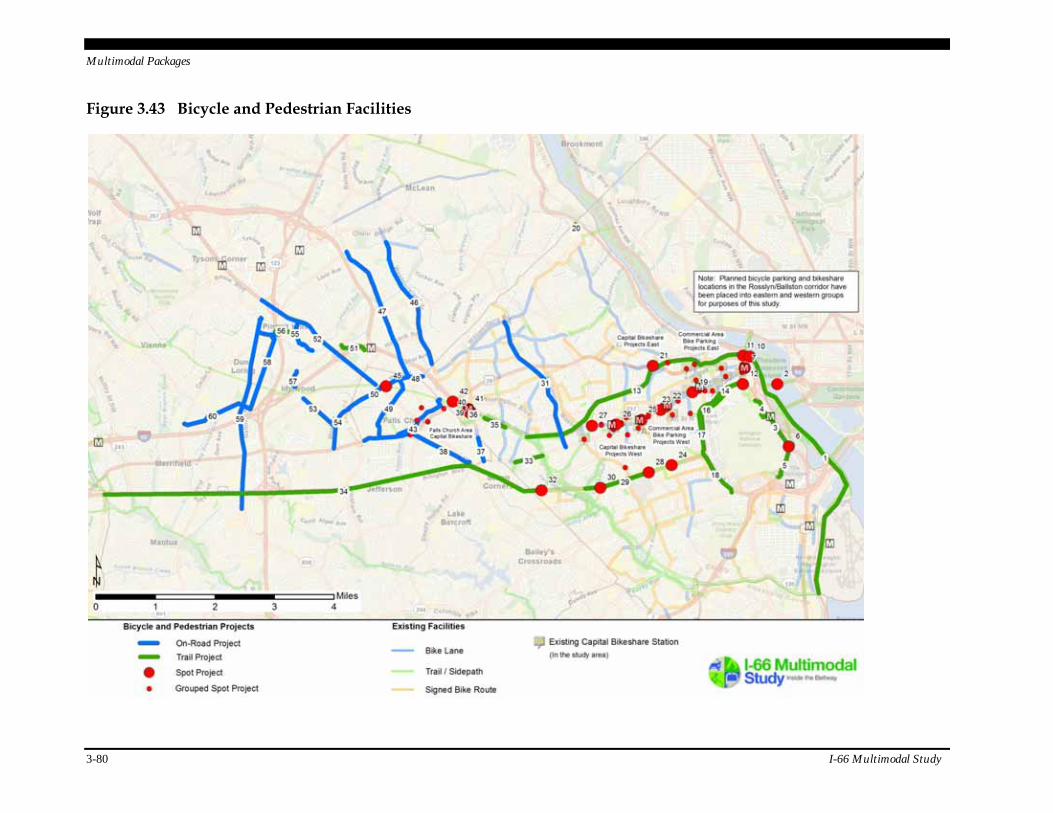
Multimodal Packages
3-80 I-66 Multimodal Study
Figure 3.43 Bicycle and Pedestrian Facilities
Multimodal Packages
I-66 Multimodal Study 3-81
Bicycle Level of Service
As previously noted, two scenarios were evaluated. Facilities were analyzed using a Baseline scenario assuming none of the recommended improvements have been made in 2040 and a scenario where all improvements have been completed, as shown in Figure 3.44 and 3.45, respectively. As certain projects would be new (i.e., currently do not exist), they do not appear in Figure 3.44.
It is recognized that there will likely be significant changes to the study area within the 2040 planning horizon; the Metrorail Silver Line stations will be open, Tysons Corner will be trans-formed, and the underlying transportation network may evolve as well. It is anticipated that many of the recommended bicycle and pedestrian improvements will be implemented well before 2040, either as a standalone project or as part of other transportation projects.
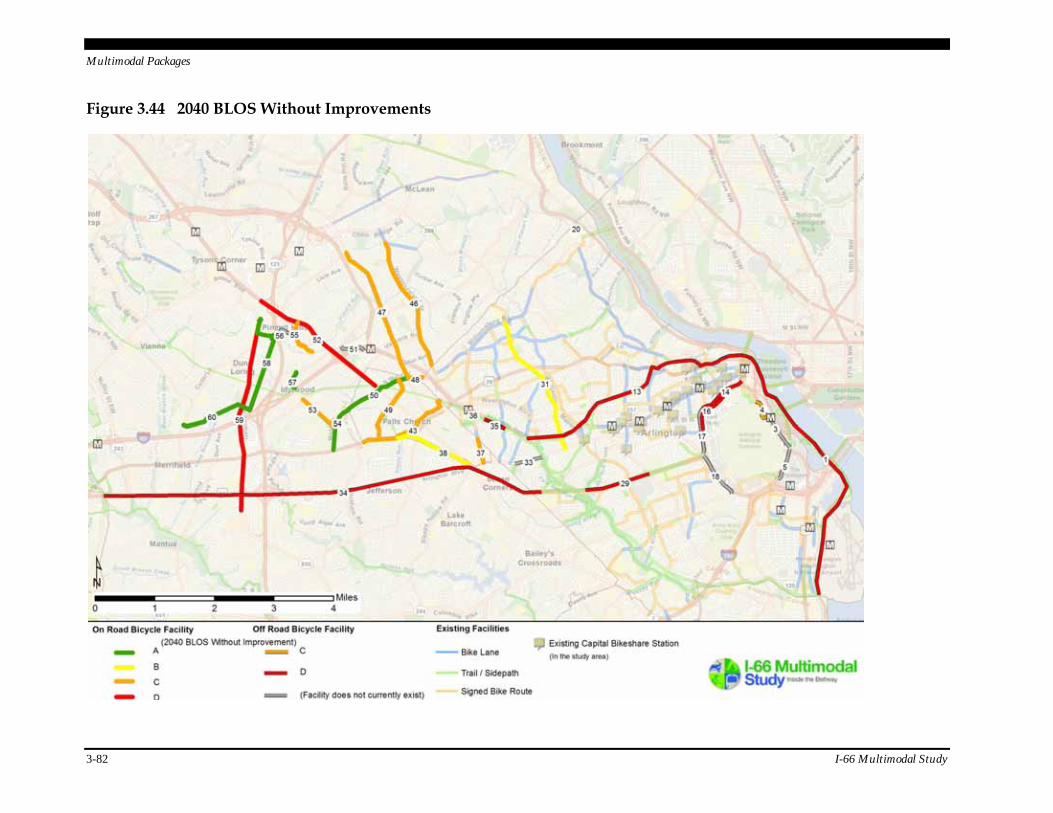
Multimodal Packages
3-82 I-66 Multimodal Study
Figure 3.44 2040 BLOS Without Improvements
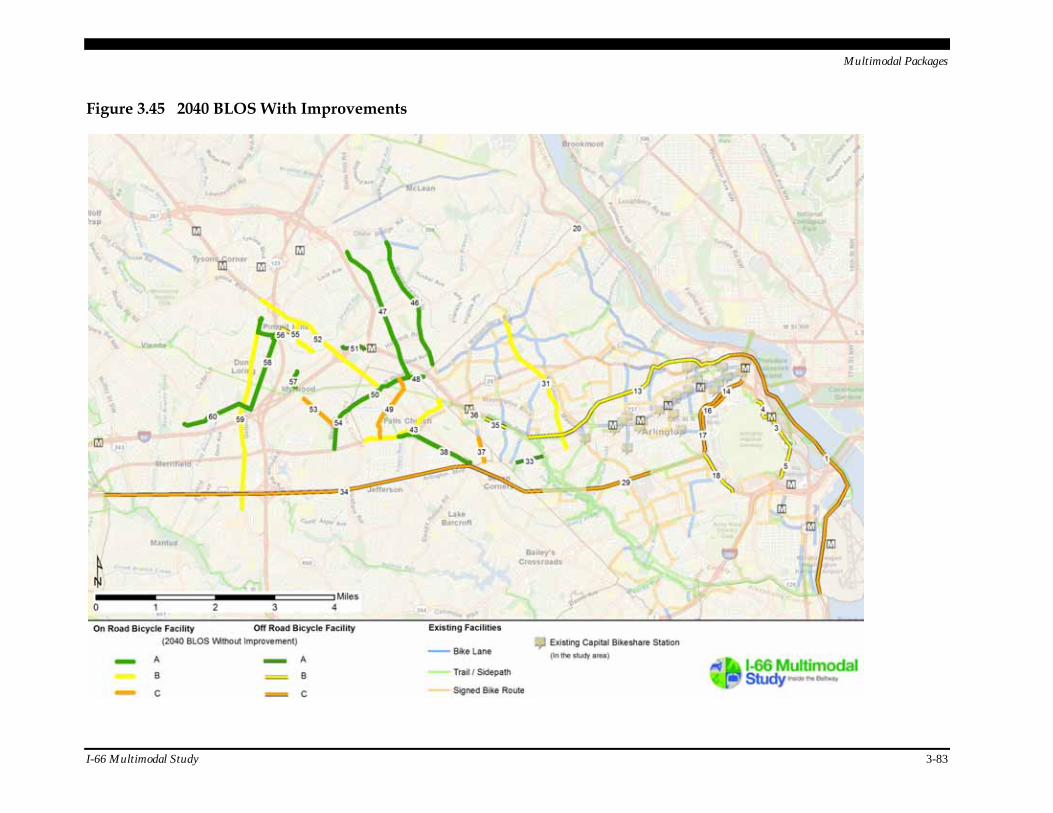
Multimodal Packages
I-66 Multimodal Study 3-83
Figure 3.45 2040 BLOS With Improvements
Multimodal Packages
3-84 I-66 Multimodal Study
Prioritization of Bicycle and Pedestrian System Enhancements
Benefits Calculation
Calculating benefits for bicycle and pedestrian improvements is an emerging art form and there are no readily available methodologies for calculating benefits of certain types of improvements such as signage/wayfinding and bicycle parking. It is recognized that both of these classes of improvements contribute significant value to bicyclists. For example, wayfinding may allow a bicyclist to reach their destination more efficiently by providing accurate direction. It also may reduce exposure to motor vehicles by recommending routes that use lower speed, lower volume roadways and trails. Lastly it may encourage more people to try bicycling as it serves as marketing for this mode. Bicycle parking also provides significant benefits for bicyclists. It provides a secure location to park a bicycle at the end of a ride, reducing the likelihood of bicycle theft. Well designed and located bicycle parking can actually generate increased inter-est in bicycling, resulting in more people taking this mode.
Benefit calculations for bicycle and pedestrian facility improvements were calculated using two different methodologies, based on the type of improvement. Projects are classified as either linear and spot improvements, or bikeshare improvements.
Linear and Spot Improvements
Benefit calculations for linear and spot improvements were based on the methodology described in NCHRP Report 552 “Guidelines for Analysis of Investments in Bicycle Facilities.” The model was originally developed in 2004 dollars and has been updated to 2011 dollars for this study. Generally, benefit calculations in the model are based on the number of likely new bicyclists living within 800, 1,600, and 2,400 meters of a proposed improvement, with the assumption that people living within 800 meters buffer of a new or improved facility would be more likely to ride a bicycle than people living further away.
The benefit analysis for linear improvements represents a compilation of the following four elements:
Mobility Benefit – Quantification of the dollar value a person places on using a certain facility, with the assumption that riders are more likely to use separated facilities (i.e., bicycle path) than a bicycle lane adjacent to on-street parking. It is based on the average amount of additional time a person would be willing to spend commuting on different types of facilities (i.e., people are willing to spend more time on separated facilities).
Health Benefit – Annual per capita health-associated cost savings derived from increased physical activity (assume $128/year for each new cyclist).
Recreation Benefit – Calculates the average annual benefit to new bicyclists who are not commuters ($3,650/year for each new recreational cyclist).
Decreased Auto Use Benefit – Represents an annual decreased auto-use benefit in dollars. Based on per-mile congestion savings ($0.5 per mile) and per-mile pollution ($0.5 per mile) savings. The calculation is based on the induced mode shift caused by the new facility.
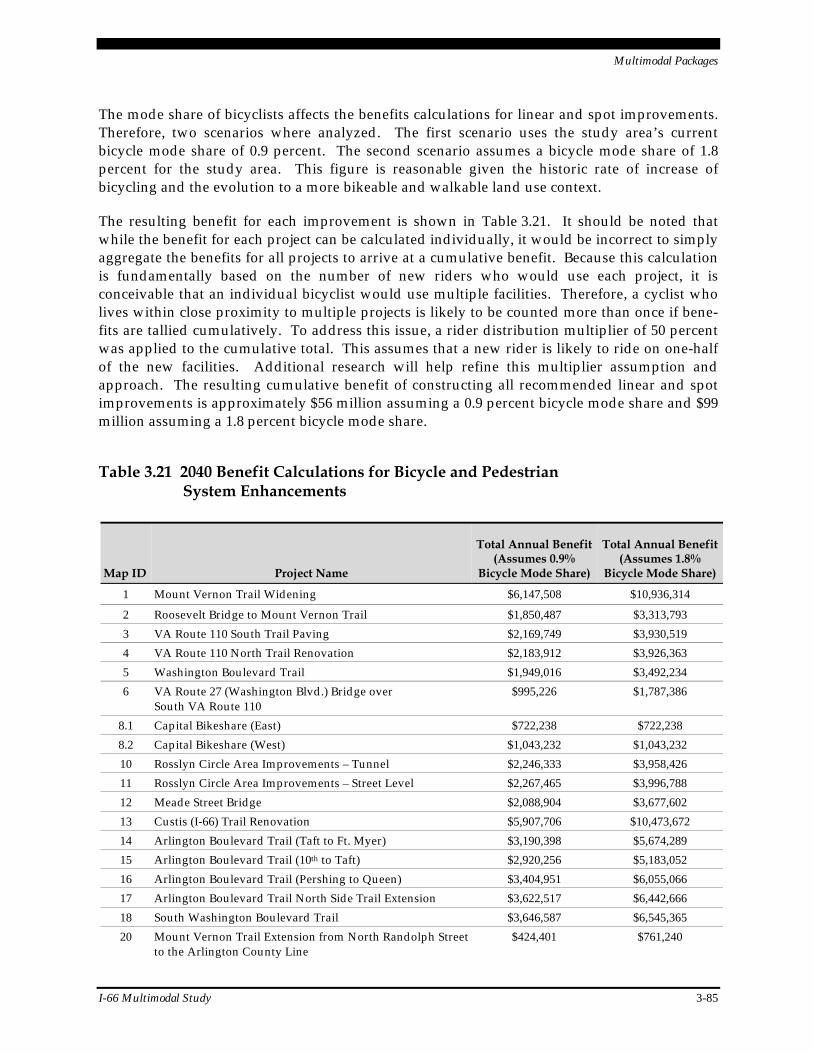
Multimodal Packages
I-66 Multimodal Study 3-85
The mode share of bicyclists affects the benefits calculations for linear and spot improvements. Therefore, two scenarios where analyzed. The first scenario uses the study area’s current bicycle mode share of 0.9 percent. The second scenario assumes a bicycle mode share of 1.8 percent for the study area. This figure is reasonable given the historic rate of increase of bicycling and the evolution to a more bikeable and walkable land use context.
The resulting benefit for each improvement is shown in Table 3.21. It should be noted that while the benefit for each project can be calculated individually, it would be incorrect to simply aggregate the benefits for all projects to arrive at a cumulative benefit. Because this calculation is fundamentally based on the number of new riders who would use each project, it is conceivable that an individual bicyclist would use multiple facilities. Therefore, a cyclist who lives within close proximity to multiple projects is likely to be counted more than once if bene-fits are tallied cumulatively. To address this issue, a rider distribution multiplier of 50 percent was applied to the cumulative total. This assumes that a new rider is likely to ride on one-half of the new facilities. Additional research will help refine this multiplier assumption and approach. The resulting cumulative benefit of constructing all recommended linear and spot improvements is approximately $56 million assuming a 0.9 percent bicycle mode share and $99 million assuming a 1.8 percent bicycle mode share.
Table 3.21 2040 Benefit Calculations for Bicycle and Pedestrian System Enhancements
Map ID Project Name
Total Annual Benefit (Assumes 0.9%
Bicycle Mode Share)
Total Annual Benefit (Assumes 1.8%
Bicycle Mode Share)
1 Mount Vernon Trail Widening $6,147,508 $10,936,314
2 Roosevelt Bridge to Mount Vernon Trail $1,850,487 $3,313,793
3 VA Route 110 South Trail Paving $2,169,749 $3,930,519
4 VA Route 110 North Trail Renovation $2,183,912 $3,926,363
5 Washington Boulevard Trail $1,949,016 $3,492,234
6 VA Route 27 (Washington Blvd.) Bridge over South VA Route 110
$995,226 $1,787,386
8.1 Capital Bikeshare (East) $722,238 $722,238
8.2 Capital Bikeshare (West) $1,043,232 $1,043,232
10 Rosslyn Circle Area Improvements – Tunnel $2,246,333 $3,958,426
11 Rosslyn Circle Area Improvements – Street Level $2,267,465 $3,996,788
12 Meade Street Bridge $2,088,904 $3,677,602
13 Custis (I-66) Trail Renovation $5,907,706 $10,473,672
14 Arlington Boulevard Trail (Taft to Ft. Myer) $3,190,398 $5,674,289
15 Arlington Boulevard Trail (10th to Taft) $2,920,256 $5,183,052
16 Arlington Boulevard Trail (Pershing to Queen) $3,404,951 $6,055,066
17 Arlington Boulevard Trail North Side Trail Extension $3,622,517 $6,442,666
18 South Washington Boulevard Trail $3,646,587 $6,545,365
20 Mount Vernon Trail Extension from North Randolph Street to the Arlington County Line
$424,401 $761,240
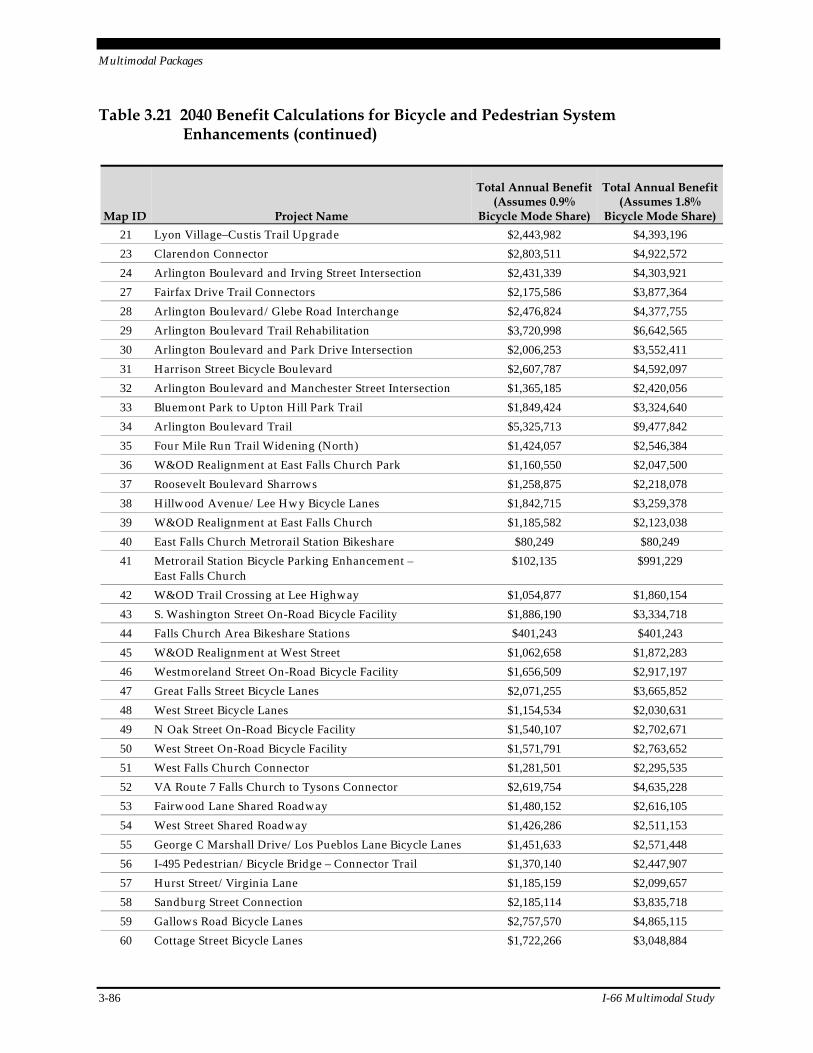
Multimodal Packages
3-86 I-66 Multimodal Study
Table 3.21 2040 Benefit Calculations for Bicycle and Pedestrian System Enhancements (continued)
Map ID Project Name
Total Annual Benefit (Assumes 0.9%
Bicycle Mode Share)
Total Annual Benefit (Assumes 1.8%
Bicycle Mode Share)
21 Lyon Village–Custis Trail Upgrade $2,443,982 $4,393,196
23 Clarendon Connector $2,803,511 $4,922,572
24 Arlington Boulevard and Irving Street Intersection $2,431,339 $4,303,921
27 Fairfax Drive Trail Connectors $2,175,586 $3,877,364
28 Arlington Boulevard/Glebe Road Interchange $2,476,824 $4,377,755
29 Arlington Boulevard Trail Rehabilitation $3,720,998 $6,642,565
30 Arlington Boulevard and Park Drive Intersection $2,006,253 $3,552,411
31 Harrison Street Bicycle Boulevard $2,607,787 $4,592,097
32 Arlington Boulevard and Manchester Street Intersection $1,365,185 $2,420,056
33 Bluemont Park to Upton Hill Park Trail $1,849,424 $3,324,640
34 Arlington Boulevard Trail $5,325,713 $9,477,842
35 Four Mile Run Trail Widening (North) $1,424,057 $2,546,384
36 W&OD Realignment at East Falls Church Park $1,160,550 $2,047,500
37 Roosevelt Boulevard Sharrows $1,258,875 $2,218,078
38 Hillwood Avenue/Lee Hwy Bicycle Lanes $1,842,715 $3,259,378
39 W&OD Realignment at East Falls Church $1,185,582 $2,123,038
40 East Falls Church Metrorail Station Bikeshare $80,249 $80,249
41 Metrorail Station Bicycle Parking Enhancement – East Falls Church
$102,135 $991,229
42 W&OD Trail Crossing at Lee Highway $1,054,877 $1,860,154
43 S. Washington Street On-Road Bicycle Facility $1,886,190 $3,334,718
44 Falls Church Area Bikeshare Stations $401,243 $401,243
45 W&OD Realignment at West Street $1,062,658 $1,872,283
46 Westmoreland Street On-Road Bicycle Facility $1,656,509 $2,917,197
47 Great Falls Street Bicycle Lanes $2,071,255 $3,665,852
48 West Street Bicycle Lanes $1,154,534 $2,030,631
49 N Oak Street On-Road Bicycle Facility $1,540,107 $2,702,671
50 West Street On-Road Bicycle Facility $1,571,791 $2,763,652
51 West Falls Church Connector $1,281,501 $2,295,535
52 VA Route 7 Falls Church to Tysons Connector $2,619,754 $4,635,228
53 Fairwood Lane Shared Roadway $1,480,152 $2,616,105
54 West Street Shared Roadway $1,426,286 $2,511,153
55 George C Marshall Drive/Los Pueblos Lane Bicycle Lanes $1,451,633 $2,571,448
56 I-495 Pedestrian/Bicycle Bridge – Connector Trail $1,370,140 $2,447,907
57 Hurst Street/Virginia Lane $1,185,159 $2,099,657
58 Sandburg Street Connection $2,185,114 $3,835,718
59 Gallows Road Bicycle Lanes $2,757,570 $4,865,115
60 Cottage Street Bicycle Lanes $1,722,266 $3,048,884
Multimodal Packages
I-66 Multimodal Study 3-87
New Bikeshare Stations
The benefit analysis of new bikeshare station relies on a methodology developed by the Metropolitan Washington Council of Governments (MWCOG) for inclusion in a Transportation Investment Generating Economic Recovery (TIGER) Grant application (TIGER II) for new Capital Bikeshare stations. The MWCOG methodology is based on the following assumptions:
Each bicycle will be used six times per day – with increases by five percent a year as system expands (based on systemwide averages);
Each rider will make two trips (one roundtrip); and
Ridership will increase 2.5 percent a year based on expansion.
In applying the MWCOG methodology, benefits for bikeshare usage were calculated based on the following assumptions:
User Cost Savings – Change in per-mile user cost savings based on mode shift. Assumptions include average trip length (Household Travel Survey 2007/2008), vehicle operating costs (fuel costs, maintenance, repair, tire costs, and capital depreciation), average transit fares (average rail versus bus trips, SmarTrip® usage, and fares), average taxi fares; and bicycle fees.
Travel Time Savings – Measures the time savings for bicycle trip shifted from another source. Assumptions include mode shifts, average trip length, average speed by mode, value of time. All assumptions from National Highway Transportation Safety Administration (NHTSA) data
Increased Access – A perceived benefit from trips taken that previously were not possible or worth the time or cost.
Congestion Reduction – Calculated benefit based on VMT reduction caused by increased bikeshare usage and a corresponding congestion reduction value.
Emissions Reduction – Calculated benefit from reductions in VOC’s, Nitrogen Dioxide, and CO2. Data is generated by MWCOG.
Improved Public Health – Calculated benefit from improved public health due to increased exercise caused by bicycling. Assumptions include health care cost increase for people completing 30 minutes of daily exercise versus those that currently do not ($20 per year), the percent of those bicycling or walking who do not meet activity recommendations (con-servatively assumed to be 20 percent), and the average extra exercise time needed to meet the requirement (15 minutes).
Accident Reduction – Benefit calculation assuming that with VMT reduction, the risk of exposure decreases. Data is sourced from NHTSA.
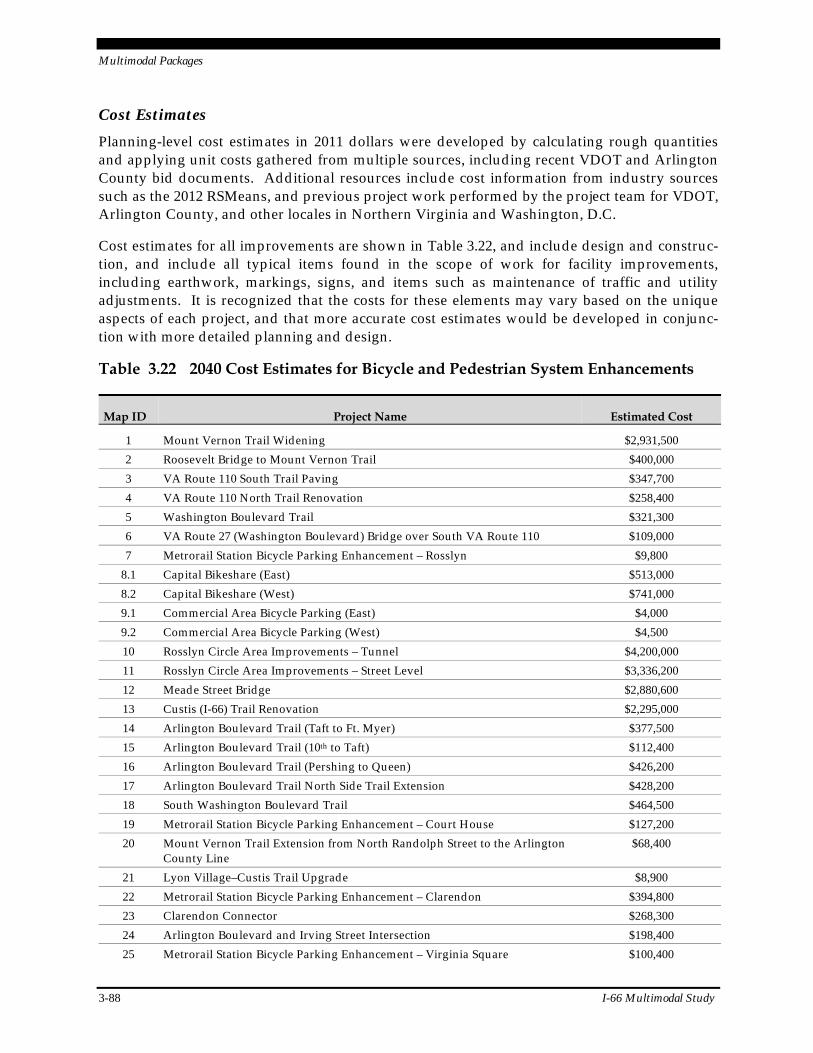
Multimodal Packages
3-88 I-66 Multimodal Study
Cost Estimates
Planning-level cost estimates in 2011 dollars were developed by calculating rough quantities and applying unit costs gathered from multiple sources, including recent VDOT and Arlington County bid documents. Additional resources include cost information from industry sources such as the 2012 RSMeans, and previous project work performed by the project team for VDOT, Arlington County, and other locales in Northern Virginia and Washington, D.C.
Cost estimates for all improvements are shown in Table 3.22, and include design and construc-tion, and include all typical items found in the scope of work for facility improvements, including earthwork, markings, signs, and items such as maintenance of traffic and utility adjustments. It is recognized that the costs for these elements may vary based on the unique aspects of each project, and that more accurate cost estimates would be developed in conjunc-tion with more detailed planning and design.
Table 3.22 2040 Cost Estimates for Bicycle and Pedestrian System Enhancements
Map ID Project Name Estimated Cost
1 Mount Vernon Trail Widening $2,931,500
2 Roosevelt Bridge to Mount Vernon Trail $400,000
3 VA Route 110 South Trail Paving $347,700
4 VA Route 110 North Trail Renovation $258,400
5 Washington Boulevard Trail $321,300
6 VA Route 27 (Washington Boulevard) Bridge over South VA Route 110 $109,000
7 Metrorail Station Bicycle Parking Enhancement – Rosslyn $9,800
8.1 Capital Bikeshare (East) $513,000
8.2 Capital Bikeshare (West) $741,000
9.1 Commercial Area Bicycle Parking (East) $4,000
9.2 Commercial Area Bicycle Parking (West) $4,500
10 Rosslyn Circle Area Improvements – Tunnel $4,200,000
11 Rosslyn Circle Area Improvements – Street Level $3,336,200
12 Meade Street Bridge $2,880,600
13 Custis (I-66) Trail Renovation $2,295,000
14 Arlington Boulevard Trail (Taft to Ft. Myer) $377,500
15 Arlington Boulevard Trail (10th to Taft) $112,400
16 Arlington Boulevard Trail (Pershing to Queen) $426,200
17 Arlington Boulevard Trail North Side Trail Extension $428,200
18 South Washington Boulevard Trail $464,500
19 Metrorail Station Bicycle Parking Enhancement – Court House $127,200
20 Mount Vernon Trail Extension from North Randolph Street to the Arlington County Line
$68,400
21 Lyon Village–Custis Trail Upgrade $8,900
22 Metrorail Station Bicycle Parking Enhancement – Clarendon $394,800
23 Clarendon Connector $268,300
24 Arlington Boulevard and Irving Street Intersection $198,400
25 Metrorail Station Bicycle Parking Enhancement – Virginia Square $100,400
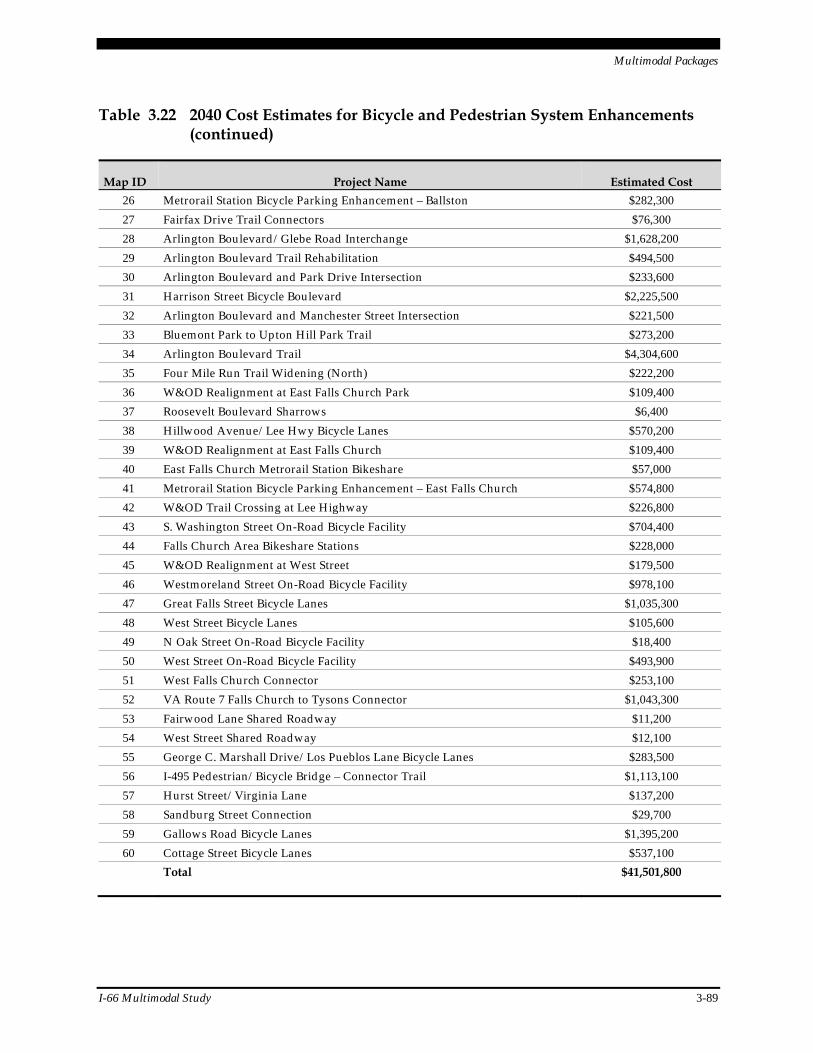
Multimodal Packages
I-66 Multimodal Study 3-89
Table 3.22 2040 Cost Estimates for Bicycle and Pedestrian System Enhancements (continued)
Map ID Project Name Estimated Cost
26 Metrorail Station Bicycle Parking Enhancement – Ballston $282,300
27 Fairfax Drive Trail Connectors $76,300
28 Arlington Boulevard/Glebe Road Interchange $1,628,200
29 Arlington Boulevard Trail Rehabilitation $494,500
30 Arlington Boulevard and Park Drive Intersection $233,600
31 Harrison Street Bicycle Boulevard $2,225,500
32 Arlington Boulevard and Manchester Street Intersection $221,500
33 Bluemont Park to Upton Hill Park Trail $273,200
34 Arlington Boulevard Trail $4,304,600
35 Four Mile Run Trail Widening (North) $222,200
36 W&OD Realignment at East Falls Church Park $109,400
37 Roosevelt Boulevard Sharrows $6,400
38 Hillwood Avenue/Lee Hwy Bicycle Lanes $570,200
39 W&OD Realignment at East Falls Church $109,400
40 East Falls Church Metrorail Station Bikeshare $57,000
41 Metrorail Station Bicycle Parking Enhancement – East Falls Church $574,800
42 W&OD Trail Crossing at Lee Highway $226,800
43 S. Washington Street On-Road Bicycle Facility $704,400
44 Falls Church Area Bikeshare Stations $228,000
45 W&OD Realignment at West Street $179,500
46 Westmoreland Street On-Road Bicycle Facility $978,100
47 Great Falls Street Bicycle Lanes $1,035,300
48 West Street Bicycle Lanes $105,600
49 N Oak Street On-Road Bicycle Facility $18,400
50 West Street On-Road Bicycle Facility $493,900
51 West Falls Church Connector $253,100
52 VA Route 7 Falls Church to Tysons Connector $1,043,300
53 Fairwood Lane Shared Roadway $11,200
54 West Street Shared Roadway $12,100
55 George C. Marshall Drive/Los Pueblos Lane Bicycle Lanes $283,500
56 I-495 Pedestrian/Bicycle Bridge – Connector Trail $1,113,100
57 Hurst Street/Virginia Lane $137,200
58 Sandburg Street Connection $29,700
59 Gallows Road Bicycle Lanes $1,395,200
60 Cottage Street Bicycle Lanes $537,100
Total $41,501,800
Multimodal Packages
3-90 I-66 Multimodal Study
Project lengths for linear improvements (e.g., pathways, bicycle lanes) were determined from GIS line work developed for this study. Costs for spot improvements, such as intersection improvements were calculated per individual location using aerial photographs to determine roadway widths. Intersection calculations assumed one curb extension, four lines of striping, three pavement marking symbols, one high visibility crosswalk, two signs, and two curb ramps for each approach. Costs assume that facility projects will be implemented by contractors through a bidding process; however, they may vary if projects are done in-house by VDOT. Actual implementation will likely be more costly if bicycle or pedestrian improvements are done as many small projects as compared to a smaller number of large projects.
All construction projects include a contingency, estimated at 25 percent of the construction cost. All construction projects include contingencies for maintenance of traffic, mobilization, and utility and drainage impacts; estimated at 5 to 10 percent of the construction cost. All construc-tion projects include a design contingency, estimated at 20 percent of the total construction cost. All construction projects include a right-of-way acquisition contingency, estimated at 10 per-cent of the total construction cost.
Bikeshare station cost estimates assume new 10-slot docks and nine new bikeshare bicycles per station and all supporting technology requirements (e.g., power, communications). Bicycle parking enhancements at Metrorail stations assumes parking equipment, concrete pads, shel-ters and covers, security features, and landscaping. Bicycle parking in other locations assumes bolted or skid mounted U-racks with capacity for six bikes.
Prioritization Criteria
Working with the project team, bicycle and pedestrian system enhancements were prioritized based on readily available criteria that relate to the potential to benefit existing and potential users of the on- and off-road bicycle and pedestrian system. In addition, other criteria related to the likelihood of implementation in the near or long term also were included. Following are descriptions of each criteria, with the associated score in Table 3.23.
Project Timeframe – Represents the project team’s professional judgment on the likely timing of the project. Projects that are anticipated to be completed in the more quickly receive more points, and projects anticipated to take longer to complete score fewer points.
Project Feasibility – Represents the project team’s professional assessment of the feasibility or ease of implementation of a project. Factors include project difficulty or technical complexity, jurisdictional issues, and right-of-way considerations. Projects that are easier to implement receive more points, projects that are more difficult receive fewer points.
Household Density – Measure of the household density (units per square mile) within 3 miles of a project was based on 2010 U.S. Census data. The household density within 3 miles of all projects are calculated and then classified into three quartiles using GIS analysis tools. Projects with higher densities in the surrounding areas receive higher scores as they are likely to benefit more people.
Employment Density – Measure of the employment density (jobs per square mile) within 3 miles of a project was based on 2010 U.S. Census data. The employment density within 3 miles
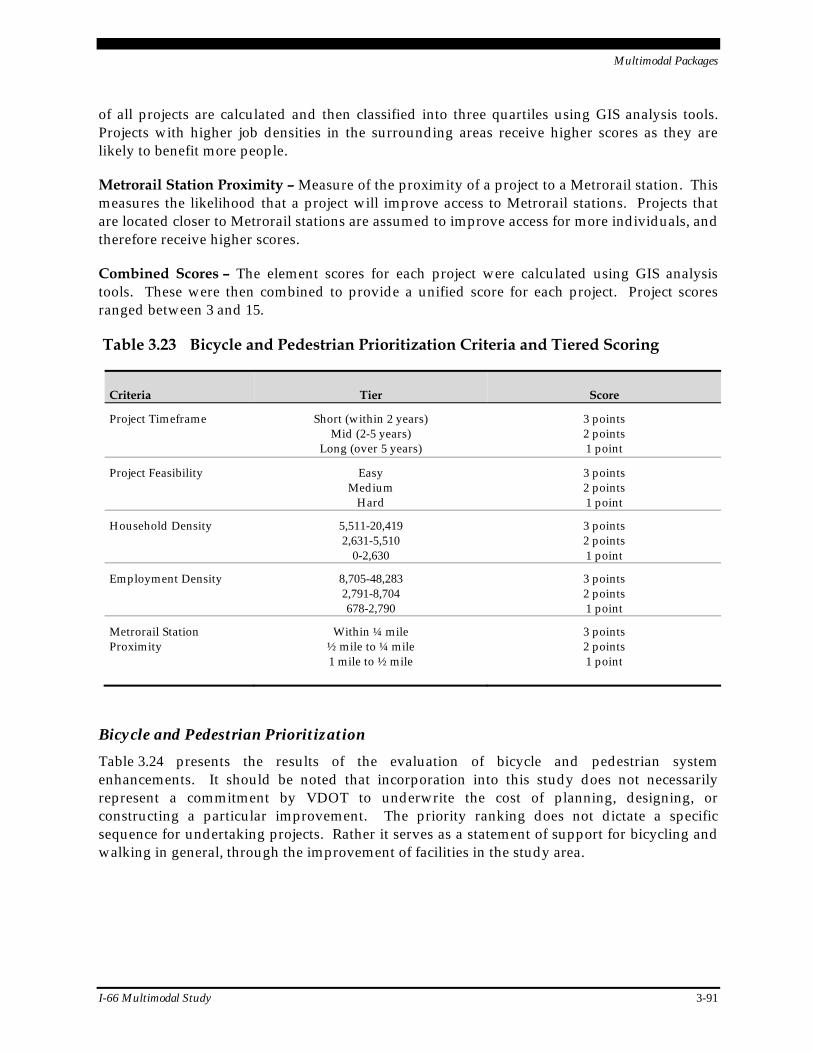
Multimodal Packages
I-66 Multimodal Study 3-91
of all projects are calculated and then classified into three quartiles using GIS analysis tools. Projects with higher job densities in the surrounding areas receive higher scores as they are likely to benefit more people.
Metrorail Station Proximity – Measure of the proximity of a project to a Metrorail station. This measures the likelihood that a project will improve access to Metrorail stations. Projects that are located closer to Metrorail stations are assumed to improve access for more individuals, and therefore receive higher scores.
Combined Scores – The element scores for each project were calculated using GIS analysis tools. These were then combined to provide a unified score for each project. Project scores ranged between 3 and 15.
Table 3.23 Bicycle and Pedestrian Prioritization Criteria and Tiered Scoring
Criteria Tier Score
Project Timeframe
Short (within 2 years) Mid (2-5 years)
Long (over 5 years)
3 points 2 points 1 point
Project Feasibility Easy Medium
Hard
3 points 2 points 1 point
Household Density 5,511-20,419 2,631-5,510
0-2,630
3 points 2 points 1 point
Employment Density 8,705-48,283 2,791-8,704 678-2,790
3 points 2 points 1 point
Metrorail Station Proximity
Within ¼ mile ½ mile to ¼ mile 1 mile to ½ mile
3 points 2 points 1 point
Bicycle and Pedestrian Prioritization
Table 3.24 presents the results of the evaluation of bicycle and pedestrian system enhancements. It should be noted that incorporation into this study does not necessarily represent a commitment by VDOT to underwrite the cost of planning, designing, or constructing a particular improvement. The priority ranking does not dictate a specific sequence for undertaking projects. Rather it serves as a statement of support for bicycling and walking in general, through the improvement of facilities in the study area.
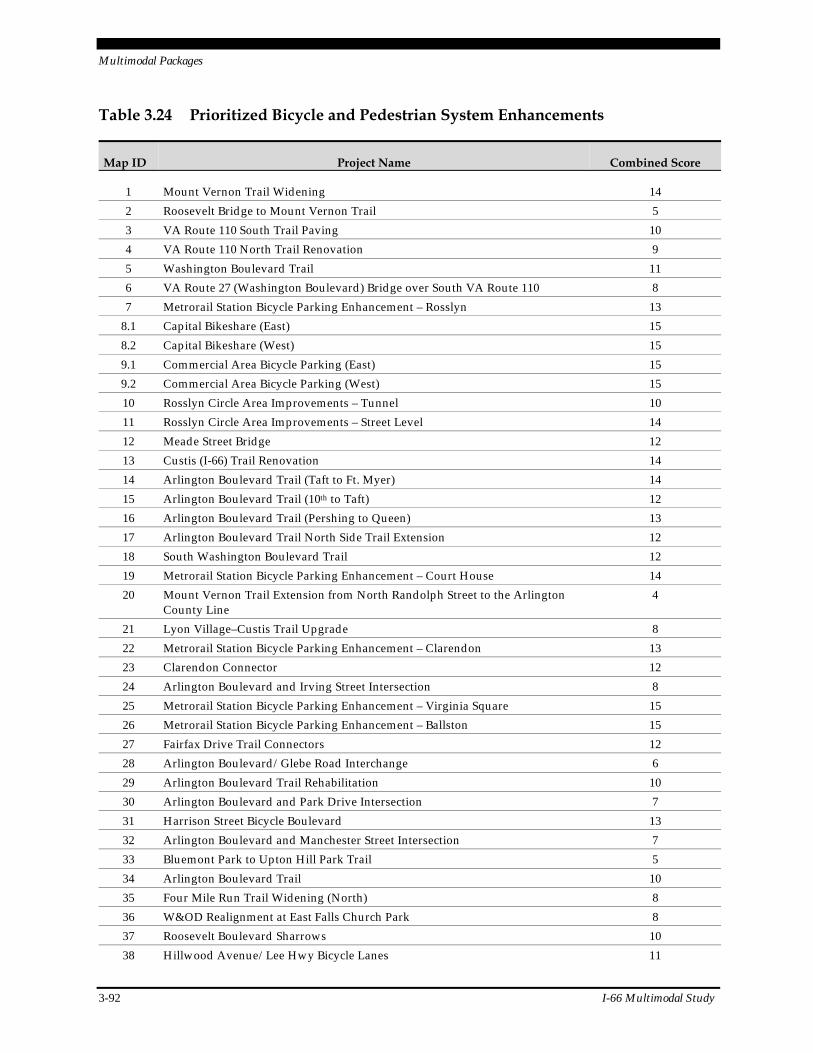
Multimodal Packages
3-92 I-66 Multimodal Study
Table 3.24 Prioritized Bicycle and Pedestrian System Enhancements
Map ID Project Name Combined Score
1 Mount Vernon Trail Widening 14
2 Roosevelt Bridge to Mount Vernon Trail 5
3 VA Route 110 South Trail Paving 10
4 VA Route 110 North Trail Renovation 9
5 Washington Boulevard Trail 11
6 VA Route 27 (Washington Boulevard) Bridge over South VA Route 110 8
7 Metrorail Station Bicycle Parking Enhancement – Rosslyn 13
8.1 Capital Bikeshare (East) 15
8.2 Capital Bikeshare (West) 15
9.1 Commercial Area Bicycle Parking (East) 15
9.2 Commercial Area Bicycle Parking (West) 15
10 Rosslyn Circle Area Improvements – Tunnel 10
11 Rosslyn Circle Area Improvements – Street Level 14
12 Meade Street Bridge 12
13 Custis (I-66) Trail Renovation 14
14 Arlington Boulevard Trail (Taft to Ft. Myer) 14
15 Arlington Boulevard Trail (10th to Taft) 12
16 Arlington Boulevard Trail (Pershing to Queen) 13
17 Arlington Boulevard Trail North Side Trail Extension 12
18 South Washington Boulevard Trail 12
19 Metrorail Station Bicycle Parking Enhancement – Court House 14
20 Mount Vernon Trail Extension from North Randolph Street to the Arlington County Line
4
21 Lyon Village–Custis Trail Upgrade 8
22 Metrorail Station Bicycle Parking Enhancement – Clarendon 13
23 Clarendon Connector 12
24 Arlington Boulevard and Irving Street Intersection 8
25 Metrorail Station Bicycle Parking Enhancement – Virginia Square 15
26 Metrorail Station Bicycle Parking Enhancement – Ballston 15
27 Fairfax Drive Trail Connectors 12
28 Arlington Boulevard/Glebe Road Interchange 6
29 Arlington Boulevard Trail Rehabilitation 10
30 Arlington Boulevard and Park Drive Intersection 7
31 Harrison Street Bicycle Boulevard 13
32 Arlington Boulevard and Manchester Street Intersection 7
33 Bluemont Park to Upton Hill Park Trail 5
34 Arlington Boulevard Trail 10
35 Four Mile Run Trail Widening (North) 8
36 W&OD Realignment at East Falls Church Park 8
37 Roosevelt Boulevard Sharrows 10
38 Hillwood Avenue/Lee Hwy Bicycle Lanes 11
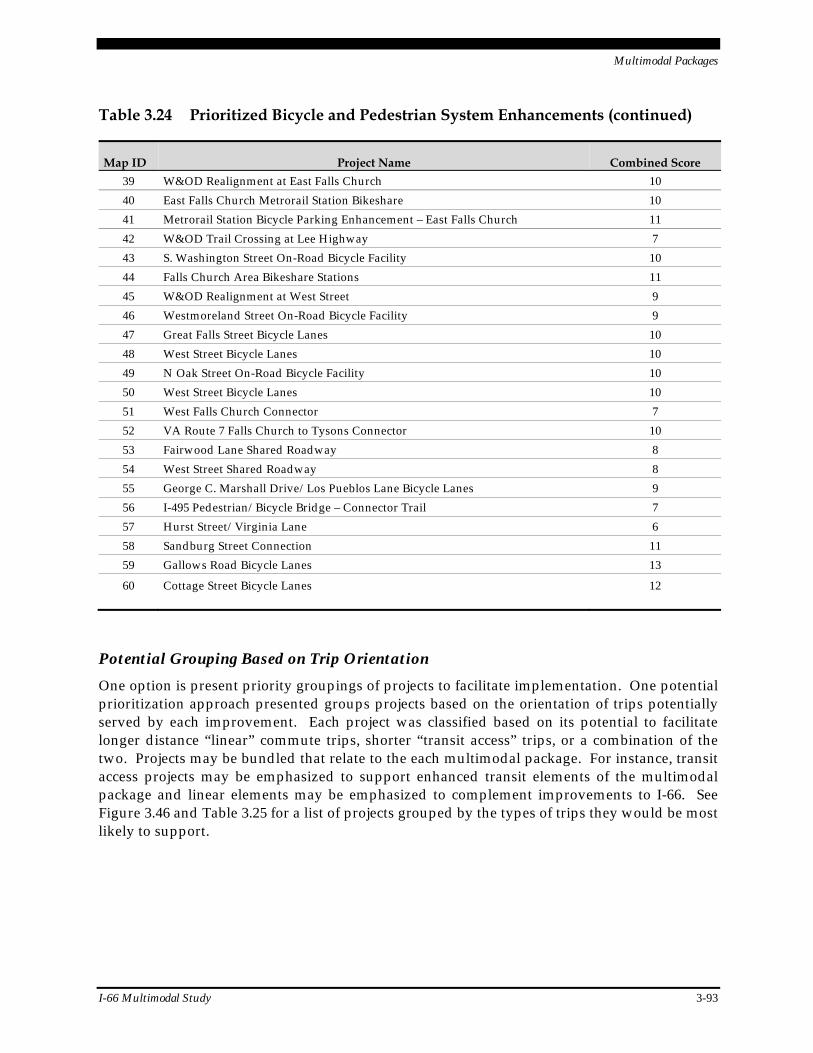
Multimodal Packages
I-66 Multimodal Study 3-93
Table 3.24 Prioritized Bicycle and Pedestrian System Enhancements (continued)
Map ID Project Name Combined Score
39 W&OD Realignment at East Falls Church 10
40 East Falls Church Metrorail Station Bikeshare 10
41 Metrorail Station Bicycle Parking Enhancement – East Falls Church 11
42 W&OD Trail Crossing at Lee Highway 7
43 S. Washington Street On-Road Bicycle Facility 10
44 Falls Church Area Bikeshare Stations 11
45 W&OD Realignment at West Street 9
46 Westmoreland Street On-Road Bicycle Facility 9
47 Great Falls Street Bicycle Lanes 10
48 West Street Bicycle Lanes 10
49 N Oak Street On-Road Bicycle Facility 10
50 West Street Bicycle Lanes 10
51 West Falls Church Connector 7
52 VA Route 7 Falls Church to Tysons Connector 10
53 Fairwood Lane Shared Roadway 8
54 West Street Shared Roadway 8
55 George C. Marshall Drive/Los Pueblos Lane Bicycle Lanes 9
56 I-495 Pedestrian/Bicycle Bridge – Connector Trail 7
57 Hurst Street/Virginia Lane 6
58 Sandburg Street Connection 11
59 Gallows Road Bicycle Lanes 13
60 Cottage Street Bicycle Lanes 12
Potential Grouping Based on Trip Orientation
One option is present priority groupings of projects to facilitate implementation. One potential prioritization approach presented groups projects based on the orientation of trips potentially served by each improvement. Each project was classified based on its potential to facilitate longer distance “linear” commute trips, shorter “transit access” trips, or a combination of the two. Projects may be bundled that relate to the each multimodal package. For instance, transit access projects may be emphasized to support enhanced transit elements of the multimodal package and linear elements may be emphasized to complement improvements to I-66. See Figure 3.46 and Table 3.25 for a list of projects grouped by the types of trips they would be most likely to support.
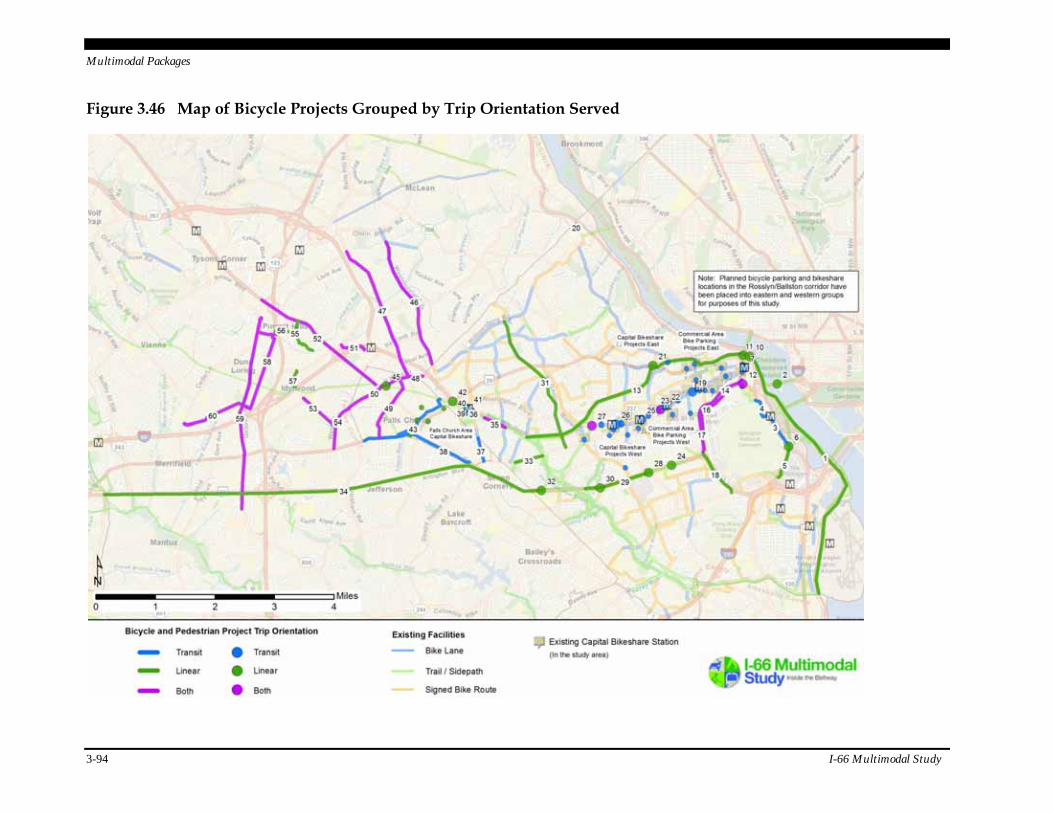
Multimodal Packages
3-94 I-66 Multimodal Study
Figure 3.46 Map of Bicycle Projects Grouped by Trip Orientation Served
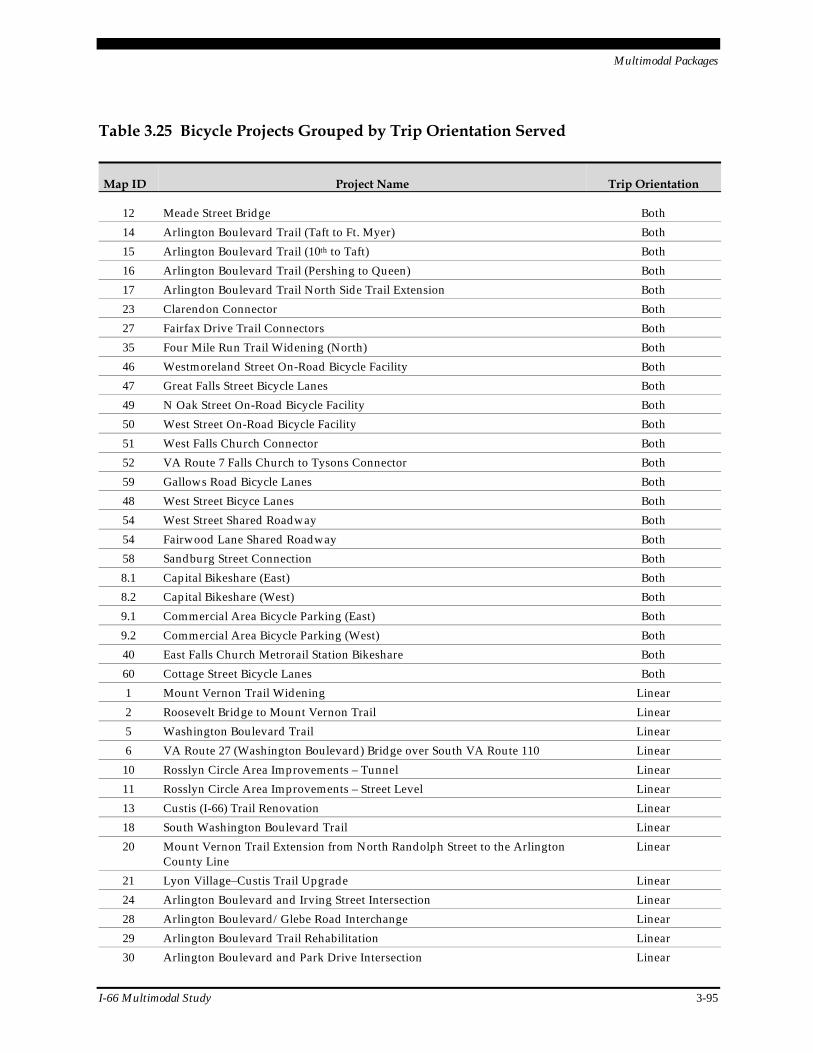
Multimodal Packages
I-66 Multimodal Study 3-95
Table 3.25 Bicycle Projects Grouped by Trip Orientation Served
Map ID Project Name Trip Orientation
12 Meade Street Bridge Both
14 Arlington Boulevard Trail (Taft to Ft. Myer) Both
15 Arlington Boulevard Trail (10th to Taft) Both
16 Arlington Boulevard Trail (Pershing to Queen) Both
17 Arlington Boulevard Trail North Side Trail Extension Both
23 Clarendon Connector Both
27 Fairfax Drive Trail Connectors Both
35 Four Mile Run Trail Widening (North) Both
46 Westmoreland Street On-Road Bicycle Facility Both
47 Great Falls Street Bicycle Lanes Both
49 N Oak Street On-Road Bicycle Facility Both
50 West Street On-Road Bicycle Facility Both
51 West Falls Church Connector Both
52 VA Route 7 Falls Church to Tysons Connector Both
59 Gallows Road Bicycle Lanes Both
48 West Street Bicyce Lanes Both
54 West Street Shared Roadway Both
54 Fairwood Lane Shared Roadway Both
58 Sandburg Street Connection Both
8.1 Capital Bikeshare (East) Both
8.2 Capital Bikeshare (West) Both
9.1 Commercial Area Bicycle Parking (East) Both
9.2 Commercial Area Bicycle Parking (West) Both
40 East Falls Church Metrorail Station Bikeshare Both
60 Cottage Street Bicycle Lanes Both
1 Mount Vernon Trail Widening Linear
2 Roosevelt Bridge to Mount Vernon Trail Linear
5 Washington Boulevard Trail Linear
6 VA Route 27 (Washington Boulevard) Bridge over South VA Route 110 Linear
10 Rosslyn Circle Area Improvements – Tunnel Linear
11 Rosslyn Circle Area Improvements – Street Level Linear
13 Custis (I-66) Trail Renovation Linear
18 South Washington Boulevard Trail Linear
20 Mount Vernon Trail Extension from North Randolph Street to the Arlington County Line
Linear
21 Lyon Village–Custis Trail Upgrade Linear
24 Arlington Boulevard and Irving Street Intersection Linear
28 Arlington Boulevard/Glebe Road Interchange Linear
29 Arlington Boulevard Trail Rehabilitation Linear
30 Arlington Boulevard and Park Drive Intersection Linear
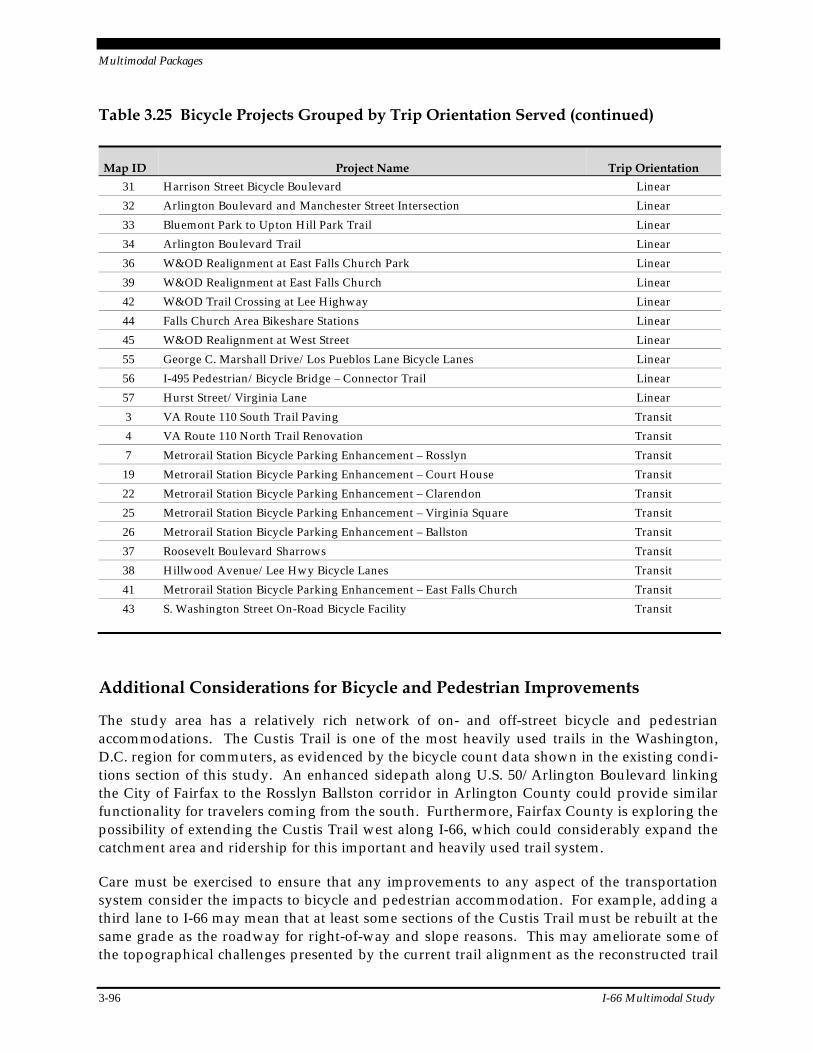
Multimodal Packages
3-96 I-66 Multimodal Study
Table 3.25 Bicycle Projects Grouped by Trip Orientation Served (continued)
Map ID Project Name Trip Orientation
31 Harrison Street Bicycle Boulevard Linear
32 Arlington Boulevard and Manchester Street Intersection Linear
33 Bluemont Park to Upton Hill Park Trail Linear
34 Arlington Boulevard Trail Linear
36 W&OD Realignment at East Falls Church Park Linear
39 W&OD Realignment at East Falls Church Linear
42 W&OD Trail Crossing at Lee Highway Linear
44 Falls Church Area Bikeshare Stations Linear
45 W&OD Realignment at West Street Linear
55 George C. Marshall Drive/Los Pueblos Lane Bicycle Lanes Linear
56 I-495 Pedestrian/Bicycle Bridge – Connector Trail Linear
57 Hurst Street/Virginia Lane Linear
3 VA Route 110 South Trail Paving Transit
4 VA Route 110 North Trail Renovation Transit
7 Metrorail Station Bicycle Parking Enhancement – Rosslyn Transit
19 Metrorail Station Bicycle Parking Enhancement – Court House Transit
22 Metrorail Station Bicycle Parking Enhancement – Clarendon Transit
25 Metrorail Station Bicycle Parking Enhancement – Virginia Square Transit
26 Metrorail Station Bicycle Parking Enhancement – Ballston Transit
37 Roosevelt Boulevard Sharrows Transit
38 Hillwood Avenue/Lee Hwy Bicycle Lanes Transit
41 Metrorail Station Bicycle Parking Enhancement – East Falls Church Transit
43 S. Washington Street On-Road Bicycle Facility Transit
Additional Considerations for Bicycle and Pedestrian Improvements
The study area has a relatively rich network of on- and off-street bicycle and pedestrian accommodations. The Custis Trail is one of the most heavily used trails in the Washington, D.C. region for commuters, as evidenced by the bicycle count data shown in the existing condi-tions section of this study. An enhanced sidepath along U.S. 50/Arlington Boulevard linking the City of Fairfax to the Rosslyn Ballston corridor in Arlington County could provide similar functionality for travelers coming from the south. Furthermore, Fairfax County is exploring the possibility of extending the Custis Trail west along I-66, which could considerably expand the catchment area and ridership for this important and heavily used trail system.
Care must be exercised to ensure that any improvements to any aspect of the transportation system consider the impacts to bicycle and pedestrian accommodation. For example, adding a third lane to I-66 may mean that at least some sections of the Custis Trail must be rebuilt at the same grade as the roadway for right-of-way and slope reasons. This may ameliorate some of the topographical challenges presented by the current trail alignment as the reconstructed trail
Multimodal Packages
I-66 Multimodal Study 3-97
would follow a relatively flat course. However, the extensive connectivity to existing neigh-borhoods may be compromised due to significant changes in elevation between the trail which would be in a trench with the highway and neighborhoods which are much higher. Maintaining the same level of connectivity may require relatively costly vertical structures, either ramps or helixes to reach from the trail bed to the neighborhood access points. On the other hand, incorporating bicycle and pedestrian improvements into larger transportation projects can be a successful strategy for accelerating implementation and enhancing the multi-modal transportation network.
3.11 Multimodal Packages Summary Findings
The following table, Table 3.26, summarizes the main measures of effectiveness used to com-pare across packages. These measures are for the study area and systemwide, and highlight the differences in performance for each package compared to the CLRP+ Baseline.
In addition to the measures of effectiveness included in Table 3.26, an initial assessment of cost/benefit was completed for the packages. The cost/benefit assessment process outlined in the Interim Report was followed, and did not provide useful information to help discern the relative impacts of the individual multimodal packages. It is important to note that the key inputs into the cost/benefit assessment were the same as those used to evaluate the multimodal packages including VMT, congested VMT, travel time, and overall package costs.
Social Equity
Social equity analysis was not performed as part of the I-66 Multimodal Study, in part because of its long range planning horizon and the subregional focus. As proposed improvements move closer towards implementation, a need to evaluate equity across its various dimensions will grow in importance. Numerous impacts may need to be considered as well as the different ways available to categorize people for analysis and to measure impacts.

Multimodal Packages
3-98 I-66 Multimodal Study
Table 3.26 Measures of Effectiveness Summary
Measures of Effectiveness 2007 CLRP + 1. I-66 HOT/HOV/
Bus Lanes
2. Support of Widen I-66 HOT/HOV/
Bus Lanes 3. Support of Added
HOV/Bus Lane to I-66 4. Support of
Enhanced Bus Service
Study Area VMT
a.m. (Total) 558,700 554,400 616,100 655,000 554,600 551,800
Uncongested 152,758 27.3% 135,458 24.4% 129,570 21.0% 135,467 20.7% 145,904 26.3% 134,871 24.4%
Near Capacity 303,671 54.4% 261,922 47.2% 321,586 52.2% 367,319 56.1% 254,505 45.9% 262,874 47.6%
Over Capacity 102,223 18.3% 157,002 28.3% 164,952 26.8% 152,240 23.2% 154,148 27.8% 154,070 27.9%
p.m. (Total) 872,100 814,000 918,600 974,400 824,400 810,300
Uncongested 169,463 19.4% 154,406 19.0% 134,562 14.6% 150,111 15.4% 181,880 22.1% 159,895 19.7%
Near Capacity 517,964 59.4% 430,138 52.8% 551,849 60.1% 655,257 67.2% 400,533 48.6% 425,524 52.5%
Over Capacity 184,681 21.2% 229,448 28.2% 232,224 25.3% 169,046 17.3% 241,938 29.3% 224,895 27.8%
Study Area Daily PMT
Rail 611,197 1,224,263 1,203,556 1,211,702 1,206,669 1,197,098
Freeway 2,063,637 2,131,288 2,173,307 2,433,363 2,347,677 2,139,304
Arterial 2,207,762 2,496,436 2,515,614 2,474,431 2,497,405 2,517,891
Total 4,882,596 5,851,987 5,892,477 6,119,496 6,051,751 5,854,293 Mode Share
All Trip Productions
SOV 45.5% 40.5% 40.3% 40.3% 40.0% 39.9%
HOV 2 22.8% 22.4% 22.2% 22.2% 22.2% 22.2%
HOV 3+ 17.6% 20.1% 19.9% 19.9% 19.7% 19.8%
Transit 14.1% 17.0% 17.6% 17.6% 18.1% 18.0%
All Trip Attractions
SOV 45.9% 38.4% 38.9% 39.0% 38.0% 38.0%
HOV 2 21.9% 20.0% 19.9% 19.9% 19.7% 19.7%
HOV 3+ 17.6% 22.5% 21.6% 21.6% 22.2% 22.2%
Transit 14.6% 19.2% 19.6% 19.5% 20.1% 20.1%
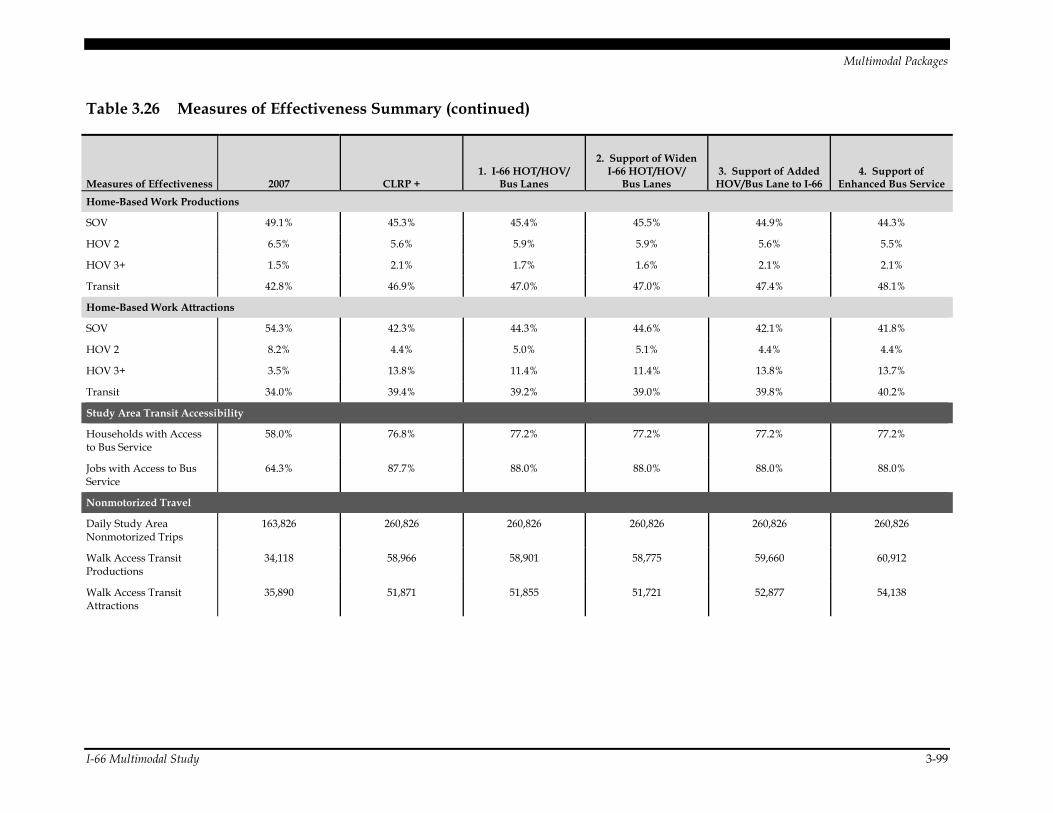
Multimodal Packages
I-66 Multimodal Study 3-99
Table 3.26 Measures of Effectiveness Summary (continued)
Measures of Effectiveness 2007 CLRP + 1. I-66 HOT/HOV/
Bus Lanes
2. Support of Widen I-66 HOT/HOV/
Bus Lanes 3. Support of Added
HOV/Bus Lane to I-66 4. Support of
Enhanced Bus Service
Home-Based Work Productions
SOV 49.1% 45.3% 45.4% 45.5% 44.9% 44.3%
HOV 2 6.5% 5.6% 5.9% 5.9% 5.6% 5.5%
HOV 3+ 1.5% 2.1% 1.7% 1.6% 2.1% 2.1%
Transit 42.8% 46.9% 47.0% 47.0% 47.4% 48.1%
Home-Based Work Attractions
SOV 54.3% 42.3% 44.3% 44.6% 42.1% 41.8%
HOV 2 8.2% 4.4% 5.0% 5.1% 4.4% 4.4%
HOV 3+ 3.5% 13.8% 11.4% 11.4% 13.8% 13.7%
Transit 34.0% 39.4% 39.2% 39.0% 39.8% 40.2%
Study Area Transit Accessibility
Households with Access to Bus Service
58.0% 76.8% 77.2% 77.2% 77.2% 77.2%
Jobs with Access to Bus Service
64.3% 87.7% 88.0% 88.0% 88.0% 88.0%
Nonmotorized Travel
Daily Study Area Nonmotorized Trips
163,826 260,826 260,826 260,826 260,826 260,826
Walk Access Transit Productions
34,118 58,966 58,901 58,775 59,660 60,912
Walk Access Transit Attractions
35,890 51,871 51,855 51,721 52,877 54,138
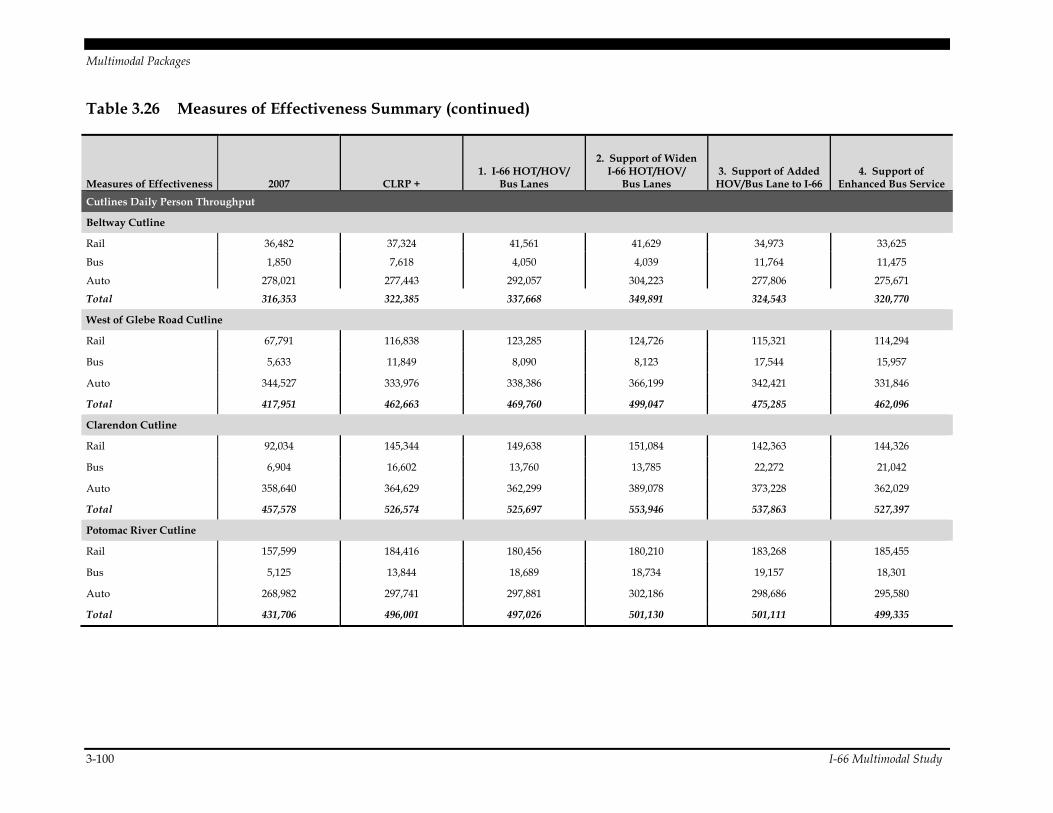
Multimodal Packages
3-100 I-66 Multimodal Study
Table 3.26 Measures of Effectiveness Summary (continued)
Measures of Effectiveness 2007 CLRP + 1. I-66 HOT/HOV/
Bus Lanes
2. Support of Widen I-66 HOT/HOV/
Bus Lanes 3. Support of Added
HOV/Bus Lane to I-66 4. Support of
Enhanced Bus Service
Cutlines Daily Person Throughput
Beltway Cutline
Rail 36,482 37,324 41,561 41,629 34,973 33,625
Bus 1,850 7,618 4,050 4,039 11,764 11,475
Auto 278,021 277,443 292,057 304,223 277,806 275,671
Total 316,353 322,385 337,668 349,891 324,543 320,770
West of Glebe Road Cutline
Rail 67,791 116,838 123,285 124,726 115,321 114,294
Bus 5,633 11,849 8,090 8,123 17,544 15,957
Auto 344,527 333,976 338,386 366,199 342,421 331,846
Total 417,951 462,663 469,760 499,047 475,285 462,096
Clarendon Cutline
Rail 92,034 145,344 149,638 151,084 142,363 144,326
Bus 6,904 16,602 13,760 13,785 22,272 21,042
Auto 358,640 364,629 362,299 389,078 373,228 362,029
Total 457,578 526,574 525,697 553,946 537,863 527,397
Potomac River Cutline
Rail 157,599 184,416 180,456 180,210 183,268 185,455
Bus 5,125 13,844 18,689 18,734 19,157 18,301
Auto 268,982 297,741 297,881 302,186 298,686 295,580
Total 431,706 496,001 497,026 501,130 501,111 499,335
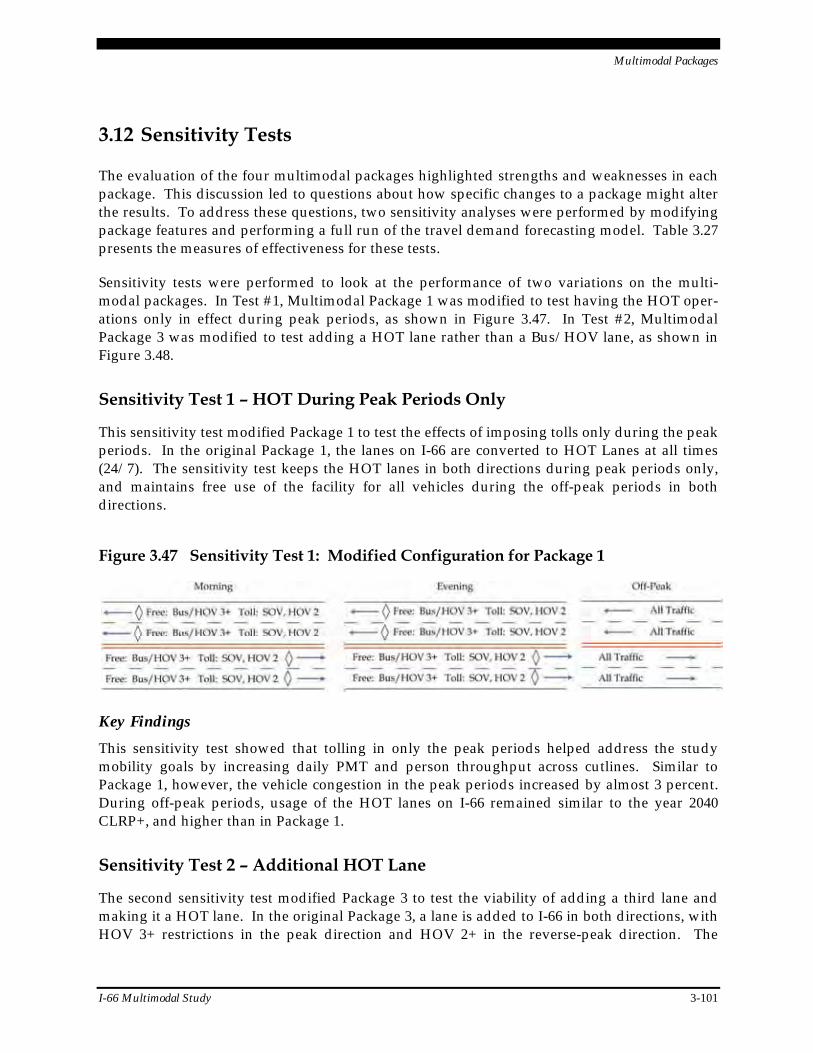
Multimodal Packages
I-66 Multimodal Study 3-101
3.12 Sensitivity Tests
The evaluation of the four multimodal packages highlighted strengths and weaknesses in each package. This discussion led to questions about how specific changes to a package might alter the results. To address these questions, two sensitivity analyses were performed by modifying package features and performing a full run of the travel demand forecasting model. Table 3.27 presents the measures of effectiveness for these tests.
Sensitivity tests were performed to look at the performance of two variations on the multi-modal packages. In Test #1, Multimodal Package 1 was modified to test having the HOT oper-ations only in effect during peak periods, as shown in Figure 3.47. In Test #2, Multimodal Package 3 was modified to test adding a HOT lane rather than a Bus/HOV lane, as shown in Figure 3.48.
Sensitivity Test 1 – HOT During Peak Periods Only
This sensitivity test modified Package 1 to test the effects of imposing tolls only during the peak periods. In the original Package 1, the lanes on I-66 are converted to HOT Lanes at all times (24/7). The sensitivity test keeps the HOT lanes in both directions during peak periods only, and maintains free use of the facility for all vehicles during the off-peak periods in both directions.
Figure 3.47 Sensitivity Test 1: Modified Configuration for Package 1
Key Findings
This sensitivity test showed that tolling in only the peak periods helped address the study mobility goals by increasing daily PMT and person throughput across cutlines. Similar to Package 1, however, the vehicle congestion in the peak periods increased by almost 3 percent. During off-peak periods, usage of the HOT lanes on I-66 remained similar to the year 2040 CLRP+, and higher than in Package 1.
Sensitivity Test 2 – Additional HOT Lane
The second sensitivity test modified Package 3 to test the viability of adding a third lane and making it a HOT lane. In the original Package 3, a lane is added to I-66 in both directions, with HOV 3+ restrictions in the peak direction and HOV 2+ in the reverse-peak direction. The
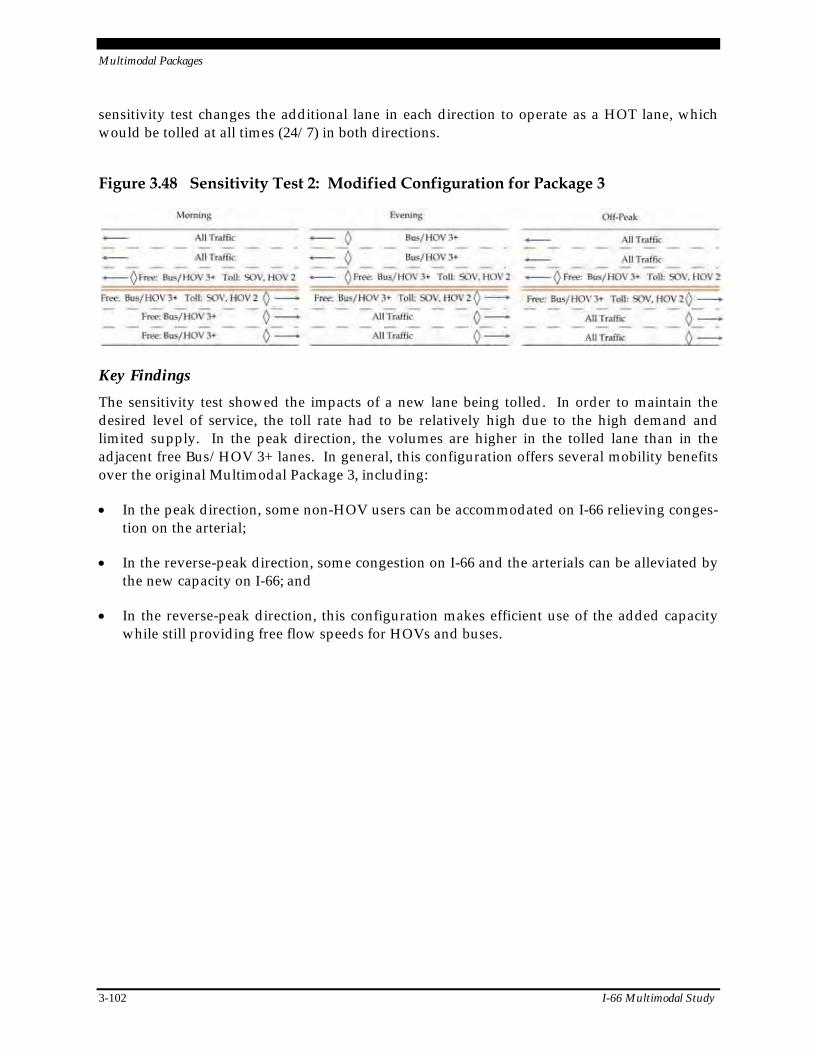
Multimodal Packages
3-102 I-66 Multimodal Study
sensitivity test changes the additional lane in each direction to operate as a HOT lane, which would be tolled at all times (24/7) in both directions.
Figure 3.48 Sensitivity Test 2: Modified Configuration for Package 3
Key Findings
The sensitivity test showed the impacts of a new lane being tolled. In order to maintain the desired level of service, the toll rate had to be relatively high due to the high demand and limited supply. In the peak direction, the volumes are higher in the tolled lane than in the adjacent free Bus/HOV 3+ lanes. In general, this configuration offers several mobility benefits over the original Multimodal Package 3, including:
In the peak direction, some non-HOV users can be accommodated on I-66 relieving conges-tion on the arterial;
In the reverse-peak direction, some congestion on I-66 and the arterials can be alleviated by the new capacity on I-66; and
In the reverse-peak direction, this configuration makes efficient use of the added capacity while still providing free flow speeds for HOVs and buses.
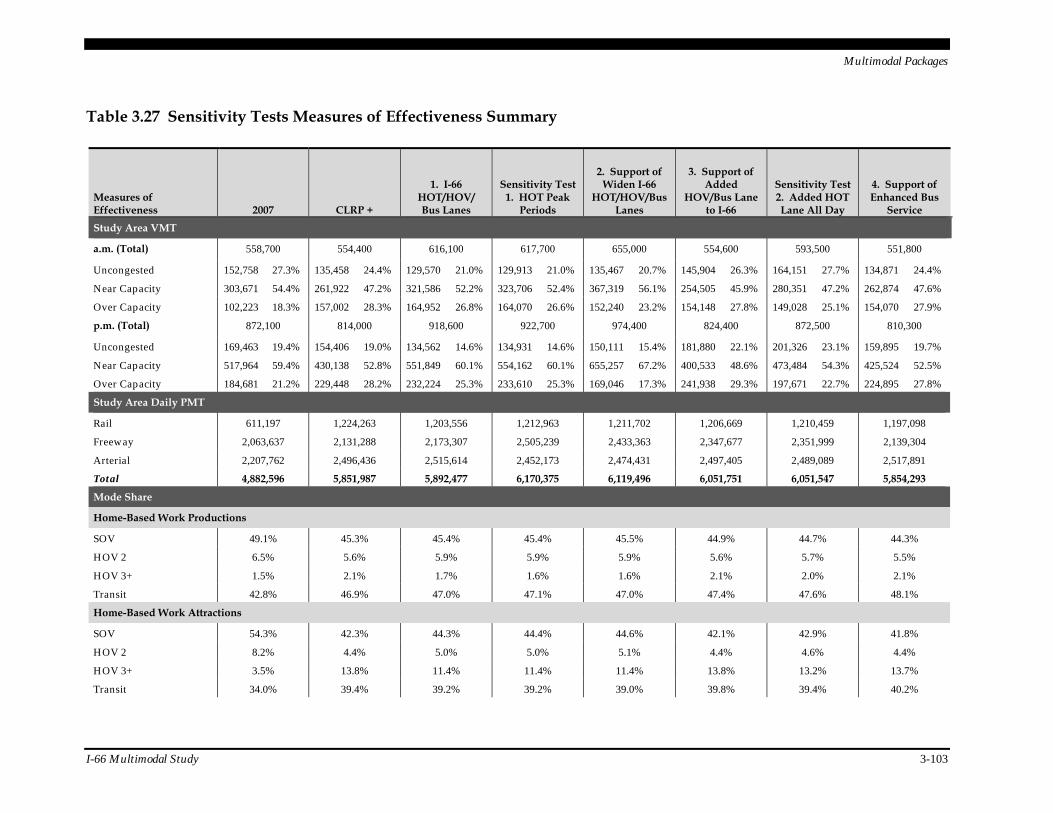
Multimodal Packages
I-66 Multimodal Study 3-103
Table 3.27 Sensitivity Tests Measures of Effectiveness Summary
Measures of Effectiveness 2007 CLRP +
1. I-66 HOT/HOV/ Bus Lanes
Sensitivity Test 1. HOT Peak
Periods
2. Support of Widen I-66
HOT/HOV/Bus Lanes
3. Support of Added
HOV/Bus Lane to I-66
Sensitivity Test 2. Added HOT Lane All Day
4. Support of Enhanced Bus
Service
Study Area VMT
a.m. (Total) 558,700 554,400 616,100 617,700 655,000 554,600 593,500 551,800
Uncongested 152,758 27.3% 135,458 24.4% 129,570 21.0% 129,913 21.0% 135,467 20.7% 145,904 26.3% 164,151 27.7% 134,871 24.4%
Near Capacity 303,671 54.4% 261,922 47.2% 321,586 52.2% 323,706 52.4% 367,319 56.1% 254,505 45.9% 280,351 47.2% 262,874 47.6%
Over Capacity 102,223 18.3% 157,002 28.3% 164,952 26.8% 164,070 26.6% 152,240 23.2% 154,148 27.8% 149,028 25.1% 154,070 27.9%
p.m. (Total) 872,100 814,000 918,600 922,700 974,400 824,400 872,500 810,300
Uncongested 169,463 19.4% 154,406 19.0% 134,562 14.6% 134,931 14.6% 150,111 15.4% 181,880 22.1% 201,326 23.1% 159,895 19.7%
Near Capacity 517,964 59.4% 430,138 52.8% 551,849 60.1% 554,162 60.1% 655,257 67.2% 400,533 48.6% 473,484 54.3% 425,524 52.5%
Over Capacity 184,681 21.2% 229,448 28.2% 232,224 25.3% 233,610 25.3% 169,046 17.3% 241,938 29.3% 197,671 22.7% 224,895 27.8%
Study Area Daily PMT
Rail 611,197 1,224,263 1,203,556 1,212,963 1,211,702 1,206,669 1,210,459 1,197,098
Freeway 2,063,637 2,131,288 2,173,307 2,505,239 2,433,363 2,347,677 2,351,999 2,139,304
Arterial 2,207,762 2,496,436 2,515,614 2,452,173 2,474,431 2,497,405 2,489,089 2,517,891
Total 4,882,596 5,851,987 5,892,477 6,170,375 6,119,496 6,051,751 6,051,547 5,854,293
Mode Share
Home-Based Work Productions
SOV 49.1% 45.3% 45.4% 45.4% 45.5% 44.9% 44.7% 44.3%
HOV 2 6.5% 5.6% 5.9% 5.9% 5.9% 5.6% 5.7% 5.5%
HOV 3+ 1.5% 2.1% 1.7% 1.6% 1.6% 2.1% 2.0% 2.1%
Transit 42.8% 46.9% 47.0% 47.1% 47.0% 47.4% 47.6% 48.1%
Home-Based Work Attractions
SOV 54.3% 42.3% 44.3% 44.4% 44.6% 42.1% 42.9% 41.8%
HOV 2 8.2% 4.4% 5.0% 5.0% 5.1% 4.4% 4.6% 4.4%
HOV 3+ 3.5% 13.8% 11.4% 11.4% 11.4% 13.8% 13.2% 13.7%
Transit 34.0% 39.4% 39.2% 39.2% 39.0% 39.8% 39.4% 40.2%
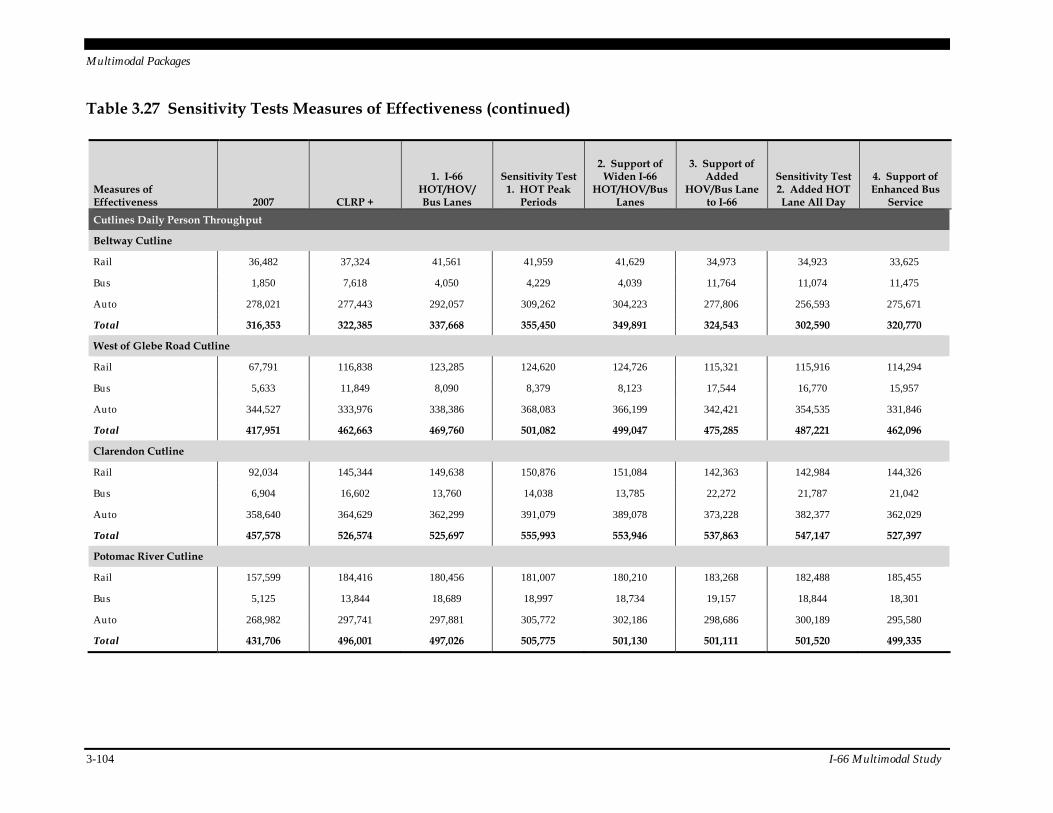
Multimodal Packages
3-104 I-66 Multimodal Study
Table 3.27 Sensitivity Tests Measures of Effectiveness (continued)
Measures of Effectiveness 2007 CLRP +
1. I-66 HOT/HOV/ Bus Lanes
Sensitivity Test 1. HOT Peak
Periods
2. Support of Widen I-66
HOT/HOV/Bus Lanes
3. Support of Added
HOV/Bus Lane to I-66
Sensitivity Test 2. Added HOT Lane All Day
4. Support of Enhanced Bus
Service
Cutlines Daily Person Throughput
Beltway Cutline
Rail 36,482 37,324 41,561 41,959 41,629 34,973 34,923 33,625
Bus 1,850 7,618 4,050 4,229 4,039 11,764 11,074 11,475
Auto 278,021 277,443 292,057 309,262 304,223 277,806 256,593 275,671
Total 316,353 322,385 337,668 355,450 349,891 324,543 302,590 320,770
West of Glebe Road Cutline
Rail 67,791 116,838 123,285 124,620 124,726 115,321 115,916 114,294
Bus 5,633 11,849 8,090 8,379 8,123 17,544 16,770 15,957
Auto 344,527 333,976 338,386 368,083 366,199 342,421 354,535 331,846
Total 417,951 462,663 469,760 501,082 499,047 475,285 487,221 462,096
Clarendon Cutline
Rail 92,034 145,344 149,638 150,876 151,084 142,363 142,984 144,326
Bus 6,904 16,602 13,760 14,038 13,785 22,272 21,787 21,042
Auto 358,640 364,629 362,299 391,079 389,078 373,228 382,377 362,029
Total 457,578 526,574 525,697 555,993 553,946 537,863 547,147 527,397
Potomac River Cutline
Rail 157,599 184,416 180,456 181,007 180,210 183,268 182,488 185,455
Bus 5,125 13,844 18,689 18,997 18,734 19,157 18,844 18,301
Auto 268,982 297,741 297,881 305,772 302,186 298,686 300,189 295,580
Total 431,706 496,001 497,026 505,775 501,130 501,111 501,520 499,335
Recommendations
4-1
4.0 Recommendations
This section presents recommendations and conclusions drawn from the I-66 Multimodal Study evaluation of potential long-term, multimodal improvements for the I-66 corridor inside the Capital Beltway. As detailed in Section 3.0, the I-66 Multimodal Study examined four multi-modal packages of improvements. Each package included transit services, bicycle and pede-strian facilities, travel demand management strategies (TDM), technological applications, and roadway improvements that worked to complement each other with the objective of maximizing the potential for the package to achieve the twin goals of the study: improving mobility and reducing highway and transit congestion.
The recommendations are presented in two categories: 1) core recommendations, which are considered a top priority and tie to the study approach; and 2) package recommendations, which are derived from the multimodal packages evaluated in this study. The package rec-ommendations made use of the evaluation of measures of effectiveness (Table 4.1) and the rec-ommendation framework (Table 4.2) in identifying promising strategies to meet the study goals of improving mobility and reducing highway and transit congestion in the corridor.
Core recommendations represent improvements identified in earlier studies that have been supported or adopted by the region. Some of these improvements have been advanced into the regional Financially Constrained Long-Range Plan (CLRP), while others are awaiting identifi-cation of funding prior to becoming part of the regional CLRP. These identified improvements in infrastructure and transit/high-occupancy vehicle (HOV) services were assumed to be part of the 2040 Baseline for this study and, as such, should be implemented before the recom-mended package elements are considered for implementation. This tiered approach provides the opportunity for reassessment and confirmation of the future need for any improvements above and beyond the core recommendations.
Package recommendations represent a combination of multimodal improvements (transit, bicycle and pedestrian, TDM, technology, and roadway) that the study analysis indicates could be gathered together as the most promising package that would further improve mobility and reduce highway and transit congestion in the study corridor. Performance measures were gen-erated for each of the four multimodal packages and two sensitivity analyses to help assess how well the corridor issues and needs and study goals are addressed. Person-miles traveled (PMT) in the study area was used as a measure to assess improved mobility. Congested vehicle-miles traveled (VMT) in the study area was used as a measure to assess reduced high-way congestion. Congested VMT values also reflect an impact to bus transit operations in that buses are affected by highway congestion. Load factors for transit (average number of passen-gers per vehicle) were looked at as a measure of congestion on the bus and rail system. Finally, person throughput at four study area cutlines was reviewed as a further indicator of multi-modal mobility.
The recommended package of multimodal improvements is a long-term planning-level pro-posal that is not intended to “leap frog” over other improvements adopted for the corridor. It
Recommendations
4-2 I-66 Multimodal Study
will be prudent to periodically reassess the need, composition, and phasing of the recom-mended package. In this way, there is an opportunity to adopt a tiered approach to implement the various elements within the recommended package. Additionally, there are potential vari-ations to some of the elements within the recommended package that could be modified to suit the need and policy prerogatives at the time detailed implementation plans are developed.
4.1 Core Recommendations
Approach
As was discussed in preceding sections, the study approach incorporated a 2040 Baseline which was comprised of the 2011 CLRP, the recommended bus services and TDM measures from the DRPT I-66 Transit/TDM Study completed in December 2009, and Metrorail core capacity improvements that are relevant to the corridor. These projects, programs, and services recom-mended in earlier studies were accepted as regional priorities and incorporated in the 2040 Baseline. As such, the major components of these prior plans and services are assumed to be implemented before the package elements are considered for implementation.
Analysis Summary
The planned 2040 improvements in the study area which are included in the 2011 CLRP are indicated in Table 3.4 (designated as CLRP). Major components of the CLRP in the corridor include: changing the occupancy requirement on I-66 in the peak direction from HOV 2+ to HOV 3+; constructing westbound spot improvements #2 and #3 on I-66; completing the Silver Line Phase I (to Wiehle Avenue) and Silver Line Phase II (to Dulles Airport and beyond to VA 772/Dulles Gateway in Loudoun County); and widening U.S. 50 to three lanes in each direction between I-495 and the Arlington County line. The CLRP improvements are funded, partially funded, or otherwise have a reasonable expectation of having funding sources identi-fied in the future.
Table 3.4 also details improvements that were recommended in the 2009 DRPT I-66 Transit/TDM Study (designated as CLRP+). Improvements inside the Beltway include new Priority Bus services in the corridor, rail station improvements at Ballston and East Falls Church, and various corridor-specific TDM options. The recommendations of the DRPT I-66 Transit/TDM Study were not formally adopted by the local jurisdictions; however, they were developed through a Technical Advisory Committee (TAC) consisting of both inside and outside the Beltway members from state, regional, and local jurisdictions, transit agencies, and transportation demand management providers. Although the I-66 Transit/TDM recommendations are not yet in the CLRP, they were deemed important for improving mobility in the corridor in the interim years 2015 and 2030.
In addition to the increased bus services and TDM programs noted above, this study recognizes the need and contribution of increasing the capacity on the Metrorail Orange and Silver Lines in the long term (2040). To address the long-term Metrorail capacity concerns in the corridor, WMATA has recommended that power systems and sufficient new rail cars be implemented to permit eight-car trains to operate throughout the system. In addition, WMATA has recom-
Recommendations
I-66 Multimodal Study 4-3
mended that additional pedestrian connections be implemented between the Gallery Place and Metro Center stations and the Farragut West and Farragut North stations to reduce crowding at key transfer points. WMATA also has been testing a virtual tunnel between the Farragut North and Farragut West stations through the SmarTrip® system as an initial lower-cost step. To the extent that these improvements are necessary to address the Metrorail core capacity concerns in the I-66 corridor, they also should be considered as part of the core recommendations of this study.
Recommendation
The first tier of improvements for the I-66 corridor inside the Capital Beltway consists of the improvements in the corridor as included in the 2011 CLRP (Table 3.4), including spot improvements along westbound I-66, increasing the HOV occupancy level from 2+ to 3+, and completing the Metrorail extension to Loudoun County.
The second tier of improvements for the I-66 corridor include the new transit services and TDM programs recommended by the 2009 DRPT I-66 Transit/TDM Study together with components of the WMATA enhancement plan deemed necessary to address Metrorail core capacity con-cerns in the I-66 corridor. The I-66 Multimodal Study did not evaluate the effectiveness of these improvements independently nor did it examine a timing and phasing strategy for them. It is assumed that the region will prepare more rigorous implementations plans for these improve-ments as the travel conditions in the corridor warrant.
4.2 Package Recommendations
Approach
As discussed in Section 3.0, four multimodal packages were assembled and analyzed, and two sensitivity tests were performed. Each multimodal package was found to have meritorious aspects, but for the most part, each package provided modest improvement in congested con-ditions and mobility in the corridor. Table 4.1 provides a summary of selected measures of effectiveness that address the goals of reducing congestion and improving mobility in the corridor. It must be noted that each package evaluated includes improvements to bicycle and pedestrian facilities, TDM programs, and implementation of various technological programs under the Integrated Corridor Management (ICM) strategy. The impact of these programs on mobility and congestion are discussed in Section 3.0, but are not quantified and reflected in the values in Table 4.1. Section 4.3 provides a prioritization within each program, which can be helpful in determining the order in which they are implemented.
Each package has unique design and implementation issues, policy considerations, and varying degrees of public support, which are presented in the package summary recommendations framework provided in Table 4.2. For example, adding tolls to an existing roadway without
Recommendations
4-4 I-66 Multimodal Study
capacity expansion would be without a regional precedent.1 Widening I-66 may carry other challenges. A recommendations framework that accepts that different policy assumptions may lead to different recommendations is a useful way to review the findings.
The recommendations framework presented in Table 4.2 has been organized to array informa-tion about each package across several dimensions. First, the design of the package is described. Second, the core purpose(s) of each package is provided. Third, how each package performs against the study goals, specifically, reducing congestion (both highway and transit) and improving mobility is outlined. Fourth, discussion regarding unique issues or other factors or dimensions of interest, including relevant market research and stakeholder input is noted.
For each multimodal package, the fifth key dimension, “Implications for Recommendations,” provides a synthesis of the opportunities and issues with each package and provides a guide to a way forward should policy-makers elect to pursue specific package elements. Given that this is a technical study with the specific task of identifying a set of multimodal improvements that hold the most promise to improve mobility and reduce congestion in the long term, policy con-siderations were not used as the guiding criteria in developing a specific package of recom-mended multimodal improvements. The recommendation framework presented in Table 4.2, however, does clearly identify the potential effectiveness of each package in specific areas suited to specific policy considerations.
It is important to note that the package recommendations in this study are based on technical considerations and are neutral to policy objectives identified during this study. As such, the recommendations are meant for consideration as long-term, end-state goals for a year 2040 planning horizon. Additionally, the performance metrics used to assess and develop the rec-ommended package rely on the foundation of core recommendations. The core recommenda-tions may be of higher priority to jurisdictions and be implemented in a shorter timeframe. As noted earlier, the package recommendations are not intended to “leap frog” the core recommendations.
Analysis Summary
As presented in Section 3.3, each of the multimodal packages impacts the key objectives of reducing congestion and improving mobility as measured through a set of performance measures. Throughout the discussion of the performance of the packages below, all cited costs are expressed in 2011 dollars.
Multimodal Package 1
Multimodal Package 1, converting I-66 to a high-occupancy/toll (HOT) facility, provides addi-tional travel options for commuters in the I-66 corridor as compared with the 2040 Baseline at a relatively low cost. In addition, the tolls would generate revenue which could offset some of the costs and/or provide revenues for transit/TDM programs. Converting to a HOT lane also
1 It has been noted that the Commonwealth of Virginia has been discussing plans to add tolls without
capacity expansion on I-95 south of the region.
Recommendations
I-66 Multimodal Study 4-5
would address the current issues with use of the facility by non-HOV users, providing a means to control the level of this usage. As may be seen in Table 4.1, this package increases highway congestion (congested VMT increases by 2.8 percent) in absolute terms compared to the Baseline condition. However, as shown in Section 3.0, as a percentage of VMT, the percentage of congested VMT with Multimodal Package 1 is lower than under the Baseline condition. The mobility measure of PMT increases 0.7 percent over the Baseline condition.
This package carries the lowest costs of the packages tested. Approximately $29 million in capital expenditures are required to implement tolling and it has been assumed that toll reve-nue will, at a minimum, completely offset the cost of operating the tolling system. Approximately $5 million in capital expenditures are necessary to implement the transit program included in the package, with an ongoing $23 million per year operating cost. Later in this section, priorities are offered for bicycle/pedestrian, TDM, and ICM improvements. The full complement of these improvements, included in all packages, is estimated to cost as fol-lows: bicycle and pedestrian, $42 million capital; TDM, $5 million per year operating cost; and ICM, $6 million capital, $1 million per year operating cost. Toll revenue was estimated for this package at a planning level, although the I-66 Multimodal Study was not designed as a traffic and revenue analysis. A conservative estimate of $24 million in annual revenue was calculated, determined solely by multiplying the tolls assumed in the model to maintain the LOS C/D level of traffic on I-66 by the number of non-HOV 3+ vehicles forecast to use the facility. However, as noted above, this is a very preliminary estimate as this study was not designed to prepare detailed financial forecasts.
Sensitivity Test 1
Sensitivity Test 1, a sensitivity test on Multimodal Package 1, was conducted by changing the time period during which tolls would be charged. In this alternative, tolls were assumed, in both directions, only during the morning and evening peak periods. This change improved the performance with regard to improving mobility, as compared to the 2040 Baseline (daily PMT increased 5.4 percent), but highway congestion reduction was similar to that of Multimodal Package 1 (congested VMT increased by 2.9 percent). However, it is important to note that the original forecast for Multimodal Package 1 was not fully refined for the off-peak periods to find the lowest necessary toll for achieving LOS C/D on I-66. Therefore, the improvement in performance of the sensitivity test scenario relative to Multimodal Package 1 may be overstated.
The cost of the sensitivity test on Multimodal Package 1 is the same as that of Multimodal Package 1. Due to the assumed significant reduction in the daily tolling period (from 24 hours to about 7 hours per day), toll revenues generated by this sensitivity test are less than half that of Multimodal Package 1, based on the rough calculations described above.
Multimodal Package 2
Multimodal Package 2, also a HOT facility option, is a variation on Multimodal Package 1 in that it assumes a third through lane on I-66. As seen in Table 4.1, this package not only improves mobility (increases PMT by 4.6 percent) compared to the Baseline condition, but also reduces the absolute level of highway congestion (congested VMT reduces by 17 percent). The estimated cost to implement this package ranges from $377 million (minimal right-of-way

Recommendations
4-6 I-66 Multimodal Study
(ROW) acquisition, with design exceptions) to $702 million (including all ROW acquisition needed to accommodate the facility with no design exceptions). Included in this figure is approximately $38 million in capital expenditures to implement tolling, and it has been assumed that toll revenue will, at a minimum, completely offset the cost of operating the tolling system. The increased annual highway maintenance cost is estimated to be about $3 million. The transit services proposed as part of Multimodal Package 2 are identical to those of Multimodal Package 1 and, therefore, carry the same cost, both capital and operating. Similarly, complementary package elements of bicycle/pedestrian, TDM, and ICM improvements carry identical cost estimates as in Multimodal Package 1.
As with Multimodal Package 1, toll revenue was also estimated for this package at a planning level, although the I-66 Multimodal Study was not designed to prepare financial forecasts. A conservative preliminary estimate of $21 million in annual revenue was calculated, determined solely by multiplying the tolls assumed in the model to maintain the LOS C/D level of traffic on I-66 by the number of non-HOV 3+ vehicles forecast to use the facility. The similarity to Package 1 in revenue estimates draws from both the methodology used and the fact that a lower toll was required to maintain the level of service policy objective under Multimodal Package 2, due to the added capacity. A traffic and revenue study could review market pricing options and refine the revenue estimates. Assuming a market pricing approach were to be used in such an analysis, toll revenues could serve as the basis for debt financing the capital cost of this package as is typically done with toll projects. Although there are greater costs associated with Multimodal Package 2, due primarily to constructing the expanded capacity, the expanded facility is estimated to provide greater congestion relief as compared to all the other packages.
As noted above, Multimodal Package 2 assumes a third through lane throughout the length of I-66 within the study area in both directions. The range of estimated costs in Table 4.1 reflects providing this third through lane with and without design exceptions; the higher value reflects the cost for construction without design exceptions. An alternate means of reducing costs and any potential impacts of this expansion is to consider providing a third through lane only for those segments where forecast demand and service levels merit the added capacity. Review of the forecasting results, particularly those which informed the toll-setting based on maintaining the LOS C/D policy objectives, showed that offering the additional through-lane segment between the Dulles Connector Road merge and Glebe Road could be most beneficial. The cost estimate to implement the third through lane between the Dulles Connector Road merge and Glebe Road is approximately $221 million, without design exceptions and utilizing the west-bound spot improvements as applicable.
The partial-implementation strategy, combined with judicious use of design exceptions, could further minimize the cost of Multimodal Package 2 so as to realize a majority of the forecast improvement in mobility and congestion reduction. Additionally, Multimodal Package 2 could be tested with tolling only during the peak periods – similar to the sensitivity test performed on Multimodal Package 1. Such testing should follow a re-examination of tolls used during off-peak periods as the original forecast was not fully refined during the off-peak periods. In gen-eral, removing tolls during the off-peak periods would be expected to increase PMT due to greater use of the added I-66 capacity as compared with a tolled condition.
Recommendations
I-66 Multimodal Study 4-7
Multimodal Package 3
Multimodal Package 3, widening the facility with an added HOV lane, does offer the prospect of new carpool options in the reverse-peak direction and supports bus service in the reverse-peak direction. During off-peak periods, the widened facility supports additional usage. In the peak direction, the facility is already forecast to have capacity available in the existing configu-ration due to the HOV 3+ policy. This package also included expansion of transit services as compared with Multimodal Package 1 and Multimodal Package 2.
While this package did improve mobility (daily PMT increases by 3.4 percent) compared to the Baseline, it increases congestion (congested VMT increases 2.5 percent). The estimated capital cost to implement the highway aspects of this package ranges from $340 million (minimal ROW acquisition with design exceptions) to $665 million (including all ROW acquisition needed to accommodate the facility with no design exceptions). The increased annual highway mainten-ance cost is estimated to be about $3 million. The expanded transit program in this package requires approximately $6 million in capital expenditures (about $1 million more than Multimodal Package 1 or 2) and $26 million in annual operating expenditures (about $3 million more per year than Multimodal Package 1 or 2). Expenditures for the bicycle/pedestrian, TDM, and ICM improvements would be the same as for all other packages, as outlined under the discussion for Multimodal Package 1, above.
Sensitivity Test 2
Sensitivity Test 2, a sensitivity test on Multimodal Package 3, was conducted in which the added third lane alone would function as a HOT lane, in both directions, all day every day, while the existing two lanes would operate as Bus/HOV 3+ during peak periods in the peak direction. Results showed that widening the facility with an added HOT lane, rather than an HOV lane, reduced congestion (congested VMT decreased 10 percent) compared to the Baseline while improving mobility (daily PMT increased 3.4 percent). However, the benefits in the peak direction were limited as compared with the all-HOT lane option represented by Multimodal Package 2 at a similar cost.
A single HOT lane operation would be more difficult to implement, with different considera-tions about ingress/egress and enforcement than with an all-HOT lane option, particularly when considering that more volume would be present in the HOT lane than in the adjacent two HOV lanes in the peak direction. A separate cost estimate was not performed for the sensitivity test, but the highway costs can be estimated be similar to those for Multimodal Package 2 ($377 million to $702 million, depending on design exception opportunities). While the tolling sys-tem costs themselves to address one lane of tolled traffic may be slightly lower than for Multimodal Package 2, added costs to address ingress/egress and enforcement could prove to make up the difference. All other costs would be the same as for Multimodal Package 3.
As with Multimodal Packages 1 and 2, toll revenue was estimated at a planning level for this operation, but is preliminary in nature as the I-66 Multimodal Study was not designed to prepare financial forecasts. A conservative estimate of $8 million in annual revenue was calculated, determined solely by multiplying the tolls assumed in the model to maintain the LOS C/D level of traffic on the HOT lane by the number of non-HOV 3+ vehicles forecast to use the single HOT lane. A higher toll was required to limit demand for the lane sufficient to
Recommendations
4-8 I-66 Multimodal Study
achieve the objective level of service in the lane. A traffic and revenue study could review market pricing options and refine the revenue estimates. Assuming a market pricing approach were to be used in such an analysis, toll revenues could serve as the basis for debt financing the capital cost of this package as is typically done with toll projects.
Multimodal Package 4
Multimodal Package 4 evaluated a transit-focused strategy to address the forecast mobility and congestion in the study area. This package constructed a shoulder lane on U.S. 50, in both directions, throughout the study area, reserved for very high frequency buses only during the morning and evening peak periods. No vehicles would be permitted on this shoulder lane during off-peak hours. Results showed that transit ridership could respond to substantial added investments in the bus network. It should be noted that the commuter transit mode share in this corridor is one of the highest nationally, making it challenging to significantly increase to even higher levels. Results indicate modest improvement in mobility (daily PMT increases by 0.1 percent) compared to the Baseline condition and a modest decrease in conges-tion (congested VMT decreases 2 percent). The results from Multimodal Package 4 suggest that consideration should be given to enhancing the level of trunk route transit service on selected bus routes in the study area.
As developed, the estimated highway-related capital cost is $211 million, with annual addi-tional highway operating costs of $1 million. The estimated capital cost to implement the tran-sit service elements of the package is $9 million. The transit service in this package requires approximately $46 million per year in operating expenses. Expenditures for the bicycle/pede-strian, TDM, and ICM improvements would be the same as for all other packages, as outlined under the discussion for Multimodal Package 1, above.
The shoulder lane on U.S. 50 afforded the ability to reduce the travel time of selected bus services. The reduction in travel times, though, was significantly tempered by potential speed limitations placed on buses operating next to congested lanes of traffic, motor vehicle ingress and egress activity in commercial areas, and the need for the buses to make stops along the way. The in-vehicle travel time improvements, coupled with the increased service frequency along the facility result in somewhat stronger ridership on U.S. 50 services, particularly closer to the Beltway cutline, as compared with the Baseline. However, the maximum cutline rider-ship is reported as about 1,500 riders per day. As is discussed in Section 3.0 of this report, the analysis did not provide encouragement for light rail service along U.S. 50 with the current land use assumptions.
Public Comments
Documentation of the public information and participation effort can be found in Appendix A of this report. A brief overview is provided here as it relates to informing the recommendations for the study. Methods for receiving public comment included market research performed in the early part of this study, stakeholder interviews that were conducted throughout the study, and public comments received at the two rounds of public meetings, via e-mail, and via the dedicated telephone line.
Recommendations
I-66 Multimodal Study 4-9
In developing the mobility options, multimodal packages, and recommendations, findings from the market research were used to examine the level of support for the components of each package. A full report on the market research is provided in Appendix B. The market research included over 3,500 survey responses, and represented users of all modes in the corridor, residing both inside and outside the Beltway. Overall, there was much support for improving the transit services and bicycle opportunities in the corridor, but mixed support for implemen-tation of HOT lanes and adding lanes to I-66. About 25 percent of all respondents supported converting the roadway to a HOT facility. The survey also indicated that, although commuters may have heard about HOT lanes, they do not have a high level of familiarity or understanding of the benefits of HOT lanes, which could contribute to the low level of support. Support for adding new HOV/bus lanes varied as well. Overall, about 44 percent of the survey respon-dents supported adding a lane for HOV/bus usage.
The stakeholder interviews conducted throughout the study also indicated strong support for transit and bicycle improvements in the corridor, but similar to the market research, about a third of the stakeholders interviewed were in favor of adding capacity to I-66 and a third opposed. When asked about converting I-66 to HOT lanes, about 43 percent of stakeholders supported the idea and 21 percent were opposed.
Citizen comments received at the public meetings and through the webpage and telephone line generally supported transit and bicycle improvements in the corridor, but were mostly not in favor of widening the roadway or converting to HOT lanes. There were more than 100 com-ments received in total from the four public meetings, through the webpage and telephone line.
The study considered all of the inputs from the public and the directive from the TPB resolu-tion in developing and evaluating the multimodal packages. The substantial support for transit and for bicycle and pedestrian improvements was evident, and is reflected by the inclusion of these elements in each package. As such, the overall performance of each package is not attri-butable to any one element, but rather to the collection of multimodal elements that make up the package.
Recommended Package Elements
As the results show in Table 4.1, Multimodal Package 2, Multimodal Package 4, and the sensi-tivity test on Multimodal Package 3 are the only tested scenarios that serve both of the study goals – improve mobility (increase daily PMT and person throughput) and reduce congestion (decrease congested VMT). The sensitivity test on Multimodal Package 1, however, has the highest PMT and person throughput of the packages (0.8 percent better than Multimodal Package 2). However, for reasons noted in Section 3.0, the difference between Multimodal Package 1 and the associated Sensitivity Test 1 may be somewhat overstated. As discussed in Section 3.0, Multimodal Package 3 has design and operational challenges that would affect service-level predictions, but are not fully captured in the planning-level travel demand mod-eling conducted for this study. As such, Multimodal Package 3 is not considered a good candidate for recommendation. The sensitivity test on Multimodal Package 1, with its potential

Recommendations
4-10 I-66 Multimodal Study
to improve mobility and its ability in concept to serve as an interim phase for Multimodal Package 2, is considered a good candidate for recommendation.2
Overall, evaluation of all of the scenarios tested using the quantitative performance measures detailed in Section 3.0 indicate that components of the following three multimodal packages – Multimodal Package 1/Sensitivity Test 1, Multimodal Package 2, and Multimodal Package 4 –could be combined to develop a hybrid multimodal package to achieve the two study goals of improving mobility and reducing congestion. Supporting merits of these three packages include:
All of these multimodal packages improve or increase daily PMT, person throughput, and transit ridership in the corridor over the Baseline. Sensitivity Test 1 does the most for mobility in the corridor,3 but only marginally more than Multimodal Package 2. Multimodal Package 2 does the most to relieve congestion in the corridor, reducing congested VMT by almost 17 percent in the peak periods.
The increased capacity in Multimodal Package 2 helps divert more PMT to the freeway and provides some relief to the arterial roadways.
In Multimodal Package 4, selected additional transit service enhancements in the study area show the potential to provide additional transit choices to, from, and through the study area. The results from Multimodal Package 4 suggest that consideration should be given to enhancing the level of transit trunk route service on selected bus routes in the study area. However, the capital cost associated with developing a shoulder lane on U.S. 50 as com-pared with the ridership estimates, suggest this element should not be carried further.
While the study examined a third through lane for the entire length of the study area in Multimodal Package 2, future development work may be conducted to identify specific segments where a third lane would be most beneficial. A targeted addition of a third lane would help reduce the impact of costs associated with widening.
The proposed targeted widening component for Multimodal Package 2 could be phased in by first implementing just the tolling aspect of the package (see footnote) and adding the third lane when certain thresholds of congestion and/or service levels are reached. Opportunity exists, as part of future project development work, to increase the daily PMT for Multimodal Package 2 by examining tolling only during the peak periods. On an hourly basis, toll revenues during the off-peak hours are likely to be moderate. However, because there are 17 off-peak hours daily, it is possible that there would be a noticeable decrease in annual revenue estimates without off-peak period tolls.
2 The tolling system implementation for an anticipated later widening might be closer to the cost
expressed for the three through lane Multimodal Package 2 than that expressed for Multimodal Package 1; the details should be addressed in implementation planning.
3 The difference between Multimodal Package 1 and its associated Sensitivity Test 1 may be overstated due to the need for further refinements in the Multimodal Package 1 off-peak tolling parameters.
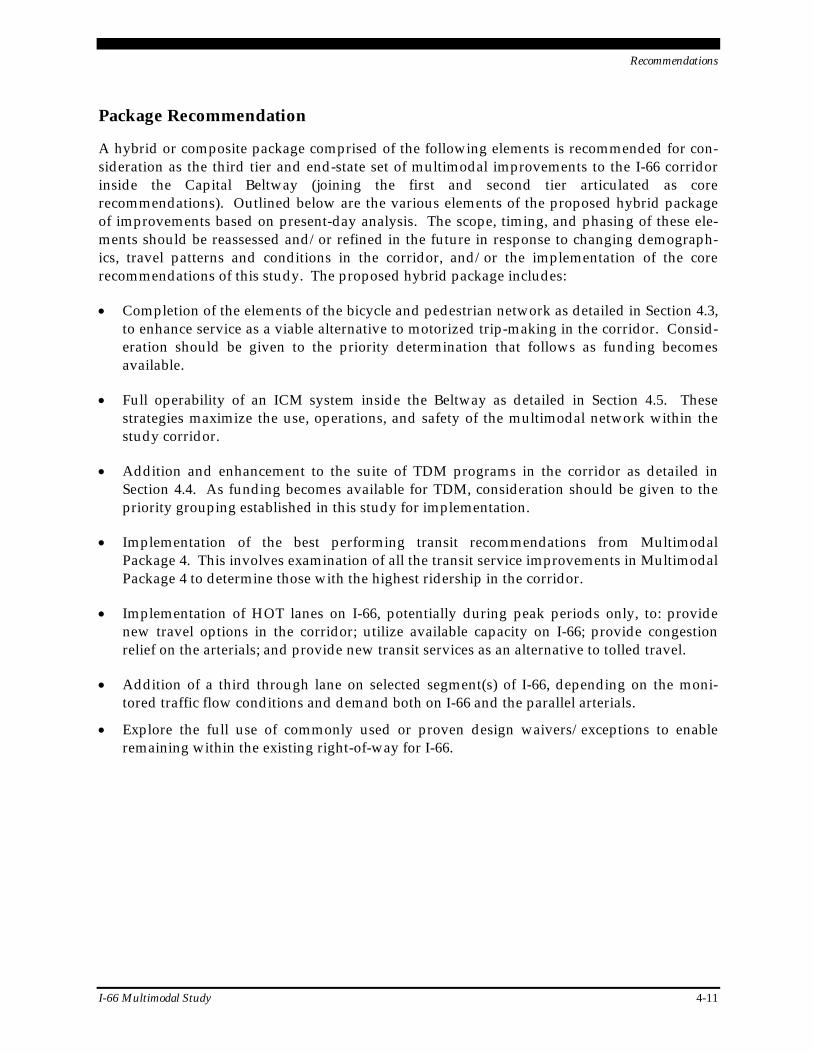
Recommendations
I-66 Multimodal Study 4-11
Package Recommendation
A hybrid or composite package comprised of the following elements is recommended for con-sideration as the third tier and end-state set of multimodal improvements to the I-66 corridor inside the Capital Beltway (joining the first and second tier articulated as core recommendations). Outlined below are the various elements of the proposed hybrid package of improvements based on present-day analysis. The scope, timing, and phasing of these ele-ments should be reassessed and/or refined in the future in response to changing demograph-ics, travel patterns and conditions in the corridor, and/or the implementation of the core recommendations of this study. The proposed hybrid package includes:
Completion of the elements of the bicycle and pedestrian network as detailed in Section 4.3, to enhance service as a viable alternative to motorized trip-making in the corridor. Consid-eration should be given to the priority determination that follows as funding becomes available.
Full operability of an ICM system inside the Beltway as detailed in Section 4.5. These strategies maximize the use, operations, and safety of the multimodal network within the study corridor.
Addition and enhancement to the suite of TDM programs in the corridor as detailed in Section 4.4. As funding becomes available for TDM, consideration should be given to the priority grouping established in this study for implementation.
Implementation of the best performing transit recommendations from Multimodal Package 4. This involves examination of all the transit service improvements in Multimodal Package 4 to determine those with the highest ridership in the corridor.
Implementation of HOT lanes on I-66, potentially during peak periods only, to: provide new travel options in the corridor; utilize available capacity on I-66; provide congestion relief on the arterials; and provide new transit services as an alternative to tolled travel.
Addition of a third through lane on selected segment(s) of I-66, depending on the moni-tored traffic flow conditions and demand both on I-66 and the parallel arterials.
Explore the full use of commonly used or proven design waivers/exceptions to enable remaining within the existing right-of-way for I-66.
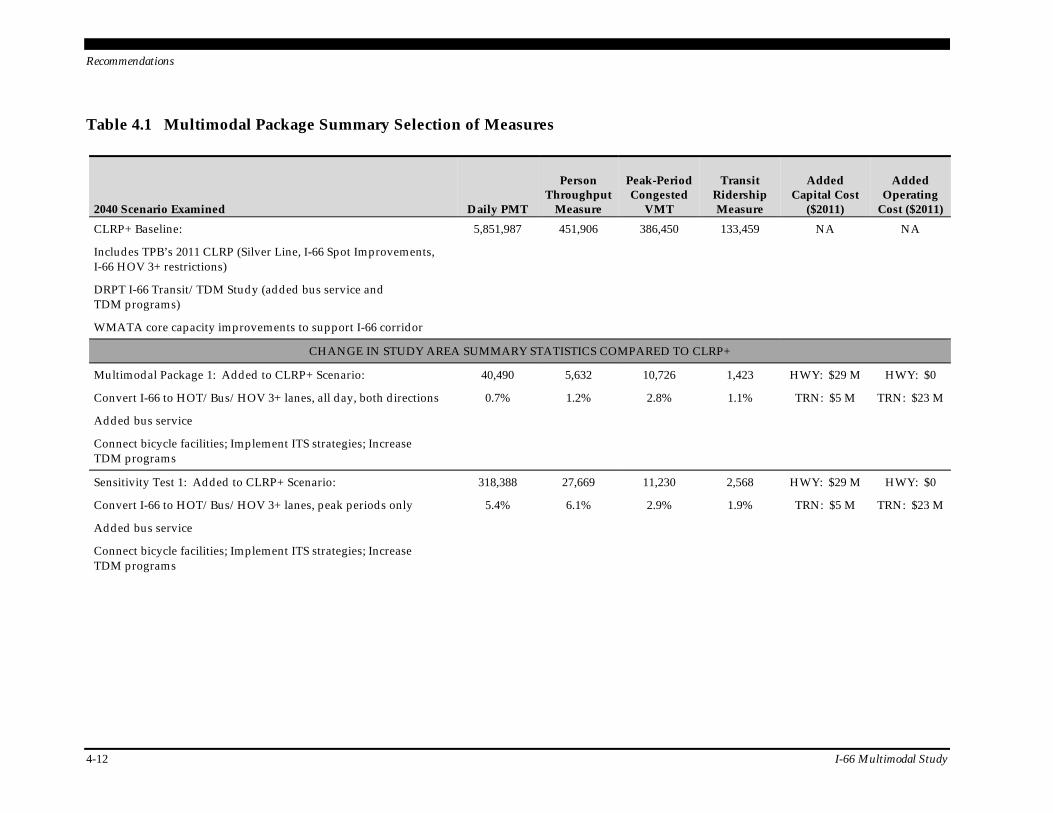
Recommendations
4-12 I-66 Multimodal Study
Table 4.1 Multimodal Package Summary Selection of Measures
2040 Scenario Examined Daily PMT
Person Throughput
Measure
Peak-Period Congested
VMT
Transit Ridership Measure
Added Capital Cost
($2011)
Added Operating
Cost ($2011) CLRP+ Baseline:
Includes TPB’s 2011 CLRP (Silver Line, I-66 Spot Improvements, I-66 HOV 3+ restrictions)
DRPT I-66 Transit/TDM Study (added bus service and TDM programs)
WMATA core capacity improvements to support I-66 corridor
5,851,987 451,906 386,450 133,459 NA NA
CHANGE IN STUDY AREA SUMMARY STATISTICS COMPARED TO CLRP+
Multimodal Package 1: Added to CLRP+ Scenario:
Convert I-66 to HOT/Bus/HOV 3+ lanes, all day, both directions
Added bus service
Connect bicycle facilities; Implement ITS strategies; Increase TDM programs
40,490
0.7%
5,632
1.2%
10,726
2.8%
1,423
1.1%
HWY: $29 M
TRN: $5 M
HWY: $0
TRN: $23 M
Sensitivity Test 1: Added to CLRP+ Scenario:
Convert I-66 to HOT/Bus/HOV 3+ lanes, peak periods only
Added bus service
Connect bicycle facilities; Implement ITS strategies; Increase TDM programs
318,388
5.4%
27,669
6.1%
11,230
2.9%
2,568
1.9%
HWY: $29 M
TRN: $5 M
HWY: $0
TRN: $23 M
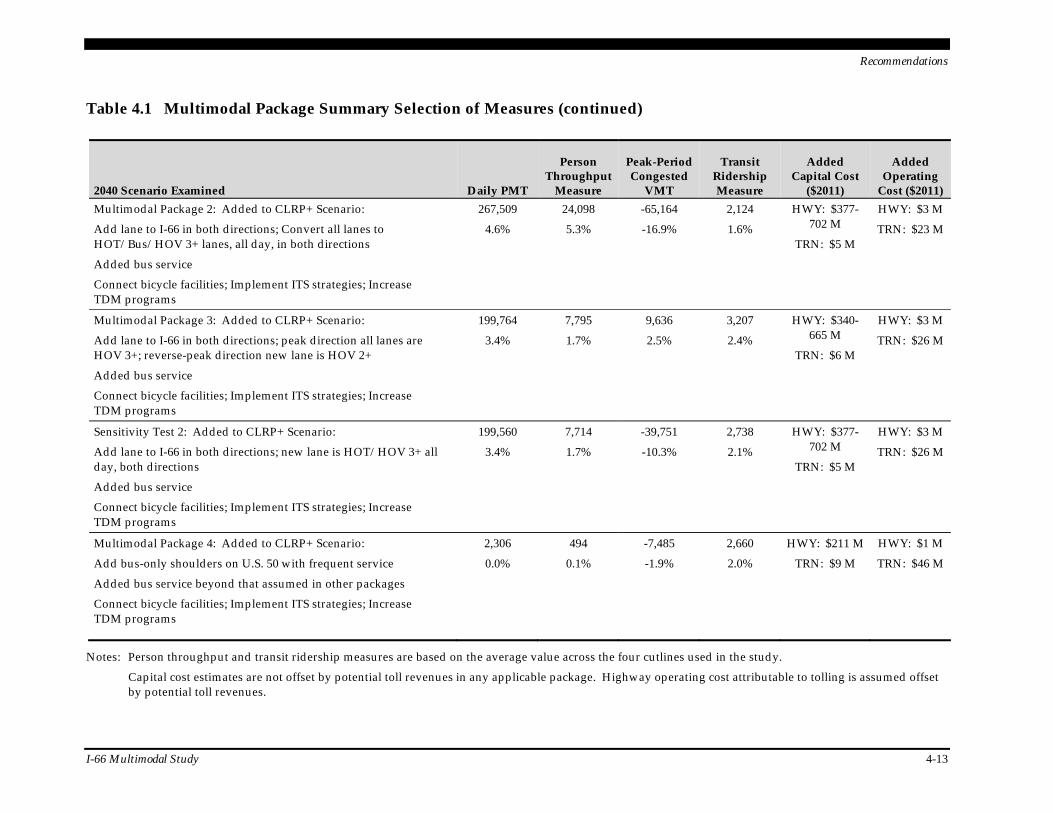
Recommendations
I-66 Multimodal Study 4-13
Table 4.1 Multimodal Package Summary Selection of Measures (continued)
2040 Scenario Examined Daily PMT
Person Throughput
Measure
Peak-Period Congested
VMT
Transit Ridership Measure
Added Capital Cost
($2011)
Added Operating
Cost ($2011) Multimodal Package 2: Added to CLRP+ Scenario:
Add lane to I-66 in both directions; Convert all lanes to HOT/Bus/HOV 3+ lanes, all day, in both directions
Added bus service
Connect bicycle facilities; Implement ITS strategies; Increase TDM programs
267,509
4.6%
24,098
5.3%
-65,164
-16.9%
2,124
1.6%
HWY: $377-702 M
TRN: $5 M
HWY: $3 M
TRN: $23 M
Multimodal Package 3: Added to CLRP+ Scenario:
Add lane to I-66 in both directions; peak direction all lanes are HOV 3+; reverse-peak direction new lane is HOV 2+
Added bus service
Connect bicycle facilities; Implement ITS strategies; Increase TDM programs
199,764
3.4%
7,795
1.7%
9,636
2.5%
3,207
2.4%
HWY: $340-665 M
TRN: $6 M
HWY: $3 M
TRN: $26 M
Sensitivity Test 2: Added to CLRP+ Scenario:
Add lane to I-66 in both directions; new lane is HOT/HOV 3+ all day, both directions
Added bus service
Connect bicycle facilities; Implement ITS strategies; Increase TDM programs
199,560
3.4%
7,714
1.7%
-39,751
-10.3%
2,738
2.1%
HWY: $377-702 M
TRN: $5 M
HWY: $3 M
TRN: $26 M
Multimodal Package 4: Added to CLRP+ Scenario:
Add bus-only shoulders on U.S. 50 with frequent service
Added bus service beyond that assumed in other packages
Connect bicycle facilities; Implement ITS strategies; Increase TDM programs
2,306
0.0%
494
0.1%
-7,485
-1.9%
2,660
2.0%
HWY: $211 M
TRN: $9 M
HWY: $1 M
TRN: $46 M
Notes: Person throughput and transit ridership measures are based on the average value across the four cutlines used in the study.
Capital cost estimates are not offset by potential toll revenues in any applicable package. Highway operating cost attributable to tolling is assumed offset by potential toll revenues.
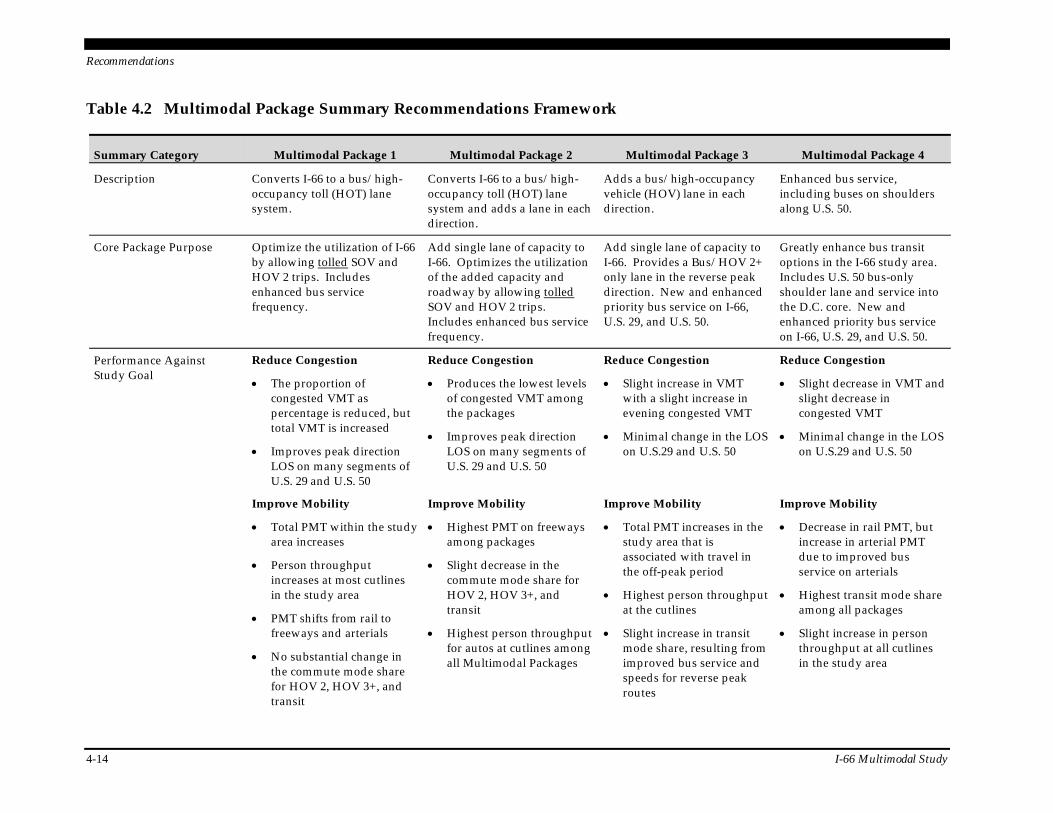
Recommendations
4-14 I-66 Multimodal Study
Table 4.2 Multimodal Package Summary Recommendations Framework
Summary Category Multimodal Package 1 Multimodal Package 2 Multimodal Package 3 Multimodal Package 4
Description Converts I-66 to a bus/high-occupancy toll (HOT) lane system.
Converts I-66 to a bus/high-occupancy toll (HOT) lane system and adds a lane in each direction.
Adds a bus/high-occupancy vehicle (HOV) lane in each direction.
Enhanced bus service, including buses on shoulders along U.S. 50.
Core Package Purpose Optimize the utilization of I-66 by allowing tolled SOV and HOV 2 trips. Includes enhanced bus service frequency.
Add single lane of capacity to I-66. Optimizes the utilization of the added capacity and roadway by allowing tolled SOV and HOV 2 trips. Includes enhanced bus service frequency.
Add single lane of capacity to I-66. Provides a Bus/HOV 2+ only lane in the reverse peak direction. New and enhanced priority bus service on I-66, U.S. 29, and U.S. 50.
Greatly enhance bus transit options in the I-66 study area. Includes U.S. 50 bus-only shoulder lane and service into the D.C. core. New and enhanced priority bus service on I-66, U.S. 29, and U.S. 50.
Performance Against Study Goal
Reduce Congestion
The proportion of congested VMT as percentage is reduced, but total VMT is increased
Improves peak direction LOS on many segments of U.S. 29 and U.S. 50
Reduce Congestion
Produces the lowest levels of congested VMT among the packages
Improves peak direction LOS on many segments of U.S. 29 and U.S. 50
Reduce Congestion
Slight increase in VMT with a slight increase in evening congested VMT
Minimal change in the LOS on U.S.29 and U.S. 50
Reduce Congestion
Slight decrease in VMT and slight decrease in congested VMT
Minimal change in the LOS on U.S.29 and U.S. 50
Improve Mobility
Total PMT within the study area increases
Person throughput increases at most cutlines in the study area
PMT shifts from rail to freeways and arterials
No substantial change in the commute mode share for HOV 2, HOV 3+, and transit
Improve Mobility
Highest PMT on freeways among packages
Slight decrease in the commute mode share for HOV 2, HOV 3+, and transit
Highest person throughput for autos at cutlines among all Multimodal Packages
Improve Mobility
Total PMT increases in the study area that is associated with travel in the off-peak period
Highest person throughput at the cutlines
Slight increase in transit mode share, resulting from improved bus service and speeds for reverse peak routes
Improve Mobility
Decrease in rail PMT, but increase in arterial PMT due to improved bus service on arterials
Highest transit mode share among all packages
Slight increase in person throughput at all cutlines in the study area
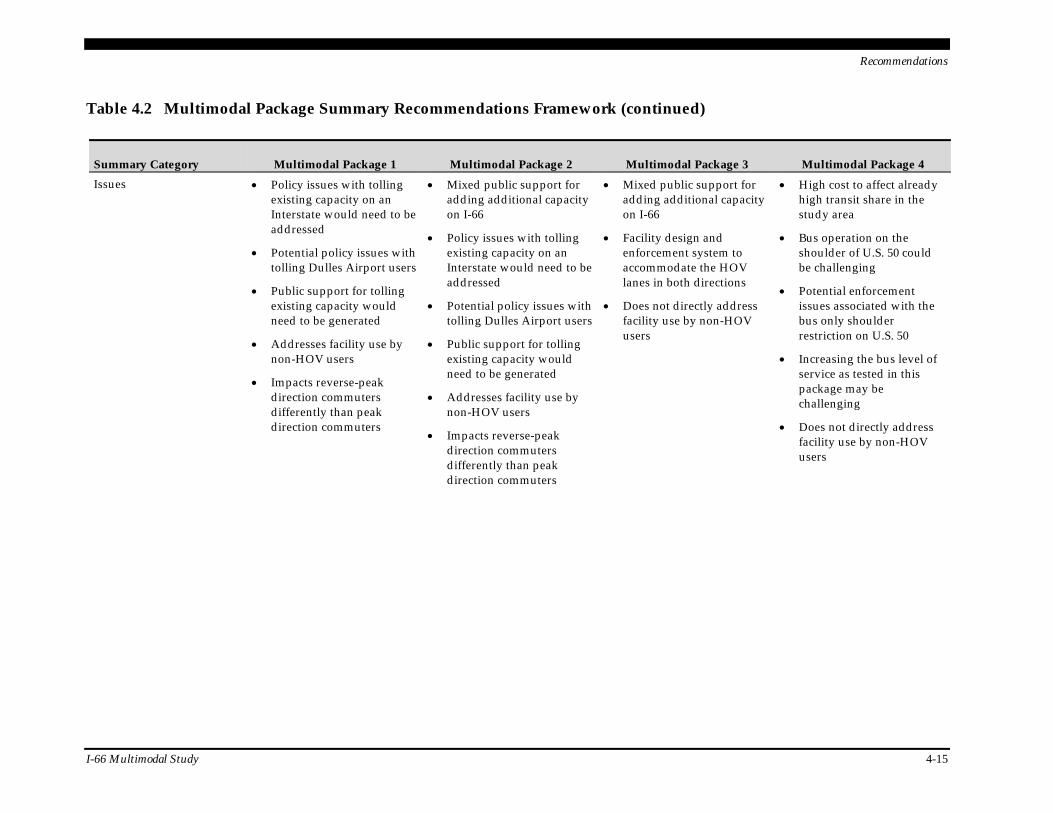
Recommendations
I-66 Multimodal Study 4-15
Table 4.2 Multimodal Package Summary Recommendations Framework (continued)
Summary Category Multimodal Package 1 Multimodal Package 2 Multimodal Package 3 Multimodal Package 4 Issues Policy issues with tolling
existing capacity on an Interstate would need to be addressed
Potential policy issues with tolling Dulles Airport users
Public support for tolling existing capacity would need to be generated
Addresses facility use by non-HOV users
Impacts reverse-peak direction commuters differently than peak direction commuters
Mixed public support for adding additional capacity on I-66
Policy issues with tolling existing capacity on an Interstate would need to be addressed
Potential policy issues with tolling Dulles Airport users
Public support for tolling existing capacity would need to be generated
Addresses facility use by non-HOV users
Impacts reverse-peak direction commuters differently than peak direction commuters
Mixed public support for adding additional capacity on I-66
Facility design and enforcement system to accommodate the HOV lanes in both directions
Does not directly address facility use by non-HOV users
High cost to affect already high transit share in the study area
Bus operation on the shoulder of U.S. 50 could be challenging
Potential enforcement issues associated with the bus only shoulder restriction on U.S. 50
Increasing the bus level of service as tested in this package may be challenging
Does not directly address facility use by non-HOV users
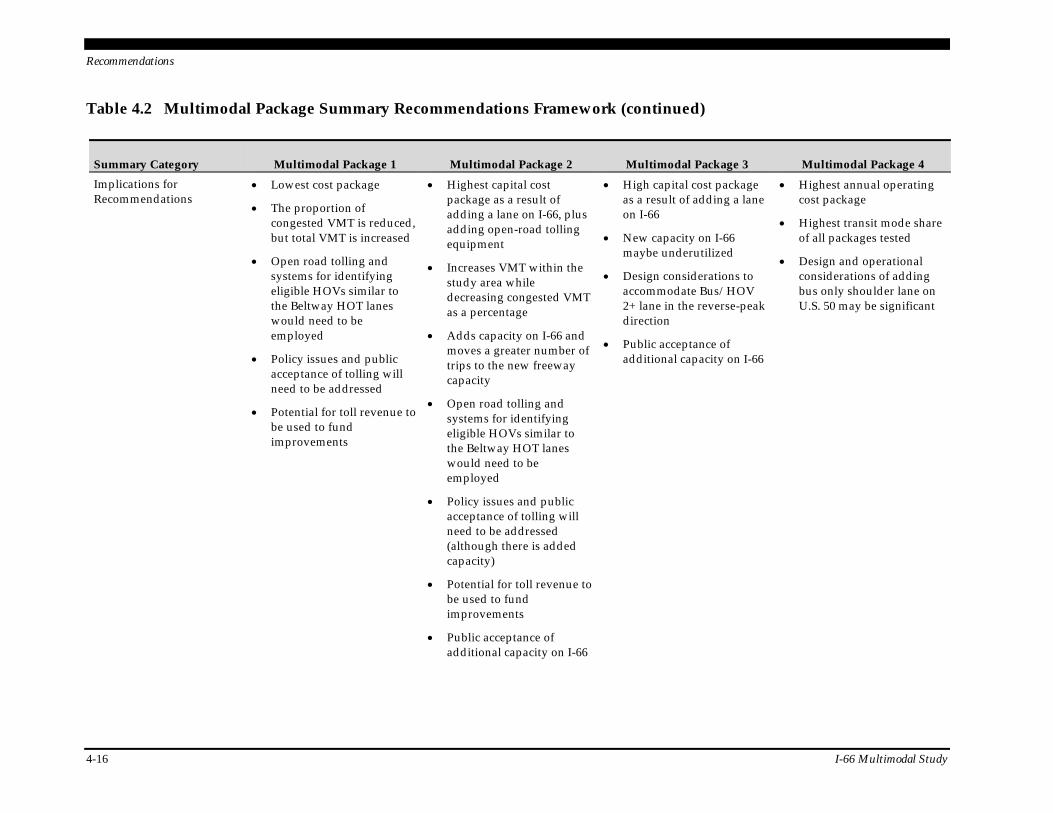
Recommendations
4-16 I-66 Multimodal Study
Table 4.2 Multimodal Package Summary Recommendations Framework (continued)
Summary Category Multimodal Package 1 Multimodal Package 2 Multimodal Package 3 Multimodal Package 4 Implications for Recommendations
Lowest cost package
The proportion of congested VMT is reduced, but total VMT is increased
Open road tolling and systems for identifying eligible HOVs similar to the Beltway HOT lanes would need to be employed
Policy issues and public acceptance of tolling will need to be addressed
Potential for toll revenue to be used to fund improvements
Highest capital cost package as a result of adding a lane on I-66, plus adding open-road tolling equipment
Increases VMT within the study area while decreasing congested VMT as a percentage
Adds capacity on I-66 and moves a greater number of trips to the new freeway capacity
Open road tolling and systems for identifying eligible HOVs similar to the Beltway HOT lanes would need to be employed
Policy issues and public acceptance of tolling will need to be addressed (although there is added capacity)
Potential for toll revenue to be used to fund improvements
Public acceptance of additional capacity on I-66
High capital cost package as a result of adding a lane on I-66
New capacity on I-66 maybe underutilized
Design considerations to accommodate Bus/HOV 2+ lane in the reverse-peak direction
Public acceptance of additional capacity on I-66
Highest annual operating cost package
Highest transit mode share of all packages tested
Design and operational considerations of adding bus only shoulder lane on U.S. 50 may be significant
Recommendations
I-66 Multimodal Study 4-17
4.3 Bicycle and Pedestrian System Enhancements
As discussed in Section 3.0, the bicycle and pedestrian system enhancements are common across packages, but have been evaluated to permit prioritization of them. The recommendations retain the entire project list, but the projects are presented in a priority grouping to facilitate implementation. The prioritization approach builds on the scoring discussed in Section 3.0, offering a combined score to sort the projects into higher- and lower-priority groups. Projects receiving over 10 points could be considered higher scoring projects and could be included in the higher-priority grouping. Projects receiving 10 points and less could be considered lower scoring projects and could be considered lower-priority projects. See Figure 4.1 and Table 4.3, Prioritized Bicycle Projects List, for a list of projects grouped by combined score.
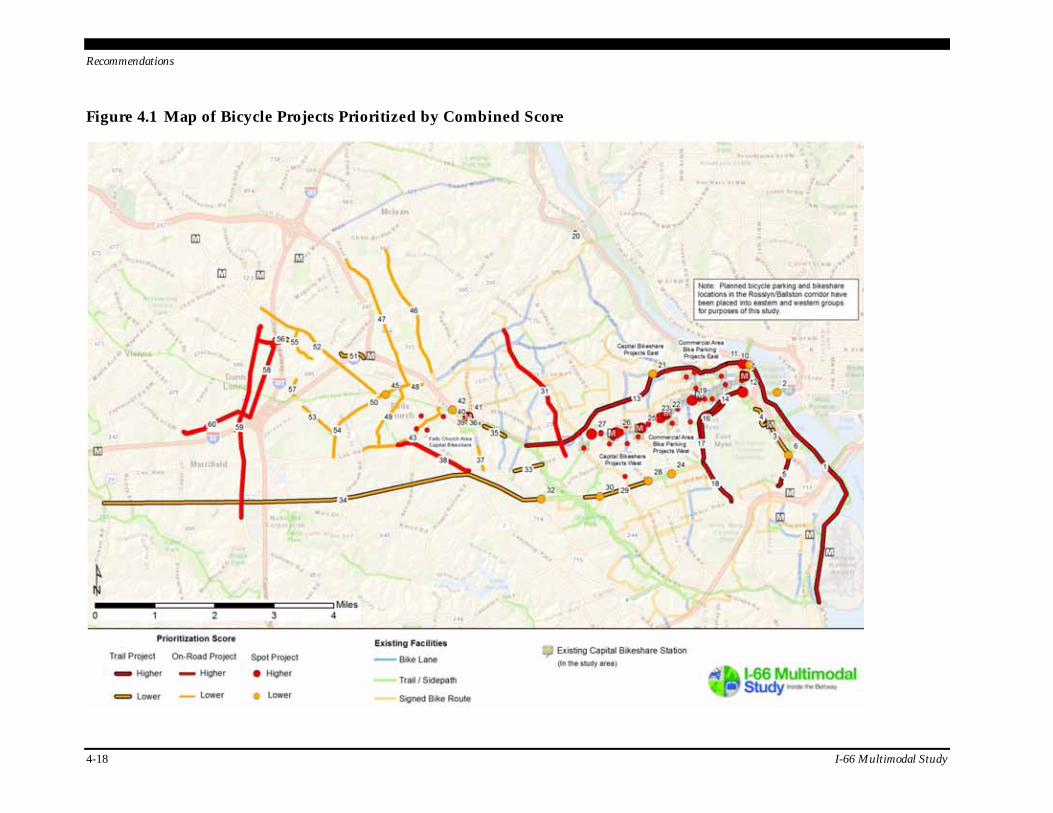
Recommendations
4-18 I-66 Multimodal Study
Figure 4.1 Map of Bicycle Projects Prioritized by Combined Score
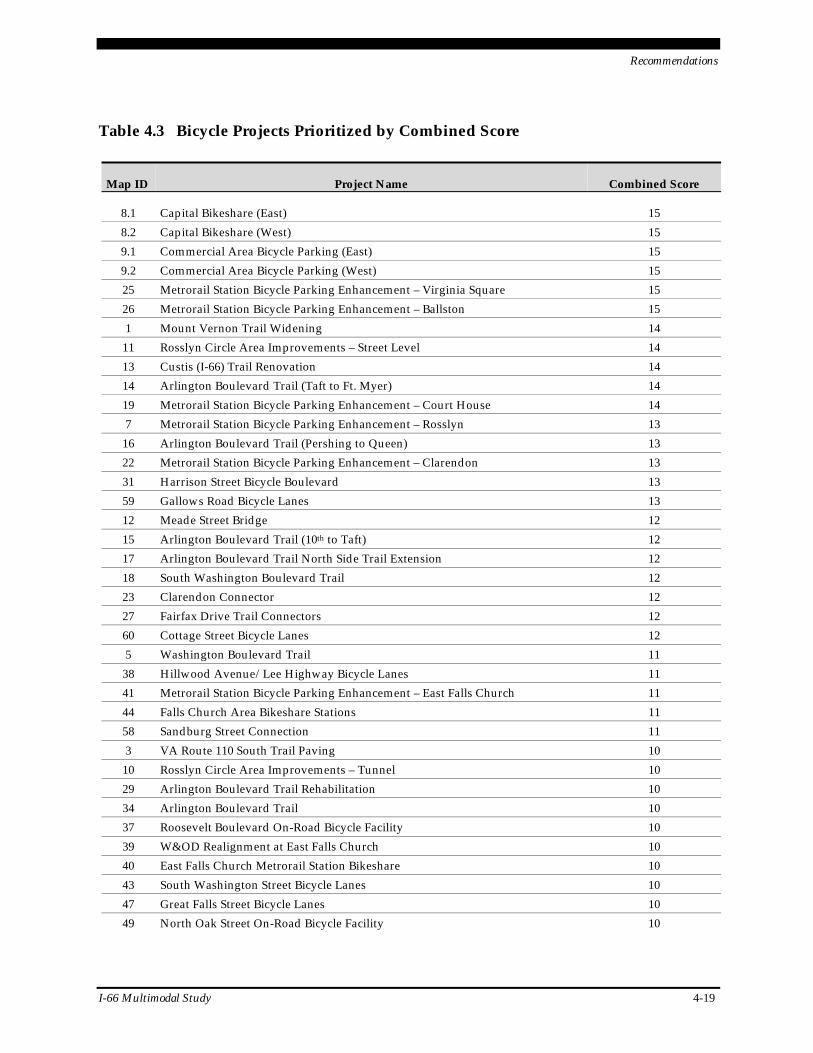
Recommendations
I-66 Multimodal Study 4-19
Table 4.3 Bicycle Projects Prioritized by Combined Score
Map ID Project Name Combined Score
8.1 Capital Bikeshare (East) 15
8.2 Capital Bikeshare (West) 15
9.1 Commercial Area Bicycle Parking (East) 15
9.2 Commercial Area Bicycle Parking (West) 15
25 Metrorail Station Bicycle Parking Enhancement – Virginia Square 15
26 Metrorail Station Bicycle Parking Enhancement – Ballston 15
1 Mount Vernon Trail Widening 14
11 Rosslyn Circle Area Improvements – Street Level 14
13 Custis (I-66) Trail Renovation 14
14 Arlington Boulevard Trail (Taft to Ft. Myer) 14
19 Metrorail Station Bicycle Parking Enhancement – Court House 14
7 Metrorail Station Bicycle Parking Enhancement – Rosslyn 13
16 Arlington Boulevard Trail (Pershing to Queen) 13
22 Metrorail Station Bicycle Parking Enhancement – Clarendon 13
31 Harrison Street Bicycle Boulevard 13
59 Gallows Road Bicycle Lanes 13
12 Meade Street Bridge 12
15 Arlington Boulevard Trail (10th to Taft) 12
17 Arlington Boulevard Trail North Side Trail Extension 12
18 South Washington Boulevard Trail 12
23 Clarendon Connector 12
27 Fairfax Drive Trail Connectors 12
60 Cottage Street Bicycle Lanes 12
5 Washington Boulevard Trail 11
38 Hillwood Avenue/Lee Highway Bicycle Lanes 11
41 Metrorail Station Bicycle Parking Enhancement – East Falls Church 11
44 Falls Church Area Bikeshare Stations 11
58 Sandburg Street Connection 11
3 VA Route 110 South Trail Paving 10
10 Rosslyn Circle Area Improvements – Tunnel 10
29 Arlington Boulevard Trail Rehabilitation 10
34 Arlington Boulevard Trail 10
37 Roosevelt Boulevard On-Road Bicycle Facility 10
39 W&OD Realignment at East Falls Church 10
40 East Falls Church Metrorail Station Bikeshare 10
43 South Washington Street Bicycle Lanes 10
47 Great Falls Street Bicycle Lanes 10
49 North Oak Street On-Road Bicycle Facility 10
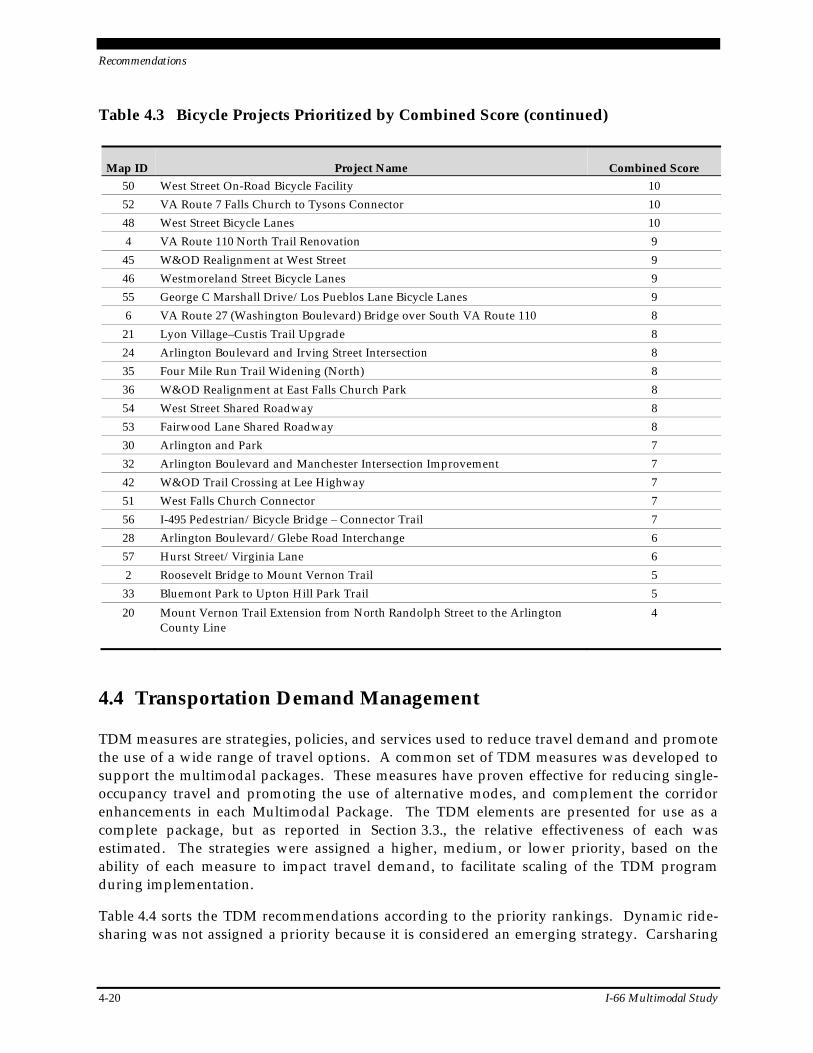
Recommendations
4-20 I-66 Multimodal Study
Table 4.3 Bicycle Projects Prioritized by Combined Score (continued)
Map ID Project Name Combined Score 50 West Street On-Road Bicycle Facility 10
52 VA Route 7 Falls Church to Tysons Connector 10
48 West Street Bicycle Lanes 10
4 VA Route 110 North Trail Renovation 9
45 W&OD Realignment at West Street 9
46 Westmoreland Street Bicycle Lanes 9
55 George C Marshall Drive/Los Pueblos Lane Bicycle Lanes 9
6 VA Route 27 (Washington Boulevard) Bridge over South VA Route 110 8
21 Lyon Village–Custis Trail Upgrade 8
24 Arlington Boulevard and Irving Street Intersection 8
35 Four Mile Run Trail Widening (North) 8
36 W&OD Realignment at East Falls Church Park 8
54 West Street Shared Roadway 8
53 Fairwood Lane Shared Roadway 8
30 Arlington and Park 7
32 Arlington Boulevard and Manchester Intersection Improvement 7
42 W&OD Trail Crossing at Lee Highway 7
51 West Falls Church Connector 7
56 I-495 Pedestrian/Bicycle Bridge – Connector Trail 7
28 Arlington Boulevard/Glebe Road Interchange 6
57 Hurst Street/Virginia Lane 6
2 Roosevelt Bridge to Mount Vernon Trail 5
33 Bluemont Park to Upton Hill Park Trail 5
20 Mount Vernon Trail Extension from North Randolph Street to the Arlington County Line
4
4.4 Transportation Demand Management
TDM measures are strategies, policies, and services used to reduce travel demand and promote the use of a wide range of travel options. A common set of TDM measures was developed to support the multimodal packages. These measures have proven effective for reducing single-occupancy travel and promoting the use of alternative modes, and complement the corridor enhancements in each Multimodal Package. The TDM elements are presented for use as a complete package, but as reported in Section 3.3., the relative effectiveness of each was estimated. The strategies were assigned a higher, medium, or lower priority, based on the ability of each measure to impact travel demand, to facilitate scaling of the TDM program during implementation.
Table 4.4 sorts the TDM recommendations according to the priority rankings. Dynamic ride-sharing was not assigned a priority because it is considered an emerging strategy. Carsharing
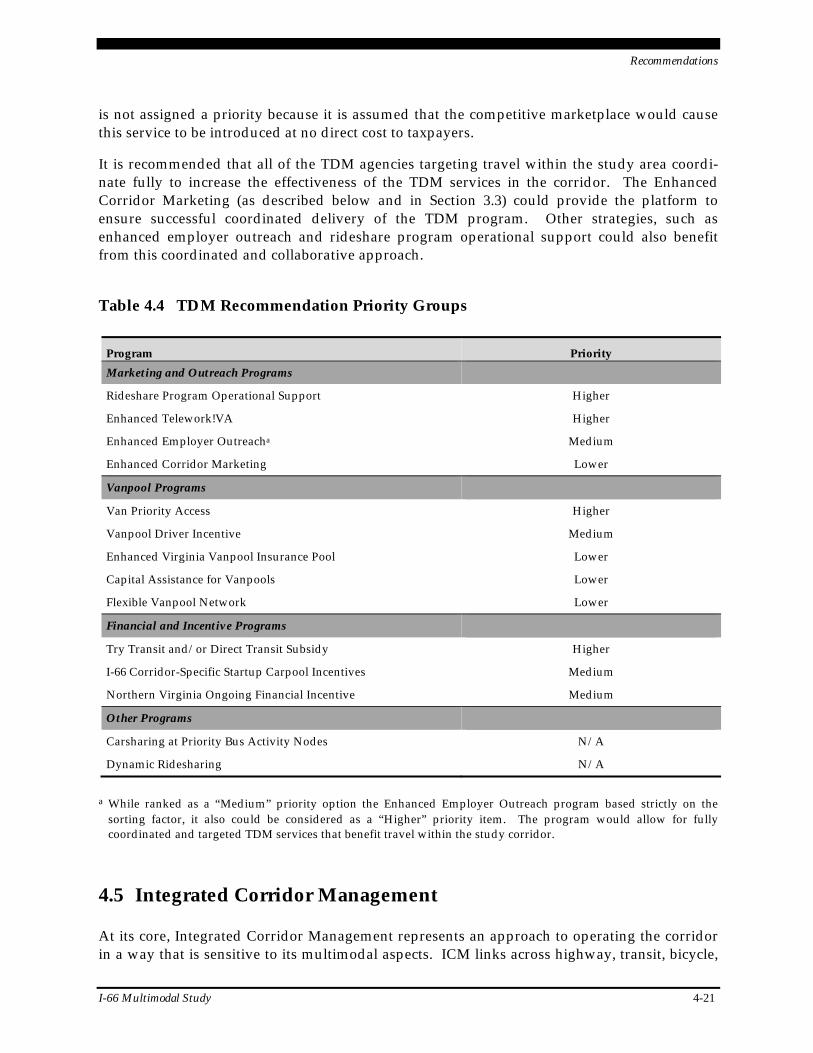
Recommendations
I-66 Multimodal Study 4-21
is not assigned a priority because it is assumed that the competitive marketplace would cause this service to be introduced at no direct cost to taxpayers.
It is recommended that all of the TDM agencies targeting travel within the study area coordi-nate fully to increase the effectiveness of the TDM services in the corridor. The Enhanced Corridor Marketing (as described below and in Section 3.3) could provide the platform to ensure successful coordinated delivery of the TDM program. Other strategies, such as enhanced employer outreach and rideshare program operational support could also benefit from this coordinated and collaborative approach.
Table 4.4 TDM Recommendation Priority Groups
Program Priority Marketing and Outreach Programs
Rideshare Program Operational Support Higher
Enhanced Telework!VA Higher
Enhanced Employer Outreacha Medium
Enhanced Corridor Marketing Lower
Vanpool Programs
Van Priority Access Higher
Vanpool Driver Incentive Medium
Enhanced Virginia Vanpool Insurance Pool Lower
Capital Assistance for Vanpools Lower
Flexible Vanpool Network Lower
Financial and Incentive Programs
Try Transit and/or Direct Transit Subsidy Higher
I-66 Corridor-Specific Startup Carpool Incentives Medium
Northern Virginia Ongoing Financial Incentive Medium
Other Programs
Carsharing at Priority Bus Activity Nodes N/A
Dynamic Ridesharing N/A
a While ranked as a “Medium” priority option the Enhanced Employer Outreach program based strictly on the sorting factor, it also could be considered as a “Higher” priority item. The program would allow for fully coordinated and targeted TDM services that benefit travel within the study corridor.
4.5 Integrated Corridor Management
At its core, Integrated Corridor Management represents an approach to operating the corridor in a way that is sensitive to its multimodal aspects. ICM links across highway, transit, bicycle,
Recommendations
4-22 I-66 Multimodal Study
and TDM. ICM brings together a variety of technology elements, providing drivers, transit users, carpoolers, and bicyclists with information to be able to make informed transportation decisions in advance or in real time. When ICM elements are implemented, users can expect greater travel time reliability and more efficient use of corridor infrastructure.
Embedded within the ICM approach are several Intelligent Transportation Systems (ITS) strat-egies which have merit for application to I-66 inside the Beltway. The high-priority elements of the I-66 Active Traffic Management (ATM) initiative are included in the CLRP and form part of the core recommendations (see Section 4.1). The high-priority elements of the I-66 ATM initia-tive also are included among the ICM elements. In summary, pursuit of ICM in the I-66 corri-dor should be considered a recommendation of this study and include the following improvements:
Enhanced ramp metering (included in I-66 ATM initiative);
Enhanced dynamic message signs (included in the I-66 ATM initiative);
Continuous closed-circuit television coverage (included in the I-66 ATM initiative);
Dynamic merge/junction control (may be included in I-66 ATM initiative);
Speed harmonization (application outside the Beltway is included in the I-66 ATM initiative);
Advanced parking management system to provide information about park-and-ride availability;
Multimodal traveler information, including travel time information by alternative modes; and
Signal priority for transit vehicles.
4.6 Conclusion
There is significant growth forecasted for Northern Virginia between now and 2040. The asso-ciated growth in travel demand will require improvements in multimodal transportation infra-structure, programs, and services to maintain mobility. The set of recommended multimodal improvements outlined in this section are believed to provide the study area – the I-66 corridor inside the Beltway – with means to accommodate the forecast growth and associated travel demand. The spectrum of recommendations – both core and package – covers a range of time-frames to 2040. Specific timing and phasing of implementation of the recommendations will require consideration of funding availability, progress against core recommendations, and the quality of operations and conditions on the existing key multimodal transportation infrastruc-ture assets.
Potential Funding Approaches
5-1
5.0 Potential Funding Approaches
The implementation of all of the I-66 Multimodal Study recommendations would require funding beyond existing resources that already are committed to other state and local trans-portation priorities. Following is an overview of existing funding (Federal, state, and local) for multimodal transportation investments and a discussion of potential revenue and financing options that could be considered to fund the I-66 Multimodal Study recommendations. Not all of the potential funding and finance approaches may be equally appropriate for use in Virginia. In addition, the use of some approaches will require legislative action. Additional information and details about funding approaches can be found in Appendix E, including Federal and state funding options and financing techniques.
Although estimates of yields for current user fee mechanisms are presented, the analysis relies on a qualitative assessment of the revenue options based on a broad set of criteria that include:
• Yield and predictability/reliability;
• Synergy with growth and demand;
• Stability; and
• Flexibility.
5.1 Summary of Revenue Options
Funding for transportation investments in Virginia comes primarily from Federal programs and state highway user fees dedicated to transportation, in addition to state retail sales and use taxes also dedicated to transportation. Figure 5.1 provides the Commonwealth Transportation Finance Map as presented to the Commonwealth Transportation Board by the Virginia Department of Transportation (VDOT) in September 2011. The figure highlights sources and uses of major state revenues, including the existence of three key funds – the highway mainten-ance and operating fund (HMOF), the transportation trust fund (TTF), and the priority trans-portation fund (PTF) – and the primary sources of funds, including several state sources. Table 5.1 shows the current rates and estimated yields for several of the state fee sources.
The TTF was created in 1986 for the purpose of providing dedicated funding for highway con-struction, transit, ports, and aviation. Formula distributions of the TTF revenues are deter-mined by statutory code, including how revenues are distributed amongst transportation modes, how the highway construction share is distributed, and formulas for the use of the tran-sit portion. Specifically, 78.7 percent is allocated to highway construction, 14.7 percent for mass transit capital and operations, 4.2 percent for ports (used for debt service, capital improve-ments, and construction), and 2.4 percent for airports (used for debt service, capital improve-ments, and construction). Due to maintenance needs being of higher priority in the statutory code, no highway construction funds have been available for distribution through the formula since fiscal year (FY) 2009.
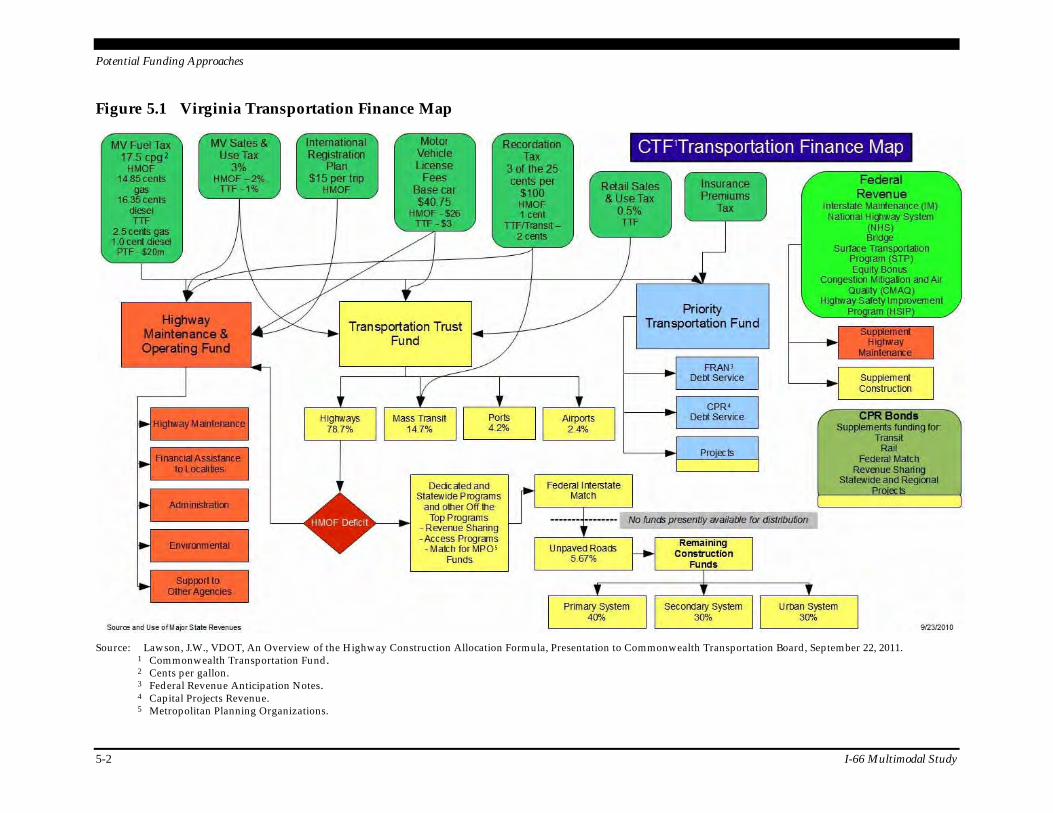
Potential Funding Approaches
5-2 I-66 Multimodal Study
Figure 5.1 Virginia Transportation Finance Map
Source: Lawson, J.W., VDOT, An Overview of the Highway Construction Allocation Formula, Presentation to Commonwealth Transportation Board, September 22, 2011. 1 Commonwealth Transportation Fund. 2 Cents per gallon. 3 Federal Revenue Anticipation Notes. 4 Capital Projects Revenue. 5 Metropolitan Planning Organizations.
1 2
3
4
5

Potential Funding Approaches
I-66 Multimodal Study 5-3
Table 5.1 Current Rates and Estimates Yields for State User Fees
Tax Mechanism Rates Estimated Virginia Yield
Motor Fuel Taxes $0.175 per gallon: $0.1485 per gallon gas for HMOF
$0.1635 per gallon diesel for HMOF $0.025 per gallon gas for TTF
$0.01 per gallon diesel for TTF $20 million to PTF
1 cent generates $47 million
Motor Vehicle Sales and Use Tax 3% purchase price: 2% for HMOF
1% for TTF
1% generates $166 million
Motor Vehicle Registration $40.75: $26 for HMOF
$3 for TTF $11.75 other
$1 generates $6 million
State Sales and Use Tax 0.50% for TTF 1% generates $900 million
Motor Vehicle Insurance Premiums 1/3 of prior year collection for PTF 0.25% generates $40 million
Recordation Tax 3 of the 25 cents per $100: 1 cent for HMOF
2 cents for TTF Transit account
1 cent generates $12 million
Motor Vehicle Rental Tax 4.0% for rail capital 1% generates $8 million
Source: Senate of Virginia, Senate Finance Committee, Transportation Subcommittee Briefing, January 25, 2012 and Lawson, J.W., VDOT, An Overview of the Highway Construction Allocation Formula, Presentation to Commonwealth Transportation Board, September 22, 2011.
The projected revenues to the TTF (dollars in thousands) for FY 2012 are shown in Table 5.2. VDOT’s FY 2012 budget totaled $4,763.6 million. Bond proceeds account for almost 24 percent of the budget, and Federal funding accounts for 21 percent. The remaining 55 percent of the budget comes primarily from state highway user fees and sales taxes dedicated to transportation.
Table 5.2 Projected Revenues to the Transportation Trust Fund (FY 2012)
Tax Mechanism Projected Revenue (in Thousands)
Motor Fuel Taxes $866,800
Priority Transportation Fund (PTF) $156,000
Motor Vehicle Sales and Use Tax $531,100
State Sales and Use Tax $501,600
Motor Vehicle License Fees $237,400
International Registration Plan $63,200
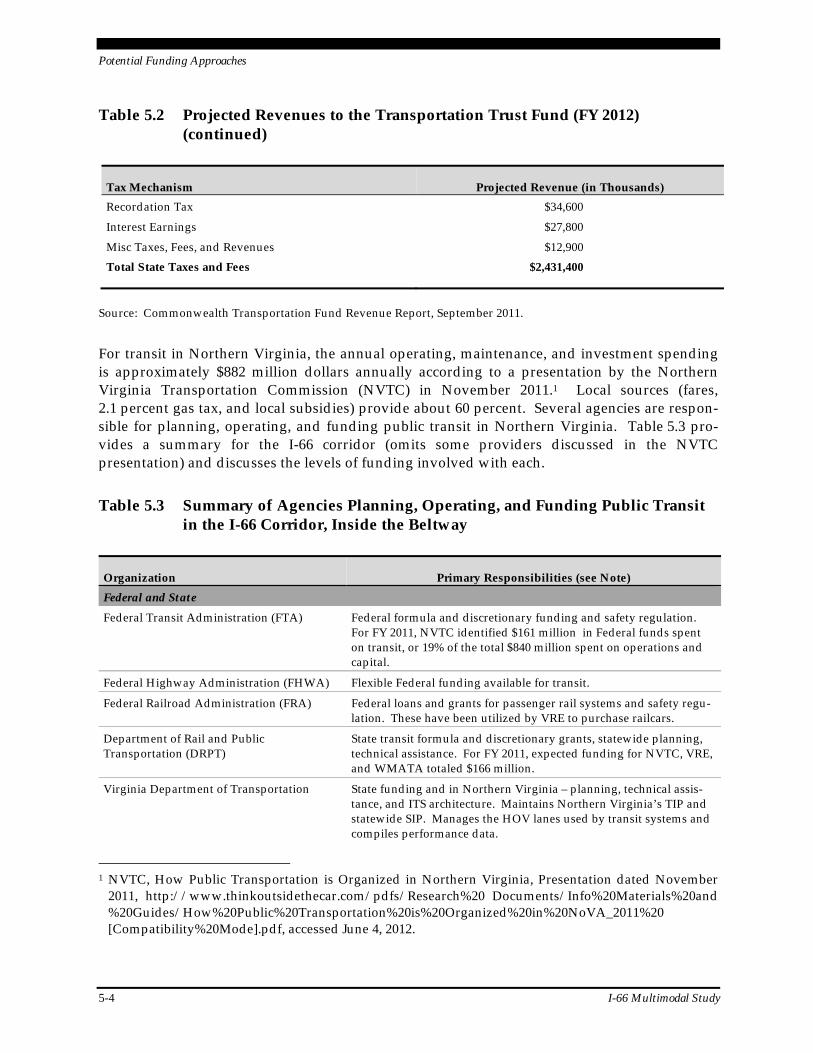
Potential Funding Approaches
5-4 I-66 Multimodal Study
Table 5.2 Projected Revenues to the Transportation Trust Fund (FY 2012) (continued)
Tax Mechanism Projected Revenue (in Thousands) Recordation Tax $34,600
Interest Earnings $27,800
Misc Taxes, Fees, and Revenues $12,900
Total State Taxes and Fees $2,431,400
Source: Commonwealth Transportation Fund Revenue Report, September 2011.
For transit in Northern Virginia, the annual operating, maintenance, and investment spending is approximately $882 million dollars annually according to a presentation by the Northern Virginia Transportation Commission (NVTC) in November 2011.1 Local sources (fares, 2.1 percent gas tax, and local subsidies) provide about 60 percent. Several agencies are respon-sible for planning, operating, and funding public transit in Northern Virginia. Table 5.3 pro-vides a summary for the I-66 corridor (omits some providers discussed in the NVTC presentation) and discusses the levels of funding involved with each.
Table 5.3 Summary of Agencies Planning, Operating, and Funding Public Transit in the I-66 Corridor, Inside the Beltway
Organization Primary Responsibilities (see Note) Federal and State
Federal Transit Administration (FTA) Federal formula and discretionary funding and safety regulation. For FY 2011, NVTC identified $161 million in Federal funds spent on transit, or 19% of the total $840 million spent on operations and capital.
Federal Highway Administration (FHWA) Flexible Federal funding available for transit.
Federal Railroad Administration (FRA) Federal loans and grants for passenger rail systems and safety regu-lation. These have been utilized by VRE to purchase railcars.
Department of Rail and Public Transportation (DRPT)
State transit formula and discretionary grants, statewide planning, technical assistance. For FY 2011, expected funding for NVTC, VRE, and WMATA totaled $166 million.
Virginia Department of Transportation State funding and in Northern Virginia – planning, technical assis-tance, and ITS architecture. Maintains Northern Virginia’s TIP and statewide SIP. Manages the HOV lanes used by transit systems and compiles performance data.
1 NVTC, How Public Transportation is Organized in Northern Virginia, Presentation dated November
2011, http://www.thinkoutsidethecar.com/pdfs/Research%20 Documents/Info%20Materials%20and %20Guides/How%20Public%20Transportation%20is%20Organized%20in%20NoVA_2011%20 [Compatibility%20Mode].pdf, accessed June 4, 2012.
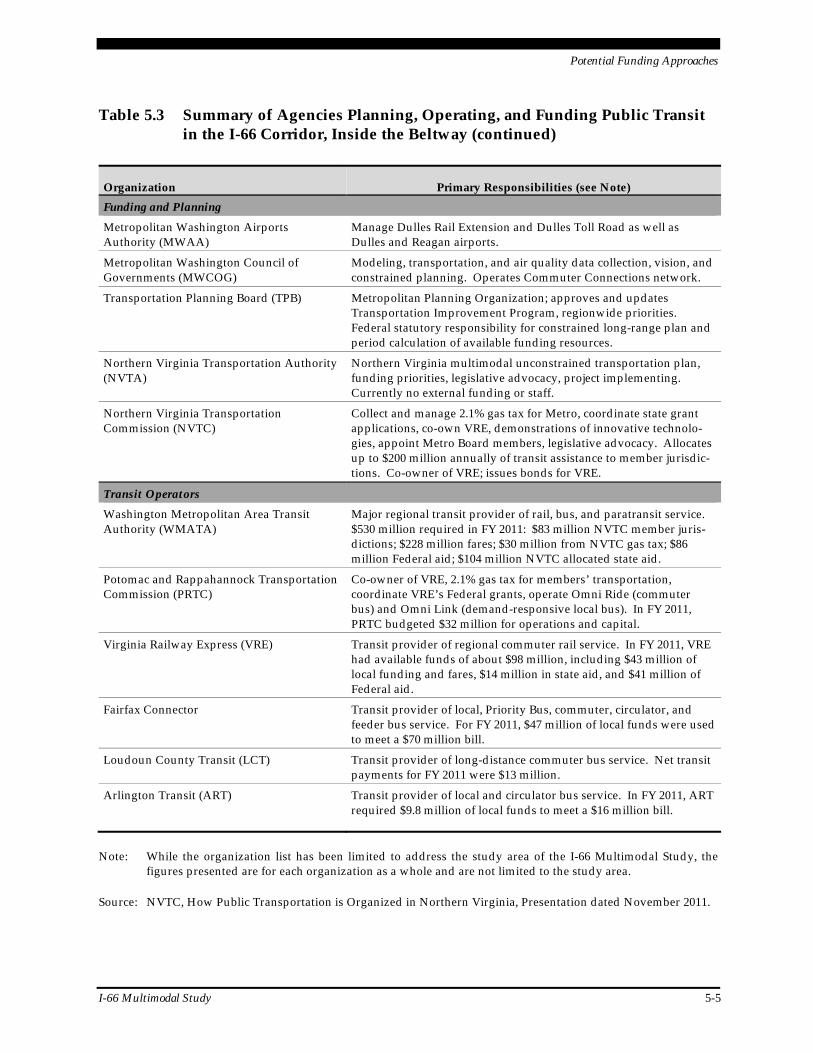
Potential Funding Approaches
I-66 Multimodal Study 5-5
Table 5.3 Summary of Agencies Planning, Operating, and Funding Public Transit in the I-66 Corridor, Inside the Beltway (continued)
Organization Primary Responsibilities (see Note) Funding and Planning
Metropolitan Washington Airports Authority (MWAA)
Manage Dulles Rail Extension and Dulles Toll Road as well as Dulles and Reagan airports.
Metropolitan Washington Council of Governments (MWCOG)
Modeling, transportation, and air quality data collection, vision, and constrained planning. Operates Commuter Connections network.
Transportation Planning Board (TPB) Metropolitan Planning Organization; approves and updates Transportation Improvement Program, regionwide priorities. Federal statutory responsibility for constrained long-range plan and period calculation of available funding resources.
Northern Virginia Transportation Authority (NVTA)
Northern Virginia multimodal unconstrained transportation plan, funding priorities, legislative advocacy, project implementing. Currently no external funding or staff.
Northern Virginia Transportation Commission (NVTC)
Collect and manage 2.1% gas tax for Metro, coordinate state grant applications, co-own VRE, demonstrations of innovative technolo-gies, appoint Metro Board members, legislative advocacy. Allocates up to $200 million annually of transit assistance to member jurisdic-tions. Co-owner of VRE; issues bonds for VRE.
Transit Operators Washington Metropolitan Area Transit Authority (WMATA)
Major regional transit provider of rail, bus, and paratransit service. $530 million required in FY 2011: $83 million NVTC member juris-dictions; $228 million fares; $30 million from NVTC gas tax; $86 million Federal aid; $104 million NVTC allocated state aid.
Potomac and Rappahannock Transportation Commission (PRTC)
Co-owner of VRE, 2.1% gas tax for members’ transportation, coordinate VRE’s Federal grants, operate Omni Ride (commuter bus) and Omni Link (demand-responsive local bus). In FY 2011, PRTC budgeted $32 million for operations and capital.
Virginia Railway Express (VRE) Transit provider of regional commuter rail service. In FY 2011, VRE had available funds of about $98 million, including $43 million of local funding and fares, $14 million in state aid, and $41 million of Federal aid.
Fairfax Connector Transit provider of local, Priority Bus, commuter, circulator, and feeder bus service. For FY 2011, $47 million of local funds were used to meet a $70 million bill.
Loudoun County Transit (LCT) Transit provider of long-distance commuter bus service. Net transit payments for FY 2011 were $13 million.
Arlington Transit (ART) Transit provider of local and circulator bus service. In FY 2011, ART required $9.8 million of local funds to meet a $16 million bill.
Note: While the organization list has been limited to address the study area of the I-66 Multimodal Study, the figures presented are for each organization as a whole and are not limited to the study area.
Source: NVTC, How Public Transportation is Organized in Northern Virginia, Presentation dated November 2011.
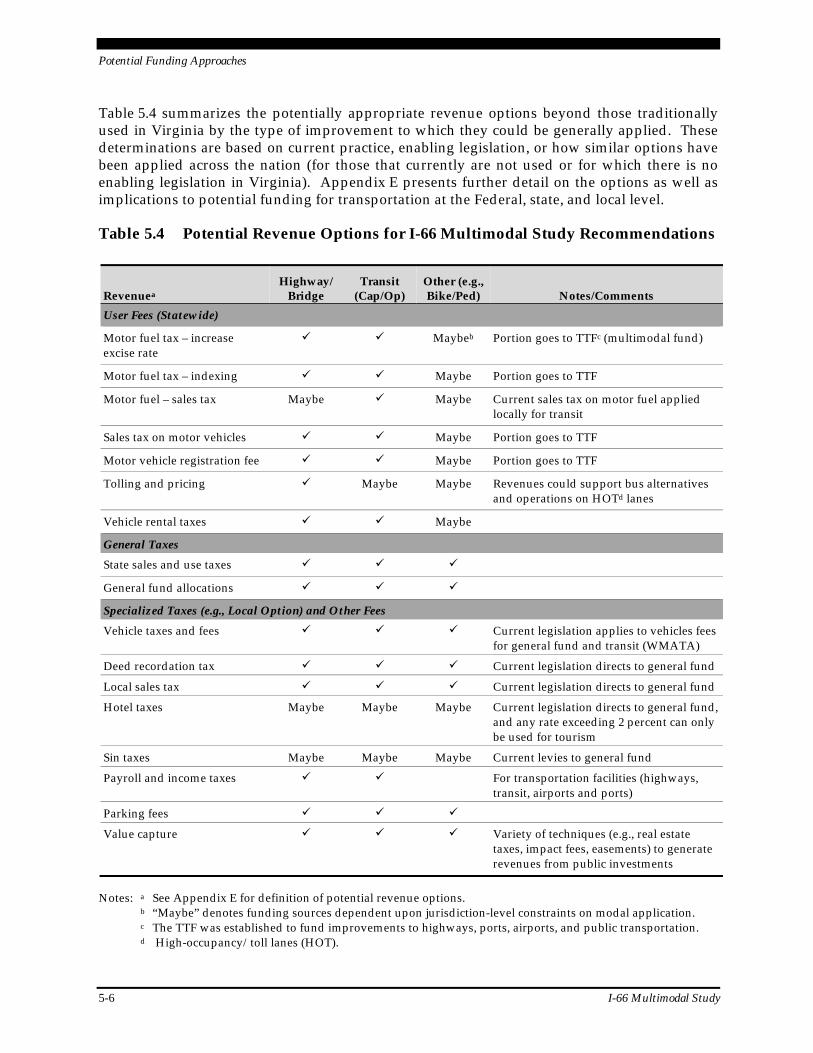
Potential Funding Approaches
5-6 I-66 Multimodal Study
Table 5.4 summarizes the potentially appropriate revenue options beyond those traditionally used in Virginia by the type of improvement to which they could be generally applied. These determinations are based on current practice, enabling legislation, or how similar options have been applied across the nation (for those that currently are not used or for which there is no enabling legislation in Virginia). Appendix E presents further detail on the options as well as implications to potential funding for transportation at the Federal, state, and local level.
Table 5.4 Potential Revenue Options for I-66 Multimodal Study Recommendations
Revenuea Highway/
Bridge Transit
(Cap/Op) Other (e.g., Bike/Ped) Notes/Comments
User Fees (Statewide)
Motor fuel tax – increase excise rate
Maybeb Portion goes to TTFc (multimodal fund)
Motor fuel tax – indexing Maybe Portion goes to TTF
Motor fuel – sales tax Maybe Maybe Current sales tax on motor fuel applied locally for transit
Sales tax on motor vehicles Maybe Portion goes to TTF
Motor vehicle registration fee Maybe Portion goes to TTF
Tolling and pricing Maybe Maybe Revenues could support bus alternatives and operations on HOTd lanes
Vehicle rental taxes Maybe
General Taxes State sales and use taxes
General fund allocations
Specialized Taxes (e.g., Local Option) and Other Fees
Vehicle taxes and fees Current legislation applies to vehicles fees for general fund and transit (WMATA)
Deed recordation tax Current legislation directs to general fund
Local sales tax Current legislation directs to general fund
Hotel taxes Maybe Maybe Maybe Current legislation directs to general fund, and any rate exceeding 2 percent can only be used for tourism
Sin taxes Maybe Maybe Maybe Current levies to general fund
Payroll and income taxes For transportation facilities (highways, transit, airports and ports)
Parking fees
Value capture Variety of techniques (e.g., real estate taxes, impact fees, easements) to generate revenues from public investments
Notes: a See Appendix E for definition of potential revenue options. b “Maybe” denotes funding sources dependent upon jurisdiction-level constraints on modal application. c The TTF was established to fund improvements to highways, ports, airports, and public transportation. d High-occupancy/toll lanes (HOT).
Potential Funding Approaches
I-66 Multimodal Study 5-7
5.2 Summary of Financing Options
Financing tools do not generate new revenue, but allow leveraging of existing resources to accelerate the construction of projects. Debt must be repaid over time, and the total cost increases by the discounted value of interest payments. The benefit of using financing tools comes through the public and economic benefits (e.g., travel time savings; reduced crashes; accessibility to jobs, suppliers, customers, and intermodal terminals; job creation; expanded tax base) realized by having the asset in place earlier. The use of these tools also recognizes the fact that the cost is being paid by future users over the life of the project. These benefits may be weighed against the higher costs of paying interest on the debt through a net present value analysis.
Local governments in Northern Virginia have traditionally used general obligation (G.O.) bonds to fund transportation improvements. Bonds are more frequently used throughout the nation for capital projects since they can be repaid over the life of the project, and are less appli-cable for regularly occurring maintenance or operating costs. G.O. bonds, as is the case in Fairfax County, may require voters’ approval through referendum, similar to other local option revenue sources.
In recent years, there has been an increase in private equity investment in surface transporta-tion through Public-Private Partnerships (P3), with financing packages that combine public and private debt, equity, and public funding.
Appendix E presents some of the common project finance techniques and project delivery tools used by DOTs and transit agencies to help states advance their transportation priorities and that may be considered for the I-66 Multimodal Study recommendations.
5.3 Evaluating Funding Options
The transportation finance approaches represent a range of options to support transportation investment which may be implemented by governing bodies at the local, state, and Federal level. Together these approaches are intended to present a broad financial picture for Virginia when considering potential funding sources and financial techniques to support implementa-tion of the I-66 Multimodal Study recommendations.
However, not all of the transportation funding and finance approaches available may be appropriate for use in Virginia. The implementation of some of the proposed revenue sources and financing tools may require legislative action, or the implementation of policies to ensure the use of these new sources for transportation needs. At the local level, some of the local option revenue sources that already are in place are used to support other local public services, and dedicating or allocating a higher share of existing resources to transportation needs means that their availability for other important public services (which also may have a growing need for funding) will be reduced. Moreover, many of the funding and financing strategies at the Federal level have been implemented, and the eligibility of proposed recommendations should be evaluated in more detail. With the next surface transportation authorization, some of these uncertainties will be resolved; however, others are likely to remain, specifically determining a
Potential Funding Approaches
5-8 I-66 Multimodal Study
long-term sustainable revenue source for the Federal Highway Trust Fund (HTF).2 Some of the ideas that have been discussed include the consolidation of existing Federal-aid programs, the consideration of performance measurements for funding distribution, a multimodal approach to transportation investment in place of the current “funding silos,” and potential of national freight fees (e.g., container fees; customs revenues) that could support investment in infra-structure to improve freight mobility and connectivity.
The next section discusses a set of criteria developed to rank the feasibility of various revenue options for funding the I-66 Multimodal Study recommendations.
Evaluating Potential Options
It is important to have a clear understanding of the rational policy basis for each potential funding strategy. Ideally, there should be a clear relationship between the value received (or the impacts created) and the amount paid.
When considering potential revenue sources for transportation, there are common criteria that may be employed when evaluating the advantages and disadvantages of potential sources of revenues. These criteria may be used as a guide when determining the feasibility of these sources for application in Virginia:
• Yield – This criterion refers to the overall magnitude of revenues a funding source is capa-ble of generating. Strategies are given a “high” rating if they are capable of producing large amounts of revenue. In particular, fuel taxes have been the mainstay of transportation rev-enues for decades, receiving generally a “high” rating related to yield. Sources or strategies are given a “low” rating if they are inherently short term or low yield. A revenue source like an impact fee would have a “low” yield, given its narrow tax base and the fact that it is a onetime charge.
• Predictability/Reliability – This criterion refers to how reliable or predictable is the yield of a revenue source over time. A funding strategy with a “high” rating produces revenues that are predictably sustained over time, whereas a “low” rating refers to funding sources whose revenue generation potential over time is more uncertain. For example, motor fuel taxes may not be reliable over time because, if not indexed, their contribution degrades with both inflation and lower consumption as vehicles become more fuel efficient. If they are indexed, the inflation impact is removed, and revenues are only impacted by lower demand.
• Stability – This criterion refers to whether a revenue source is subject to uncertain revenue fluctuations that may impact an agency or project sponsor to manage resources. Most
2 The Federal Highway Trust Fund (HTF) was created in 1956, and is funded through deposit of the
Federal motor fuel taxes (18.4 cpg excise tax on gasoline and 24.4 cpg on diesel) and other vehicle user fees. It is the primary source of funding for the Federal-Aid Highway Program (FAHP) and FTA programs.
Potential Funding Approaches
I-66 Multimodal Study 5-9
revenue sources, in general, are impacted during economic slowdowns and recessionary periods, and they recover as the economic conditions improve.
• Synergy with Growth and Demand – This criterion refers to the extent that a strategy pro-vides clear pricing signals that encourage users and providers to minimize unproductive travel and maximize economic growth. Therefore, strategies with “high” synergy are those that help to make the marginal prices of goods and services reflect their true costs. Strate-gies with “low” synergy are those that distort the market by collecting fees that are unre-lated to the services they help fund.
• Flexibility – Because the proposed I-66 corridor improvements will be multimodal, the funding strategies under consideration should be flexible in that they can be applied to dif-ferent types of improvements and modes.
Table 5.5 summarizes the scoring of the revenue options for the I-66 Multimodal Study recom-mendations. Revenue mechanisms with high yields and high stability/predictability are gen-erally appropriate for capital spending and could potentially be leveraged through bonding or used as a repayment source for other financing tools. Revenue sources with lower yields, high to medium predictability, and that can be collected annually may be used to support ongoing expenses such as operations and maintenance. Revenue sources with sunset provisions (e.g., five years for local income taxes) or one-time payments (e.g., impact fees) are not appropriate for ongoing operating and maintenances expenses, but can provide funding for capital improvements. Note that financing tools are not being evaluated against these criteria, and that the key to implementation is to have a revenue source in place for repayment.
As shown in Table 5.6, which defines the ratings for each criterion, revenue options are pro-vided a rating of low, medium, or high. The ratings are intended to provide a qualitative assessment of the revenue options to inform decision-makers about the pros and cons of implementation. The ratings are subjective, and not intended to support or dismiss any of the revenue options without further analysis.
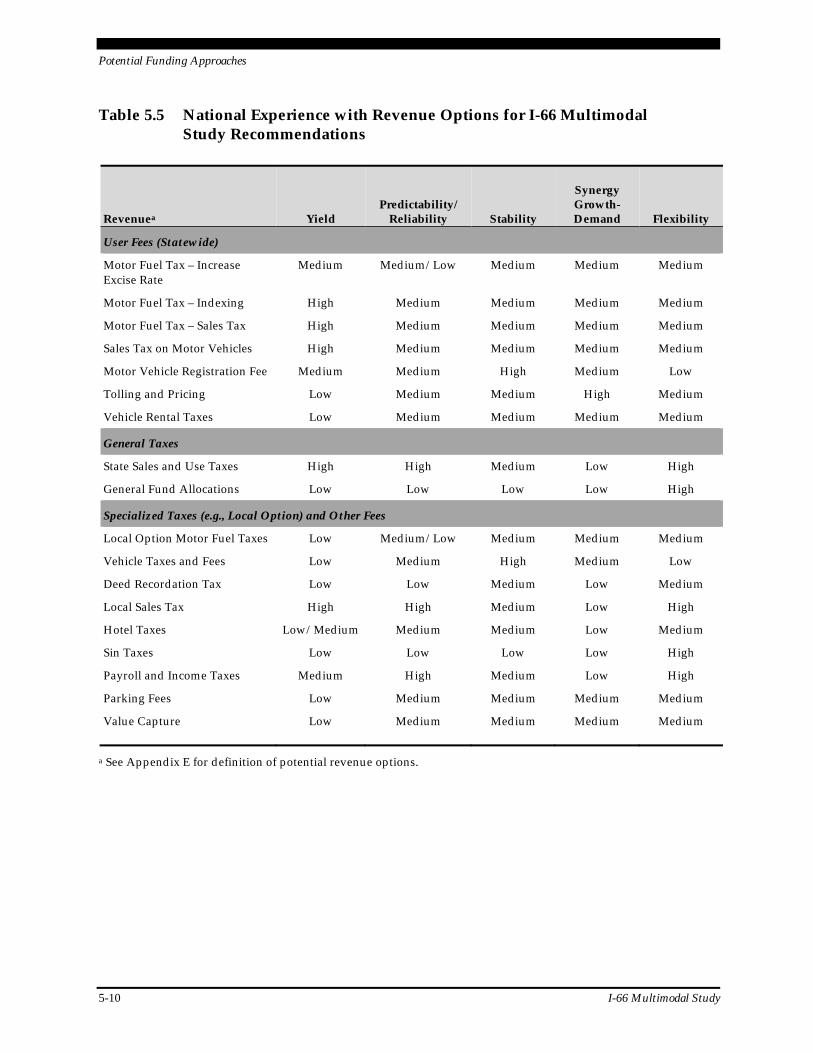
Potential Funding Approaches
5-10 I-66 Multimodal Study
Table 5.5 National Experience with Revenue Options for I-66 Multimodal Study Recommendations
Revenuea Yield Predictability/
Reliability Stability
Synergy Growth-Demand Flexibility
User Fees (Statewide)
Motor Fuel Tax – Increase Excise Rate
Medium Medium/Low Medium Medium Medium
Motor Fuel Tax – Indexing High Medium Medium Medium Medium
Motor Fuel Tax – Sales Tax High Medium Medium Medium Medium
Sales Tax on Motor Vehicles High Medium Medium Medium Medium
Motor Vehicle Registration Fee Medium Medium High Medium Low
Tolling and Pricing Low Medium Medium High Medium
Vehicle Rental Taxes Low Medium Medium Medium Medium
General Taxes
State Sales and Use Taxes High High Medium Low High
General Fund Allocations Low Low Low Low High
Specialized Taxes (e.g., Local Option) and Other Fees
Local Option Motor Fuel Taxes Low Medium/Low Medium Medium Medium
Vehicle Taxes and Fees Low Medium High Medium Low
Deed Recordation Tax Low Low Medium Low Medium
Local Sales Tax High High Medium Low High
Hotel Taxes Low/Medium Medium Medium Low Medium
Sin Taxes Low Low Low Low High
Payroll and Income Taxes Medium High Medium Low High
Parking Fees Low Medium Medium Medium Medium
Value Capture Low Medium Medium Medium Medium
a See Appendix E for definition of potential revenue options.
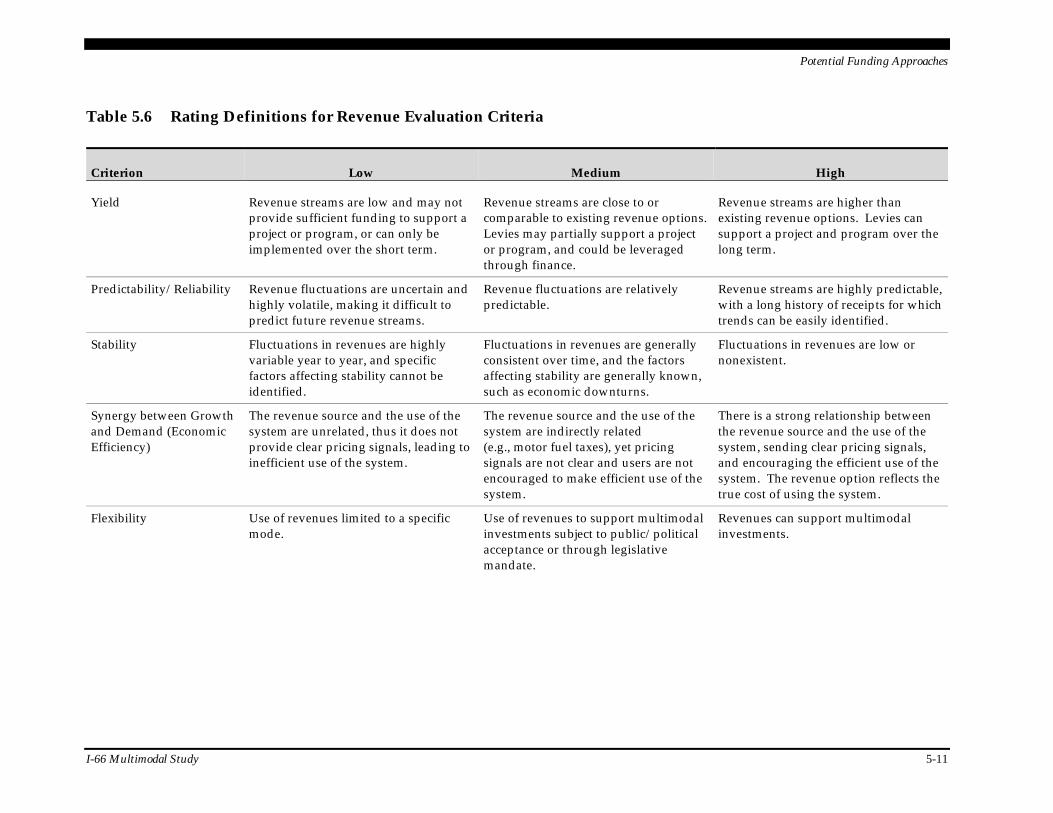
Potential Funding Approaches
I-66 Multimodal Study 5-11
Table 5.6 Rating Definitions for Revenue Evaluation Criteria
Criterion Low Medium High
Yield Revenue streams are low and may not provide sufficient funding to support a project or program, or can only be implemented over the short term.
Revenue streams are close to or comparable to existing revenue options. Levies may partially support a project or program, and could be leveraged through finance.
Revenue streams are higher than existing revenue options. Levies can support a project and program over the long term.
Predictability/Reliability Revenue fluctuations are uncertain and highly volatile, making it difficult to predict future revenue streams.
Revenue fluctuations are relatively predictable.
Revenue streams are highly predictable, with a long history of receipts for which trends can be easily identified.
Stability Fluctuations in revenues are highly variable year to year, and specific factors affecting stability cannot be identified.
Fluctuations in revenues are generally consistent over time, and the factors affecting stability are generally known, such as economic downturns.
Fluctuations in revenues are low or nonexistent.
Synergy between Growth and Demand (Economic Efficiency)
The revenue source and the use of the system are unrelated, thus it does not provide clear pricing signals, leading to inefficient use of the system.
The revenue source and the use of the system are indirectly related (e.g., motor fuel taxes), yet pricing signals are not clear and users are not encouraged to make efficient use of the system.
There is a strong relationship between the revenue source and the use of the system, sending clear pricing signals, and encouraging the efficient use of the system. The revenue option reflects the true cost of using the system.
Flexibility Use of revenues limited to a specific mode.
Use of revenues to support multimodal investments subject to public/political acceptance or through legislative mandate.
Revenues can support multimodal investments.

Potential Funding Approaches
I-66 Multimodal Study 5-12
This page intentionally left blank.


![Towards Interactive Multimodal Music Transcriptiongrfia.dlsi.ua.es/repositori/grfia/pubs/371/Thesis.pdfPreface ‘[...] who was six years old on 6/6/66 [...]’ With such particular](https://img.pdfslide.net/doc/110x75/5accb6567f8b9a6a678c9b77/towards-interactive-multimodal-music-who-was-six-years-old-on-6666-.jpg)