Embed Size (px)
Citation preview
I-70 Dedicated Truck Lanes
Feasibility Study
MAASTO
Cincinnati, Ohio
July 22, 2011
www.i70dtl.org

Today’s presentation
• History of the project
• Findings Phases 1 and 2
• Next steps
• Decisions, directions, action plans
History of the Project
2005 - CEOs meeting at INDOT
Missouri, Illinois, Indiana, Ohio and others
Shared congestion problems
Interest in evaluating concept of DTLs
2007 - Indiana led 4-state coalition
application for FHWA “Corridor of the
Future” designation
One of 6 corridors designated
Received funds under separate application

History of the Project
Jan 2009: 4 states signed Development Agreement with
USDOT
MOU under the COF program authorized
“..study, plan, develop, finance, construct, operate and maintain the I-70 Corridor as a unified facility.”
Spring 2009: I-70 Study initiated Phase 1: Evaluate big picture/business case for
DLTs
Phase 2: Evaluate and strengthen business case findings from Phase 1, and recommendations to move DTL concept to reality
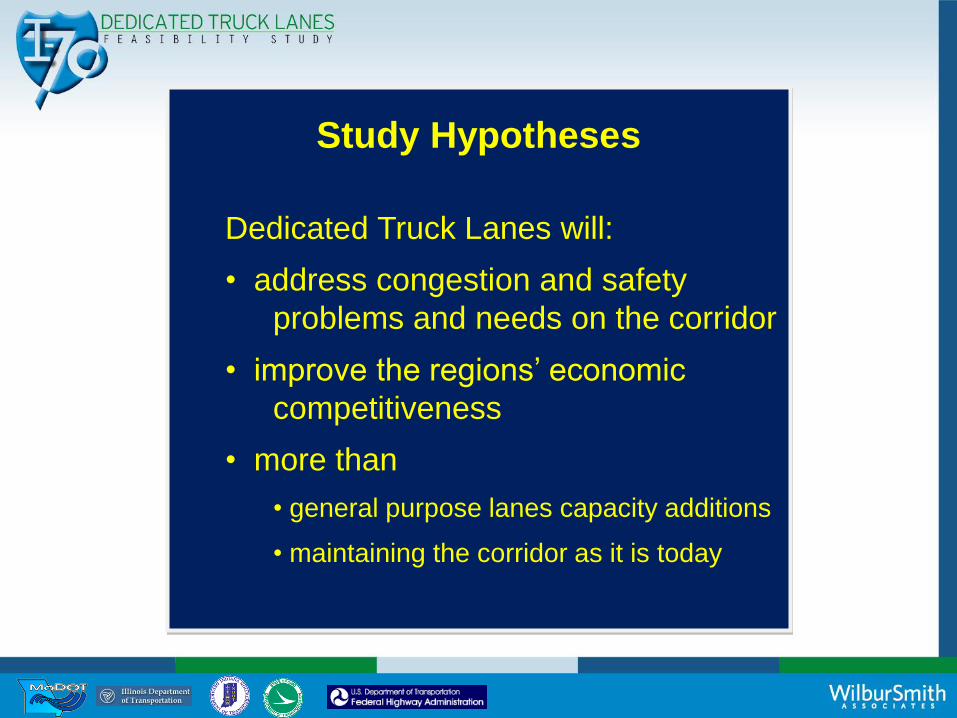
Study Hypotheses
Dedicated Truck Lanes will:
• address congestion and safety
problems and needs on the corridor
• improve the regions‟ economic
competitiveness
• more than
• general purpose lanes capacity additions
• maintaining the corridor as it is today
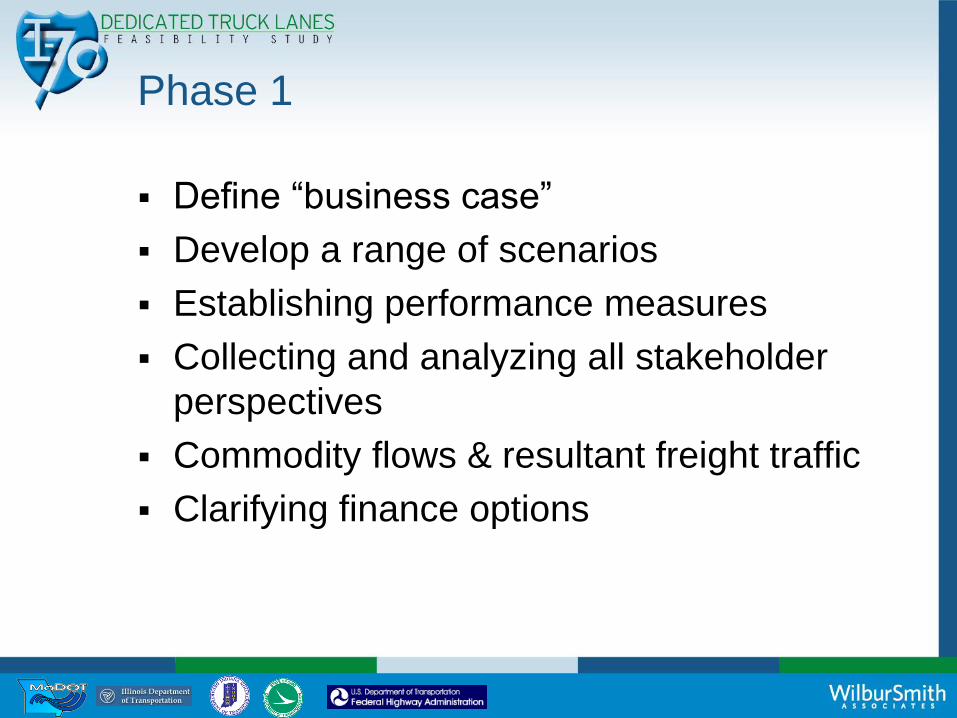
Phase 1
Define “business case”
Develop a range of scenarios
Establishing performance measures
Collecting and analyzing all stakeholder
perspectives
Commodity flows & resultant freight traffic
Clarifying finance options

Phase 1 = Business Case
The need and demand for dedicated truck lanes
Whether state and federal investments in
dedicated truck lanes are justified
Cost to Construct, Operate and Maintain
< Return on Investment + Cost Avoidance
(CC + CO + CM) ≤ (ROI + CA)

Phase 1 Evaluation criteria1. Safety
2. Freight Movement Productivity
3. Cost and Financial Feasibility
4. Economic Benefit
5. Stakeholder Acceptance
6. Technology Integration / Security
7. Pavement Life Cycle
8. Other Incentives and Amenities
9. Environmental Impact
10. Political / Legislative
11. Intermodal Connectivity

Phase 1 Findings
Daily Regional I-70 Truck Trips
by Distance (2030)
0
5,000
10,000
15,000
20,000
25,000
30,000
35,000
40,000
< 100 < 200 < 300 < 400 < 500 < 600 < 700 <= 800
Dail
y R
eg
ion
al T
ruc
ks
Miles
Trip Purpose CV’s on
I-70 Study Area
Trip Purpose Percent
Local pickups and
deliveries
(less than 100 miles)
24%
Regional
(100 to 499 miles)
33%
Inter-regional
(500 to 999 miles)
28%
National
(1,000 or more miles)
15%
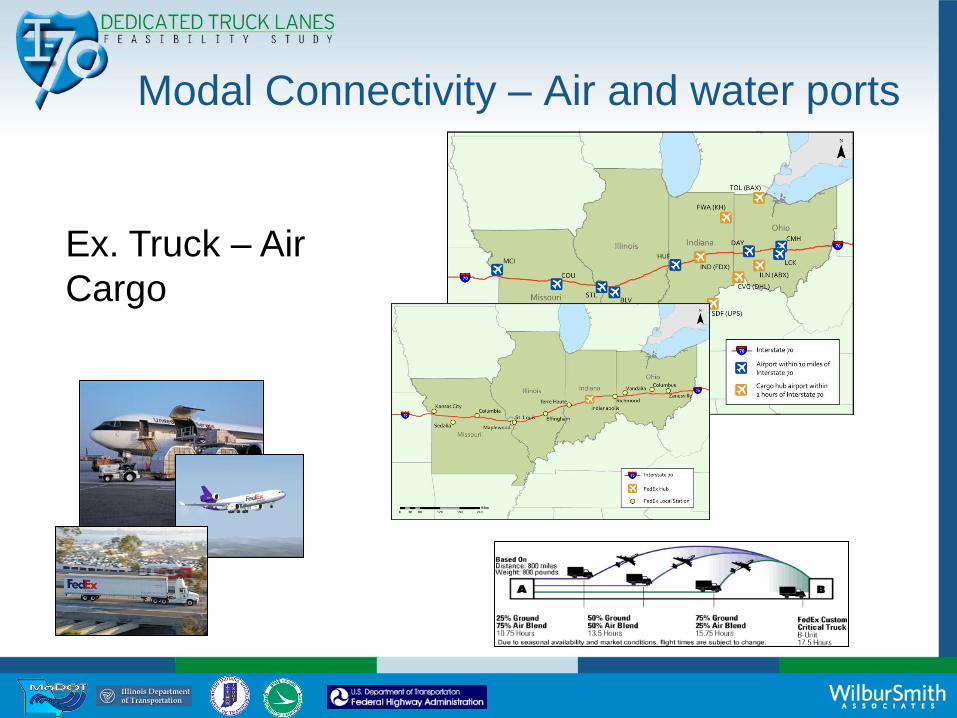
Modal Connectivity – Air and water ports
Ex. Truck – Air
Cargo

Truck to Rail Intermodal Market
Truck to rail
connectivity
at corridor
terminus
All corridor service on
trucks

Environmental Red Flag Assessment
Are there corridor-wide environmental benefits or
concerns to constructing DTLs?
Air quality and carbon emissions footprint
Noise
Environmental Justice
Secondary and cumulative impacts
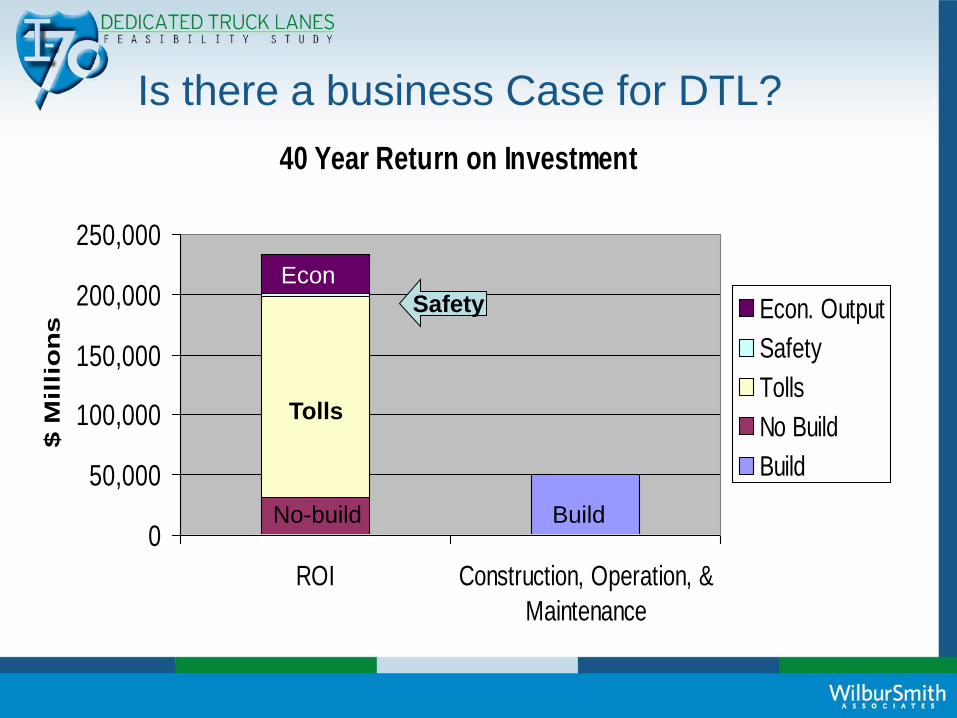
Is there a business Case for DTL?
40 Year Return on Investment
0
50,000
100,000
150,000
200,000
250,000
ROI Construction, Operation, &
Maintenance
$ M
illi
on
s
Econ. Output
Safety
Tolls
No Build
Build
Safety
Tolls
BuildNo-build
Econ

Phase 1 Findings
$50.0$32.0
$10.6$2.5
$32.3
0
20
40
60
80
100
CA & ROI DTL Total Costs (build, operate, maintain)
Bill
ion
s40 Year Cost Avoidance & Return on Investment
(2015 - 2055) in 2010 Dollars
Build Costs & Operations
CA (as is costs w/o DTLs)
Optional Toll Revenues
Safety Cost Reduction ($2.5 - $3.3 Billion)
Increased Economic Output (Benefits 2011-2030)
Business Case for DTLs on I-70
(CC + CO + CM) ≤ (ROI + CA)
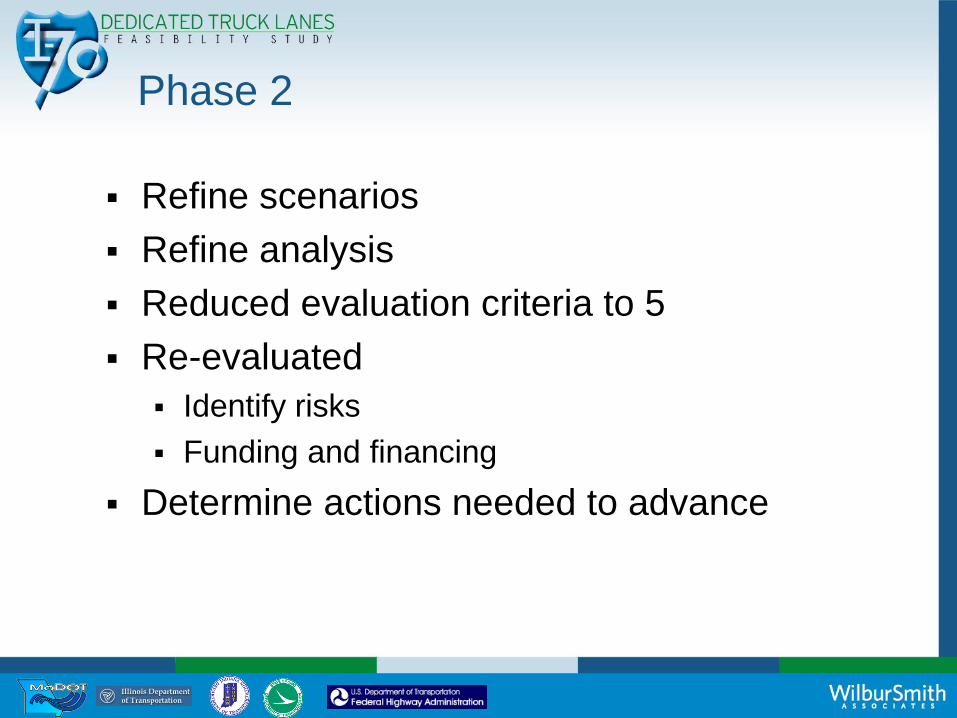
Phase 2
Refine scenarios
Refine analysis
Reduced evaluation criteria to 5
Re-evaluated
Identify risks
Funding and financing
Determine actions needed to advance
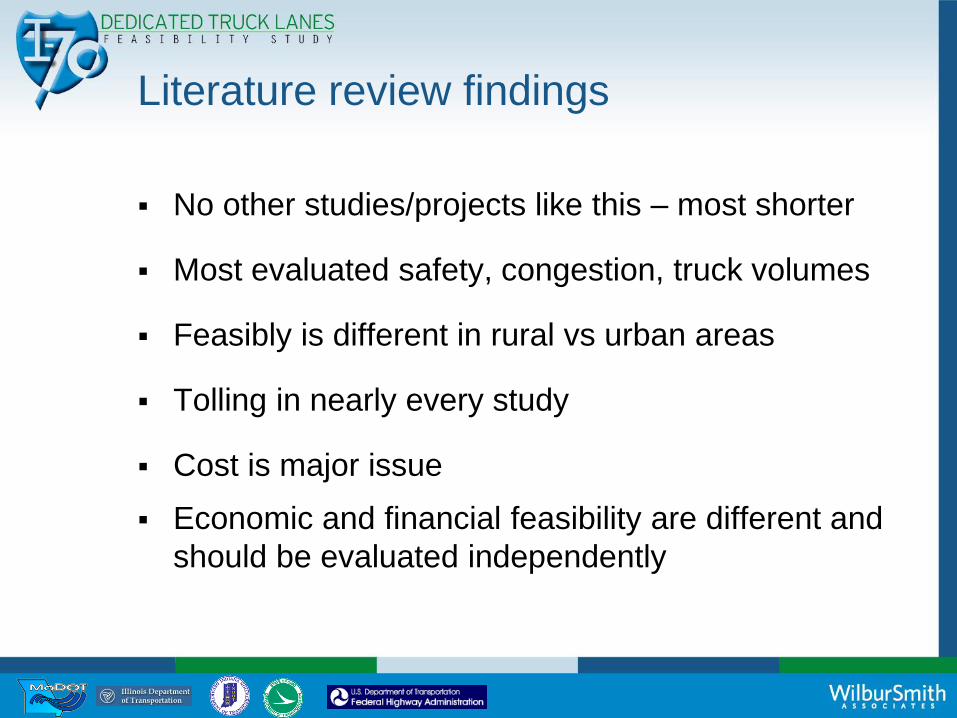
Literature review findings
No other studies/projects like this – most shorter
Most evaluated safety, congestion, truck volumes
Feasibly is different in rural vs urban areas
Tolling in nearly every study
Cost is major issue
Economic and financial feasibility are different and
should be evaluated independently
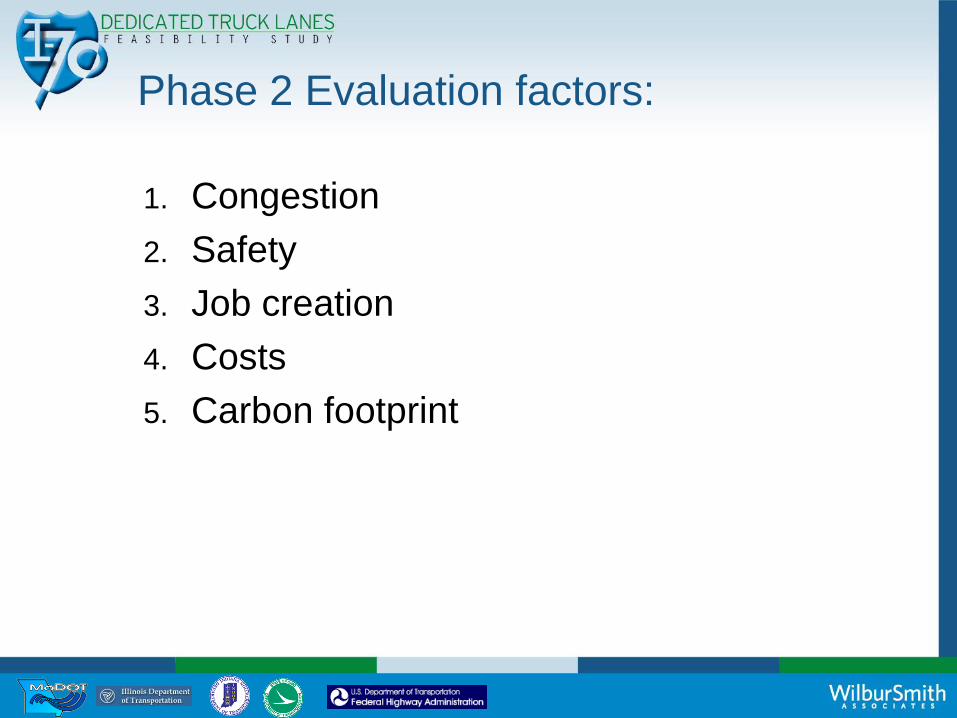
Phase 2 Evaluation factors:
1. Congestion
2. Safety
3. Job creation
4. Costs
5. Carbon footprint

OverviewScenarios Evaluated in Phase 2
Scenario 1 2 3 4
Concept No-
Builda Buildb
Build Four DTL's
Build DTL's (4 lanes rural,
2 lanes urban)
A B
Add capacity to general purpose lanes X X
Ru
ral
Se
ctio
ns
Number of DTL Lanes in each direction 2 2 2
Truck interchanges
(grade separated/slip ramps ) 24 24 24
Physically separate the lanes with barriers and medians X X X
Urb
an
Se
ctio
ns
Number of DTL Lanes in each direction 2 2 1
Number of separated truck interchanges 18 18 10
Physically separate the lanes with concrete barriers and shoulders X X
HPV Staging Area
X X
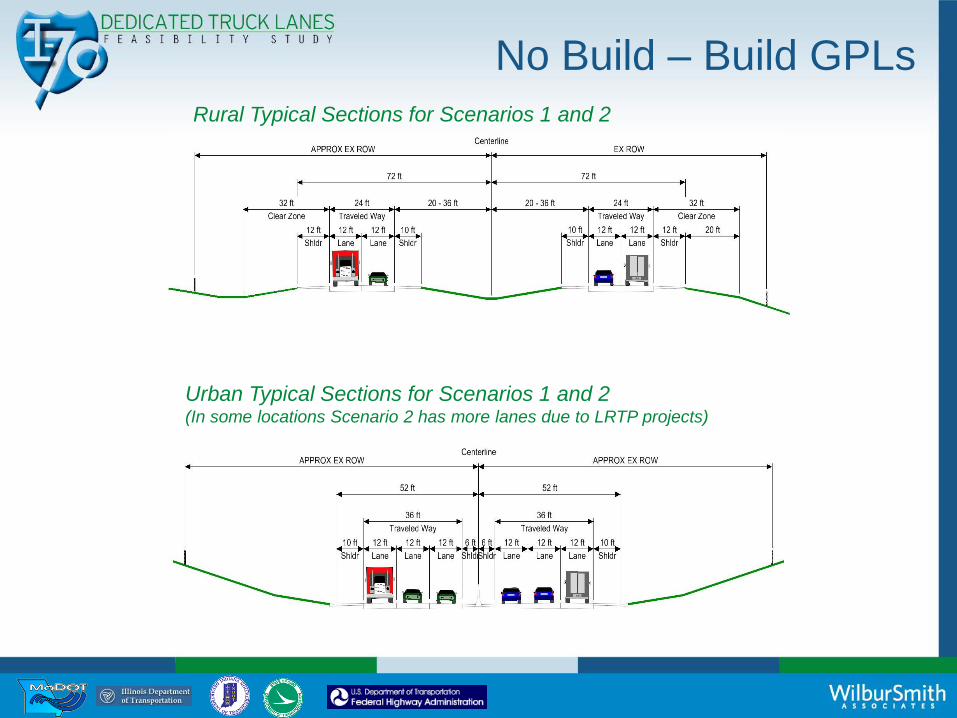
Rural Typical Sections for Scenarios 1 and 2
Urban Typical Sections for Scenarios 1 and 2(In some locations Scenario 2 has more lanes due to LRTP projects)
No Build – Build GPLs

Urban Typical Sections for Scenario 3
Rural Typical Sections for Scenarios 3 and 4(Also used for HPV configuration analysis)
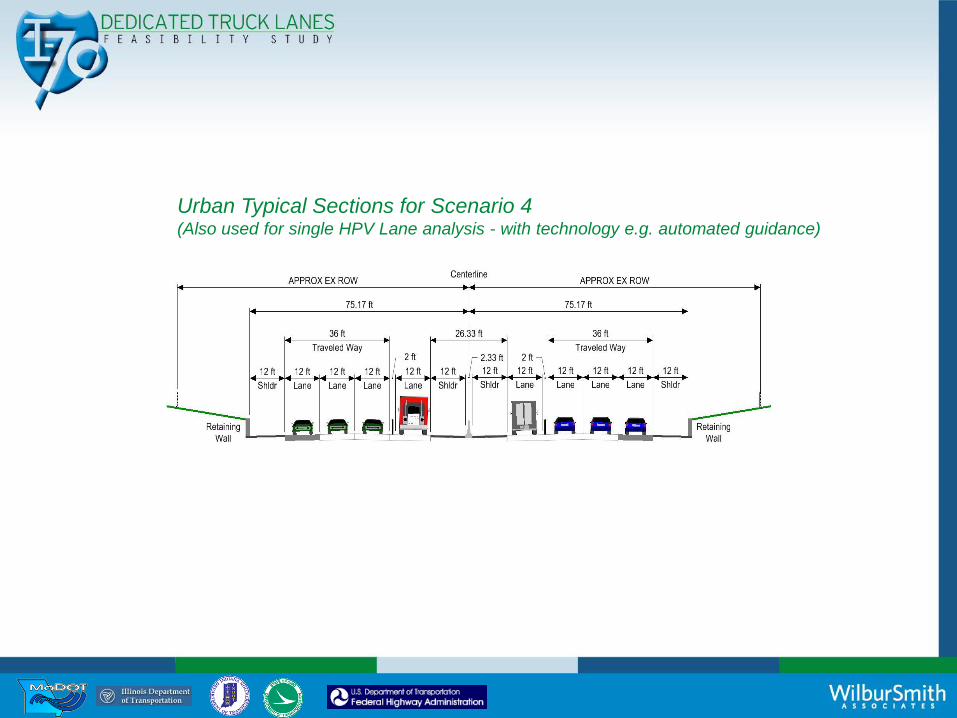
Urban Typical Sections for Scenario 4(Also used for single HPV Lane analysis - with technology e.g. automated guidance)

Corridor Traffic, Congestion
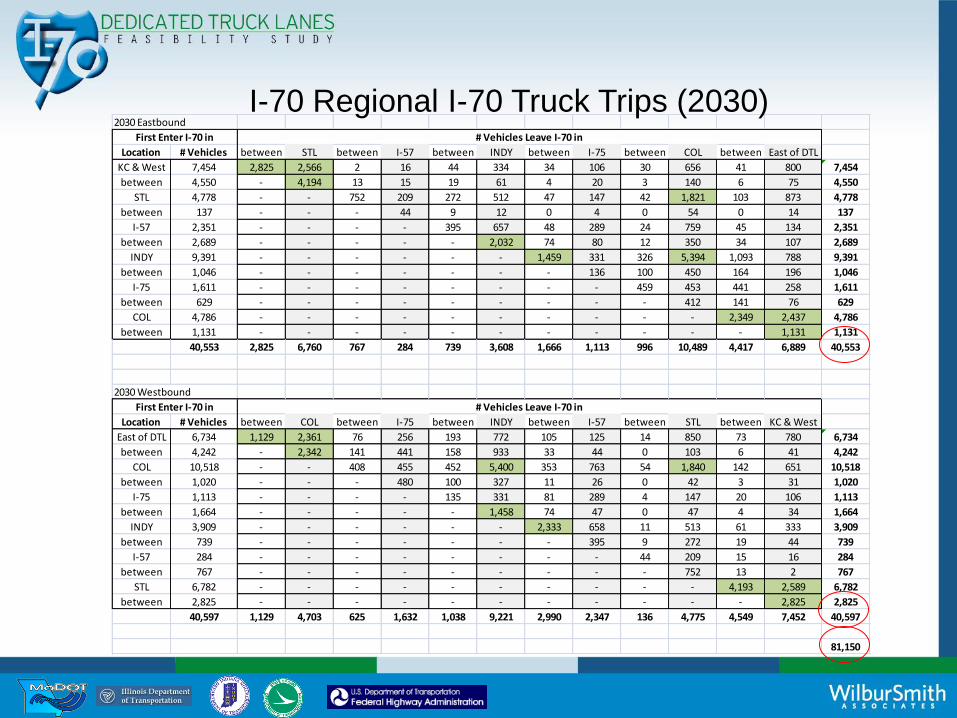
2030 Eastbound
Location # Vehicles between STL between I-57 between INDY between I-75 between COL between East of DTL
KC & West 7,454 2,825 2,566 2 16 44 334 34 106 30 656 41 800 7,454
between 4,550 - 4,194 13 15 19 61 4 20 3 140 6 75 4,550
STL 4,778 - - 752 209 272 512 47 147 42 1,821 103 873 4,778
between 137 - - - 44 9 12 0 4 0 54 0 14 137
I-57 2,351 - - - - 395 657 48 289 24 759 45 134 2,351
between 2,689 - - - - - 2,032 74 80 12 350 34 107 2,689
INDY 9,391 - - - - - - 1,459 331 326 5,394 1,093 788 9,391
between 1,046 - - - - - - - 136 100 450 164 196 1,046
I-75 1,611 - - - - - - - - 459 453 441 258 1,611
between 629 - - - - - - - - - 412 141 76 629
COL 4,786 - - - - - - - - - - 2,349 2,437 4,786
between 1,131 - - - - - - - - - - - 1,131 1,131
40,553 2,825 6,760 767 284 739 3,608 1,666 1,113 996 10,489 4,417 6,889 40,553
2030 Westbound
Location # Vehicles between COL between I-75 between INDY between I-57 between STL between KC & West
East of DTL 6,734 1,129 2,361 76 256 193 772 105 125 14 850 73 780 6,734
between 4,242 - 2,342 141 441 158 933 33 44 0 103 6 41 4,242
COL 10,518 - - 408 455 452 5,400 353 763 54 1,840 142 651 10,518
between 1,020 - - - 480 100 327 11 26 0 42 3 31 1,020
I-75 1,113 - - - - 135 331 81 289 4 147 20 106 1,113
between 1,664 - - - - - 1,458 74 47 0 47 4 34 1,664
INDY 3,909 - - - - - - 2,333 658 11 513 61 333 3,909
between 739 - - - - - - - 395 9 272 19 44 739
I-57 284 - - - - - - - - 44 209 15 16 284
between 767 - - - - - - - - - 752 13 2 767
STL 6,782 - - - - - - - - - - 4,193 2,589 6,782
between 2,825 - - - - - - - - - - - 2,825 2,825
40,597 1,129 4,703 625 1,632 1,038 9,221 2,990 2,347 136 4,775 4,549 7,452 40,597
81,150
First Enter I-70 in # Vehicles Leave I-70 in
First Enter I-70 in # Vehicles Leave I-70 in
I-70 Regional I-70 Truck Trips (2030)

Total Regional I-70 Truck Growth - (2015 to 2030)
Truck Market
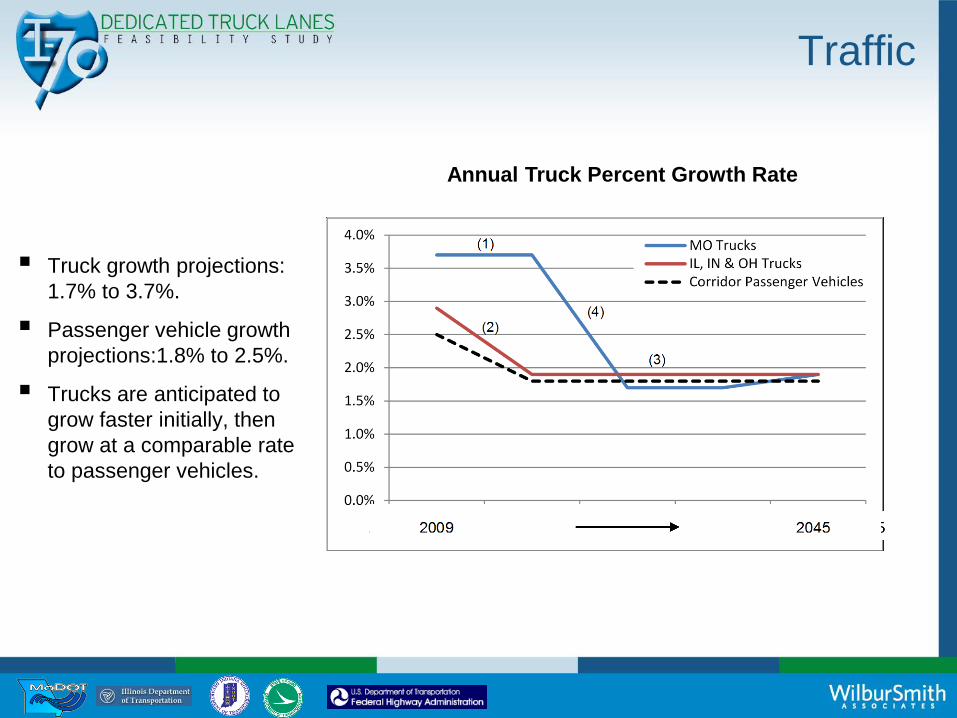
Truck growth projections:
1.7% to 3.7%.
Passenger vehicle growth
projections:1.8% to 2.5%.
Trucks are anticipated to
grow faster initially, then
grow at a comparable rate
to passenger vehicles.
Annual Truck Percent Growth Rate
Traffic
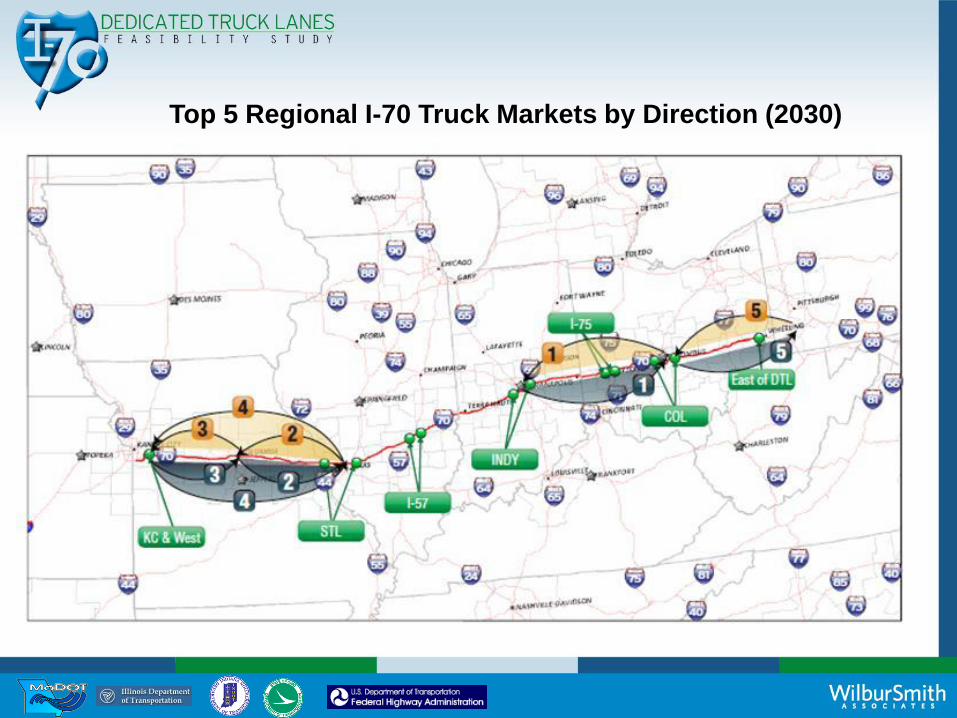
Top 5 Regional I-70 Truck Markets by Direction (2030)

2030 Model ResultsTrips First Entering I-70 in KC & West (EB Direction)
I-70 Dedicated Truck Lanes Feasibility Study Phase 2IN 104585 / Market Assessment Figures.ppt / 11-24-10
7,454 Trips
First Enter
I-70 in KC
& West

2030 Model ResultsTrips First Entering I-70 in STL (EB Direction)
I-70 Dedicated Truck Lanes Feasibility Study Phase 2IN 104585 / Market Assessment Figures.ppt / 11-24-10
4,778
Trips
First
Enter
I-70 in
STL
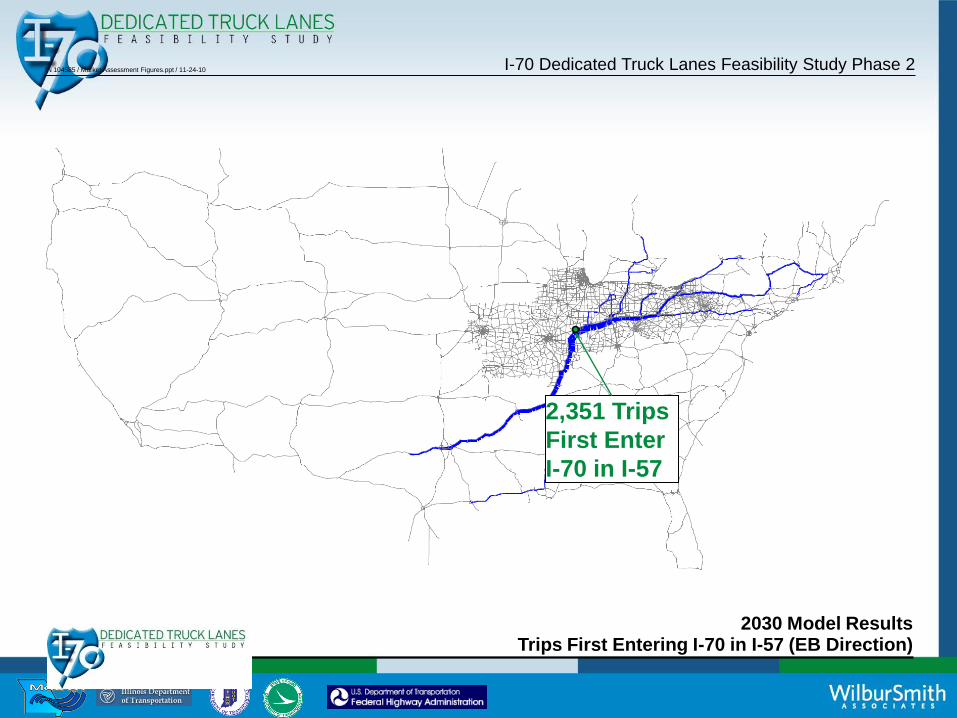
2030 Model ResultsTrips First Entering I-70 in I-57 (EB Direction)
I-70 Dedicated Truck Lanes Feasibility Study Phase 2IN 104585 / Market Assessment Figures.ppt / 11-24-10
2,351 Trips
First Enter
I-70 in I-57
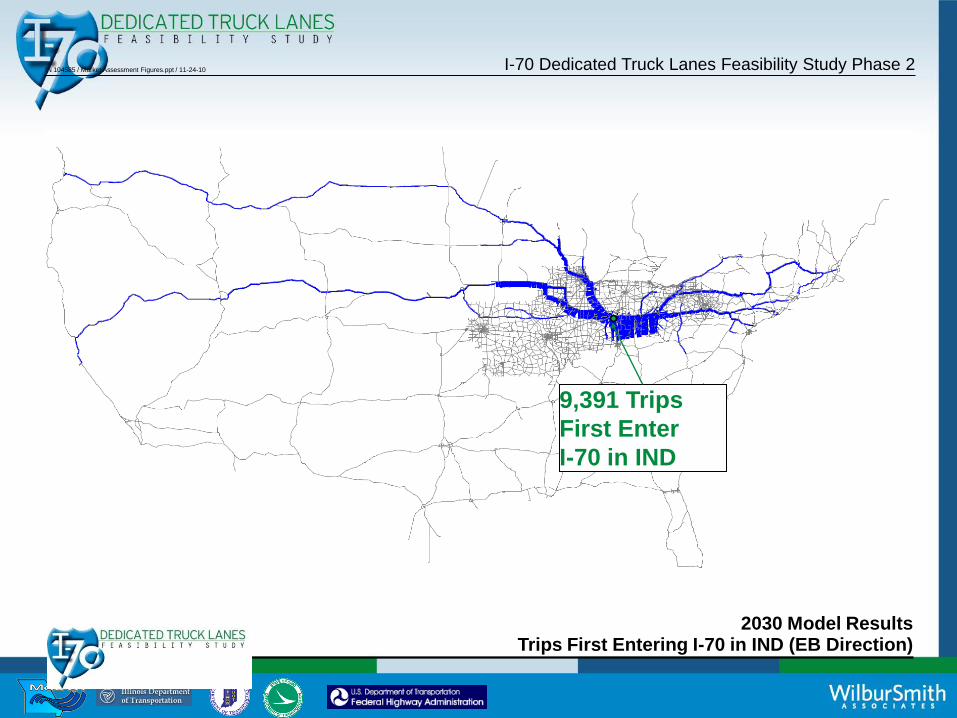
2030 Model ResultsTrips First Entering I-70 in IND (EB Direction)
I-70 Dedicated Truck Lanes Feasibility Study Phase 2IN 104585 / Market Assessment Figures.ppt / 11-24-10
9,391 Trips
First Enter
I-70 in IND
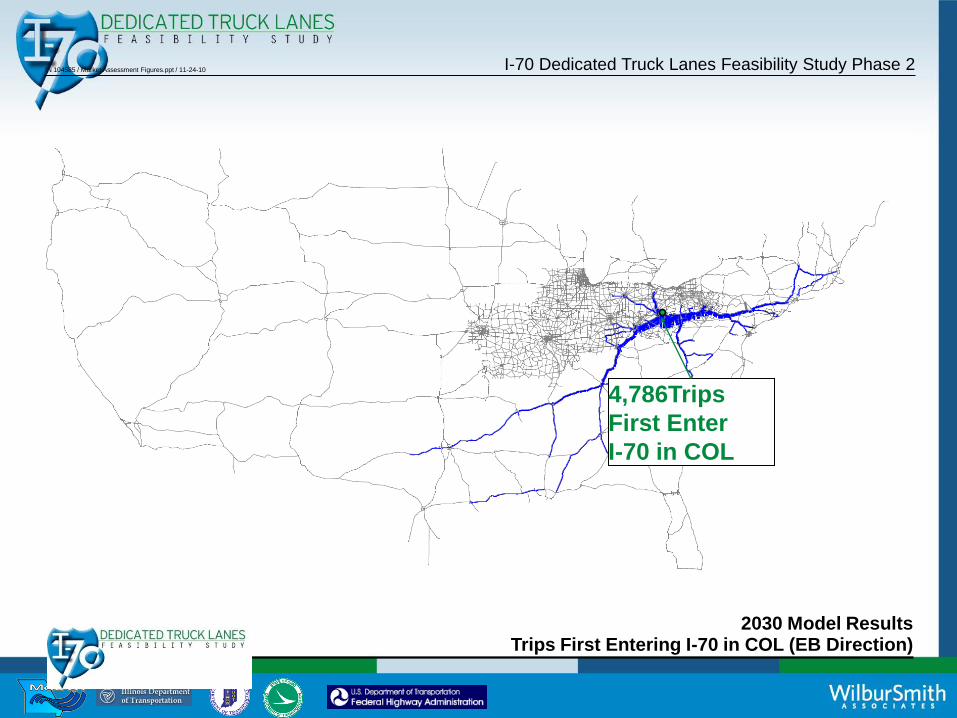
2030 Model ResultsTrips First Entering I-70 in COL (EB Direction)
I-70 Dedicated Truck Lanes Feasibility Study Phase 2IN 104585 / Market Assessment Figures.ppt / 11-24-10
4,786Trips
First Enter
I-70 in COL
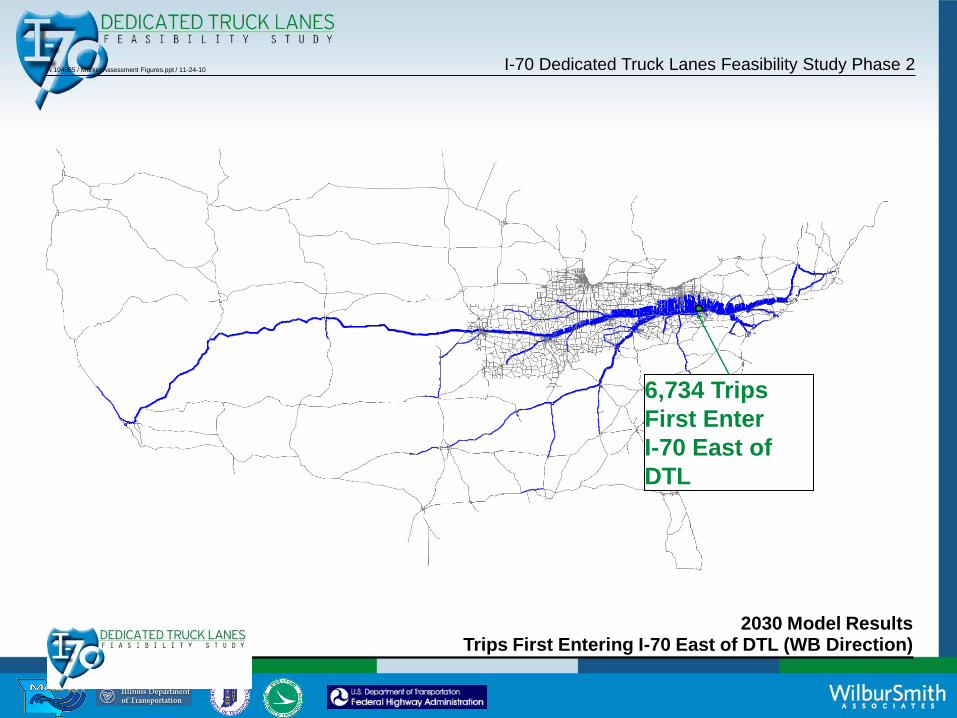
2030 Model ResultsTrips First Entering I-70 East of DTL (WB Direction)
I-70 Dedicated Truck Lanes Feasibility Study Phase 2IN 104585 / Market Assessment Figures.ppt / 11-24-10
6,734 Trips
First Enter
I-70 East of
DTL

2030 Model ResultsTrips First Entering I-70 in COL (WB Direction)
I-70 Dedicated Truck Lanes Feasibility Study Phase 2IN 104585 / Market Assessment Figures.ppt / 11-24-10
10,518 Trips
First Enter
I-70 in COL

2030 Model ResultsTrips First Entering I-70 in IND (WB Direction)
I-70 Dedicated Truck Lanes Feasibility Study Phase 2IN 104585 / Market Assessment Figures.ppt / 11-24-10
3,909 Trips
First Enter I-70
in IND

2030 Model ResultsTrips First Entering I-70 in STL (WB Direction)
I-70 Dedicated Truck Lanes Feasibility Study Phase 2IN 104585 / Market Assessment Figures.ppt / 11-24-10
6,782 Trips
First Enter
I-70 in STL

Largest Regional I-70 Truck Trip Markets
For trucks that would use DTLs, the top three markets are
between:
1. Indianapolis and Columbus
2. Kansas City and St. Louis
3. Columbus and east of the corridor

69% of the I-70 truck trips are 200 miles or less
82% of the I-70 truck trips are 300 miles or less
Daily Regional I-70 Truck Trips by Distance (2030)
Truck Market
FAF-3 Commodity Analysis Findings
50 % of the freight moving on the corridor are
“internal movements” remaining within the 4
Coalition states
Many of the top commodities for each type of
directional movement “weigh-out” versus “cube
out.”
Gravel, the top commodity by weight for all directional
movement is an example of this condition.

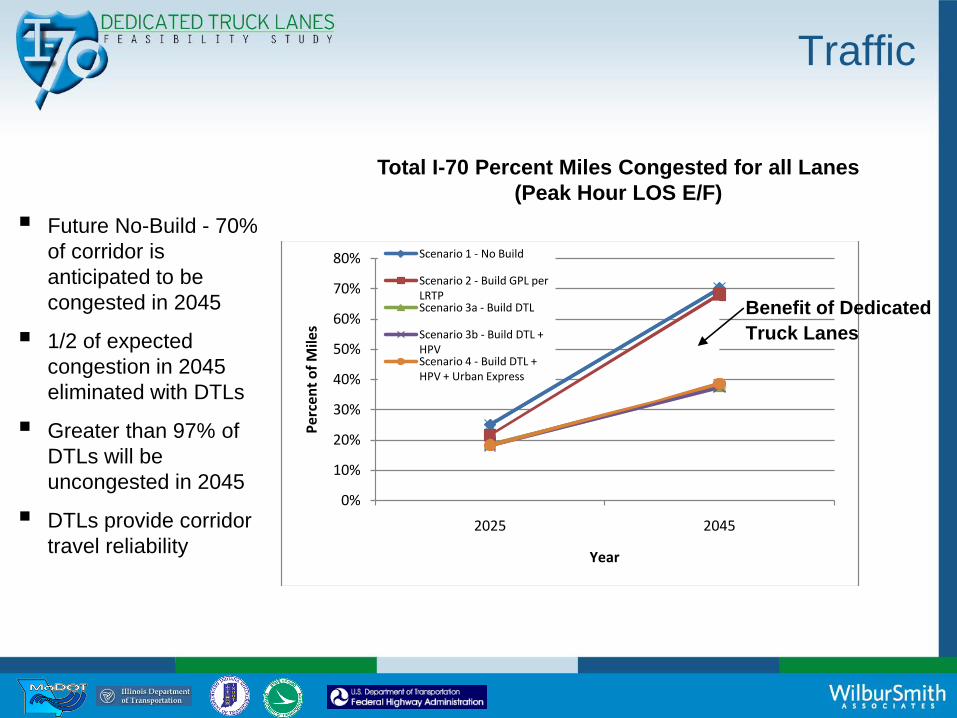
Traffic
By 2025, congestion
emerges in urban and rural
areas.
DTLs reduce congestion
where they are
implemented; though not
always to LOS D or better.
0%
10%
20%
30%
40%
50%
60%
70%
80%
2025 2045
Pe
rce
nt
of
Mile
s
Year
Scenario 1 - No Build
Scenario 2 - Build GPL per LRTPScenario 3a - Build DTL
Scenario 3b - Build DTL + HPVScenario 4 - Build DTL + HPV + Urban Express
Benefit of Dedicated
Truck Lanes
Total I-70 Percent Miles Congested for all Lanes
(Peak Hour LOS E/F)
Future No-Build - 70%
of corridor is
anticipated to be
congested in 2045
1/2 of expected
congestion in 2045
eliminated with DTLs
Greater than 97% of
DTLs will be
uncongested in 2045
DTLs provide corridor
travel reliability
Traffic

Safety

0
5,000
10,000
15,000
20,000
25,000
30,000
35,000
Scenario 1 - No Build
Scenario 2 - Build GPL per LRTP
Scenario 3A -Build DTL
Scenario 3B -Build DTL + HPV
Scenario 4 - Build DTL + HPV +
Urban Express
Nu
mb
er
of
Cra
she
s
2045 Total I-70 Annual Crashes
(All Vehicles)
I-70 crash rate for
trucks in congested
conditions is 3.5X
greater than passenger
vehicles
DTLs reduce total
annual crashes by 1/3
DTLs reduce crashes
in the general purpose
lanes by 50%.
DTLs reduce fatal
crashes by nearly 2/3
Safety
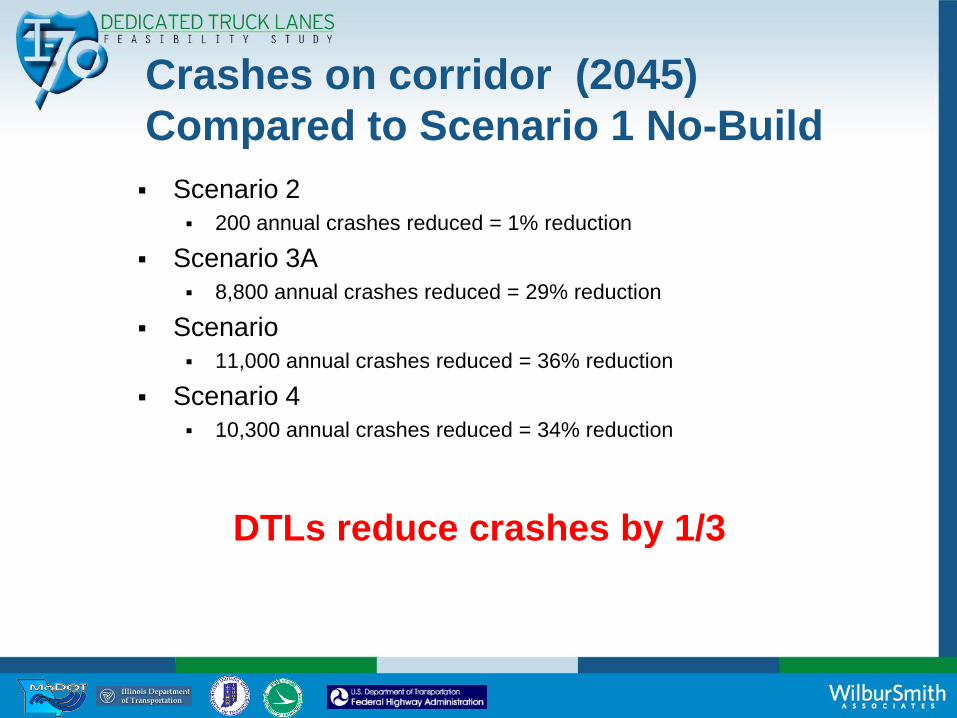
Crashes on corridor (2045)
Compared to Scenario 1 No-Build
Scenario 2
200 annual crashes reduced = 1% reduction
Scenario 3A
8,800 annual crashes reduced = 29% reduction
Scenario
11,000 annual crashes reduced = 36% reduction
Scenario 4
10,300 annual crashes reduced = 34% reduction
DTLs reduce crashes by 1/3

Crashes on GPLs (2045)
Compared to Scenario 1 No-Build
Scenario 2
200 annual crashes reduced = 1% reduction
Scenario 3A
16,000 annual crashes reduced = 52% reduction
Scenario
16,000 annual crashes reduced = 52% reduction
Scenario 4
15,000 annual crashes reduced = 49% reduction
DTLs reduce crashes by 1/2
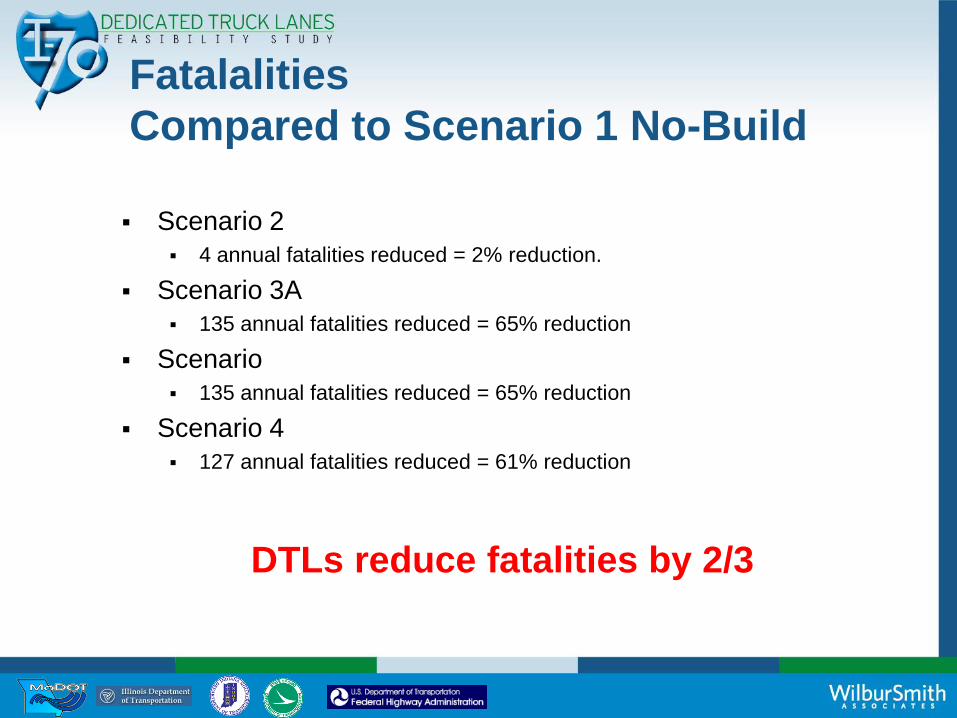
Fatalalities
Compared to Scenario 1 No-Build
Scenario 2
4 annual fatalities reduced = 2% reduction.
Scenario 3A
135 annual fatalities reduced = 65% reduction
Scenario
135 annual fatalities reduced = 65% reduction
Scenario 4
127 annual fatalities reduced = 61% reduction
DTLs reduce fatalities by 2/3
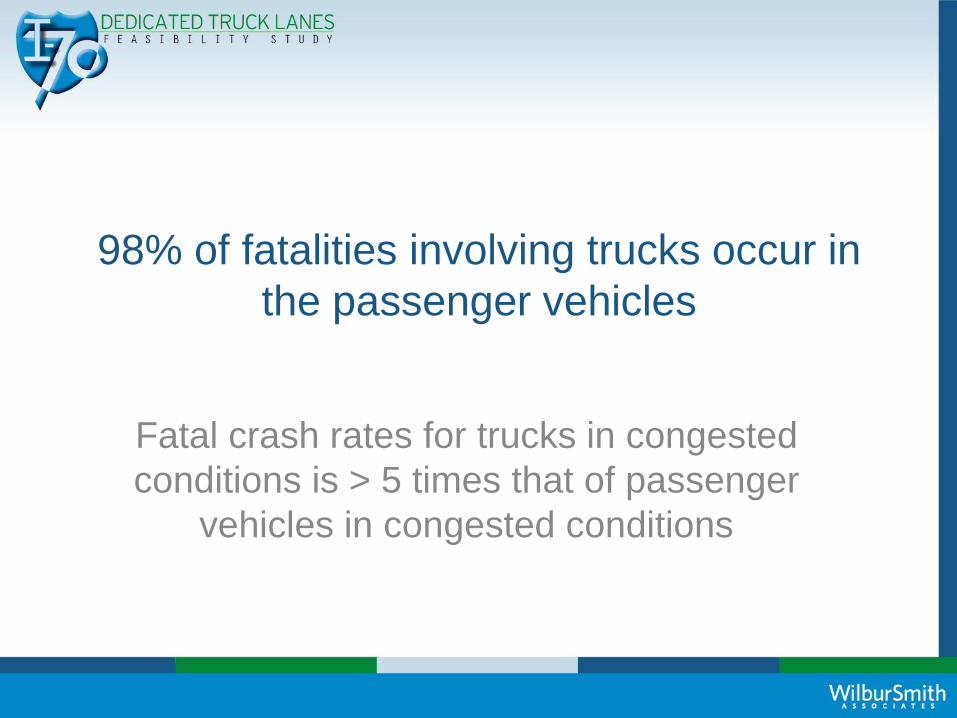
98% of fatalities involving trucks occur in
the passenger vehicles
Fatal crash rates for trucks in congested
conditions is > 5 times that of passenger
vehicles in congested conditions
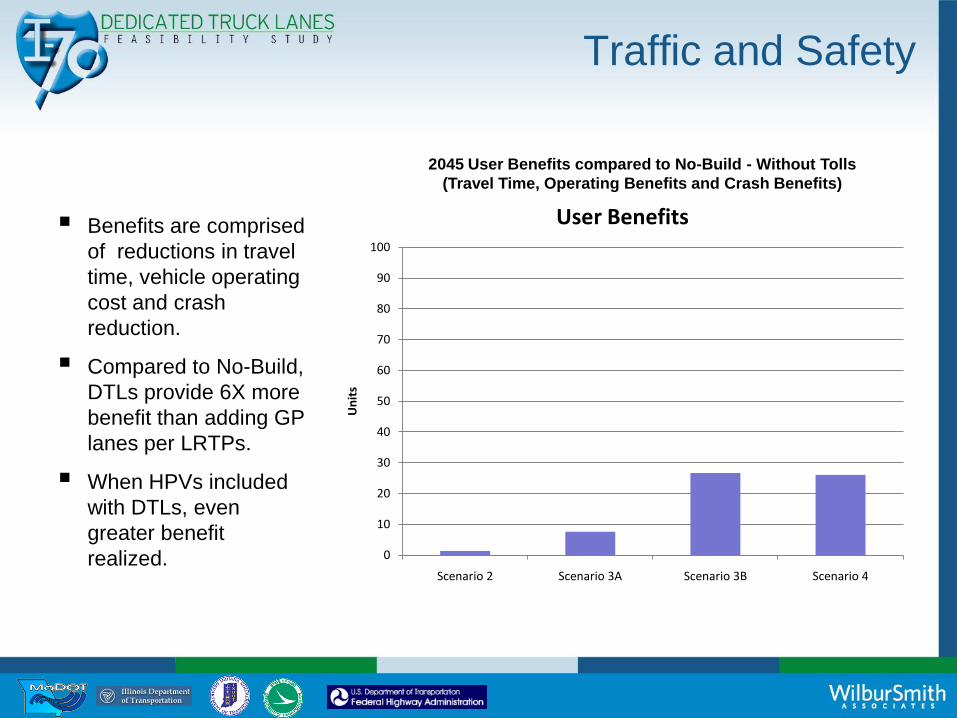
2045 User Benefits compared to No-Build - Without Tolls
(Travel Time, Operating Benefits and Crash Benefits)
Benefits are comprised
of reductions in travel
time, vehicle operating
cost and crash
reduction.
Compared to No-Build,
DTLs provide 6X more
benefit than adding GP
lanes per LRTPs.
When HPVs included
with DTLs, even
greater benefit
realized.
Traffic and Safety
0
10
20
30
40
50
60
70
80
90
100
Scenario 2 Scenario 3A Scenario 3B Scenario 4
Un
its
User Benefits
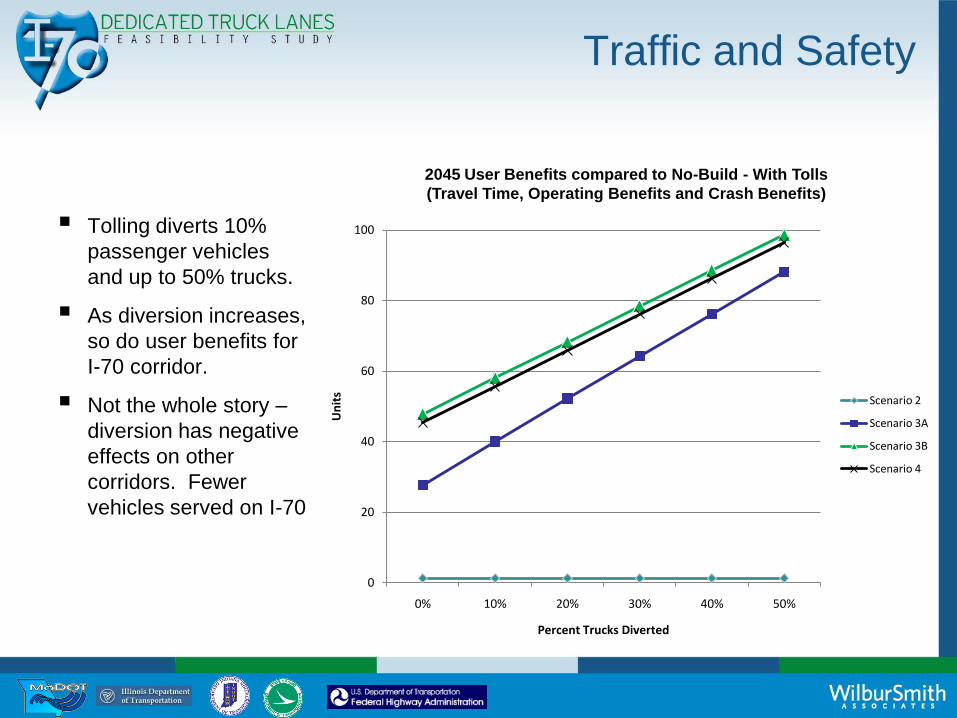
2045 User Benefits compared to No-Build - With Tolls
(Travel Time, Operating Benefits and Crash Benefits)
Tolling diverts 10%
passenger vehicles
and up to 50% trucks.
As diversion increases,
so do user benefits for
I-70 corridor.
Not the whole story –
diversion has negative
effects on other
corridors. Fewer
vehicles served on I-70
0
20
40
60
80
100
0% 10% 20% 30% 40% 50%
Un
its
Percent Trucks Diverted
Scenario 2
Scenario 3A
Scenario 3B
Scenario 4
Traffic and Safety
Higher Productivity Vehicles (HPVs)
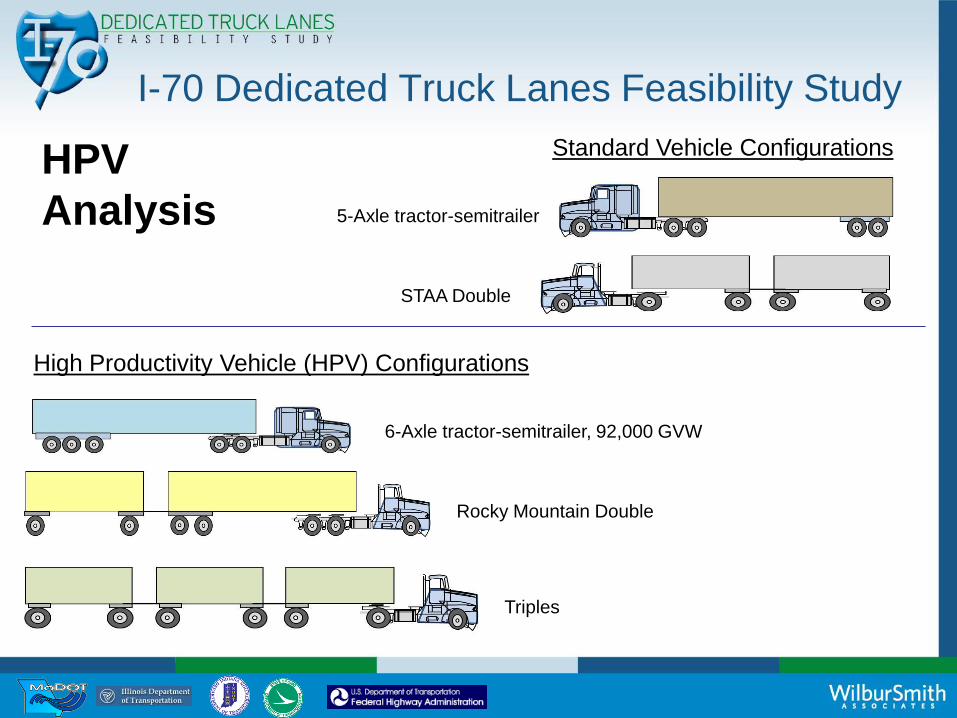
I-70 Dedicated Truck Lanes Feasibility Study
Standard Vehicle Configurations
High Productivity Vehicle (HPV) Configurations
5-Axle tractor-semitrailer
6-Axle tractor-semitrailer, 92,000 GVW
STAA Double
Rocky Mountain Double
Triples
HPV
Analysis

HPV Scenario Analysis
The HPV scenario showed significant reductions in
both fuel consumed and total emissions
Total fuel consumption to move the same quantity of
freight decreases by 13 %
This HPV scenario also showed reductions of 13 % in
emissions for CO2, NOx and PM.

Air Quality / Carbon Footprint

Air Quality – National Benefits
National Emissions Decrease By 2045, total nationwide
emissions decrease for all build alternatives
Removing trucks from traffic (& allowing HPVs) reduces emissions
Emissions reductions grow over time
Greatest air quality benefits from I-70 DTLs would accrue along competing corridors such as in Chicago and Cleveland along I-80
NOx SO2 VOC PM2 CO2 VMT
3A -0.01% -0.11% -1.78% -0.31% -0.05% 0.18%
3B -0.58% -0.68% -2.19% -0.83% -0.62% -0.52%
4 -0.57% -0.66% -1.97% -0.81% -0.61% -0.54%
-2.50%
-2.00%
-1.50%
-1.00%
-0.50%
0.00%
0.50%
Relative Change in National Emissions for DTL Alternatives
versus No-Build: 2045

Air Quality – Local Impacts
-4
-3
-2
-1
0
1
2
3
3A vs 1 3B vs 1 4 vs 1
2045
Millio
n T
on
s p
er
Year
Change in CO2 Emissions forDTL Alternatives vs. No-Build
I-70 Urban I-70 Rural Rest of US Overall
Emissions Along I-70 Increase
Largest increases in rural areas
But urban areas may face
difficulty with conformity
Largest impact: NOX
Exception: VOCs, local benefits
May need to shift SIP budgets
within the states
Mitigation may also be needed
Detailed conformity analyses
would be necessary in NEPA
for each urban area
Jobs and economic benefits
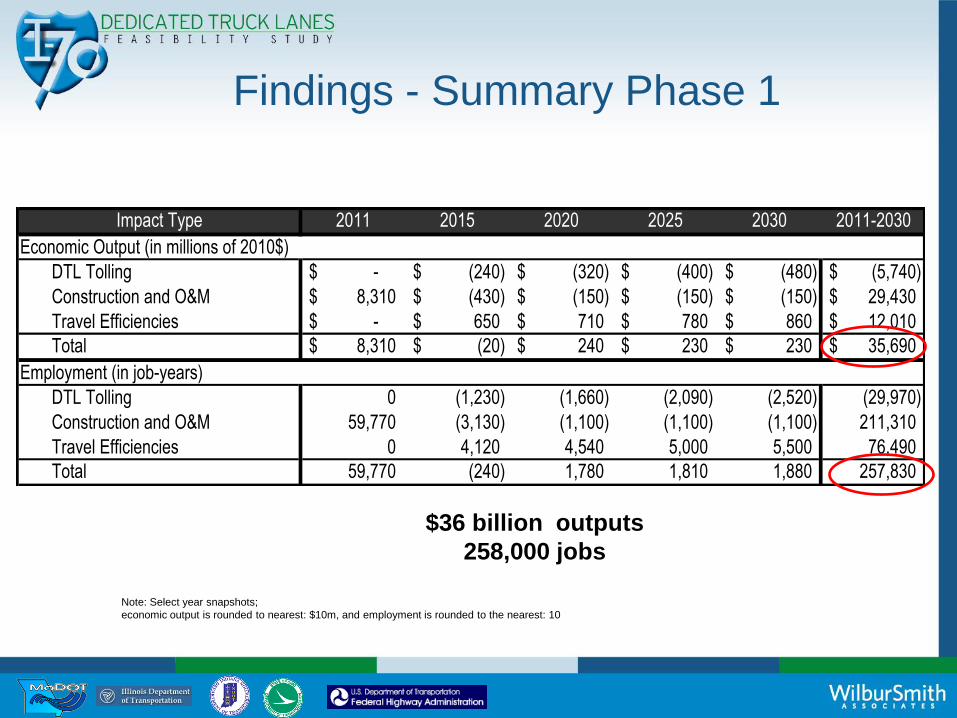
Findings - Summary Phase 1
Note: Select year snapshots;
economic output is rounded to nearest: $10m, and employment is rounded to the nearest: 10
Impact Type 2011 2015 2020 2025 2030 2011-2030
DTL Tolling -$ (240)$ (320)$ (400)$ (480)$ (5,740)$
Construction and O&M 8,310$ (430)$ (150)$ (150)$ (150)$ 29,430$
Travel Efficiencies -$ 650$ 710$ 780$ 860$ 12,010$
Total 8,310$ (20)$ 240$ 230$ 230$ 35,690$
DTL Tolling 0 (1,230) (1,660) (2,090) (2,520) (29,970)
Construction and O&M 59,770 (3,130) (1,100) (1,100) (1,100) 211,310
Travel Efficiencies 0 4,120 4,540 5,000 5,500 76,490
Total 59,770 (240) 1,780 1,810 1,880 257,830
Economic Output (in millions of 2010$)
Employment (in job-years)
$36 billion outputs
258,000 jobs
(10,000)
0
10,000
20,000
30,000
40,000
50,000
60,000
70,000
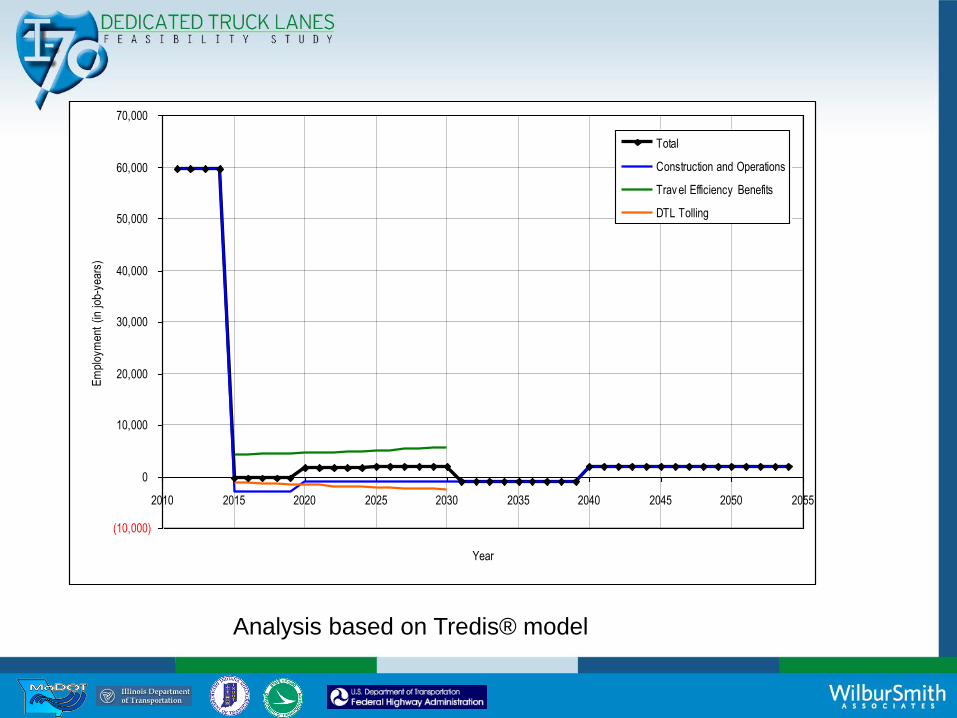
2010 2015 2020 2025 2030 2035 2040 2045 2050 2055
Year
Em
plo
yment
(in
job-y
ear
s)
Total
Construction and Operations
Trav el Efficiency Benefits
DTL Tolling
Analysis based on Tredis® model

Job creation – Phase 2 approach
$ 1 billion in government spending creates
1,085.4 job years of employment
$92,136 government spending
needed to create 1 job-year
64% of job years represent direct and indirect effects
36% of the job years are induced effects
Source: Estimates of job creation from the American Recovery and
Reinvestment Act of 2009, May 2009
NOTE: During the Bush years estimates were provided saying that
$ 1 billion in highway spending supports 34,779 jobs

Job years created by scenario
2020-2099
Scenario Estimated Cost
job years
created
No-build $ 31,667,000,000 343,698
2 $ 34,694,000,000 376,552
3a $ 53,807,000,000 583,995
3b $ 54,216,000,000 588,434
4 $ 52,393,000,000 568,649
Cost estimates

Construction Time Frames (2020 – 2044)
Section construction time frame assumed for cost estimation
purposes only
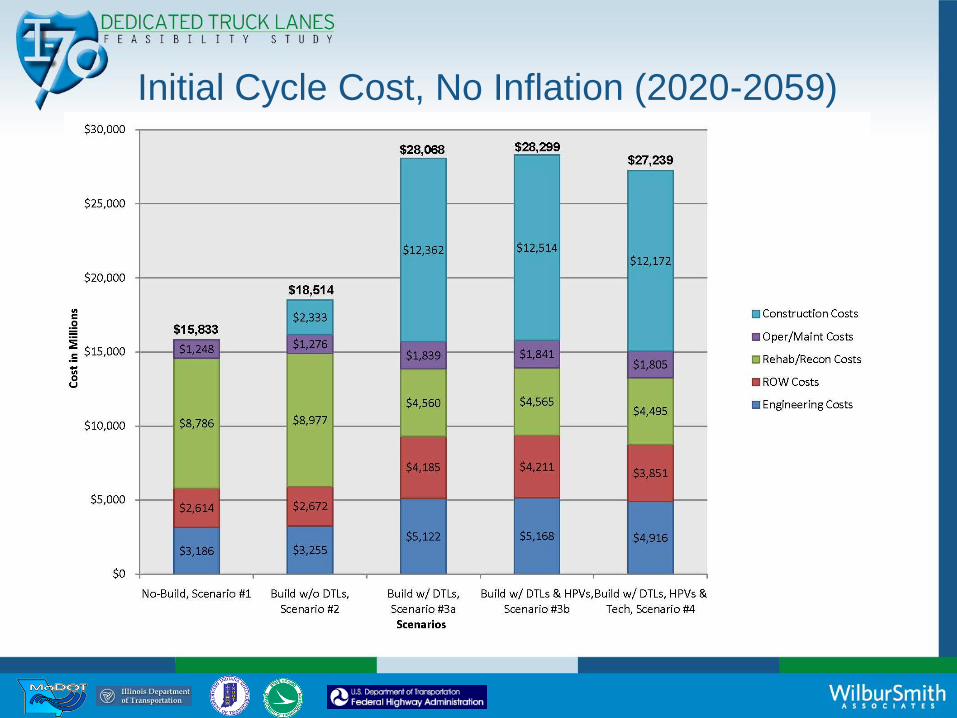
Initial Cycle Cost, No Inflation (2020-2059)

Payee Cost Split, No Inflation (2020-2099)
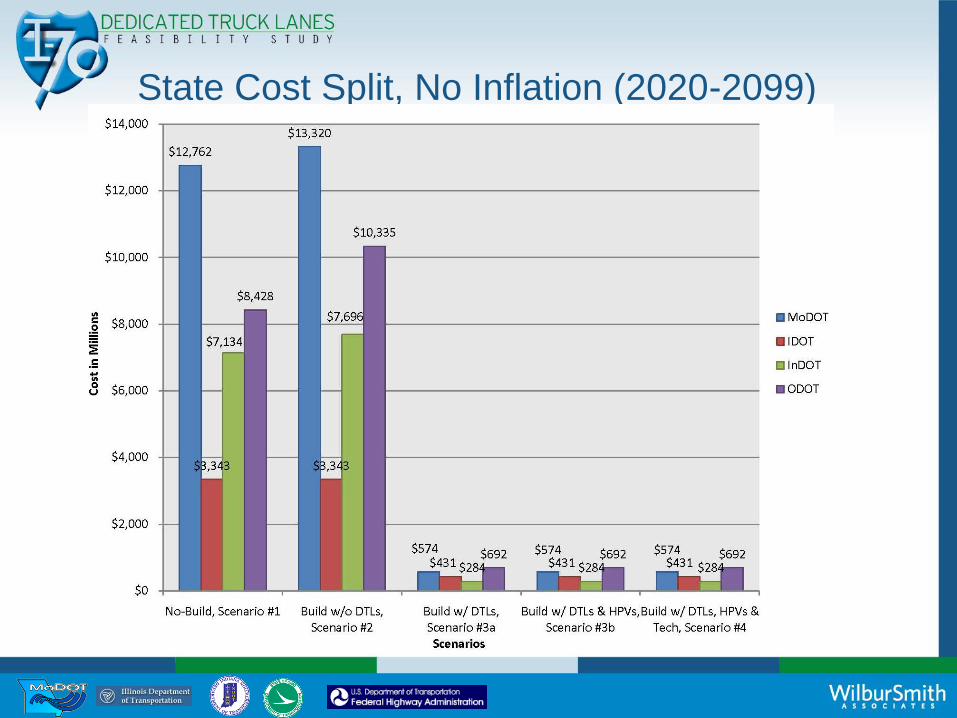
State Cost Split, No Inflation (2020-2099)
Funding and Finance
Funding and Financing Options:
Key Concepts
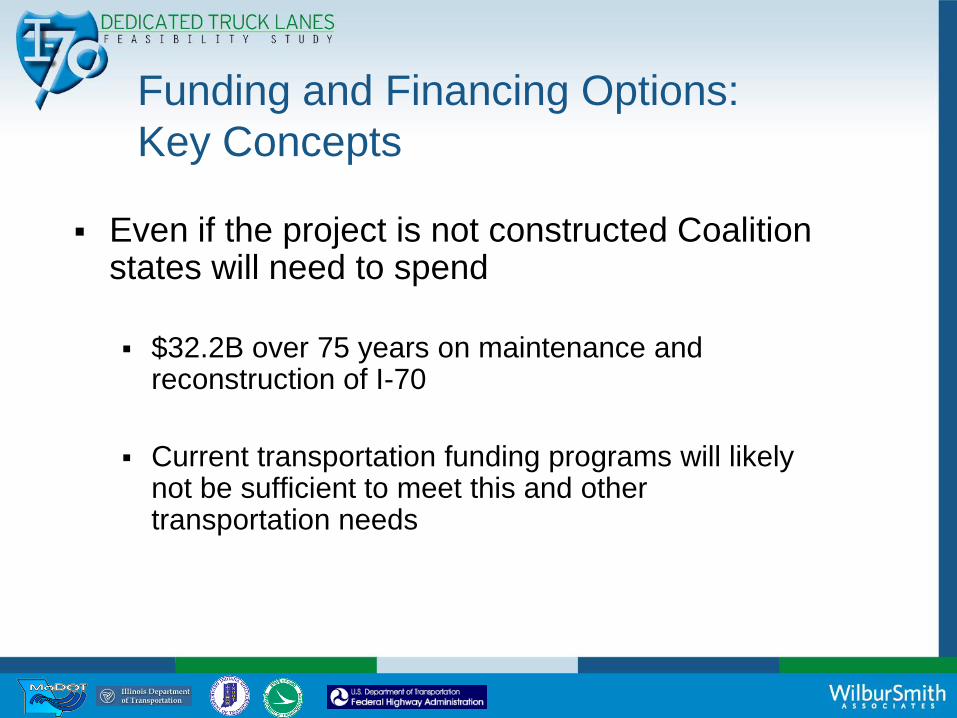
Even if the project is not constructed Coalition states will need to spend
$32.2B over 75 years on maintenance and reconstruction of I-70
Current transportation funding programs will likely not be sufficient to meet this and other transportation needs
Funding and Financing Options:
Key Concepts
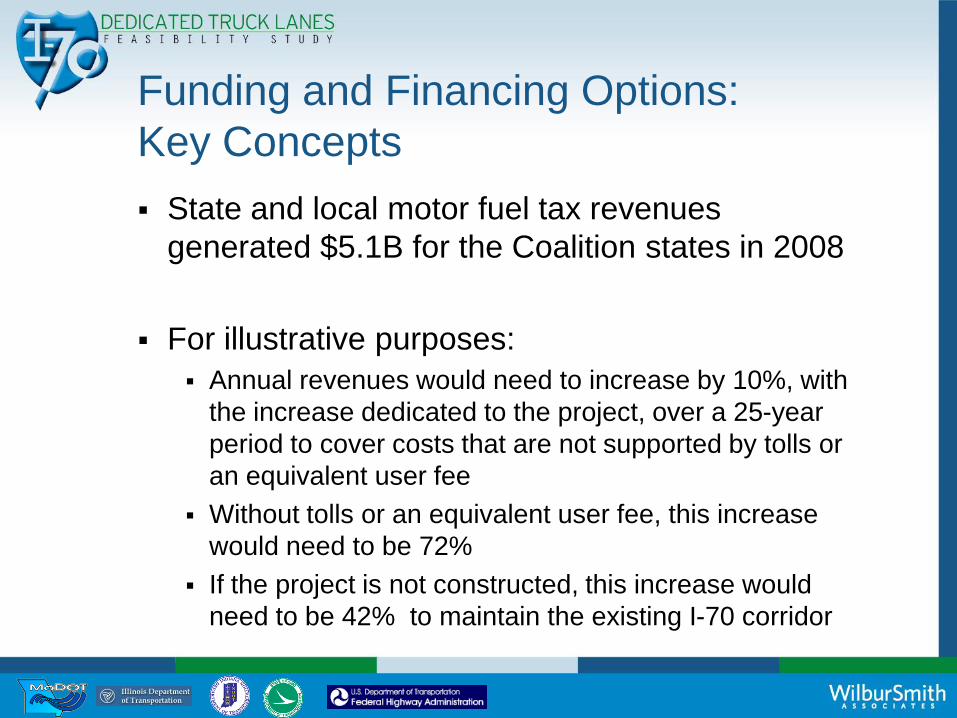
State and local motor fuel tax revenues
generated $5.1B for the Coalition states in 2008
For illustrative purposes:
Annual revenues would need to increase by 10%, with
the increase dedicated to the project, over a 25-year
period to cover costs that are not supported by tolls or
an equivalent user fee
Without tolls or an equivalent user fee, this increase
would need to be 72%
If the project is not constructed, this increase would
need to be 42% to maintain the existing I-70 corridor
Funding and Financing Options:
Key Concepts
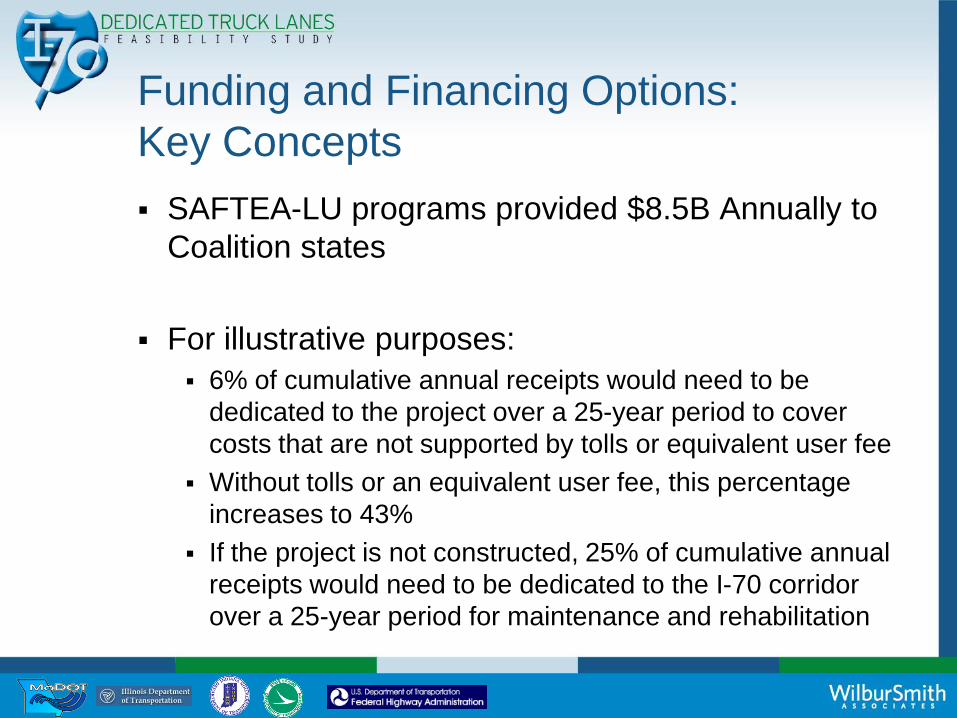
SAFTEA-LU programs provided $8.5B Annually to
Coalition states
For illustrative purposes:
6% of cumulative annual receipts would need to be
dedicated to the project over a 25-year period to cover
costs that are not supported by tolls or equivalent user fee
Without tolls or an equivalent user fee, this percentage
increases to 43%
If the project is not constructed, 25% of cumulative annual
receipts would need to be dedicated to the I-70 corridor
over a 25-year period for maintenance and rehabilitation
PPP Financing Capacity Analysis
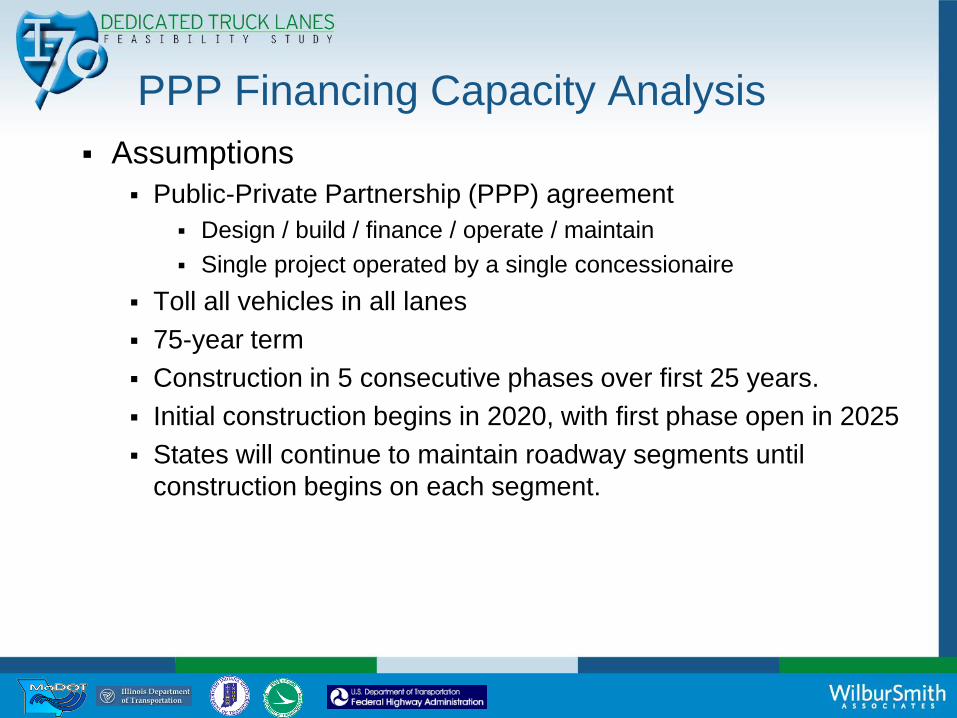
Assumptions
Public-Private Partnership (PPP) agreement
Design / build / finance / operate / maintain
Single project operated by a single concessionaire
Toll all vehicles in all lanes
75-year term
Construction in 5 consecutive phases over first 25 years.
Initial construction begins in 2020, with first phase open in 2025
States will continue to maintain roadway segments until
construction begins on each segment.
Financing Capacity Analysis
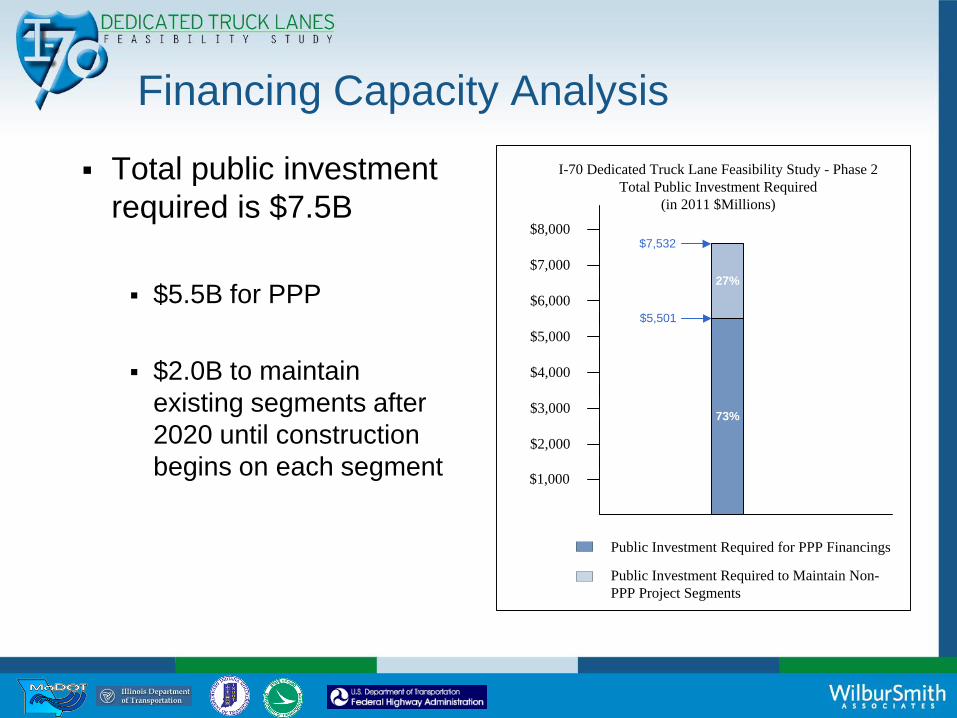
Total public investment
required is $7.5B
$5.5B for PPP
$2.0B to maintain
existing segments after
2020 until construction
begins on each segment$2,000
$3,000
$4,000
$5,000
$6,000
27%
73%
Public Investment Required for PPP Financings
Public Investment Required to Maintain Non-
PPP Project Segments
$1,000
I-70 Dedicated Truck Lane Feasibility Study - Phase 2
Total Public Investment Required
(in 2011 $Millions)
$7,532
$5,501
$7,000
$8,000
Financing Capacity Analysis
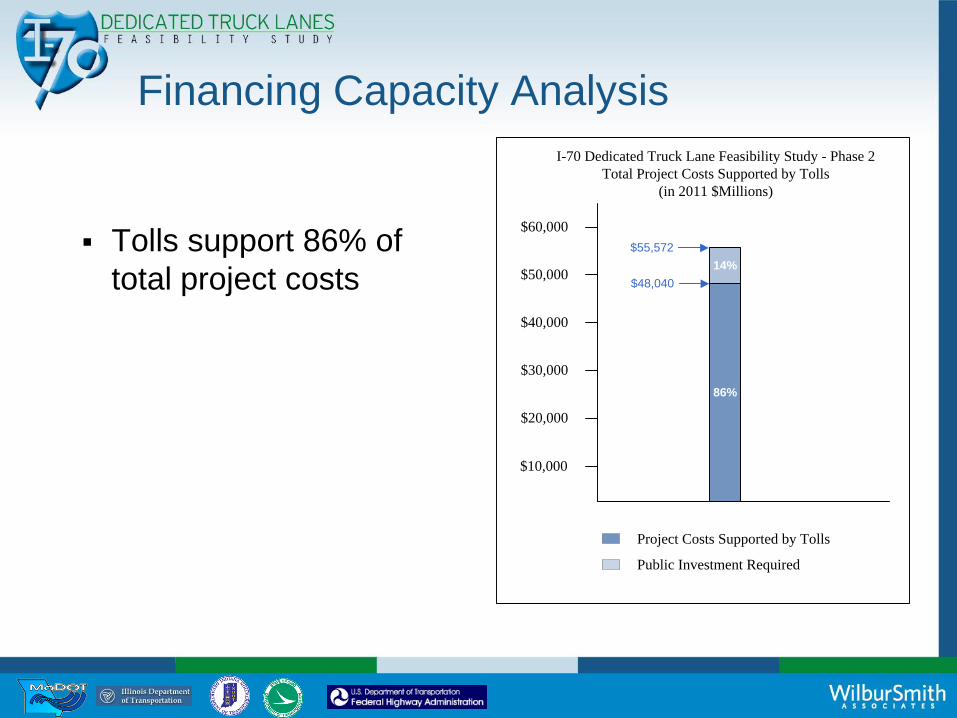
Tolls support 86% of
total project costs
$20,000
$30,000
$40,000
$50,000
$60,000
14%
86%
Project Costs Supported by Tolls
Public Investment Required
$10,000
I-70 Dedicated Truck Lane Feasibility Study - Phase 2
Total Project Costs Supported by Tolls
(in 2011 $Millions)
$55,572
$48,040

Cost to maintain vs build (2020-2099)
Cost to continue as is = $35 billion
Cost for DTLs = $ 53 billion
Difference is about $18 billion over 79 years
If concessionaire - - - - 73% of $53 Billion
covered
States share = $ 7.5 Billion over 75 years

Funding and Financing Options:
Good candidate for Transportation Infrastructure Finance and Innovation Act (TIFIA) funding Funding for TIFIA is uncertain in the near-term
Program is over subscribed
Program‟s limited capacity is exacerbated by the overall limited availability of federal funds
Good candidate for Private Activity Bonds (PABs) under a PPP Lower cost of capital encourages private investment
PPP would require enabling legislation and multi-state agreements
Funding and Financing Options:
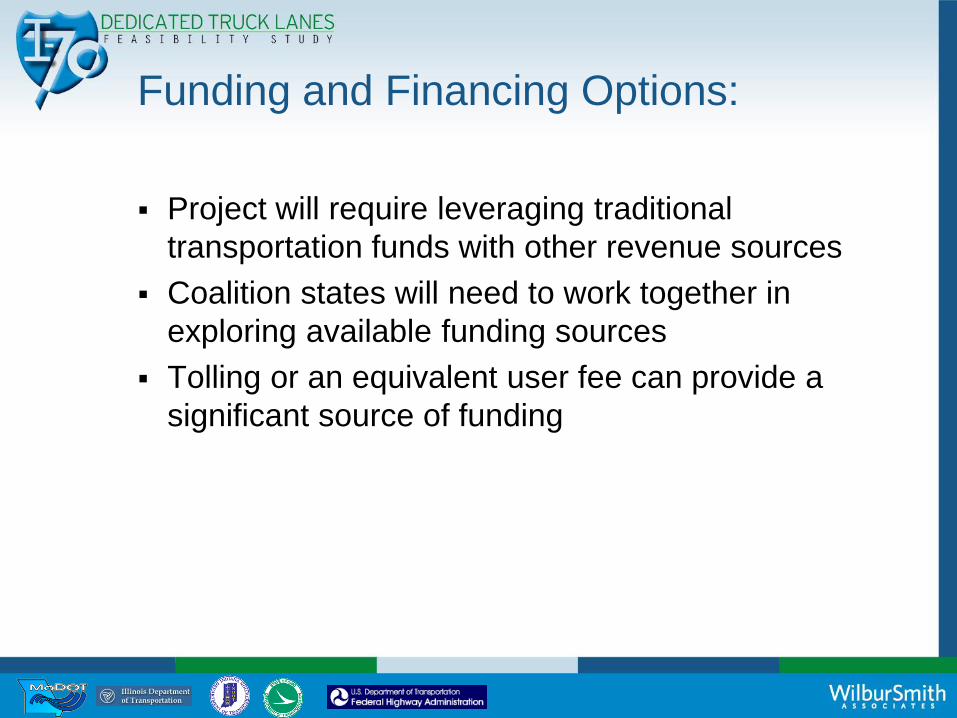
Project will require leveraging traditional
transportation funds with other revenue sources
Coalition states will need to work together in
exploring available funding sources
Tolling or an equivalent user fee can provide a
significant source of funding

Legislative authority
State
Tolling :
Legislative
approval
required
P3
Bonding:
Legislative
approval required
MissouriYes
Legislative approval
requiredYes
IllinoisYes
Legislative approval
requiredYes
Indiana Yes Governor may enact Yes
Ohio Yes 1 ODOT has authority Yes
1 ODOT Direct may apply tolls to new lanes

How do the scenarios compare
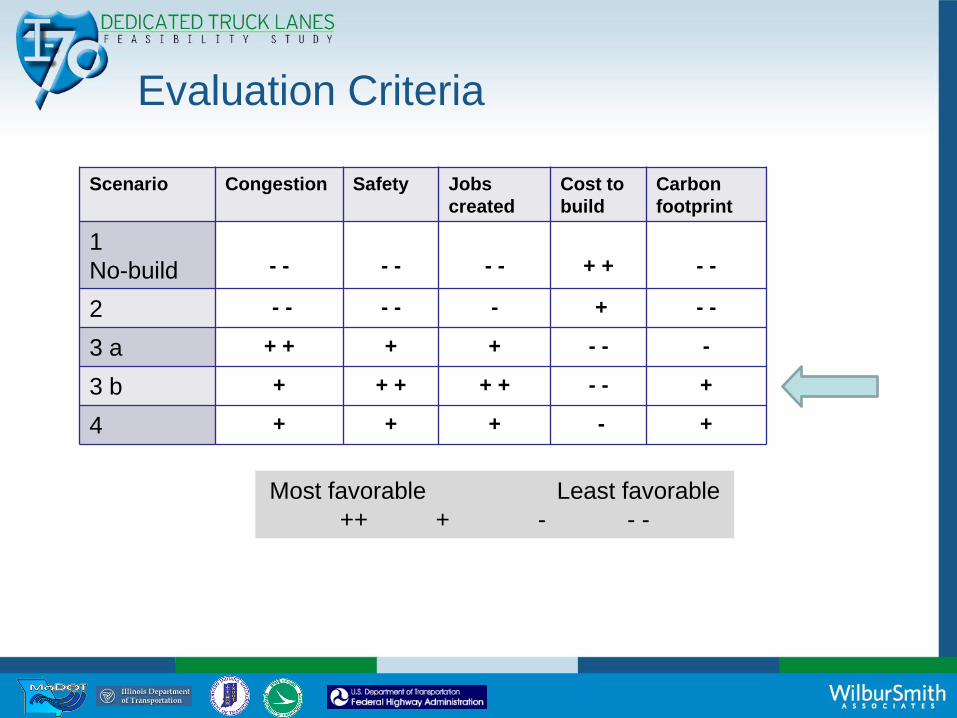
Evaluation Criteria
Scenario Congestion Safety Jobs
created
Cost to
build
Carbon
footprint
1
No-build - - - - - - + + - -
2 - - - - - + - -
3 a + + + + - - -
3 b + + + + + - - +
4 + + + - +
Most favorable Least favorable
++ + - - -

OverviewScenarios Evaluated in Phase 2
Scenario 1 2 3 4
Concept No-
Builda Buildb
Build Four DTL's
Build DTL's (4 lanes rural,
2 lanes urban)
A B
Add capacity to general purpose lanes X X
Ru
ral
Se
ctio
ns
Number of DTL Lanes in each direction 2 2 2
Truck interchanges
(grade separated/slip ramps ) 24 24 24
Physically separate the lanes with barriers and medians X X X
Urb
an
Se
ctio
ns
Number of DTL Lanes in each direction 2 2 1
Number of separated truck interchanges 18 18 10
Physically separate the lanes with concrete barriers and shoulders X X
HPV Staging Area
X X

Public stakeholders
I-70 Dedicated Truck Lanes Feasibility Study
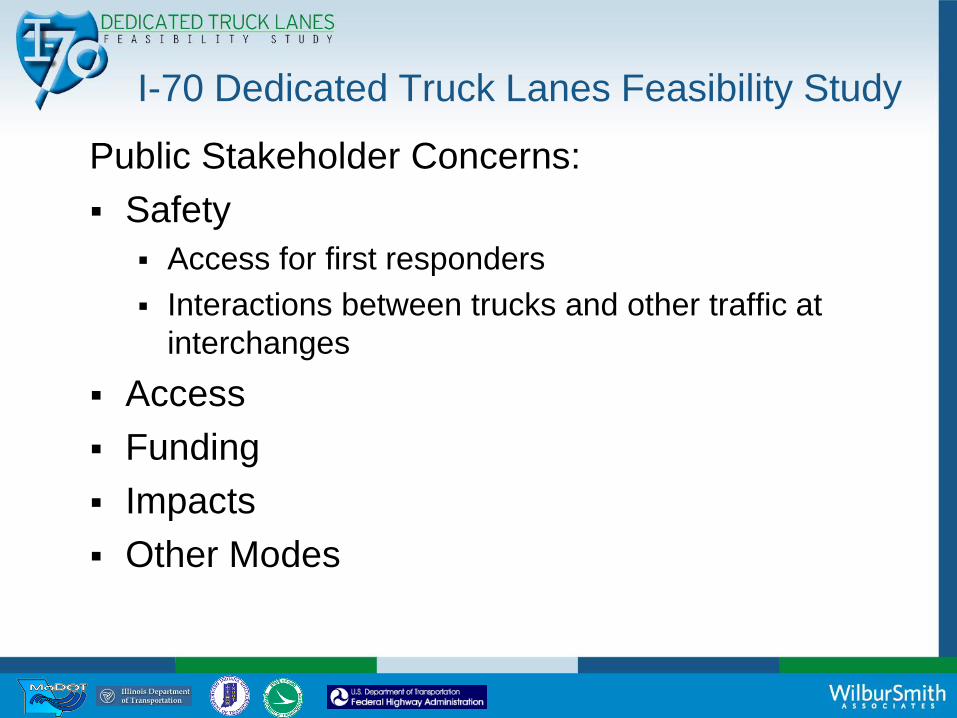
Public Stakeholder Concerns:
Safety
Access for first responders
Interactions between trucks and other traffic at
interchanges
Access
Funding
Impacts
Other Modes

Motor Carrier Perspectives
ATRI – Focus groups and interviews
with motor carriers
Discussion of Key Topics
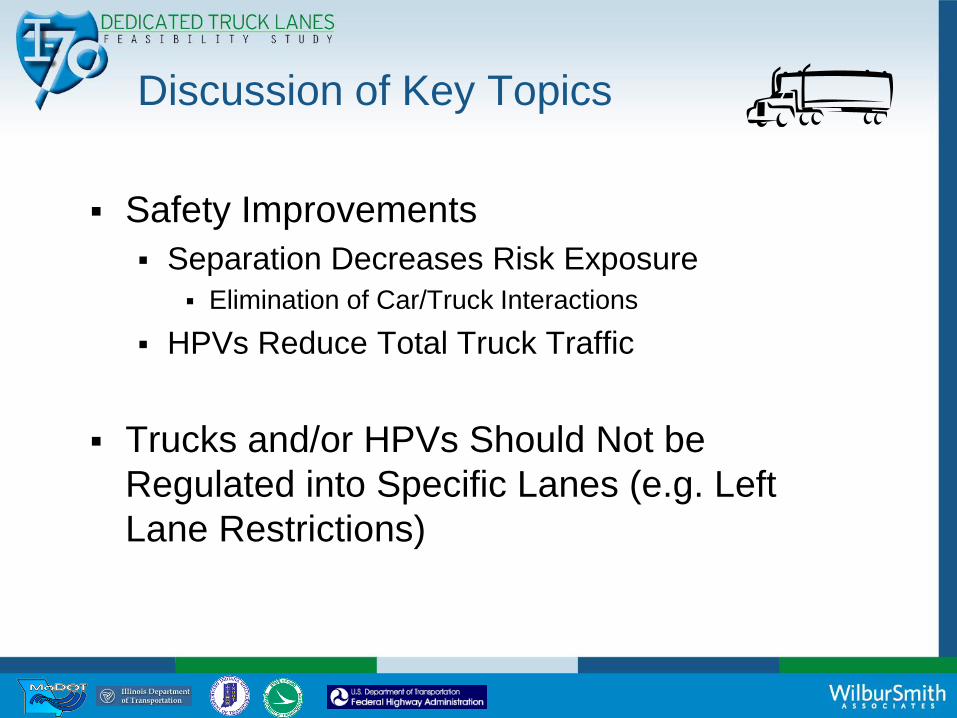
Safety Improvements
Separation Decreases Risk Exposure
Elimination of Car/Truck Interactions
HPVs Reduce Total Truck Traffic
Trucks and/or HPVs Should Not be
Regulated into Specific Lanes (e.g. Left
Lane Restrictions)

Discussion of Key Topics
Strong Support for HPVs
Documented Benefits Decreased Fuel Consumption
Improved Air Quality
Decrease in Congestion
Anecdotal Safety Benefits
Interest in Performance-Based Configurations Triple 28s
Turnpike/Rocky Mountain Doubles
6-axle Tractor Semi-Trailer
Interested in an HPV Test Program on I-70
Discussion of Key Topics
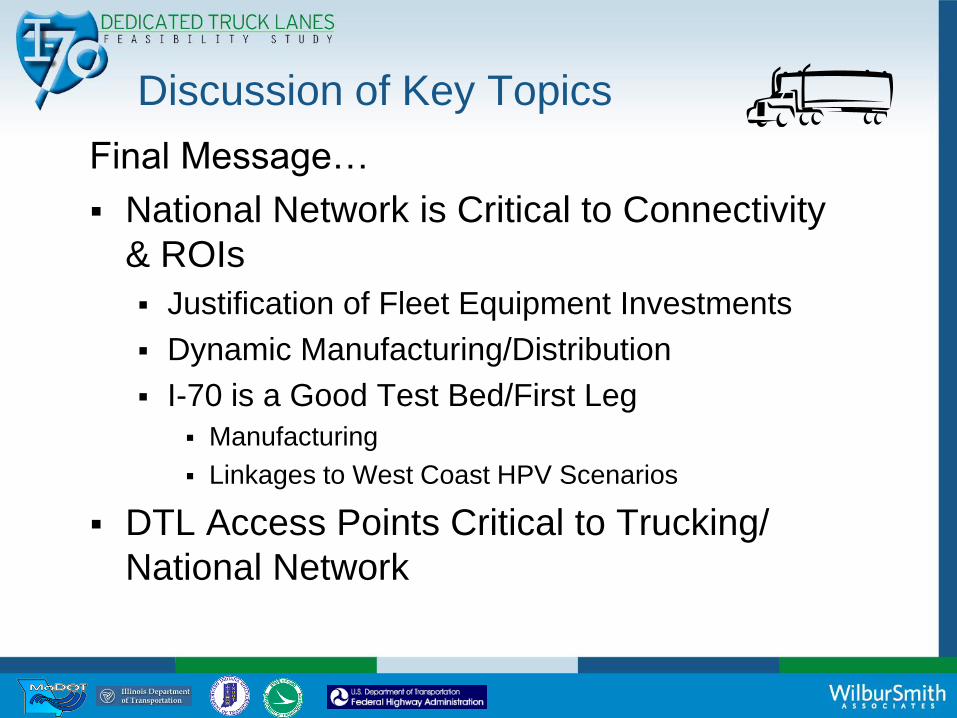
Final Message…
National Network is Critical to Connectivity
& ROIs
Justification of Fleet Equipment Investments
Dynamic Manufacturing/Distribution
I-70 is a Good Test Bed/First Leg
Manufacturing
Linkages to West Coast HPV Scenarios
DTL Access Points Critical to Trucking/
National Network

Motor carriers‟ preferences
if tolled……
1. All vehicles pay
2. Electronic – no need to stop
3. Trucks be permitted in all lanes / DTLs
voluntary
4. All tolls go back into roadway – not used
for other facilities or purposes
5. Tolls end when facility is paid-off
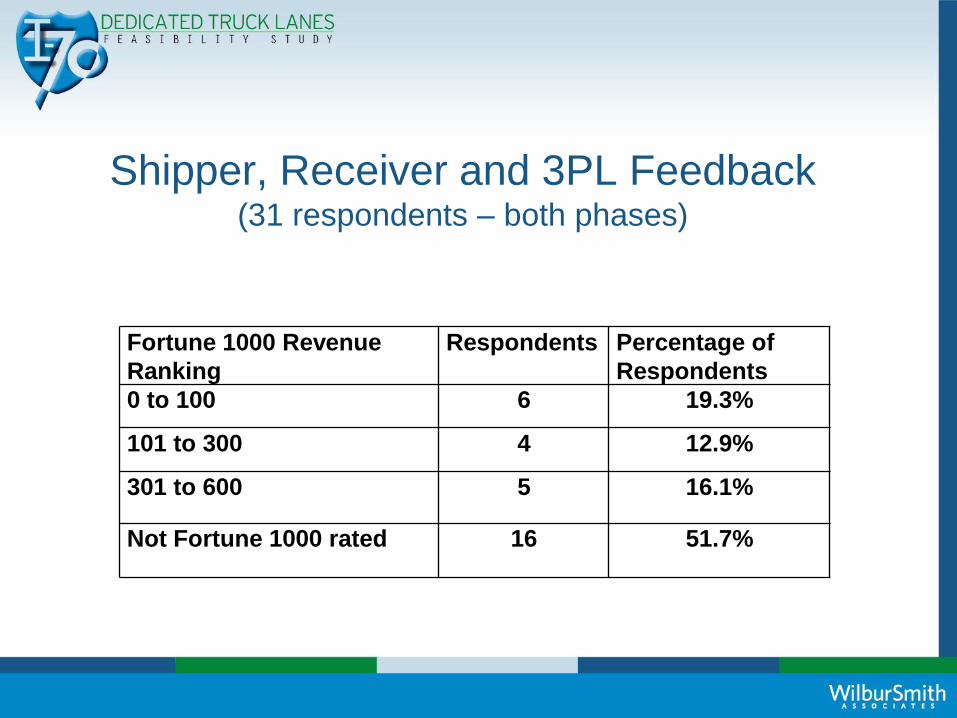
Shipper, Receiver and 3PL Feedback(31 respondents – both phases)
Fortune 1000 Revenue
Ranking
Respondents Percentage of
Respondents
0 to 100 6 19.3%
101 to 300 4 12.9%
301 to 600 5 16.1%
Not Fortune 1000 rated 16 51.7%
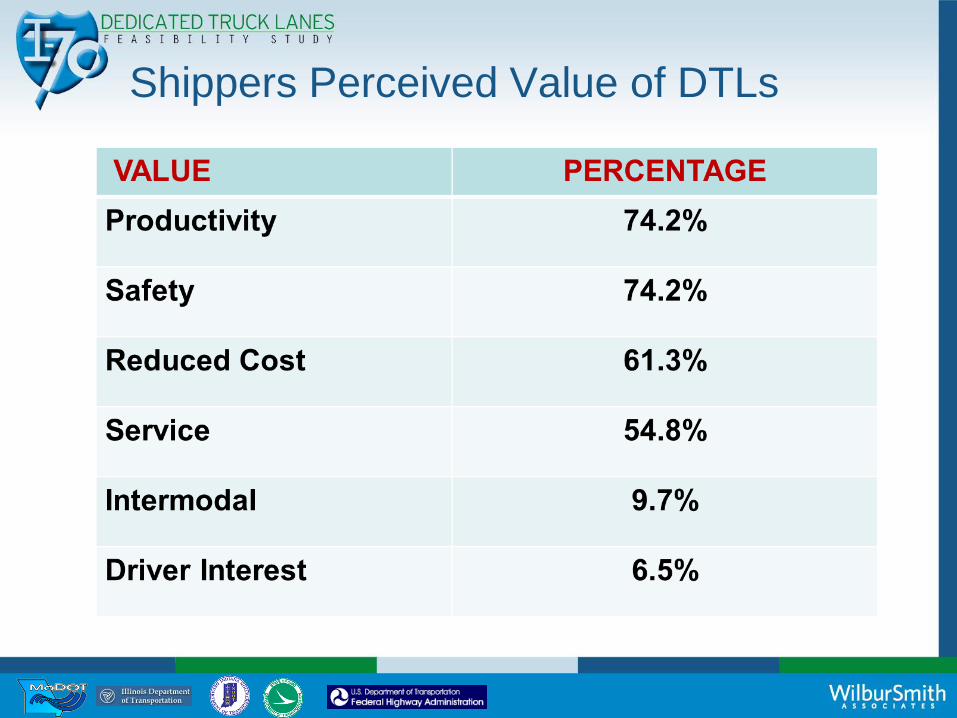
Shippers Perceived Value of DTLs

Shipper/Receiver focus Group
Affirmed - Must Have(s)
Cost savings if there is a charge for use
Increased payload (HPV - weight)
Combination trailers (HPV- size)
Improved truckload asset utilizations (turns/day-week)
with or without HPV
Reasonable travel distance to and from Corridor
HPV – weight and or combination trailers intact
Note: Recommend ocean and domestic containers
move in tandem to and from Intermodal yards
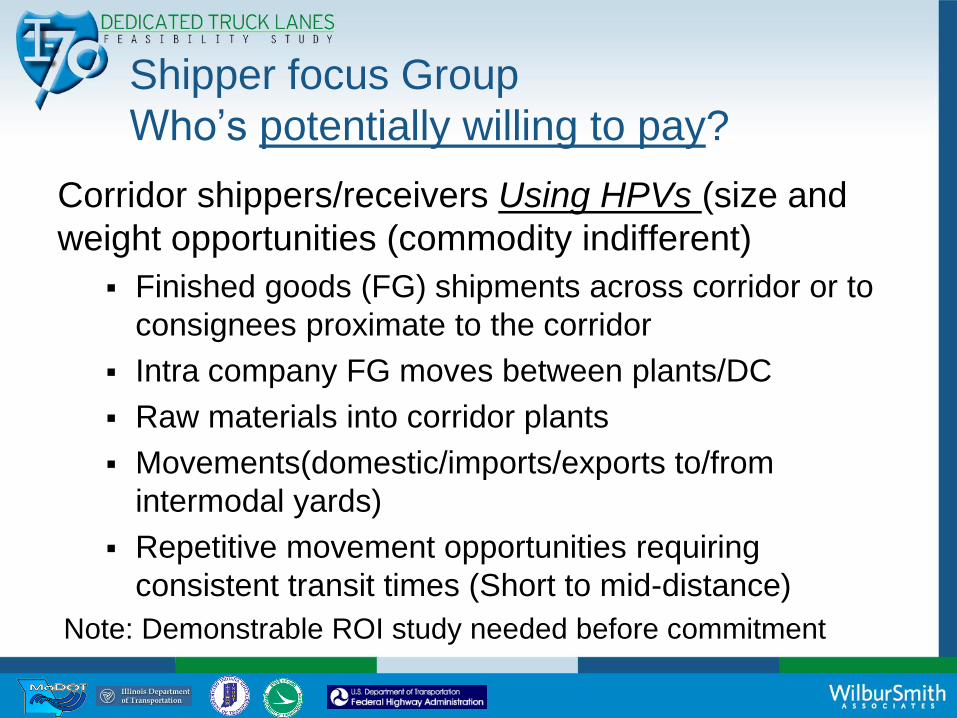
Shipper focus Group
Who‟s potentially willing to pay?
Corridor shippers/receivers Using HPVs (size and
weight opportunities (commodity indifferent)
Finished goods (FG) shipments across corridor or to
consignees proximate to the corridor
Intra company FG moves between plants/DC
Raw materials into corridor plants
Movements(domestic/imports/exports to/from
intermodal yards)
Repetitive movement opportunities requiring
consistent transit times (Short to mid-distance)
Note: Demonstrable ROI study needed before commitment

Shipper focus Group
Potentially who won‟t pay
Those that cannot create productivity with size, weight,
turns & JIT.
OD pairs originating and terminating away from corridor
and do not have interest or HPV capable carrier base.
Can‟t find carriers willing to provide HPV equipment
Owner-Operators that do not have HPVs.
Private/Dedicated fleets unwilling to train drivers or
sufficient ROI to convert fleet.
Potential HPV shippers/receivers too far away from
assembly points to create needed productivity.
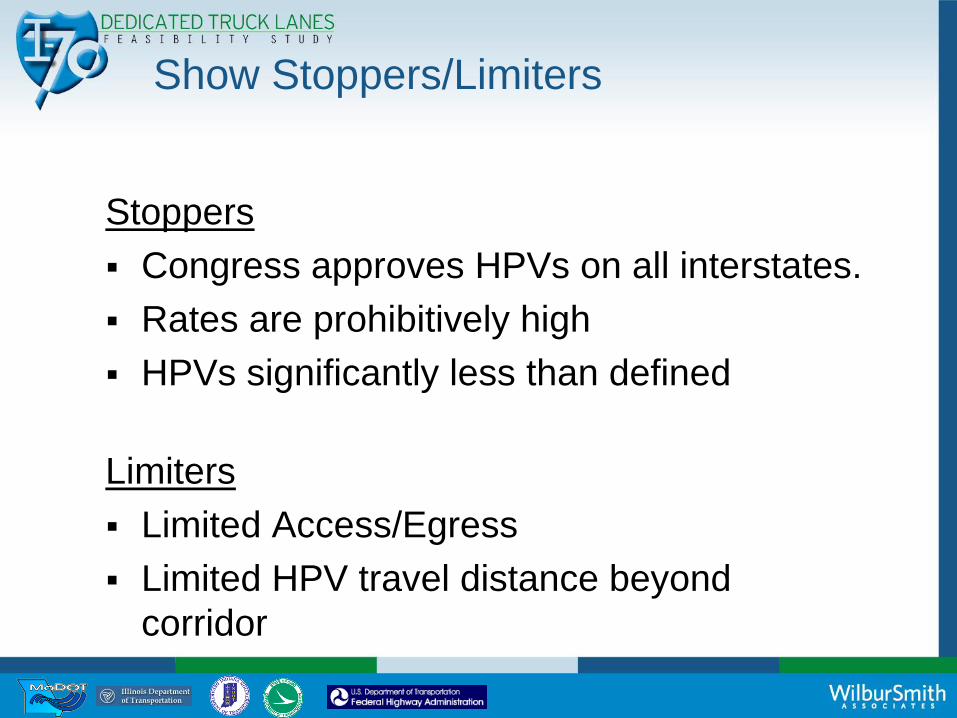
Show Stoppers/Limiters
Stoppers
Congress approves HPVs on all interstates.
Rates are prohibitively high
HPVs significantly less than defined
Limiters
Limited Access/Egress
Limited HPV travel distance beyond
corridor

Risks

Risks
Organization
Policy
Funding
Construction
Operations
Maintenance
Standardization

Next Steps
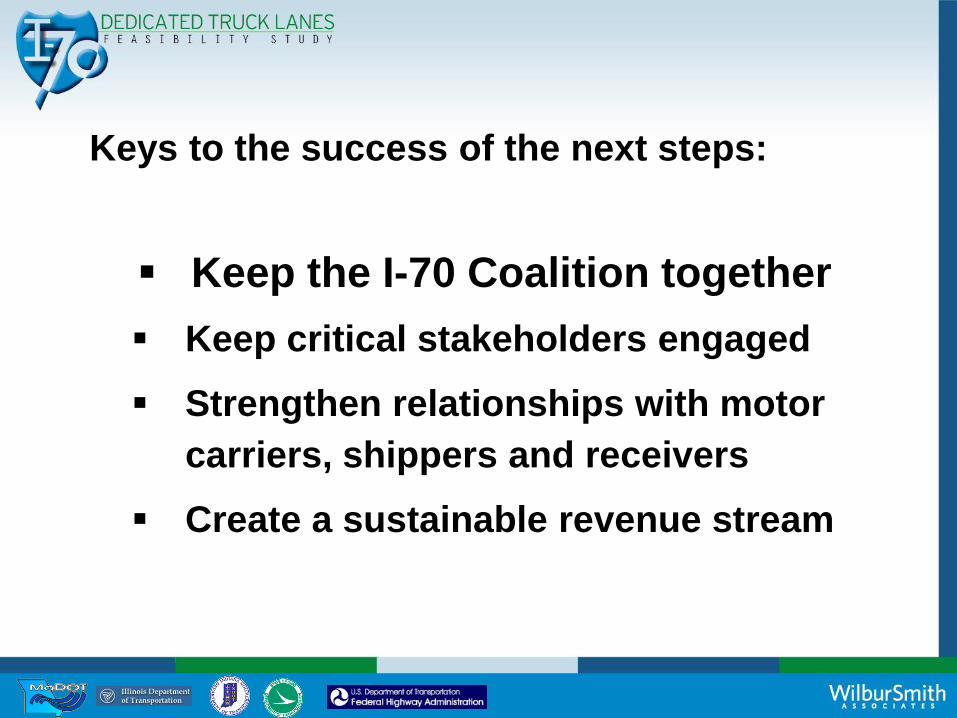
Keys to the success of the next steps:
Keep the I-70 Coalition together
Keep critical stakeholders engaged
Strengthen relationships with motor
carriers, shippers and receivers
Create a sustainable revenue stream

Actions – level 1- short term
Reaffirm commitment
Position paper/presentation for CEO‟s
FHWA to host webinar with CEOs
Maintain Coalition
Peer exchange / other coalitions
Identify and develop Coalition projects
Uniformity (SPR 2 ?)
Regulations, enforcement, ITS Coordination, Incident
management, Green initiatives
Potential pilot projects w/ motor carriers – HPVs
I-70 Dedicated Truck Lanes Feasibility Study
Stakeholder outreach next steps:
Outreach to MPOs and DOTs
Online meeting for public stakeholders
Online survey related to the online meeting
Opportunities for Coalition to work
together on projects other than DTLs
• ITS Technology
• Green Corridor
ITS Summary
Already exists along the corridor
Technology continues to evolve and will
play a role in corridor operations regardless
of TOL
ITS is a relatively fast and inexpensive way
to move the corridor forward
But, ITS requires higher annual operational
costs to avoid obsolescence
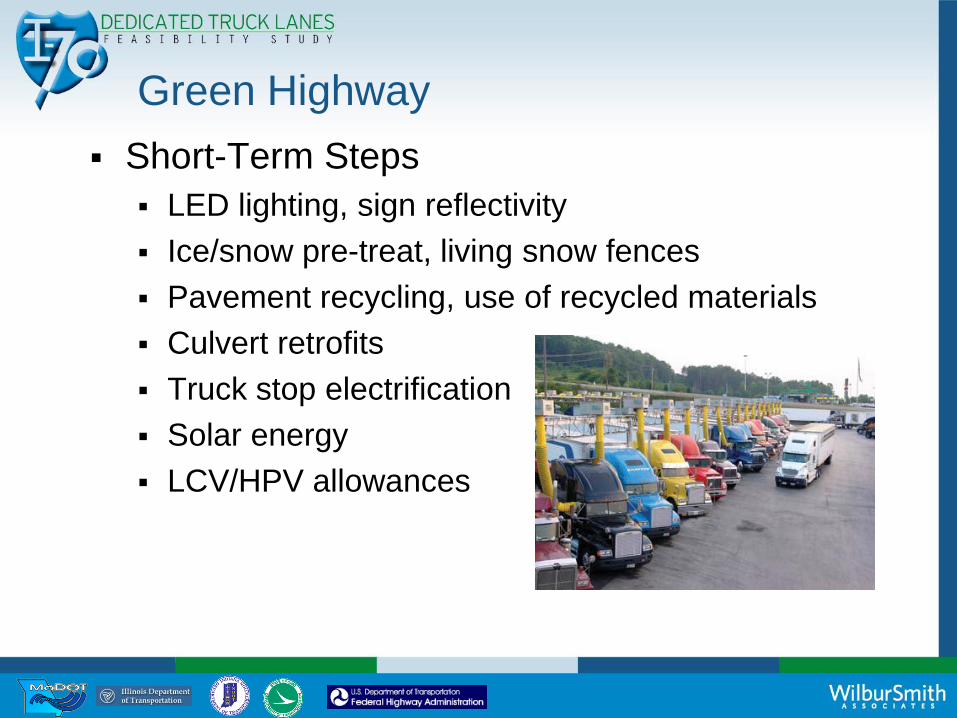
Green Highway
Short-Term Steps
LED lighting, sign reflectivity
Ice/snow pre-treat, living snow fences
Pavement recycling, use of recycled materials
Culvert retrofits
Truck stop electrification
Solar energy
LCV/HPV allowances

Green Highway
Long-Term/Construction Steps
Roadway alignment – vertical curves
Roadway materials, recycled materials
Wetland and habitat restoration above minimum
Bio-swales, terraces
Alternative fuels trucks/corridor – LNG on I-5
Rest areas/truck breakdown areas
Conclusion: Unique Opportunity
The I-70 corridor states, acting in concert, have
a unique opportunity to:
Create a highly efficient and effective
„logistical artery‟ for current and
prospective businesses
Achieve higher levels of safety and
efficiency for everyone.

Consultant Team – Phase 2
www.i70dtl.org