Embed Size (px)
Citation preview


I-75 AT S.R. 50 AREA CIRCULATION PLAN STUDY
Prepared for:
Hernando County Metropolitan Planning Organization
Prepared by:
Tindale‐Oliver and Associates, Inc.
April 24, 2013 COPR
122074‐04.12

I‐75/SR 50 Area Circulation Plan Study Page ES‐1 Tindale‐Oliver and Associates, Inc. April, 2013
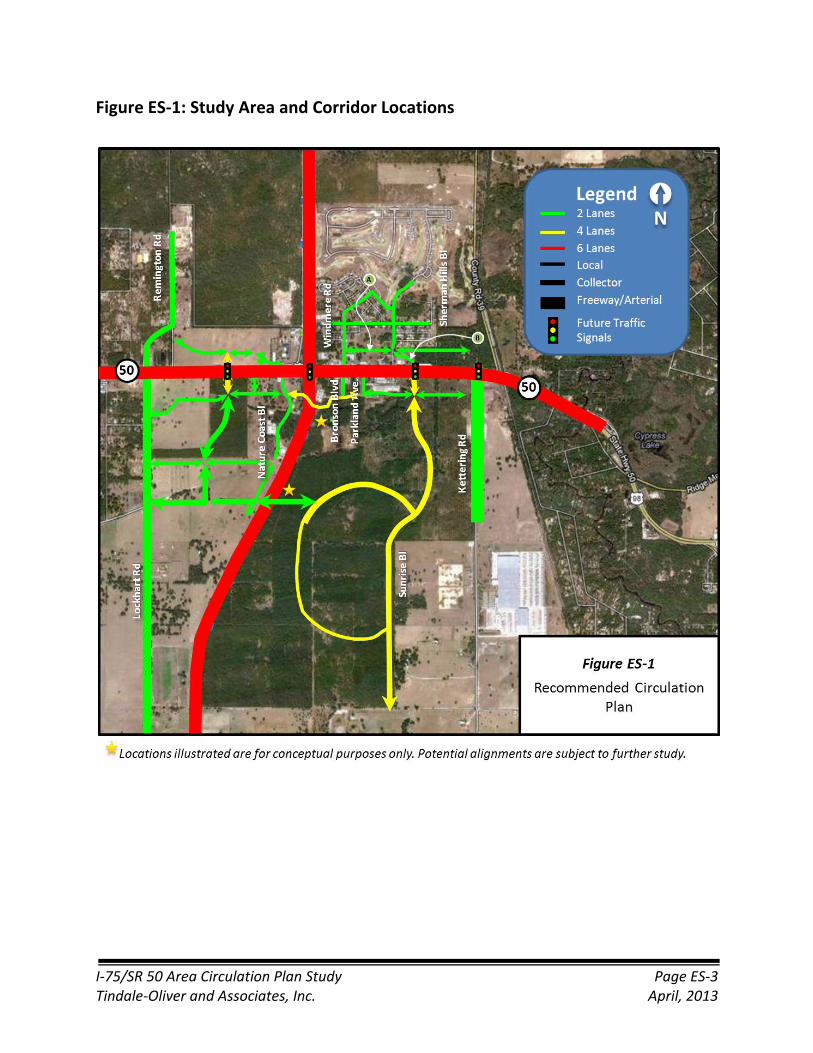
Executive Summary The Hernando County Metropolitan Planning Organization (MPO) undertook a traffic circulation study for the area surrounding the I‐75 at SR 50 interchange in eastern Hernando County to identify long‐term circulation needs and to identify shorter‐term improvements, compatible with the long‐term needs, to be coordinated with planned Florida DOT changes to SR 50. The study area and recommended circulation plan are illustrated in Figure ES‐1. The study was undertaken from the perspective of a build‐out analysis of the area surrounding the I‐75/SR 50 interchange, taking into consideration proposed development plans and assumptions of potential development on land where specific developments have not been proposed. The adopted Tampa Bay Regional Transportation Planning Model (TBRPM) was the technical foundation of the study. The study provided for interaction with interested parties through two project progress meetings. Opportunity for public comment was provided at these meetings. Findings and recommendations of the study are:
An element of the FDOT changes to SR 50 is the closure of the existing median opening on SR 50 at Windermere Rd./Bronson Blvd., just east of I‐75, and the relocation of the existing traffic signal there to a location eastward ‐‐ to Sherman Hills Blvd. When the signal was installed, it was understood by the involved parties that it was a temporary installation and that it would be relocated at a later date. Realignment of where Sherman Hills Blvd. intersects SR 50 eastward is recommended as the logical location for this signal, and right‐of‐way to accommodate the realignment has been dedicated to Hernando County.
Hernando County should move forward with preliminary design studies to identify right‐of‐way needs for links A and B (including the realignment of Sherman Hills Blvd.) of the circulation plan (as depicted on Figure ES‐1) and implement these segments in conjunction with the Florida DOT’s planned improvements. The preliminary design studies will identify more exact alignments, traffic operational requirements, storm‐water treatment strategies, and pond requirements so that right‐of‐way needs can be identified and land developments adjacent to the roadways can be planned compatibly with the circulation plan.
If implemented in coordination with the FDOT’s SR 50 improvements, the realignment of Sherman Hills Blvd. can also facilitate the relocation of the traffic signal from Windemere Rd./Bronson Blvd. in one step, thereby avoiding additional costs.
The location that presents the most costly long‐term traffic circulation challenge in the study area is the I‐75/SR 50 interchange.

I‐75/SR 50 Area Circulation Plan Study Page ES‐2 Tindale‐Oliver and Associates, Inc. April, 2013
The recommended circulation plan provides for two potential locations to the south of SR 50 at which east‐west traffic can cross from one side of I‐75 to the other, resulting in a 30 percent reduction of traffic on SR 50. Reduced traffic volumes can defer the need for costly interchange improvements, and the additional crossing locations provide for alternative routes for traffic circulation, which is advantageous for alternate modes of mobility and reduced dependence on SR 50.
The potential for I‐75 crossing locations should be reviewed with FDOT.
Hernando County should adopt the enclosed circulation plan into its long‐range transportation plan to increase the likelihood of its ultimate implementation.
As individual land parcels are developed, implement elements of the circulation plan in conjunction with development approvals to provide improved circulation and access.
I‐75/SR 50 Area Circulation Plan Study Page ES‐3 Tindale‐Oliver and Associates, Inc. April, 2013
Figure ES‐1: Study Area and Corridor Locations

I‐75/SR 50 Area Circulation Plan Study Page i Tindale‐Oliver and Associates, Inc. April, 2013
I-75 AT S.R. 50 AREA
CIRCULATION PLAN STUDY
Table of Contents Introduction ................................................................................................................................... 1 Study Approach .............................................................................................................................. 3 Growth Forecast ............................................................................................................................ 4 Travel Demand Estimates .............................................................................................................. 5 Findings and Recommendations .................................................................................................... 5
List of Figures 1. Proposed Improvements to I‐75 and SR 50 ............................................................................. 2 2. Study Area and Initial Circulation Plan .................................................................................... 3 3. Trend Growth and TBRPM/PD&E Study Volume Estimates .................................................... 6 4. Recommended Circulation Plan ............................................................................................... 8
List of Tables 1. Summary of Growth Estimates ................................................................................................. 4
Appendices A. 2007 “I‐75/SR 50 PDD” Road Plan and Resolution ........................................................... A‐1 B. Socio‐Economic Data Forecast ......................................................................................... B‐1 C. Network Alternative Testing Results ............................................................................... C‐1 D. Planning Road Cost Estimate ........................................................................................... D‐1

I‐75/SR 50 Area Circulation Plan Study Page 1 Tindale‐Oliver and Associates, Inc. April, 2013
I-75 AT S.R. 50 AREA CIRCULATION PLAN STUDY
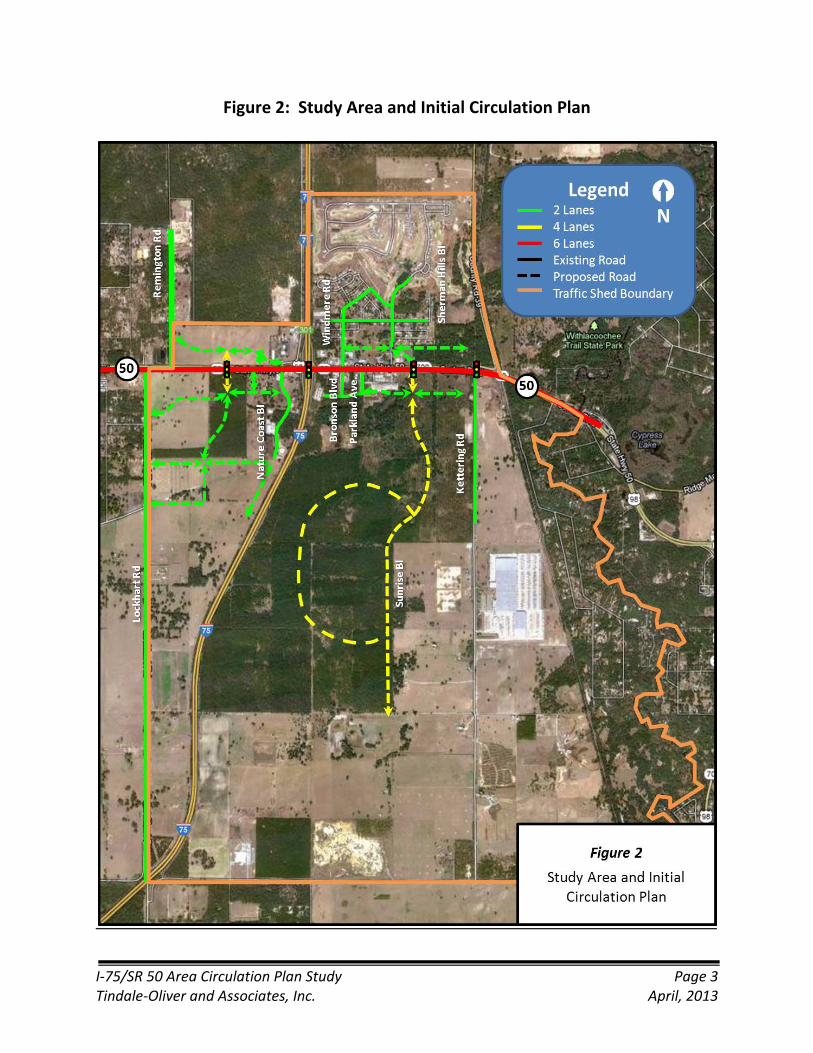
Introduction Various developments have been proposed in the area surrounding the I‐75 and S.R. 50 interchange in Eastern Hernando County. As the area develops, early agreement is needed on the location and character of new and/or enhanced future transportation facilities and services to serve the area. Early planning for transportation corridors allows severe congestion to be moderated, provides for convenient circulation to occur, and provides for alternative routing around potential bottleneck points. Once a circulation plan is established, developments can be designed to accommodate and to take advantage of the transportation facilities, neighborhood‐serving land uses can be strategically located, and subdivisions can be designed to protect sensitive land uses from the negative effects of intrusive traffic. The Florida DOT is in the process of planning and implementing improvements to I‐75 and SR 50. Project Development and Environment (PD&E) studies have been completed for planned widening of I‐75 (to 6 or 8 lanes), and for widening of SR 50 to six lanes in this area. The long‐term planning assessment reflected in the approved PD&E study for I‐75 is that a northbound I‐75 to westbound S.R. 50 fly‐over ramp will be needed(1). In the intervening time, however, a single‐point urban interchange will be provided. The PD&E study for S.R. 50 improvements proposes widening S.R. 50 to six lanes, relocating the existing traffic signal at Bronson Blvd./Windmere Rd. further eastward to either the existing or the proposed Sherman Hills Blvd. location, closure of the existing median openings at Nature Coast Blvd. and Bronson Blvd./Windermere Rd., and eliminating the northbound and southbound through and left turn movements at the Parkland Av. median opening. Figure 1 illustrates these proposed changes. The FDOT improvements are scheduled to commence in late 2014 or 2015. The specific issues of interest addressed in this study are:
evaluation of a circulation plan proposed through individual developments addressing the local and collector roads to the north as south of SR 50, and
the need for constructing elements of that circulation plan to respond to the above proposed changes to SR 50 median and signalization changes.
Elements of the proposed circulation plan are illustrated in Figure 2. 1. Florida Department of Transportation, District 7, “Traffic Technical Memorandum, I‐75 (SR 93) PD&E Study
from North of SR 52 to South of CR 476B”, June, 2007

I‐75/SR 50 Area Circulation Plan Study Page 2 Tindale‐Oliver and Associates, Inc. April, 2013
Figure 1: Proposed Improvements to I‐75 and SR 50
I‐75/SR 50 Area Circulation Plan Study Page 3 Tindale‐Oliver and Associates, Inc. April, 2013
Figure 2: Study Area and Initial Circulation Plan

I‐75/SR 50 Area Circulation Plan Study Page 4 Tindale‐Oliver and Associates, Inc. April, 2013
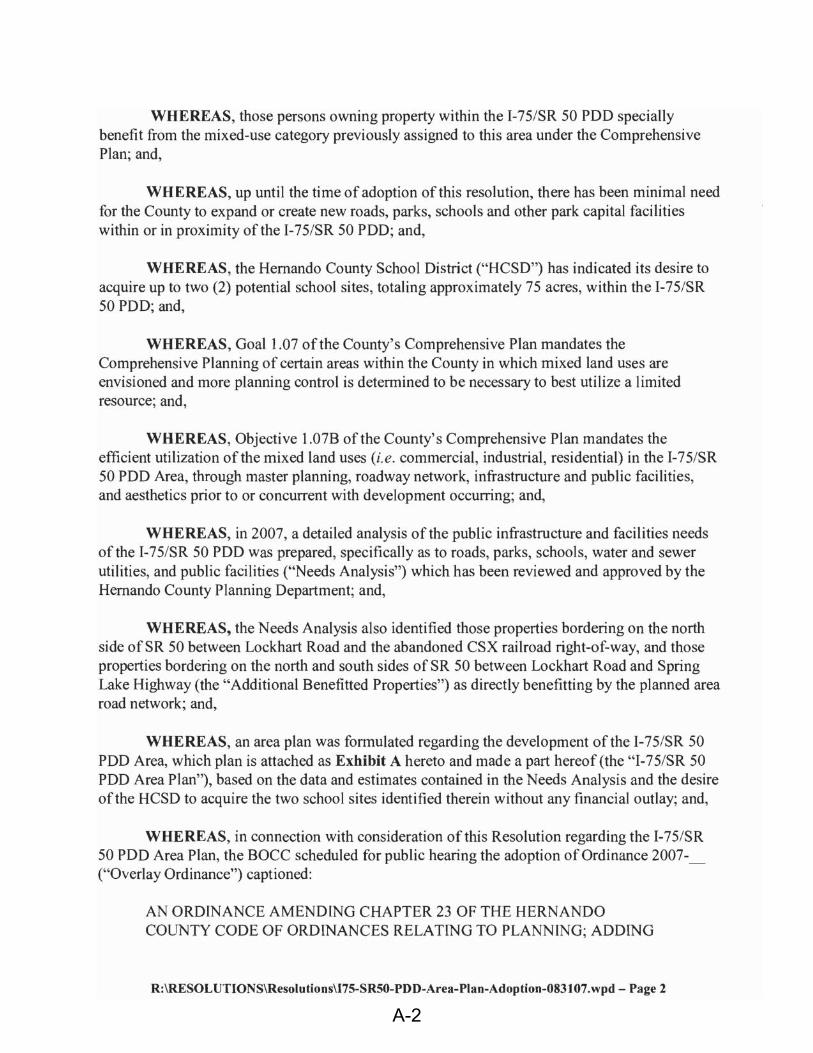
An area circulation plan was undertaken in 2007. The “I‐75/SR 50 PDD Study“ proposed elements of a similar circulation plan, but without the benefit of the FDOT studies. That study resulted in the adoption of a 50 percent surcharge on the prevailing transportation impact fee for development in the PDD district to finance the plan. The plan developed in the 2007 study and adopting resolution are provided in Appendix A.
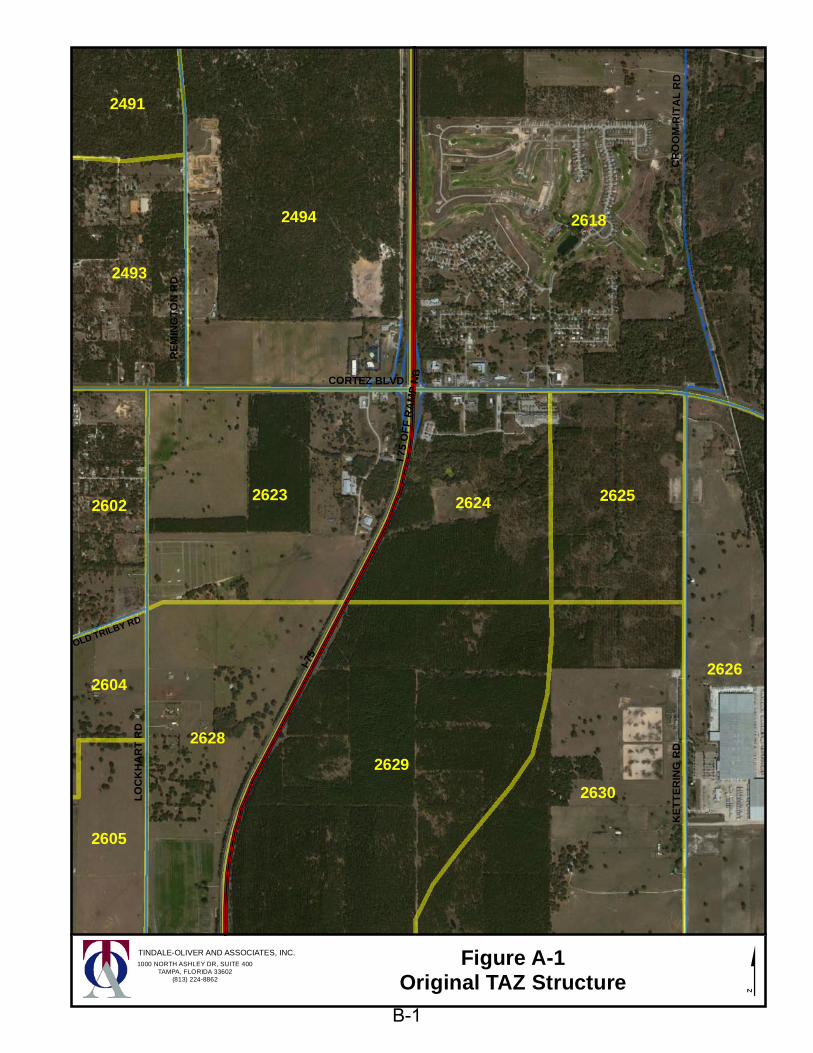
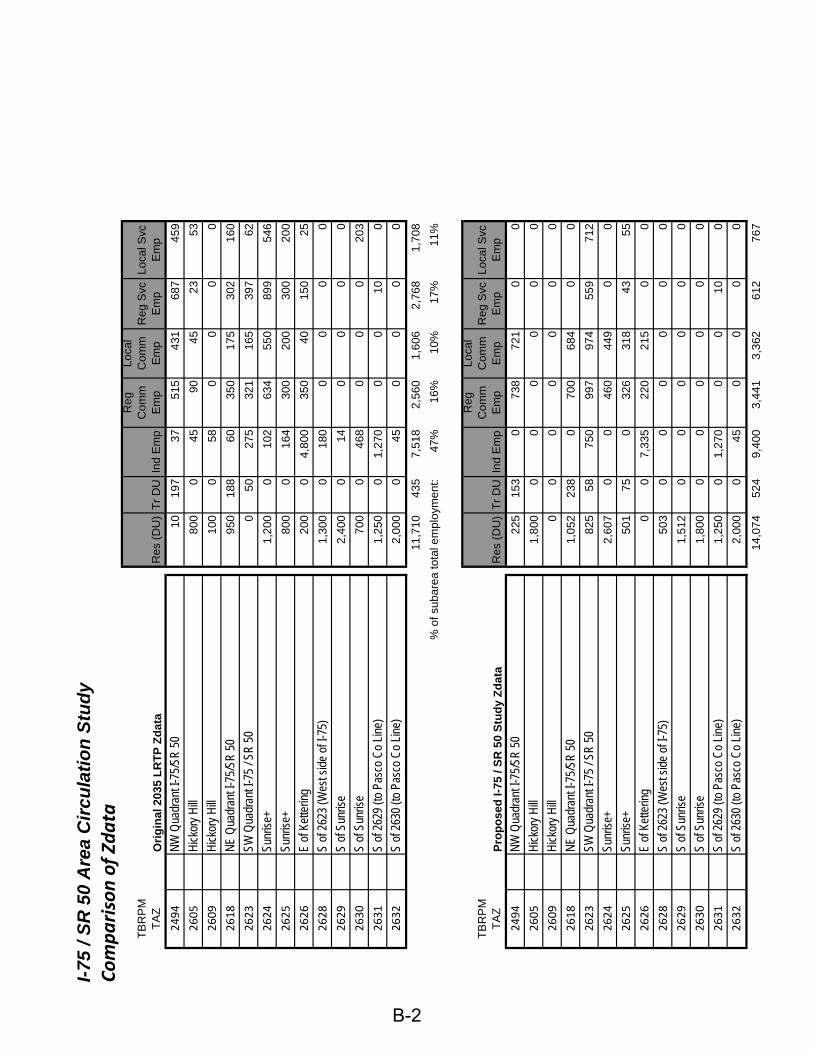
Study Approach The geographic scope of the study is illustrated in Figure 2. The study road network extended from Lockhart Rd. on the west to Kettering Rd. on the east, and approximately one‐half mile to the north and up to two miles south of SR 50. For evaluating future year travel demands, a larger “traffic‐shed” area was also addressed, as also illustrated in Figure 2. An estimated “build‐out” planning horizon was used for the traffic‐shed area, and the adopted 2035 growth projections for all other areas of the Tampa Bay Regional (Transportation) Planning Model (TBRPM) were used. These projections were developed in coordination with the MPO staff and interested landowners. Appendix B provides a traffic analysis zone map and tables documenting the assumptions on which the land use data for each traffic analysis zone was based. In many cases, the existing TBRPM traffic analysis zones were divided to create more realistic loadings to the planned road network.
Growth Assumptions Table 1 summarizes the growth forecasts for the study area “traffic‐shed”. The total number of dwellings assumed in the build‐out traffic‐shed area is 13,074, only five percent greater than the number of dwellings assumed in the current 2035 transportation plan. Growth in employment was to 17,604, nine percent greater than the number of employees previously incorporated into the MPO’s 2035 transportation plan. In addition, employment was shifted from the service sector to retail and industrial employment. The adopted 2035 forecast on which the current transportation plan is based assumed 28 percent of the employees would be in the service sector, whereas the updated data indicated only seven percent. These changes
Table 1: Summary of Growth Forecast Employment
ScenarioResidential
DUTransient
DU IndustrialRegional
CommercialLocal
CommercialRegional Service
Local Service
2006 802 315 2,296 17 488 265 131
2035 Adopted MPO Plan 12,510 435 7,540 2,560 1,606 2,768 1,708
2050 "Build‐Out" 13,074 524 9,422 3,441 3,362 612 767
I‐75/SR 50 Area Circulation Plan Study Page 5 Tindale‐Oliver and Associates, Inc. April, 2013
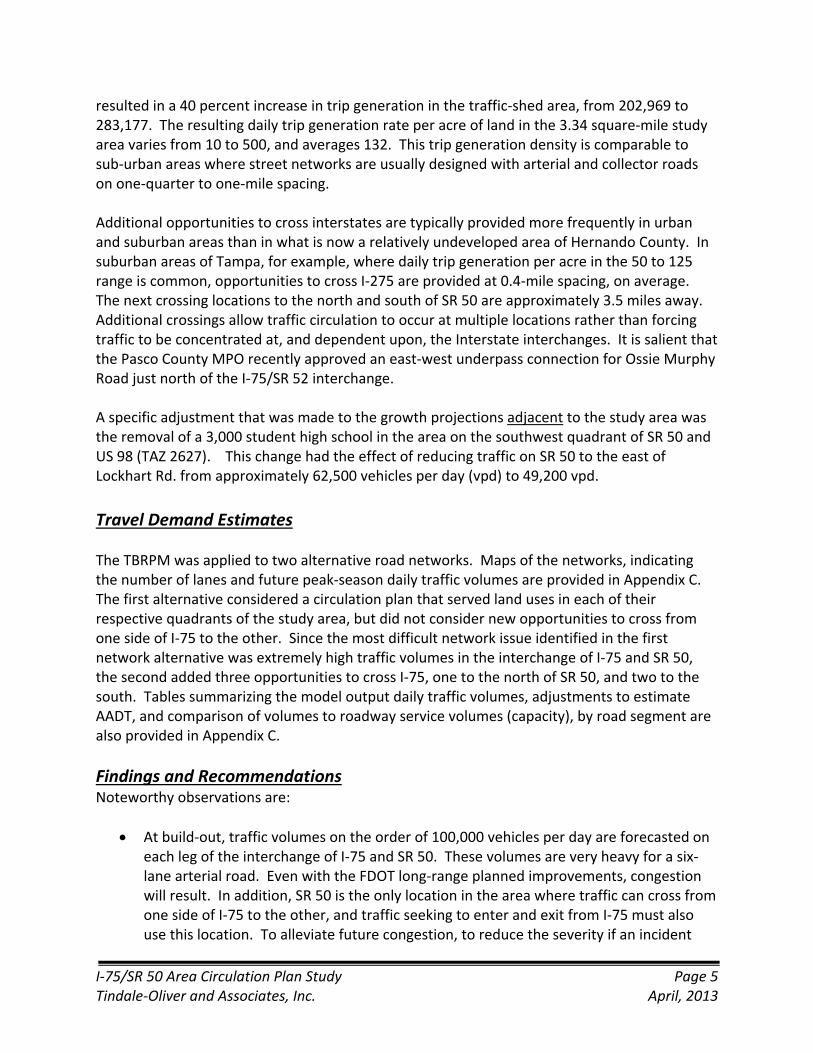
resulted in a 40 percent increase in trip generation in the traffic‐shed area, from 202,969 to 283,177. The resulting daily trip generation rate per acre of land in the 3.34 square‐mile study area varies from 10 to 500, and averages 132. This trip generation density is comparable to sub‐urban areas where street networks are usually designed with arterial and collector roads on one‐quarter to one‐mile spacing. Additional opportunities to cross interstates are typically provided more frequently in urban and suburban areas than in what is now a relatively undeveloped area of Hernando County. In suburban areas of Tampa, for example, where daily trip generation per acre in the 50 to 125 range is common, opportunities to cross I‐275 are provided at 0.4‐mile spacing, on average. The next crossing locations to the north and south of SR 50 are approximately 3.5 miles away. Additional crossings allow traffic circulation to occur at multiple locations rather than forcing traffic to be concentrated at, and dependent upon, the Interstate interchanges. It is salient that the Pasco County MPO recently approved an east‐west underpass connection for Ossie Murphy Road just north of the I‐75/SR 52 interchange. A specific adjustment that was made to the growth projections adjacent to the study area was the removal of a 3,000 student high school in the area on the southwest quadrant of SR 50 and US 98 (TAZ 2627). This change had the effect of reducing traffic on SR 50 to the east of Lockhart Rd. from approximately 62,500 vehicles per day (vpd) to 49,200 vpd.
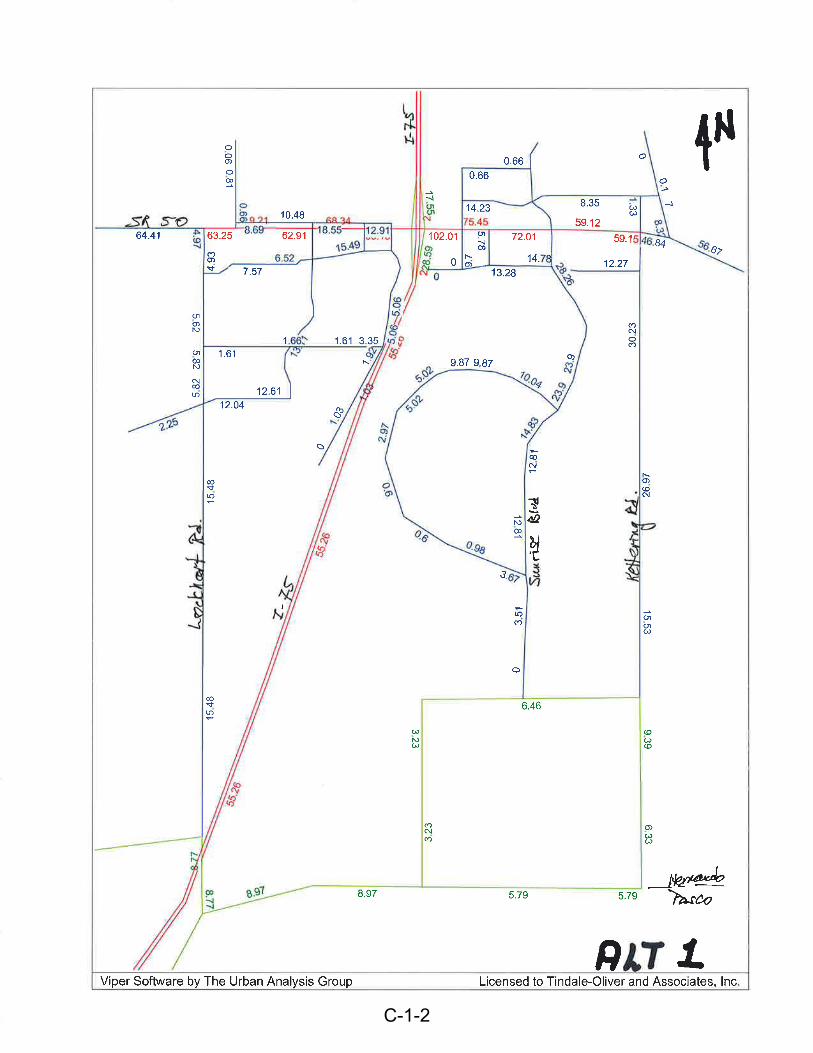
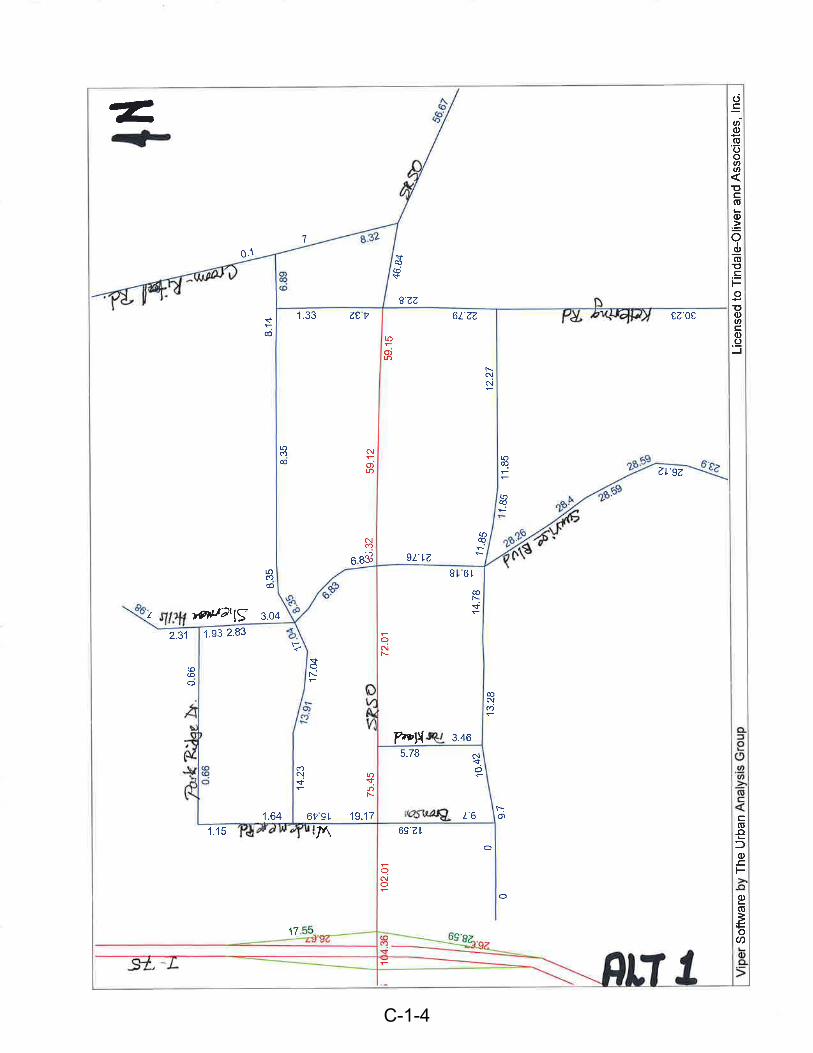
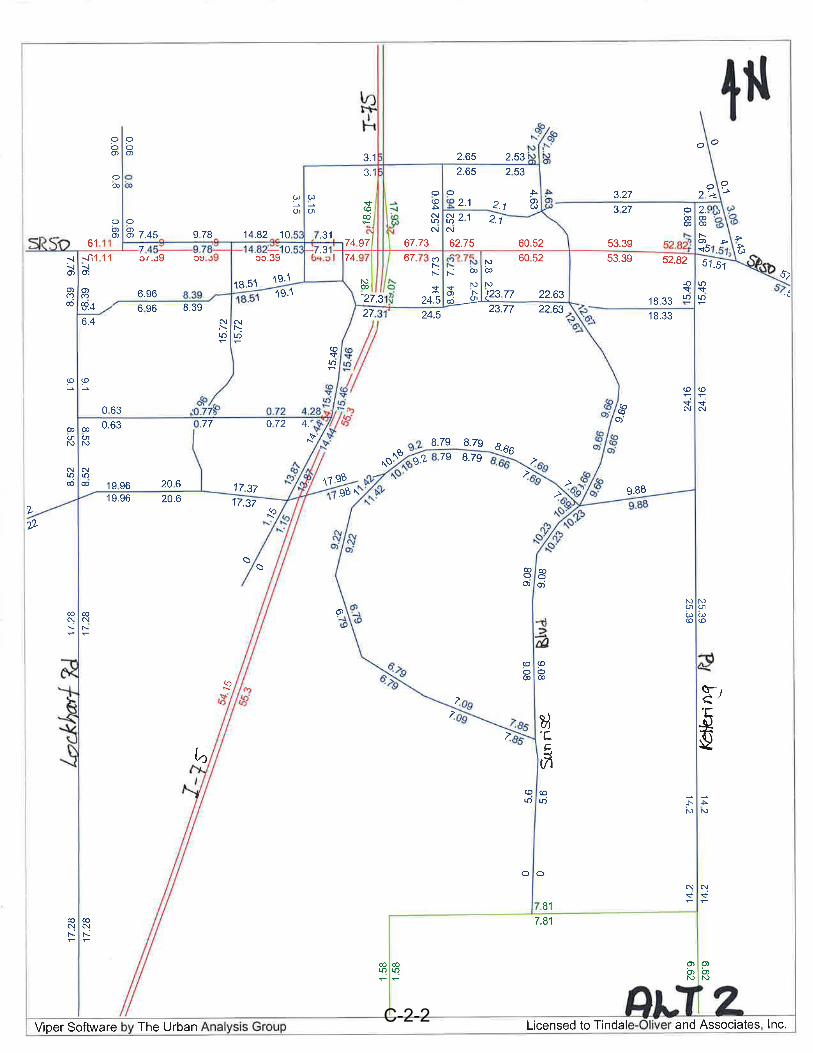
Travel Demand Estimates The TBRPM was applied to two alternative road networks. Maps of the networks, indicating the number of lanes and future peak‐season daily traffic volumes are provided in Appendix C. The first alternative considered a circulation plan that served land uses in each of their respective quadrants of the study area, but did not consider new opportunities to cross from one side of I‐75 to the other. Since the most difficult network issue identified in the first network alternative was extremely high traffic volumes in the interchange of I‐75 and SR 50, the second added three opportunities to cross I‐75, one to the north of SR 50, and two to the south. Tables summarizing the model output daily traffic volumes, adjustments to estimate AADT, and comparison of volumes to roadway service volumes (capacity), by road segment are also provided in Appendix C.
Findings and Recommendations Noteworthy observations are:
At build‐out, traffic volumes on the order of 100,000 vehicles per day are forecasted on each leg of the interchange of I‐75 and SR 50. These volumes are very heavy for a six‐lane arterial road. Even with the FDOT long‐range planned improvements, congestion will result. In addition, SR 50 is the only location in the area where traffic can cross from one side of I‐75 to the other, and traffic seeking to enter and exit from I‐75 must also use this location. To alleviate future congestion, to reduce the severity if an incident

I‐75/SR 50 Area Circulation Plan Study Page 6 Tindale‐Oliver and Associates, Inc. April, 2013
should temporarily close some lanes under I‐75, and to defer the need for more costly improvements and hindrance to property access on SR 50, the County should pursue opportunities to develop additional crossings between the east and west sides of I‐75 at other locations. Potential I‐75 crossings should be jointly pursued with FDOT. Initial testing of additional crossings resulted in daily traffic reductions on SR 50 of approximately 30 to 35 percent, adjacent to I‐75.
The traffic volume forecasts for I‐75 and SR 50 that are incorporated into the TBRPM and FDOT PD&E studies bear discussion. Figure 3 illustrates the past 12 years of traffic counts, a trendline reflecting the past 12 years of recorded counts, and the forecasts of the MPO/FDOT in 2030 and 2035, where available. (The I‐75 PD&E study used a horizon year of 2030, the SR 50 PD&E study used a horizon year of 2035.) The growth trend over the past 15 years at traffic count stations surrounding the interchange of I‐75 and SR 50 indicate a growth rate of only one to two percent per year, but the design traffic forecasts for I‐75 incorporate a six percent per year growth rate, and the growth rates on SR 50 incorporate 12 to 15 percent per year growth rates. While these higher growth expectations may have been expected in 2007 (before the recent economic
Figure 3: Trend Growth and TBRPM/PD&E Study Volume Estimates
0
10,000
20,000
30,000
40,000
50,000
60,000
70,000
80,000
90,000
100,000
1990 1995 2000 2005 2010 2015 2020 2025 2030 2035 2040
AADT
YearSources: 2010 Florida Traffic Information CD, FDOT I‐75 (SR 93) PD&E Study, June,
2007
AADT TrendI‐75 North of SR 50
Counts
Trend
I‐75 PD&E Forecast
0
10,000
20,000
30,000
40,000
50,000
60,000
70,000
80,000
90,000
1990 1995 2000 2005 2010 2015 2020 2025 2030 2035 2040
AADT
YearSources: 2010 Florida Traffic Information, FDOT I‐75 (SR 93) PD&E Study, June, 2007,
FDOT SR 50 (Cortez Boulevard) PD&E Study, November, 2011.
AADT TrendSR 50 West of I‐75
Counts
Trend
I‐75 PD&E Forecast
SR 50 PD&E Forecast
0
10,000
20,000
30,000
40,000
50,000
60,000
70,000
80,000
90,000
100,000
1990 1995 2000 2005 2010 2015 2020 2025 2030 2035 2040
AADT
YearSources: 2010 Florida Traffic Information, FDOT I‐75 (SR 93) PD&E Study, June, 2007
AADT TrendI‐75 South of SR 50
Counts
Trend
I‐75 PD&E Forecast
0
10,000
20,000
30,000
40,000
50,000
60,000
70,000
80,000
90,000
1990 1995 2000 2005 2010 2015 2020 2025 2030 2035 2040
AADT
YearSources: 2010 Florida Traffic Information, FDOT I‐75 (SR 93) PD&E Study, June, 2007,
FDOT SR 50 (Cortez Boulevard) PD&E Study, November, 2011.
AADT TrendSR 50 East of I‐75
Counts
Trend
I‐75 PD&E Forecast
SR 50 PD&E Forecast

I‐75/SR 50 Area Circulation Plan Study Page 7 Tindale‐Oliver and Associates, Inc. April, 2013
recession), the forecasts result in traffic volume estimates by 2030 that double to more than quadruple the current daily traffic volumes. The volume forecasts of this study make use of the same growth forecasts, but it is reasonable to acknowledge that these growth forecasts depend on both local growth and regional traffic growth that may not occur as originally thought. Thus, the interim improvements may have service lives greater than estimated, and that the need for elements of the local circulation plan may not materialize as quickly as initially anticipated.
Figure 4 illustrates the generalized recommendations regarding needed number of lanes for the local circulation system. Two lanes will suffice for most roads, but in some cases
Figure 4: Recommended Circulation Plan

I‐75/SR 50 Area Circulation Plan Study Page 8 Tindale‐Oliver and Associates, Inc. April, 2013
four lanes will be needed. The more significant number of lanes are generally needed where some of the busier roads approach SR 50, and serve as major land access roads
that collect traffic and convey it to SR 50. In the alternative 1 test, it appears that some
traffic used the reverse‐frontage roads to avoid congestion on SR 50, resulting in traffic volumes that border on the need for four lanes. In alternative test 2, the connection of Cracker Crossing over I‐75 to Nature Coast Blvd. attracted enough traffic to require four‐lanes. Two lanes proved to be adequate for the other two crossings included in the network test. A crossing north of SR 50 only attracted 3,000 vehicles per day, making it of little value; therefore, this crossing was eliminated from the study recommendations.
The circulation plan illustrated in Figure 4 is recommended for inclusion in the Hernando County MPO’s Long‐Range Transportation Plan, and Hernando County’s Comprehensive Plan Traffic Circulation Element. This Plan includes provision of two potential crossings over I‐75 to the south of SR 50.
Generalized planning cost estimates for the network plan are provided in Appendix D. The total estimated plan network cost for construction of an additional 20.1 lane‐miles of roadway, including land value, design, construction and bridges, is estimated to be on the order of $39 million. However, development contribution for some of the network improvements is anticipated.
Elements of the local circulation system are associated with specific developments. The realignment of Sherman Hills Blvd. is associated with the development of it’s adjacent parcel, and the construction of Sunrise Blvd. to the south of SR 50 is associated with the Sunrise Development of Regional Impact. Other elements of the circulation plan should be implemented as adjacent lands are developed.
Most elements of the proposed circulation plan need not be implemented in the immediate future since SR 50 will continue to allow U‐turns to facilitate access to the existing local street system. However, one exception to this generalization might be the realignment of Sherman Hills Blvd. and the westward access road to it, identified in Figure 4 as segments “A” and “B”.
Hernando County should advance the planning process for segments A and B into route alignment studies and/or design. This work will identify more exact alignments, traffic operational requirements, right‐of‐way needs, stormwater treatment strategies, and pond requirements so that land developments adjacent to the roadways can be coordinated. Consistent with the currently scheduled SR 50 improvement, design and construction of segment “B” should be pursued quickly as the design‐build services for improvements to SR 50 are to commence in late 2014 or 2015 (schedule as of the initiation date of this study). Estimated budgets for these activities are summarized below:

I‐75/SR 50 Area Circulation Plan Study Page 9 Tindale‐Oliver and Associates, Inc. April, 2013
*Right‐of‐Way for segment B, the Sherman Hills realignment, has already been dedicated to Hernando County.
The above recommendations are consistent with guidance provided by the Institute of Transportation Engineers Proposed Recommended Practice “Planning Urban Roadway Systems” (2) – specifically the objectives of:
providing adequate capacity for expected travel demands,
providing a network at a scale suitable for transit, pedestrian, and bicycle travel,
providing for routing alternatives for normal daily traffic flow as well as incident management purposes, and
developing networks with more frequently spaced roadways rather than relying on sparse networks of wide arterials.
2. Institute of Transportation Engineers, “Planning Urban Roadway Systems – An ITE Proposed Recommended Practice”, 2011.
Segment From/To Design ROW Const/CEI/Cont Total
A Windmere to Sheman Hills $40,300 $33,818 $387,500 $461,618
B Segment A to SR 50 $22,491 $0* $466,263 $488,754

Appendix A
2007 “I‐75/SR 50 PDD Study” Resolution and Road Plan

A-1
A-2

A-3

A-4

A-5

Appendix B
Socio‐Economic Data Forecast
2618
2629
2494
2630
2623
2626
2628
2624 2625
2493
2602
2605
2491
2604
I-75
CORTEZ BLVD
LO
CK
HA
RT
RD
CR
OO
M R
I TA
L R
D
I 75
OF
F R
AM
P N
B
Figure A-1Original TAZ Structure $
TINDALE-OLIVER AND ASSOCIATES, INC.1000 NORTH ASHLEY DR, SUITE 400
TAMPA, FLORIDA 33602(813) 224-8862
KE
TT
ER
ING
RD
RE
MIN
GT
ON
RD
OLD TRILBY RD
B-1
I-75
/ S
R 5
0 A
rea
Cir
cula
tio
n S
tud
yCo
mpa
rison
of Z
data
TB
RP
M
TA
ZO
rig
inal
203
5 L
RT
P Z
dat
aR
es (
DU
)T
r D
UIn
d E
mp
Reg
C
omm
E
mp
Loca
l C
omm
E
mp
Reg
Svc
E
mp
Loca
l Svc
E
mp
2494
NW
Qua
dran
t I-7
5/SR
50
1019
737
515
431
687
459
2605
Hic
kory
Hill
800
045
9045
2353
2609
Hic
kory
Hill
100
058
00
00
2618
NE
Qua
dran
t I-7
5/SR
50
950
188
6035
017
530
216
0
2623
SW Q
uadr
ant I
-75
/ SR
50
050
275
321
165
397
62
2624
Sunr
ise+
1,20
00
102
634
550
899
546
2625
Sunr
ise+
800
016
430
020
030
020
0
2626
E of
Ket
terin
g20
00
4,80
035
040
150
25
2628
S of
262
3 (W
est s
ide
of I-
75)
1,30
00
180
00
00
2629
S of
Sun
rise
2,40
00
140
00
0
2630
S of
Sun
rise
700
046
80
00
203
2631
S of
262
9 (to
Pas
co C
o Li
ne)
1,25
00
1,27
00
010
0
2632
S of
263
0 (to
Pas
co C
o Li
ne)
2,00
00
450
00
0
11,7
1043
57,
518
2,56
01,
606
2,76
81,
708
% o
f sub
area
tota
l em
ploy
men
t:47
%16
%10
%17
%11
%
TB
RP
M
TA
ZP
rop
ose
d I-
75 /
SR
50
Stu
dy
Zd
ata
Res
(D
U)
Tr
DU
Ind
Em
p
Reg
C
omm
E
mp
Loca
l C
omm
E
mp
Reg
Svc
E
mp
Loca
l Svc
E
mp
2494
NW
Qua
dran
t I-7
5/SR
50
225
153
073
872
10
0
2605
Hic
kory
Hill
1,80
00
00
00
0
2609
Hic
kory
Hill
00
00
00
0
2618
NE
Qua
dran
t I-7
5/SR
50
1,05
223
80
700
684
00
2623
SW Q
uadr
ant I
-75
/ SR
50
825
5875
099
797
455
971
2
2624
Sunr
ise+
2,60
70
046
044
90
0
2625
Sunr
ise+
501
750
326
318
4355
2626
E of
Ket
terin
g0
07,
335
220
215
00
2628
S of
262
3 (W
est s
ide
of I-
75)
503
00
00
00
2629
S of
Sun
rise
1,51
20
00
00
0
2630
S of
Sun
rise
1,80
00
00
00
0
2631
S of
262
9 (to
Pas
co C
o Li
ne)
1,25
00
1,27
00
010
0
2632
S of
263
0 (to
Pas
co C
o Li
ne)
2,00
00
450
00
0
14,0
7452
49,
400
3,44
13,
362
612
767
B-2

2631
2494
2632
2626
2640
2628
2493
2620
2618
2602
2605
2659
2491
2661
2664
2641
2638
2672
2604
2678
2660
2677
2674
2636
2644
2679
2645
2655
2680
2663
2675
2668
2665 2666
2643
2676
2654
2658
2662
26522673
26392637
2656
2669
265026492647
2657
2642
2667
2646
26532671
2651
2670
2648
I-75
CORTEZ BLVD
LO
CK
HA
RT
RD
CR
OO
M R
I TA
L R
D
Figure A-2Modified TAZ Structure $
TINDALE-OLIVER AND ASSOCIATES, INC.1000 NORTH ASHLEY DR, SUITE 400
TAMPA, FLORIDA 33602(813) 224-8862
KE
TT
ER
ING
RD
RE
MIN
GT
ON
RD
OLD TRILBY RD
B-3
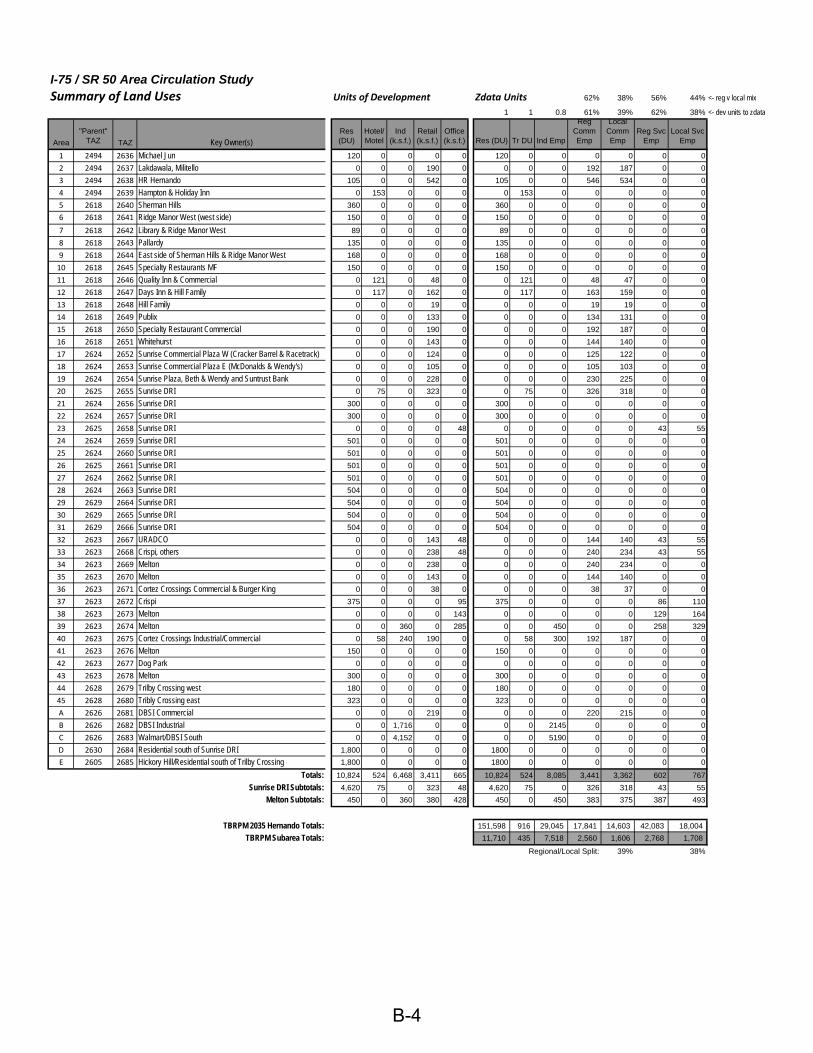
I-75 / SR 50 Area Circulation StudySummary of Land Uses Units of Development Zdata Units 62% 38% 56% 44% <- reg v local mix
1 1 0.8 61% 39% 62% 38% <- dev units to zdata
Area
"Parent" TAZ TAZ Key Owner(s)
Res (DU)
Hotel/ Motel
Ind (k.s.f.)
Retail (k.s.f.)
Office (k.s.f.) Res (DU) Tr DU Ind Emp
Reg Comm Emp
Local Comm Emp
Reg Svc Emp
Local Svc Emp
1 2494 2636 Michael Jun 120 0 0 0 0 120 0 0 0 0 0 0
2 2494 2637 Lakdawala, Militello 0 0 0 190 0 0 0 0 192 187 0 0
3 2494 2638 HR Hernando 105 0 0 542 0 105 0 0 546 534 0 0
4 2494 2639 Hampton & Holiday Inn 0 153 0 0 0 0 153 0 0 0 0 0
5 2618 2640 Sherman Hills 360 0 0 0 0 360 0 0 0 0 0 0
6 2618 2641 Ridge Manor West (west side) 150 0 0 0 0 150 0 0 0 0 0 0
7 2618 2642 Library & Ridge Manor West 89 0 0 0 0 89 0 0 0 0 0 0
8 2618 2643 Pallardy 135 0 0 0 0 135 0 0 0 0 0 0
9 2618 2644 East side of Sherman Hills & Ridge Manor West 168 0 0 0 0 168 0 0 0 0 0 0
10 2618 2645 Specialty Restaurants MF 150 0 0 0 0 150 0 0 0 0 0 0
11 2618 2646 Quality Inn & Commercial 0 121 0 48 0 0 121 0 48 47 0 0
12 2618 2647 Days Inn & Hill Family 0 117 0 162 0 0 117 0 163 159 0 0
13 2618 2648 Hill Family 0 0 0 19 0 0 0 0 19 19 0 0
14 2618 2649 Publix 0 0 0 133 0 0 0 0 134 131 0 0
15 2618 2650 Specialty Restaurant Commercial 0 0 0 190 0 0 0 0 192 187 0 0
16 2618 2651 Whitehurst 0 0 0 143 0 0 0 0 144 140 0 0
17 2624 2652 Sunrise Commercial Plaza W (Cracker Barrel & Racetrack) 0 0 0 124 0 0 0 0 125 122 0 0
18 2624 2653 Sunrise Commercial Plaza E (McDonalds & Wendy's) 0 0 0 105 0 0 0 0 105 103 0 0
19 2624 2654 Sunrise Plaza, Beth & Wendy and Suntrust Bank 0 0 0 228 0 0 0 0 230 225 0 0
20 2625 2655 Sunrise DRI 0 75 0 323 0 0 75 0 326 318 0 0
21 2624 2656 Sunrise DRI 300 0 0 0 0 300 0 0 0 0 0 0
22 2624 2657 Sunrise DRI 300 0 0 0 0 300 0 0 0 0 0 0
23 2625 2658 Sunrise DRI 0 0 0 0 48 0 0 0 0 0 43 55
24 2624 2659 Sunrise DRI 501 0 0 0 0 501 0 0 0 0 0 0
25 2624 2660 Sunrise DRI 501 0 0 0 0 501 0 0 0 0 0 0
26 2625 2661 Sunrise DRI 501 0 0 0 0 501 0 0 0 0 0 0
27 2624 2662 Sunrise DRI 501 0 0 0 0 501 0 0 0 0 0 0
28 2624 2663 Sunrise DRI 504 0 0 0 0 504 0 0 0 0 0 0
29 2629 2664 Sunrise DRI 504 0 0 0 0 504 0 0 0 0 0 0
30 2629 2665 Sunrise DRI 504 0 0 0 0 504 0 0 0 0 0 0
31 2629 2666 Sunrise DRI 504 0 0 0 0 504 0 0 0 0 0 0
32 2623 2667 URADCO 0 0 0 143 48 0 0 0 144 140 43 55
33 2623 2668 Crispi, others 0 0 0 238 48 0 0 0 240 234 43 55
34 2623 2669 Melton 0 0 0 238 0 0 0 0 240 234 0 0
35 2623 2670 Melton 0 0 0 143 0 0 0 0 144 140 0 0
36 2623 2671 Cortez Crossings Commercial & Burger King 0 0 0 38 0 0 0 0 38 37 0 0
37 2623 2672 Crispi 375 0 0 0 95 375 0 0 0 0 86 110
38 2623 2673 Melton 0 0 0 0 143 0 0 0 0 0 129 164
39 2623 2674 Melton 0 0 360 0 285 0 0 450 0 0 258 329
40 2623 2675 Cortez Crossings Industrial/Commercial 0 58 240 190 0 0 58 300 192 187 0 0
41 2623 2676 Melton 150 0 0 0 0 150 0 0 0 0 0 0
42 2623 2677 Dog Park 0 0 0 0 0 0 0 0 0 0 0 0
43 2623 2678 Melton 300 0 0 0 0 300 0 0 0 0 0 0
44 2628 2679 Trilby Crossing west 180 0 0 0 0 180 0 0 0 0 0 0
45 2628 2680 Tribly Crossing east 323 0 0 0 0 323 0 0 0 0 0 0
A 2626 2681 DBSI Commercial 0 0 0 219 0 0 0 0 220 215 0 0
B 2626 2682 DBSI Industrial 0 0 1,716 0 0 0 0 2145 0 0 0 0
C 2626 2683 Walmart/DBSI South 0 0 4,152 0 0 0 0 5190 0 0 0 0
D 2630 2684 Residential south of Sunrise DRI 1,800 0 0 0 0 1800 0 0 0 0 0 0
E 2605 2685 Hickory Hill/Residential south of Trilby Crossing 1,800 0 0 0 0 1800 0 0 0 0 0 0
Totals: 10,824 524 6,468 3,411 665 10,824 524 8,085 3,441 3,362 602 767
Sunrise DRI Subtotals: 4,620 75 0 323 48 4,620 75 0 326 318 43 55
Melton Subtotals: 450 0 360 380 428 450 0 450 383 375 387 493
TBRPM 2035 Hernando Totals: 151,598 916 29,045 17,841 14,603 42,083 18,004
TBRPM Subarea Totals: 11,710 435 7,518 2,560 1,606 2,768 1,708
Regional/Local Split: 39% 38%
B-4

Appendix C
Network Alternative Testing Results In this appendix, worksheets and maps associated with each alternative are identified by using page numbers in the format C‐xx‐yy, where xx corresponds to the scenario and yy is the page number within the scenario. The scenarios are numbered as follows:
1. Alternative 1 2. Alternative 2

Alternative 1
Long
‐Term Volum
e Estim
ates
On: From/To
2035 M
odel
Volume
2035 AADT
Estimate
K100
D
(NB/EB)
Pk Hr
Total V
ol
(NB/EB)
Pk Hr
Total V
ol
(SB/W
B)
One‐
Way
Lanes
Needed
LOS Std
Needed
Road
Type
Daily Svc
Vol(1
)
SR 50: W. of Lockhart
60,000
57,600
0.091
0.490
2,568
2,673
3D
6D
59,900
SR 50: Lockhart to Drive 1
62,000
59,520
0.091
0.490
2,654
2,762
3D
6D
59,900
SR 50: Drive 1 to Drive 2
68,300
65,568
0.091
0.490
2,924
3,043
3D
8D
80,100
SR 50: Drive 2 to Nature Coast Bl.
80,200
76,992
0.091
0.490
3,433
3,573
4D
8D
80,100
SR 50: Nature Coast Bl. to I‐75
106,000
101,760
0.091
0.490
4,537
4,723
5D
10D
100,000
SR 50: I‐75 to W
indmere/Bronson
102,000
97,920
0.091
0.550
4,901
4,010
5D
10D
100,000
SR 50: Windmere/Bronson to Parkland
75,500
72,480
0.091
0.550
3,628
2,968
4D
8D
80,100
SR 50: Parkland Av to Sherman
Hills
72,000
69,120
0.091
0.550
3,459
2,830
4D
8D
80,100
SR 50: Sherman
Hills to Sunrise Bl
72,000
69,120
0.091
0.550
3,459
2,830
4D
8D
80,100
SR 50: Sunrise Bl to Kettering Rd
62,000
59,520
0.091
0.550
2,979
2,437
3D
6D
59,900
SR 50: E of Kettering Rd.
46,800
44,928
0.091
0.550
2,249
1,840
2D
6D
59,900
Lockhart S of SR
50
5,000
4,800
0.091
0.565
247
190
1D
2U
8,200
Drive 1 S of SR
50
15,200
14,592
0.091
0.565
750
578
1D
2D
12,000
Drive 1 N
of SR
50
16,500
15,840
0.091
0.500
721
721
1D
2D
12,000
Drive 2 S of SR
50
16,300
15,648
0.091
0.565
805
619
1D
2D
12,000
Drive 2 N
of SR
50
6,300
6,048
0.091
0.500
275
275
1D
2U
8,200
Nature Coast S of SR
50
14,000
13,440
0.091
0.565
691
532
1D
2D
12,000
Nature Coast N of SR
50
13,000
12,480
0.091
0.500
568
568
1D
2D
12,000
I‐75 S of SR
50
109,624
105,239
0.091
0.560
5,363
4,214
6C
8F
123,500
I‐75 N
of SR
50
88,354
84,820
0.091
0.560
4,322
3,396
5C
6F
93,000
Windermere/Bronson S of SR
50
12,600
12,096
0.091
0.500
550
550
1D
2D
12,000
Windermere/Bronson N
of SR
50
19,200
18,432
0.091
0.565
948
730
1D
2D
12,000
Parkland S of SR
50
5,800
5,568
0.091
0.435
220
286
1D
2U
8,200
Parkland N
of SR
50
1,700
1,632
0.091
0.500
74
74
1D
2U
8,200
Sherman
Hills S of SR
50
6,000
5,760
0.091
0.500
262
262
1D
2U
8,200
Sherman
Hills N of SR
50
2,000
1,920
0.091
0.565
99
76
1D
2U
8,200
Sunrise S of SR
50
21,800
20,928
0.091
0.435
828
1,076
1D
4D
23,900
Sunrise N
of SR
50
6,800
6,528
0.091
0.565
336
258
1D
2U
8,200
Kettering S of SR
50
22,800
21,888
0.091
0.565
1,125
866
1D
4D
23,900
Kettering N of SR
50
4,300
4,128
0.091
0.565
212
163
1D
2U
8,200
Capa
city value
s based
on the follo
wing:
Road
Type
Daily
Capacity
No Lanes
Sat
Flow/
Lane
G:C
phf
% turns
k
2D
12,000
21850
0.35
0.925
0.35
0.09
2U
8,200
21480
0.3
0.925
0.35
0.09
4D
23,900
41850
0.35
0.925
0.35
0.09
6D
59,900
FDOT Gen
eralized
Annual Average Daily Capacity table, 2012 Q/LOS Handbook
6F
93,000
FDOT Gen
eralized
Annual Average Daily Capacity table, 2012 Q/LOS Handbook
8D
80,100
FDOT Gen
eralized
Annual Average Daily Capacity table, 2012 Q/LOS Handbook
8F
123,500
FDOT Gen
eralized
Annual Average Daily Capacity table, 2012 Q/LOS Handbook
10D
100,125
FDOT Gen
eralized
Annual Average Daily Capacity table, 2012 Q/LOS Handbook
C-1-1
C-1-2

C-1-3
C-1-4

Alternative 2
Long
‐Term Volum
e Estim
ates
On: From/To
2035 M
odel
Volume
2035 AADT
Estimate
K100
D
(NB/EB)
Pk Hr
Total V
ol
(NB/EB)
Pk Hr
Total V
ol
(SB/W
B)
One‐
Way
Lanes
Needed
LOS Std
Needed
Road
Type
Daily Svc
Vol(1
)
SR50:W.ofLockhart
65,129
62,500
0.091
0.490
2,787
2,901
3D
6D
59,900
SR 50: W. of Lockhart
65,129
62,500
0.091
0.490
2,787
2,901
3D
6D
59,900
SR 50: Lockhart to Drive 1
60,250
57,800
0.091
0.490
2,577
2,682
3D
6D
59,900
SR 50: Drive 1 to Drive 2
55,390
53,200
0.091
0.490
2,372
2,469
3D
8D
80,100
SR 50: Drive 2 to Nature Coast Bl.
64,500
61,900
0.091
0.490
2,760
2,873
3D
8D
80,100
SR 50: Nature Coast Bl. to I‐75
74,970
72,000
0.091
0.490
3,210
3,342
4D
10D
100,000
SR 50: I‐75 to W
indmere/Bronson
67,730
65,000
0.091
0.550
3,253
2,662
4D
10D
100,000
SR 50: Windmere/Bronson to Parkland
62,750
60,200
0.091
0.550
3,013
2,465
3D
8D
80,100
SR 50: Parkland Av to Sherman
Hills
63,060
60,500
0.091
0.550
3,028
2,477
3D
8D
80,100
SR50
Sherman
Hillsto
Sunrise
Bl
60520
58100
0091
0550
2908
2379
3D
8D
80100
SR 50: Sherman
Hills to Sunrise Bl
60,520
58,100
0.091
0.550
2,908
2,379
3D
8D
80,100
SR 50: Sunrise Bl to Kettering Rd
56,720
54,500
0.091
0.550
2,728
2,232
3D
6D
59,900
SR 50: E of Kettering Rd.
51,510
49,400
0.091
0.550
2,472
2,023
3D
6D
59,900
Lockhart S of SR
50
7,760
7,400
0.091
0.565
380
293
1D
2U
8,200
Drive 1 S of SR
50
16,710
16,000
0.091
0.565
823
633
1D
2D
12,000
Drive 1 N
of SR
50
14,949
14,400
0.091
0.500
655
655
1D
2D
12,000
Drive 2 S of SR
50
10,550
10,100
0.091
0.565
519
400
1D
2D
12,000
Drive 2 N
of SR
50
680
700
0.091
0.500
32
32
1D
2U
8,200
Nature Coast S of SR
50
10,540
10,100
0.091
0.565
519
400
1D
2D
12,000
Nature Coast N of SR
50
7,310
7,000
0.091
0.500
319
319
0D
2D
12,000
I‐75 S of SR
50
109,450
105,100
0.091
0.560
5,356
4,208
6C
8F
123,500
I‐75 N
of SR
50
88,255
84,700
0.091
0.560
4,316
3,391
5C
6F
93,000
Windermere/Bronson S of SR
50
7,730
7,400
0.091
0.500
337
337
0D
2D
12,000
Windermere/Bronson N
of SR
50
4,580
4,400
0.091
0.565
226
174
0D
2D
12,000
Parkland S of SR
50
2,800
2,700
0.091
0.435
107
139
1D
2U
8,200
,,
,
Parkland N
of SR
50
5,865
5,600
0.091
0.500
255
255
1D
2U
8,200
Sherman
Hills S of SR
50
6,000
5,800
0.091
0.500
264
264
1D
2U
8,200
Sherman
Hills N of SR
50
2,000
1,900
0.091
0.565
98
75
1D
2U
8,200
Sunrise S of SR
50
17,580
16,900
0.091
0.435
669
869
1D
4D
23,900
Sunrise N
of SR
50
2,870
2,800
0.091
0.565
144
111
1D
2U
8,200
Kettering S of SR
50
15,450
14,800
0.091
0.565
761
586
1D
4D
23,900
Kettering N of SR
50
4,970
4,800
0.091
0.565
247
190
0D
2U
8,200
Buckner
OverI75
27310
26200
0091
0565
1347
1037
1D
4D
23900
Buckner Over I‐75
27,310
26,200
0.091
0.565
1,347
1,037
1D
4D
23,900
Nature Trail/Sunrise M
idway over I‐75(2)
17,982
17,300
0.091
0.565
889
685
1D
2U
17,800
1. Capacity values based
on the following:
Road
Type
Daily
Cap
acity
No Lan
es
Sat
Flow/
Lane
G:C
phf
% turns
k
2D
12,000
21850
0.35
0.925
0.35
0.09
2U
8,200
21480
0.3
0.925
0.35
0.09
4D
23,900
41850
0.35
0.925
0.35
0.09
6D
59,900
FDOT Gen
eralized
Annual Average Daily Capacity table, 2012 Q/LOS Handbook
6F
93,000
FDOT Gen
eralized
Annual Average Daily Capacity table, 2012 Q/LOS Handbook
8D
80,100
FDOT Gen
eralized
Annual Average Daily Capacity table, 2012 Q/LOS Handbook
8F
123,500
FDOT Gen
eralized
Annual Average Daily Capacity table, 2012 Q/LOS Handbook
10D
100,125
FDOT Gen
eralized
Annual Average Daily Capacity table, 2012 Q/LOS Ha ndbook
2. Capacity value based
on assumption of no nearby signals.
C-2-1
C-2-2
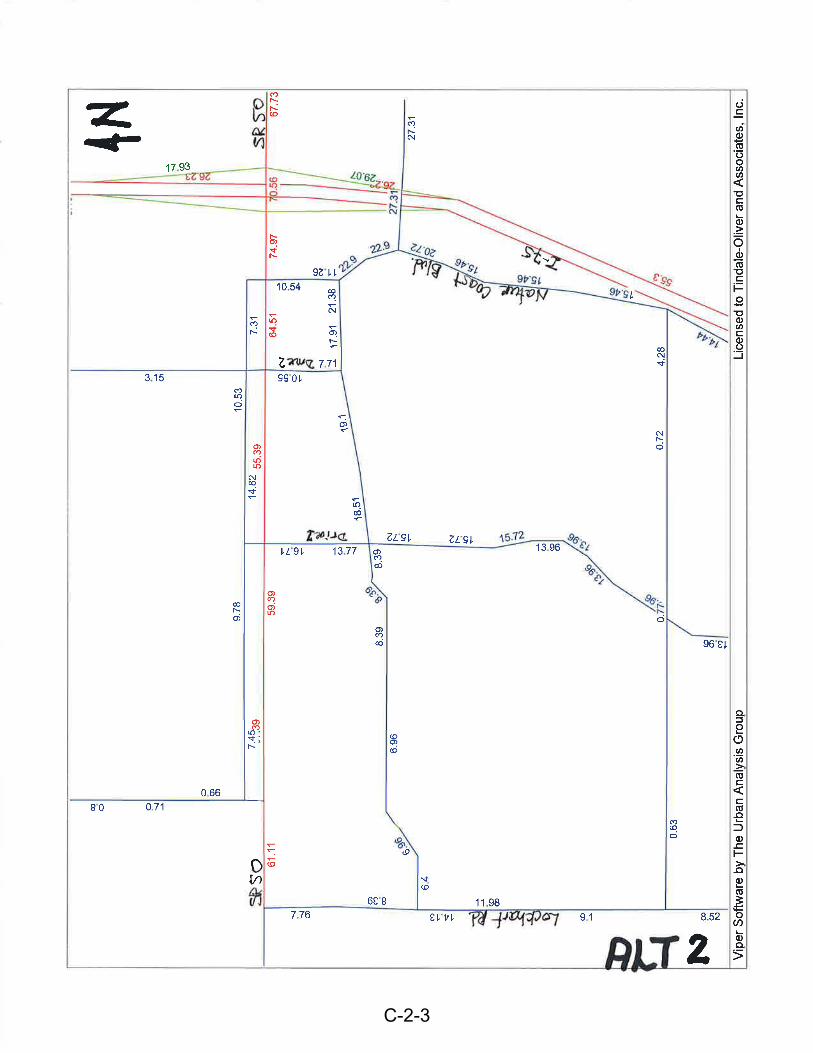
C-2-3

C-2-4

Appendix D
Planning Road Cost Estimates

D-1

Florida Department of Transportation RICK SCOlT GOVERNOR
11201 North McKinley Drive Tampa, Florida 33612
ANANTH PRASAD, P.E.
ACCESS MANAGEMENT REVIEW COMMITTEE (AMRC) PELICAN ROOM
11:00 AM. Location: Section: County: Speed Limit: Project ID: Project Manager: Typical Section: Access Class:
July 301h, 2014
SR SO & Nature Coast Blvd. 08070000 SR SO
Hernando 4S MPH on SR SO
411011-2
Amy Neidringbaus, P.E. Proposed 6-lane divided on SR SO
Class 3 on SR SO
Presenters: Mr. Don Lacey, Coastal Engineering Associates Mr. Marshall Rainey
SECRETARY
Applicant Request: Continuation of AMRC Meeting, Tabled June 2S1h, 2014
The applicant request is: Approved Disapproved Condilionally Approved / Tabled l l Comments: The Access Management Review Committee agrees to a temporary full median opening at Station 982+40 and to a temporary bi-directional median opening at Station 971+70 with the following conditions: See Attachment "A" for Conditions.
A ruling by the Access Management Review Comm1ttee (AMRC) only defines the number and type of access points and associated features that
may be permuted and is not the frnal action m your permit process. Comm1ttee approval . or other favorable ruling. generally means that the
property owner may develop plans complymg with the ruling and submit them within SIX months to the Department for permit processing.
Department pem1its personnel have the duties of checking the viability of the design plans in tenns of standards compliance and constructability
and of assuring that the plan substantially complies with the engineering drawings approved by the Committee. Committee approvals or rulings,
\\h1ch are at variance with Department rules or standards, are not binding rn the pcrmining process for more than one )'tar. Please submit a copy
ofth1s letter with your permit application.
ACCESS MANAGEMENT REVIEW COM'\-tlTTEE
With the above ruling 1: .., t _ , Ronald Chin, P.E. \ t:' 71 ( c:( (. ck :_ District Traffic Operatic~ Engineer
Ming Gao. P E. =:::::;;;;r ---..._ ~ ~· lntermodal Systems Dc,m~anage£:::2 -
R1chard Moss, P E. (0___ ~ ' District Design Engineer
www.dot.state.fl.us
Agree Disagree
[]
Date
~~~4--J I
~u r/3ofy
[)

ACCESS MANAGEMENT REVIEW COMMITTEE (AMRC) PELICAN ROOM
July 30th, 2014 Attachment "A"
Access Management Review Committee conditions:
I. The temporary full median opening at Station 982+40 will never be signalized.
2. The Florida Department of Transportation will decide when the temporary full median opening at Station 982+40 will be modified to a bi-directional median opening.
3. The Florida Department of Transportation will decide when the bi-directional median opening at Station 971 -r70 will be modified to a full median opening.
4. When a traffic signal is installed at the temporary bi-directional median opening at Station 971 + 70, the temporary full median opening at Station 982+40 will be modified to a bi-directional median opening.
5. When the department decides to modify the temporary full median opening at Station 982+40 to a bi-directional median opening, the proposed frontage roads on the north and south sides of SR 50 shall be constructed between Station 971 + 70 and Station 982+40.
6. The above conditions are to be incorporated into the 1-75/SR 50 PDD Area Plan by Resolution adopted by the Hernando County Board of County Commissioners.
7. In addition, the 1-75/SR 50 Frontage Road Plan adopted by the Hernando County MPO will also be incorporated into the I-75/SR 50 PDD Area Plan by Resolution adopted by the Hernando County Board of County Commissioners.
8. SR 50 is subject to the Hernando County frontage road ordinance land development regulations. Hernando County, in coordination with the department, shall enforce the above conditions and require the construction of frontage roads by the developer as required.

ACCESS MANAGEMENT REVIEW COMMITTEE - SIGN IN :
NAM E
Ronald Chin, P.E.
Richard Moss, P.E. 1, I
Ming Gao, P.E. (/JA,~ '"
SR SO & Nature Coast Blvd.
STREET ADDRESS
11201 N. McKinley Drive
11201 N. McKinley Drive
11201 N. McKinley Drive
EMAIL/ PHONE
[email protected] 813-975-6178 richard. [email protected] 813-975-6030
[email protected] 813-975-6454
- --
Jim F. Scott, P.E. 11201 N. McKinley Drive I [email protected] .us - -------1-- . 813-975-6273
Marty Hernandez 11201 N. McKin ley Drive
John L. Foley 11201 N. McKinley Drive
Amy Neidringhaus, P.E. 11201 N. McKinley Drive
[email protected] 813-975-6483 [email protected] 813-975-6263
[email protected] 813-975-6169
Q(c.LOt\ ~(.e~,..h q~otf w.(/"'r-~ tJ;.(((;>t~, ctCA~tc(-<- C.'"1. .,...,ta 1------------I----L\!c.=...:c-o.'_..,ll"}bz.k I..Q > -~ I ~"'--....:::...../_1_\_J
G..·FF-8 GIA-S""t'At..- ~~ ... ~ 1 ._OM.
C,;L vfF f¥\4" tV (NG{, 4rc. (!(;;A(~ 3 S'-z.-- I~ <.r - q ~ z_.. 3
~,J~ L*L.t l.\ L'
- Df'nn, c /) ,\ ,, flcrna"ACtri;;74Pu P;;-;::7->""'t---~cs L 1
t.rv..y. Nr•oft.l"'C.'~''-' oi! D>T ~TATC . ~-~ .JJ
r ....... y NEIOelf'I(>IJJ\\1• tOuT t;;~-<1-,S-<..1<..~