Embed Size (px)
Citation preview
I Am the Antenna: Accurate Outdoor AP Locationusing Smartphones
Zengbin Zhang†, Xia Zhou†, Weile Zhang†§, Yuanyang Zhang†, Gang Wang†,Ben Y. Zhao† and Haitao Zheng†
†Department of Computer Science, UC Santa Barbara, CA 93106, USA§School of Electronic and Information Engineering, Xian Jiaotong University, P. R. China
{zengbin, xiazhou, yuanyang, gangw, ravenben, htzheng}@cs.ucsb.edu, [email protected]
ABSTRACT
Today’s WiFi access points (APs) are ubiquitous, and pro-vide critical connectivity for a wide range of mobile network-ing devices. Many management tasks, e.g. optimizing APplacement and detecting rogue APs, require a user to effi-ciently determine the location of wireless APs. Unlike priorlocalization techniques that require either specialized equip-ment or extensive outdoor measurements, we propose a wayto locate APs in real-time using commodity smartphones.Our insight is that by rotating a wireless receiver (smart-phone) around a signal-blocking obstacle (the user’s body),we can effectively emulate the sensitivity and functionalityof a directional antenna. Our measurements show that wecan detect these signal strength artifacts on multiple smart-phone platforms for a variety of outdoor environments. Wedevelop a model for detecting signal dips caused by blockingobstacles, and use it to produce a directional analysis tech-nique that accurately predicts the direction of the AP, alongwith an associated confidence value. The result is Borealis, asystem that provides accurate directional guidance and leadsusers to a desired AP after a few measurements. Detailedmeasurements show that Borealis is significantly more accu-rate than other real-time localization systems, and is nearlyas accurate as offline approaches using extensive wirelessmeasurements.
Categories and Subject Descriptors
C.2 [Computer-Communication Networks]: NetworkArchitecture and Design
General Terms
Design, Experimentation, Performance
Keywords
Access point location, WiFi, smartphones
Permission to make digital or hard copies of all or part of this work forpersonal or classroom use is granted without fee provided that copies arenot made or distributed for profit or commercial advantage and that copiesbear this notice and the full citation on the first page. To copy otherwise, torepublish, to post on servers or to redistribute to lists, requires prior specificpermission and/or a fee.MobiCom’11, September 19–23, 2011, Las Vegas, Nevada, USA.Copyright 2011 ACM 978-1-4503-0492-4/11/09 ...$10.00.
1. INTRODUCTIONWiFi networks today are ubiquitous in our daily lives.
WiFi access points (APs) extend the reach of wired networksin indoor environments such as homes and offices, and en-able mobile connectivity in outdoor environments such assports stadiums, parks, schools and shopping centers [1, 2].Even cellular service providers are relying on outdoor WiFiAPs to offload their 3G traffic [2, 3]. As Internet users be-come reliant on these APs to connect their smartphones,tablets and laptops, the availability and performance of to-morrow’s networks will depend on well tuned and managedaccess points.
A critical part of managing access points is the abilityto locate individual access points based on their signal [16,19, 23]. Doing so allows network administrators to identifyAPs causing excessive interference to others, or unautho-rized APs that may provide easy entry for malicious attack-ers [22]. For individual users, it allows them to locate andget closer to neighborhood WiFi hotspots, build war-drivingdatabases, or pinpoint neighboring APs so they can betterposition their own basestations.
Unfortunately, much of this is not possible today, becausecurrent techniques to locate outdoor WiFi access points re-quire either extensive wardriving measurements, followed bysignificant offline computation [11], or complex hardwarecomponents such as steerable directional phased array an-tennas [28]. For the wardriving scenario, locating each APrequires measurements from a large number (35+) of loca-tions, making the process extremely time and energy inten-sive. For the directional antenna solution, the specializedhardware components cost several thousand dollars each,which clearly limits their availability to only a small portionof system administrators for large enterprises.
In this work, we ask the question: “is there a cost- andtime-efficient alternative to perform accurate outdoor loca-tion of WiFi access points?” A potential solution usingcommon-off-the-shelf (COTS) hardware would break accesspoint location out of a small niche market of enterprise ad-ministrators, and make it available to home users and smallbusinesses managing their own local hotspots.
Our solution is derived from a key insight: “by rotating astandard wireless receiver around a blocking object, we caneffectively emulate the sensitivity and functionality of a di-rectional antenna.” We exploit the property that the signalstrength observed by a wireless receiver drops most signifi-cantly when there is a large obstacle directly between it andthe transmitter. Such a drop in signal strength is strongestwhen the receiver is directly adjacent to the obstacle, and
should be observable as long as the obstacle is large enoughto block a significant portion of the reception angle. There-fore, by “rotating” the receiver’s position with respect to theobstacle (and the signal “void” it produces), and observingthe received signal strength, we can determine the approxi-mate direction of the transmitter. We refer to this processas directional analysis.
While this is a general observation potentially applicableto a variety of wireless transmissions on different frequen-cies and hardware, we focus our attention in this paper ona single use case: outdoor location of WiFi access points us-ing smartphones. Applying our insight, we hypothesize thata user can accurately locate WiFi APs using common-off-the-shelf smartphones as receivers, and her own body as theblocking obstacle. To perform a directional analysis opera-tion, she slowly rotates her body around 360 degrees, whilekeeping the smartphone in front of her and performing pe-riodic received signal strength (RSS) measurements. Theobserved RSS should be at its lowest point when the user’sbody is directly between the smartphone and the wirelessAP. By walking towards the predicted direction of the AP,and periodically repeating the directional analysis, a usershould be able to zone in and locate any specific AP.
To validate our hypothesis, we first perform detailed ex-periments to see if such dips in signal strength can be ob-served using today’s smartphones and standard WiFi accesspoints. We run tests on several different environments onthe UC Santa Barbara campus, target both 802.11b/g and802.11n (MIMO) APs, and use three different smartphoneplatforms, Android, WindowsMobile, and Apple iPhone4.Using a large number of real measurements, we do in factobserve the expected dip in signal strength when the tester’sbody blocks the smartphone from the access point. We con-sistently observe the artifact across both platforms, environ-ments with different levels of obstructions, and for users ofdifferent heights and weights.
Borealis. These measurement results lead us to developBorealis, a system for locating outdoor WiFi access pointsusing software on commodity smartphones. Borealis userscan perform robust directional analysis by turning their bod-ies on a 360◦ axis, and use this technique to locate a trans-mitting access point. We address several challenges in theprocess of building Borealis, most significant of which is thaterrors in directional analysis are impacted by environmentalconditions, and particularly exacerbated by multipath prop-agation around areas with multiple buildings. Our solutionis to build a model that predicts the impact of blocking ob-stacles on signal strength at the receiver, use it to identifylarge blocking effects, and in doing so, produce more accu-rate predictions of the AP’s direction. Combined with priortechniques on direction-guided user navigation [10, 14, 15],we produce a system that efficiently guides users to an AP.In scenarios where the AP is housed indoors, our systemguides the user to an outdoor location closest to the AP.
We implement and deploy Borealis as a user applicationand a set of kernel modifications on the Android platform.We modify the WiFi driver to focus scans on specific chan-nels, thus allowing more frequent RSS measurements whilereducing energy usage. Our user application assists the userin directional analysis by logging each RSS measurementalong with data from the orientation sensor, and using it tocompute the most likely direction of the access point along
with a prediction confidence. The user can repeat the pro-cess with success until she is within 2 meters of the AP.
We perform detailed experimental evaluation on MotorolaDroid and HTC G1 phones. Our results show that Bore-alis produces significantly more accurate AP direction valuesthan GUIDE [10], the recent system using triangle gradientsto compute AP direction. We also find that running Bore-alis in real-time produces similar accuracy compared to anoffline version using learning techniques on a large numberof RSS measurements. Finally, our results show that usingour direction predictions, Borealis leads the user on a paththat reasonably approximates the shortest path to the AP.
Our work shows that with small software modifications,today’s smartphones can effectively replace directional an-tennas to locate outdoor WiFi access points. Borealis is thefirst example of a potential class of systems that approx-imate directional antenna systems using rotation aroundsignal-blocking obstacles, and its underlying principle canpotentially be applied to build location systems for otherwireless transmissions.
2. PRELIMINARIESIn this section, we briefly describe the problem scenario
and assumptions. We then summarize existing work that ismost relevant to our target scenario.
Our focus is to accurately locate outdoor WiFi AP usingcommon off-the-shelf smartphones as receivers. This func-tionality is a critical part of managing WiFi access networksfor both small business and home users. The problem sce-nario is simple – a user, holding a smartphone, seeks to findthe physical location of a WiFi AP from its BSSID. Notethat our AP location problem is different from the generalwireless localization problem [4, 6, 12]. The user seeks tolocate a transmitting AP rather than determining her ownlocation.
2.1 Related WorkIn general, a receiver locates a transmitter by examining
received signal strength (RSS), time of arrival (TOA) [7],time difference of arrival (TDOA) [13], or angle of arrival(AOA) [20]. The latter three methods all require simulta-neous measurements at multiple receivers or antenna array.They are commonly used in cellular networks where neigh-boring basestations collaborate to locate a mobile device.They are, however, not feasible in our target scenario. Thuswe focus our discussion on the RSS based method.
We categorize the RSS based solutions into three groups.
Model-based. Solutions in this category consider abso-lute values of RSS. Using RSS values measured at one [26]or multiple [8] locations, existing designs seek to derive thephysical distance between the tester and the transmitter orthe exact transmitter location, based on a radio propagationmodel. This solution, however, is fundamentally limited bythe inaccuracy of propagation models for practical environ-ments [12].
Gradient-based. This type of solution compares the RSSvalues obtained from different locations. Based on the as-sumption that a location closer to the AP will have a higherRSS value, existing designs estimate the AP direction bycomputing the gradient of the RSS value across different lo-cations. This is done either online [10, 29] using a small set oflocal measurements, or offline [11] by integrating the results
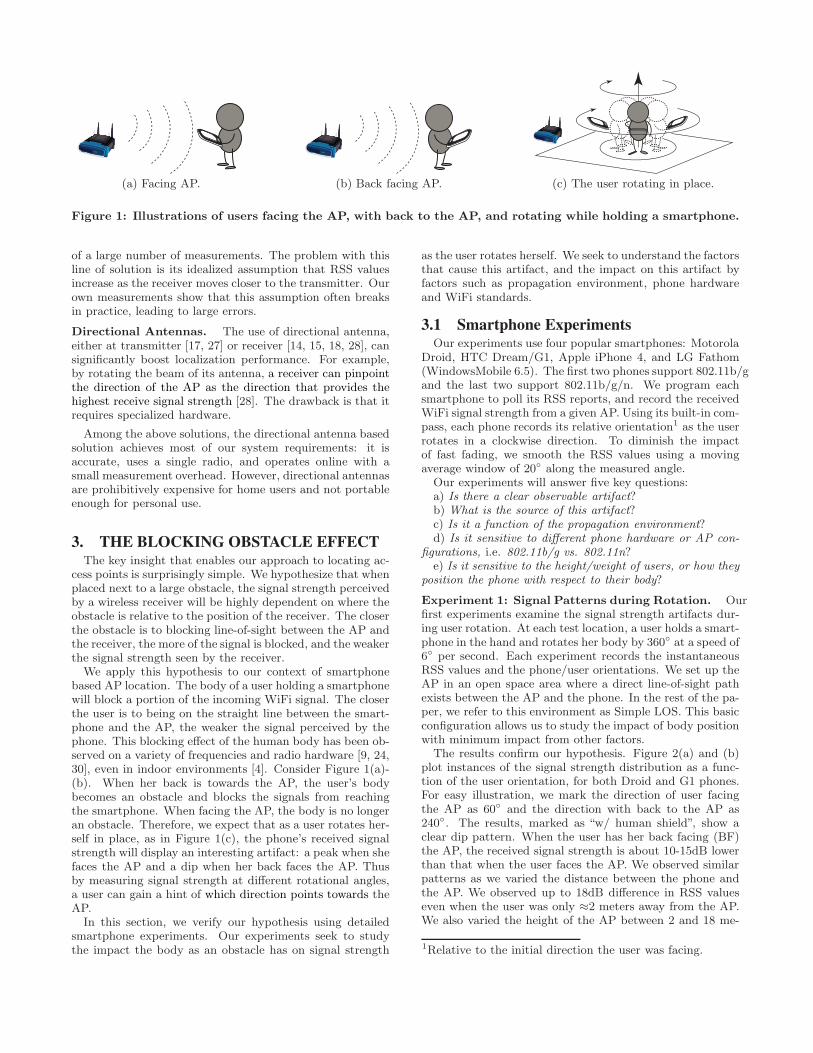
(a) Facing AP. (b) Back facing AP. (c) The user rotating in place.
Figure 1: Illustrations of users facing the AP, with back to the AP, and rotating while holding a smartphone.
of a large number of measurements. The problem with thisline of solution is its idealized assumption that RSS valuesincrease as the receiver moves closer to the transmitter. Ourown measurements show that this assumption often breaksin practice, leading to large errors.
Directional Antennas. The use of directional antenna,either at transmitter [17, 27] or receiver [14, 15, 18, 28], cansignificantly boost localization performance. For example,by rotating the beam of its antenna, a receiver can pinpointthe direction of the AP as the direction that provides thehighest receive signal strength [28]. The drawback is that itrequires specialized hardware.
Among the above solutions, the directional antenna basedsolution achieves most of our system requirements: it isaccurate, uses a single radio, and operates online with asmall measurement overhead. However, directional antennasare prohibitively expensive for home users and not portableenough for personal use.
3. THE BLOCKING OBSTACLE EFFECTThe key insight that enables our approach to locating ac-
cess points is surprisingly simple. We hypothesize that whenplaced next to a large obstacle, the signal strength perceivedby a wireless receiver will be highly dependent on where theobstacle is relative to the position of the receiver. The closerthe obstacle is to blocking line-of-sight between the AP andthe receiver, the more of the signal is blocked, and the weakerthe signal strength seen by the receiver.
We apply this hypothesis to our context of smartphonebased AP location. The body of a user holding a smartphonewill block a portion of the incoming WiFi signal. The closerthe user is to being on the straight line between the smart-phone and the AP, the weaker the signal perceived by thephone. This blocking effect of the human body has been ob-served on a variety of frequencies and radio hardware [9, 24,30], even in indoor environments [4]. Consider Figure 1(a)-(b). When her back is towards the AP, the user’s bodybecomes an obstacle and blocks the signals from reachingthe smartphone. When facing the AP, the body is no longeran obstacle. Therefore, we expect that as a user rotates her-self in place, as in Figure 1(c), the phone’s received signalstrength will display an interesting artifact: a peak when shefaces the AP and a dip when her back faces the AP. Thusby measuring signal strength at different rotational angles,a user can gain a hint of which direction points towards theAP.
In this section, we verify our hypothesis using detailedsmartphone experiments. Our experiments seek to studythe impact the body as an obstacle has on signal strength
as the user rotates herself. We seek to understand the factorsthat cause this artifact, and the impact on this artifact byfactors such as propagation environment, phone hardwareand WiFi standards.
3.1 Smartphone ExperimentsOur experiments use four popular smartphones: Motorola
Droid, HTC Dream/G1, Apple iPhone 4, and LG Fathom(WindowsMobile 6.5). The first two phones support 802.11b/gand the last two support 802.11b/g/n. We program eachsmartphone to poll its RSS reports, and record the receivedWiFi signal strength from a given AP. Using its built-in com-pass, each phone records its relative orientation1 as the userrotates in a clockwise direction. To diminish the impactof fast fading, we smooth the RSS values using a movingaverage window of 20◦ along the measured angle.
Our experiments will answer five key questions:a) Is there a clear observable artifact?b) What is the source of this artifact?c) Is it a function of the propagation environment?d) Is it sensitive to different phone hardware or AP con-
figurations, i.e. 802.11b/g vs. 802.11n?e) Is it sensitive to the height/weight of users, or how they
position the phone with respect to their body?
Experiment 1: Signal Patterns during Rotation. Ourfirst experiments examine the signal strength artifacts dur-ing user rotation. At each test location, a user holds a smart-phone in the hand and rotates her body by 360◦ at a speed of6◦ per second. Each experiment records the instantaneousRSS values and the phone/user orientations. We set up theAP in an open space area where a direct line-of-sight pathexists between the AP and the phone. In the rest of the pa-per, we refer to this environment as Simple LOS. This basicconfiguration allows us to study the impact of body positionwith minimum impact from other factors.
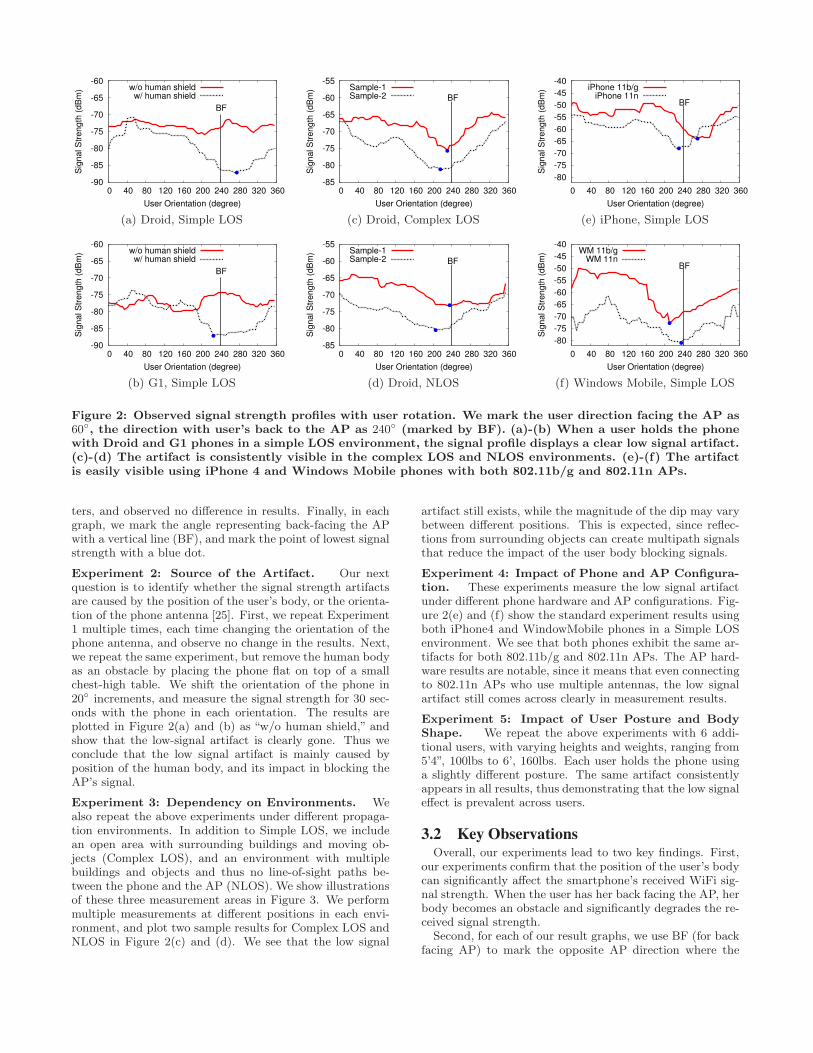
The results confirm our hypothesis. Figure 2(a) and (b)plot instances of the signal strength distribution as a func-tion of the user orientation, for both Droid and G1 phones.For easy illustration, we mark the direction of user facingthe AP as 60◦ and the direction with back to the AP as240◦. The results, marked as “w/ human shield”, show aclear dip pattern. When the user has her back facing (BF)the AP, the received signal strength is about 10-15dB lowerthan that when the user faces the AP. We observed similarpatterns as we varied the distance between the phone andthe AP. We observed up to 18dB difference in RSS valueseven when the user was only ≈2 meters away from the AP.We also varied the height of the AP between 2 and 18 me-
1Relative to the initial direction the user was facing.
-90
-85
-80
-75
-70
-65
-60
0 40 80 120 160 200 240 280 320 360
Sig
nal S
trength
(dB
m)
User Orientation (degree)
BF
w/o human shieldw/ human shield
(a) Droid, Simple LOS
-90
-85
-80
-75
-70
-65
-60
0 40 80 120 160 200 240 280 320 360
Sig
nal S
trength
(dB
m)
User Orientation (degree)
BF
w/o human shieldw/ human shield
(b) G1, Simple LOS
-85
-80
-75
-70
-65
-60
-55
0 40 80 120 160 200 240 280 320 360
Sig
nal S
trength
(dB
m)
User Orientation (degree)
BF
Sample-1Sample-2
(c) Droid, Complex LOS
-85
-80
-75
-70
-65
-60
-55
0 40 80 120 160 200 240 280 320 360
Sig
nal S
trength
(dB
m)
User Orientation (degree)
BF
Sample-1Sample-2
(d) Droid, NLOS
-80
-75
-70
-65
-60
-55
-50
-45
-40
0 40 80 120 160 200 240 280 320 360
Sig
nal S
trength
(dB
m)
User Orientation (degree)
BF
iPhone 11b/giPhone 11n
(e) iPhone, Simple LOS
-80
-75
-70
-65
-60
-55
-50
-45
-40
0 40 80 120 160 200 240 280 320 360
Sig
nal S
trength
(dB
m)
User Orientation (degree)
BF
WM 11b/gWM 11n
(f) Windows Mobile, Simple LOS
Figure 2: Observed signal strength profiles with user rotation. We mark the user direction facing the AP as60◦, the direction with user’s back to the AP as 240◦ (marked by BF). (a)-(b) When a user holds the phonewith Droid and G1 phones in a simple LOS environment, the signal profile displays a clear low signal artifact.(c)-(d) The artifact is consistently visible in the complex LOS and NLOS environments. (e)-(f) The artifactis easily visible using iPhone 4 and Windows Mobile phones with both 802.11b/g and 802.11n APs.
ters, and observed no difference in results. Finally, in eachgraph, we mark the angle representing back-facing the APwith a vertical line (BF), and mark the point of lowest signalstrength with a blue dot.
Experiment 2: Source of the Artifact. Our nextquestion is to identify whether the signal strength artifactsare caused by the position of the user’s body, or the orienta-tion of the phone antenna [25]. First, we repeat Experiment1 multiple times, each time changing the orientation of thephone antenna, and observe no change in the results. Next,we repeat the same experiment, but remove the human bodyas an obstacle by placing the phone flat on top of a smallchest-high table. We shift the orientation of the phone in20◦ increments, and measure the signal strength for 30 sec-onds with the phone in each orientation. The results areplotted in Figure 2(a) and (b) as “w/o human shield,” andshow that the low-signal artifact is clearly gone. Thus weconclude that the low signal artifact is mainly caused byposition of the human body, and its impact in blocking theAP’s signal.
Experiment 3: Dependency on Environments. Wealso repeat the above experiments under different propaga-tion environments. In addition to Simple LOS, we includean open area with surrounding buildings and moving ob-jects (Complex LOS), and an environment with multiplebuildings and objects and thus no line-of-sight paths be-tween the phone and the AP (NLOS). We show illustrationsof these three measurement areas in Figure 3. We performmultiple measurements at different positions in each envi-ronment, and plot two sample results for Complex LOS andNLOS in Figure 2(c) and (d). We see that the low signal
artifact still exists, while the magnitude of the dip may varybetween different positions. This is expected, since reflec-tions from surrounding objects can create multipath signalsthat reduce the impact of the user body blocking signals.
Experiment 4: Impact of Phone and AP Configura-tion. These experiments measure the low signal artifactunder different phone hardware and AP configurations. Fig-ure 2(e) and (f) show the standard experiment results usingboth iPhone4 and WindowMobile phones in a Simple LOSenvironment. We see that both phones exhibit the same ar-tifacts for both 802.11b/g and 802.11n APs. The AP hard-ware results are notable, since it means that even connectingto 802.11n APs who use multiple antennas, the low signalartifact still comes across clearly in measurement results.
Experiment 5: Impact of User Posture and BodyShape. We repeat the above experiments with 6 addi-tional users, with varying heights and weights, ranging from5’4”, 100lbs to 6’, 160lbs. Each user holds the phone usinga slightly different posture. The same artifact consistentlyappears in all results, thus demonstrating that the low signaleffect is prevalent across users.
3.2 Key ObservationsOverall, our experiments lead to two key findings. First,
our experiments confirm that the position of the user’s bodycan significantly affect the smartphone’s received WiFi sig-nal strength. When the user has her back facing the AP, herbody becomes an obstacle and significantly degrades the re-ceived signal strength.
Second, for each of our result graphs, we use BF (for backfacing AP) to mark the opposite AP direction where the
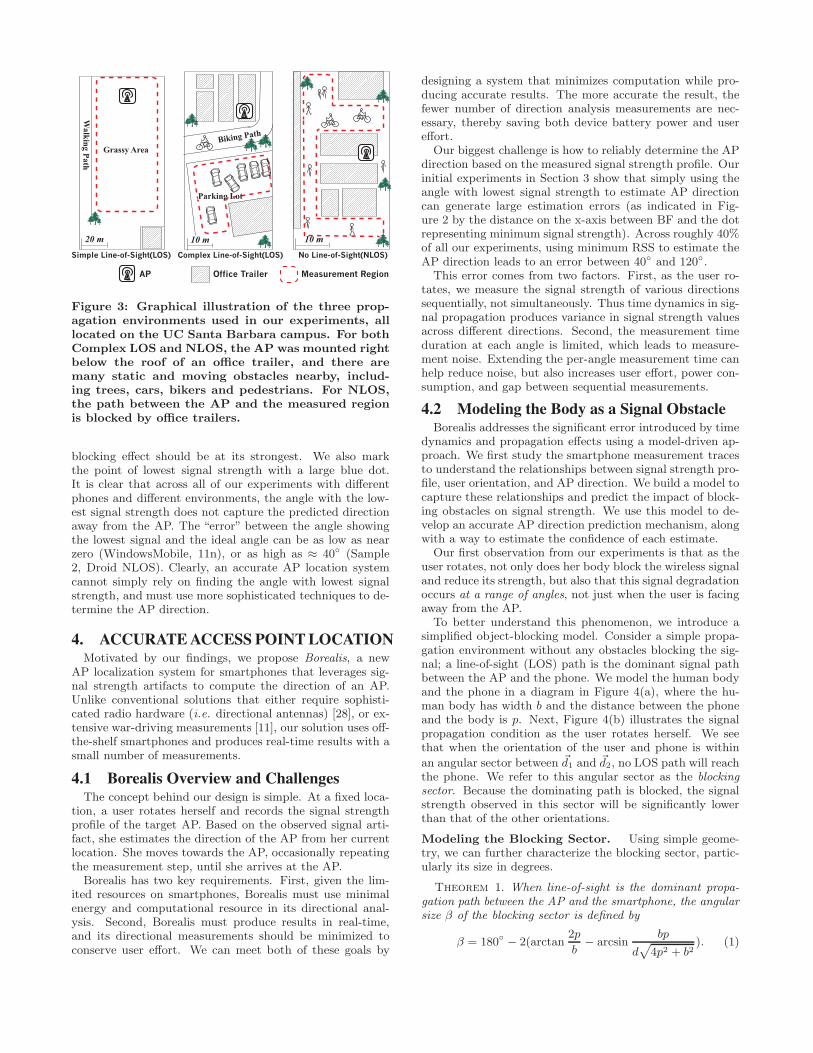
Simple Line-of-Sight(LOS) Complex Line-of-Sight(LOS) No Line-of-Sight(NLOS)
Grassy Area
Parking Lot
Walk
ing P
ath
Biking Path
20 m 10 m10 m
AP Measurement Region Office Trailer
Figure 3: Graphical illustration of the three prop-agation environments used in our experiments, alllocated on the UC Santa Barbara campus. For bothComplex LOS and NLOS, the AP was mounted rightbelow the roof of an office trailer, and there aremany static and moving obstacles nearby, includ-ing trees, cars, bikers and pedestrians. For NLOS,the path between the AP and the measured regionis blocked by office trailers.
blocking effect should be at its strongest. We also markthe point of lowest signal strength with a large blue dot.It is clear that across all of our experiments with differentphones and different environments, the angle with the low-est signal strength does not capture the predicted directionaway from the AP. The “error” between the angle showingthe lowest signal and the ideal angle can be as low as nearzero (WindowsMobile, 11n), or as high as ≈ 40◦ (Sample2, Droid NLOS). Clearly, an accurate AP location systemcannot simply rely on finding the angle with lowest signalstrength, and must use more sophisticated techniques to de-termine the AP direction.
4. ACCURATE ACCESS POINT LOCATIONMotivated by our findings, we propose Borealis, a new
AP localization system for smartphones that leverages sig-nal strength artifacts to compute the direction of an AP.Unlike conventional solutions that either require sophisti-cated radio hardware (i.e. directional antennas) [28], or ex-tensive war-driving measurements [11], our solution uses off-the-shelf smartphones and produces real-time results with asmall number of measurements.
4.1 Borealis Overview and ChallengesThe concept behind our design is simple. At a fixed loca-
tion, a user rotates herself and records the signal strengthprofile of the target AP. Based on the observed signal arti-fact, she estimates the direction of the AP from her currentlocation. She moves towards the AP, occasionally repeatingthe measurement step, until she arrives at the AP.
Borealis has two key requirements. First, given the lim-ited resources on smartphones, Borealis must use minimalenergy and computational resource in its directional anal-ysis. Second, Borealis must produce results in real-time,and its directional measurements should be minimized toconserve user effort. We can meet both of these goals by
designing a system that minimizes computation while pro-ducing accurate results. The more accurate the result, thefewer number of direction analysis measurements are nec-essary, thereby saving both device battery power and usereffort.
Our biggest challenge is how to reliably determine the APdirection based on the measured signal strength profile. Ourinitial experiments in Section 3 show that simply using theangle with lowest signal strength to estimate AP directioncan generate large estimation errors (as indicated in Fig-ure 2 by the distance on the x-axis between BF and the dotrepresenting minimum signal strength). Across roughly 40%of all our experiments, using minimum RSS to estimate theAP direction leads to an error between 40◦ and 120◦.
This error comes from two factors. First, as the user ro-tates, we measure the signal strength of various directionssequentially, not simultaneously. Thus time dynamics in sig-nal propagation produces variance in signal strength valuesacross different directions. Second, the measurement timeduration at each angle is limited, which leads to measure-ment noise. Extending the per-angle measurement time canhelp reduce noise, but also increases user effort, power con-sumption, and gap between sequential measurements.
4.2 Modeling the Body as a Signal ObstacleBorealis addresses the significant error introduced by time
dynamics and propagation effects using a model-driven ap-proach. We first study the smartphone measurement tracesto understand the relationships between signal strength pro-file, user orientation, and AP direction. We build a model tocapture these relationships and predict the impact of block-ing obstacles on signal strength. We use this model to de-velop an accurate AP direction prediction mechanism, alongwith a way to estimate the confidence of each estimate.
Our first observation from our experiments is that as theuser rotates, not only does her body block the wireless signaland reduce its strength, but also that this signal degradationoccurs at a range of angles, not just when the user is facingaway from the AP.
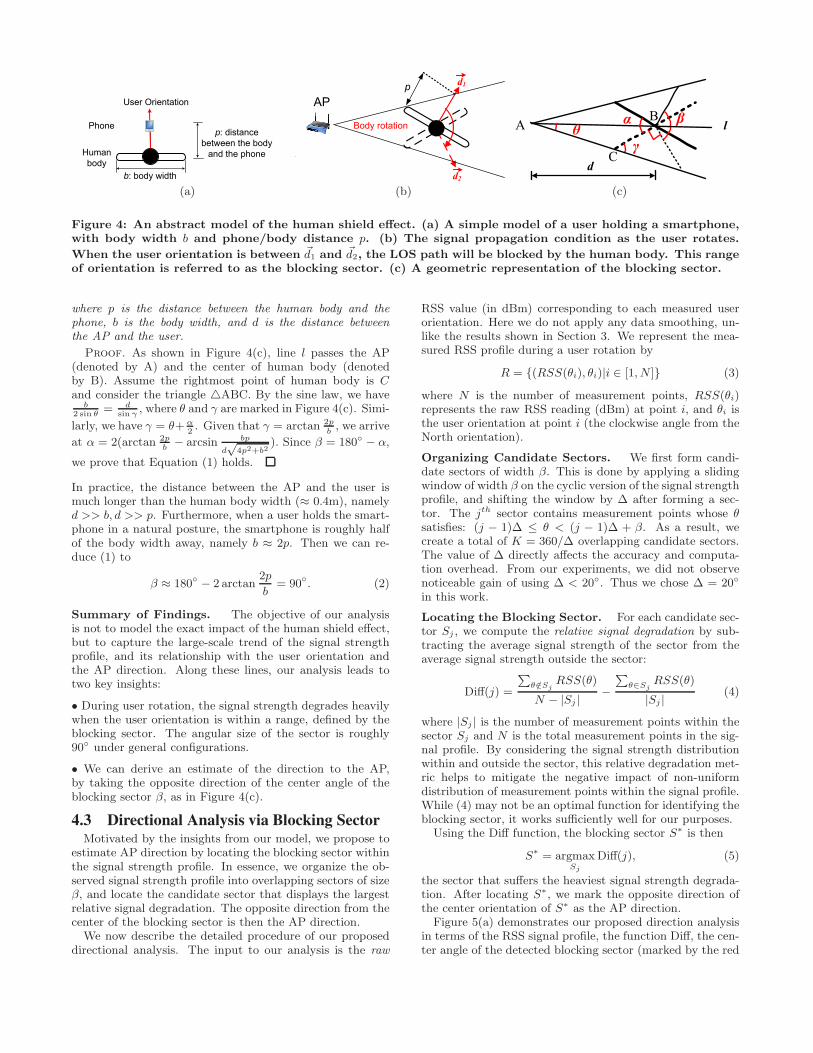
To better understand this phenomenon, we introduce asimplified object-blocking model. Consider a simple propa-gation environment without any obstacles blocking the sig-nal; a line-of-sight (LOS) path is the dominant signal pathbetween the AP and the phone. We model the human bodyand the phone in a diagram in Figure 4(a), where the hu-man body has width b and the distance between the phoneand the body is p. Next, Figure 4(b) illustrates the signalpropagation condition as the user rotates herself. We seethat when the orientation of the user and phone is within
an angular sector between ~d1 and ~d2, no LOS path will reachthe phone. We refer to this angular sector as the blockingsector. Because the dominating path is blocked, the signalstrength observed in this sector will be significantly lowerthan that of the other orientations.
Modeling the Blocking Sector. Using simple geome-try, we can further characterize the blocking sector, partic-ularly its size in degrees.
Theorem 1. When line-of-sight is the dominant propa-gation path between the AP and the smartphone, the angularsize β of the blocking sector is defined by
β = 180◦ − 2(arctan2p
b− arcsin
bp
dp
4p2 + b2). (1)
b: body width
Phonep: distance
between the body
and the phoneHuman
bodyA
User Orientation
(a)
Body rotation
AP
d1
d2
p
(b)
βA
α B
C
lθγ
d
(c)
Figure 4: An abstract model of the human shield effect. (a) A simple model of a user holding a smartphone,with body width b and phone/body distance p. (b) The signal propagation condition as the user rotates.
When the user orientation is between ~d1 and ~d2, the LOS path will be blocked by the human body. This rangeof orientation is referred to as the blocking sector. (c) A geometric representation of the blocking sector.
where p is the distance between the human body and thephone, b is the body width, and d is the distance betweenthe AP and the user.
Proof. As shown in Figure 4(c), line l passes the AP(denoted by A) and the center of human body (denotedby B). Assume the rightmost point of human body is Cand consider the triangle △ABC. By the sine law, we have
b2 sin θ
= dsin γ
, where θ and γ are marked in Figure 4(c). Simi-
larly, we have γ = θ+ α2. Given that γ = arctan 2p
b, we arrive
at α = 2(arctan 2pb− arcsin bp
d√
4p2+b2). Since β = 180◦ − α,
we prove that Equation (1) holds.
In practice, the distance between the AP and the user ismuch longer than the human body width (≈ 0.4m), namelyd >> b, d >> p. Furthermore, when a user holds the smart-phone in a natural posture, the smartphone is roughly halfof the body width away, namely b ≈ 2p. Then we can re-duce (1) to
β ≈ 180◦ − 2 arctan2p
b= 90◦. (2)
Summary of Findings. The objective of our analysisis not to model the exact impact of the human shield effect,but to capture the large-scale trend of the signal strengthprofile, and its relationship with the user orientation andthe AP direction. Along these lines, our analysis leads totwo key insights:
• During user rotation, the signal strength degrades heavilywhen the user orientation is within a range, defined by theblocking sector. The angular size of the sector is roughly90◦ under general configurations.
• We can derive an estimate of the direction to the AP,by taking the opposite direction of the center angle of theblocking sector β, as in Figure 4(c).
4.3 Directional Analysis via Blocking SectorMotivated by the insights from our model, we propose to
estimate AP direction by locating the blocking sector withinthe signal strength profile. In essence, we organize the ob-served signal strength profile into overlapping sectors of sizeβ, and locate the candidate sector that displays the largestrelative signal degradation. The opposite direction from thecenter of the blocking sector is then the AP direction.
We now describe the detailed procedure of our proposeddirectional analysis. The input to our analysis is the raw
RSS value (in dBm) corresponding to each measured userorientation. Here we do not apply any data smoothing, un-like the results shown in Section 3. We represent the mea-sured RSS profile during a user rotation by
R = {(RSS(θi), θi)|i ∈ [1, N ]} (3)
where N is the number of measurement points, RSS(θi)represents the raw RSS reading (dBm) at point i, and θi isthe user orientation at point i (the clockwise angle from theNorth orientation).
Organizing Candidate Sectors. We first form candi-date sectors of width β. This is done by applying a slidingwindow of width β on the cyclic version of the signal strengthprofile, and shifting the window by ∆ after forming a sec-tor. The jth sector contains measurement points whose θsatisfies: (j − 1)∆ ≤ θ < (j − 1)∆ + β. As a result, wecreate a total of K = 360/∆ overlapping candidate sectors.The value of ∆ directly affects the accuracy and computa-tion overhead. From our experiments, we did not observenoticeable gain of using ∆ < 20◦. Thus we chose ∆ = 20◦
in this work.
Locating the Blocking Sector. For each candidate sec-tor Sj , we compute the relative signal degradation by sub-tracting the average signal strength of the sector from theaverage signal strength outside the sector:
Diff(j) =
P
θ/∈SjRSS(θ)
N − |Sj |−
P
θ∈SjRSS(θ)
|Sj |(4)
where |Sj | is the number of measurement points within thesector Sj and N is the total measurement points in the sig-nal profile. By considering the signal strength distributionwithin and outside the sector, this relative degradation met-ric helps to mitigate the negative impact of non-uniformdistribution of measurement points within the signal profile.While (4) may not be an optimal function for identifying theblocking sector, it works sufficiently well for our purposes.
Using the Diff function, the blocking sector S∗ is then
S∗ = argmaxSj
Diff(j), (5)
the sector that suffers the heaviest signal strength degrada-tion. After locating S∗, we mark the opposite direction ofthe center orientation of S∗ as the AP direction.
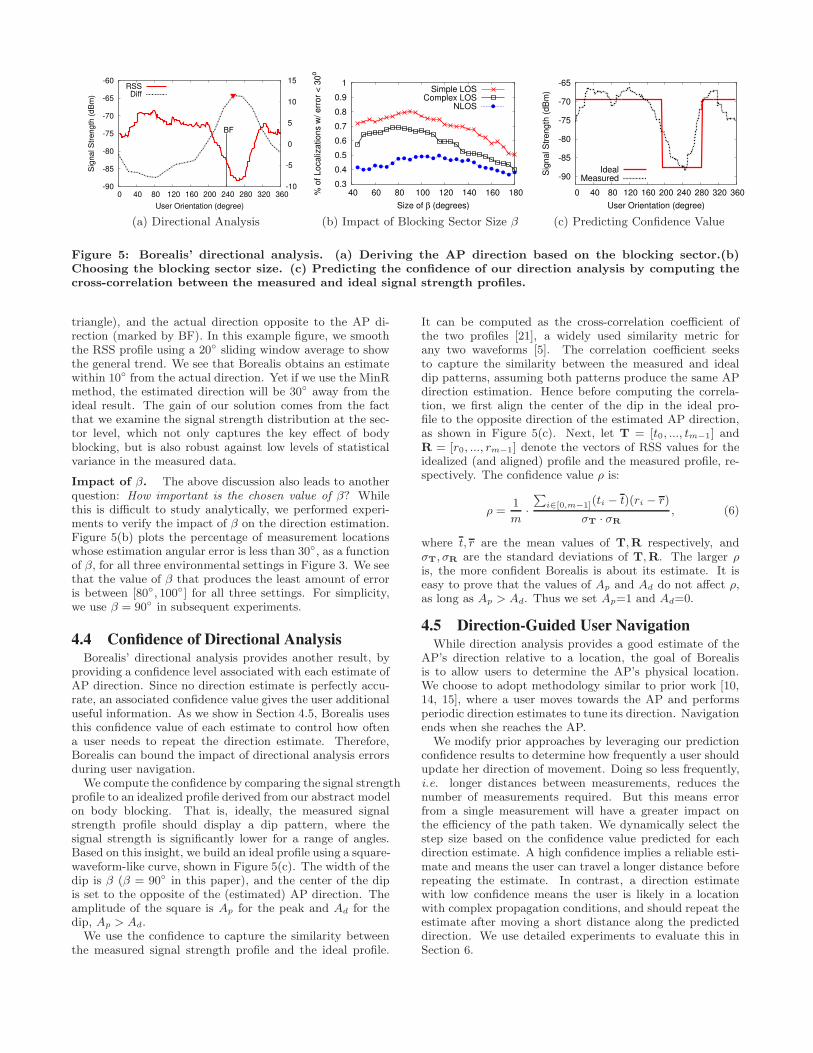
Figure 5(a) demonstrates our proposed direction analysisin terms of the RSS signal profile, the function Diff, the cen-ter angle of the detected blocking sector (marked by the red
-90
-85
-80
-75
-70
-65
-60
0 40 80 120 160 200 240 280 320 360-10
-5
0
5
10
15
Sig
nal S
trength
(dB
m)
User Orientation (degree)
BF
RSSDiff
(a) Directional Analysis
0.3
0.4
0.5
0.6
0.7
0.8
0.9
1
40 60 80 100 120 140 160 180% o
f Localiz
ations w
/ err
or
< 3
0o
Size of β (degrees)
Simple LOSComplex LOS
NLOS
(b) Impact of Blocking Sector Size β
-90
-85
-80
-75
-70
-65
0 40 80 120 160 200 240 280 320 360
Sig
nal S
trength
(dB
m)
User Orientation (degree)
IdealMeasured
(c) Predicting Confidence Value
Figure 5: Borealis’ directional analysis. (a) Deriving the AP direction based on the blocking sector.(b)Choosing the blocking sector size. (c) Predicting the confidence of our direction analysis by computing thecross-correlation between the measured and ideal signal strength profiles.
triangle), and the actual direction opposite to the AP di-rection (marked by BF). In this example figure, we smooththe RSS profile using a 20◦ sliding window average to showthe general trend. We see that Borealis obtains an estimatewithin 10◦ from the actual direction. Yet if we use the MinRmethod, the estimated direction will be 30◦ away from theideal result. The gain of our solution comes from the factthat we examine the signal strength distribution at the sec-tor level, which not only captures the key effect of bodyblocking, but is also robust against low levels of statisticalvariance in the measured data.
Impact of β. The above discussion also leads to anotherquestion: How important is the chosen value of β? Whilethis is difficult to study analytically, we performed experi-ments to verify the impact of β on the direction estimation.Figure 5(b) plots the percentage of measurement locationswhose estimation angular error is less than 30◦, as a functionof β, for all three environmental settings in Figure 3. We seethat the value of β that produces the least amount of erroris between [80◦, 100◦] for all three settings. For simplicity,we use β = 90◦ in subsequent experiments.
4.4 Confidence of Directional AnalysisBorealis’ directional analysis provides another result, by
providing a confidence level associated with each estimate ofAP direction. Since no direction estimate is perfectly accu-rate, an associated confidence value gives the user additionaluseful information. As we show in Section 4.5, Borealis usesthis confidence value of each estimate to control how oftena user needs to repeat the direction estimate. Therefore,Borealis can bound the impact of directional analysis errorsduring user navigation.
We compute the confidence by comparing the signal strengthprofile to an idealized profile derived from our abstract modelon body blocking. That is, ideally, the measured signalstrength profile should display a dip pattern, where thesignal strength is significantly lower for a range of angles.Based on this insight, we build an ideal profile using a square-waveform-like curve, shown in Figure 5(c). The width of thedip is β (β = 90◦ in this paper), and the center of the dipis set to the opposite of the (estimated) AP direction. Theamplitude of the square is Ap for the peak and Ad for thedip, Ap > Ad.
We use the confidence to capture the similarity betweenthe measured signal strength profile and the ideal profile.
It can be computed as the cross-correlation coefficient ofthe two profiles [21], a widely used similarity metric forany two waveforms [5]. The correlation coefficient seeksto capture the similarity between the measured and idealdip patterns, assuming both patterns produce the same APdirection estimation. Hence before computing the correla-tion, we first align the center of the dip in the ideal pro-file to the opposite direction of the estimated AP direction,as shown in Figure 5(c). Next, let T = [t0, ..., tm−1] andR = [r0, ..., rm−1] denote the vectors of RSS values for theidealized (and aligned) profile and the measured profile, re-spectively. The confidence value ρ is:
ρ =1
m·
P
i∈[0,m−1](ti − t)(ri − r)
σT · σR
, (6)
where t, r are the mean values of T,R respectively, andσT, σR are the standard deviations of T,R. The larger ρis, the more confident Borealis is about its estimate. It iseasy to prove that the values of Ap and Ad do not affect ρ,as long as Ap > Ad. Thus we set Ap=1 and Ad=0.
4.5 Direction-Guided User NavigationWhile direction analysis provides a good estimate of the
AP’s direction relative to a location, the goal of Borealisis to allow users to determine the AP’s physical location.We choose to adopt methodology similar to prior work [10,14, 15], where a user moves towards the AP and performsperiodic direction estimates to tune its direction. Navigationends when she reaches the AP.
We modify prior approaches by leveraging our predictionconfidence results to determine how frequently a user shouldupdate her direction of movement. Doing so less frequently,i.e. longer distances between measurements, reduces thenumber of measurements required. But this means errorfrom a single measurement will have a greater impact onthe efficiency of the path taken. We dynamically select thestep size based on the confidence value predicted for eachdirection estimate. A high confidence implies a reliable esti-mate and means the user can travel a longer distance beforerepeating the estimate. In contrast, a direction estimatewith low confidence means the user is likely in a locationwith complex propagation conditions, and should repeat theestimate after moving a short distance along the predicteddirection. We use detailed experiments to evaluate this inSection 6.
Phone Hardware
Application Layer
OS Layer
Directional Analysis
Modified WiFi Driver
Navigation
Compass SensorWiFi
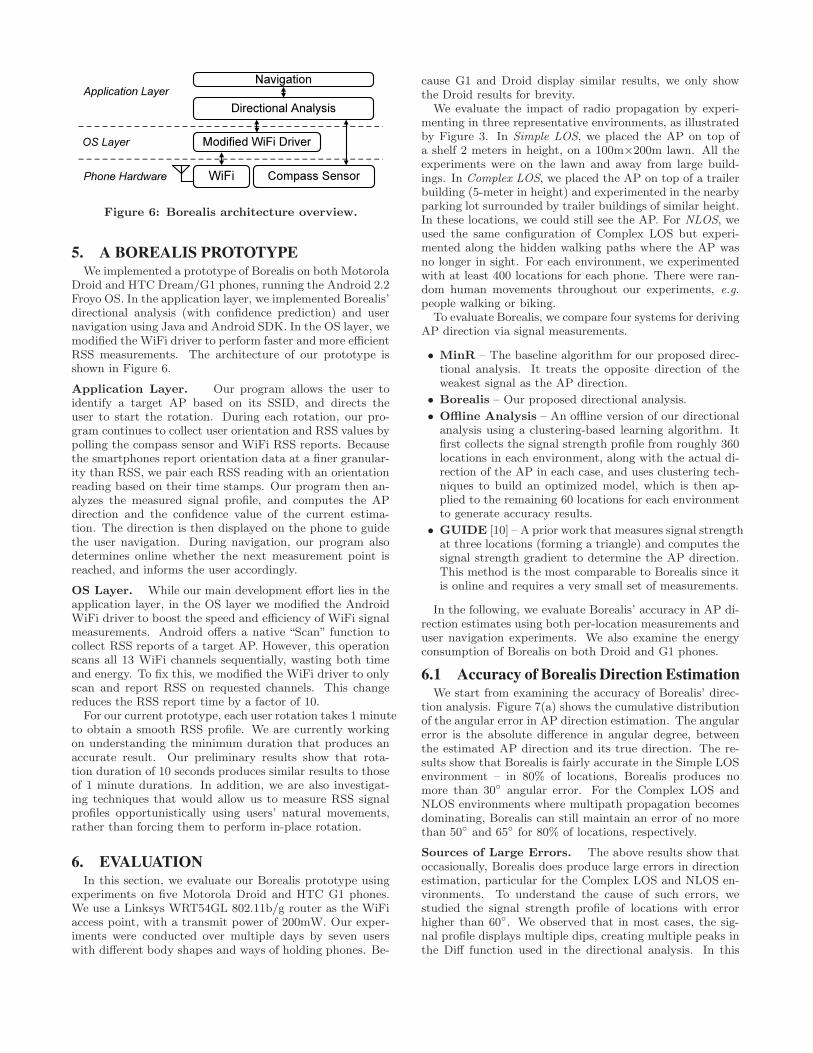
Figure 6: Borealis architecture overview.
5. A BOREALIS PROTOTYPEWe implemented a prototype of Borealis on both Motorola
Droid and HTC Dream/G1 phones, running the Android 2.2Froyo OS. In the application layer, we implemented Borealis’directional analysis (with confidence prediction) and usernavigation using Java and Android SDK. In the OS layer, wemodified the WiFi driver to perform faster and more efficientRSS measurements. The architecture of our prototype isshown in Figure 6.
Application Layer. Our program allows the user toidentify a target AP based on its SSID, and directs theuser to start the rotation. During each rotation, our pro-gram continues to collect user orientation and RSS values bypolling the compass sensor and WiFi RSS reports. Becausethe smartphones report orientation data at a finer granular-ity than RSS, we pair each RSS reading with an orientationreading based on their time stamps. Our program then an-alyzes the measured signal profile, and computes the APdirection and the confidence value of the current estima-tion. The direction is then displayed on the phone to guidethe user navigation. During navigation, our program alsodetermines online whether the next measurement point isreached, and informs the user accordingly.
OS Layer. While our main development effort lies in theapplication layer, in the OS layer we modified the AndroidWiFi driver to boost the speed and efficiency of WiFi signalmeasurements. Android offers a native “Scan” function tocollect RSS reports of a target AP. However, this operationscans all 13 WiFi channels sequentially, wasting both timeand energy. To fix this, we modified the WiFi driver to onlyscan and report RSS on requested channels. This changereduces the RSS report time by a factor of 10.
For our current prototype, each user rotation takes 1 minuteto obtain a smooth RSS profile. We are currently workingon understanding the minimum duration that produces anaccurate result. Our preliminary results show that rota-tion duration of 10 seconds produces similar results to thoseof 1 minute durations. In addition, we are also investigat-ing techniques that would allow us to measure RSS signalprofiles opportunistically using users’ natural movements,rather than forcing them to perform in-place rotation.
6. EVALUATIONIn this section, we evaluate our Borealis prototype using
experiments on five Motorola Droid and HTC G1 phones.We use a Linksys WRT54GL 802.11b/g router as the WiFiaccess point, with a transmit power of 200mW. Our exper-iments were conducted over multiple days by seven userswith different body shapes and ways of holding phones. Be-
cause G1 and Droid display similar results, we only showthe Droid results for brevity.
We evaluate the impact of radio propagation by experi-menting in three representative environments, as illustratedby Figure 3. In Simple LOS, we placed the AP on top ofa shelf 2 meters in height, on a 100m×200m lawn. All theexperiments were on the lawn and away from large build-ings. In Complex LOS, we placed the AP on top of a trailerbuilding (5-meter in height) and experimented in the nearbyparking lot surrounded by trailer buildings of similar height.In these locations, we could still see the AP. For NLOS, weused the same configuration of Complex LOS but experi-mented along the hidden walking paths where the AP wasno longer in sight. For each environment, we experimentedwith at least 400 locations for each phone. There were ran-dom human movements throughout our experiments, e.g.people walking or biking.
To evaluate Borealis, we compare four systems for derivingAP direction via signal measurements.
• MinR – The baseline algorithm for our proposed direc-tional analysis. It treats the opposite direction of theweakest signal as the AP direction.
• Borealis – Our proposed directional analysis.
• Offline Analysis – An offline version of our directionalanalysis using a clustering-based learning algorithm. Itfirst collects the signal strength profile from roughly 360locations in each environment, along with the actual di-rection of the AP in each case, and uses clustering tech-niques to build an optimized model, which is then ap-plied to the remaining 60 locations for each environmentto generate accuracy results.
• GUIDE [10] – A prior work that measures signal strengthat three locations (forming a triangle) and computes thesignal strength gradient to determine the AP direction.This method is the most comparable to Borealis since itis online and requires a very small set of measurements.
In the following, we evaluate Borealis’ accuracy in AP di-rection estimates using both per-location measurements anduser navigation experiments. We also examine the energyconsumption of Borealis on both Droid and G1 phones.
6.1 Accuracy of Borealis Direction EstimationWe start from examining the accuracy of Borealis’ direc-
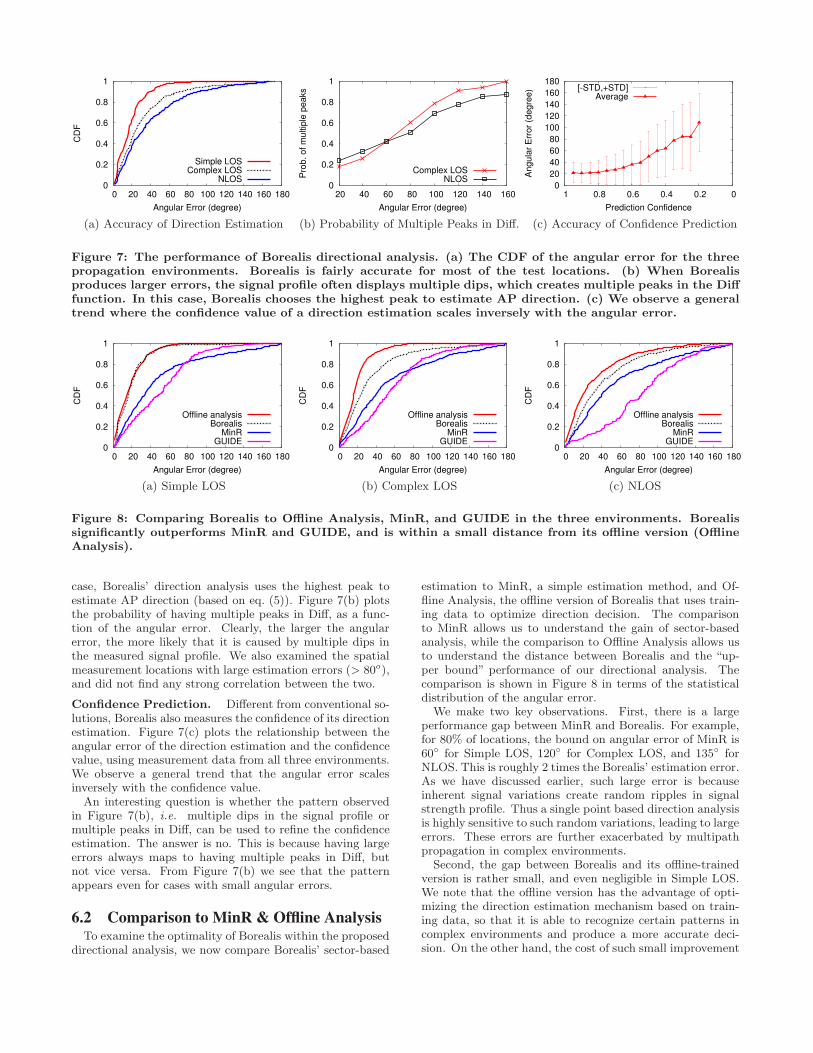
tion analysis. Figure 7(a) shows the cumulative distributionof the angular error in AP direction estimation. The angularerror is the absolute difference in angular degree, betweenthe estimated AP direction and its true direction. The re-sults show that Borealis is fairly accurate in the Simple LOSenvironment – in 80% of locations, Borealis produces nomore than 30◦ angular error. For the Complex LOS andNLOS environments where multipath propagation becomesdominating, Borealis can still maintain an error of no morethan 50◦ and 65◦ for 80% of locations, respectively.
Sources of Large Errors. The above results show thatoccasionally, Borealis does produce large errors in directionestimation, particular for the Complex LOS and NLOS en-vironments. To understand the cause of such errors, westudied the signal strength profile of locations with errorhigher than 60◦. We observed that in most cases, the sig-nal profile displays multiple dips, creating multiple peaks inthe Diff function used in the directional analysis. In this
0
0.2
0.4
0.6
0.8
1
0 20 40 60 80 100 120 140 160 180
CD
F
Angular Error (degree)
Simple LOSComplex LOS
NLOS
(a) Accuracy of Direction Estimation
0
0.2
0.4
0.6
0.8
1
20 40 60 80 100 120 140 160
Pro
b. of m
ultip
le p
eaks
Angular Error (degree)
Complex LOSNLOS
(b) Probability of Multiple Peaks in Diff.
0
20
40
60
80
100
120
140
160
180
0 0.2 0.4 0.6 0.8 1
Angula
r E
rror
(degre
e)
Prediction Confidence
[-STD,+STD]Average
(c) Accuracy of Confidence Prediction
Figure 7: The performance of Borealis directional analysis. (a) The CDF of the angular error for the threepropagation environments. Borealis is fairly accurate for most of the test locations. (b) When Borealisproduces larger errors, the signal profile often displays multiple dips, which creates multiple peaks in the Difffunction. In this case, Borealis chooses the highest peak to estimate AP direction. (c) We observe a generaltrend where the confidence value of a direction estimation scales inversely with the angular error.
0
0.2
0.4
0.6
0.8
1
0 20 40 60 80 100 120 140 160 180
CD
F
Angular Error (degree)
Offline analysisBorealis
MinRGUIDE
(a) Simple LOS
0
0.2
0.4
0.6
0.8
1
0 20 40 60 80 100 120 140 160 180
CD
F
Angular Error (degree)
Offline analysisBorealis
MinRGUIDE
(b) Complex LOS
0
0.2
0.4
0.6
0.8
1
0 20 40 60 80 100 120 140 160 180
CD
F
Angular Error (degree)
Offline analysisBorealis
MinRGUIDE
(c) NLOS
Figure 8: Comparing Borealis to Offline Analysis, MinR, and GUIDE in the three environments. Borealissignificantly outperforms MinR and GUIDE, and is within a small distance from its offline version (OfflineAnalysis).
case, Borealis’ direction analysis uses the highest peak toestimate AP direction (based on eq. (5)). Figure 7(b) plotsthe probability of having multiple peaks in Diff, as a func-tion of the angular error. Clearly, the larger the angularerror, the more likely that it is caused by multiple dips inthe measured signal profile. We also examined the spatialmeasurement locations with large estimation errors (> 80o),and did not find any strong correlation between the two.
Confidence Prediction. Different from conventional so-lutions, Borealis also measures the confidence of its directionestimation. Figure 7(c) plots the relationship between theangular error of the direction estimation and the confidencevalue, using measurement data from all three environments.We observe a general trend that the angular error scalesinversely with the confidence value.
An interesting question is whether the pattern observedin Figure 7(b), i.e. multiple dips in the signal profile ormultiple peaks in Diff, can be used to refine the confidenceestimation. The answer is no. This is because having largeerrors always maps to having multiple peaks in Diff, butnot vice versa. From Figure 7(b) we see that the patternappears even for cases with small angular errors.
6.2 Comparison to MinR & Offline AnalysisTo examine the optimality of Borealis within the proposed
directional analysis, we now compare Borealis’ sector-based
estimation to MinR, a simple estimation method, and Of-fline Analysis, the offline version of Borealis that uses train-ing data to optimize direction decision. The comparisonto MinR allows us to understand the gain of sector-basedanalysis, while the comparison to Offline Analysis allows usto understand the distance between Borealis and the “up-per bound” performance of our directional analysis. Thecomparison is shown in Figure 8 in terms of the statisticaldistribution of the angular error.
We make two key observations. First, there is a largeperformance gap between MinR and Borealis. For example,for 80% of locations, the bound on angular error of MinR is60◦ for Simple LOS, 120◦ for Complex LOS, and 135◦ forNLOS. This is roughly 2 times the Borealis’ estimation error.As we have discussed earlier, such large error is becauseinherent signal variations create random ripples in signalstrength profile. Thus a single point based direction analysisis highly sensitive to such random variations, leading to largeerrors. These errors are further exacerbated by multipathpropagation in complex environments.
Second, the gap between Borealis and its offline-trainedversion is rather small, and even negligible in Simple LOS.We note that the offline version has the advantage of opti-mizing the direction estimation mechanism based on train-ing data, so that it is able to recognize certain patterns incomplex environments and produce a more accurate deci-sion. On the other hand, the cost of such small improvement
is the large measurement overhead and the fact of being anoffline learning solution requires actual knowledge of the APdirection. Overall, because the gap between the two meth-ods is small, we conclude that Borealis is a practical andeffective solution for determining AP direction in real time.
6.3 Comparison to GUIDEWe now turn our attention to GUIDE [10] , the most
relevant work in AP direction prediction using signal mea-surements. Similar to Borealis, GUIDE operates online, usesonly a single receiver and requires a small set of measure-ments (at three locations). Different from Borealis, GUIDEapplies a triangle-gradient based solution to estimate the APdirection.
We implemented GUIDE on our smartphones and exper-imented it in the three environments. Figure 8 comparesthe performance of GUIDE to that of Borealis. We see thatfor all three environments, Borealis significantly outperformsGUIDE. The key reason behind such large performance gapis that GUIDE (and other gradient based solutions) assumesthat received signal strength degrades with the distance be-tween the transmitter and receiver. In practice, this doesnot always hold, even in the simple LOS environment. Ourown experiments show that the above assumption breaks inroughly 30% of the measurement cases.
For fairness, we did not compare Borealis to other APlocalization methods, such as [28] and [11] . This is be-cause these designs either require sophisticated directionalantenna [28] or large measurements [11].
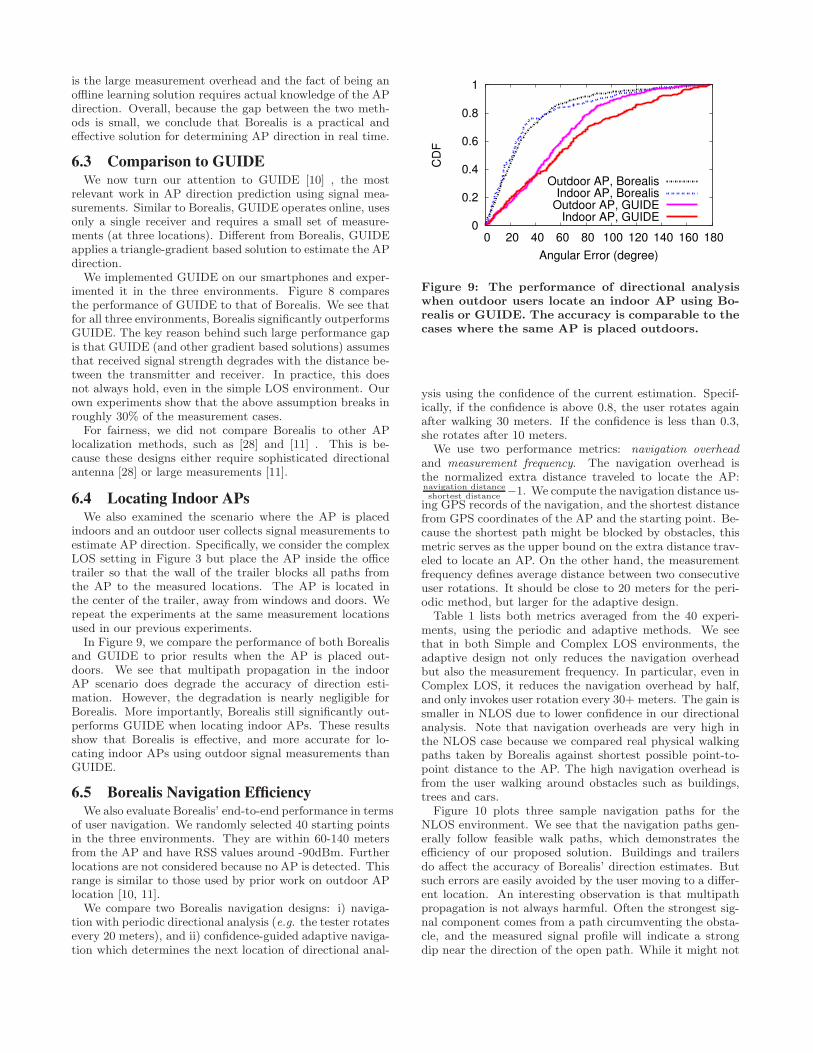
6.4 Locating Indoor APsWe also examined the scenario where the AP is placed
indoors and an outdoor user collects signal measurements toestimate AP direction. Specifically, we consider the complexLOS setting in Figure 3 but place the AP inside the officetrailer so that the wall of the trailer blocks all paths fromthe AP to the measured locations. The AP is located inthe center of the trailer, away from windows and doors. Werepeat the experiments at the same measurement locationsused in our previous experiments.
In Figure 9, we compare the performance of both Borealisand GUIDE to prior results when the AP is placed out-doors. We see that multipath propagation in the indoorAP scenario does degrade the accuracy of direction esti-mation. However, the degradation is nearly negligible forBorealis. More importantly, Borealis still significantly out-performs GUIDE when locating indoor APs. These resultsshow that Borealis is effective, and more accurate for lo-cating indoor APs using outdoor signal measurements thanGUIDE.
6.5 Borealis Navigation EfficiencyWe also evaluate Borealis’ end-to-end performance in terms
of user navigation. We randomly selected 40 starting pointsin the three environments. They are within 60-140 metersfrom the AP and have RSS values around -90dBm. Furtherlocations are not considered because no AP is detected. Thisrange is similar to those used by prior work on outdoor APlocation [10, 11].
We compare two Borealis navigation designs: i) naviga-tion with periodic directional analysis (e.g. the tester rotatesevery 20 meters), and ii) confidence-guided adaptive naviga-tion which determines the next location of directional anal-
0
0.2
0.4
0.6
0.8
1
0 20 40 60 80 100 120 140 160 180
CD
F
Angular Error (degree)
Outdoor AP, BorealisIndoor AP, Borealis
Outdoor AP, GUIDEIndoor AP, GUIDE
Figure 9: The performance of directional analysiswhen outdoor users locate an indoor AP using Bo-realis or GUIDE. The accuracy is comparable to thecases where the same AP is placed outdoors.
ysis using the confidence of the current estimation. Specif-ically, if the confidence is above 0.8, the user rotates againafter walking 30 meters. If the confidence is less than 0.3,she rotates after 10 meters.
We use two performance metrics: navigation overheadand measurement frequency. The navigation overhead isthe normalized extra distance traveled to locate the AP:navigation distanceshortest distance
−1. We compute the navigation distance us-ing GPS records of the navigation, and the shortest distancefrom GPS coordinates of the AP and the starting point. Be-cause the shortest path might be blocked by obstacles, thismetric serves as the upper bound on the extra distance trav-eled to locate an AP. On the other hand, the measurementfrequency defines average distance between two consecutiveuser rotations. It should be close to 20 meters for the peri-odic method, but larger for the adaptive design.
Table 1 lists both metrics averaged from the 40 experi-ments, using the periodic and adaptive methods. We seethat in both Simple and Complex LOS environments, theadaptive design not only reduces the navigation overheadbut also the measurement frequency. In particular, even inComplex LOS, it reduces the navigation overhead by half,and only invokes user rotation every 30+ meters. The gain issmaller in NLOS due to lower confidence in our directionalanalysis. Note that navigation overheads are very high inthe NLOS case because we compared real physical walkingpaths taken by Borealis against shortest possible point-to-point distance to the AP. The high navigation overhead isfrom the user walking around obstacles such as buildings,trees and cars.
Figure 10 plots three sample navigation paths for theNLOS environment. We see that the navigation paths gen-erally follow feasible walk paths, which demonstrates theefficiency of our proposed solution. Buildings and trailersdo affect the accuracy of Borealis’ direction estimates. Butsuch errors are easily avoided by the user moving to a differ-ent location. An interesting observation is that multipathpropagation is not always harmful. Often the strongest sig-nal component comes from a path circumventing the obsta-cle, and the measured signal profile will indicate a strongdip near the direction of the open path. While it might not
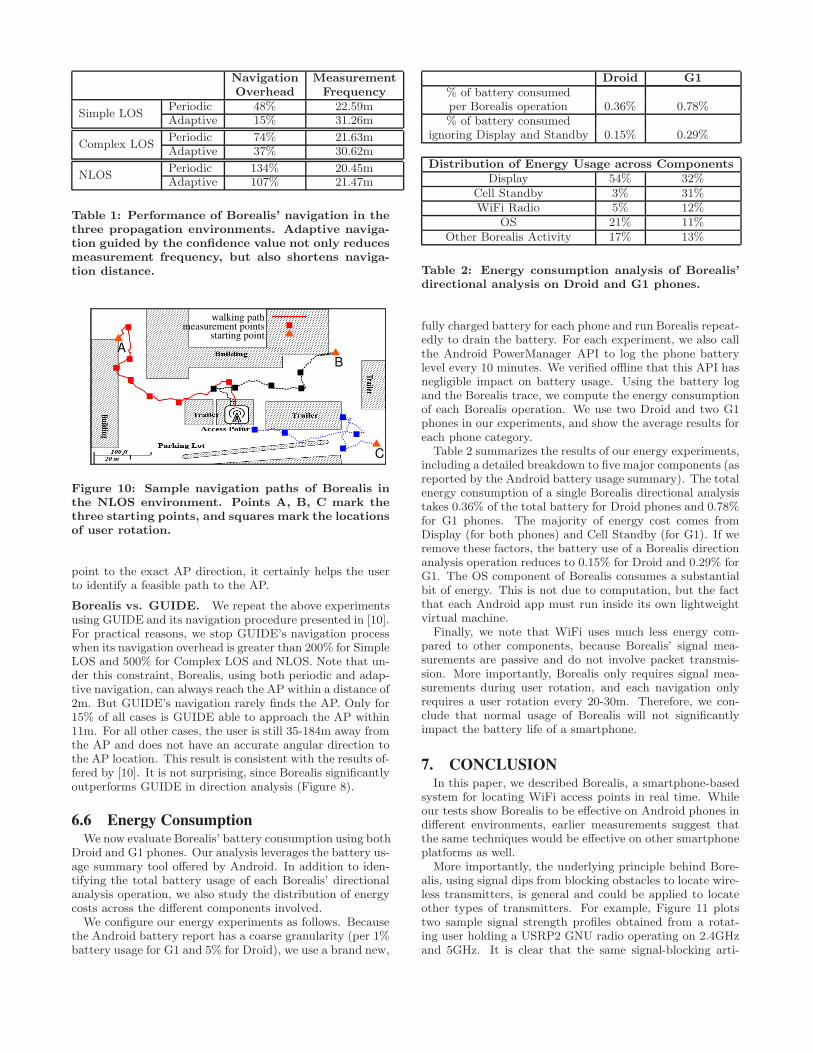
Navigation MeasurementOverhead Frequency
Simple LOSPeriodic 48% 22.59mAdaptive 15% 31.26m
Complex LOSPeriodic 74% 21.63mAdaptive 37% 30.62m
NLOSPeriodic 134% 20.45mAdaptive 107% 21.47m
Table 1: Performance of Borealis’ navigation in thethree propagation environments. Adaptive naviga-tion guided by the confidence value not only reducesmeasurement frequency, but also shortens naviga-tion distance.
walking pathmeasurement points
AB
C
starting point
Figure 10: Sample navigation paths of Borealis inthe NLOS environment. Points A, B, C mark thethree starting points, and squares mark the locationsof user rotation.
point to the exact AP direction, it certainly helps the userto identify a feasible path to the AP.
Borealis vs. GUIDE. We repeat the above experimentsusing GUIDE and its navigation procedure presented in [10].For practical reasons, we stop GUIDE’s navigation processwhen its navigation overhead is greater than 200% for SimpleLOS and 500% for Complex LOS and NLOS. Note that un-der this constraint, Borealis, using both periodic and adap-tive navigation, can always reach the AP within a distance of2m. But GUIDE’s navigation rarely finds the AP. Only for15% of all cases is GUIDE able to approach the AP within11m. For all other cases, the user is still 35-184m away fromthe AP and does not have an accurate angular direction tothe AP location. This result is consistent with the results of-fered by [10]. It is not surprising, since Borealis significantlyoutperforms GUIDE in direction analysis (Figure 8).
6.6 Energy ConsumptionWe now evaluate Borealis’ battery consumption using both
Droid and G1 phones. Our analysis leverages the battery us-age summary tool offered by Android. In addition to iden-tifying the total battery usage of each Borealis’ directionalanalysis operation, we also study the distribution of energycosts across the different components involved.
We configure our energy experiments as follows. Becausethe Android battery report has a coarse granularity (per 1%battery usage for G1 and 5% for Droid), we use a brand new,
Droid G1% of battery consumedper Borealis operation 0.36% 0.78%% of battery consumed
ignoring Display and Standby 0.15% 0.29%
Distribution of Energy Usage across ComponentsDisplay 54% 32%
Cell Standby 3% 31%WiFi Radio 5% 12%
OS 21% 11%Other Borealis Activity 17% 13%
Table 2: Energy consumption analysis of Borealis’directional analysis on Droid and G1 phones.
fully charged battery for each phone and run Borealis repeat-edly to drain the battery. For each experiment, we also callthe Android PowerManager API to log the phone batterylevel every 10 minutes. We verified offline that this API hasnegligible impact on battery usage. Using the battery logand the Borealis trace, we compute the energy consumptionof each Borealis operation. We use two Droid and two G1phones in our experiments, and show the average results foreach phone category.
Table 2 summarizes the results of our energy experiments,including a detailed breakdown to five major components (asreported by the Android battery usage summary). The totalenergy consumption of a single Borealis directional analysistakes 0.36% of the total battery for Droid phones and 0.78%for G1 phones. The majority of energy cost comes fromDisplay (for both phones) and Cell Standby (for G1). If weremove these factors, the battery use of a Borealis directionanalysis operation reduces to 0.15% for Droid and 0.29% forG1. The OS component of Borealis consumes a substantialbit of energy. This is not due to computation, but the factthat each Android app must run inside its own lightweightvirtual machine.
Finally, we note that WiFi uses much less energy com-pared to other components, because Borealis’ signal mea-surements are passive and do not involve packet transmis-sion. More importantly, Borealis only requires signal mea-surements during user rotation, and each navigation onlyrequires a user rotation every 20-30m. Therefore, we con-clude that normal usage of Borealis will not significantlyimpact the battery life of a smartphone.
7. CONCLUSIONIn this paper, we described Borealis, a smartphone-based
system for locating WiFi access points in real time. Whileour tests show Borealis to be effective on Android phones indifferent environments, earlier measurements suggest thatthe same techniques would be effective on other smartphoneplatforms as well.
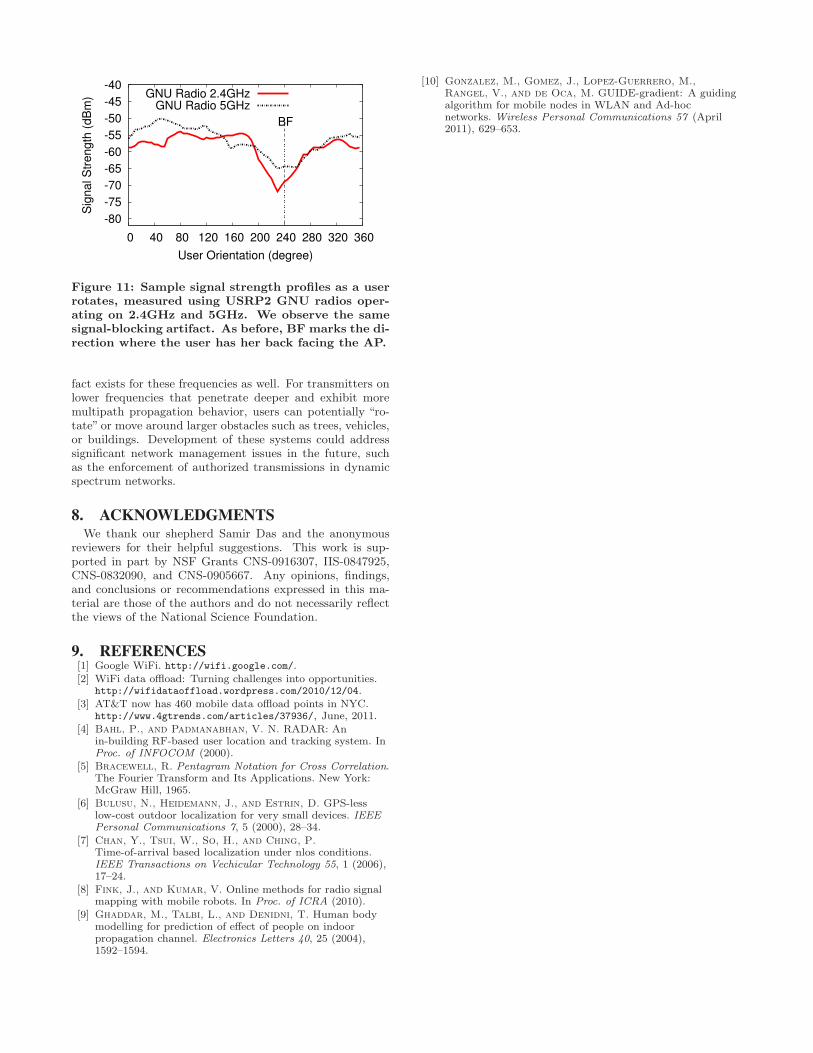
More importantly, the underlying principle behind Bore-alis, using signal dips from blocking obstacles to locate wire-less transmitters, is general and could be applied to locateother types of transmitters. For example, Figure 11 plotstwo sample signal strength profiles obtained from a rotat-ing user holding a USRP2 GNU radio operating on 2.4GHzand 5GHz. It is clear that the same signal-blocking arti-
-80
-75
-70
-65
-60
-55
-50
-45
-40
0 40 80 120 160 200 240 280 320 360
Sig
nal S
trength
(dB
m)
User Orientation (degree)
BF
GNU Radio 2.4GHzGNU Radio 5GHz
Figure 11: Sample signal strength profiles as a userrotates, measured using USRP2 GNU radios oper-ating on 2.4GHz and 5GHz. We observe the samesignal-blocking artifact. As before, BF marks the di-rection where the user has her back facing the AP.
fact exists for these frequencies as well. For transmitters onlower frequencies that penetrate deeper and exhibit moremultipath propagation behavior, users can potentially “ro-tate” or move around larger obstacles such as trees, vehicles,or buildings. Development of these systems could addresssignificant network management issues in the future, suchas the enforcement of authorized transmissions in dynamicspectrum networks.
8. ACKNOWLEDGMENTSWe thank our shepherd Samir Das and the anonymous
reviewers for their helpful suggestions. This work is sup-ported in part by NSF Grants CNS-0916307, IIS-0847925,CNS-0832090, and CNS-0905667. Any opinions, findings,and conclusions or recommendations expressed in this ma-terial are those of the authors and do not necessarily reflectthe views of the National Science Foundation.
9. REFERENCES[1] Google WiFi. http://wifi.google.com/.[2] WiFi data offload: Turning challenges into opportunities.
http://wifidataoffload.wordpress.com/2010/12/04.[3] AT&T now has 460 mobile data offload points in NYC.
http://www.4gtrends.com/articles/37936/, June, 2011.[4] Bahl, P., and Padmanabhan, V. N. RADAR: An
in-building RF-based user location and tracking system. InProc. of INFOCOM (2000).
[5] Bracewell, R. Pentagram Notation for Cross Correlation.The Fourier Transform and Its Applications. New York:McGraw Hill, 1965.
[6] Bulusu, N., Heidemann, J., and Estrin, D. GPS-lesslow-cost outdoor localization for very small devices. IEEEPersonal Communications 7, 5 (2000), 28–34.
[7] Chan, Y., Tsui, W., So, H., and Ching, P.Time-of-arrival based localization under nlos conditions.IEEE Transactions on Vechicular Technology 55, 1 (2006),17–24.
[8] Fink, J., and Kumar, V. Online methods for radio signalmapping with mobile robots. In Proc. of ICRA (2010).
[9] Ghaddar, M., Talbi, L., and Denidni, T. Human bodymodelling for prediction of effect of people on indoorpropagation channel. Electronics Letters 40, 25 (2004),1592–1594.
[10] Gonzalez, M., Gomez, J., Lopez-Guerrero, M.,Rangel, V., and de Oca, M. GUIDE-gradient: A guidingalgorithm for mobile nodes in WLAN and Ad-hocnetworks. Wireless Personal Communications 57 (April2011), 629–653.
[11] Han, D., Andersen, D., Kaminsky, M., Papagiannaki,K., and Seshan, S. Access point localization using localsignal strength gradient. In Proc. of PAM (2009).
[12] He, T., Huang, C., Blum, B., Stankovic, J., andAbdelzaher, T. Range-free localization scheme for largescale sensor networks. In Proc. of MobiCom (2003).
[13] Ho, K. C., and Xu, W. An accurate algebraic solution formoving source location using TDOA and FDOAmeasurements. IEEE Transactions on Signal Processing52, 9 (2004), 2453–2463.
[14] Kim, M., and Chong, N. RFID-based mobile robotguidance to a stationary target. Mechatronics 17, 4-5(2007), 217–229.
[15] Kim, M., and Chong, N. Direction sensing RFID readerfor mobile robot navigation. IEEE Transactions onAutomation Science and Engineering 6, 1 (2009), 44–54.
[16] LaMarca, A., Chawathe, Y., Consolvo, S., Hightower,J., Smith, I., Scott, J., Sohn, T., Howard, J., Hughes,J., Potter, F., et al. Place lab: Device positioning usingradio beacons in the wild. Pervasive Computing (2005),116–133.
[17] Nasipuri, A., and Li, K. A directionality based locationdiscovery scheme for wireless sensor networks. In Proc. ofWSNA (2002), ACM.
[18] Niculescu, D., and Nath, B. VOR based stations forindoor 802.11 positioning. In Proc. of MobiCom (2004).
[19] Pacchiano, R. Track down rogue wireless access points.WiFi Planet Tutorial, March 2006.
[20] Pages-Zamora, A., Vidal, J., and Brooks, D.Closed-form solution for positioning based on angle ofarrival measurements. In Proc. of PIMRC (2002).
[21] Pearson, K. Mathematical contributions to the theory ofevolution. iii. regression, heredity, and panmixia.Philosophical Transactions of the Royal Society of London.Series. A 187 (1896), 253–318.
[22] Poulsen, K. Wardriver pleads guilty in lowe’s wifi hacks.SecurityFocus, June 2004.http://www.securityfocus.com/news/8835.
[23] Roberts, B., and Pahlavan, K. Site-specific RSSsignature modeling for WiFi localization. In Proc. ofGLOBECOM (2009).
[24] Ryckaert, J., De Doncker, P., Meys, R., de Le Hoye,A., and Donnay, S. Channel model for wirelesscommunication around human body. Electronics Letters 40,9 (2004), 543–544.
[25] Sani, A., Zhong, L., and Sabharwal, A. Directionalantenna diversity for mobile devices: Characterizations andsolutions. In Proc. of MobiCom (2010).
[26] Savvides, A., Han, C., and Strivastava, M. Dynamicfine-grained localization in ad-hoc networks of sensors. InProc. of MobiCom (2001).
[27] Shah, S., Srirangarajan, S., and Tewfik, A.Implementation of a directional beacon-based positionlocation algorithm in a signal processing framework. IEEETransactions on Wireless Communications 9, 3 (2010),1044–1053.
[28] Subramanian, A., Deshpande, P., Gaojgao, J., andDas, S. Drive-by localization of roadside WiFi networks. InProc. of INFOCOM (2008).
[29] Sun, Y., Xiao, J., Li, X., and Cabrera-Mora, F.Adaptive source localization by a mobile robot using signalpower gradient in sensor networks. In Proc. ofGLOBECOM (2008).
[30] Welch, T., Musselman, R., Emessiene, B., Gift, P.,Choudhury, D., Cassadine, D., and Yano, S. The effectsof the human body on UWB signal propagation in anindoor environment. IEEE Journal on Selected Areas inCommunications 20, 9 (2002), 1778–1782.