Embed Size (px)
Citation preview
r-\i1
!.1
Ij
~
ANNUALREPORT
I
I
1j
~
!
r-1
,,
\
I
~,
r1!
~
ii
rI
r-!
j
J»DrJ8I.M81Iy,p"."'jW.~, Rect,am~tiQI1A~) Clbu City
!J
rIi
I11
.ISSION
VICENTEC. RIVERA,JR.Chairman
Secretary, Department of Transportation & Communications
CRISOSTOMO F. ABANESAlternate Chairman
Undersecretary, Department of Transportation &Communications
,ANTONIOJOSE B. ELUMIR,JR.
Vice Chairman
DR. RAUL P. ALCAREZCommissioner
-ROMULO P. MANIGSACA
Commissioner
MICHAELC. MENDOZACommissioner
PACITA G. TANCommissioner
RAMIRO V. VALENZUELA,JR.Commissioner
Atty. Leonides Francis F. QuiranteCorporate Board Secretary
4J. -!! AnnualReport 1999~., 11
~
ANTONIO JOSE B. ELUMIR, JR.General Manager
ENGR. DENNIS R. VILLAMORActing Deputy General Manager
Port Services DivisionManager
~
ENGR. MARIO G. TANEngineering Services Division
~
ROSARIO G. PEGAROMResource Management DivisionManager
,-OSCARJ. LOPEZ
Security,Safety, and Environment Division
ATTY.YUSOPJ.UCKUNGLegal AffairsDivisionManager
\
i- ROMEO S. ALVISOChief of Staff
Office of the General Manager
AnnualReport 1999'-
ISION
Engr. Sofronio T. MagdadaroConstruction/Maintenance Section
Engr. Jose Rido C. SullanoPlanning/Monitoring Section
Engr. Romeo A. Sevillautilities Section
'iRONMENT DIVISION
Felix E. QuianzonActing Intelligence &Investigation Section
Edmund V. Leopoldo, Sr.Access/Pass Control
Glenn S. SaradorPatrol/Traffic Section
Elizabeth C. SuarezFinance Officer
Perlita G. JumapaoSr. Industrial Relations Mgt. Officer
Leah S. GorreroSupply Officer
Bibiano V. JandayanOIC, General Services
~,j. Annual Report 1.999
II
.ION
Capt. Arnoldo I. MaglangitHarborMaster
Fernando C. TaladuaManager, Management Office 1
Nilo L. RiveraManager, Management Office 2
Benjamin B. CartillaManager, Management Office 3
Paterno C. SatinaManager, Management Office 4
Florencio B. AnibManager, Management Office 5
Rodrigo M. OportoManager, Management Office 6
Augusto V. DuranoManager, Management Office 7
Eutiquio Nunez, Jr.Manager, Management Office 8
Claro R. Cagigas, Jr.Manager, Management Office 9
Japier Czarina R. GarciaActing Chief Statistician
Annual Report 199911
-r.I,
~.......
..
'iV""'
I' I
"'i'~
0,
".'
,
"\;"/"
,
"
,,
"
,
"'
,
'
,
'
,
'. """"
'
,
'
,
' ~f.~.<I.'
"
, "I' "'81 '\,,/ ,",
.,~, r ' ~
'
,
">,
~,
"
,
'
,
'
,
T'~',
,~,,
~' J, h
'f..!!,'" J "tlL'irL- -""J
ERSREVIEW
In 1999, the country was caught in a frenzy of becoming Y2K compliant. Withmajority of its computer dependent services already upgraded before the lastquarter of 1999, the Authority was ready to embark to the new millennium.
1999was also a year when the Authority was besieged with various port strikes. Buteven with the strikes and the sudden resignation of the members of the 2nd CebuPort Commission at the last quarter of the year, these did not slacken the optimumoverall performance of the office in general.
A. YEAR2000 Y2K READINESS:
Pursuant to the provisions of RA 8747 otherwise known as the PhilippineYear 2000 Disclosure and Readiness Act and of EO NO.9 directing allgovernment institutions to ensure Y2K millennium compliance of computerbased systems, the CPA thru the guidance of the DOTC Y2K Contingencyand Readiness Center, identified and remedied Y2K critical areas.
A total of P 1.1 M was spent in upgrading computer hardware susceptible toY2K threats to make them Y2K compliant. The existing software used in thepayroll system,the billing and collection system,and the integrated accountingsystem were remediated free of charge by the software developers.
With the Y2K Readiness Certificate signed on December21, 1999, GedunkenCorporation, an independent validator authorized by the PresidentialCommission on Year 2000 Compliance of the Office of the President,certified the readiness of CPA on its mission critical systems.
B. ORGANIZATIONAL DEVELOPMENT
As of 31 December 1999, the total manpower complement stood at 191,composed of 178 regular employees and 13 employees on casual status, upby 1.6% over last year's 188 employees.
In an effort to attain the objectives of CPA through efficient and effectivepublic service, about 60% of the total manpower complement were sent tovarious trainings, conducted in-house or sponsored by other governmentagencies and private sectors.
I~.. ~;. Annual Report 1999
5
~
,.-.I
1I
B.
III
r-1i
r
(-I
I II ,i '
These trainings were aimed to enhance the level of awareness, knowledge,and skills of the employees.
Meanwhile, in line with the Authority's IT program and to facilitate theinterconnectivity among the different divisions and the management as awhole in terms of communications and research and for easier access ofinformation, the management engaged the services of MosaicCommunicationsfor its internet and intranet requirements. The ultimate goalis to achieve capability of telnetting remote computers to be able to usesome of their capabilities and of transferring files of information that wouldfacilitate paperless type of communications. All these are designed toimproved office efficiency.
Also, after almost two years of putting the organizational restructuring onhold due to several factors affecting management's efforts and the austeritymeasures issued by the President, the proposed restructuring which wasapproved by the 2ndCebu Port Commission was finally submitted to DBMforreview and approval. The proposed structure is envisioned to transform thepresent set-up into one that would be responsive to the purposes andobjectives for which CPA was created.
OPERATIONAL
For the year 1999, all port performance indicators, except for one (foreignbreakbulk cargo traffic at baseport), registered positive variances, comparedto 1998.
C.1 Baseport
Domestic ship calls increased by 10%, from 54,693 to 60,216 andforeign by 3%, from 398 to 409. The most significant increase(34%: 19,586 to 26,269) in the domestic calls was registered bythe ferry service between the cities of Cebu and Lapu-Iapu.
Calls of conventional and short run vessels also increased (10%and 12%, respectively) with the commissioning of new vessels.On the other hand, fastcraft services significantly went down (24%:9,812 to 7,452) due to the closure of one of the fastcraftcompanies and to the lesser calls made by the others because ofinternal operational and technical problems. Calls of Ro-Ro typevessels also decreased by 11%, mainly due to the recurring portconflicts in 1999.
~. Annual Report 1999h

B.
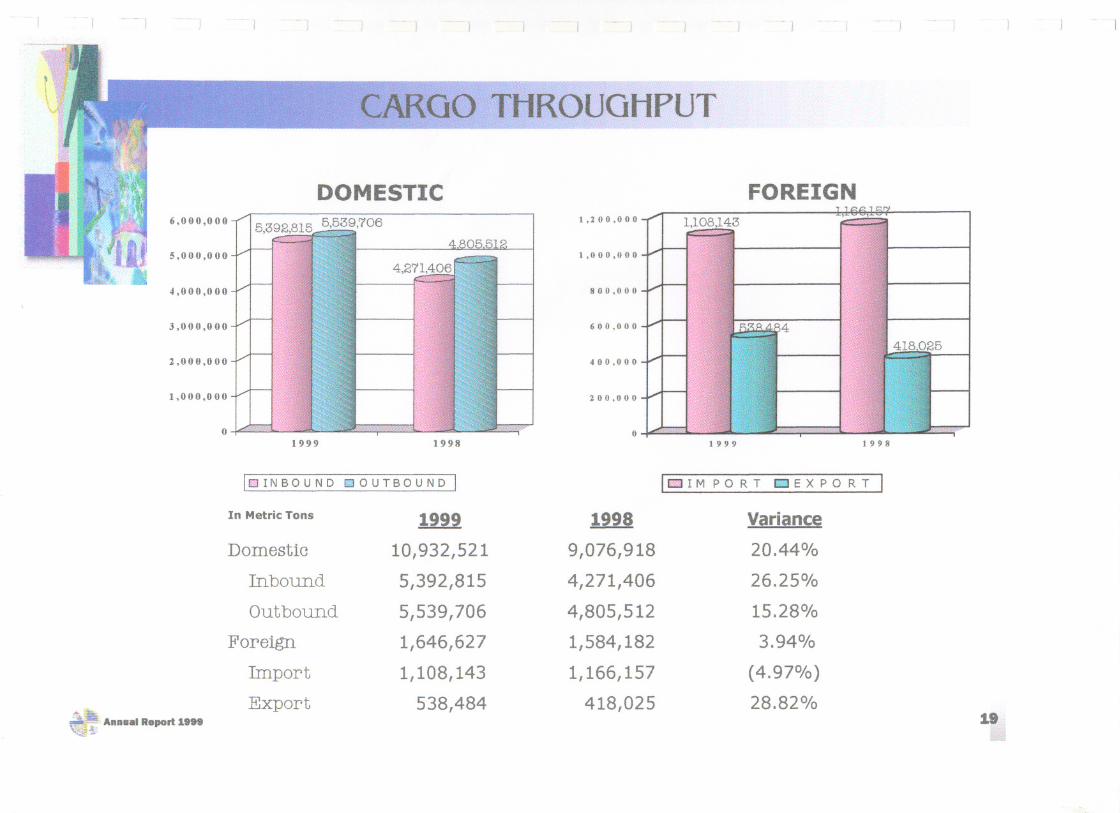
The domestic breakbulk cargo throughput increased by 15%, from5.7 M mts to 6.6 M mts, while foreign cargo throughput decreasedby 0.75%, from 0.436 M mts to 0.433 M mts.
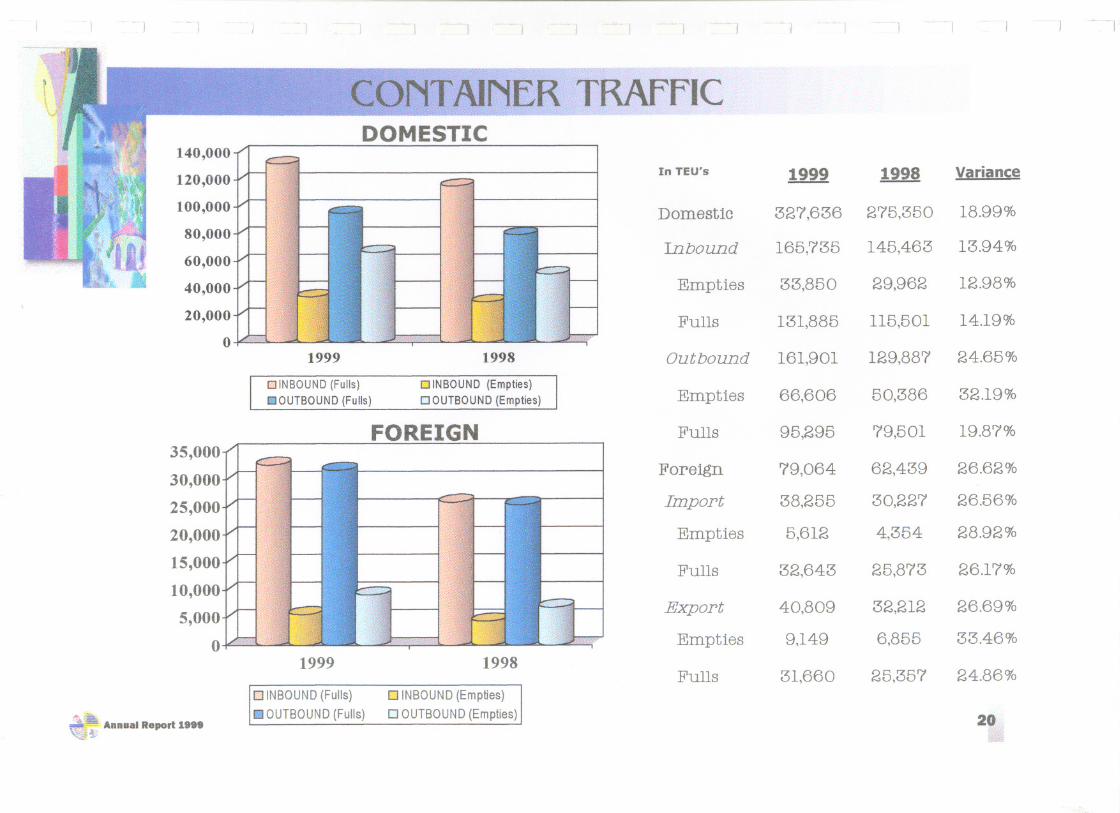
On the other hand, the domestic Container traffic increased by19%, from 275,350 TEUs in 1998 to 327,636 TEUs in 1999.Foreign container traffic also increased by 27%, from 62,493 TEUsto 79,064 TEUs.
Of the total domestic container traffic in 1999, 69% or 227,180TEUs were fulls and 31% or 100, 465 TEUs were empties. Forforeign, 81% or 64,303 were fulls and 19% or or 14,761 wereempties.
Passenger traffic increased slightly by 3%, from 10.38M in 1998to 10.61M in 1999.
C.2 Outports
The domestic ship calls increased by 11% in 1999compared 1998,from 13,108 to 14,574 calls, while foreign shipcalls also went upby 17%, from 174 to 204.
Domestic cargo throughput significantly increased by 31%, from3.34 mts in 1998 to 4.37M mts in 1999. The volume of passengermovement in the outports increased by 6%, from 1.48 M in 1998to 1.56 M in 1999.
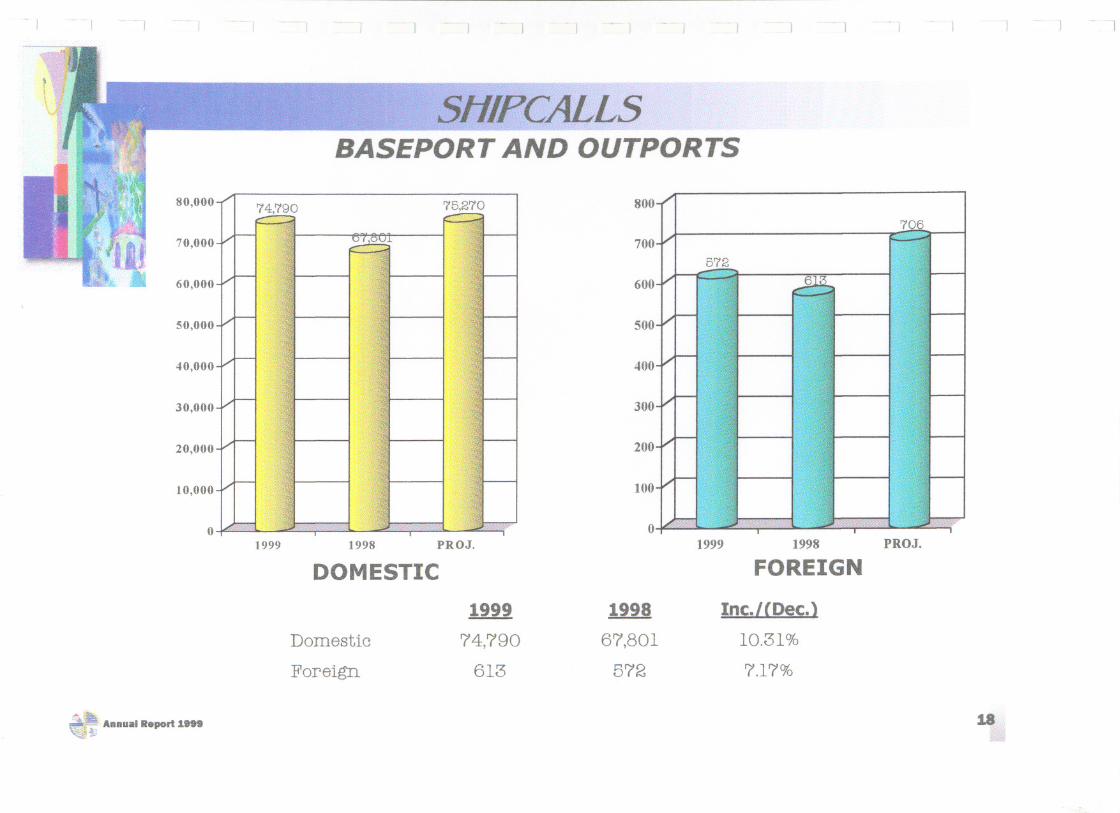
On the over-all, the Cebu Port Authority registered positive variances in1999 compared to 1998. Total foreign shipcalls increased by 7% from 572 to613, while domestic calls increased by 10% from 67,801 to 74,790. Totalforeign breakbulk throughput increased by 4%, from 1.58 M mts to 1.65 Mmts and domestic throughput increased by 20%, from 9.08 M mts to 10.93 Mmts. Total foreign container movements increased by 27%, from 62, 439TEUs to 79,064 TEUs, while domestic increased by 19% from 275,350 TEUsto 327,636 TEUs. Total passenger traffic increased by 3.5% from 11,755,634to 12,172,696.
ENGINEERING
At the close of 1999, the Authority was able to implement 16 Repair andMaintenance Projects and 2 Capital Outlay Projects in the amounts of
:- ~. P 69.5M and P 30.5M, respectively..~ Annual Report 1999 u
.-,
'\.. "I
t')'~ k'. " ,
i;~, ~.,'. ,,,. .
~~Lt~ ~r-~ Unfortunately,in the courseof the implementationof the differentprojects,the extent and seriousness of the damages and deterioration of the pre-warstructures of the Cebu port facilities was discovered to be worse thanpreviously determined and this became evident when 2 projects weresuspended because the adjacent RC decks collapsed while works on theseprojects were on going. It was then necessary that the repair of theseadjacent collapsed structures have to be done either first or simultaneouslybefore the works of the 2 projects could be continued and completed.Although it was the original intention of the management to conduct therehabilitation works in phases due to operational and budgetary constraints,management did not have any other options available at this instant andtherefore could not do otherwise but to implement the immediaterehabilitation of the affected areas.
B. FINANCIAL
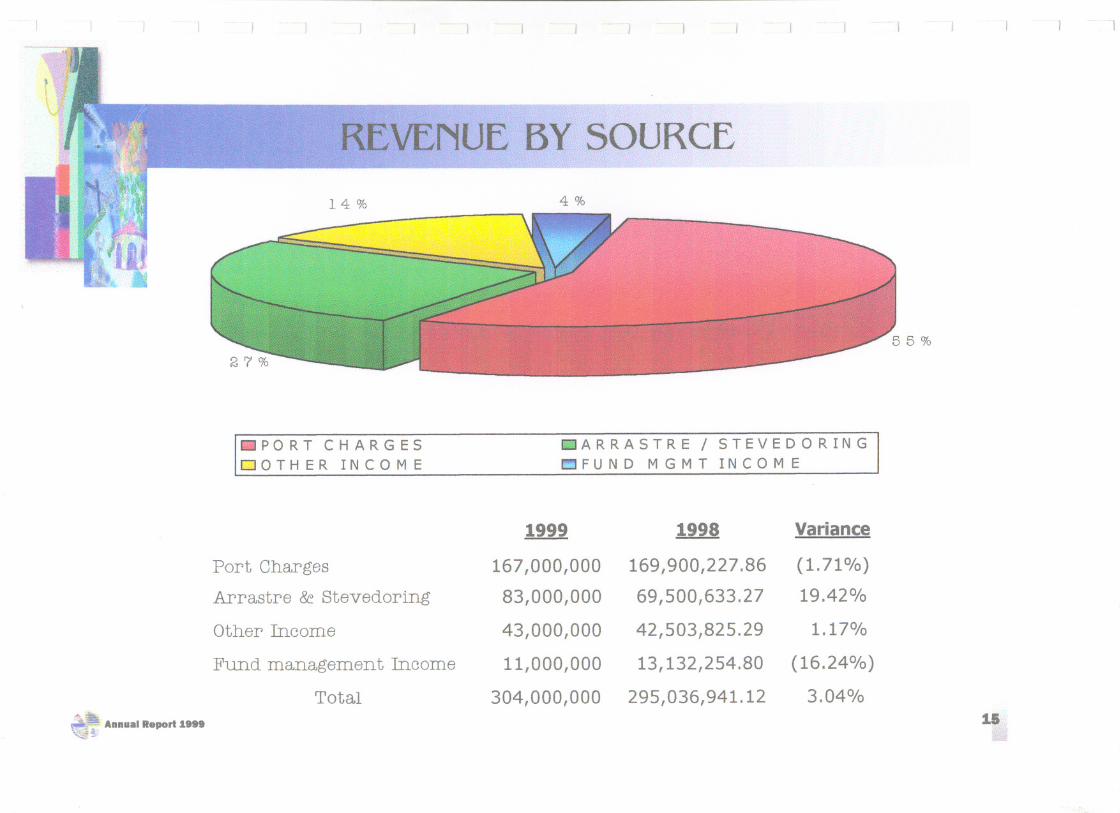
In 1999, CPA generated a total revenue of P. 304 M, a slight increase of 3%over last year's revenue of P. 295 M.
Revenues consisted of collection from vessel charges at P.54 M or 18% ofthe total revenue, wharfage dues at P.101 M or 33%, storage dues at P.12 Mor 4%, share from arrastre and stevedoring services at P.83 M or 27%, otherincome at P.43 M or 14%, and interest income at P.11 M or 4%.
The Authority, however, fell short by 2% of its projected revenue of P.310 M.Collection shortfall were for vessel charges by P.6 M, storage dues by P.7 M,and interest income by P.2 M. Revenue items that posted favorable budgetvariances were for wharfage dues by P. 3 M and share from arrastre andstevedoring services by P.6 M.
On the other hand, total cash operating expenses during the year amountedto P.225 M or an increase of 8% over the P. 208 M level in 1998, whilenon-cash charges remained almost unchanged at P. 70 M. With themanagement's efforts to minimize expenses, the Authority generatedbudgetary savings of P. 10M, of which P. 4 M was from the allotment forPersonal Services and P. 6 M from Maintenance and other OperatingExpenses.
c-":.~~.~
~j~ Annual Report 1999 ,*. ..
II,hI (to
"- ,..;.~ "Ii",~
I gjI ~"\\\1
!J4, "
"
'
.
I ~oIL l/t.
.
,""
1 . ,,' '1JiP ,. f" 1Ij~4
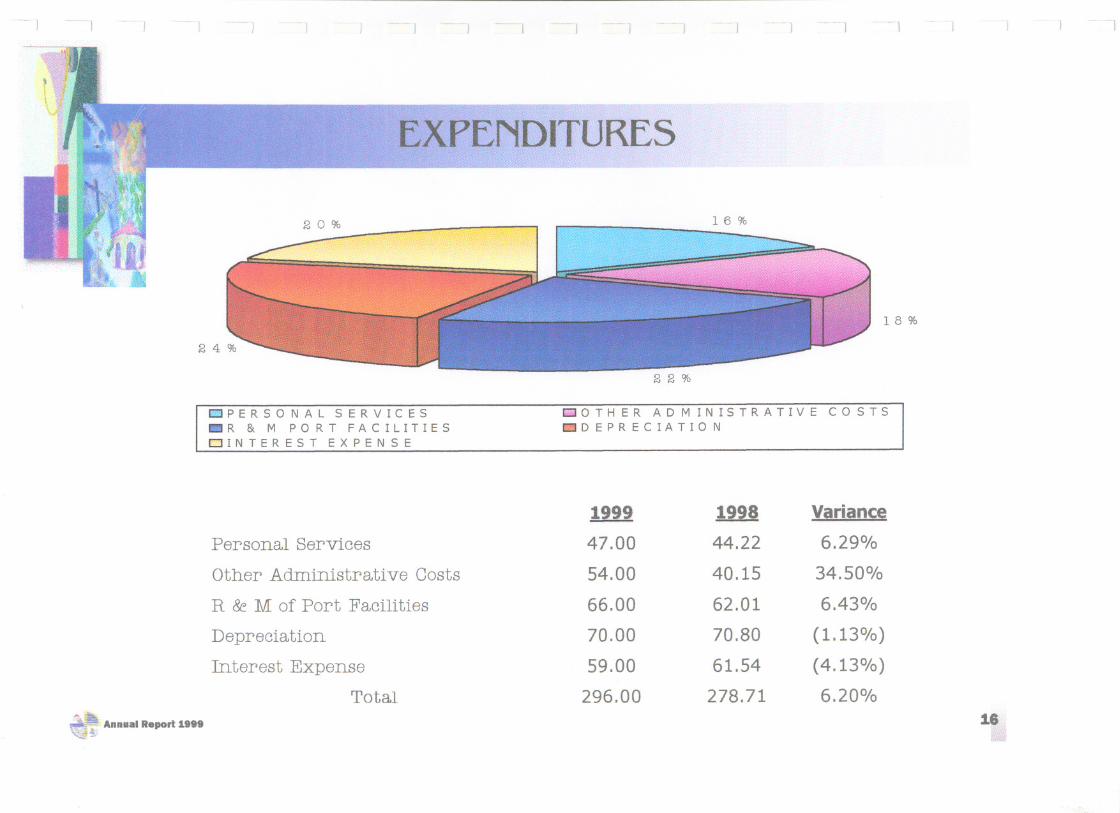
:..1 I.fr{'ilt!bo-" -~ Operating expenses consisted of Personal Services at P 47 M or 16% ofthe total OPEX,Repairs and Maintenanceof Port Facilitiesat P. 66 M or22%; Maintenance and Other Operating Expenses at P. 54 M or 18%inclusiveofthe provisionfor real estate tax at P.22 M;Depreciation Chargesat P.70 Mor 24%, and Interest Expense for foreign loan obligations at P.59Mor 20%.
r
-I
CPA made a P. 50 M principal repayments for existing loans withInternational Bank of Rehabilitation and Development (IBRD) andOverseasEconomicCooperationFund (OECF) which were assumed fromthe Philippine Ports Authoritywhen it took over the port operations in Cebuin 1996. Regarding these loans, CPAwill be relieved of its obligations withthe IBRD on 15 March 2000 after it shall have settled its 26thand last semi-annual amortization, while the OECF loan has ten (10) more years to go asits maturity will still be on 20 June 2010. As of December 1999, thebalances of the foreign loans, based on the original conversion rates,were P. 18.08 M and P. 140.185 M for the IBRD and OECF loans,respectively.
~
I
1-
..... With the guidance of the newly appointed 3rd Cebu Port Commission and thecontinued cooperation of its employees, management believes that theAuthority can attain its goal of establishing a world class port in Cebu,complemented by well-equipped and well-maintained network of portscontributing to a globally competitive delivery of safe, efficient and effective portservices, manned by professional, skilled, dedicated and motivated personnel.
r
A~R,JR.General Manager
~ "".
~'t" Annual Report 1999 .~ .
--J -, ~ -,
Annual Report 1999!;!
~
~~
~
F"",
'
.'"
.
,,
'
.
.
.
.
",
.
'.,
'
.,
"""
,
I,
'
,
"
""
"
.
"'
."
"
'
..'
.
'"
'. ' .., ,
, "", ..
, -, - J - -, -1
IifI~\1!
~~
-1 , -,
N"
CIAL' ,',
\11("~'r\1 il" .. """"/".,.""",,., "..,..",'."",,,,,,,,,.,,,.
- -l
'"
T
'i"'.'!t"
A
"'\'~ ",¥ "" 'T~"; _r~\
- J -I -I -, --l
1Q~
---J ~-I --I -I - -l - -1 -- I --I -1 -1 --l 1
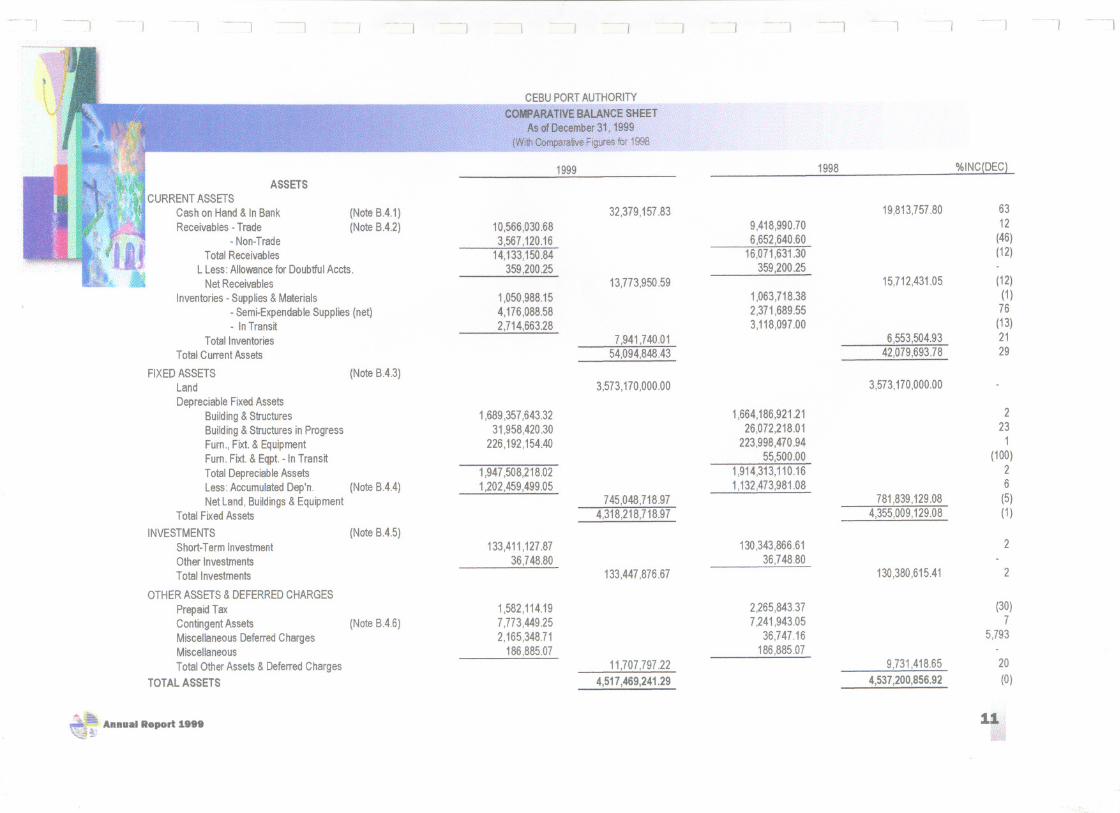
CURRENTASSETSCashon Hand& InBankReceivables-Trade
-Non-TradeTotalReceivables
L Less:Allowancefor DoubtfulAccts.NetReceivables
Inventories-Supplies&Materials- Semi-ExpendableSupplies(net)- InTransit
TotalInventoriesTotalCurrentAssets
FIXEDASSETSLand
DepreciableFixedAssetsBuilding&StructuresBuilding&Structuresin ProgressFum.,Fixt.& EquipmentFum.Fixt.& Eqpt.-In TransitTotalDepreciableAssetsLess:AccumulatedDep'n. (NoteB.4.4)NetLand,Buildings& Equipment
TotalFixedAssets
INVESTMENTSShort-TermInvestmentOtherInvestmentsTotallnvestments
ASSETS
OTHERASSETS&DEFERREDCHARGESPrepaidTaxContingentAssetsMiscellaneousDeferredChargesMiscellaneousTotalOtherAssets&DeferredCharges
TOTALASSETS
::,,~ Annual Report 1999~iJ
(NoteB.4.1)
(Note8.4.2)
(NoteB.4.3)
(NoteB.4.5)
(NoteB.4.6)
-/ ---1
%INC(DEC)
6312
(46)(12)
(12)(1)76(13)2129
2231
(100)26(5)(1)
2
2
(30)7
5,793
20
(0)
11
i<~
1999 1998
32,379,157.83 19,813,757.8010,566,030.68 9,418,990.703,567,120.16 6,652,640.60
14,133,150.84 16,071,631.30359,200.25 359,200.25
13,773,950.59 15,712,431.051,050,988.15 1,063,718.384,176,088.58 2,371,689.552,714,663.28 3,118,097.00
7,941,740.01 6,553,504.9354,094,848.43 42,079,693.78
3,573,170,000.00 3,573,170,000.00
1,689,357,643.32 1,664,186,921.2131,958,420.30 26,072,218.01
226,192,154.40 223,998,470.9455,500.00
1,947,508,218.02 1,914,313,110.161,202,459,499.05 1,132,473,981.08
745,048,718.97 781,839,129.084,318,218,718.97 4,355,009,129.08
133,411,127.87 130,343,866.6136,748.80 36,748.80
133,447,876.67 130,380,615.41
1,582,114.19 2,265,843.377,773,449.25 7,241,943.052,165,348.71 36,747.16
186,885.07 186,885.0711,707,797.22 9,731,418.65
4,517,469,241.29 4,537,200,856.92
--1
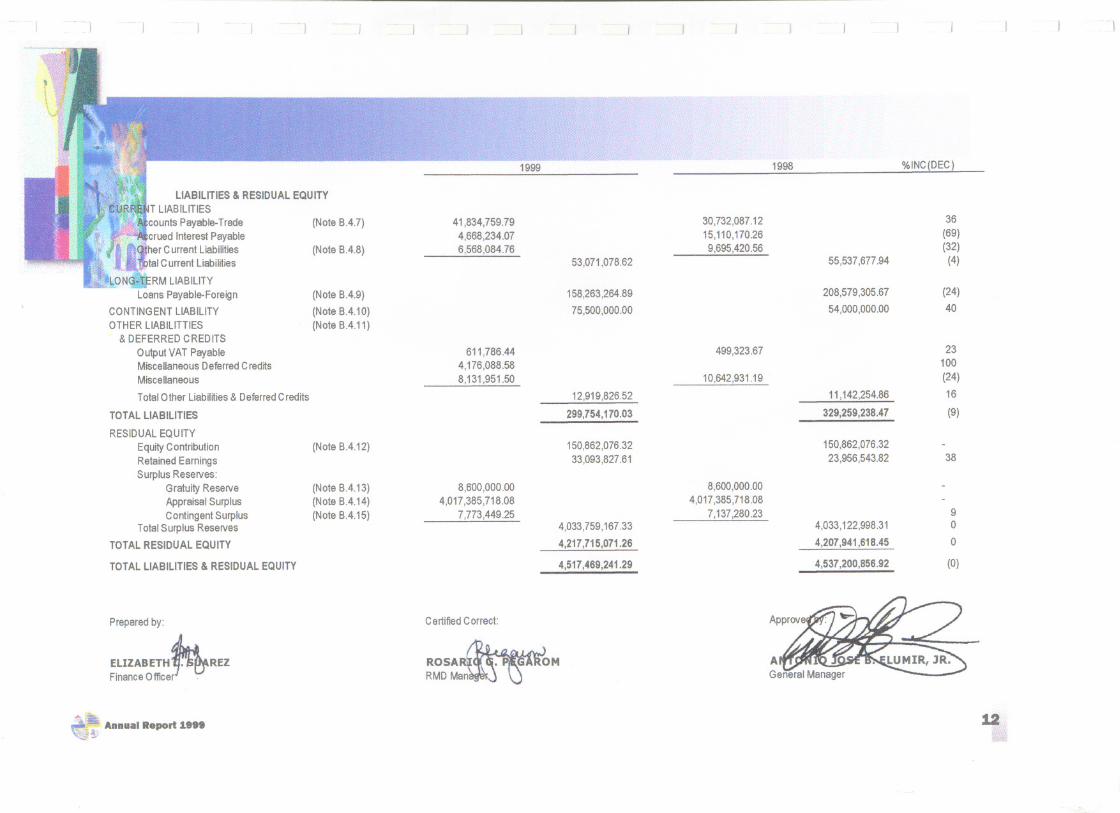
TotalOtherLiabilities& DeferredCredits
TOTALLIABILITIES
RESIDUALEQUITYEquityContributionRetainedEarningsSurplusReserves:
GratuityReserveAppraisalSurplusContingentSurplus
TotalSurplusReservesTOTALRESIDUALEQUITY
TOTALLIABILITIES& RESIDUALEQUITY
Preparedby:
EUZA8ETH~Rf2FinanceOfficer
--t.
Annual Report 1999
-1
'" --«
~ ~~
"'IW
<-
1998
-\
%INC(DEC)
(NoteB.4.7)
LIABILITIES& RESIDUALEQUITYT LlABILiTIES
countsPayable-Tradecrued InterestPayableler CurrentLiabilities,talCurrentLiabilities
-:RMLlA81L1TYLoansPayable-Foreign
CONTINGENTLIABILITYOTHERLlA81L1TTIES
& DEFERREDCREDITS
OutputVATPayableMiscellaneousDeferredCreditsMiscellaneous
(Note8.4.8)
(Note8.4.9)
(Note8.4.10)(Note8.4.11)
(Note8.4.12)
(Note8.4.13)(Note8.4.14)(NoteB.4.15)
36
(69)(32)(4)
(24)40
23100
(24)16
(9)
38
90
0
{OJ
CertifiedCorrect:
ROSA~OM
RMDM~ r'0"""
12
41,834,759.79 30,732,087.12
4,668,234.07 15,110,170.26
6,568,084.76 9,695,420.56
53,071,078.62 55,537,677.94
158,263,264.89 208,579,305.67
75,500,000.00 54,000,000.00
611,786.44 499,323.67
4,176,088.58
8,131,951.50 10,642,931.19
12,919,826.52 11,142,254.86
299,754,170.03 329,259,238.47
150,862,076.32 150,862,076.32
33,093,827.61 23,956,543.82
8,600,000.00 8,600,000.00
4,017,385,718.08 4,017,385,718.08
7,773,449.25 7,137,280.23
4,033,759,167.33 4,033,122,998.31
4,217,715,071.26 4,207,941,618.45
4,517,469,241.29 4,537,200,856.92
~Rnance Officer ~Prepared by: Certified Correct:
~~ft!I:. .. Annual Report 1999~ii
13,.,j;'S
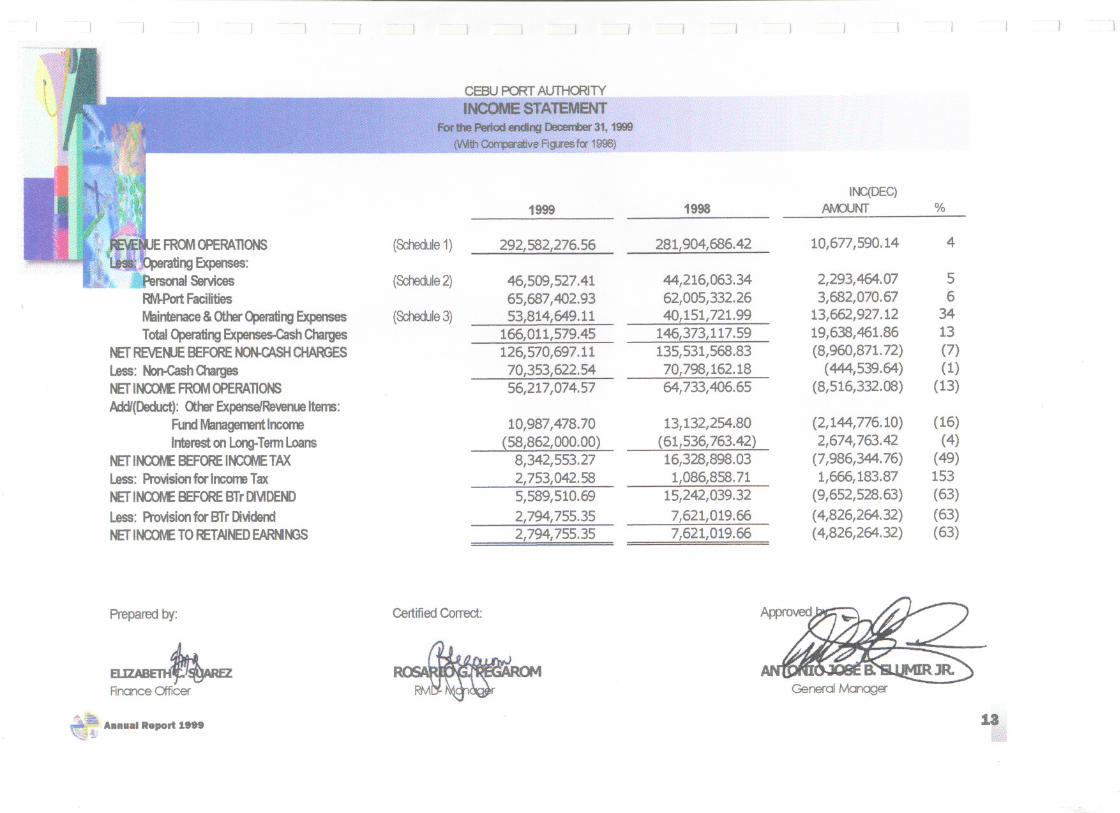
Ir-qoEC)1999 1998 M'OUNT %
FROMOPERATIONS (Schedule1) 292/582,276.56 281,904/686.42 10/677,590.14 4
'ratingExpenses:rsonal Services (Schedule2) 46,509,527.41 44,216,063.34 2,293,464.07 5
RM-PortFacilities 65, 687A02. 93 62,005,332.26 3/682/070.67 6
Maintenace& OtherOperatingExpenses (Schedule3) 53,814/649.11 40,151,721.99 13/662/927.12 34
Total Operating Expense$-CashCharges 166,011,579.45 146,373,117.59 19,638A61.86 13
NETREVEMJEBEFORENON-rASHCHARGES 126,570,697.11 135,531,568.83 (8/960,871. 72) (7)
less: Non-CashOlarges 70/353/622.54 70,798/162.18 (444/539.64) (1)NETINCONEFROMOPERA11ONS 56,217/074.57 64,733A06.65 (8,516,332.08) (13)
AdcII(Deduct):OtherExpenseJRevenueItems:FundManagementIncome 10,987A78. 70 13,132/254.80 (2,144,776.10) (16)
Interest onLong-TermLoans (58,862/000.00) (61,536/763.42) 2,674,763.42 (4)NETINCOrvEBEFOREINCOMETAX 8,342/553.27 16,328/898.03 (7,986,344.76) (49)less: PtovisionforlncomeTax 2,753,042.58 1,086/858.71 1/666/183.87 153
NETINCOM:BEFOREBTrDIVIDEND 5,589/510.69 15,242/039.32 (9/652,528.63) (63)
less: ProvisionforBTrDividend 2,794,755.35 7,621,019.66 (4,826/264.32) (63)NET INCOM: TORETAINEDEARNlN3S 2,794/755.35 71621/019.66 (4/826/264. 32) (63)
-,
INC(DEC)°/.1998
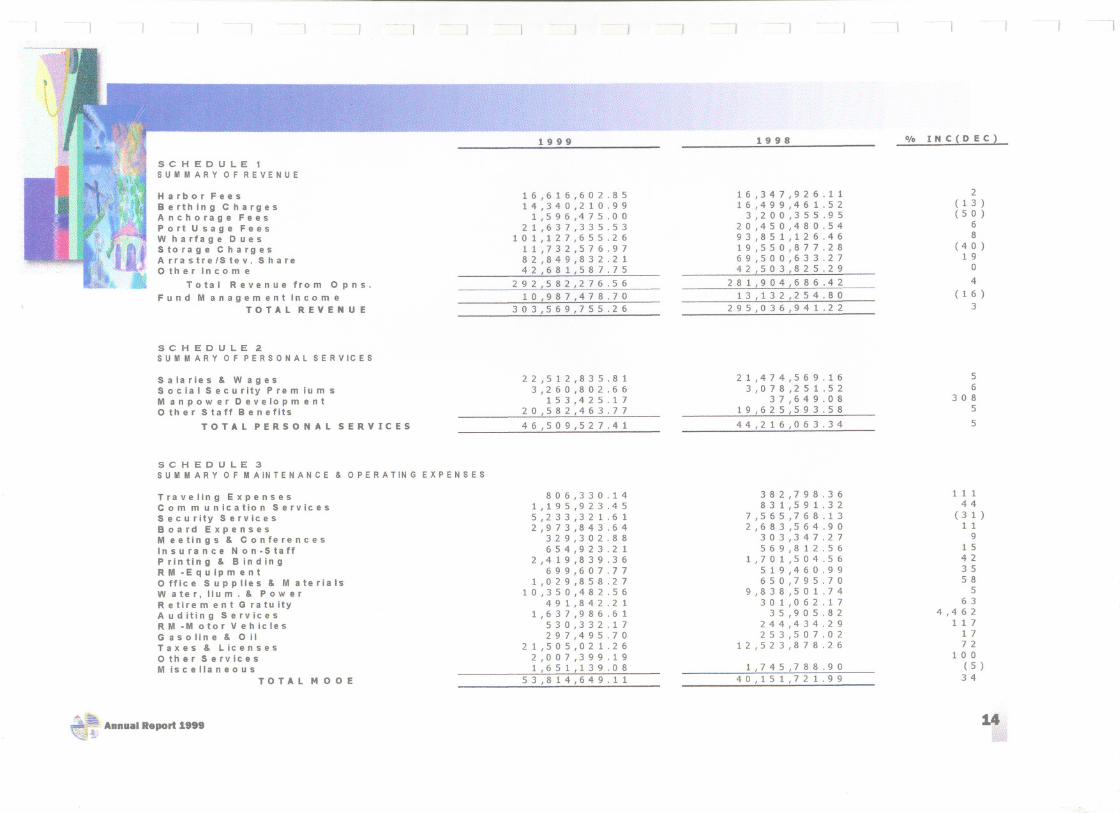
SCHEDULE fSUMMARY OF REVENUE
2( 1 3 )( 5 0 )
68
(40 )1 9
0
4
( 1 6 )3
16,347,926.1116,499,461.52
3,200,355.9520,450,480.5493,851,126.4619,550,877.2869,500,633.2742,503,825.29
281,904,686.4213,132,254.80
295,036,941.22
16,616,602.8514,340,210.99
1,596,475.0021,637,335.53
101,127,655.2611,732,576.9782,849,832.2142,681,587.75
292,582,276.5610,987,478.70
303,569,755.26
HarborFeesBerthing ChargesAnchorage FeesPort Usa g e Fee sWharfage DuesStorage ChargesA rrastre/Stev. Share0 th e r In com e
Total Revenue from 0 pns.Fund ManagementlncomE!
TOTAL REVENUE
SCHEDULE2SUM MAR Y 0 F PER SON A L S E R V IC E S
56
3 0 85
5
21,474,569.163,078,251.52
37,649.0819,625,593.58
44,216,063.34
22,512,835.813,260,802.66
153,425.1720,582,463.77
46,509,527.41
S a la r ie s & Wag e sSocial Security Prem ium sMan power D eve 10 p men t0 the r Staff Ben e fits
TOTAL PERSONAL SERVICES
SCHEDULE 3SUM MAR Y 0 F M A IN TEN A N C E & 0 PER A T IN G EX PEN S E S
1 1 144
(3 1 )1 1
91 5423 55 8
56 3
4,4621 1 7
1 772
1 0 0( 5 )
34
382,798.36831,591.32
7,565,768.132,683,564.90
303,347.27569,812.56
1,701,504.56519,460.99650,795.70
9,838,501.74301,062.17
35,905.82244,434.29253,507.02
12,523,878.26
806,330.141,195,923.455,233,321.612,973,843.64
329,302.88654,923.21
2,419,839.36699,607.77
1,029,858.2710,350,482.56
491,842.211,637,986.61
530,332.17297,495.70
21,505,021.262,007,399.191,651,139.08
53,814,649.11
Traveling ExpensesCom m unication ServicesS e cur ity S e r v ic e sBoard ExpensesMeetings & ConferencesInsurance Non-StaffPrinting & BindingRM-EquipmentOffice Supplies & MaterialsWater,IIum.& PowerRetirem ent GratuityAuditing ServicesRM -M otor VehiclesGasoline&OllTaxes & LicensesOther ServicesMiscellaneous
TOTALMOOE1,745,788.90
40,151,721.99
14.,t;Annual Report 1999
~..
BOURCE
14 % 4%
_PORT CHARGES
DOTHER INCOME
DJARRASTRE / STEVEDORINGIIIFUND MGMT INCOME
1999 1998 Variance
Port Charges 167,000,000 169,900,227.86 (1.71% )
Arrastre & Stevedoring 83,000,000 69,500,633.27 19.42%
Other Income 43,000,000 42,503,825.29 1.17%
Fund management Income 11,000,000 13,132,254.80 (16.24%)
Total 304,000,000 295,036,941.12 3.04%
Annual RfJIIOrt1999 16!i'
- ]
..," Annual Report 1999
- I -I -1--1 -I -I - --I - I-I - 1 - I -,
£~s..,L
20%
18%
22%
IBJPERSONAL SERVICESGIIR & M PORT FACILITIESEJINTEREST EXPENSE
lEaTHER ADMINISTRATIVE COSTSCIIDEPRECIATION
Personal Services
Other Administrative Costs
R &. M of Port Facilities
Depreciation
Interest Expense
Total
1999 1998 Variance
47.00 44.22 6.29%
54.00 40.15 34.50%
66.00 62.01 6.43%
70.00 70.80 (1.13%)
59.00 61.54 (4.13%)
296.00 278.71 6.20%18
tJii!i
-I I - I
~
, ..I
- I
§'
- ]
'if
- I --I -I
II.
-I
1t.. "!!$ 'nnual Report 1999
t,;
-I - I - -1
17ii'-,
- I - I
A ~ Annual Report 199'~
- I -- I - J
~ If Ii\! ~10
~~~
75,270 800
700
600
500
400
300
200
100
01998 PROJ.
DOMESTIC
Domestic
Foreign.
1999
74,790
613
18.~~
80,000
70,000
60,000
50,000
40,000
30,000
20,000
10,000
01999 1999 1998 PROJ.
FOREIGN
1998 Jnc./lDec.)
67,801 10.31%
572 7.17%
-) - - !
6,000,000
5,000,000
4,000,000
3,000,000
2,000,000
1,000,000
."'"'.,..~ Annaal Report 1999
!i<
~ '"
III.. ~
DOMESTIC
01999 1998
!fJiINBOUND ilJOUTBOUND I
In Metric Tons 1:U.2
10,932,521
5,392,815
5,539,706
1,646,627
1,108,143
538,484
Domestic
Inbound
Outbound
Foreign
Import
Export
-I - I
FOREIGN1,200,000
1,000,000
800,000
600,000
400,000
200,000
01999 1998
IE1IMPORT DliBEXPORT I
1998
9,076,918
4,271,406
4,805,512
1,584,182
1,166,157
418,025
Variance
20.44%
26.25%
15.28%
3.94%
(4.97% )
28.82%19
~
- J - -]-I
'~~RAfFIC~... =

Disem bar king
Embarking
- ) -1
7,000,000
6,000,000
5,000,000
4,000,000
3,000,000
2,000,000
1,000,000
0
~ Annual Report 1899i2
-I - 1 - ) -1- -1 - 1
RAFFICf..C.I!L_--"'If ~v ""--~""" - -
BASEPORT AND OUTPORTS
1999 1998
111.1EMBARKING II DISEMBARKING I
1999
6,085,286
6,087,410
1998
6,003,307
5,752,827
Inc.1(pee.)
1.37%
5.82%
1.
~I
22.~-'"