Embed Size (px)
Citation preview

I. BATHYMETRIC, MAGNETIC, AND SEISMIC REFLECTION DATA:GLOMAR CHALLENGER, LEG 28
Dennis E. Hayes,1 Lamont-Doherty Geological Observatory of Columbia University, Palisades, N.Y.and
Robert E. Wall, Submarine Geology and Geophysics Program, National Science Foundation, Washington, D.C.
INTRODUCTION
The underway geophysical data collected duringGlomar Challenger Cruise 28 from Fremantle, Australia,to Christchurch, New Zealand, are presented in twogroups of profiles (Figures 1 and 2). The first group ofdata consists of bathymetric and total intensity magneticanomaly profiles displayed as a function of distance andtime. The procedure used in reducing and displaying thedata was that described by Talwani (1969). Local time inhours and dates are shown at the top of each figure aswell as the positions where the tracks crossed integraldegrees of latitude and longitude. The Leg 28 drill-sitelocations, conspicuous morphological features and keymagnetic anomaly lineations, identified according to thesystem of Heirtzler et al. (1968) are labeled. For Figure 1the uppermost profile represents depths in nominalfathoms (1/400 sec of two-way reflection time). The ver-tical exaggeration on these depth profiles is 100:1. Thelower profile represents total intensity magneticanomalies in gammas. The regional magnetic field hasbeen removed using the IGRF coefficients of Cain et al.(1968). Selected positions are annotated along withcourse and speed made good between adjacent naviga-tion points. The detailed listing of the navigation isavailable through the Deep Sea Drilling Project office atScripps Institution of Oceanography. Distances alongthe track are indicated every 200 nautical miles at thebottom of each figure. The index track maps given inFigure 3a, b, c show the track location and are also an-notated with hundreds of miles, drill-site locations, andselected physiographic features. The navigational infor-mation printed near the bottom of the profilesrepresents the speed and course made good and does notnecessarily correspond with the dead-reckoned courseand speed.
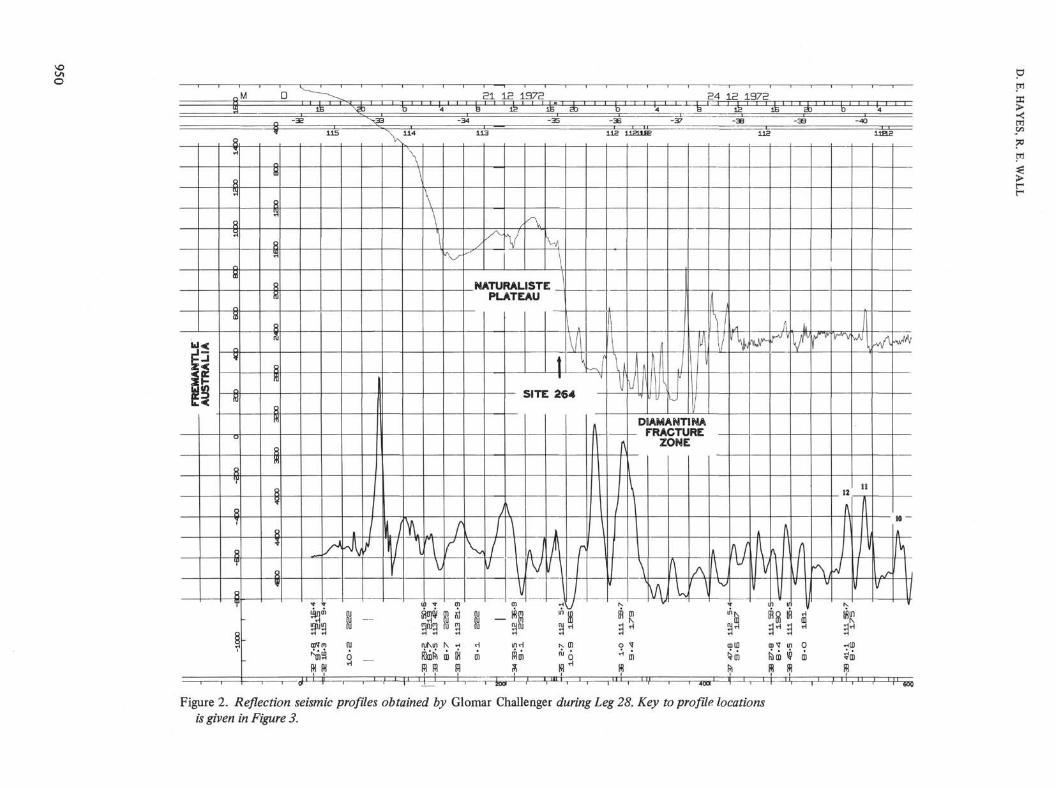
The second group of profiles (Figure 2) arephotographic reductions of original seismic profilerreflection records. The instrumentation incorporated inthe collection of these data and also that of themagnetics and depths are described briefly in the In-troduction chapter of this volume. Depth scales for theseismic records are given as seconds of two-way reflec-tion time for each profile. Note that 400 nominalfathoms approximately represent 1 sec of two-wayreflection time through the water layer. Subbottom
'Also Department of Geological Sciences, Columbia University,New York, N.Y.
depths can be estimated by assuming that the velocity ofcompressional waves in the unconsolidated sediments isapproximately 2 km/sec. With this assumption, each 1.0sec of reflection time represents 1 km of sediment.Selected time-date information is also shown at the bot-tom of each profile. In the case of the seismic profiles,the course-speed data shown on the original records arethose steered and do not correspond exactly with thefinal adjusted courses shown on the geophysical plots.The vertical exaggeration on these profiles is ap-proximately 30:1. Significant breaks in the record are in-dicated by the label "data gap." Hundreds of nauticalmiles along the track are also annotated across the bot-tom of the record and correspond with the distancesshown on the geophysical profiles and on the indexmaps of Figure 3.
The seismic profiles (Figure 2) must be read fromright to left on each sheet; the beginning portion of therecord starts at the upper right with time and distanceincreasing to the left. Although the time spent on thedrill sites is indicated, the precise locations of the siteson the seismic profiles are not given here; the drill sitesare located on those portions of the records reproducedin the individual site report chapters of this volume.
Selected isobaths taken from Hayes and Conolly(1972), Heezen et al. (1972), and Hayes and Davey (thisvolume) have been incorporated into the index figures.
NARRATIVEBetween Fremantle and Site 264, Glomar Challenger
proceeded southwest across the west Australian con-tinental margin and Naturaliste Plateau where Site 264was located. A conspicuous short-wavelength, high-amplitude magnetic anomaly was associated with theupper continental slope as shown near mile 80. Thesediments of the upper continental slope are highlyreflective, and very little penetration was obtained withthe high-frequency, low-energy airgun source used in theseismic system. The sediments on the NaturalistePlateau are basically transparent and correspond toabout 200-400 meters in thickness, resting on a highlyreflective acoustic basement surface. To the south, andseaward of the Naturaliste Plateau, the highly fracturedsea-floor morphology associated with the DiamantinaFracture Zone is evident. Depths in some of the deepervalleys of this tectonically complex zone exceed 3200fathoms. Slightly further south, the basement mor-phology becomes relatively smooth, and the uniformregional gradient of the sea floor (especially the base-ment layer) associated with the Southeast Indian Ridgeis evident from mile 425 to approximately mile 1200.
945

D. E. HAYES, R. E. WALL
Figure la. Bathymetry (upper profile) in nominal fathoms (1/400 sec reflection time) and total intensity magnetic anomalies(gammas) along track o/Glomar Challenger during Leg 28. Key to location is given in Figure 3.
The course on this leg of the cruise was essentially duesouth and the magnetic anomalies for this area, asdescribed by Weissel and Hayes (1972), are extremelywell displayed and labeled accordingly on thegeophysical plots. There was no evidence that any majorfracture zones were crossed along this traverse. The totalsediment veneer over the north flank of the SoutheastIndian Ridge is uniformly thin, thickening slightly awayfrom the axis of the ridge in a systematic manner,probably related simply to the increasing age of the un-derlying crust.
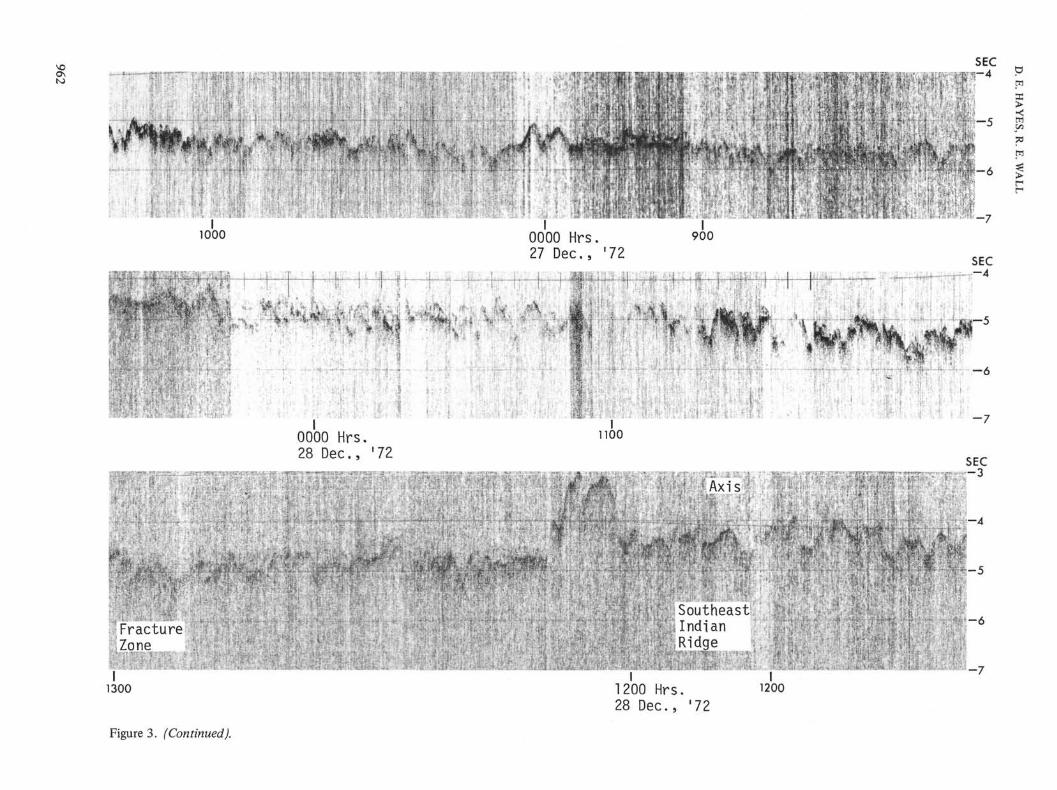
Near 50°S, close to the axis of the Southeast IndianRidge, the Antarctic Convergence was encountered.This was accompanied by a general degradation in theweather and high sea states. From about mile 1200 untilmile 1800 the quality of the seismic reflection records isextremely poor. Although the noisy record quality Is nodoubt partly related to the presence of rough seas,another factor is thought to be the unusual near-surfacesound velocity structure south of the Antarctic con-vergence. This velocity structure may have degraded thesignal/noise ratio by enhancing the horizontal propaga-tion of ship and towing noise.
Although there were slight maneuverings to occupySites 264, 265, and 267, the general course through thisregion was south, and the magnetic anomalies again areeasily recognized and identified on the geophysicalplots. At least one major fracture zone and perhapsother minor fracture zones were encountered along thetraverse from mile 1200 to mile 2000. The weather in the
vicinity of Site 268 was extremely rough, and thesediments of the lower continental rise north of WilkesLand were highly reflective, resulting in very poor sub-bottom penetration. The observed magnetic anomaliesbetween Sites 268 and 269 (mile 2200 to mile 3200) dis-play greatly different characteristics. Relatively loweramplitude, long-wave anomalies probably arise from thecombination of two effects: (1) the ship's course wasdominantly east-west in a region where magneticlineations, if they exist, also trend east-west; and (2) thisarea, with crust older than anomaly 20 (~50 m.y.B.P.),appears to be a region associated with a magneticallyquiet zone, as described by Weissel and Hayes (1972).
Between Sites 269 and 270, the Southeast IndianRidge was again traversed, and for small regions,specifically mile 3800 to mile 4200, several key magneticlineations of the Cenozoic pattern are easily recognized.The rough, step-like topography shown between miles3500 and 3700 reflects the transiting of two or more ma-jor fracture zones; these have been well mapped in theregion to the north and are indicated on Figure 3b, andalso by Hayes and Conolly (1972). Note that in theregion from about mile 3900 to mile 4200 the totalblanket of sediment resting on the flank of the SoutheastIndian Ridge is much thicker than its counterpart to thewest even for regions representing the same crustal age(about 30-40 m.y.B.P.). The graben-like feature shownat mile 4440 is probably the extension of the grabendiscussed by Hayes and Davey (this volume). For a de-tailed description of the geophysical characteristics of
946

BATHYMETRIC, MAGNETIC, AND SEISMIC REFLECTION DATA
60 βo
75 75JOS 120 135 150 165 lβO
Figure lb. (Continued).
the Ross continental shelf, the reader is referred toHayes and Davey (this volume).
The Ross Continental Shelf was traversed from mile4500 through mile 5400. The general depth of the shelf istwo to three times that of normal continental shelvesthroughout the world. The relief on the shelf is thoughtto be primarily the result of glacial erosion by apreviously more extensive grounded ice shelf (Hayes andDavey, this volume; Hayes and Frakes, this volume).Although the multiple reflections obscure the deepstructure of the Ross Continental Shelf, the dispositionof the sedimentary horizons can be seen clearly inseveral locations and in many places the layers dip gen-tly and have been truncated at or near the sea surface(see also Houtz and Davey, 1973), for example, nearmile 4650 and miles 4900 to 5200. The significance ofthese truncations is discussed in detail in the combinedsite chapter for Sites 270, 271, and 272, and also for thesite chapter 273 and in the synthesis chapter (Hayes andFrakes, this volume).
Upon departing Site 274 for the long 2000-mile transitto New Zealand, the ship first crossed that portion ofthe Antarctic plate associated with sea-floor spreadingbetween Australia and Antarctica, but later, near mile5850, crossed that portion of the Antarctic plateassociated with spreading between the Antarctic and thePacific plates. The Pacific-Antarctic Ridge in this regionis very highly fractured; typical ridge and valley relief ison the order of 500 fathoms. The magnetic anomalypattern associated with the crestal portion of the Pacific-Antarctic Ridge is not clear. However, the magneticanomalies older than anomaly 25 are well developed andare labeled on the geophysics profile between aboutmiles 6200 and 6800. The quality of the profile records isagain poor in the sub-Antarctic region transiting theAntarctic Convergence. The record quality improvednear mile 6450 and was good for the remainder of thecruise. The sediment disposition for the portion of thePacific plate lying between miles 6500 and 6850 is typicalof that shown by others (see, for example, Hayes et al.,
947

D. E. HAYES, R. E. WALL
DSDP LEG 28DRILL SITES
Figure lc. (Continued).
1972; Houtz et al., 1973). From about mile 6900 to mile7100, 50-300 meters of sediment can be seen in variousplaces on the Campbell Plateau. The incised canyonsystems running through the fairly well-mapped BountyTrough are evident at miles 7170 and 7220.
The general crustal evolution and the history of sea-floor spreading for the region lying south of theCampbell Plateau has been discussed by Hayes andRingis (1973), Christoffel and Falconer (1972), andMolnar et al. (in press).
ACKNOWLEDGMENTS
The fine efforts of the Deep Sea Drilling Project technicalstaff in the collection of the Leg 28 geophysical data aregratefully acknowledged. The technical staff was under thedirection of R. Illucci, party chief. I thank R. Shearer for herassistance in the computer reduction of the data and JeffWeissel for reviewing the magnetic lineations identificationsshown on the geophysical profiles.
REFERENCESCain, J.C., Henricks, S., Daniels, W.E., and Jensen, J.C.,
1968. Computation of the main geomagnetic field fromspherical harmonic expansions: Data User's NoteNSSDC68-11, Greenbelt, Md.
Christoffel, D.A. and Falconer, R.K.H., 1972. Marinemagnetics measurements in the Southwest Pacific Ocean. InHayes, D.E. (Ed.), Antarctic Oceanology II: theAustralian-New Zealand Sector, Antarctic Res. Ser., v. 19:Washington (Am. Geophys. Union), p. 165-196.
Hayes, D.E. and Conolly, J.R., 1972. Morphology of theSoutheast Indian Ocean. In Hayes, D.E. (Ed.), AntarcticOceanology II: The Australian-New Zealand Sector, An-tarctic Res. Ser., v. 19: Washington (Am. Geophys. Union),p. 125-146.
Hayes, D.E. and Ringis, J., 1973. Sea floor spreading in theTasman Sea: Nature, v. 243, p. 454-458.
Hayes, D.E., Talwani, M., Houtz, R., and Pitman, W.C., III,1972. Part A: Navigation; Part B: Bathymetric,geomagnetic, and gravity profiles; Part C: Seismic reflec-
948

BATHYMETRIC, MAGNETIC, AND SEISMIC REFLECTION DATA
tion profiles. In U.S.N.S. Eltanin, Cruises 28-32, March1967-March 1968: Lamont-Doherty survey of the worldocean, v. 22: Lamont-Doherty Geological Observatory ofColumbia University, Tech. Rept. No. CU-1-72.
Heezen, B., Tharp, M., and Bentley, C.R., 1972. Morphologyof the earth in the Antarctic and sub-Antarctic: AntarcticMap Folio Ser., Folio 16, Am. Geographical Soc.
Heirtzler, J.R., Dickson, G.O., Herron, E.M., Pitman, W.C.,III, and Le Pichon, X., 1968. Marine magnetic anomalies,geometric field reversals, and motions of the ocean floorand continents: J. Geophys. Res., v. 73, p. 2119-2136.
Houtz, R.E. and Davey, F.J., 1973. Seismic profiler andsonobuoy measurements in the Ross Sea, Antarctica: J.Geophys. Res., v. 78, p. 3448-3468.
Houtz, R., Ewing, M., Hayes, D.E., and Naini, B., 1973. Sedi-ment isopachs in the Indian and Pacific ocean sectors (105°
to 70°W): Antarctic Map Folio Ser., Folio 17, Am.Geographical Soc, p. 9-12.
Molnar, P., Atwater, T., Mammerickx, J., and Smith, S., inpress. Magnetic anomalies, bathymetry and the tectonicevolution of the South Pacific since the Late Cretaceous:Roy. Astron. Soc. Geophy. J.
Talwani, M., 1969. A computer system for the reduction,storage and display of underway data acquired at sea:Lamont-Doherty Geological Observatory of ColumbiaUniversity, Tech. Rept. No. 1, Cu-1-69 N00014-67-A-0108-0004.
Weissel, J. and Hayes, D.E., 1972. Magnetic anomalies in theSoutheast Indian Ocean. In Hayes, D.E. (Ed.), AntarcticOceanology II: the Australian-New Zealand Sector, An-tarctic Res. Ser., v. 19: Washington (Am. Geophys. Union),p. 165-196.
949
DOAMANTINAFRACTURE
ZONE
¥ Mαffσ> 01
^OlS 0QJ QJ ^
in'"'*
(uKm
R ft
010101
K
m
id
H
0101
r l
cn
~aülinrl
S
K Dl
So,
w
3d
CDU3 co T in 0
Fö CD *C GD
r " ' i 'V -y-1 1• i -S55
Figure 2. Reflection seismic profiles obtained by Glomar Challenger during Leg 28. Key to profile locationsis given in Figure 3.

Figure 2. (Continued).

to
Figure 2. (Continued).

13 1 1973
f '14 1 1373
i' ' ' ik ' ' ' ik15 1 1973
/ ^
105
t
106
i
SITE 268
Jr}
A
V
A
V J
107
v
lOθ
V
J
103
u
no
\
Λ
A\
i n 112
/
L_^-
/
m
113 114
— =
Λ
\
115
/
11B
\
V\V
117
i —
l i e
—^—
/
n r
11a 12C
r
CD
L21
:-—--"•
i 2 a
\ /
V
123
*"
—
c
—
D
124
^
125
- — / •
J
126
^
\
127
/
128
,—s~
N
13
oO is 01
Vm Mm
3
cm
•m "•o
OD in oOotn
IIIIIIII, i ,i ii J T I T" ~ 1 28O0Ii i ii i 11 i i i—r
Figure 2. (Continued).
CO>H
I2p
o
ip
θ
S55n
9o
σ>

j) " ' b " L 4 ' ' ' b
129 130 131 132 133
- — -
r
S. 1NDIANADT99HL
PLAIN
Λ
^V\
\
— . — •
Fif;ure 2. (CointinuedA
IB 1 197312 IE 20 0
134 135 136 137 136 139
—s—
/
y
__
A
—
—̂,
c
-61
43
4 0
140 141
>DTE
H-6
1 42
1O
Λ
fJ
2€Q
\
to IQ
96^^T
η T ^ π T π
142 143 14*
1
TJ
—
\\j
—
—-
.—-—
J\\\
—
—- i
—
Λ
r
> 1 197312 IB 20 0
- 6 2
» 145 146 147 148 149
tI \
v V
(I
—
\
λ
r \ /
E3' ' A ' ' ' B '
150 151 152
sJ_
r1
/f fI
1
AW
f
|
t-
in it π
8 taTOCIDT (B
i
1 5 3
W
(W
r11
I
19731 IB
154 155
Ml
Λ
i
Λ
ftT
f
1

Figure 2. (Continued).

174 175 17B 177 178 179 1BO -179 -178 -177-176-175 -17G -177 -178-179 -180 179 17B 177
~t
ROSSCONTINENTAL
SHELF
ISITE 270 - SITE 271 SITE 272
t t
Figure 2. (Continued).
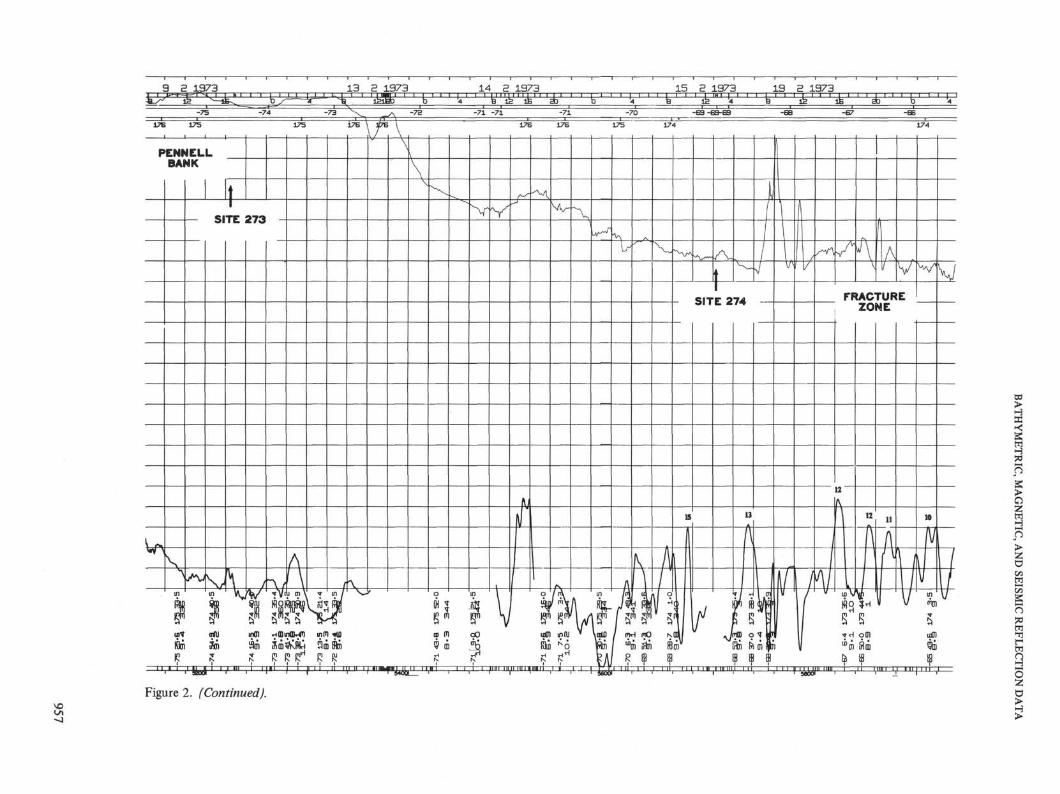
Figure 2. (Continued).

0 0
50 £ 1973k 1 ' ' b ' ' ' '4
gl g 1973 gg g 1973 S3 E 1973
PACIFICANTARCTIC
RIDGE
i " ' i 62001 M T "-h— T 1 - 1 — M l ' " ' ! j . _ i ' ' 640d l l ' 1 " L T J f~ .X^TI
Figure 2. (Continued).

-1 1 I "T 1 r ~l 1 1—
,M D—I 1 1 1 r
E4 S 1973 E5 g 1973y ' 'ik'
177 176 17B
IU IfO>U) l^U) C 0)
wH $ δ ^
CAMPBELLPLATEAU
BOUNTYTROUGH
(U *
δ δo 0 mm
δ"1
ffj Ji
W (Duθ) m CD
Iftnaid)
0 96
δ δ1 7 1
III Nil)
fòm dmir>Ol uvl
Sm ito
"I "-*1 '—T" -r~1—T 1— 'i
Figure 2. (Continued).
2
a•z
3

Depart Fremantle, Aust.SEC
NaturalistePlateau
- 5
- 6200
I I21 D e c , '72 1200 Hrs. 300
Figure 3. Index map for underway geophysical data obtained by Glomar Challenger during Leg 28. The ship's track is annotated with date and time, and distancealong track in hundreds of miles.

Figure 3. (Continued).
O
1000
. .,
. IT
0000 Hrs.27 Dec, '72
SECfT^ii'''''^'''''^"<T
1 •
i•—5
900
_:ji. . J .
\ù÷
_
-7
SEC
-6
I0000 Hrs.28 Dec, '72
noo
Axis
-7
SEC
1-4
..r, ^ •
•: - 5
FractureZone
I1300
SoutheastIndianRidge
1200 Hrs.28 D e c , '72
1200
- 6
- 7
Figure 3. (Continued).

•
r- 6
.... (
1400 1200 Hrs.
29 D e c , '72
SITE 266
1600
, : ^ • : ' ;
1800
Figure 3. (Continued).
0000 Hrs.5 J a n . , '73
1200 Hrs.1 J a n . , '73
• ** , , v
1700
SEC- 5
1-6
p
>
wH
n>σmn
w

Figure 3. (Continued).

Figure 3. (Continued).

ON SEC
•3 : , ? ! ' ! '
l i t S . I n d i a n <> •fi•? ,Abyssa l | : ;
{• !
v • • < < :
I3000
3400
, P l a i n -i«v• ". i • ; . i><ui. . »*!K: -•: liL•MiV •. I H . " 1 ' S . w H l
I0000 Hrs.16 J a n . , '73
1 I
3200
'iM - . j :-
I0000 Hrs.17 J a n . , '73
. ,
'3300
2900
- 8
SEC- 5
rs-7
- 83100
0000 Hrs.22 J a n . , '73
>w
?°w
is
Figure 3. (Continued).

- 2 SEC
>o
3800
, -
3600
t y • i .
%
I I3500 0000 Hrs.
23 J a n . , ' 7 3
- ó
,̂ \
SoutheastIndian Ridge
I3700
25 J a n . , '73 0000 Hrs. 3900
0000 Hrs.24 J a n . , '73
Figure 3. (Continued).

ON00
4100
- . . •
SECp -2
i?
fit
4400I
0000 Hrs.27 J a n . , '73
1200 Hrs.25 J a n . , '73
— 3
r4000
- 4
4200
Figure 3. (Continued).

4600 0000 Hrs.28 Jan . , '73
I4500
c
- 6
i—1
Ross ContinentalShelf
Multiple
I I4 8 0 0 0000 Hrs.
29 J a n . , '73
I4700
>o
- 2 P
ö
-3 §o

O
L
1 A/C1200 Hrs.5 Feb . , '73
5200I I
5ioo 0000 Hrs.9 Feb . , '73
- 3
Q .
CD
SEC
- c
f1-1
SITE 273-"-21Q - 3
—4
Figure 3. (Continued).
5300
- 5
0000 Hrs.13 Feb . , "73

FracturetZone
I5700 5ÓOO 0000 Hrs.
15 F e b . , '73
5900 5 8 0 0 1200 Hrs .19 F e b . , '73

- , :•p, £J V
8 1 f
• Ji i a-p•
i
:f
\ , *
SEC—1
"t
; ; - 2
: _ 3
σm55>
CO
JO
>rr
"4
iI I
0000 Hrs. 610°21 Feb., '73
Paci f icAntarcticRidge
6000
1 - 6
'
•;,'
L It
Data gap I6300
•^εf-
<I '"
I I1200 Hrs. 620021 F e b . , C73
- Fracture• ' Zone
- 7
- 8
Figure 3. (Continued).
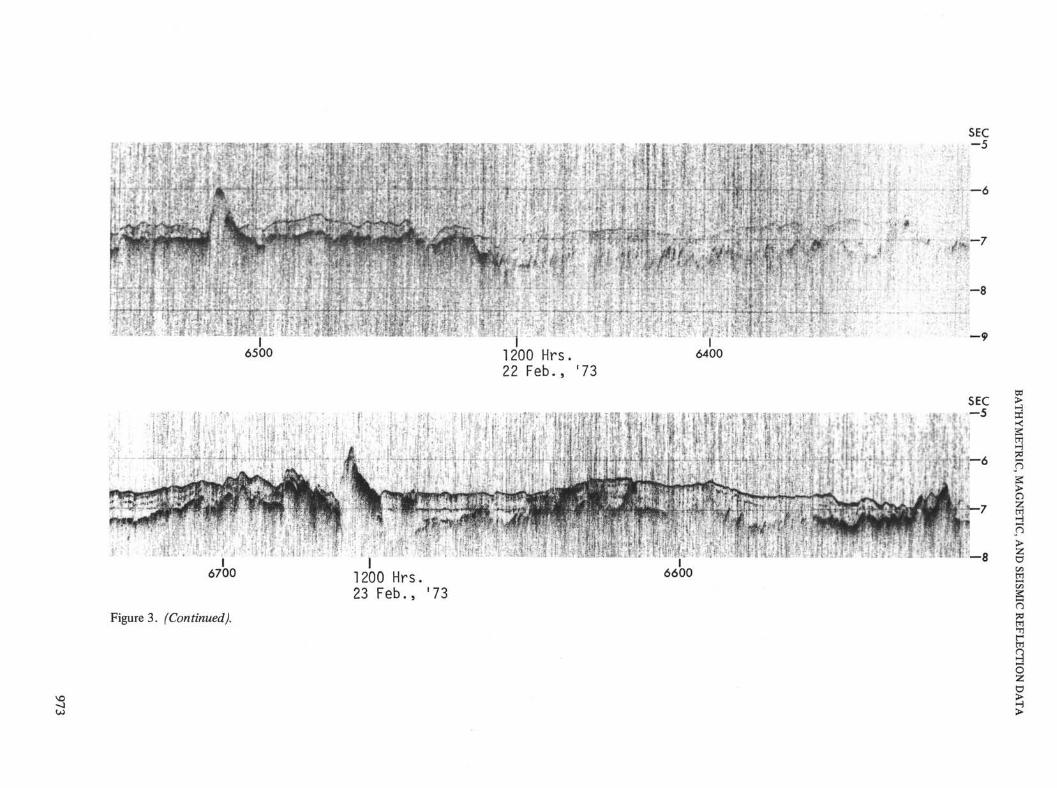
Figure 3. (Continued).

£ 5O-P>•
6900 6800 0000 Hrs.24 F e b . , '73
SEC- 2
. -»-― j
-– • . •—A
X>
w
?°
>r1
r
—5
- 6
7000 0000 H r s .25 F e b . , '73
Figure 3. (Continued).

ArriveChristchurch, N. Z.
7100 1200 Hrs .25 F e b . , '73
7200
I7300