Embed Size (px)
Citation preview

i-cut Layout
User Manual
i-cut Layout
ii
Contents
1. Preface..............................................................................................................................................................................................6
1.1 Welcome to i-cut Layout................................................................................................................................................6
1.2 Who is this guide aimed at?.........................................................................................................................................6
1.3 Copyright Notice................................................................................................................................................................6
2. Getting Started with i-cut Layout.........................................................................................................................................8
2.1 Starting i-cut Layout........................................................................................................................................................ 8
2.2 Creating your first nested layout.................................................................................................................................8
2.3 Concepts and ideas in i-cut Layout........................................................................................................................13
2.3.1 Graphics and Layouts...................................................................................................................................... 14
2.3.2 View modes.......................................................................................................................................................... 15
2.3.3 Typical workflow................................................................................................................................................. 15
2.3.4 Document window elements......................................................................................................................... 15
2.3.5 Entering information.......................................................................................................................................... 17
2.3.6 External Files........................................................................................................................................................18
2.3.7 Shuttle.....................................................................................................................................................................19
3. Creating a SmartNest Layout.............................................................................................................................................. 20
3.1 Document Setup............................................................................................................................................................. 20
3.1.1 Sheet Presets.......................................................................................................................................................21
3.2 Adding Graphics..............................................................................................................................................................22
3.2.1 Maximum Fill........................................................................................................................................................24
3.2.2 Scale dialog..........................................................................................................................................................24
3.3 Creating Layouts............................................................................................................................................................. 25
3.3.1 Finding Layouts...................................................................................................................................................26
3.3.2 Managing Layouts..............................................................................................................................................30
3.4 Export Production Files................................................................................................................................................31
4. Offcut sheets............................................................................................................................................................................... 34
4.1 Creating Offcut Sheets................................................................................................................................................. 34
4.2 Using Offcut Sheets.......................................................................................................................................................35
4.3 Managing Offcut Sheets.............................................................................................................................................. 36
4.4 Offcut Preferences..........................................................................................................................................................36
5. Working with Graphics........................................................................................................................................................... 38
5.1 Graphic Settings..............................................................................................................................................................38
5.1.1 General................................................................................................................................................................... 38
5.1.2 Back.........................................................................................................................................................................39
5.1.3 Trim Box and Margins......................................................................................................................................40
5.1.4 Inks...........................................................................................................................................................................41
5.2 Working in Graphic View..............................................................................................................................................42

Contents
iii
5.2.1 Defining the Cut Path.......................................................................................................................................42
5.2.2 Create Bleed........................................................................................................................................................ 46
5.2.3 White Underprint.................................................................................................................................................47
5.3 Working with Placeholders..........................................................................................................................................48
5.4 Adjusting overlapping Graphics................................................................................................................................ 49
5.4.1 Using Adjust Masks.......................................................................................................................................... 49
5.4.2 Resetting masks................................................................................................................................................. 49
5.4.3 Checking the status of masks......................................................................................................................49
5.5 Tiling Graphics................................................................................................................................................................. 51
5.5.1 Create Tiling Grid............................................................................................................................................... 51
5.5.2 Setting up the Tiling..........................................................................................................................................52
5.5.3 Working with a Tiling Template.....................................................................................................................56
5.6 Jigsaw Tiling..................................................................................................................................................................... 57
5.6.1 Jigsaw Tiling........................................................................................................................................................57
5.7 Add Box..............................................................................................................................................................................58
5.8 Export Graphic.................................................................................................................................................................60
6. Working with Graphic files....................................................................................................................................................61
6.1 About importing a graphic.......................................................................................................................................... 61
6.2 Replacing a graphic.......................................................................................................................................................61
6.3 Importing a PostScript file.......................................................................................................................................... 62
6.3.1 Pages.......................................................................................................................................................................62
6.3.2 Color Management............................................................................................................................................ 63
6.3.3 Inks...........................................................................................................................................................................66
6.3.4 Overprint.................................................................................................................................................................67
6.3.5 Images.................................................................................................................................................................... 69
6.3.6 Page Size...............................................................................................................................................................72
6.3.7 Other........................................................................................................................................................................73
6.3.8 Output..................................................................................................................................................................... 75
6.4 Importing a PDF file.......................................................................................................................................................76
6.4.1 Importing multipage PDF files.......................................................................................................................76
6.5 Importing an EPS file.................................................................................................................................................... 77
6.6 Importing an Illustrator file.......................................................................................................................................... 77
6.7 Importing an EPF file.....................................................................................................................................................77
6.7.1 Images.................................................................................................................................................................... 77
6.7.2 Other........................................................................................................................................................................79
6.7.3 EPF...........................................................................................................................................................................80
6.8 Importing an Image file................................................................................................................................................ 81
6.9 Importing Nicks from i-cut Preflight........................................................................................................................ 82
6.10 Importing an XML from i-cut Automate.............................................................................................................. 82
7. Manual Sheet Editing.............................................................................................................................................................. 83
7.1 Placing a Graphic........................................................................................................................................................... 83
7.2 Replacing a Graphic...................................................................................................................................................... 84
i-cut Layout
iv
7.3 Arranging Objects........................................................................................................................................................... 85
7.3.1 Using Layers........................................................................................................................................................ 85
7.3.2 Using To Front/To Back...................................................................................................................................89
7.3.3 Using the Transform Window........................................................................................................................89
7.3.4 Using the Align Window..................................................................................................................................90
7.4 Two-sided Printing..........................................................................................................................................................92
7.4.1 Two-sided Graphics...........................................................................................................................................92
7.4.2 Two-sided sheets............................................................................................................................................... 93
7.5 Managing Inks..................................................................................................................................................................93
7.5.1 Working with inks...............................................................................................................................................93
8. Working with SmartMarks.....................................................................................................................................................96
8.1 What are SmartMarks?.................................................................................................................................................96
8.2 Using SmartMarks.......................................................................................................................................................... 96
8.2.1 Adding a SmartMark.........................................................................................................................................97
8.2.2 Deleting a SmartMark.......................................................................................................................................98
8.2.3 Editing a SmartMark......................................................................................................................................... 98
8.2.4 Creating and saving a set.............................................................................................................................. 98
8.2.5 Using a set............................................................................................................................................................99
8.2.6 Replacing and editing a set...........................................................................................................................99
8.2.7 SmartMarks in the Graphic View.................................................................................................................99
8.2.8 Setting Inks in SmartMarks............................................................................................................................99
8.2.9 Setting the location of a SmartMark........................................................................................................104
8.3 Supplied SmartMarks................................................................................................................................................. 105
8.3.1 i-cut Marks......................................................................................................................................................... 105
8.3.2 Waste Divider.................................................................................................................................................... 108
8.3.3 ARS mark............................................................................................................................................................108
8.3.4 Eyelet Mark........................................................................................................................................................ 109
8.3.5 Text on Cut Path..............................................................................................................................................110
8.3.6 Fotoba Mark.......................................................................................................................................................112
8.3.7 Image Mark........................................................................................................................................................ 113
8.3.8 Rectangle............................................................................................................................................................ 116
8.3.9 Bar code..............................................................................................................................................................118
8.3.10 Text Mark..........................................................................................................................................................121
9. Menus and Toolbars..............................................................................................................................................................124
9.1 Menus................................................................................................................................................................................124
9.1.1 File menu.............................................................................................................................................................124
9.1.2 Edit menu............................................................................................................................................................132
9.1.3 View menu.......................................................................................................................................................... 141
9.1.4 Arrange menu....................................................................................................................................................158
9.1.5 Preparation menu............................................................................................................................................ 158
9.1.6 Inks menu........................................................................................................................................................... 158
9.1.7 Tools menu......................................................................................................................................................... 161

Contents
v
9.1.8 Production menu..............................................................................................................................................161
9.1.9 Window menu................................................................................................................................................... 195
9.1.10 Help menu........................................................................................................................................................211
9.2 Toolbars............................................................................................................................................................................ 212
9.2.1 Status Bar...........................................................................................................................................................212
9.2.2 Tools...................................................................................................................................................................... 213
9.2.3 View Selector.....................................................................................................................................................224

1i-cut Layout
6
1. Preface
1.1 Welcome to i-cut Layout
i-cut Layout is a nesting application to efficiently match graphic designs with the available substrate.
i-cut Layout nests jobs based on size, shape and ordered quantities, placing designs as tightly aspossible onto the substrate, minimizing waste and, thus, reducing production costs.
i-cut Layout also reduces preparation times dramatically for operator-intensive tiling jobs, particularlyfor specially shaped large format displays and substrates that require milling. It fully automates thedigital printing and the finishing by reading the printed barcodes with the camera on the finishingdevice.
1.2 Who is this guide aimed at?
This user manual is intended for people with a good preknowledge of the use of the Windowsoperating system and have just started using i-cut Layout. You will find all the necessary informationyou need to make you feel at ease working with the application. It is meant to be equally helpfulto first time users and skilled operators (for whom the 'Function after function' chapter will be veryinformative) who might need a little extra assistance from time to time. This manual is a paper versionof the online help you can find in the application.
1.3 Copyright Notice
© Copyright 2012 Esko Software BVBA, Gent, Belgium
All rights reserved. This material, information and instructions for use contained herein are theproperty of Esko Software BVBA. The material, information and instructions are provided on an AS ISbasis without warranty of any kind. There are no warranties granted or extended by this document.Furthermore Esko Software BVBA does not warrant, guarantee or make any representationsregarding the use, or the results of the use of the software or the information contained herein. EskoSoftware BVBA shall not be liable for any direct, indirect, consequential or incidental damages arisingout of the use or inability to use the software or the information contained herein.
The information contained herein is subject to change without notice. Revisions may be issued fromtime to time to advise of such changes and/or additions.
No part of this document may be reproduced, stored in a data base or retrieval system, or published,in any form or in any way, electronically, mechanically, by print, photoprint, microfilm or any othermeans without prior written permission from Esko Software BVBA.
This document supersedes all previous dated versions.
PANTONE®, PantoneLIVE and other Pantone trademarks are the property of Pantone LLC. All othertrademarks or registered trademarks are the property of their respective owners. Pantone is a whollyowned subsidiary of X-Rite, Incorporated. © Pantone LLC, 2012. All rights reserved.

1i-cut Layout
7
This software is based in part on the work of the Independent JPEG Group.
Portions of this software are copyright © 1996-2002 The FreeType Project (www.freetype.org). Allrights reserved.
Portions of this software are copyright 2006 Feeling Software, copyright 2005-2006 Autodesk MediaEntertainment.
Portions of this software are copyright ©1998-2003 Daniel Veillard. All rights reserved.
Portions of this software are copyright ©1999-2006 The Botan Project. All rights reserved.
Part of the software embedded in this product is gSOAP software. Portions created by gSOAP areCopyright ©2001-2004 Robert A. van Engelen, Genivia inc. All rights reserved.
Portions of this software are copyright ©1998-2008 The OpenSSL Project and ©1995-1998 EricYoung ([email protected]). All rights reserved.
This product includes software developed by the Apache Software Foundation (http://www.apache.org/).
Adobe, the Adobe logo, Acrobat, the Acrobat logo, Adobe Creative Suite, Illustrator, InDesign, PDF,Photoshop, PostScript, XMP and the Powered by XMP logo are either registered trademarks ortrademarks of Adobe Systems Incorporated in the United States and/or other countries.
Microsoft and the Microsoft logo are registered trademarks of Microsoft Corporation in the UnitedStates and other countries.
SolidWorks is a registered trademark of SolidWorks Corporation.
Portions of this software are owned by Spatial Corp. 1986 2003. All Rights Reserved.
JDF and the JDF logo are trademarks of the CIP4 Organisation. Copyright 2001 The InternationalCooperation for the Integration of Processes in Prepress, Press and Postpress (CIP4). All rightsreserved.
The Esko software contains the RSA Data Security, Inc. MD5 Message-Digest Algorithm.
Java and all Java-based trademarks and logos are trademarks or registered trademarks of SunMicrosystems in the U.S. and other countries.
Part of this software uses technology by BestTM Color Technology (EFI). EFI and Bestcolor areregistered trademarks of Electronics For Imaging GmbH in the U.S. Patent and Trademark Office.
Contains PowerNest library Copyrighted and Licensed by Alma, 2005 – 2007.
All other product names are trademarks or registered trademarks of their respective owners.
Correspondence regarding this publication should be forwarded to:
Esko Software BVBA
Kortrijksesteenweg 1095
B – 9051 Gent

2i-cut Layout
8
2. Getting Started with i-cut Layout
2.1 Starting i-cut Layout
To start i-cut Layout, log on to your system if necessary and then do the following:
1. Click Start > Programs > Esko2. Select the version of i-cut Layout that you have installed.3. The startup screen will appear.4. The sheet document window will replace the startup screen.
Or you can also simply double-click the desktop icon.
2.2 Creating your first nested layout
To introduce you to some of the possibilities of i-cut Layout, follow these simple steps to create yourfirst nested layout.
Note:
To change the current units, click Edit > Preferences > Defaults .
1. In i-cut Layout, click File > New (CTRL+N).
The Document Setup dialog box appears.

2i-cut Layout
9
2. Define a substrate for the new layout by choosing a new entry on the Substrate drop-down listbox or by entering a name for it.
3. Define the size for the sheet and the margins by entering them manually or by using a SheetPreset. For this example, follow the steps below.
a) Choose Custom from the Sheet Preset drop-down list box.b) Enter a Sheet Height of 1000 mm (40 inches).c) Enter a Sheet Width of 2000 mm (80 inches).d) Enter a Top Margin of 15 mm (0.6 inches).
4. Click OK
5. i-cut Layout can automatically place i-cut registration marks. The easiest way is to define a setof SmartMarks. To add i-cut marks, do the following:
a) Click Production > SmartMarks or click SmartMarks in the status bar.
If you selected a SmartMarks set earlier, this set will be applied and opened. If not, a new"Untitled" SmartMarks set will be opened

2i-cut Layout
10
b) Click the Add SmartMark button, and select i-cut Marks
c) Set the options as desired.d) The i-cut system can automatically retrieve the correct file if it has a bar code on it. Select the
Bar Code tab, check Add bar code, and set the options as desired. Make sure to use "Left"as bar code position.
e) Click Apply to add the i-cut marks and the bar code to the SmartMarks set.f) In the Fly-out menu of the SmartMarks dialog (by clicking the triangle in the upper right corner),
select Save Setg) Enter a name for the set (e.g. "i-cut marks") and click Save.
2i-cut Layout
11
You can see in the bottom bar that the newly created SmartMarks set is active, so it will be usedon any new layouts.
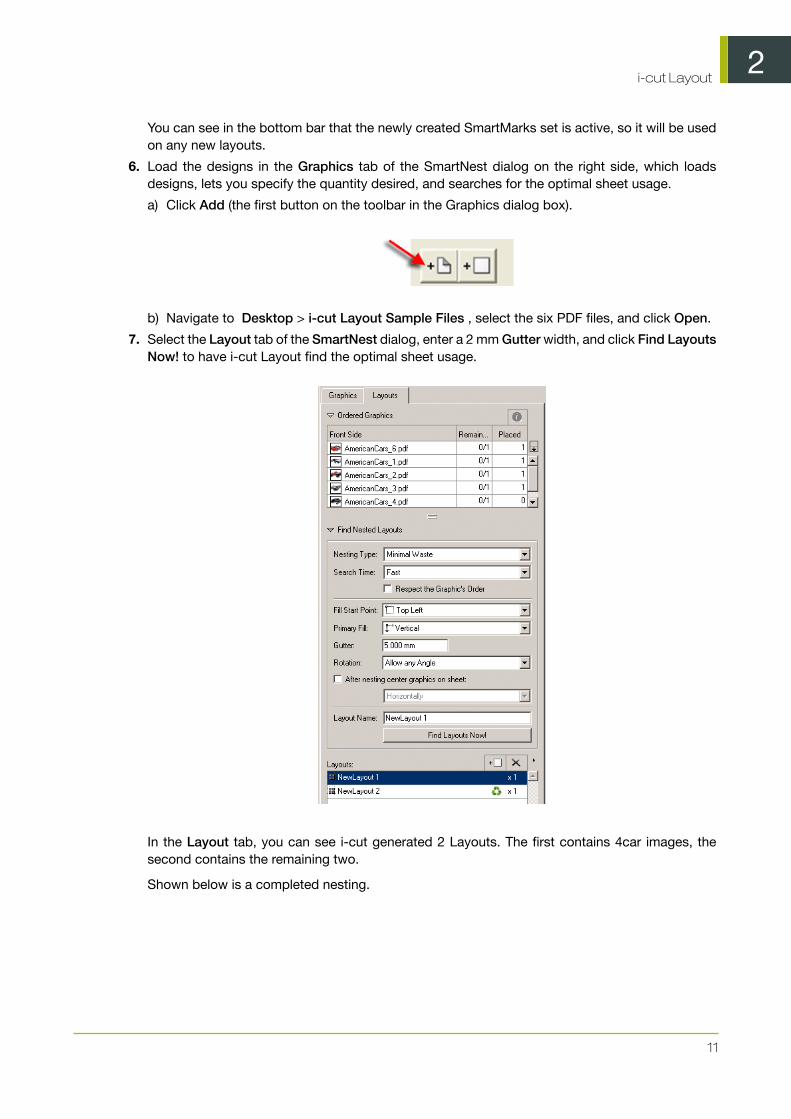
6. Load the designs in the Graphics tab of the SmartNest dialog on the right side, which loadsdesigns, lets you specify the quantity desired, and searches for the optimal sheet usage.
a) Click Add (the first button on the toolbar in the Graphics dialog box).
b) Navigate to Desktop > i-cut Layout Sample Files , select the six PDF files, and click Open.
7. Select the Layout tab of the SmartNest dialog, enter a 2 mm Gutter width, and click Find LayoutsNow! to have i-cut Layout find the optimal sheet usage.
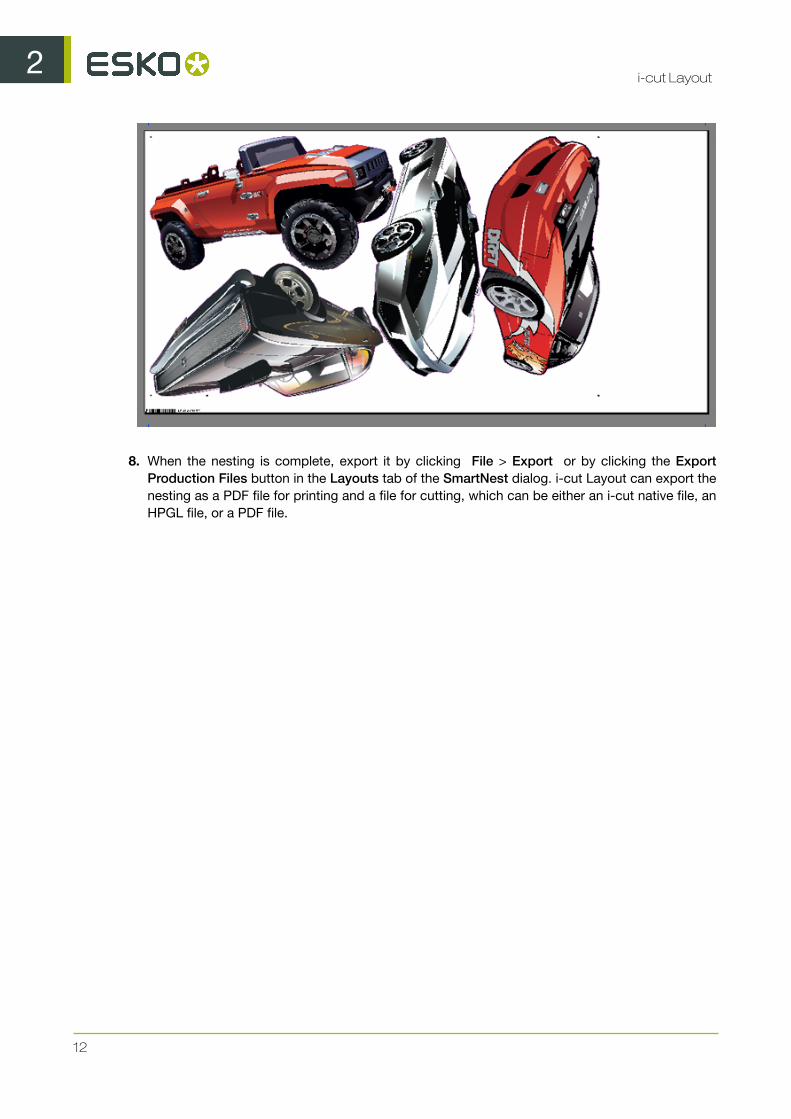
In the Layout tab, you can see i-cut generated 2 Layouts. The first contains 4car images, thesecond contains the remaining two.
Shown below is a completed nesting.
2i-cut Layout
12
8. When the nesting is complete, export it by clicking File > Export or by clicking the ExportProduction Files button in the Layouts tab of the SmartNest dialog. i-cut Layout can export thenesting as a PDF file for printing and a file for cutting, which can be either an i-cut native file, anHPGL file, or a PDF file.

2i-cut Layout
13
2.3 Concepts and ideas in i-cut Layout
• Graphics and Layouts• View Modes• Typical workflow• Document window elements• Entering information

2i-cut Layout
14
• External Files
2.3.1 Graphics and Layouts
The primary objects that you create in i-cut Layout are Graphics and Layouts. A Graphic is the objectthat you want to repeat on a sheet or Layout. You may have several copies of the same Graphic orof different Graphics in one Layout.
You may already be familiar with this concept. Sometimes the terms 1-up (the non-repeated object)or station, and sheet are used to indicate Graphics and Layouts. In ArtiosCAD, a design file is theequivalent of a Graphic and a manufacturing file is the equivalent of a Layout.
• What is a Graphic?• What is a layout?
What is a Graphic?
A Graphic can contain a graphic file, a cut path, a mask and graphic marks. You are not required tohave a cut path, a mask and graphic marks in your Graphic. All Graphics should contain a graphic, buti-cut Layout has the notion of ‘Placeholders’ which are empty graphics (see further). The concept ofPlaceholders is designed to allow you to assemble layouts before the final graphics become available(cost estimating purposes). In a normal workflow, Placeholders will be replaced by the actual graphicsbefore making sheets / layouts.The graphics used in a Graphic can be a (Normalized) PDF file, animage file or an Esko GRS file. Cut Paths in i-cut Layout are usually created by extracting contoursin a certain ink. All the items that you include in a Graphic will be repeated on your layout. AlthoughGraphics can be created and manipulated from the Layout View, you edit Graphics in the GraphicView.The definition of a Graphic is embedded inside the layout file.
Graphic objects consist of:
• a reference to a graphics. In case of a Placeholder this will be a rectangle with a dummy color,simply for viewing.
• a cut path. This is the shape on which the actual Graphics will be cut.• a bleed mask. This is a gross mask that cuts away all irrelevant graphics. Most of the time, the
bleed mask is generated by spreading the die shape over a certain distance.
What is a Layout?
A Layout contains a sheet size and any number of Graphics. The Graphics contained in a Layoutmay be multiple instances of the same Graphic, single instances of different Graphics, or someintermediate mix (a combination Layout). As Layouts can be recto/verso, i-cut Layout can create theback of a Layout from the front for two-sided printing. When i-cut Layout creates the back side ofthe Layout, the position of the Graphics is mirrored for accurate front-to-back alignment. The backside of the Graphics is automatically inserted to create the printing on the back side. i-cut Layout

2i-cut Layout
15
maintains a link between the front and back side of a Layout: moving Graphics on the front side willmove the corresponding Graphics on the back side accordingly.
2.3.2 View modes
i-cut Layout has two view modes:
• The Sheet View shows the Layout and all the Graphics that have been placed. In this view, youcan switch between the front and the back of a layout.
• The Graphic View focusses on the individual Graphic.
Switching between those views can be done in one single session.
Sheet View
In the Sheet View, you can assemble the layout by placing a number of copies of one or multipleGraphics.
Graphic View
In the Graphic View, you are basically working on one side of a Graphic. As stated earlier on, a Graphiccan contain graphics, a cut path, a mask and station marks.The Graphic View offers all functionalityto create and manipulate these objects:
• import graphics• create a cut path• align graphics and cut path• create a mask (based on the cut path)• ...
2.3.3 Typical workflow
i-cut Layout supports the SmartNest workflow. The process of creating a sheet is usually a logicalprogression. First you define the sheet size and the margins. Next, you add the Graphics that youplan to include on the sheet. You can either use the Graphics tab of the SmartNest dialog box orthe Graphic View to create Graphics containing graphics, dies, masks, and Graphic marks. Finally,you add Graphics to the sheet to create a file that is ready for printing.
2.3.4 Document window elements
The different views all contain a display area and a number of toolbars (see toolbars ).

2i-cut Layout
16
1. The display area is where you do your work. You can think of it as a blank printing sheet onwhich you are assembling your layout. The white area is the sheet. The size and position of theseare defined when you create a new layout.
2. 'File & Edit' offers you the standard save and edit functionality.3. View Selector4. Side indicator tells you which side of the sheet you are working on; front or back and allows to
switch from front to back and vice versa.5. The Preview Selector indicates the selected preview. See Preview6. Zoom : indicates the zoom factor.7. The Graphics tab allows you to add Graphics, and adjust the settings for the individual Graphics.
Tip:
Double-click a Graphic to open it in Graphic View
8. The Layout tab allows to search for SmartNest layouts. See Finding Layouts9. The Toolbar contains the interactive tools. Some tools are only available in 1 view (Graphic view
or Sheet View). See Tools
2i-cut Layout
17
10.The SmartMarks and Quick Masks indicators show the currently selected SmartMarks set andthe state of the Quick Masks.
11.Current Orientation / Current Unit : the orientation and unit can be changed in the Defaults tabof the Preferences dialog box. Orientation, units and server name together make up the StatusBar .
Note:
The menu bar contains commands that are available in the current module. Not all commands in allmenus may be available. Availability depends on the options purchased and the active tool.
Note:
All the toolbars can be opened via the Window menu > Toolbars.
Tip:
The Workspace Layout Manager allows you to make some predefined workspaces of the userinterface dialog boxes and switch from one to another in one single click.
Tip:
All toolbars of the Window menu can either be used as docked tools or as proper dialog boxes.
2.3.5 Entering information
Many of the dialog boxes expect you to enter information. You usually do this by typing on thekeyboard. To edit a value in a dialog box, click the field and enter a new value. Clicking a field onceselects the entire contents of the field. Clicking a field twice will insert the cursor into the existingvalue in the field and allow you to edit it.
There are two other ways to work with dialog boxes that you may not have seen before:
• Dragging numbers• Using smart edit fields
Dragging numbers
i-cut Layout allows you to drag a number between two dialog boxes. Sometimes, you might want touse a value from one dialog box in another. For example, you might want to take some measurementsfrom within your document and then use that measured value as an entry in the Transform dialog box.
To drag a number from one dialog box to another:
1. Click and drag the number that you want to use. The cursor turns into the pointing hand icon.2. Drag the number to the edit field of another dialog box and release the mouse button. The value
is copied from the first dialog box to the second.
2i-cut Layout
18
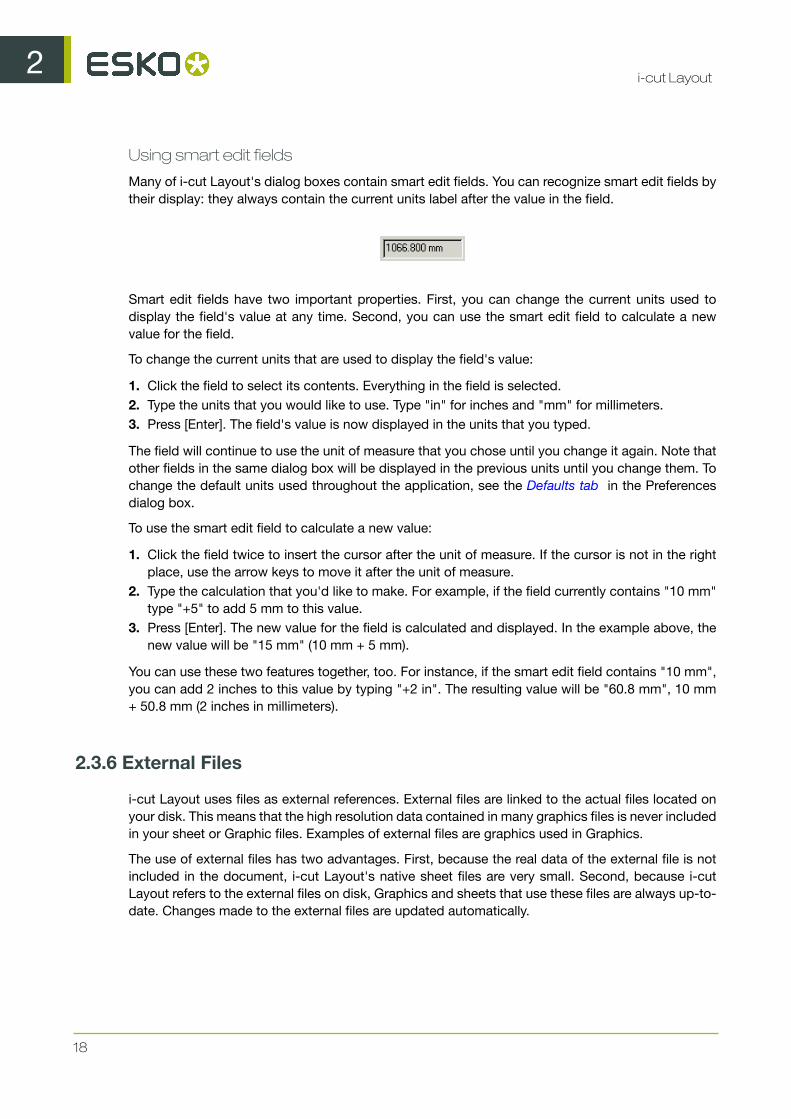
Using smart edit fields
Many of i-cut Layout's dialog boxes contain smart edit fields. You can recognize smart edit fields bytheir display: they always contain the current units label after the value in the field.
Smart edit fields have two important properties. First, you can change the current units used todisplay the field's value at any time. Second, you can use the smart edit field to calculate a newvalue for the field.
To change the current units that are used to display the field's value:
1. Click the field to select its contents. Everything in the field is selected.2. Type the units that you would like to use. Type "in" for inches and "mm" for millimeters.3. Press [Enter]. The field's value is now displayed in the units that you typed.
The field will continue to use the unit of measure that you chose until you change it again. Note thatother fields in the same dialog box will be displayed in the previous units until you change them. Tochange the default units used throughout the application, see the Defaults tab in the Preferencesdialog box.
To use the smart edit field to calculate a new value:
1. Click the field twice to insert the cursor after the unit of measure. If the cursor is not in the rightplace, use the arrow keys to move it after the unit of measure.
2. Type the calculation that you'd like to make. For example, if the field currently contains "10 mm"type "+5" to add 5 mm to this value.
3. Press [Enter]. The new value for the field is calculated and displayed. In the example above, thenew value will be "15 mm" (10 mm + 5 mm).
You can use these two features together, too. For instance, if the smart edit field contains "10 mm",you can add 2 inches to this value by typing "+2 in". The resulting value will be "60.8 mm", 10 mm+ 50.8 mm (2 inches in millimeters).
2.3.6 External Files
i-cut Layout uses files as external references. External files are linked to the actual files located onyour disk. This means that the high resolution data contained in many graphics files is never includedin your sheet or Graphic files. Examples of external files are graphics used in Graphics.
The use of external files has two advantages. First, because the real data of the external file is notincluded in the document, i-cut Layout's native sheet files are very small. Second, because i-cutLayout refers to the external files on disk, Graphics and sheets that use these files are always up-to-date. Changes made to the external files are updated automatically.
2i-cut Layout
19
Caution:
Note that whereas all graphics used in Graphics are external references, the Graphic definitionsthemselves (the link to graphics, cut path, mask, station number, trapping layer, etc…) are storedinside the sheet file.
Tip:
When inks are changed in external files, PLA files should be opened and saved.
2.3.7 Shuttle
Shuttle allows to connect to an EskoArtwork server: Automation Engine 10, Nexus or Odystar. Itallows to submit the current job to a workflow queue, and to monitor jobs running on the server.
All Shuttle functionality can be found
• In the Shuttle toolbar: Window > Toolbars > Shuttle . The toolbar contains the Submit buttonand the Shuttle window button.
• In the Shuttle window: Window > Shuttle
A full explanation on Shuttle can be found in the Shuttle documentation, available on the EskoArtworkDocumentation DVD.
3i-cut Layout
20
3. Creating a SmartNest Layout
With i-cut Layout's SmartNest tool you can create intuitive layouts that make optimal use of theavailable sheet. i-cut Layout can generate layouts to find the ultimate layout for your purpose.
3.1 Document Setup
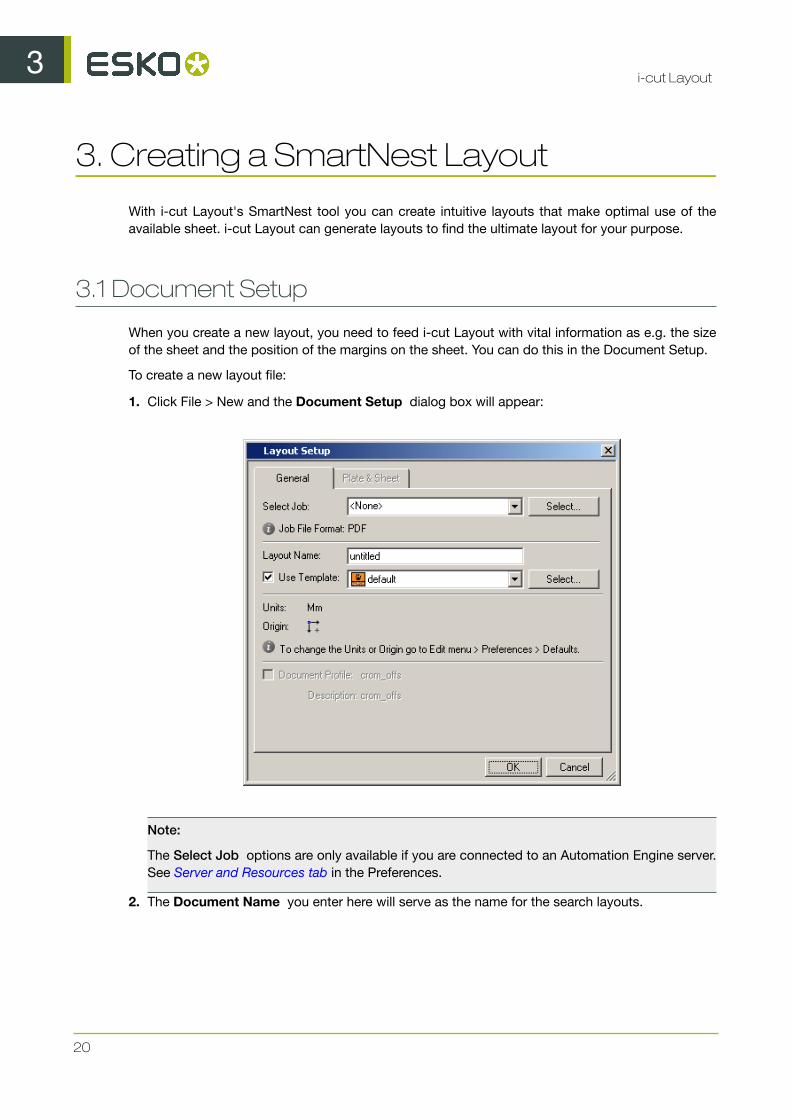
When you create a new layout, you need to feed i-cut Layout with vital information as e.g. the sizeof the sheet and the position of the margins on the sheet. You can do this in the Document Setup.
To create a new layout file:
1. Click File > New and the Document Setup dialog box will appear:
Note:
The Select Job options are only available if you are connected to an Automation Engine server.See Server and Resources tab in the Preferences.
2. The Document Name you enter here will serve as the name for the search layouts.

3i-cut Layout
21
Tip:
It is advised not to enter names of more than 7 characters. This guarantees that in case ofmultipage files unique bar codes will be generated.
3. Set the dimensions and substrate of your sheet:
• Define the sheet manually, by entering the dimensions, and by entering the substrate namemanually or selecting a substrate from the dropdown list (which contains all known substrates).You can manage the list of substrates in the Substrate tab of the Sheet Presets. See SheetPresets
• Select a sheet from the Sheet Presets dropdown, and the vertical and horizontal dimensionsand the substrate will be entered automatically. See Sheet Presets. You can also select OffcutSheets: see Offcut Sheets
4. Enter a decent margin to foresee enough white space to place i -cut marks and bar codes.5. Backing Up : Define the way for backing up: either Turn or Tumble. This is useful for two-sided
printing: see Two-sided Printing6. Click 'OK' to create the new layout. Clicking 'Cancel' will close the Document Setup dialog box
without creating a new sheet.
Your new sheet is shown in the document window. The white area is the sheet, the blue line showsthe sheet and its position on the sheet.
Note:
You can change these settings for an open document by choosing File > Document Setup . Thesame dialog will open, allowing to change any settings.
3.1.1 Sheet Presets
Sheet Presets allows you to set up a collection of pre-defined sheet sizes and substrates. The list ofsheets will be available in the Document Setup dialog box. You can also manage the Offcut Sheets:see manage the Offcut Sheets.

3i-cut Layout
22
In the Substrates tab, all known Substrates are shown. The Nick Size will be used when importinga graphic from i-cut Preflight, containing Nicks. See Importing Nicks from i-cut Preflight
You can
• Add substrates, using the New button or by typing in a new Substrate name directly in the SheetPresets or in the Document Setup
• Modify the Nick Size for a substrate.• Delete a Substrate from the list. Note that Sheet Presets and Offcuts using this Substrate will be
removed as well. A warning will be shown.
3.2 Adding Graphics
You can add and manage Graphics in the Graphics tab of the SmartNest dialog.

3i-cut Layout
23
1. Use the Add Graphic button to select one or more files to be added as Graphics to the GraphicsList. See also Working with Graphic files
2. Use the Add Placeholder to add a Placeholder. See also Working with Placeholders3. Use the Add Box to create a box and add it as a Placeholder. See also Add Box4. The Graphics list shows all Graphics, including a preview and some key information. In the
Graphics list you can:
• Double-click a Graphic to open the Graphic in Graphic View. See also Working with Graphics• Change the key settings directly in the Graphics list, such as the number ordered, the scaling,
the Cut Path, the Bleed, ...• Select one or more Graphics for further actions (see below). If multiple Graphics are selected,
you can change the settings or apply the actions on all selected Graphics at once• Click and drag Graphics to change the order in the list.

3i-cut Layout
24
5. The Information button opens the Graphic settings dialog for the selected Graphic. If multipleGraphics are selected, the Graphic Settings dialog will be reduced, showing only the settings thatcan be modified for all selected Graphics. See Graphic Settings
6. Use the Delete button to delete all selected Graphics from the list. You can only remove Graphicsthat are not on a layout.
7. Click More Actions to use one of the Graphic functions on all selected Graphics. See also Workingwith Graphics
3.2.1 Maximum Fill
Instead of a fixed number, the amount ordered can be set to "Maximum Fill".
• In the Graphics tab, click the Ordered number, and enable Maximum Fill
• Open the General tab of the Graphic Settings, and enable Maximum Fill
If this option is selected, i-cut Layout will place as much copies as possible on the sheet.
Graphics with a fixed quantity will be placed first. After that, graphics with a "Maximum Fill" will beplaced until the sheet is filled completely.
If more than one graphic has "Maximum Fill" enabled, the sheet will be filled with both graphicsproportionally.
Note:
As soon as one Graphic has Maximum Fill enabled, the "Minimal Waste" nesting type can’t be used.See Finding Layouts
3.2.2 Scale dialog
If you click the "scale" label in the Graphics list , the Scale dialog will open.

3i-cut Layout
25
The Scale dialog allows to enter the desired resulting size or the desired scale factor of the graphics.Changing the desired resulting size will also change the scale factor and vice versa.
If the lock behind the input fields is enabled, the scaling will remain proportional. Entering a verticalsize will change the horizontal size and vice versa.
If you disable the lock, you can set different scaling factors for vertical and horizontal scaling.
Clicking Reset will revert the settings back to 100% scaling, and the lock enabled.
You can also enter a scale factor in the Station settings. See General on page 38
3.3 Creating Layouts
In the Layouts tab of the SmartNest window, you can create all the layouts you need.
The Layouts tab consists of 3 parts:
1. The Ordered graphics , which is similar to the Graphics tab (see Adding Graphics). For everyGraphic, you can see the amount placed on the currently selected layout, and the total amountremaining / ordered.
2. The Find Nested Layouts section, containing all settings for searching the optimal Layouts. SeeFinding Layouts

3i-cut Layout
26
3. The Layouts section, showing all the layouts created so far. See Managing Layouts
In the Layouts tab, you can use the triangles in front of the Ordered Graphics and Find Nested Layoutssection to collapse these sections.
Note:
Before searching for the Layouts, you can add marks, edit the graphics or their Cut Path, set aSmartMarks set, etc. See
• Working with Graphics• Using a set• i-cut Marks
3.3.1 Finding Layouts
i-cut Layout can find the most optimal layouts for the requested Graphics and their amounts, basedon 3 nesting types:
3i-cut Layout
27
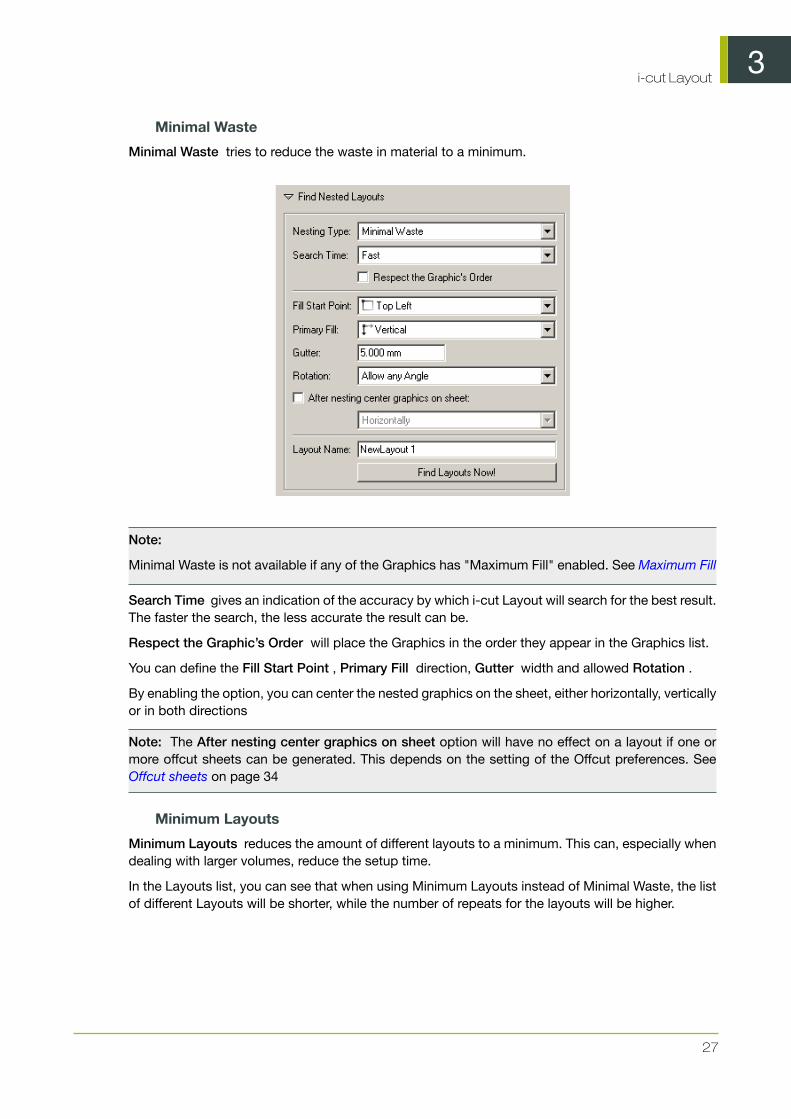
Minimal Waste
Minimal Waste tries to reduce the waste in material to a minimum.
Note:
Minimal Waste is not available if any of the Graphics has "Maximum Fill" enabled. See Maximum Fill
Search Time gives an indication of the accuracy by which i-cut Layout will search for the best result.The faster the search, the less accurate the result can be.
Respect the Graphic’s Order will place the Graphics in the order they appear in the Graphics list.
You can define the Fill Start Point , Primary Fill direction, Gutter width and allowed Rotation .
By enabling the option, you can center the nested graphics on the sheet, either horizontally, verticallyor in both directions
Note: The After nesting center graphics on sheet option will have no effect on a layout if one ormore offcut sheets can be generated. This depends on the setting of the Offcut preferences. SeeOffcut sheets on page 34
Minimum Layouts
Minimum Layouts reduces the amount of different layouts to a minimum. This can, especially whendealing with larger volumes, reduce the setup time.
In the Layouts list, you can see that when using Minimum Layouts instead of Minimal Waste, the listof different Layouts will be shorter, while the number of repeats for the layouts will be higher.

3i-cut Layout
28
Search Time gives an indication of the accuracy by which i-cut Layout will search for the best result.The faster the search, the less accurate the result can be.
You can define the Fill Start Point , Primary Fill direction, Gutter width and allowed Rotation .
By enabling the option, you can center the nested graphics on the sheet, either horizontally, verticallyor in both directions
Note: The After nesting center graphics on sheet option will have no effect on a layout if one ormore offcut sheets can be generated. This depends on the setting of the Offcut preferences. SeeOffcut sheets on page 34
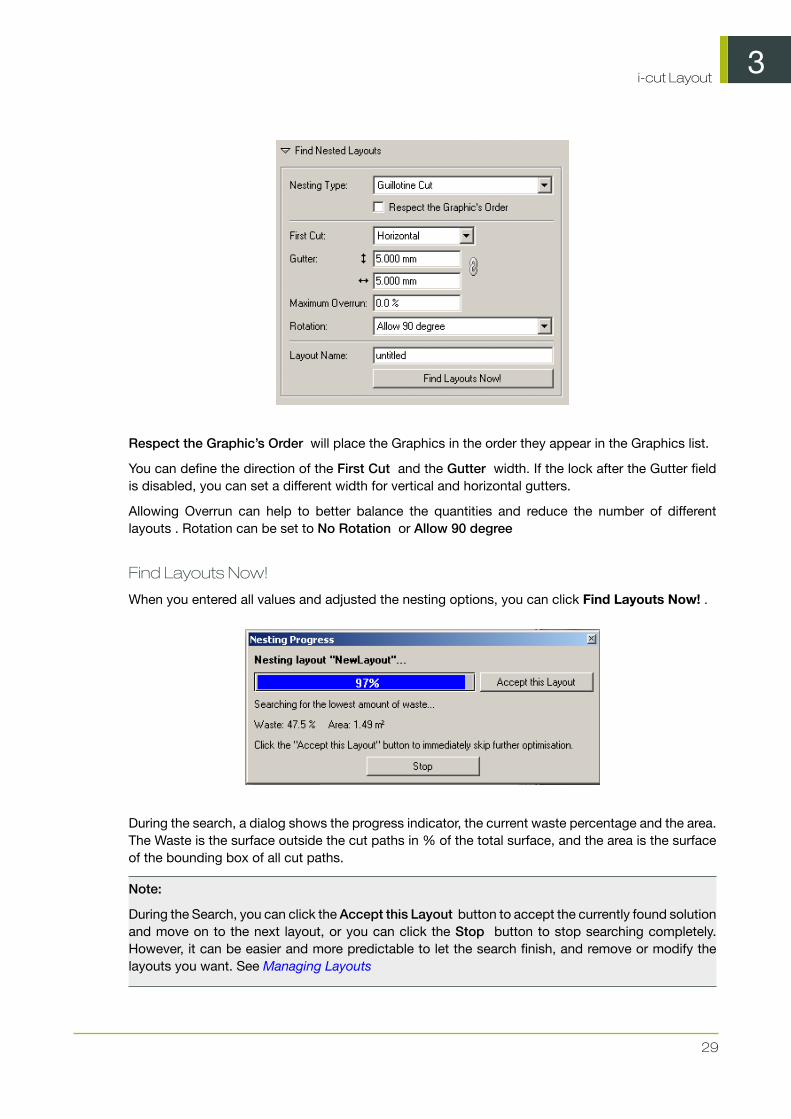
Guillotine cuts
Guillotine cuts will prepare layouts to be cut on a Guillotine table, reducing the number of cuts, andmaking sure all cuts are possible on a guillotine cutter. Underneath on the left is an example of a layout(created using Minimal Waste) that can’t be cut on a guillotine cutter. When using Guillotine Cuts, theresult will be the layout shown on the right. The remaining Graphic will be placed on another layout.
3i-cut Layout
29
Respect the Graphic’s Order will place the Graphics in the order they appear in the Graphics list.
You can define the direction of the First Cut and the Gutter width. If the lock after the Gutter fieldis disabled, you can set a different width for vertical and horizontal gutters.
Allowing Overrun can help to better balance the quantities and reduce the number of differentlayouts . Rotation can be set to No Rotation or Allow 90 degree
Find Layouts Now!
When you entered all values and adjusted the nesting options, you can click Find Layouts Now! .
During the search, a dialog shows the progress indicator, the current waste percentage and the area.The Waste is the surface outside the cut paths in % of the total surface, and the area is the surfaceof the bounding box of all cut paths.
Note:
During the Search, you can click the Accept this Layout button to accept the currently found solutionand move on to the next layout, or you can click the Stop button to stop searching completely.However, it can be easier and more predictable to let the search finish, and remove or modify thelayouts you want. See Managing Layouts

3i-cut Layout
30
i-cut Layout will generate as much layouts as necessary to place all Graphics the required (remaining)number of times, according to the settings you entered. All layouts will have a name based on theLayout Name , with a sequential number attached.
The resulting Layouts will be added to the list of layouts. See Managing Layouts
Note:
If the layout already contains Graphics (either placed manually or from a previous search), you canselect them in green to “glue” them to their position, so they will not be changed by any search.
3.3.2 Managing Layouts
The Layouts list in the Layout tab of the SmartNest window, lists all layouts found and generated.
Next to the name of the layout, i-cut Layout will show the number of times the Layout is needed.
The Offcut button (a green recycling icon) is shown if an Offcut sheet can be created from theremainder of the material on that specific layout. See Offcut sheets
In this list, you can:
• Select a Layout. The selected layout will be shown in the working area, and the number ofGraphics applied on the currently selected Layout is shown in the Ordered section. You can nowmodify the selected layout
• Select a layout in the list, and delete it, by clicking the cross button.• Open the Flyout menu by clicking the triangle button, and select Delete All to delete all layouts• Click the Offcut button to create an Offcut sheet for the remainder of the material on that layout.
See Offcut sheets
Note:
If you created a layout manually, you can add it to the Layouts list by clicking the Add Layout button.
When all Graphics have been assigned and your layouts have been created, you can add i-cut marks(see i-cut Marks on page 105) and/or barcodes to the selected Layout, and export all layouts toPDF and .cut files by clicking File > Export ... or by clicking the Export Production Files button.See Export Production Files
3i-cut Layout
31
You can also save the complete job, including all Layouts, as a PDFPLA file, for further editing orarchiving.
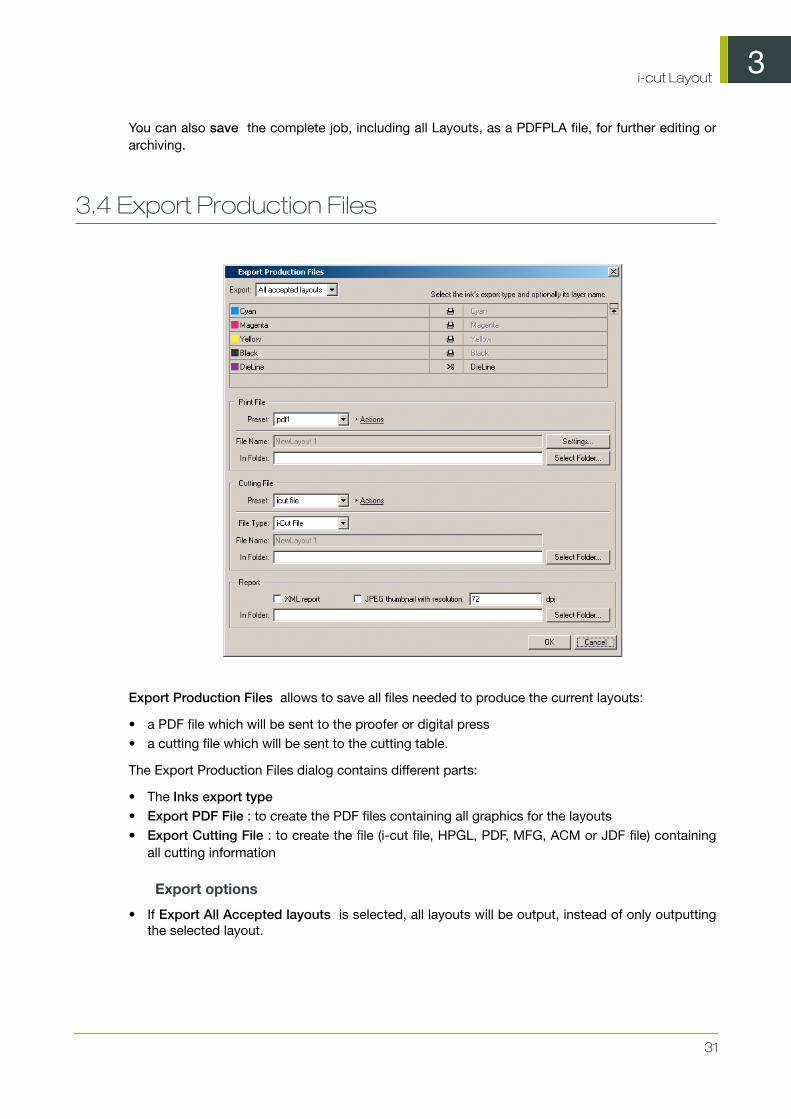
3.4 Export Production Files
Export Production Files allows to save all files needed to produce the current layouts:
• a PDF file which will be sent to the proofer or digital press• a cutting file which will be sent to the cutting table.
The Export Production Files dialog contains different parts:
• The Inks export type• Export PDF File : to create the PDF files containing all graphics for the layouts• Export Cutting File : to create the file (i-cut file, HPGL, PDF, MFG, ACM or JDF file) containing
all cutting information
Export options
• If Export All Accepted layouts is selected, all layouts will be output, instead of only outputtingthe selected layout.

3i-cut Layout
32
Inks
The Inks shows all inks used in the layouts.
The first column lists the name of all inks
The second column shows how the inks are assigned:
• : these inks need to be printed, so they will be included in the PDF file
• : these inks contain cutting information, and thus will be included in the cutting file
• : these inks will be excluded from export.
You can change the assignment of an ink by clicking the icon.
Note:
If you want to output only the i-Cut file, you can switch all printing inks to "exclude". If you only wantto output the PDF file, you can switch the cutting inks to "exclude".
The third column is only available for inks assigned to the Cutting file. What you can define dependson the selected cutting file type (see below).
If the Cutting File type is set to i-Cut file or PDF file, you can enter (or change) the name of the layerthe ink will be placed in.
If the Cutting File type is set to HPGL, you can define the HPGL line type to be used.
If the Cutting File type is set to MFG, you can select the ArtiosCad line types . If an ArtiosCAD filewas imported for the cut shape, the complete ARD file will be put in the MFG file.
If the Cutting File type is set to ACM, you can either select ArtiosCad line types, or you can selectthe native line types (P1, P2, P3, ...). When selecting ArtiosCad line types, the conversion from MFGto ACM will include a number of optimizations and manipulations. When using P1, P2, ..., the cutlines are dumped straight into the ACM file.
Export PDF File
• Set the File Name• Define in what folder the file must be saved, either by entering the path, or by clicking the Select
Folder button and browse to it.• Click the Settings button to set extra PDF options
Note:
In the Settings, you can choose to output as a multipage PDF. This will result in one PDF filecontaining one page for every layout needed, instead of one PDF for every layout. This option isonly available if all layouts have the same dimensions.
Export Cutting File
• Select the File Type : i-Cut file, HPGL file, PDF file, MFG file, or ACM file.• Set the File Name• Define in what folder the file must be saved, either by entering the path, or by clicking the Select
Folder button and browse to it.• Click the Settings button to set extra options. See Cutting file Settings. These settings are not
available when exporting MFG or ACM files.
3i-cut Layout
33
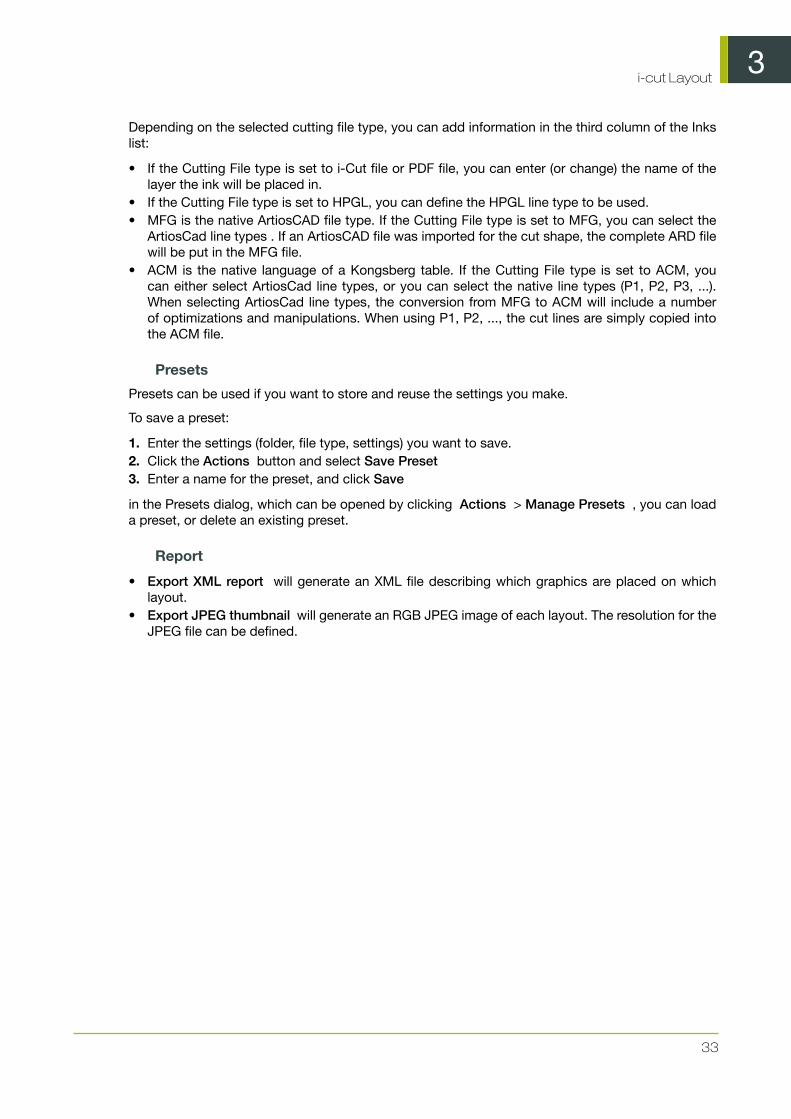
Depending on the selected cutting file type, you can add information in the third column of the Inkslist:
• If the Cutting File type is set to i-Cut file or PDF file, you can enter (or change) the name of thelayer the ink will be placed in.
• If the Cutting File type is set to HPGL, you can define the HPGL line type to be used.• MFG is the native ArtiosCAD file type. If the Cutting File type is set to MFG, you can select the
ArtiosCad line types . If an ArtiosCAD file was imported for the cut shape, the complete ARD filewill be put in the MFG file.
• ACM is the native language of a Kongsberg table. If the Cutting File type is set to ACM, youcan either select ArtiosCad line types, or you can select the native line types (P1, P2, P3, ...).When selecting ArtiosCad line types, the conversion from MFG to ACM will include a numberof optimizations and manipulations. When using P1, P2, ..., the cut lines are simply copied intothe ACM file.
Presets
Presets can be used if you want to store and reuse the settings you make.
To save a preset:
1. Enter the settings (folder, file type, settings) you want to save.2. Click the Actions button and select Save Preset3. Enter a name for the preset, and click Save
in the Presets dialog, which can be opened by clicking Actions > Manage Presets , you can loada preset, or delete an existing preset.
Report
• Export XML report will generate an XML file describing which graphics are placed on whichlayout.
• Export JPEG thumbnail will generate an RGB JPEG image of each layout. The resolution for theJPEG file can be defined.
4i-cut Layout
34
4. Offcut sheets
Offcut sheets allows to store and (re)use the remainders of sheets. The empty areas will be cut off(rectangular), and stored. The name of the offcut sheets will be printed on them, so if the offcut sheetis used for another layout, it is easy to find the specific offcut sheet in your stock.
1. Create a SmartNest Layout. See Creating a SmartNest Layout2. Create Offcut Sheets from the empty areas. See Creating Offcut Sheets3. Reuse Offcut Sheets when selecting sheets (in the Setup or SmartNest dialog). See Using Offcut
Sheets
You can manage the list of sheets , e.g. to remove lost sheets, or to add Offcut Sheets manually.
In the Preferences , there are some specific settings for Offcut Sheets.
4.1 Creating Offcut Sheets
After generating layouts, layouts that contain an unused area big enough to create Offcut Sheets will
show the Offcut Sheets button . See Managing Layouts
Creating Offcut Sheets is done by clicking the recycle icon in the Layouts tab.
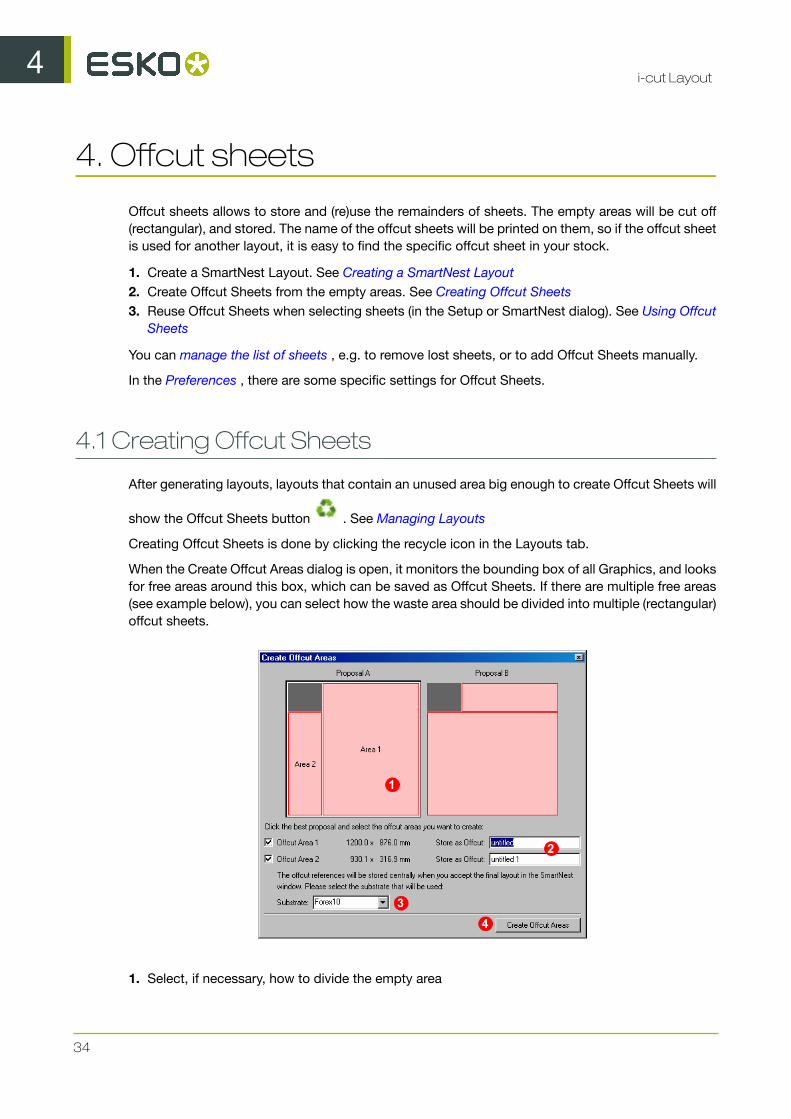
When the Create Offcut Areas dialog is open, it monitors the bounding box of all Graphics, and looksfor free areas around this box, which can be saved as Offcut Sheets. If there are multiple free areas(see example below), you can select how the waste area should be divided into multiple (rectangular)offcut sheets.
1. Select, if necessary, how to divide the empty area
4i-cut Layout
35
2. Define what Offcut Areas to be saved as Offcut Sheets, and enter a name. The name of the offcutsheet will be printed in the free area, and cutting lines will be generated on the borders of theoffcut area, taking into account the margins.
3. Define the substrate4. Click Create Offcut Areas . Extra cutting lines will be generated and an Offcut Sheet will be added
to the Offcut sheet database. Undoing or manually removing the offcut lines will remove the offcutsheet from the database.
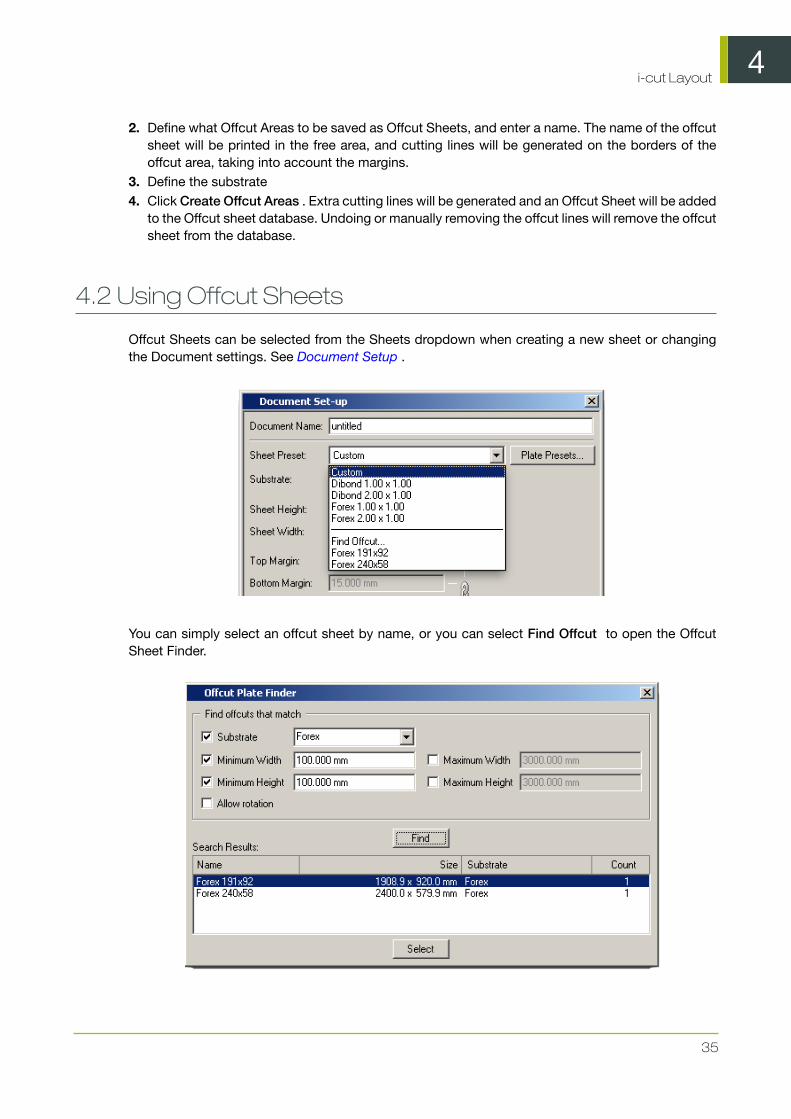
4.2 Using Offcut Sheets
Offcut Sheets can be selected from the Sheets dropdown when creating a new sheet or changingthe Document settings. See Document Setup .
You can simply select an offcut sheet by name, or you can select Find Offcut to open the OffcutSheet Finder.

4i-cut Layout
36
The Offcut Sheet Finder allows to search for Offcut Sheets based on Substrate and Minimum orMaximum Width or Height.
4.3 Managing Offcut Sheets
In the Sheet Presets dialog, an Offcuts tab allows to manage all the offcut sheets.
By clicking the New button, you can create a new Offcut sheet by entering its name, material, heightand width.
4.4 Offcut Preferences
In the Preferences you can define the Minimum Width or Height for an Offcut Sheet, the Safety Margin,and the Font, Weight and Size for the name of the Offcut Sheet to be printed on the Offcut Sheet.

4i-cut Layout
37

5i-cut Layout
38
5. Working with Graphics
Arranging Graphics on the sheet is the primary purpose of i-cut Layout. This section will provide youwith the basics of working with Graphic files. You will learn all settings and functions that can beused on a single Graphic.
Note:
For some of these functions , the Graphic must be selected in Graphic View. To open a Graphic inGraphic view, just double-click it in the Graphics list in the Graphics tab of the SmartNest window.
5.1 Graphic Settings
The Graphic Settings can be opened by selecting one or more Graphics in the Graphics list, and
clicking the Information button .
The Graphic Settings dialog contains 4 tabs:
• General• Back• Trim Box and Margins• Inks
Using the Next and Previous button, you can switch to the next or previous Graphic in the Graphicslist.
Clicking OK will accept all changes. Clicking Cancel will close the dialog without applying anychanges.
5.1.1 General

5i-cut Layout
39
The General tab of the Graphic settings contains:
• The Type : either a File or an Empty Graphic (see Working with Placeholders• The Name of the file, and a browse button to select (another) file.• The number Ordered .
The amount can be set as a fixed number, or as "Maximum Fill". See Maximum Fill• The amount already placed, and the path to the file on disk• The Vertical and Horizontal Scale or Size.
You can enter the desired resulting size or the desired scale factor of the graphics. Changing thedesired resulting size will also change the scale factor and vice versa.
If the lock behind the input fields is enabled, the scaling will remain proportional. Entering a verticalsize will change the horizontal size and vice versa.
If you disable the lock, you can set different scaling factors for vertical and horizontal scaling.• The Cut Path . You can set this to the Trim Box, to any of the inks (which can be used if the file
contains a specific die cut ink), or to "Undefined". If a Cut Path was created or selected in Graphicview (see Defining the Cut Path) the Cut Path will be "Manual".
• The Dimensions of the Graphic• The Bleed
5.1.2 Back

5i-cut Layout
40
The Back tab allows to set the back side for the Graphic. As soon as one Graphic has a definedback side, the layouts for the back side can also be generated.
• Use same graphic on back allows to set the same graphic for the front and the back side.• Flip Horizontally will mirror the graphic on the back side• The Type : either a File or a Placeholder (see Working with Placeholders• The Name of the file, and a browse button to select (another) file.
5.1.3 Trim Box and Margins
5i-cut Layout
41
The Trim Box & Margins tab shows the dimensions of the Trim Box, and the margins for the otherpage boxes defined in the graphics file.
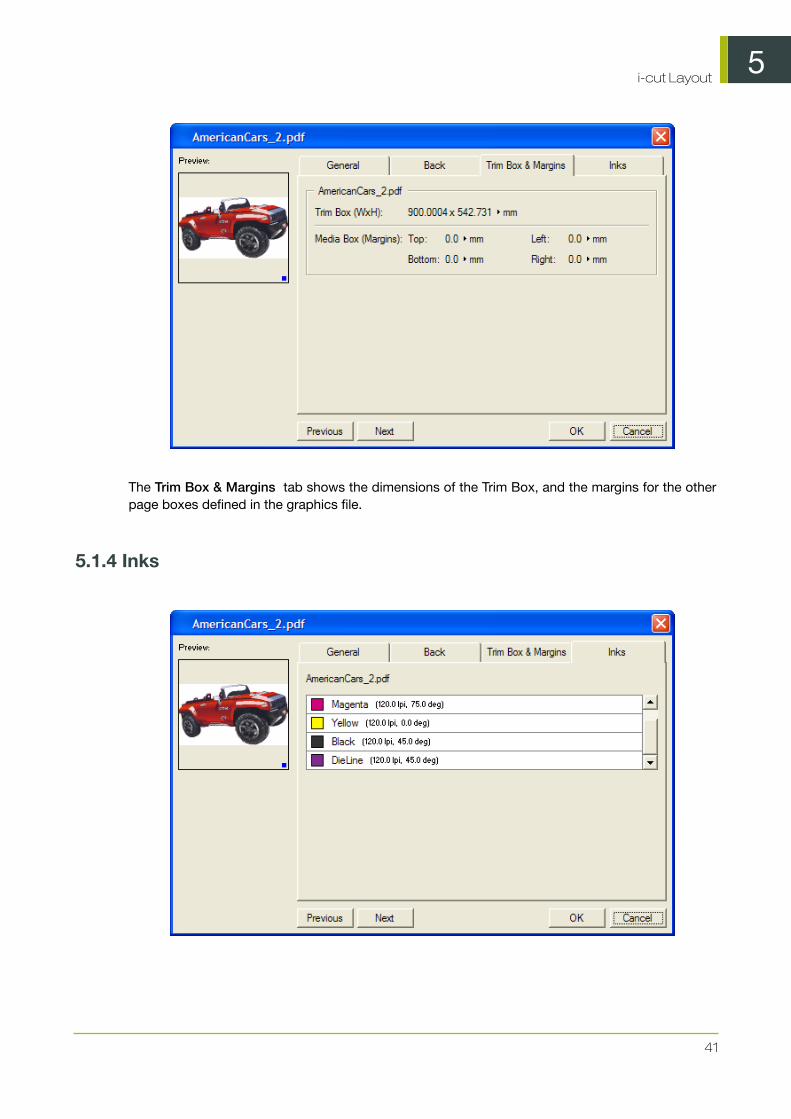
5.1.4 Inks

5i-cut Layout
42
The Inks tab shows all inks used in the graphics file, including a preview of the color, the name ofthe ink, the lineature and the angle.
5.2 Working in Graphic View
The Graphic View is a view dedicated to editing a Graphic that you want to use on your sheet. Youcan switch between the Sheet View and the Graphic View by clicking the view icons in the ViewSelector . You can also open a Graphic in Graphic View by double-clicking it in the Graphics list inthe Graphics tab of the SmartNest window.
5.2.1 Defining the Cut Path
In the Graphic View in i-cut Layout, you can create or select a Cut Path to be used for the Graphic.
• Select Cut Path allows to select a cut path that already exists in the file. See Select Cut Path• Create Cut Path allows to create a new cut path. See Create cut path• Optimize Cut Path allows you to optimize an existing cut path. See Optimize Cut Path
Select Cut Path
Use Preparation > Select Cut Path to select a cut path using several different methods.
Custom size
You can create a rectangular Cut Path by using the option Custom Size . Simply specify the requiredheight and width of the Cut Path.
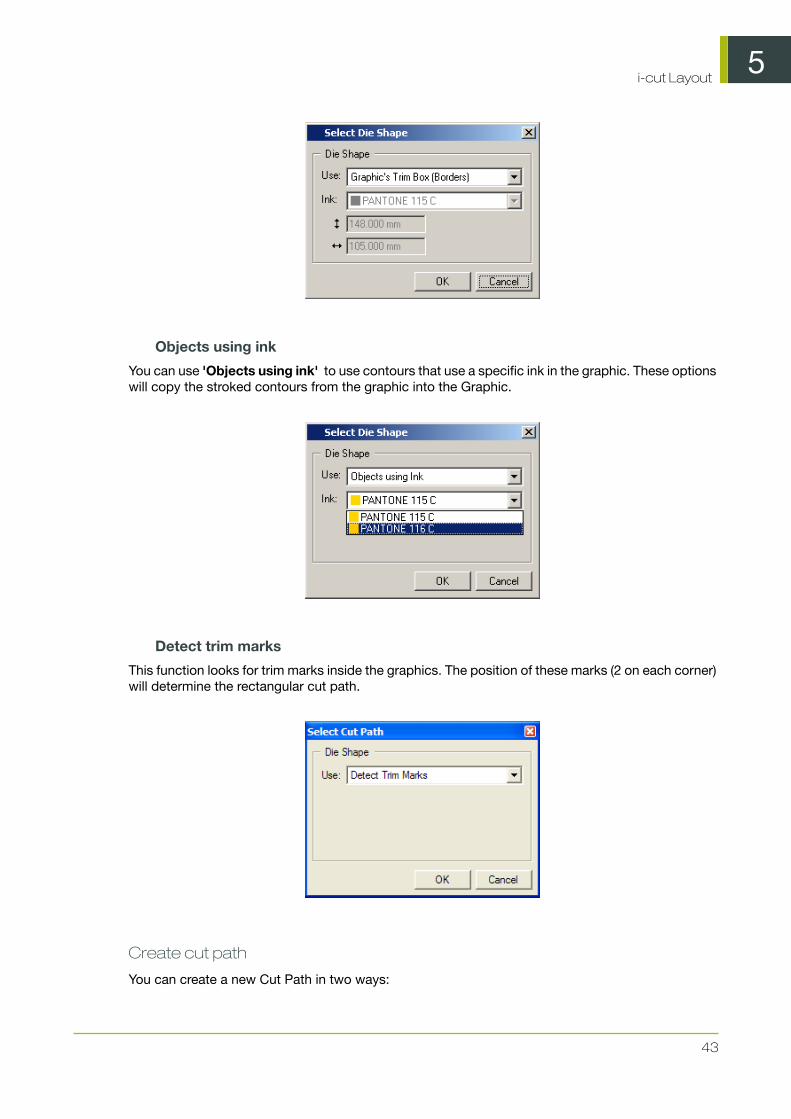
Trim Box
You can fit the cut path to the trim size of an imported graphic. Esko applications, like PackEdge, callthe trim size the Borders. Desktop applications often call the trim size the Page Size or the DocumentSize. If your graphic has the correct trim size to use for the die, the Select Cut Path dialog box cancreate the Graphic's cut path from the trim box of the graphic.
5i-cut Layout
43
Objects using ink
You can use 'Objects using ink' to use contours that use a specific ink in the graphic. These optionswill copy the stroked contours from the graphic into the Graphic.
Detect trim marks
This function looks for trim marks inside the graphics. The position of these marks (2 on each corner)will determine the rectangular cut path.
Create cut path
You can create a new Cut Path in two ways:
5i-cut Layout
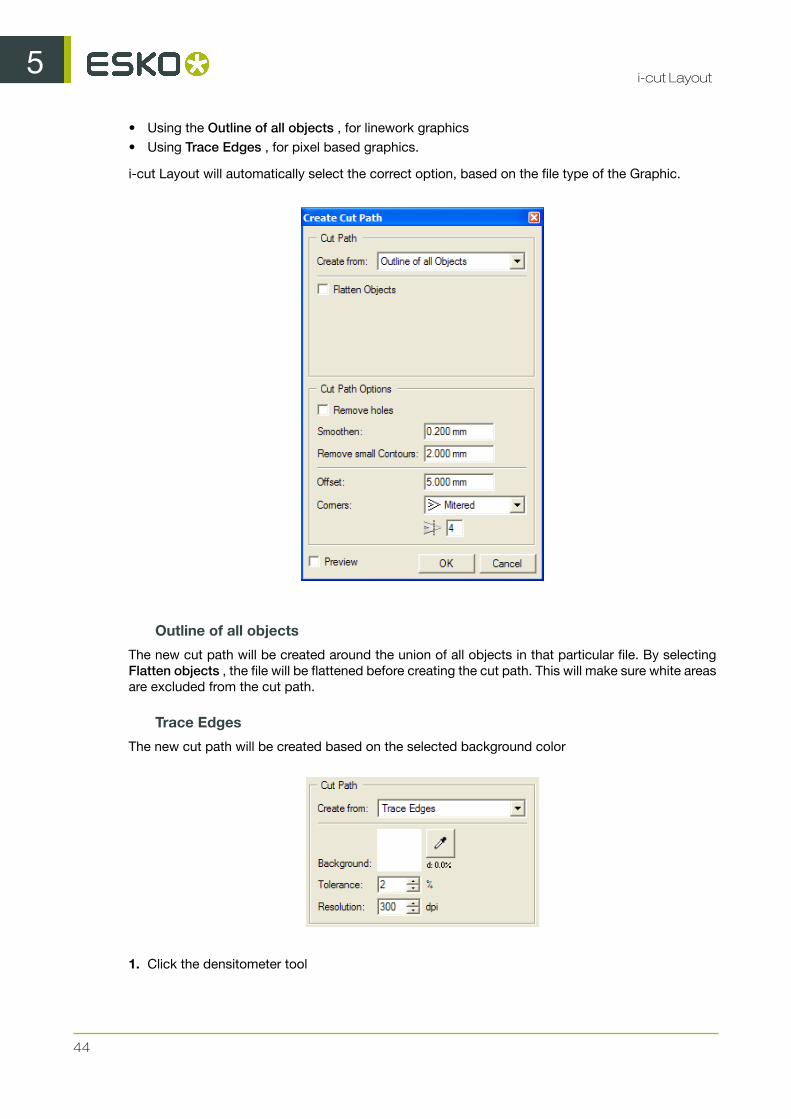
44
• Using the Outline of all objects , for linework graphics• Using Trace Edges , for pixel based graphics.
i-cut Layout will automatically select the correct option, based on the file type of the Graphic.
Outline of all objects
The new cut path will be created around the union of all objects in that particular file. By selectingFlatten objects , the file will be flattened before creating the cut path. This will make sure white areasare excluded from the cut path.
Trace Edges
The new cut path will be created based on the selected background color
1. Click the densitometer tool

5i-cut Layout
45
2. Click in the image on the background color. The color will be shown in the Background square,and its density is shown (in percentage)
3. Set the tolerance (in percentage) and the resolution (in dpi)
Cut Path Options
By selecting Remove holes , the cut path will only contain the outside borders. Contours inside theseoutside boundaries will be disregarded.
Select a higher Smoothen value to eliminate points in order to smooth the contour. Depending onthe deviation, you will loose some detail, but it will facilitate and speed up the cutting process.
Set the value for Remove small Contours . Objects smaller than the entered value will be removedfrom the cut path.
Select an Offset value to spread or choke the Cut Path over the specified Offset distance. You canalso define the shape of the corners.
Select Preview to get immediate feedback on screen of the current settings. Clicking OK will acceptthe cut path. Cancel will close the dialog without applying any changes.
Optimize Cut Path
Preparation > Optimize Cut Path allows you to adjust the cut path of the Graphic.Select Smoothento eliminate points in order to smoothen the contour. Depending on the deviation, you will loose somedetail, but it will facilitate and speed up the cutting process.
Tip:
Click the Contour Cleanup Tool and select the Move Points tool from the palette. If thepath is selected, and you click 'Optimize' you will immediately see that a certain number of pointsare being removed.
Select an Offset value to spread or choke the Cut Path over the specified Offset distance. You canalso define the shape of the corners.

5i-cut Layout
46
Select Milling Compensation to simulate the thickness of the milling head. Specify the diameter ofthe milling head and indicate its position with respect to the cut path.
Tip:
Click the Contour Cleanup Tool and select the Change Start Point and Direction tool from the palette. Changing the direction might be interesting for certain types of paper or cardboard.To improve the cutting quality, it could be decided to cut the outer contours in the opposite directionof the inner contours.
Importing a CAD design
You can create a Cut Path based on a file, by using Preparation > import CAD design
You can only have one CAD design in a Graphic at a time. If you want to replace a CAD design with adifferent one, click Preparation > Import CAD Design... The existing CAD design will be replacedby the new one.If you import a new CAD design and the existing one contained a bleed mask, themask will only be updated when switching to the Sheet View.
5.2.2 Create Bleed
If the graphic contains no information (color) outside of the cut path, you can use Preparation >Create Bleed to create a bleed.
5i-cut Layout
47
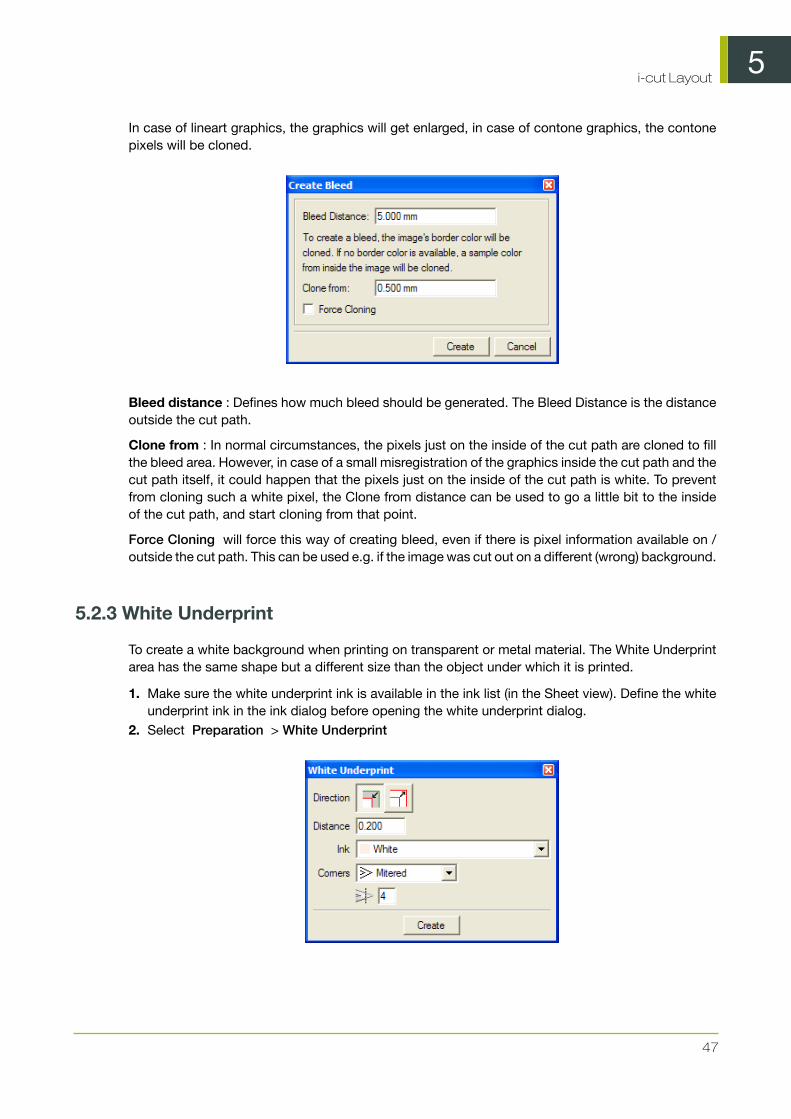
In case of lineart graphics, the graphics will get enlarged, in case of contone graphics, the contonepixels will be cloned.
Bleed distance : Defines how much bleed should be generated. The Bleed Distance is the distanceoutside the cut path.
Clone from : In normal circumstances, the pixels just on the inside of the cut path are cloned to fillthe bleed area. However, in case of a small misregistration of the graphics inside the cut path and thecut path itself, it could happen that the pixels just on the inside of the cut path is white. To preventfrom cloning such a white pixel, the Clone from distance can be used to go a little bit to the insideof the cut path, and start cloning from that point.
Force Cloning will force this way of creating bleed, even if there is pixel information available on /outside the cut path. This can be used e.g. if the image was cut out on a different (wrong) background.
5.2.3 White Underprint
To create a white background when printing on transparent or metal material. The White Underprintarea has the same shape but a different size than the object under which it is printed.
1. Make sure the white underprint ink is available in the ink list (in the Sheet view). Define the whiteunderprint ink in the ink dialog before opening the white underprint dialog.
2. Select Preparation > White Underprint

5i-cut Layout
48
3.Set the Direction :Do you want the White Underprint to be smaller or bigger than theoriginal object?
4. Define the distance between the edge of the White Underprint layer and the edge of the objectunder which White Underprint is applied.
5. Select the ink for the white underprint area.6. Set the corner type and miter ratio.7. Click Create
Tip:
If no objects are selected, the white underprint will be generated under all objects You canhowever.select (in green) the objects under which a white underprint area needs to be created.
Objects selected in blue will be ignored by the white Underprint tool.
5.3 Working with Placeholders
Working with Placeholders allows you to create layouts even when the Graphics aren't available yet.Only the size needs to be known.
To create a Placeholder:
1.In the Graphics tab of the SmartNest window, click the Add Placeholder button
2. If you want to base the Placeholder on a file, you can enable Based on File , and browse forthe file using the Select File button. In case of a CAD file, the trim box will be used, and thecad information will be used as Cut Path. For other files, only the trim box size is taken from theBase file.
3. Enter a Name for the Graphic4. If not using a base file, enter the Height and with .5. You can click the Color square to change the representation color for the Placeholder6. Click OK

5i-cut Layout
49
When a layout has been generated, Placeholders can be replaced by the actual Graphics, by usingPreparation > Replace by Graphics file . While doing so, a check will be performed based on thesize (of the Placeholder against the chosen Graphics file).
Another way to replace Placeholders is using the Graphic Settings: simply browse to the realGraphics. See Graphic Settings
5.4 Adjusting overlapping Graphics
In production, your sheet layouts may have Graphics that partially overlap one another. For example,if your Graphics include a bleed and they are placed on the layout so that they have a common cut,the bleeds between the Graphics will overlap. The Adjust Masks tool is used to adjust overlappingGraphics.
5.4.1 Using Adjust Masks
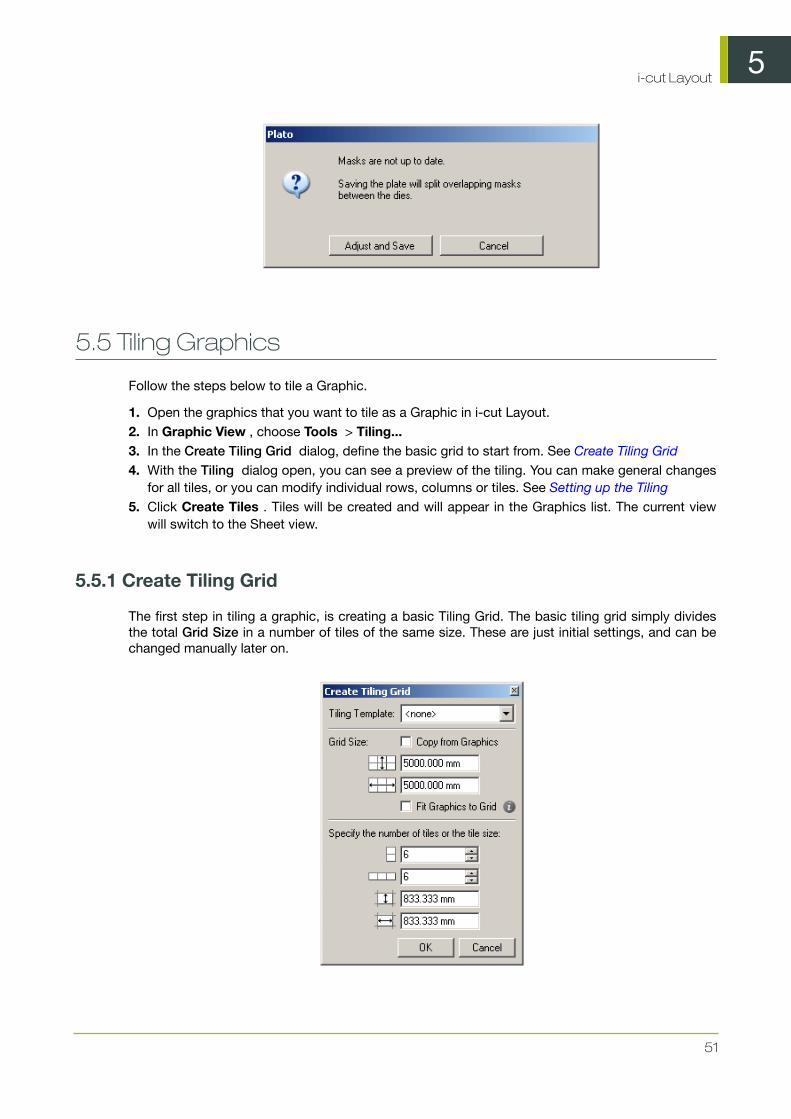
By clicking Adjust Masks , the masks will always be split half-way between the Graphics, even ifthey will be modified afterwards. The masks are not updated in real-time but they will be updatedjust before saving the file.
The status of the masks will be indicated in the Status bar. If the masks are not up to date, a warningwill be displayed.
5.4.2 Resetting masks
When you use the Adjust Masks tool, new masks are applied to the Graphics on the sheet. You canremove these masks by selecting 'Reset Masks' on the Tools menu.
When you remove masks from the Graphics in the sheet, the Graphics revert to using their originalmasks as they were created in the Graphic View. The Reset Masks command is disabled if there areno modified masks on the current sheet.
5.4.3 Checking the status of masks
How do you know if your masks are up to date? i-cut Layout will display masks information in theStatus bar.If the masks are not up to date, a warning will be displayed.
After adjusting, the Quick Masks status will show:
5i-cut Layout
50
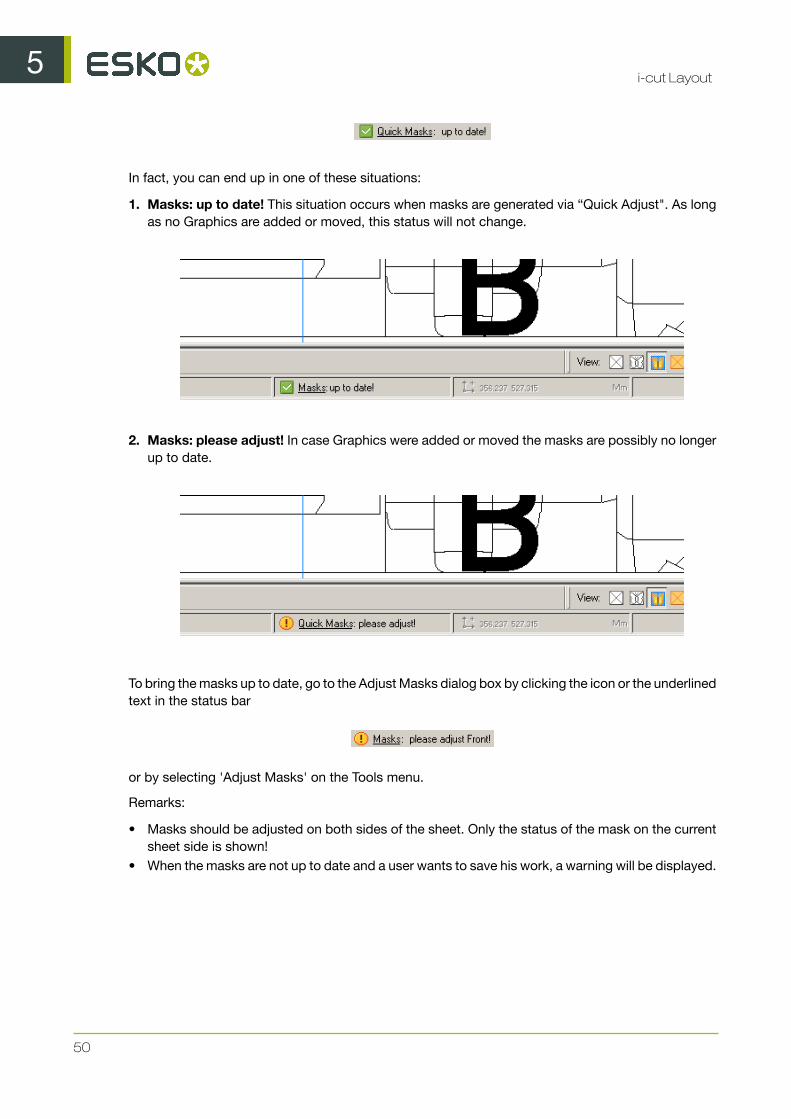
In fact, you can end up in one of these situations:
1. Masks: up to date! This situation occurs when masks are generated via “Quick Adjust". As longas no Graphics are added or moved, this status will not change.
2. Masks: please adjust! In case Graphics were added or moved the masks are possibly no longerup to date.
To bring the masks up to date, go to the Adjust Masks dialog box by clicking the icon or the underlinedtext in the status bar
or by selecting 'Adjust Masks' on the Tools menu.
Remarks:
• Masks should be adjusted on both sides of the sheet. Only the status of the mask on the currentsheet side is shown!
• When the masks are not up to date and a user wants to save his work, a warning will be displayed.
5i-cut Layout
51
5.5 Tiling Graphics
Follow the steps below to tile a Graphic.
1. Open the graphics that you want to tile as a Graphic in i-cut Layout.2. In Graphic View , choose Tools > Tiling...3. In the Create Tiling Grid dialog, define the basic grid to start from. See Create Tiling Grid4. With the Tiling dialog open, you can see a preview of the tiling. You can make general changes
for all tiles, or you can modify individual rows, columns or tiles. See Setting up the Tiling5. Click Create Tiles . Tiles will be created and will appear in the Graphics list. The current view
will switch to the Sheet view.
5.5.1 Create Tiling Grid
The first step in tiling a graphic, is creating a basic Tiling Grid. The basic tiling grid simply dividesthe total Grid Size in a number of tiles of the same size. These are just initial settings, and can bechanged manually later on.

5i-cut Layout
52
• You can select a previously saved Tiling Template. If a Tiling Template is selected, the grid size isfixed, and the bottom of the dialog will show a preview of the Tiling Template. See Working witha Tiling Template on page 56
• If you want to keep the total Grid Size at the size of your graphic, you can enable the Copy fromGraphics option. In that case, the Grid Size is fixed at the size of the Graphic. Changing thenumber of tiles (vertical or horizontal) will change the tile size and vice versa.
• If Copy from Graphics is disabled, you can freely change the total Grid Size. Changing the GridSize will automatically change the Tile Size, while changing the Tile Size or the number of tileswill automatically update the Grid Size.
• If you enable Fit Graphics to Grid, your Graphic will be scaled to match the Grid Size, bothvertically and horizontally. This can result in non-proportional scaling. If the option is enabled, aninfo icon is shown. When moving the mouse over this icon will show the resulting scaling.
When clicking OK, the Tiling dialog will open, and you can see a preview of the tiling. See Settingup the Tiling on page 52
5.5.2 Setting up the Tiling
The Tiling dialog allows to change the tiling and tiling settings, while showing a preview of the tiles,over a dimmed preview of the graphic.
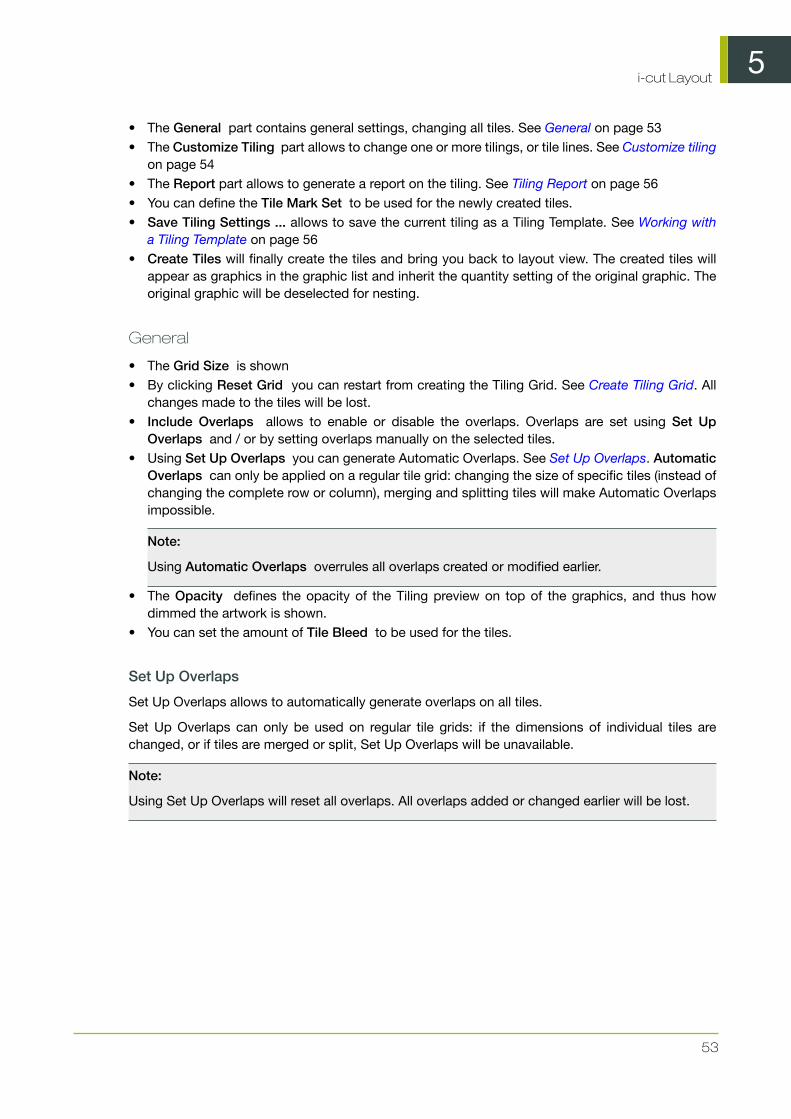
5i-cut Layout
53
• The General part contains general settings, changing all tiles. See General on page 53• The Customize Tiling part allows to change one or more tilings, or tile lines. See Customize tiling
on page 54• The Report part allows to generate a report on the tiling. See Tiling Report on page 56• You can define the Tile Mark Set to be used for the newly created tiles.• Save Tiling Settings ... allows to save the current tiling as a Tiling Template. See Working with
a Tiling Template on page 56• Create Tiles will finally create the tiles and bring you back to layout view. The created tiles will
appear as graphics in the graphic list and inherit the quantity setting of the original graphic. Theoriginal graphic will be deselected for nesting.
General
• The Grid Size is shown• By clicking Reset Grid you can restart from creating the Tiling Grid. See Create Tiling Grid. All
changes made to the tiles will be lost.• Include Overlaps allows to enable or disable the overlaps. Overlaps are set using Set Up
Overlaps and / or by setting overlaps manually on the selected tiles.• Using Set Up Overlaps you can generate Automatic Overlaps. See Set Up Overlaps. Automatic
Overlaps can only be applied on a regular tile grid: changing the size of specific tiles (instead ofchanging the complete row or column), merging and splitting tiles will make Automatic Overlapsimpossible.
Note:
Using Automatic Overlaps overrules all overlaps created or modified earlier.
• The Opacity defines the opacity of the Tiling preview on top of the graphics, and thus howdimmed the artwork is shown.
• You can set the amount of Tile Bleed to be used for the tiles.
Set Up Overlaps
Set Up Overlaps allows to automatically generate overlaps on all tiles.
Set Up Overlaps can only be used on regular tile grids: if the dimensions of individual tiles arechanged, or if tiles are merged or split, Set Up Overlaps will be unavailable.
Note:
Using Set Up Overlaps will reset all overlaps. All overlaps added or changed earlier will be lost.

5i-cut Layout
54
Overlap adds an area that will contains information of the neighboring tiles.
If Overlap on both sides is enabled, the same Overlap distance will be applied in both directions.In that case, no Glue Area will be applied.
Glue Area adds an area that will be left unprinted and will be glued afterwards.
Specify the First Tile's Position and the Order in which the tiles should be numbered.
The image on the right offers a visual representation of the order of the tiles. The arrows indicate howthe Graphics overlap.In the example, Graphic 2 and 5 both overlap Graphic 1.
Note:
The first tile will usually be at the bottom. It will have more overlap as neighbouring tiles will beattached on top of this tile.
Customize tiling
The Customize Tiling section allows to manually select and change selected tiles. The contents ofthe dialog depends on the current selection.
Selecting
• When hovering over the tiles, the blue lines show the "selectable" objects. The actual selectionis shown in magenta.
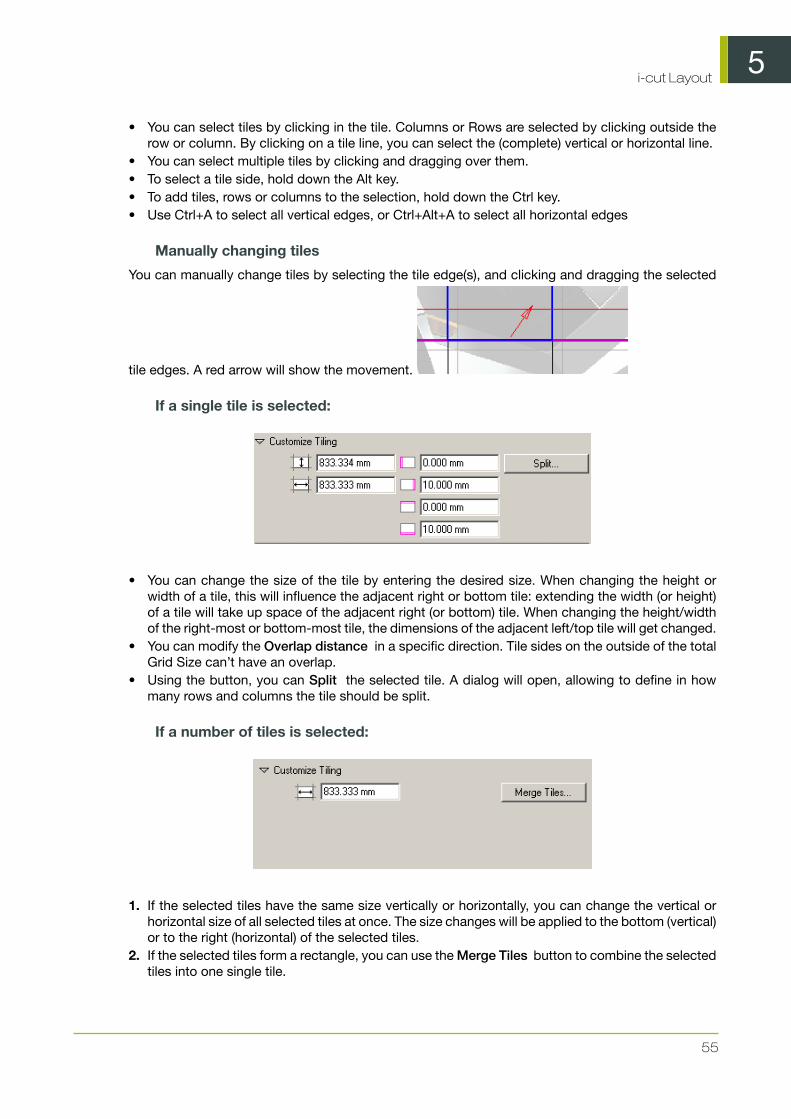
5i-cut Layout
55
• You can select tiles by clicking in the tile. Columns or Rows are selected by clicking outside therow or column. By clicking on a tile line, you can select the (complete) vertical or horizontal line.
• You can select multiple tiles by clicking and dragging over them.• To select a tile side, hold down the Alt key.• To add tiles, rows or columns to the selection, hold down the Ctrl key.• Use Ctrl+A to select all vertical edges, or Ctrl+Alt+A to select all horizontal edges
Manually changing tiles
You can manually change tiles by selecting the tile edge(s), and clicking and dragging the selected
tile edges. A red arrow will show the movement.
If a single tile is selected:
• You can change the size of the tile by entering the desired size. When changing the height orwidth of a tile, this will influence the adjacent right or bottom tile: extending the width (or height)of a tile will take up space of the adjacent right (or bottom) tile. When changing the height/widthof the right-most or bottom-most tile, the dimensions of the adjacent left/top tile will get changed.
• You can modify the Overlap distance in a specific direction. Tile sides on the outside of the totalGrid Size can’t have an overlap.
• Using the button, you can Split the selected tile. A dialog will open, allowing to define in howmany rows and columns the tile should be split.
If a number of tiles is selected:
1. If the selected tiles have the same size vertically or horizontally, you can change the vertical orhorizontal size of all selected tiles at once. The size changes will be applied to the bottom (vertical)or to the right (horizontal) of the selected tiles.
2. If the selected tiles form a rectangle, you can use the Merge Tiles button to combine the selectedtiles into one single tile.
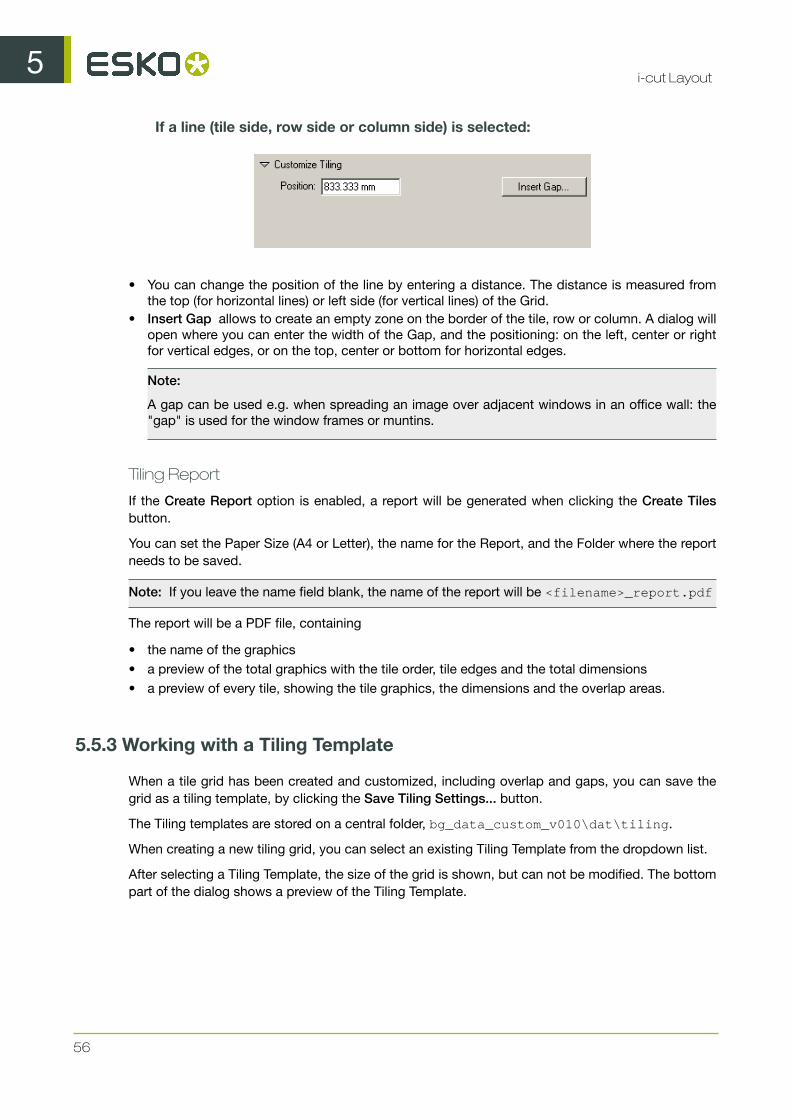
5i-cut Layout
56
If a line (tile side, row side or column side) is selected:
• You can change the position of the line by entering a distance. The distance is measured fromthe top (for horizontal lines) or left side (for vertical lines) of the Grid.
• Insert Gap allows to create an empty zone on the border of the tile, row or column. A dialog willopen where you can enter the width of the Gap, and the positioning: on the left, center or rightfor vertical edges, or on the top, center or bottom for horizontal edges.
Note:
A gap can be used e.g. when spreading an image over adjacent windows in an office wall: the"gap" is used for the window frames or muntins.
Tiling Report
If the Create Report option is enabled, a report will be generated when clicking the Create Tilesbutton.
You can set the Paper Size (A4 or Letter), the name for the Report, and the Folder where the reportneeds to be saved.
Note: If you leave the name field blank, the name of the report will be <filename>_report.pdf
The report will be a PDF file, containing
• the name of the graphics• a preview of the total graphics with the tile order, tile edges and the total dimensions• a preview of every tile, showing the tile graphics, the dimensions and the overlap areas.
5.5.3 Working with a Tiling Template
When a tile grid has been created and customized, including overlap and gaps, you can save thegrid as a tiling template, by clicking the Save Tiling Settings... button.
The Tiling templates are stored on a central folder, bg_data_custom_v010\dat\tiling.
When creating a new tiling grid, you can select an existing Tiling Template from the dropdown list.
After selecting a Tiling Template, the size of the grid is shown, but can not be modified. The bottompart of the dialog shows a preview of the Tiling Template.
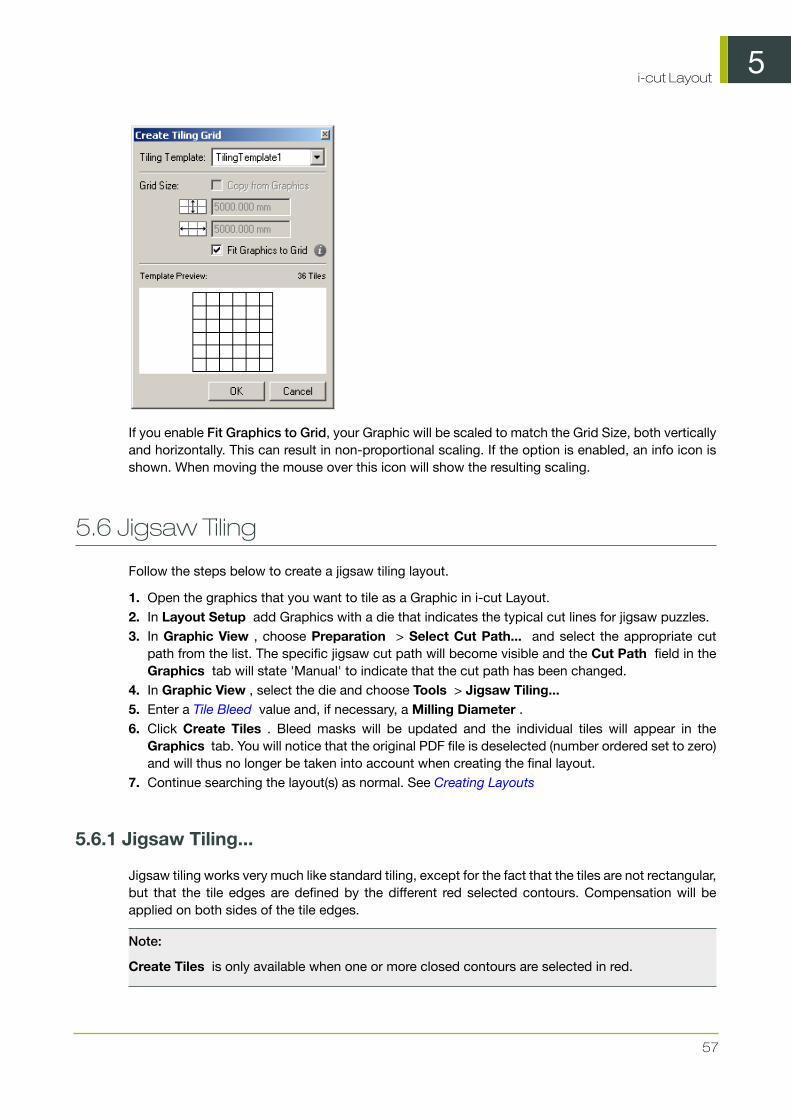
5i-cut Layout
57
If you enable Fit Graphics to Grid, your Graphic will be scaled to match the Grid Size, both verticallyand horizontally. This can result in non-proportional scaling. If the option is enabled, an info icon isshown. When moving the mouse over this icon will show the resulting scaling.
5.6 Jigsaw Tiling
Follow the steps below to create a jigsaw tiling layout.
1. Open the graphics that you want to tile as a Graphic in i-cut Layout.2. In Layout Setup add Graphics with a die that indicates the typical cut lines for jigsaw puzzles.3. In Graphic View , choose Preparation > Select Cut Path... and select the appropriate cut
path from the list. The specific jigsaw cut path will become visible and the Cut Path field in theGraphics tab will state 'Manual' to indicate that the cut path has been changed.
4. In Graphic View , select the die and choose Tools > Jigsaw Tiling...5. Enter a Tile Bleed value and, if necessary, a Milling Diameter .6. Click Create Tiles . Bleed masks will be updated and the individual tiles will appear in the
Graphics tab. You will notice that the original PDF file is deselected (number ordered set to zero)and will thus no longer be taken into account when creating the final layout.
7. Continue searching the layout(s) as normal. See Creating Layouts
5.6.1 Jigsaw Tiling...
Jigsaw tiling works very much like standard tiling, except for the fact that the tiles are not rectangular,but that the tile edges are defined by the different red selected contours. Compensation will beapplied on both sides of the tile edges.
Note:
Create Tiles is only available when one or more closed contours are selected in red.
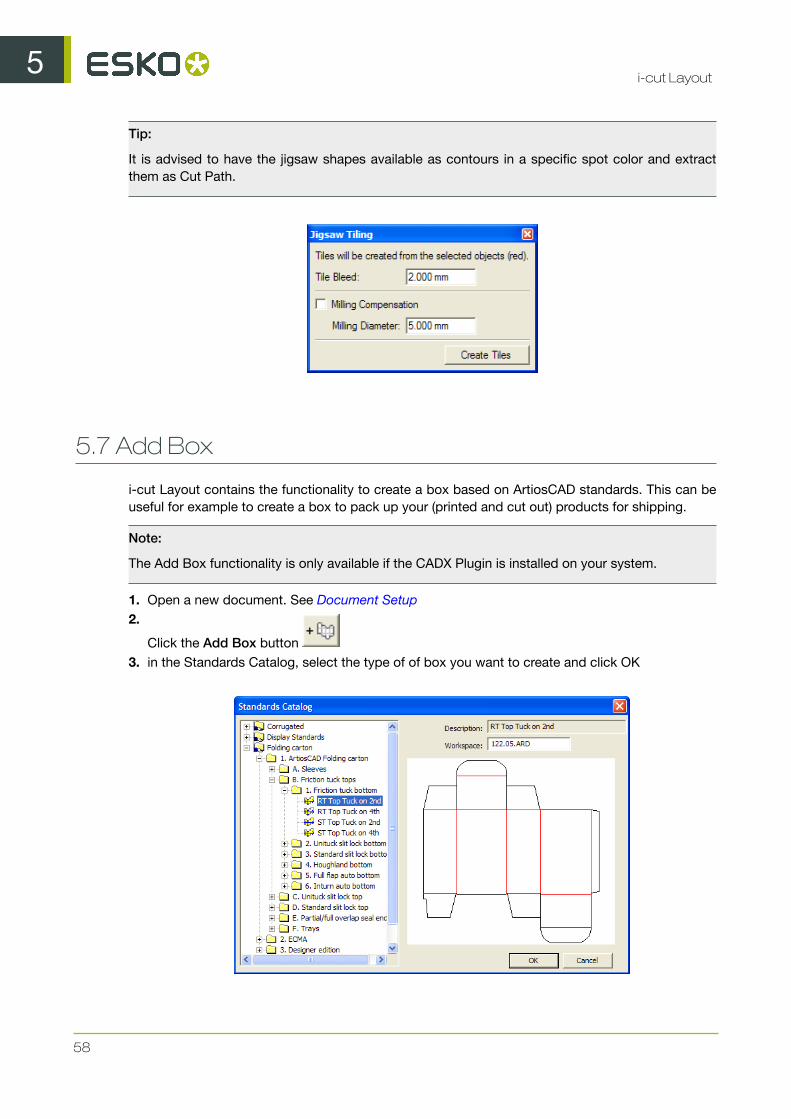
5i-cut Layout
58
Tip:
It is advised to have the jigsaw shapes available as contours in a specific spot color and extractthem as Cut Path.
5.7 Add Box
i-cut Layout contains the functionality to create a box based on ArtiosCAD standards. This can beuseful for example to create a box to pack up your (printed and cut out) products for shipping.
Note:
The Add Box functionality is only available if the CADX Plugin is installed on your system.
1. Open a new document. See Document Setup2.
Click the Add Box button 3. in the Standards Catalog, select the type of of box you want to create and click OK
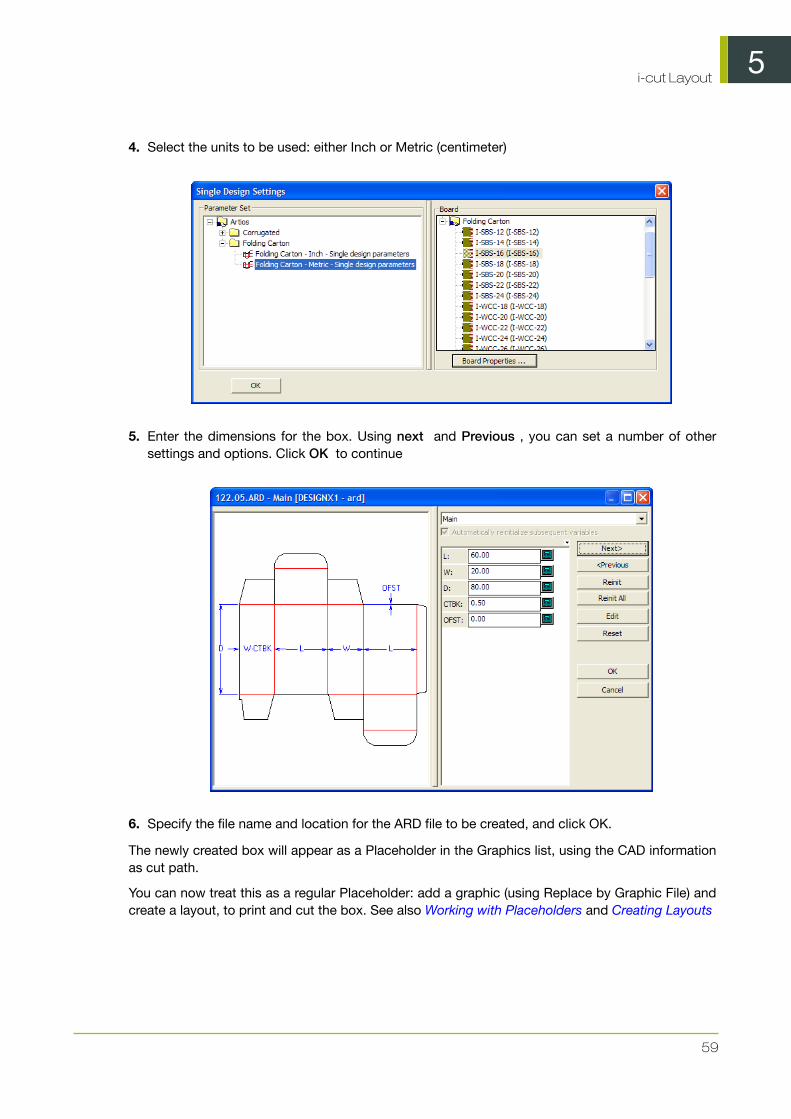
5i-cut Layout
59
4. Select the units to be used: either Inch or Metric (centimeter)
5. Enter the dimensions for the box. Using next and Previous , you can set a number of othersettings and options. Click OK to continue
6. Specify the file name and location for the ARD file to be created, and click OK.
The newly created box will appear as a Placeholder in the Graphics list, using the CAD informationas cut path.
You can now treat this as a regular Placeholder: add a graphic (using Replace by Graphic File) andcreate a layout, to print and cut the box. See also Working with Placeholders and Creating Layouts

5i-cut Layout
60
5.8 Export Graphic
Export Graphic allows you to export a Graphic, including all changes you made, such as creatinga Cut Path, adding bleed, ....
Only Export to PDF is possible. All normal PDF export options are available.
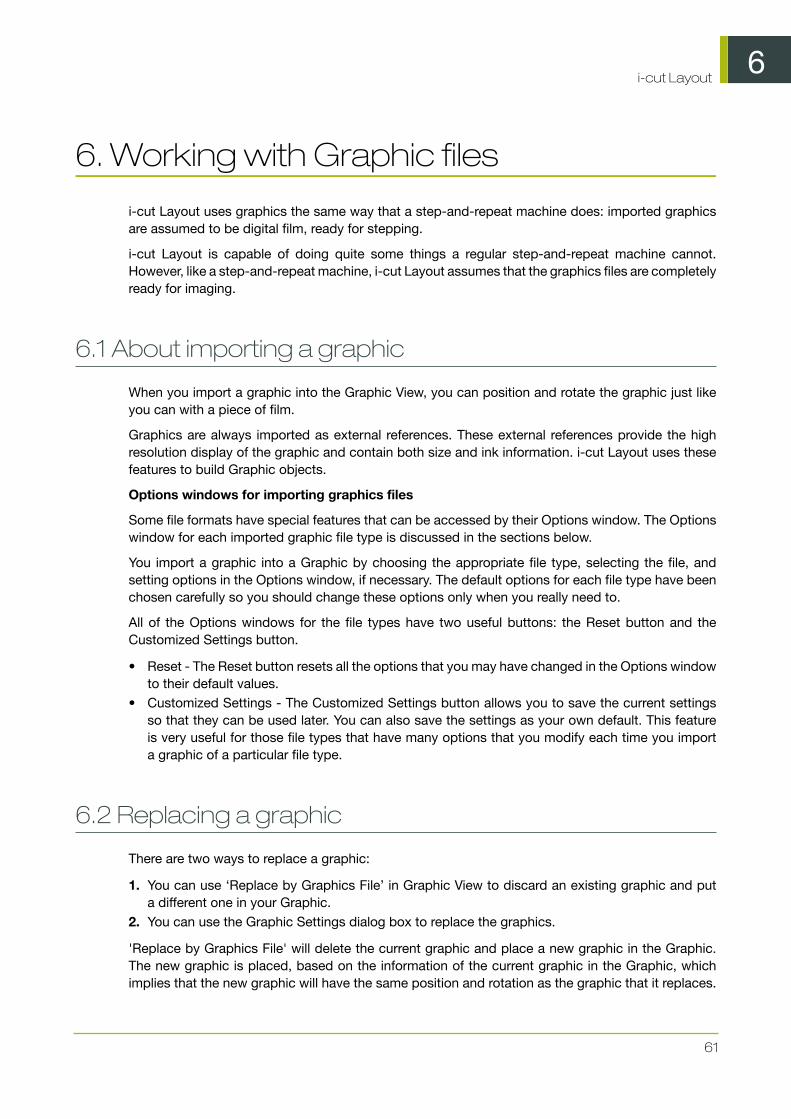
6i-cut Layout
61
6. Working with Graphic files
i-cut Layout uses graphics the same way that a step-and-repeat machine does: imported graphicsare assumed to be digital film, ready for stepping.
i-cut Layout is capable of doing quite some things a regular step-and-repeat machine cannot.However, like a step-and-repeat machine, i-cut Layout assumes that the graphics files are completelyready for imaging.
6.1 About importing a graphic
When you import a graphic into the Graphic View, you can position and rotate the graphic just likeyou can with a piece of film.
Graphics are always imported as external references. These external references provide the highresolution display of the graphic and contain both size and ink information. i-cut Layout uses thesefeatures to build Graphic objects.
Options windows for importing graphics files
Some file formats have special features that can be accessed by their Options window. The Optionswindow for each imported graphic file type is discussed in the sections below.
You import a graphic into a Graphic by choosing the appropriate file type, selecting the file, andsetting options in the Options window, if necessary. The default options for each file type have beenchosen carefully so you should change these options only when you really need to.
All of the Options windows for the file types have two useful buttons: the Reset button and theCustomized Settings button.
• Reset - The Reset button resets all the options that you may have changed in the Options windowto their default values.
• Customized Settings - The Customized Settings button allows you to save the current settingsso that they can be used later. You can also save the settings as your own default. This featureis very useful for those file types that have many options that you modify each time you importa graphic of a particular file type.
6.2 Replacing a graphic
There are two ways to replace a graphic:
1. You can use ‘Replace by Graphics File’ in Graphic View to discard an existing graphic and puta different one in your Graphic.
2. You can use the Graphic Settings dialog box to replace the graphics.
'Replace by Graphics File' will delete the current graphic and place a new graphic in the Graphic.The new graphic is placed, based on the information of the current graphic in the Graphic, whichimplies that the new graphic will have the same position and rotation as the graphic that it replaces.

6i-cut Layout
62
The center of the graphic is aligned with the center of the current die. If this position is not correct,you can move or rotate the graphic with the Transform and Align tools.
Tip:
This feature is useful for changes that require a new graphic, while all the other parts of the Graphicneed to remain exactly the same.
6.3 Importing a PostScript file
You can import PostScript files and use them as a graphic in your Graphic. PostScript files areconverted to PDF files. Composite and separated PostScript files can both be imported.
The Options window for importing PostScript and PDF contain the same features. The Options forIllustrator and EPS contain some, but not all the same features as the PostScript Options window.All the features of the PostScript Options window will be described here. The features that are usedin PDF, Illustrator and EPS files refer to this section.
Clicking 'Setup...' in the Replace Graphic dialog box opens the PostScript Options window. TheOptions window contains tabs to fine-tune the import of PostScript files.
6.3.1 Pages
Some options of the Pages tab are used by Esko Software Suite applications other than i-cut Layout.Some options are disabled, as shown below:
Select All Pages or specify a Range of pages.
Split up a multipage file To divide the original multipage PostScript file into smaller parts. You definethe amount of pages to open (of the specified pages or range). What you need to know:
6i-cut Layout
63
• Each part is stored as a separate GRS/`Normalized PDF file. It is either stored locally or storedin the output directory .
• Each part is stored with the name of the imported PostScript file followed by _001, _002,_0001_001... or it gets the output name.
Split up a multipage file Check the box to divide the original multipage PostScript file into smallerparts. You define the amount of pages to open (of the specified pages or range). What you needto know:
• Each part is stored as a separate Normalized PDF file. It is either stored locally or stored in theOutput Directory.
• Each part is stored with the name of the imported PostScript file followed by _001, _002,_0001_001... or it gets the Output Name.
Merge Tiled CT files to one CT Some ArtPro files have tiled CTs, those are CTs which are actuallydivided into a number of little CTs (tiles). Some jobs are so large that there are thousands of theselittle CTs. Select this toggle to merge the tiles into one CT to improve editability of the Esko nativefile and to optimize further processing. This option is default selected, it doesn't matter if you importa file with no tiled CTs.
Note:
When errors occur when a PostScript file is imported (e.g. a font is not found), the Merge Tiled CTsto one CT will not be performed.
Merge Separated PostScript file to Composite page Merges separated single-page and multi-page PostScript files to a composite file.
Optimize Merged PostScript File This option optimizes the merged PostScript file. This is usefulwhen you need to edit the imported PostScript file. This option becomes available when 'MergeSeparate PostScript File to Composite Page' is activated.
Note:
When errors occur when a PostScript file is imported (e.g. a font is not found), the Optimize MergedPostScript File will not be performed.
Password You can enter a password for protected PDF files.
6.3.2 Color Management

6i-cut Layout
64
Destination Color Space
Here you define what color space the opened/imported document will have.
Color Space
• CMYK• Grayscale
Destination Profile Choose a color profile from the drop-down list. Currently only CMYK andGrayscale profiles are supported, you can choose between standard ICC profiles and EskoKaleidoscope profiles.
The 'Use PDF Output intent if available' toggle: in some PDF files, the PDF Output intent is defined(e.g. PDF/X-3). If you want to use the color space as defined in the output intent, use this toggle. If youselected the toggle for a file without PDF Output intent, the chosen Destination Profile will be used.
Rendering Intent
• Relative (No Background): Use this option if you do not want any background simulation. Anycolor that falls outside the range that the output device can render is adjusted to the closest colorthat can be rendered, while all other colors are left unchanged.The white point of the source willbe mapped on the white point of the destination process. This rendering intent takes into accountthe ability of the human eye to adapt to the surrounding white.
• Absolute (Background): Any colors that fall outside the range that the output device can renderare adjusted to the closest color that can be rendered, while all other colors are left unchanged.The white point is preserved.
• Perceptual: This will result in no background simulation (white of reference color space is mappedon white of destination color space). In other words, if certain colors in an image fall outside ofthe range of colors that the output device can render, the picture intent will cause all the colors

6i-cut Layout
65
in the image to be adjusted so that the every color in the image falls within the range that canbe rendered and so that the relationship between colors is preserved as much as possible.Usethis option if you don't care too much about an exact color match but you want the pictures atleast to look nice on your proofer. It will give a visually pleasing result. If the gamut of the sourceis wider than the proofer, the entire gamut is shrunk so that it fits inside the gamut of the proofer.
• Saturation: Use this option if you care especially about saturated colors. It preserves the saturationof colors in the image at the possible expense of hue and lightness.
Set Document Profile A Document Profile is the color space of the process inks used in thedocument.
• Always: you can 'tag' a Normalized PDF file with its Document Profile. This means that the file'knows' what its Document Profile is, which may make further color conversion throughout aworkflow more correct.
• Never: Document Profile is not set.
Spot Colors
PANTONE Inks
• Keep All: No PANTONE inks will be converted to process inks.• Convert All: All PANTONE inks will be converted to process inks.• Keep list: All PANTONE inks will be converted except those listed in the Inks tab.
Method
• Use Destination Profile: PANTONE and Designer inks will be converted using the selectedDestination Profile. This gives the most accurate color reproduction.
• PANTONE Solids to Process (Euroscale). PANTONE inks will be converted to process inksaccording to a fixed conversion table provided by PANTONE. The result is independent of theselected Destination Profile. This assumes the Euroscale print conditions.
• PANTONE Solids to Process (SWOP). PANTONE inks will be converted to process inks accordingto a fixed conversion table provided by PANTONE. The result is independent of the selectedDestination Profile. This assumes the American SWOP print conditions.
Designer Inks
• Keep All: No Designer inks will be converted to process inks.• Convert All: All Designer inks will be converted to process inks.• Keep list: All Designer inks will be converted except those listed in the Inks tab.
RGB
RGB will always be converted to process inks during import.
RGB Method Select one from the drop-down list
• Source to destination profile: the user needs to specify both the Source Profile (RGB) and theDestination Profile (CMYK or Grayscale).
• With Link profile: the user specifies a Kaleidoscope Device Link Profile. this Link Profile implicitelydetermines the Source and Destination profiles.
Source Profile / Link Profile Select one from the drop-down list.

6i-cut Layout
66
Objects with RGB Profile tags The RGB objects in a PostScript or PDF file may be tagged witha Color Profile.
• Convert using the RGB Profile tags: The user may choose to use that Color Profile as a SourceProfile (overruling the Source / Link Profile selected above).
Tip:
In strictly controlled workflows, the embedded tags are probably accurate, so this option maybe preferable.
• Ignore tags: the embedded Color Profile will be ignored, the Source / Link Profile defined abovewill be used during conversion of RGB objects.
CMYK and Gray
The CMYK objects in a PostScript or PDF file may be tagged with a Color Profile. The colorpercentages of untagged objects will always be preserved. For tagged objects, users have a choice:
• Ignore tags, preserve percentages : the Color Profile tag will be ignored, the percentages willbe those of the object's color.
• Convert, preserve appearance : the objects' color profile will be taken into account; this meansthat their color values will change.
The Gray objects in a PostScript or PDF file may be tagged with a Color Profile. The color percentagesof untagged objects will always be preserved. For tagged objects, users have a choice:
• Ignore tags, preserve percentages : the Color Profile tag will be ignored, the percentages willbe those of the object's color.
• Convert, preserve appearance : the objects' color profile will be taken into account; this meansthat their color values will change.
6.3.3 Inks
The Inks / Separations tab depends on the output type you selected in the Color Management tab .If you choose CMYK Composite or Composite, the Inks tab will be visible, if you choose separatedoutput, the Separations tab will be visible.

6i-cut Layout
67
Use rulings, angles and dot gain compensation from PostScript file if available If the PostScriptfile contains rulings, angles and dot gain compensation, these will be used when this toggle isselected, other settings in this tab will be overruled.
Apply Screen Swap Table Select a screen swap table from the drop-down list.
Inks (double-click the fields to edit)
Autoload Ink Settings from Job Setup If Job parameters were defined, you can use this toggle tomake sure these inks are used. If you do not click this button, you are free to edit the ink settings.The default values as defined at the bottom are used for ink attributres that are not set in the inksettings of the job setup.
Default values, used when a ruling, angle or dotshape is not specified. Enter the default values forruling angle and dotshape, the system will take these values when they are not specified elsewhere(i.e. in the PostScript file, or in job Parameters, ...).
6.3.4 Overprint
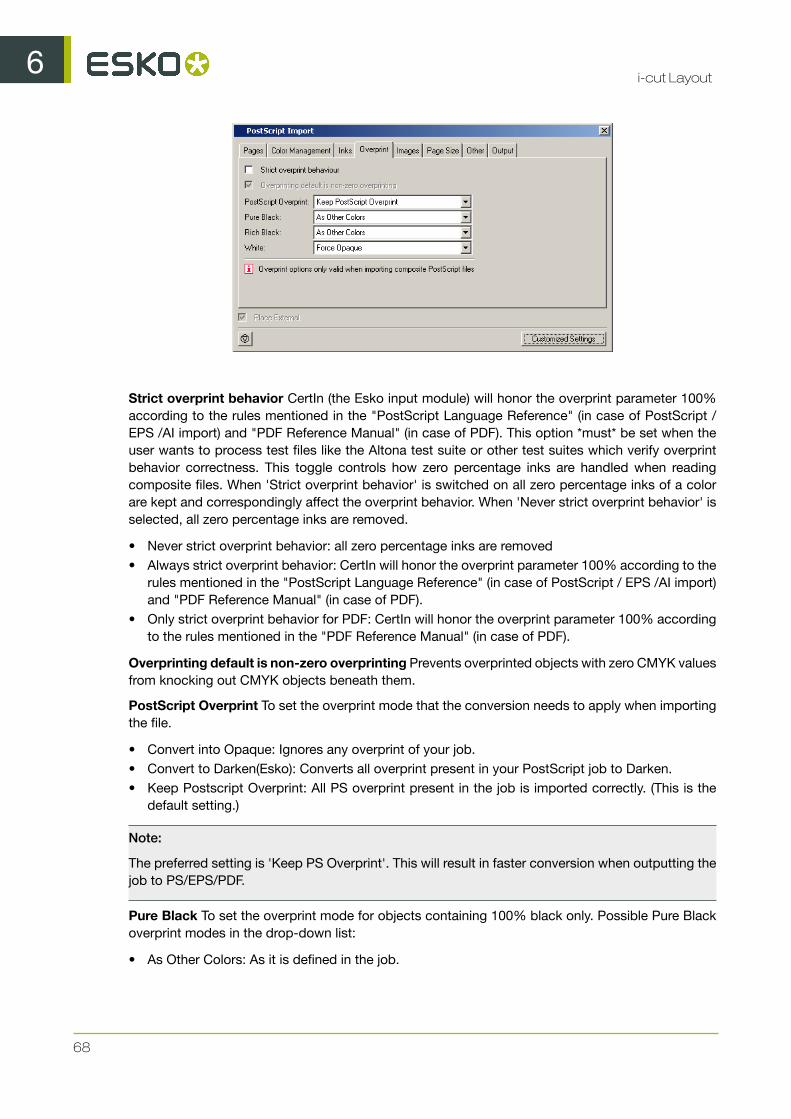
6i-cut Layout
68
Strict overprint behavior CertIn (the Esko input module) will honor the overprint parameter 100%according to the rules mentioned in the "PostScript Language Reference" (in case of PostScript /EPS /AI import) and "PDF Reference Manual" (in case of PDF). This option *must* be set when theuser wants to process test files like the Altona test suite or other test suites which verify overprintbehavior correctness. This toggle controls how zero percentage inks are handled when readingcomposite files. When 'Strict overprint behavior' is switched on all zero percentage inks of a colorare kept and correspondingly affect the overprint behavior. When 'Never strict overprint behavior' isselected, all zero percentage inks are removed.
• Never strict overprint behavior: all zero percentage inks are removed• Always strict overprint behavior: CertIn will honor the overprint parameter 100% according to the
rules mentioned in the "PostScript Language Reference" (in case of PostScript / EPS /AI import)and "PDF Reference Manual" (in case of PDF).
• Only strict overprint behavior for PDF: CertIn will honor the overprint parameter 100% accordingto the rules mentioned in the "PDF Reference Manual" (in case of PDF).
Overprinting default is non-zero overprinting Prevents overprinted objects with zero CMYK valuesfrom knocking out CMYK objects beneath them.
PostScript Overprint To set the overprint mode that the conversion needs to apply when importingthe file.
• Convert into Opaque: Ignores any overprint of your job.• Convert to Darken(Esko): Converts all overprint present in your PostScript job to Darken.• Keep Postscript Overprint: All PS overprint present in the job is imported correctly. (This is the
default setting.)
Note:
The preferred setting is 'Keep PS Overprint'. This will result in faster conversion when outputting thejob to PS/EPS/PDF.
Pure Black To set the overprint mode for objects containing 100% black only. Possible Pure Blackoverprint modes in the drop-down list:
• As Other Colors: As it is defined in the job.
6i-cut Layout
69
• Force Opaque(masking): Forces Opaque for objects in 100% black and knocking out allunderlying inks.
• Force Postscript Overprint: Forces PostScript overprint for objects in 100% black.• Force Darken(Esko): Forces Darken for ALL objects in 100% black. The black color is printed on
top of other colors, instead of erasing the color underneath.
Caution:
There are two problems:
• Sometimes ink saturation can occur.
100% black text on a 100% red (this is, 100% magenta and 100% yellow) background, resultsin three inks printed at 100%.
• Black is best handled as knockout for flexo, since it is better to add a small trapping regionthan to make the complete black region overprint.
Rich Black Set the paint mode for objects containing 100% black and at least one other ink.
• As Other Colors: As it is defined in the job.• Force Opaque(masking): Sets the overprint mode to opaque for all objects containing 100% black
and at least one other ink.• Force Postscript Overprint: Keeps the PostScript overprint for objects in 100% black and at least
one other ink (overprint objects stay in overprint and opaque objects stay opaque).• Force Darken(Esko): Forces Darken for all objects in 100% black and at least one other ink.
White Possible White paint modes to select from the drop-down list:
• Opaque: Forces all objects in white to Opaque.• Keep PostScript Overprint: Keeps the PostScript overprint for objects in White (overprint objects
stay in overprint, opaque objects stay opaque)
6.3.5 Images
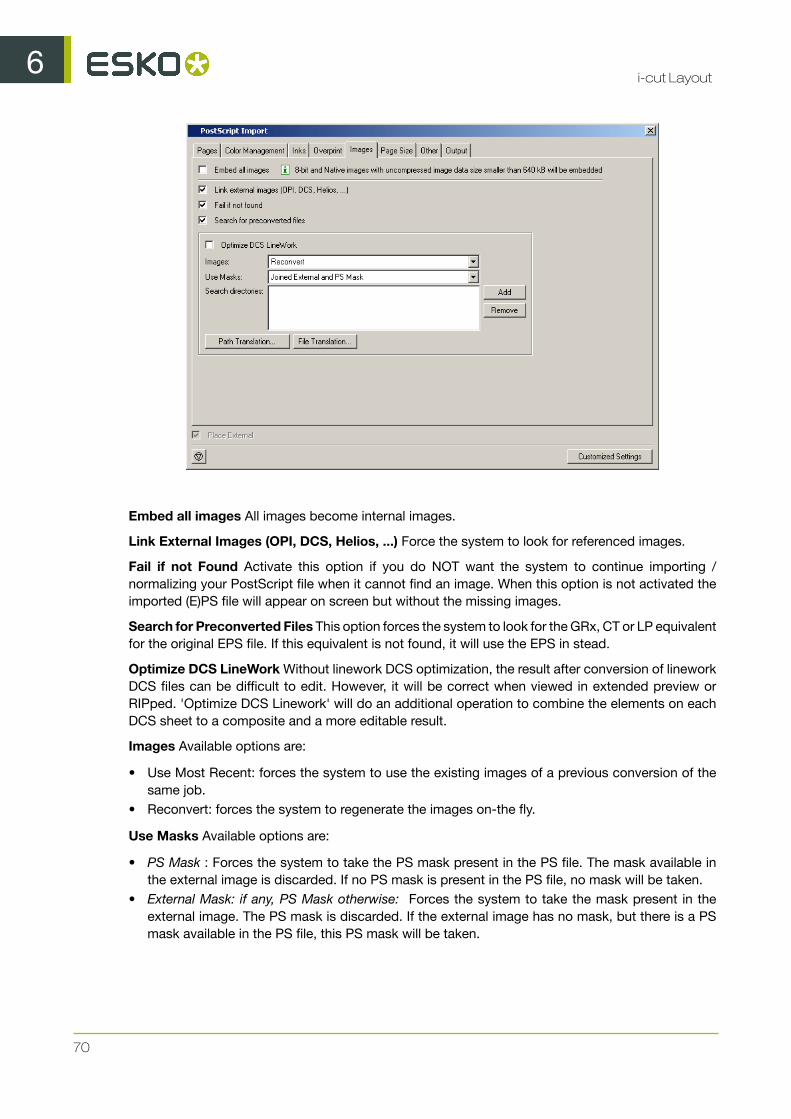
6i-cut Layout
70
Embed all images All images become internal images.
Link External Images (OPI, DCS, Helios, ...) Force the system to look for referenced images.
Fail if not Found Activate this option if you do NOT want the system to continue importing /normalizing your PostScript file when it cannot find an image. When this option is not activated theimported (E)PS file will appear on screen but without the missing images.
Search for Preconverted Files This option forces the system to look for the GRx, CT or LP equivalentfor the original EPS file. If this equivalent is not found, it will use the EPS in stead.
Optimize DCS LineWork Without linework DCS optimization, the result after conversion of lineworkDCS files can be difficult to edit. However, it will be correct when viewed in extended preview orRIPped. 'Optimize DCS Linework' will do an additional operation to combine the elements on eachDCS sheet to a composite and a more editable result.
Images Available options are:
• Use Most Recent: forces the system to use the existing images of a previous conversion of thesame job.
• Reconvert: forces the system to regenerate the images on-the fly.
Use Masks Available options are:
• PS Mask : Forces the system to take the PS mask present in the PS file. The mask available inthe external image is discarded. If no PS mask is present in the PS file, no mask will be taken.
• External Mask: if any, PS Mask otherwise: Forces the system to take the mask present in theexternal image. The PS mask is discarded. If the external image has no mask, but there is a PSmask available in the PS file, this PS mask will be taken.
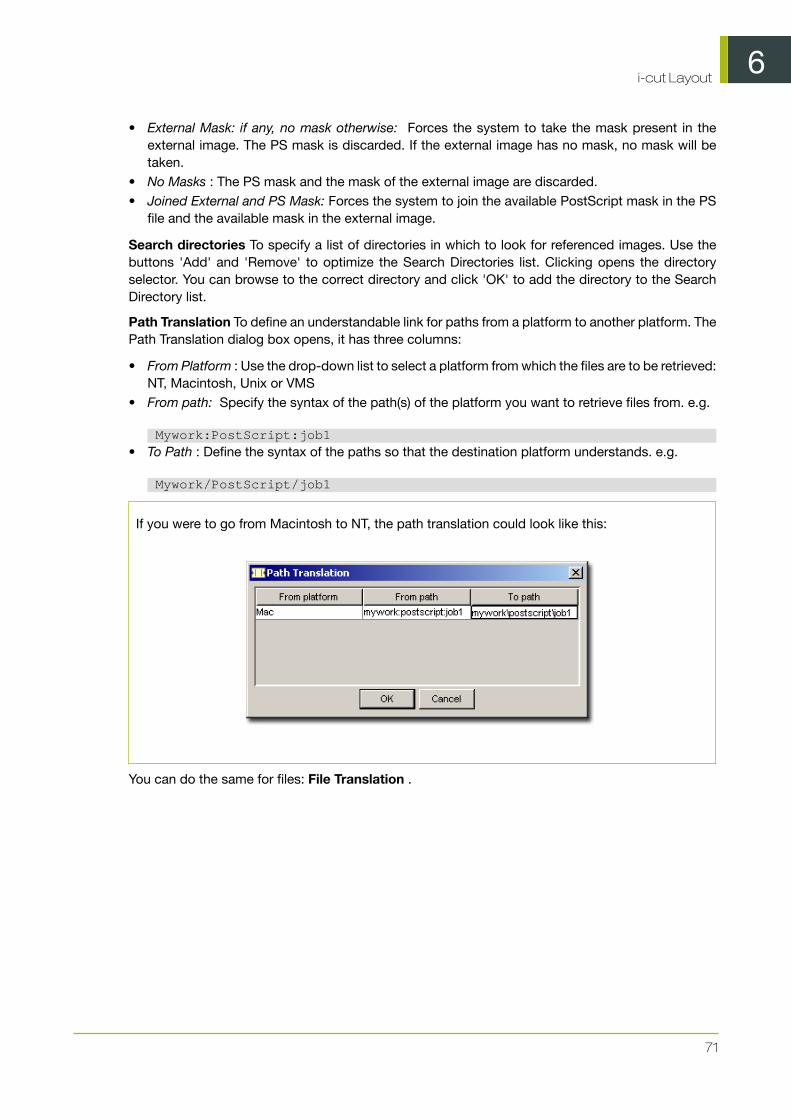
6i-cut Layout
71
• External Mask: if any, no mask otherwise: Forces the system to take the mask present in theexternal image. The PS mask is discarded. If the external image has no mask, no mask will betaken.
• No Masks : The PS mask and the mask of the external image are discarded.• Joined External and PS Mask: Forces the system to join the available PostScript mask in the PS
file and the available mask in the external image.
Search directories To specify a list of directories in which to look for referenced images. Use thebuttons 'Add' and 'Remove' to optimize the Search Directories list. Clicking opens the directoryselector. You can browse to the correct directory and click 'OK' to add the directory to the SearchDirectory list.
Path Translation To define an understandable link for paths from a platform to another platform. ThePath Translation dialog box opens, it has three columns:
• From Platform : Use the drop-down list to select a platform from which the files are to be retrieved:NT, Macintosh, Unix or VMS
• From path: Specify the syntax of the path(s) of the platform you want to retrieve files from. e.g.
Mywork:PostScript:job1 • To Path : Define the syntax of the paths so that the destination platform understands. e.g.
Mywork/PostScript/job1
If you were to go from Macintosh to NT, the path translation could look like this:
You can do the same for files: File Translation .
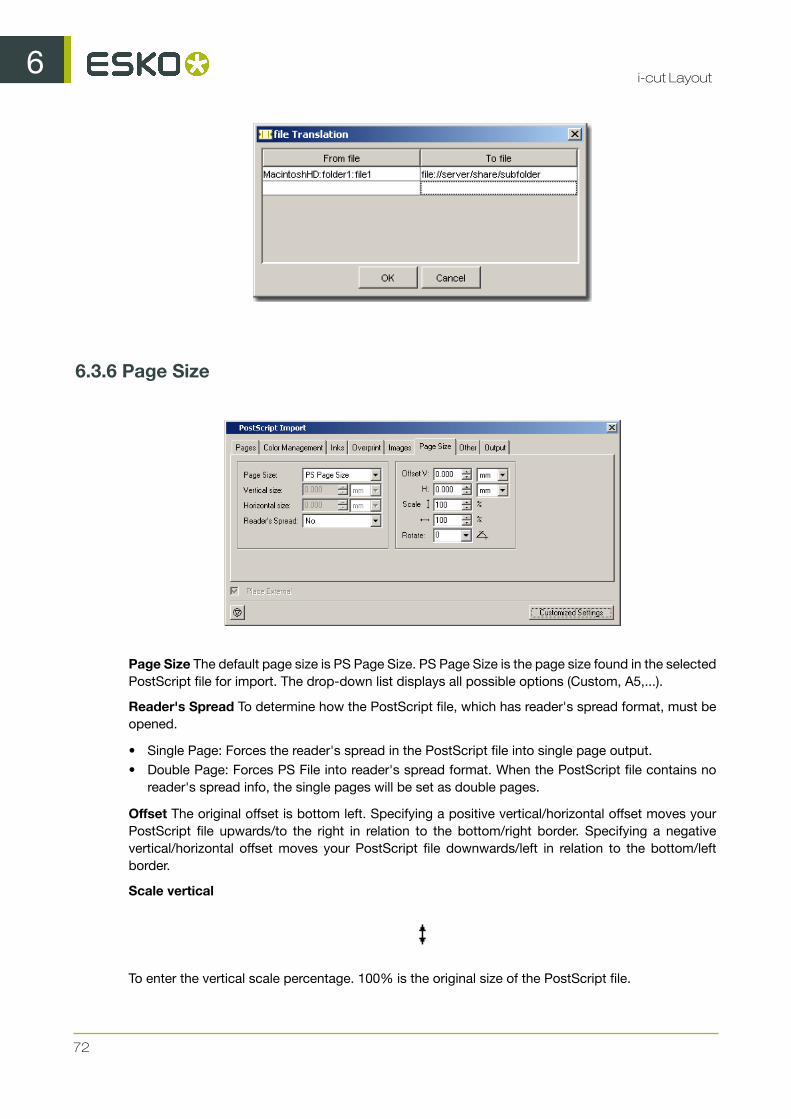
6i-cut Layout
72
6.3.6 Page Size
Page Size The default page size is PS Page Size. PS Page Size is the page size found in the selectedPostScript file for import. The drop-down list displays all possible options (Custom, A5,...).
Reader's Spread To determine how the PostScript file, which has reader's spread format, must beopened.
• Single Page: Forces the reader's spread in the PostScript file into single page output.• Double Page: Forces PS File into reader's spread format. When the PostScript file contains no
reader's spread info, the single pages will be set as double pages.
Offset The original offset is bottom left. Specifying a positive vertical/horizontal offset moves yourPostScript file upwards/to the right in relation to the bottom/right border. Specifying a negativevertical/horizontal offset moves your PostScript file downwards/left in relation to the bottom/leftborder.
Scale vertical
To enter the vertical scale percentage. 100% is the original size of the PostScript file.

6i-cut Layout
73
Scale horizontal
To enter the horizontal scale percentage. 100% is the original size of the PostScript file.
Rotate
Forces the system to rotate the PostScript File with the specified angle. The origin for rotation isbottom left. Possible angles in the drop-down list:
• 0: No rotation is to be performed.• 90: Forces to rotate over 90 degrees counterclockwise• 180: Forces to rotate over 180 degrees.• 270: Forces to rotate over 270 degrees counterclockwise.
6.3.7 Other
Substitute Missing Fonts Roman fonts by: choose a default replacement font for the missing fontsfor this job on your system.Japanese fonts by: choose a default replacement font for the missingfonts for this job on your system
Images Import 1-bit images as:
• Embed: Images become internal black and white bitmaps.• Linked file: Images are imported as external referenced LP files.• Contours: Images are contourized during import of the (E)PS file.
6i-cut Layout
74
CT display images Choose Yes to create a display image for the generated CT files on-the-fly.
Output file display images This option is activated when 'Split Up a MultiPage File' was activated.Select the type of display from the drop-down list: None, Thumbnail, Image.
Miscellaneous
Device resolution (xxx ppi)Device resolution is the resolution used internally by CertIn during thenormalization. Normally the produced output is not dependent of this internal resolution but in somerare cases like when converting RIP test strips or device specific tests it is important that this valueis the same resolution of the final RIP device which will be used to print output.
Virtual Memory Limit The default value for the virtual memory is 50MB. The limit is set to 1 gigabyte.
Convert text to contours will contourize all text.
Note:
Conversion might increase the file size.
Workaround Options
Skip Images Check this box to open the EPF file without linking to external images or convertingembedded images.
Preserve Quark trapping Forces the system to keep the trap strokes made by QuarkXpress.
Disable optimizations Vignettes recognition and optimization for Photoshop Multitone images areperformed (whenever possible) when this option is not activated. Sometimes after updating your DTPapplications, Esko can no longer perform the optimization and the conversion of the (E)PS file mightfail. Switching this option ON will allow you to import the (E)PS file.
Show PS comments All PS comments present in the (E)PS file are displayed on screen.
Disable OPI This option is valuable when you are importing (E)PS files of QuarkXpress containinghigh resolution Tiffs files for which the option 'Include tiff, omit ...' or 'Include all' was activated. In thiscase, when importing such a file and if Link External Images (page 5) is activated, the matching forthe TIFF files will surely fail. It fails because at the time the (E)PS file was generated OPI commandswere also inserted for the TIFF files. Therefore, the system will try to link to images for the Tiff files.To overcome this, activate Disable OPI.
Show external images searches Displays the path(s) in which the system has found and linked toexternal images.
Optimize Illustrator Patterns into PostScript patterns Illustrator writes patterns in a different waythan PostScript does, default behavior is that Illustrator patterns will be optimized. Normally thisspeeds up the further processing (less linework in your file) sometimes, though, the optimization itselfmay take some time.
Use PostScript rules for color conversion Check this box to make sure that all color managementwill happen using PostScript rules, in stead of BGCMS. Most options in the Color Managementtabsheet will be greyed out.
Recognize ArtScreen (lpi-angle) Check this box and the application will try to recognize screensthat are created in ArtPro applications and swap them to Esko-Graphics screens. If a (E)PS or PDF
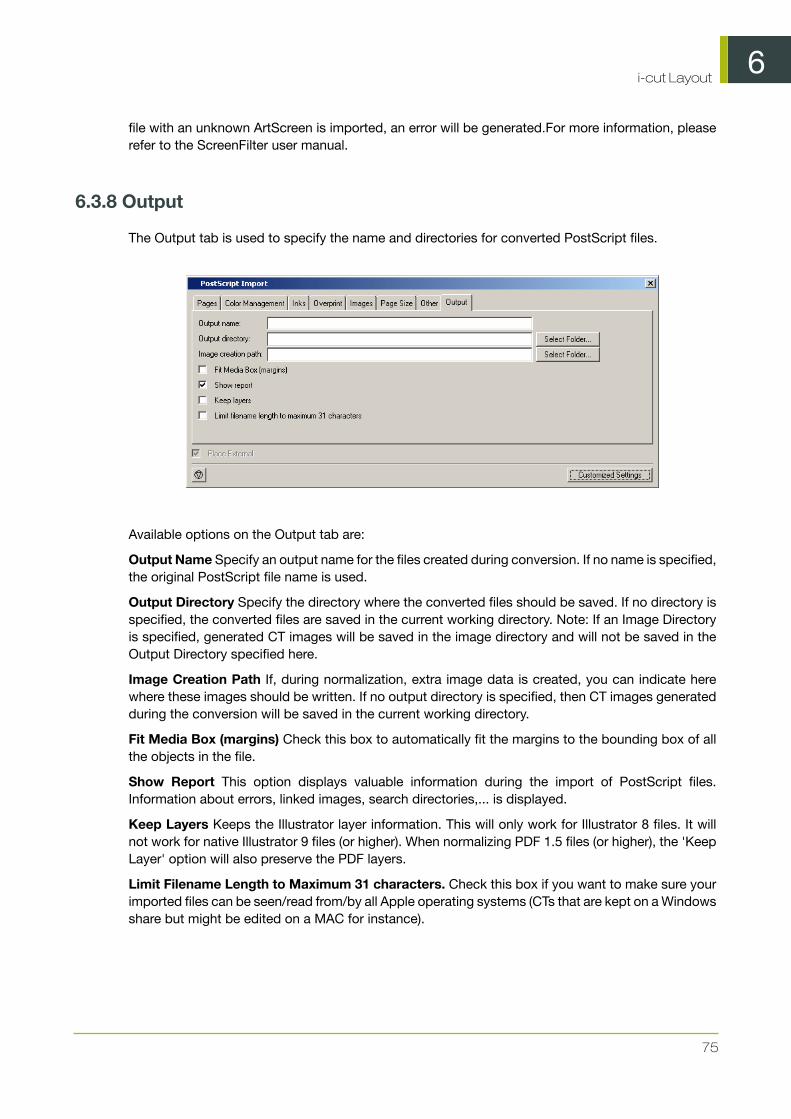
6i-cut Layout
75
file with an unknown ArtScreen is imported, an error will be generated.For more information, pleaserefer to the ScreenFilter user manual.
6.3.8 Output
The Output tab is used to specify the name and directories for converted PostScript files.
Available options on the Output tab are:
Output Name Specify an output name for the files created during conversion. If no name is specified,the original PostScript file name is used.
Output Directory Specify the directory where the converted files should be saved. If no directory isspecified, the converted files are saved in the current working directory. Note: If an Image Directoryis specified, generated CT images will be saved in the image directory and will not be saved in theOutput Directory specified here.
Image Creation Path If, during normalization, extra image data is created, you can indicate herewhere these images should be written. If no output directory is specified, then CT images generatedduring the conversion will be saved in the current working directory.
Fit Media Box (margins) Check this box to automatically fit the margins to the bounding box of allthe objects in the file.
Show Report This option displays valuable information during the import of PostScript files.Information about errors, linked images, search directories,... is displayed.
Keep Layers Keeps the Illustrator layer information. This will only work for Illustrator 8 files. It willnot work for native Illustrator 9 files (or higher). When normalizing PDF 1.5 files (or higher), the 'KeepLayer' option will also preserve the PDF layers.
Limit Filename Length to Maximum 31 characters. Check this box if you want to make sure yourimported files can be seen/read from/by all Apple operating systems (CTs that are kept on a Windowsshare but might be edited on a MAC for instance).
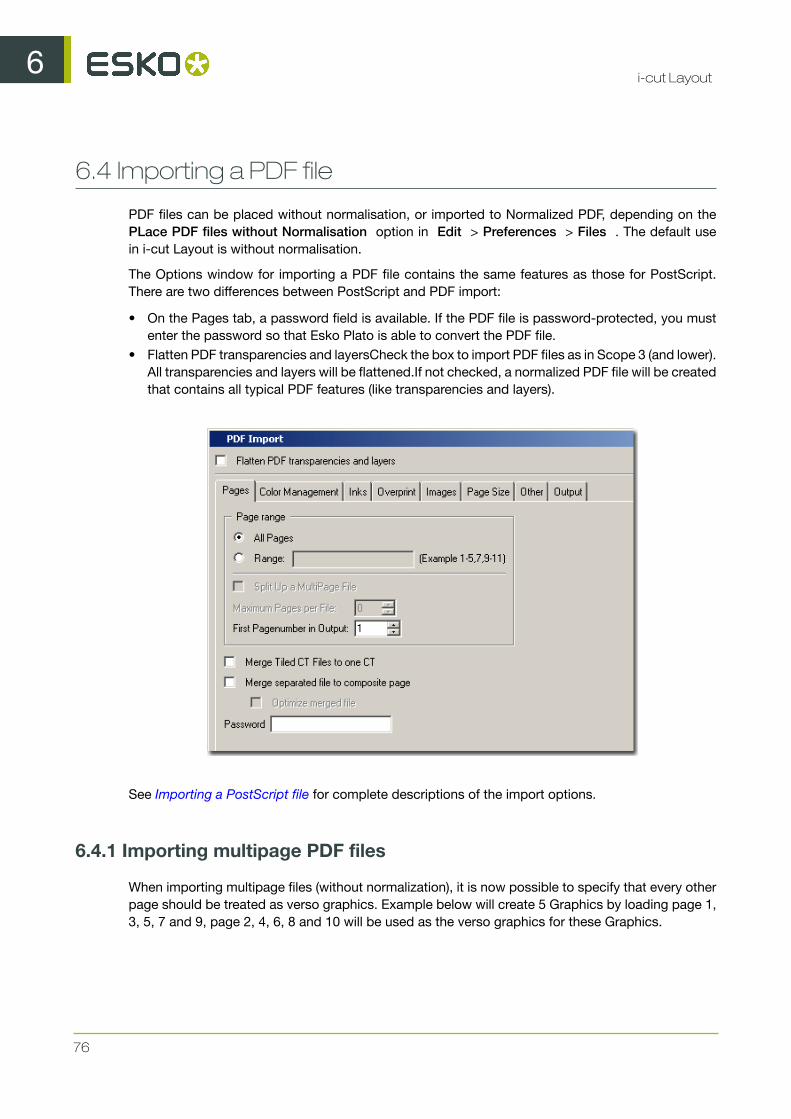
6i-cut Layout
76
6.4 Importing a PDF file
PDF files can be placed without normalisation, or imported to Normalized PDF, depending on thePLace PDF files without Normalisation option in Edit > Preferences > Files . The default usein i-cut Layout is without normalisation.
The Options window for importing a PDF file contains the same features as those for PostScript.There are two differences between PostScript and PDF import:
• On the Pages tab, a password field is available. If the PDF file is password-protected, you mustenter the password so that Esko Plato is able to convert the PDF file.
• Flatten PDF transparencies and layersCheck the box to import PDF files as in Scope 3 (and lower).All transparencies and layers will be flattened.If not checked, a normalized PDF file will be createdthat contains all typical PDF features (like transparencies and layers).
See Importing a PostScript file for complete descriptions of the import options.
6.4.1 Importing multipage PDF files
When importing multipage files (without normalization), it is now possible to specify that every otherpage should be treated as verso graphics. Example below will create 5 Graphics by loading page 1,3, 5, 7 and 9, page 2, 4, 6, 8 and 10 will be used as the verso graphics for these Graphics.

6i-cut Layout
77
6.5 Importing an EPS file
The Options for importing an EPS file contain some, but not all the same features as the PostScriptOptions window. In particular, the Pages and the Page Size tabs do not appear.
See Importing a PostScript file for complete descriptions of the import options.
6.6 Importing an Illustrator file
The Options for importing an Illustrator file contain some, but not all the same features as thePostScript Options window. In particular, the Pages and the Page Size tabs do not appear.
See Importing a PostScript file for complete descriptions of the import options.
6.7 Importing an EPF file
The Esko Prep File or EPF is designed to improve the connection between the designer (AdobeIllustrator) and the prepress department.
The Import dialog box has four tabs:
• Images• Other• EPF
6.7.1 Images

6i-cut Layout
78
Embed all images Select this toggle if you want to embed 8-bit and native images.
Link External Images (OPI, DCS, Helios, ...) Force the system to look for referenced images.
Fail if not Found Activate this option if you do NOT want the system to continue opening yourPostScript file when it cannot find an image. When this option is not activated the imported (E)PSfile will appear on screen but without the missing images.
Search forPreconverted Files : this option forces the system to look for the GRx, PDF, CT or LPequivalent for the original EPS file. If this equivalent is not found, it will use the EPS instead.
The Optimize DCS LineWork toggleWithout linework DCS optimization, the result after conversionof linework DCS files can be difficult to edit. However, it will be correct when viewed in extendedpreview or RIPped. 'Optimize DCS Linework' will do an additional operation to combine the elementson each DCS sheet to a composite and a more editable result.
Images Available options are:
• Use Most Recent: forces the system to use the existing images of a previous conversion of thesame job.
• Reconvert: forces the system to regenerate the images on-the fly.
Use Masks Available in the drop-down list are:
• PS Mask : Forces the system to take the PS mask present in the PS file. The mask available inthe external image is discarded. If no PS mask is present in the PS file, no mask will be taken.
• External Mask: if any, PS Mask otherwise: Forces the system to take the mask present in theexternal image. The PS mask is discarded. If the external image has no mask, but there is a PSmask available in the PS file, this PS mask will be taken.
• External Mask: if any, no mask otherwise : Forces the system to take the mask present in theexternal image. The PS mask is discarded. If the external image has no mask, no mask will betaken.
• No Masks : The PS mask and the mask of the external image are discarded.

6i-cut Layout
79
• Joined External and PS Mask: Forces the system to join the available PostScript mask in the PSfile and the available mask in the external image.
Search directories To specify a list of directories to look for referenced images. Use the buttons'Add' and 'Remove' to optimize the Search Directories list. Clicking the 'Add' button opens thedirectory selector. You can browse to the correct directory and click 'OK' to add the directory to theSearch Directory list.
Path Translation To define an understandable link for paths from a platform to another platform. IfThe Path translation dialog box opens, it has three columns:
• From Platform : Use the drop-down list to select a platform from which the files are to be retrieved:NT, Macintosh, Unix or VMS
• From path: Specify the syntax of the path(s) of the platform you want to retrieve files from. e.g.
Mywork:PostScript:job1 • To Path : Define the syntax of the paths so that the destination platform understands. e.g.
Mywork/PostScript/job1
Image Creation Path If, during normalization, extra image data is created, you can indicate herewhere these images should be written. If no output directory is specified, then CT images generatedduring the conversion will be saved in the current working directory.
6.7.2 Other
Images
Import 1-bit images as:
• Embed: Images become internal black and white bitmaps.• Linked file: Images are imported as external referenced LP files.• Contours: Images are contourized during import of the (E)PS file.
Miscellaneous
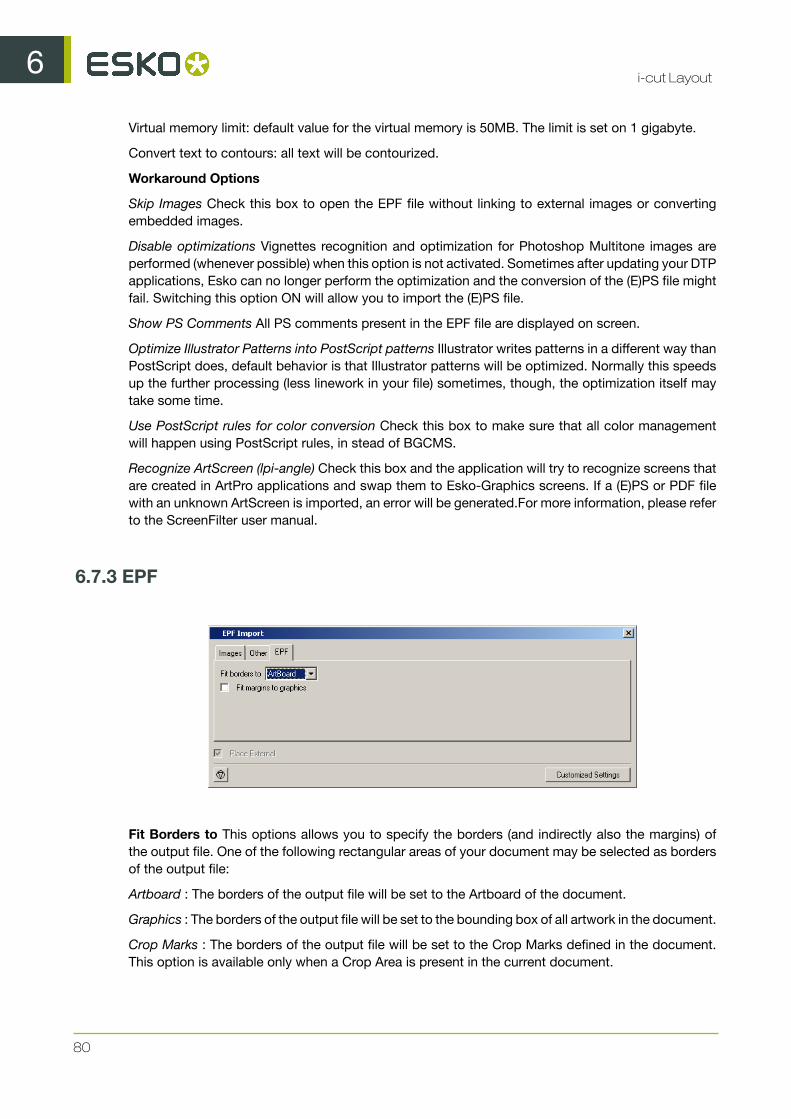
6i-cut Layout
80
Virtual memory limit: default value for the virtual memory is 50MB. The limit is set on 1 gigabyte.
Convert text to contours: all text will be contourized.
Workaround Options
Skip Images Check this box to open the EPF file without linking to external images or convertingembedded images.
Disable optimizations Vignettes recognition and optimization for Photoshop Multitone images areperformed (whenever possible) when this option is not activated. Sometimes after updating your DTPapplications, Esko can no longer perform the optimization and the conversion of the (E)PS file mightfail. Switching this option ON will allow you to import the (E)PS file.
Show PS Comments All PS comments present in the EPF file are displayed on screen.
Optimize Illustrator Patterns into PostScript patterns Illustrator writes patterns in a different way thanPostScript does, default behavior is that Illustrator patterns will be optimized. Normally this speedsup the further processing (less linework in your file) sometimes, though, the optimization itself maytake some time.
Use PostScript rules for color conversion Check this box to make sure that all color managementwill happen using PostScript rules, in stead of BGCMS.
Recognize ArtScreen (lpi-angle) Check this box and the application will try to recognize screens thatare created in ArtPro applications and swap them to Esko-Graphics screens. If a (E)PS or PDF filewith an unknown ArtScreen is imported, an error will be generated.For more information, please referto the ScreenFilter user manual.
6.7.3 EPF
Fit Borders to This options allows you to specify the borders (and indirectly also the margins) ofthe output file. One of the following rectangular areas of your document may be selected as bordersof the output file:
Artboard : The borders of the output file will be set to the Artboard of the document.
Graphics : The borders of the output file will be set to the bounding box of all artwork in the document.
Crop Marks : The borders of the output file will be set to the Crop Marks defined in the document.This option is available only when a Crop Area is present in the current document.

6i-cut Layout
81
The figure below illustrates the borders and margins of an output document as interpreted on anEsko system. The full black line represents the borders (corresponding to one or the above options)while the dotted black line indicates the margins of the document:
If the option Artboard or Crop Marks is selected, the margins of the input document will be definedimplicitly by the bounding box of all artwork in the document. If there is no artwork (partially) outsidethe Artboard (or Crop Area) then the top, bottom, left and right margins will be set to zero (no margins).In other cases the margins will be computed automatically to include artwork of the document.
6.8 Importing an Image file
Places an image but keeps it native. i.e. these file will not be converted to a CT file, even when thefile (containing the placed ones) is saved as a Esko native file. Image files can be Photoshop PSDfiles, EPS, JPEG or TIFF files.
Check Embed image to embed the image.
6i-cut Layout
82
Force to place 1–bit images as copydot image makes sure that Copydot optimization will beactivated when outputting to a Rip. If this toggle is not selected, the Rip will contourize the 1–bitimage (resulting slow performance or out of memory issues).
Caution:
The 1–bit image needs to be placed in blend mode Darken, when placed in blend mode opaque,the rip will still contourize.
6.9 Importing Nicks from i-cut Preflight
In i-cut Preflight 10.1, you can add Nicks to a cut path, and save the nick positions in the PDF file.When importing such a PDF graphic, these positions are loaded, and a message is displayed, e.g.Loaded 8 nicks using the default nick size .
To determine the nick size, i-cut Layout will look for the current substrate in the Substrate tab of theSheet Presets. See Sheet Presets
If the current substrate is not in that list, or if no nick size is defined for the substrate, the default sizeis used, as set in the Nick tool. See Nick Tool
6.10 Importing an XML from i-cut Automate
In i-cut Automate, you can use the Add Parameters for Nesting task to create an XML file, containinga link to the corresponding PDF file, and all necessary information such as number ordered, cut path,scale, etc.
These XML files can be send to a Nesting task, but in some cases, the XML files can be processedmanually in i-cut Layout, e.g.
• if the job doesn’t fit on the sheet size set in the Nesting task• if the due date is too close, and the maximum waste set in the Nesting task is exceeded• ...
To use an XML in i-cut Layout, you use the regular Add Graphic function, and browse for the XMLfile. The corresponding PDF file will be placed, and all information (number ordered, cut path, scale,etc) will be entered in the Graphics List.

7i-cut Layout
83
7. Manual Sheet Editing
Besides using all the SmartNest tools, you can create and edit your sheets manually
7.1 Placing a Graphic
The Add Graphic command is used to add an existing Graphic to a sheet in the Manual LayoutWorkflow. This command will place an existing Graphic in the lower left corner of the sheet. This is thedefault situation. The orientation can be set in Edit menu > Preferences > Defaults. Once a Graphichas been placed in the layout, you can use the Transform and Align tools to create your own layout.
To place a Graphic:
1. Create a new layout.2. On the Preparation menu, click 'Add Graphic'. The Place Graphic dialog box appears:

7i-cut Layout
84
3. Select the type of file that you would like to assign from the 'Files of type' list.
Tip:
It is possible to make a page selection. The default is to select page 1 of a PDF file (as well forthe front as for the back side). When creating the back side, i-cut Layout will automatically selectthe next page of the PDF file.
4. Select the Graphic file that you want to place.5. Click 'Open'.
You can also add a graphic manually, by clicking and dragging a graphic from the Graphics list ontothe canvas, and then use the transform / align tools.
7.2 Replacing a Graphic
You may want to replace certain Graphics on your sheet with a different Graphic. For example, youmight want to replace Graphics in a sheet layout that you did earlier with a new version. Or you maywant to replace specific Graphics to create a combination layout .
To replace a Graphic:
1. Select the Graphic(s) to be replaced.2. On the Preparation menu, click 'Replace by...'. Click Replace Graphic' to browse to an already
existing Graphic or select a Graphic directly from the drop-down list.
3. Select the type of file that you would like to assign from the 'Files of type' list.4. Select the new Graphic file to use.5. Click 'Open'.
The Graphics that you selected are replaced with the new Graphic. Any Graphics that were notselected for the Replace Graphic command remain the same.
7i-cut Layout
85
7.3 Arranging Objects
In the previous chapters you learned how to work with Graphics. You can start with a CAD layoutand assign Graphics to the layout. You can also place Graphics in the manual layout workflow. Youalso know how to adjust overlapping Graphics and how to number Graphics.
The rest of i-cut Layout's tools help you to complete your sheet layout. You can organize your workby using Layers. You can transform objects on the sheet using the Transform and Align windows. Andyou can create a layout using the Step-and-Repeat tools. These tools are the subject of this section.
7.3.1 Using Layers
i-cut Layout uses the concept of layers to build a file. Layers can be used in Graphics as well asin sheets. You can use layers to organize the objects in your document. i-cut Layout automaticallycreates some layers for you, but you can edit these layers or add your own. You can also createspecial layers, known as grid and markup layers. You can turn the display of layers on and off, locklayers, indicate that layer must not be printed and rearrange the order of layers.You can use multiplelayers to keep similar objects together. For example, you might want to put all your marks on onelayer and all Graphics on another. The Layer Browser helps you create and organize layers.
Objects in a Graphic can be placed on layers to make them easier to organize and edit. Similarly,objects in the sheet can be placed in different layers too.
You can have as many layers as you want. You can also name layers to help you remember whatobjects are on them and to make it easier for someone else to pick up where you left off. You canalso rearrange the order of layers.
Types of layers
i-cut Layout supports three types of layers: object layers, grid layers and markup grid layers. Objectlayers contain objects in the sheet. Grid and markup grid layers contain grids and guides to helpyou position objects.
Adding an object layer
Even though i-cut Layout makes some layers automatically, you will want to create your own layers.You can create your own layers and name them. To create a new object layer:
1. Open the Layer Browser by clicking 'Layer Browser' on the Window menu.2. Click the Add Layer button
A new layer appears. The new layer is selected and becomes the active layer.
7i-cut Layout
86
Deleting layers
You may want to delete a previously created layer. When you delete a layer, the layer and all objectsin that layer are deleted. You can delete any layer with the Delete Layer button. To delete a layer:
1. Open the Layer Browser by clicking 'Layer Browser' on the Window menu.2. Select the layer you want to delete.3. Click the Delete Layer button
The selected layer is deleted. You cannot delete the last object layer in a document.
Changing the name of a layer
You can change the name of layers to make their contents easy to remember. To change the nameof a layer:
1. Select the layer that you want to change.2. Click the name of the layer. The name becomes an edit field.3. Type in the name for the new layer.4. Press [Enter] on the keyboard to save the new name.
Changing the order of layers
One of the nice things about using layers is that it makes it easy to move groups of objects in frontof or behind others. You can change the order of the layers whenever you like and as often as youlike. So, you can move objects on top of other temporarily and then easily move them behind again.To change the order of layers:
1. Click and drag the layer to a new location in the list. The location that the layer will be movedto is highlighted.
2. Release the mouse button.
The layer is moved to the new location in the list. Objects in the layer now appear on top of objectson lower layers.
Moving objects to a different layer
To move objects from one layer to another, you use the Cut and Paste commands. When you use theCut (or Copy ) commands and then use Paste, the object is placed on the same location. To movean object to a different layer, you cut the object from its current layer, select a new layer and pasteit into the new layer. To move an object to a different layer:
1. Select the object(s) you want in a different layer.2. On the Edit menu, click 'Cut'.3. Make another layer the Active Layer by selecting it.4. On the Edit menu, click 'Paste'.

7i-cut Layout
87
The object is placed in the new layer on the same location from which it was cut.
Using a Grid Layer
Grid layers contain evenly spaced guides that can be used to align objects. You can specify thespacing of a grid layer. You can also create multiple grid layers, each with a different spacing. Youcan then turn these layers on and off as you need them.
To create a grid layer:
1. Open the Layer Browser by clicking Layer Browser on the Window menu.2. Click the Add Grid Layer button
The Grid dialog box appears:
3. Enter the spacing for the grid in the vertical and horizontal step fields. For a square grid, enterthe same number in each step field. You do not have to enter the same number in both fields;entering different numbers creates a rectangular grid.
4. Enter the start position of the grid in the offset fields. The default start position of the grid is at thecurrent origin. However, you can enter a different start position by entering values other than 0.
5. Click the close box on the Grid dialog box.
The grid layer is added to the Layer Browser. The grid appears in the document window as grey lineson the sheet. Depending on the grid size and your current zoom level, it may be hard to see the grid.Like other layers, you can change the order of grid layers in the Layer Browser. If you want to workwith the grid layer behind all your objects, move the grid layer to the back. If you want your grid layerto appear on top of all objects, move it to the top. You can also name a grid layer. If you want to workwith multiple grid layers, it is a good idea to name them so that you can easily identify each one.
Using a markup grid layer
A markup grid layer is a layer with guides that you can place wherever you want. The guides can beplaced numerically or interactively. The guides on markup grid layers are displayed in blue.
If you place a guide interactively, i-cut Layout creates a markup grid automatically. If you want tocreate guides numerically, you need to create a markup grid first and then enter the locations of theguides that you want to create.
To create a guide interactively:
1. Click and drag a guide from either the vertical or horizontal ruler.2. Release the mouse button to create the guide.

7i-cut Layout
88
If the Layer Browser is open, you will see that i-cut Layout has created a markup grid for this guideif there was none.
You can also create a markup grid numerically. You use the Mark-up dialog box to enter the exactlocation that you would like for the guide. You can also use the Mark-up dialog box to fine-tune theposition of a guide that you created interactively. Finally, opening the Mark-up dialog box makes itpossible to select, move and delete guides.
To create a markup grid numerically:
1. Open the Layer Browser by clicking Layer Browser on the Window menu.2. Click the Add Markup Grid Layer button
The Mark-up dialog box appears:
3. Select the tab for vertical or horizontal guides based on the type of guide you want to add.4. Enter the position for the guide in the field below.5. Press [Enter] to add the guide.6. Click the appropriate button to position the guide relative to the top-left corner of the sheet
, or relative to a crosshair
The guide you added is selected in the document window. When the Mark-up dialog box is open,you can select, move and delete the guides interactively from the document window. To delete aguide, select it and press [Delete].

7i-cut Layout
89
Automatically created layers
i-cut Layout can create some layers for you automatically. For example, a layer "CAD Layout" will becreated when you import a CAD layout into the sheet. All the crease and cut lines for the CAD layoutare placed in this layer.A “Graphic” layer will also be created when you place or assign Graphics onthe sheet. All Graphics are placed in this layer.
A “working area” layer is created when you specify margins in the layout setup.
You are not restricted to using these layers. They are created to help you organize your work. Otherobjects can be placed in these layers too. For instance, you can place marks in the Graphic layer.
7.3.2 Using To Front/To Back
Four commands on the Arrange menu help you order the objects in a layer. These are: To Front,Forward, Backward, and To Back.
To move an object to the top of all other objects on the current layer:
1. Select the object(s) that you want in front.2. On the Arrange menu, click To Front.
To move an object one step up within the current layer:
1. Select the object(s) that you want to move forward.2. On the Arrange menu, click Forward.
To move a object one step down within the current layer:
1. Select the object(s) that you want to move backward.2. On the Arrange menu, click Backward.
To move an object to the bottom of all other objects on the current layer:
1. Select the object(s) that you want in the back.2. On the Arrange menu, click To Back.
Remember that these commands move objects forward and backward in a layer. If you use thesecommands to bring an object to the front and there still may be objects in front of it, the front objectsare located in a different layer.
7.3.3 Using the Transform Window
You can transform objects numerically with the Transform window. To transform object interactively,use the Transform tool . The Transform window provides two features. First, the Transform windowprovides you with information about the currently selected object. This information includes thelocation, size, rotation and scaling of the selected object. Secondly, the Transform window allowsyou to numerically transform an object by changing this information.
You numerically transform objects by selecting them, choosing a current point if necessary, andentering specific values in the Transform window. To move an object to a specific location:

7i-cut Layout
90
1. Select the object.2. In the Transform window, select the current point that you want to locate.3. Type a new location into the 'Location' fields.4. Press [Enter] to make the change.
The current point of the selected object is moved to the vertical and horizontal location that youentered.
To enter a specific height and/or width for an object:
1. Select the object.2. Type the height and/or width for the object in the Size fields.3. Press [Enter] to make the change.
The selected object is scaled to the size that you entered for the height and/or width.
To rotate an object by a certain angle:
1. Select the object.2. Type an angle for the object in the Angle field.3. Press [Enter] to make the change.
The selected object is rotated to the angle that you entered. By default, rotations of objects occuraround the center of the object. If you want the object to rotate around a different point, you needto move the point of origin. See Moving the point of origin.
To scale an object as a percentage of current size:
1. Select the object.2. Type a percentage in the vertical and/or horizontal Scale fields.3. Press [Enter] to make the change.
The selected object is scaled to the percentage(s) that you entered into the Scale fields. You canscale an object proportionally by entering the same percentage in both fields. You can scale an objectnon-proportionally by entering a different value in the each field.
7.3.4 Using the Align Window
You use the Align window to align objects to the center of the sheet or to a single other object. Twoof the functions of the Align window align objects to the center of the sheet. The other functions ofthe Align window align objects to one another.
Aligning objects to one another uses both red selection and green selection. A green selection is a"locked"; a red selection is moved to align with the green selection.
Like the Transform window, the Align window uses the die of the current selections, if there is one,to align the objects.
Aligning objects with the Align Window
You align objects with the Align window by selecting objects and pressing the appropriate button.To align an object to the center of the sheet:
1. Select the object that you want to align.
7i-cut Layout
91
2. Press the one or both of the 'Align to Sheet' buttons in the Align window.
Pressing both buttons one after the other aligns the object to the exact center of the sheet. Pressingonly one of the buttons aligns the object in that direction only.
To align two objects by the same attribute:
1. Select the object that you want to align to.2. Press [Insert] to make the selection green.3. Select the object that you want to align.4. Press the appropriate Align by Attribute button in the Align window.
Pressing more than one button after another performs multiple alignment commands. For example,pressing 'Align Middle' followed by 'Align Center' will align the exact center of the red selection tothe exact center of the green selection.
To align two objects edge to edge:
1. Select the object that you want to align to.2. Press [Insert] to make the selection green.3. Select the object that you want to align.4. Enter a Gap in the appropriate field, if desired.5. Press the appropriate Align Edge to Edge button in the Align Window.
The Align Edge to Edge commands use the nearest opposite edge to determine which way to movethe red selection. Before using these options, arrange the objects so that the edges that you arealigning are in the relationship that you want. You don't have to be entirely accurate (or even close),i-cut Layout just needs to be able to clearly identify which edges that you want to align.
Align Window Tips
• The Align Window uses one object that is locked (the green selection) to align the other objects.It is a good idea to have the green selected object in the right location before starting with theAlign options.
• After using the Align commands, you can still move the objects around the sheet. But, if you wantthese objects to preserve their relationship with one another, you have to make sure that youselect and move them together. A good way to maintain the alignment parameters is to use theGroup command immediately after. Then the objects that you aligned will always be selected andmoved as a single object.
• The Align commands also work with multiple selections. This makes it easy to align several objectsat one time, with a single command.
Aligning in the Graphic View
The Align window also works in the Graphic View. However, the 2 centering features of Align donot center objects on the sheet, since a Graphic has no sheet. Instead, these 2 options center anobject on the current die. You should also remember that Align works with all types of objects inboth the Sheet and the Graphic View. So, you can use Align to align a graphic or a SmartMark withthe current die.

7i-cut Layout
92
7.4 Two-sided Printing
When preparing sheets for two-sided printing, you need to take the following steps:
• Set up Graphics with a back side. See Two-sided Graphics• Generate the necessary layouts for the front side• Generate the back side for every sheet. See Two-sided sheets• Export the PDF and icut files for the sheets.
7.4.1 Two-sided Graphics
i-cut Layout can create the back of a sheet layout from the front for two-sided printing. When i-cutLayout creates the back side of the sheet, the back side of each graphic is inserted automatically.You need to create a two-sided graphic in the Graphic View to create a two-sided sheet for printing.
To create a back side from the front, there are two ways:
In the Graphics tab:
1. Click Back Name for the Graphic you want to add a Back Side.2. Select the file to be used as the back side graphic.
In the Graphic Settings:
1. Open the Graphic Settings. See Graphic Settings2. Select the Back tab.3. Select Use same graphic on back to set the same graphic for the front and the back side. In this
case you can use Flip Horizontally to mirror the graphic on the back side4. You can select another Graphic to be used on the back side, by setting the Type : either a File or
a Placeholder (see Working with Placeholders), setting or selecting the Name of the file, or usethe browse button to select (another) file.
You complete the back side the same way that you did the front.The cut path of the front isautomatically mirrored to the back.
Tip:
• If the graphic that you are using is multi-page, the back side will be created with the subsequentpage. If this is not the graphic that you want, delete it and import a different graphic for the backside.
• If you have used the Create Bleed Mask tool to create a mask on the front side of the Graphic,this mask is included on the back side. If you do not want the same mask on the back, use theCreate Bleed Mask tool to create a different mask for the back side of the Graphic.
7i-cut Layout
93
Note:
If you receive a file that contains the front and the back of a Graphic and the bounding box of the frontand back are not well-aligned, or i.o.w are not positioned in relation to the center, you are stronglyadvised to fit the trim box on the cut path.
7.4.2 Two-sided sheets
i-cut Layout can create the back of a sheet layout from the front for two-sided printing.
In the Document Setup, you define if you want to Turn or Tumble: . See Document Setup
• Turn rotates the sheet around the vertical center of the sheet. The left edge of the sheet becomesthe right edge of the sheet on the back.
• Tumble rotates the sheet around the horizontal center of the sheet. The top of the sheet becomesthe bottom of the sheet on the back.
If one of the placed Graphics has a back side, when finding layouts, the back side will be generatedas well. See Finding Layouts
When the back side of the sheet is created, the position of the Graphics is mirrored for accurate front-to-back alignment. The back side of the Graphics is automatically inserted to create the printing onthe back side. If you move a Graphic on the front side, the back side will be updated automatically.
You can also use the Turn Front to Back and Tumble Front to Back commands on the Tools menuto create the back side of a sheet manually.
To create a back side from the front manually:
1. On the Tools menu, click 'Turn Front to Back' or 'Tumble Front to Back'.2. The back side of the sheet is automatically created. i-cut Layout's view changes to the back side
of the sheet.
7.5 Managing Inks
i-cut Layout has several tools that help you manage the inks in your document. You can use thesetools to display the individual separations of the document or to add or modify inks.
Caution:
Note that it is impossible to edit or delete inks in Graphic View mode.
7.5.1 Working with inks
Use the Inks window to add and edit inks in a document. You can add inks, delete inks, set thescreen ruling, angle and dot shape of the inks, and set the order of the inks in your document.
7i-cut Layout
94
Adding inks
You add and delete inks in the Inks dialog. You can have any number of inks, of any type in adocument. There are three groups of inks: Process Inks, PANTONE Inks and Designer Inks. The wayin which you add an ink depends on the ink that you want to add.
To add a Process ink :
1. Click in the ink name field for the empty ink.2. Type the letter for the process ink you want to add. Type C for Cyan, M for Magenta, Y for Yellow
and K for Black.3. Press [Enter].
To add a PANTONE ink :
1. Enter the PANTONE ink number.
You cannot delete inks that are used in external references, like Graphics. However, you can map anink in an external reference to another ink in the job. You can also choose not to print the ink.
Changing the order of the inks in a document
The order of the inks in the document determines how an ink is displayed and the order in which theseparations are printed. For these reasons, you may want the inks in a particular order.
To change the order of the inks:
1. Click and drag the ink to a new location.2. Release the mouse button.
To set the order of the inks based on darkness:
1. Make sure that the Inks window contains all the inks you want in your document.2. On the fly-out menu, click 'Sort Light to Dark...' or 'Sort Dark to Light...'. The inks are reordered
based on the option you choose.
Changing the screen parameters of an ink
You can set the screening parameters for the inks in your document in the Inks dialog box. Theseparameters include screen ruling, screen angle and dot shape. To set the screen ruling for an ink:
1. Click the screen ruling field for an ink. The contents of the field are highlighted.2. Enter a new screen ruling.3. Press [Enter].
To set the screen angle for an ink:
1. Click the screen angle field for an ink. The contents of the field are highlighted.2. Enter a new screen angle.3. Press [Enter].
To set the dot shape for an ink:
1. Click the screen dot shape field for an ink. The contents of the field are highlighted.

7i-cut Layout
95
2. Enter a new screen dot shape.3. Press [Enter].
Cleaning up unused inks in a document
Your document may contain inks that are no longer being used. For example, you may have replacedGraphics on the sheet with Graphics that use different inks. The old inks from the previous Graphicsmay still be contained in the document even though they are no longer being used.
To clean up unused inks:
1. Open the Inks dialog box.2. On the fly-out menu, click 'Remove Unused Colors and Inks'.
8i-cut Layout
96
8. Working with SmartMarks
8.1 What are SmartMarks?
SmartMarks are marks used as production controls that automatically update based on changes tothe sheet size, the sheet size and the number of inks on the sheet.
You add SmartMarks to your sheet or Graphic using the SmartMarks tool on the Production menu.You can add as many marks as you like to your job. You can also add multiple copies of a mark to thesame job. If you have marks that you add to every job, you can save the collection as a SmartMarkSet. A set can be added to a job to place several marks all at once, or you can make it active, so itwill be applied on every new layout you generate.
What is a Mark
All of the SmartMarks that you add using the SmartMark tool are based on mark macros. Macros arescripts that are executed to create the marks that you have specified. So instead of simply drawingan object, you select a script (e.g. a rectangle mark) and specify some parameter settings (e.g. drawin center of sheet in registration ink).The mark scripts are executed at certain times to make surethat they are completely up-to-date with the current job. For example, when you save or open a filecontaining SmartMarks, the marks are executed. Other actions also cause marks to be executed,like adding an ink or changing an ink's definition.
What is a Set
A set is a collection of marks that you save using the SmartMarks window. A set can contain anynumber of SmartMark mark definitions. After saving a set, you can apply all the marks in that set bypicking its name from a list of available sets. Like the marks themselves, you can create and save asmany sets as you like. This way, you can create a customized set of marks that are used for differentcustomers, different printing presses and different printing processes.
8.2 Using SmartMarks
SmartMarks are easy to use. Click Production > SmartMarks , or click SmartMarks in the statusbar, and you can begin to add marks.
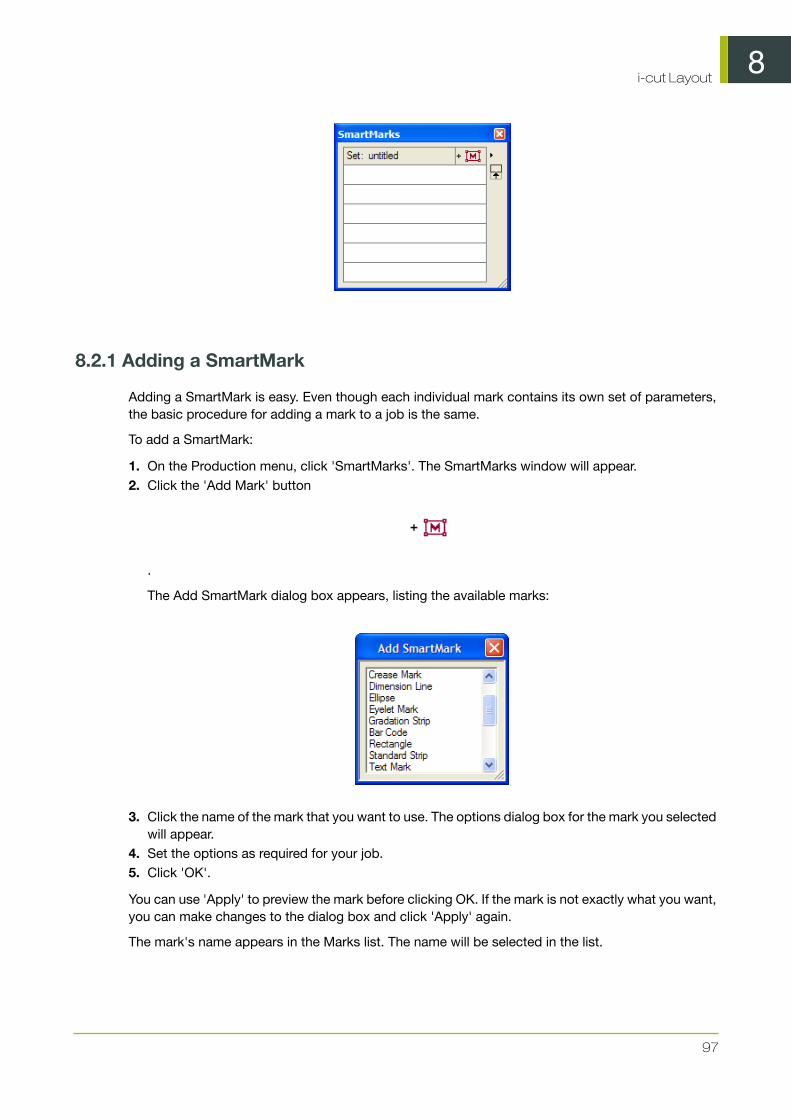
8i-cut Layout
97
8.2.1 Adding a SmartMark
Adding a SmartMark is easy. Even though each individual mark contains its own set of parameters,the basic procedure for adding a mark to a job is the same.
To add a SmartMark:
1. On the Production menu, click 'SmartMarks'. The SmartMarks window will appear.2. Click the 'Add Mark' button
.
The Add SmartMark dialog box appears, listing the available marks:
3. Click the name of the mark that you want to use. The options dialog box for the mark you selectedwill appear.
4. Set the options as required for your job.5. Click 'OK'.
You can use 'Apply' to preview the mark before clicking OK. If the mark is not exactly what you want,you can make changes to the dialog box and click 'Apply' again.
The mark's name appears in the Marks list. The name will be selected in the list.
8i-cut Layout
98
Whenever a mark name is selected in the SmartMarks window, the mark that is created by that markwill also be selected in the document window. This helps you to identify which mark definition createsa particular mark in the job.
8.2.2 Deleting a SmartMark
You can delete a SmartMark in various ways. First, you can simply select it in the document windowand delete it like you would any other object. When you delete a SmartMark from the documentwindow, its definition is deleted automatically from the SmartMark list of Current Marks.
You can also delete a SmartMark from the SmartMarks window:
1. In the SmartMarks window, click the name of the mark that you want to delete.2. Choose 'Delete' from the fly-out menu.
Tip:
You can delete more than one mark from the 'Current Mark' list by holding [CTRL] to select morethan one name at a time.
8.2.3 Editing a SmartMark
After you have created a SmartMark, you may want to edit it later. There are two ways that you canedit an existing SmartMark.
First, you can open the mark's options dialog box by double-clicking the mark in the documentwindow. The mark options dialog box will appear. Make any changes and click 'OK' to update themark in the document window.
You can also edit a SmartMark from the SmartMarks window:
1. Select 'SmartMarks' on the Production menu. The SmartMarks window appears.2. In the SmartMarks window, click the name of the mark that you want to edit, and click 'Options'
in the fly-out menu, or just double-clck it, The mark options dialog box will appear.3. Edit the parameters and click 'OK'.
You can also double-click a mark name in the SmartMarks window or the mark object in the drawingwindow to open the option dialog box for that specific mark.
8.2.4 Creating and saving a set
If you regularly create jobs that use the same marks, you can save time by creating a set that containsall these marks. Each mark of a set can be applied in one step by selecting it from the Mark Set list.
To create and save a Mark Set:
1. In the SmartMarks dialog box, add all the marks that you would like to have included in your set.2. On the fly-out menu, click 'Save Set'.3. Enter a name for the Set and click 'OK'.

8i-cut Layout
99
Note:
If you save a Set, it will automatically become active. See Using a set
8.2.5 Using a set
Once you have defined a SmartMark set, its name will appear in the Mark Set list. To use it, simplyselect its name from the list. The marks in that set will be applied to the current job.However, it mightoccur that you want to keep existing marks that are already present in the job while adding marksfrom a set. If this is the case, you should use 'Load Set' to add the marks of a set to existing marksthat are already in the job.
If a set is active, its name will be shown in the bottom Status bar, and the SmartMarks defined in theset will be applied automatically when generating a new Layout.
8.2.6 Replacing and editing a set
Replacing a set
If you have used a set in a job and want to use a completely different set, simply open another set.Opening a different set will remove all the marks from the previous set and replace them with marksfrom the new set.
Editing a set
Editing a set is done by loading the set, making the required changes, and saving the set again. Ifyou want to use an existing set as the basis for a new set, you can load the existing set, make therequired changes and use 'Save As' on the fly-out menu. Using 'Save As' creates a new set witha different name.
8.2.7 SmartMarks in the Graphic View
When using SmartMarks in i-cut Layout, the reference point in the marks dialog boxes is based onthe sheet. In the Graphic View, there is no sheet; in this case the reference point is based on theborders or the margins.
In the Graphic View, the borders are set to the bounding box of the current die. So, you can attachSmartMarks to the die of the Graphic.
The Margins of a Graphic are set to the bounding box of all the objects in the Graphic, includingthose that are outside the die. So, if you have other elements, like Geometry Marks that are locatedoutside the die, the Margins are fit to include them. See Setting the location of a SmartMark .
8.2.8 Setting Inks in SmartMarks
Most SmartMarks offer the following options to define the Ink to be used for the marks:

8i-cut Layout
100
Ink
• Registration• Darkest• Black or Darkest• Black• Knock Out• Custom Ink allows to pick any number of inks, either by name or by position (in the inks list).• Custom Color allows you to pick a color, based on the ink name, ink number or color name.
Overprint
• Opaque• Darken• PostScript• Add• Reverse: Knocks out the selected ink in the underlying separation. If you select for instance
Magenta, it will be knocked out in the Magenta separation.
Ignore Similar Inks : This option becomes available when you selected Registration ink
Tip:
This is useful when you have similar inks in your job, e.g. two cyans with a different angle, and youwant to step all the inks but you only want to have one cyan.
Ignore Technical Inks : Technical inks will not be used in the SmartMark. This option becomesavailable when you selected Registration ink. Technical Inks are inks used for technical data, suchas e.g. an "ink" to define all cut paths. These inks are usually not printed. An ink can be marked"Technical" in the ink dialog.
Ignore Varnish Inks : Varnish inks will not be used in the SmartMark. An ink can be marked "Varnish"in the ink dialog.
Custom Color in SmartMarks
When you select a Custom Color ink from the Ink dropdown list, you can define a color and use itafterwards in a SmartMark. Custom color inks can be applied e.g. in text marks.

8i-cut Layout
101
Click 'Define Color...' to define a custom color. Custom colors can be defined in four ways:
• By Ink Number• By Ink Name• By Color Name• Random CMYK color
Ink Numbers
To define a Custom Color by means of an ink number, select 'Ink Numbers' from the dropdown list.The inks that are used in the current document are displayed. Activate the ink by clicking the "check"area in front of the ink and its value will be set to 100%. You can click the value if you want to changethe percentage. The color patch will show you the resulting color.

8i-cut Layout
102
You can drag a color swatch from the Colors palette to the color sample at the top right of the dialogbox and the list in the "Define Color" dialog box will be updated immediately.
When building SmartMarks using a custom color in an empty document, the color patch shows thecolor "unknown".
Ink Name
When you select Ink Name from the dropdown list, only the inks that are used in the current documentare displayed. Activate the ink by clicking the "check" area in front of the ink and its value will be setto 100%. You can click the value if you want to change the percentage. The color patch will showyou the resulting color.

8i-cut Layout
103
Color Name
All named colors are displayed in the list. Select one of them by selecting the button in front of thecolor. To create a new color, you can simply drop a color from the Colors palette on the patch. Thiscolor will be added to the list and gets a default name (Color 1, Color 2, ...). The color name willalso be displayed in the Colors palette. At any time you are able to change this name in the "DefineColor" dialog box. When changing the name in the 'Define Color' dialog box, the Colors palette willupdated automatically.
Random CMYK color
Choosing "Random CMYK color" will result in a random CMYK color.

8i-cut Layout
104
When entering a Random based on value, either manually or using SmartNames, the random CMYKcolor will be based on this value. Using the same value again, will result in the same (random) color.You can use this e.g. to have files from the same folder to use the same (random) color for the Texton Cut Path SmartMark.
8.2.9 Setting the location of a SmartMark
You specify the location for most SmartMarks using a 9-point selector similar to the one that is usedin the Transform dialog box. Here is an example of the Standard Strip mark:
In the left half of the dialog box, you set the location for the mark. The red selector represents thereference point on the mark; the blue selector represents the reference point in the job.
The reference point in the job is selected by position. In Esko Plato, a SmartMark can be attachedto a sheet, a sheet, visible objects (= bounding box of all printable objects except SmartMarks), or'Position Marks'. In the Graphic View, a SmartMark can be attached to the borders, the margins, tovisible objects' (= bounding box of all printable objects except SmartMarks), 'Position Marks', or tothe 'General' level.
You click and drag the mark's red selector to align any of its 9 points to any of the 9 points on thejob. In the dialog box above, the upper left corner of the mark will be aligned with the upper leftcorner of the sheet.
Once you have set the reference point for a mark, you can specify an offset from this point usingthe vertical and horizontal offset fields. Both positive and negative offsets are allowed.
8i-cut Layout
105
You set the orientation of the mark by selecting one of the 5 orientation options.
8.3 Supplied SmartMarks
SmartMarks are very easy to use. The mark Options dialog boxes allow you to set the location andink usage for the mark. This section describes each of the marks that are supplied with i-cut Layout.
Note:
i-cut Layout is installed with a base set of SmartMarks. If another EskoArtwork application (e.g.PackEdge, Plato, ...) was installed on your workstation, the list of registration marks that wereavailable in that application will also be available as SmartMarks.
There are 6 SmartMarks specific for i-cut Layout:
• i-cut Marks• Waste Divider• ARS mark• Eyelet Mark• Text on Cut Path• Fotoba Mark
There are 4 general SmartMarks installed with i-cut Layout:
• Image Mark• Rectangle• Bar code• Text Mark
8.3.1 i-cut Marks
i -cut marks are added to the layout in order to make sure that the cut contour perfectly matches theprinted graphics. i -cut marks are a type of registration marks which will be scanned by the camerasystem on the i -cut-enabled Kongsberg table.

8i-cut Layout
106
Mark
The marks tab consists of two parts.
The top part allows you to specify the parameters of the marks.
Type : Select the type of mark you want to add to the layout. You can choose between a filled circleor an outlined circle with a knockout white center.
Size : Select the size of the mark (diameter).
Stroke width : Select the appropriate stroke. This option will only be active if an outlined circle hasbeen selected from the type list.
Distance : Specify the minimum distance between the marks and the cut path.
Note:
The Place Mark tool allows you to manually add marks. The pointer will assume a differentshape, depending on the selected type. When pressing Ctrl, a plus sign will be indicated next to thepointer and the mark will be placed on all copies of the selected Graphic.
When placing marks manually, the cursor will snap to positions that take into account the distance
from the cut path, as set in the 'distance' option
The bottom part of the dialog allows you to specify the position of the i -cut marks.
Nested Layout : Five marks are generated, four of which will be put on the four corners of thebounding box of all cut paths. A fifth mark is added to make sure that the position is not symmetricalin order to be able to detect possible rotations.
Around Each Graphic's Cut Path : Select this option to positon i-cut marks around the differentcut paths. The marks will be distributed over the entire sheet as evenly as possible. The 'Distance'specified above is taken into account as marks are being positioned on the given distance from thecut path. i-cut Layout will try to guarantee a minimal distance between the individual marks.
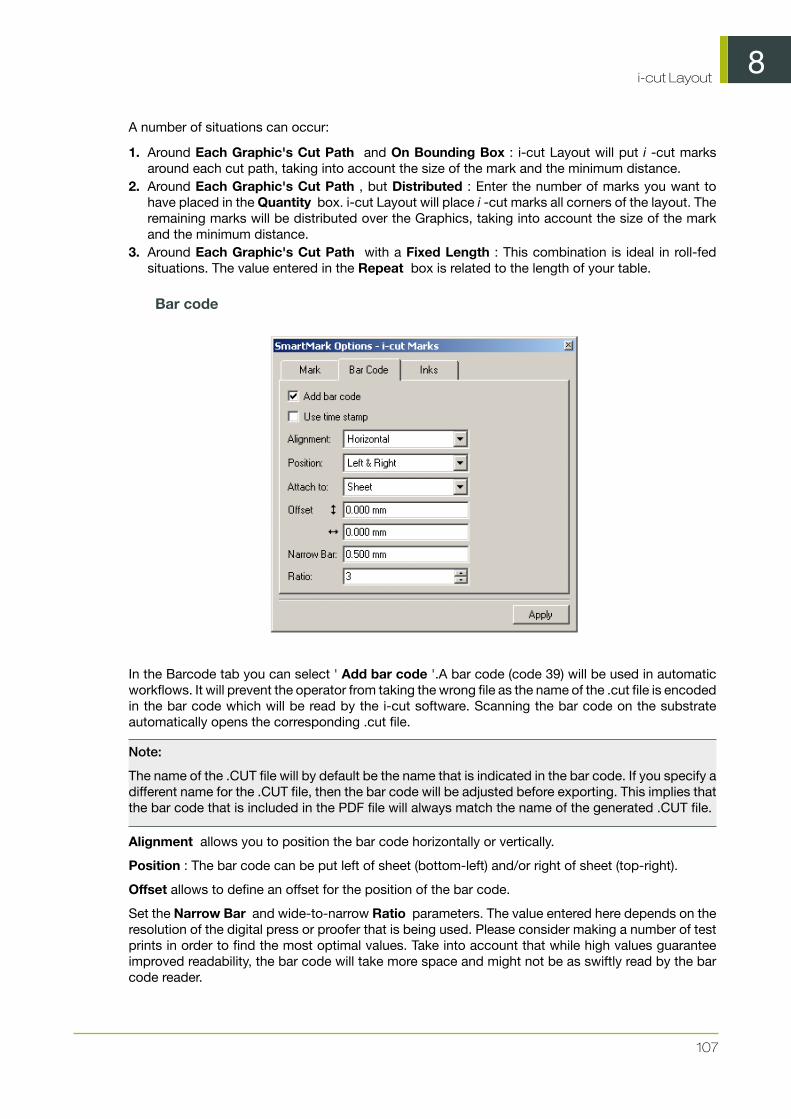
8i-cut Layout
107
A number of situations can occur:
1. Around Each Graphic's Cut Path and On Bounding Box : i-cut Layout will put i -cut marksaround each cut path, taking into account the size of the mark and the minimum distance.
2. Around Each Graphic's Cut Path , but Distributed : Enter the number of marks you want tohave placed in the Quantity box. i-cut Layout will place i -cut marks all corners of the layout. Theremaining marks will be distributed over the Graphics, taking into account the size of the markand the minimum distance.
3. Around Each Graphic's Cut Path with a Fixed Length : This combination is ideal in roll-fedsituations. The value entered in the Repeat box is related to the length of your table.
Bar code
In the Barcode tab you can select ' Add bar code '.A bar code (code 39) will be used in automaticworkflows. It will prevent the operator from taking the wrong file as the name of the .cut file is encodedin the bar code which will be read by the i-cut software. Scanning the bar code on the substrateautomatically opens the corresponding .cut file.
Note:
The name of the .CUT file will by default be the name that is indicated in the bar code. If you specify adifferent name for the .CUT file, then the bar code will be adjusted before exporting. This implies thatthe bar code that is included in the PDF file will always match the name of the generated .CUT file.
Alignment allows you to position the bar code horizontally or vertically.
Position : The bar code can be put left of sheet (bottom-left) and/or right of sheet (top-right).
Offset allows to define an offset for the position of the bar code.
Set the Narrow Bar and wide-to-narrow Ratio parameters. The value entered here depends on theresolution of the digital press or proofer that is being used. Please consider making a number of testprints in order to find the most optimal values. Take into account that while high values guaranteeimproved readability, the bar code will take more space and might not be as swiftly read by the barcode reader.
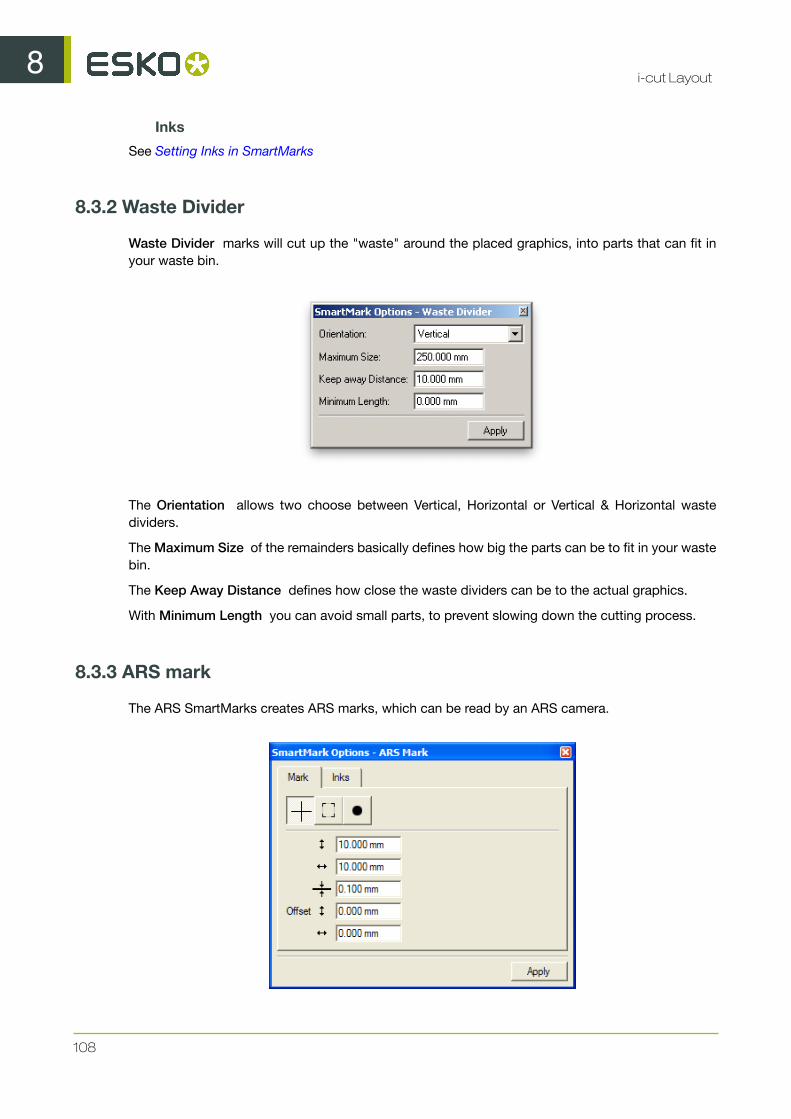
8i-cut Layout
108
Inks
See Setting Inks in SmartMarks
8.3.2 Waste Divider
Waste Divider marks will cut up the "waste" around the placed graphics, into parts that can fit inyour waste bin.
The Orientation allows two choose between Vertical, Horizontal or Vertical & Horizontal wastedividers.
The Maximum Size of the remainders basically defines how big the parts can be to fit in your wastebin.
The Keep Away Distance defines how close the waste dividers can be to the actual graphics.
With Minimum Length you can avoid small parts, to prevent slowing down the cutting process.
8.3.3 ARS mark
The ARS SmartMarks creates ARS marks, which can be read by an ARS camera.

8i-cut Layout
109
Mark
There are 3 types of ARS marks available: a cross, an a corner and a circle. You can make thefollowing settings:
• Horizontal size, Vertical size and line thickness for the cross and corner shaped ARS marks, orthe circumference for the circle ARS mark
• The offset, both vertical and horizontal.
Inks
See Setting Inks in SmartMarks
8.3.4 Eyelet Mark
Eyelet Marks allow to define the eyelets, e.g. for stretch banners to be mounted on a frame.
Mark
There are three marks that can be used for eyelet marks:
• Cross marks, defined by vertical size, horizontal size and line thickness.• Circle marks, defined by vertical size, horizontal size, circle diameter and line thickness• an external file, which can be selected using the browse button.

8i-cut Layout
110
Inks
See Setting Inks in SmartMarks
Position
You can set eyelet marks on All Sides, or only in the left/right or top/bottom area by setting the Wheredropdown.
The position of the eyelet marks is defined by the Hem , the Distance to the edge of the sheet, andthe maximum interval . Eyelet marks will be divided equally along the edge. The smallest amount ofeyelets is used, without exceeding the maximum interval.
You can duplicate the eyelet marks in the Hem area by selecting the Duplicate Mark in Hem option.The eyelet will be mirrored over the Hem edge, so that after folding both marks are at the same placeon the front and back side.
8.3.5 Text on Cut Path
The Text on Cut Path SmartMark can be used to place text around the cut path of a graphic, allowingto identify the individual graphics when placed on a layout.
Note:
Text on cut path can only be applied in Graphics view.

8i-cut Layout
111
Text
Enter the text you want to place on the cut path.
Click ’Style’ to format your text.Click ’Smart Text...’ if you want to use smart text.
Inks
See Setting Inks in SmartMarks
To guarantee that the text is readable when placed over the bleed of the graphic, there is an optionto add a white halo around the text.
Position

8i-cut Layout
112
Define the start point, direction and Offset for the text.
8.3.6 Fotoba Mark
The Fotoba SmartMark can be used to add vertical and horizontal lines specific for Fotoba rollcutters.
Mark
Enter the Offset Vertical and Horizontal, the line Thickness and the Main Direction.
Set the Single cut mark in main direction if necessary.

8i-cut Layout
113
Inks
See Setting Inks in SmartMarks
8.3.7 Image Mark
The image mark allows you to enter a CT, LP, LC , GRS or Normalized PDF file as a mark.
• Monochrome images:(Can be placed in one or all inks of the job, with or without step.)
• LP, LC, monochrome CT• PDF files containing only one ink• Normalized PDF files containing more than one ink
• Colored images:(Can be placed in their original inks, or can be inkmapped to the job's inks.)
• CMYK and multichannel CT files• GRS files containing more than one ink
The Image Mark dialog box has three tabs:
• Image• Inks• Position
Tip:
The Image Mark can be moved in your job by simply using the Move tool in the Tools toolbar.The Position parameters (Offset) will automatically reflect the changes.
Image
Name : Enter the name of the Image Mark you want to use or click the browse button to browse toa Normalized PDF, GRS, LC or LP file.
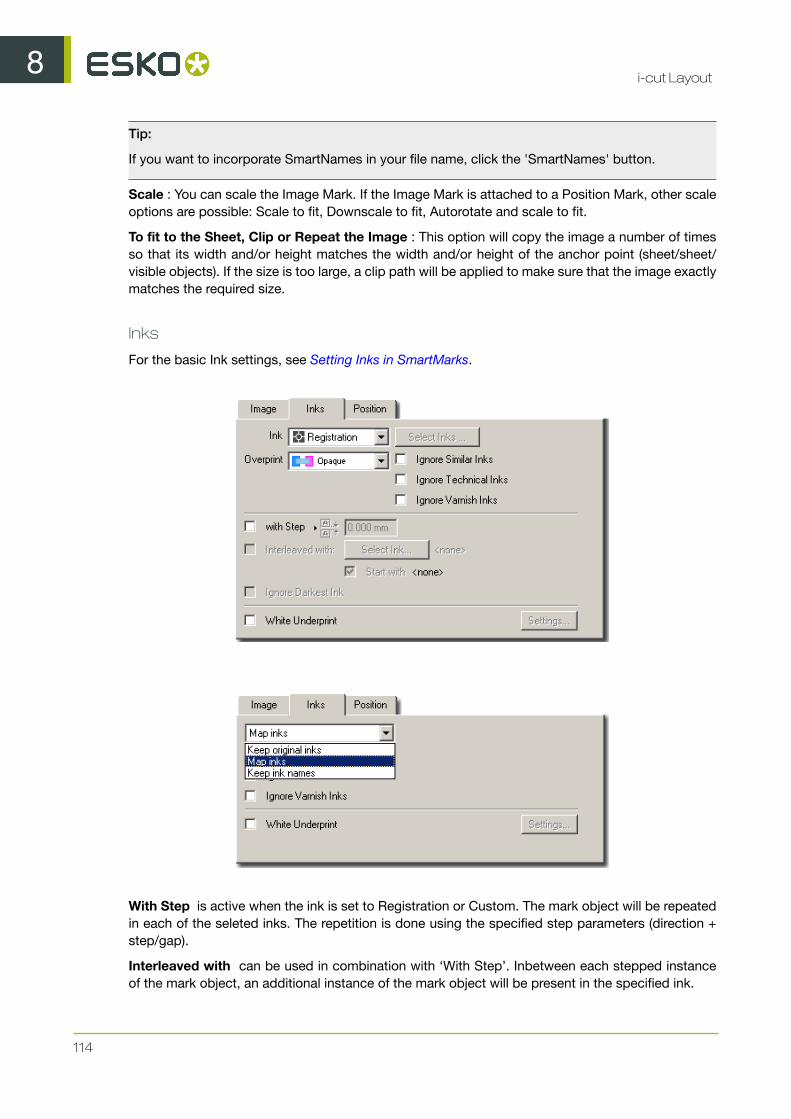
8i-cut Layout
114
Tip:
If you want to incorporate SmartNames in your file name, click the 'SmartNames' button.
Scale : You can scale the Image Mark. If the Image Mark is attached to a Position Mark, other scaleoptions are possible: Scale to fit, Downscale to fit, Autorotate and scale to fit.
To fit to the Sheet, Clip or Repeat the Image : This option will copy the image a number of timesso that its width and/or height matches the width and/or height of the anchor point (sheet/sheet/visible objects). If the size is too large, a clip path will be applied to make sure that the image exactlymatches the required size.
Inks
For the basic Ink settings, see Setting Inks in SmartMarks.
With Step is active when the ink is set to Registration or Custom. The mark object will be repeatedin each of the seleted inks. The repetition is done using the specified step parameters (direction +step/gap).
Interleaved with can be used in combination with ‘With Step’. Inbetween each stepped instanceof the mark object, an additional instance of the mark object will be present in the specified ink.
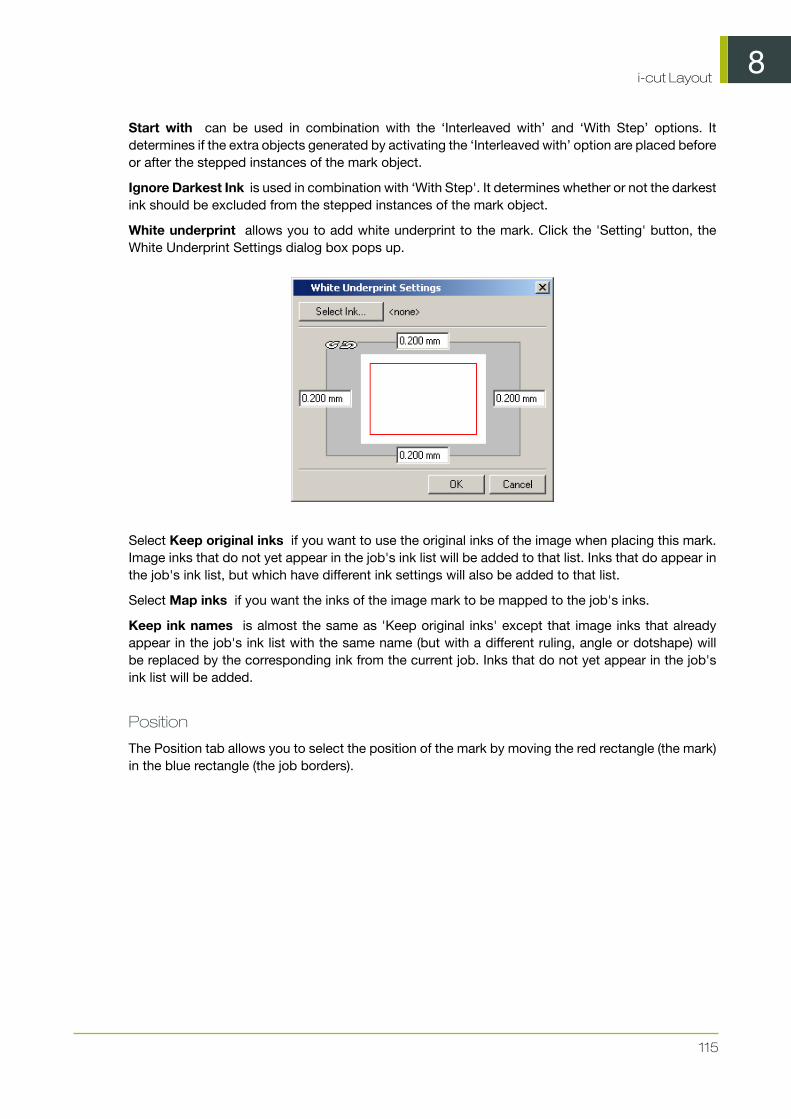
8i-cut Layout
115
Start with can be used in combination with the ‘Interleaved with’ and ‘With Step’ options. Itdetermines if the extra objects generated by activating the ‘Interleaved with’ option are placed beforeor after the stepped instances of the mark object.
Ignore Darkest Ink is used in combination with ‘With Step'. It determines whether or not the darkestink should be excluded from the stepped instances of the mark object.
White underprint allows you to add white underprint to the mark. Click the 'Setting' button, theWhite Underprint Settings dialog box pops up.
Select Keep original inks if you want to use the original inks of the image when placing this mark.Image inks that do not yet appear in the job's ink list will be added to that list. Inks that do appear inthe job's ink list, but which have different ink settings will also be added to that list.
Select Map inks if you want the inks of the image mark to be mapped to the job's inks.
Keep ink names is almost the same as 'Keep original inks' except that image inks that alreadyappear in the job's ink list with the same name (but with a different ruling, angle or dotshape) willbe replaced by the corresponding ink from the current job. Inks that do not yet appear in the job'sink list will be added.
Position
The Position tab allows you to select the position of the mark by moving the red rectangle (the mark)in the blue rectangle (the job borders).

8i-cut Layout
116
Attach to : Sheet, Sheet, Visible Objects, Objects.
Use the offset options
to apply an extra offset to the chosen position using
Orientation Click one of the buttons to obtain the desired orientation for your image.
Angle
allows you to specify an angle in case you selected the rotation button in the 'Orientation' group.
8.3.8 Rectangle
A rectangle mark generates a rectangle with the specified dimenions in the required ink(s).

8i-cut Layout
117
The Rectangle Mark dialog box has three tabs:
• Rectangle• Inks• Position
Tip:
The Rectangle can be moved in your job by simply using the Move tool
in the Tools toolbar.
Rectangle
Enter the Rectangle's vertical and horizontal dimensions.
Enter the height and width of the ellipse.Select the Fit to Trim Box (Borders) toggle if you want thewidth and height to be fitted to the trim box dimensions. This will activate the Extra Height/Lengthinput boxes and will allow you to make the mark as long (or wide) as the anchor object (borders,margins, Position Mark,…) of your job.You may opt to give the mark a stroke instead of a fill. Selectthe Stroke toggle and enter a width. Tint : Enter a percentage. If you enter 50 %, the mark will beshown using 50 percent of the inks.
Inks
See Setting Inks in SmartMarks

8i-cut Layout
118
Position
The Position tab is identical to the Position tab of the Image Mark dialog box.
8.3.9 Bar code
A Bar Code mark generates a bar code object.
The Bar code dialog box has four tabs:
• Bar Code• Box• Inks• Position
Please check the Dynamic Bar Codes manual (on the Documentation DVD or via Help) for moreinformation on the different bar code types.
Bar Code
Type Select a bar code type from the list.
Code To enter the digits of the bar code.
Note:
When entering a wrong number of digits or wrong begin or end digits, the system displays a warningmessage, informing you on the required number of digits or displaying the correct code. The codeis corrected automatically.

8i-cut Layout
119
Bar Width Reduction To adapt the bar width of the bar code. This is necessary to adapt the bar codeto printing processes where the ink tends to 'bleed'. To compensate for this ink bleeding, the barshave to be a little thinner. The exact value will be provided by your printer or customer. If the printerspecifies for example that the line width will increase with 0.01mm, then specify a bar width reductionof 0.01 mm. By default, the value 0 is entered for all bar codes. This means that the bar width is notadapted. A negative value in this input box results in thicker bars, a positive value in thinner bars.
Device Compensation The in/decrease in bar width has 2 causes: the printing process (printedline is wider than what is on the sheet) and the plate-making process. Here you can enter a devicecompensation value, The net compensation is the sum of both the device compensation and the BarWidth Reduction . You can leave on '0' if you do not want to compensate.
Magnification Represents a reduction or enlargement factor for proportional reduction orenlargement of the bar code. Entering "1" creates a 100% bar code. Entering "1.5" creates a 150%bar code. The value is an absolute factor which is automatically rounded depending on the type ofbar code. As bar codes are magnified or reduced in size, the relationship between the bars remainsconstant The widths of individual bars and spaces however, are increased or reduced.
Note:
Since all the values in this dialog box are related proportionally, specifying a number in theMagnification input box will influence the other values in the dialog box.
Height The height of the bar code. The height covers the height of the bars and the digits (if any).Although the height does not contain information, it has to be sufficient to allow an efficient readingof the code.
Caution:
Do not change the height of the bar code before entering a Magnification value. The height willchange again according to the Magnification factor that you define.
Characters per unit Defines the number of characters that you want to print. It is necessary tospecify the number of characters per unit, because the character width depends on the printingprocess and the surface on which the bar code is printed.
Ratio Defines the ratio between the narrowest bar, which is used as reference unit, and the otherbars in the bar code.
Narrow bar Indicates the width of the smallest unit of the bar code.
Wide Bar Determines the width of the wide line within the symbol.
Gap Determines the distance between lines within the symbol and interacts with the ratio: gap value= (1 + ratio) * narrow bar width / 2.
Output resolution Defines the resolution for the exposure of the bar code. The unit is ppi. If youunlock the chain, the system will no longer take the Output resolution in account.
Add Characters By default, the characters are added underneath the bar code when it is created.If there is no need to add them, uncheck the box.
Light Margin Indicator Check the box to have a greater than (>) or less than (<) character printedin the human readable field of the bar code symbol, with the tip aligned with the outer edge of thelight margin.
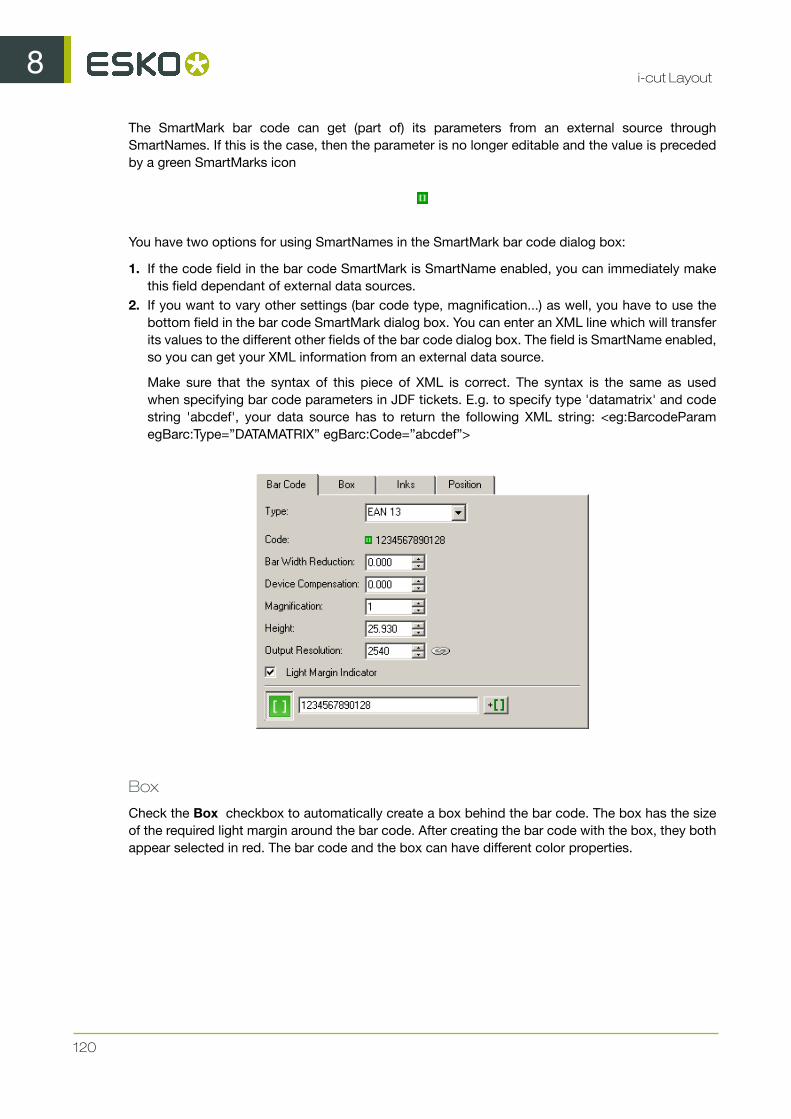
8i-cut Layout
120
The SmartMark bar code can get (part of) its parameters from an external source throughSmartNames. If this is the case, then the parameter is no longer editable and the value is precededby a green SmartMarks icon
You have two options for using SmartNames in the SmartMark bar code dialog box:
1. If the code field in the bar code SmartMark is SmartName enabled, you can immediately makethis field dependant of external data sources.
2. If you want to vary other settings (bar code type, magnification...) as well, you have to use thebottom field in the bar code SmartMark dialog box. You can enter an XML line which will transferits values to the different other fields of the bar code dialog box. The field is SmartName enabled,so you can get your XML information from an external data source.
Make sure that the syntax of this piece of XML is correct. The syntax is the same as usedwhen specifying bar code parameters in JDF tickets. E.g. to specify type 'datamatrix' and codestring 'abcdef', your data source has to return the following XML string: <eg:BarcodeParamegBarc:Type=”DATAMATRIX” egBarc:Code=”abcdef”>
Box
Check the Box checkbox to automatically create a box behind the bar code. The box has the sizeof the required light margin around the bar code. After creating the bar code with the box, they bothappear selected in red. The bar code and the box can have different color properties.

8i-cut Layout
121
Inks
For the basic Ink settings, see Setting Inks in SmartMarks.
With Step repeats the mark in various inks with a step between each repetition.
Position
The Position tab is identical to the Position tab of the Image Mark dialog box.
8.3.10 Text Mark
The Text dialog box allows you to create additional text on a specified position and a certainorientation. The additional text fields will be put next to each other on the specified position. Textfields can contain any additional information that you type in and will be created in the ink selected.
The text Mark has three tabs:
• Text• Inks

8i-cut Layout
122
• Position
Text
To create additional text on a specified position and orientation.
Tip:
The Text Mark can be moved in your job by simply using the Move tool
in the Tools toolbar.
Check the Mirrored box if you want your text to appear mirrored.When choosing ' Automatic Size', quadding modes will be ignored and the size of the box will depend on the size of the text.Deselect'Automatic Size' to be able to enter text box dimensions yourself.
Click 'Style' to format your text.Click 'Smart Text...' if you want to use smart text.
Inks
For the basic Ink settings, see Setting Inks in SmartMarks.
8i-cut Layout
123
With Step repeats the mark in various inks with a step between each repetition.
Position
The Position tab is identical to the Position tab of the Image Mark dialog box.

9i-cut Layout
124
9. Menus and Toolbars
9.1 Menus
The menu bar contains commands available in the current module. Not all commands on all menusmay be available; availability depends on the options purchased and the active tool.
• File• Edit• View• Arrange• Graphic• Inks• Tools• Production• Window• Help
9.1.1 File menu
The File menu contains following items:
• New... offers you the possibility to create a new layout. See Document Setup.• Open allows you to open an existing layout.• Close closes the job you are currently working on.• Save saves the layout you are currently working on.• Save as... saves the layout under another name.• Launch Workflow allows to submit the current job to a workflow queue using Shuttle. See Shuttle• Save and Select in Esko Automation Engine Pilot automatically selects the open file in the
Automation Engine Pilot. When the document has been changed, you will be prompted to savethe changes.
• Save Red Selection and Select in Esko Automation Engine Pilot : saves the red selection andautomatically selects the open file in the Automation Engine Pilot. When the document has beenchanged, you will be prompted to save the changes.
Note:
These two options are only available if you are connected to an Automation Engine Pilot.
Note:
The Automation Engine Pilot needs to be running.
• Export Layout allows to export a layout to a PostScript file. See Exporting to a PostScript File
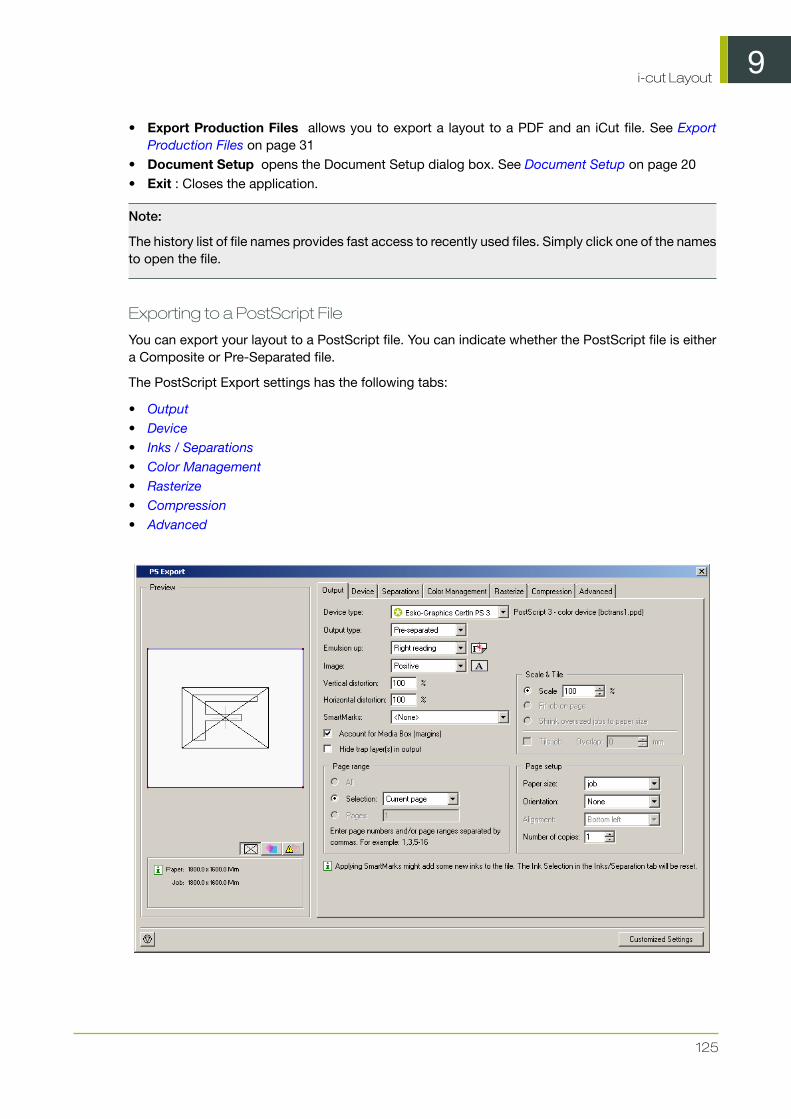
9i-cut Layout
125
• Export Production Files allows you to export a layout to a PDF and an iCut file. See ExportProduction Files on page 31
• Document Setup opens the Document Setup dialog box. See Document Setup on page 20• Exit : Closes the application.
Note:
The history list of file names provides fast access to recently used files. Simply click one of the namesto open the file.
Exporting to a PostScript File
You can export your layout to a PostScript file. You can indicate whether the PostScript file is eithera Composite or Pre-Separated file.
The PostScript Export settings has the following tabs:
• Output• Device• Inks / Separations• Color Management• Rasterize• Compression• Advanced

9i-cut Layout
126
Output
Emulsion Up To obtain Right Reading (= emulsion up) or Wrong Reading (=emulsion down).
Image To specify Positive or Negative print mode.
Note:
Image and Emulsion up becomes unavailable (appears dimmed) when CMYK Composite Outputwas chosen.
Enter the Vertical and/or Horizontal distortion in percentages
Select SmartMarks from the drop-down list.
Account for Media Box (margins) To select the margins of the job as the true boundary. If youdeselect this toggle, the borders of the job are taken as the true boundary. When you want to outputeverything that is placed within the margins too, leave the option activated.
Hide trap layer(s) in output Trap layers will not be included in the output.
Page range
• Output all pages.• Output a number of pages. Enter page numbers or page ranges separated by commas, e.g.
1,3,5-8.
Scale & Tile
• Enter a Scale factor (percentage).• Fit job on page scales the job so it fits the selected paper size.• Shrink oversized jobs to paper size .• Select ' Tile Job ' to obtain a tiled output if the job is too big to fit on the selected paper size.
The tiling option which can be used to export a large job to a series of smaller pages (tiles) allowsthe user to cycle through the tiles which will be produced and see just how many tiles thereare. Overlap X mm/inches: To specify a tiling overlap. The value you enter here, is the amount ofoverlap in all four directions between adjacent tiles. It defaults to 5 mm.
Page Setup
• Select a paper size from the drop-down list. The list that appears here is based on the page sizessupported by the selected ppd.
• Orientation : Auto, None, 90° cw, 90°ccw, 180°. The orientation options are disabled when 'Tilejob' is selected.
• Alignment : Bottom left, Top left, Top right, Bottom right, Centered. The alignment options aredisabled when 'Tile job' is selected.
• Enter the number of copies.
Device
The Resolution depends on your output device and on the purpose of the PostScript file. Forproofing for example, a lower resolution might be sufficient.
Select the Dotshape .

9i-cut Layout
127
Halftoning If you select CMYK Composite or Composite as Output type, you can choose to includescreen information when outputting (lpi and angle).
• Use Printer Defaults : the output device's default screen info will be used.• Take over from job• Some devices offer other dotshapes if they are available in the PPD.
Dot Gain Compensation You can select Dot Gain Compensation (DGC) curves made withIntelliCurve or IntelliCurvePro.
Note:
A screen-based DGC file was the format written by the two DGC Editors (DGC Editor and Screen-based DGC Editor). These two editors have been replaced by IntelliCurve, which writes DGCStrategies. However, a screen-based DGC file can still be applied.
• Single curve: Allows you to select one DGC curve (.dgc file) that will be applied to all your data.• Automatic: Allows you to select a screen-based DGC table (.scrdgc file) or a DGC Strategy (.icpro
file). The former allows you to apply dot gain compensation selectively depending on the dotshape, screen ruling, angles and even Contone or Linework properties. The latter does the samebut also offers ink based dot gain compensation.
Note:
You can also apply both single curve and automatic DGC simultaneously, resulting in a cumulationof both effects.
Roll Fed Devices Account for Media Width allows the conversion program to find the best printingorientation. For roll-fed devices, mostly imagesetters, a Media Width (film width) can be specified. Theconversion program finds the best printing orientation in order not to waste paper or file if Rotationis set to Auto. The Media Width value is expressed in mm.The option ' Extra Gap ' allows you tospecify extra width for the film or paper feed. The Extra Gap value is expressed in mm. By default,no Extra Gap is set.
For Device specific options please refer to the manual of your output device.
Inks / Separations
The Inks / Separations tab depends on the output type you selected in the Output tab . If you chooseCMYK Composite or Composite, the Inks tab will be visible, if you choose separated, the Separationstab will be visible.
Inks Tab
Use technical inks in output Normally technical inks are hidden when you save a job in an Eskoeditor. But, there's a possibility to save the Technical inks as visible. This toggle here makes it possibleto output the visible (non hidden) technical inks.
The Inks are listed. You can deselect the ones you want to exclude from export by clicking theprint icon
9i-cut Layout
128
Separations Tab
Use technical inks in output Normally technical inks are hidden when you save a job in an Eskoeditor. But, there's a possibility to save the Technical inks as visible. This toggle here makes it possibleto output the visible (non hidden) technical inks.
The inks and separations are listed. You can deselect one or more inks, the according separationwill disappear from the Sheets list.
Use the 'Convert to CMYK' button
to convert PANTONE inks to CMYK values.
Color Management
Convert to
• CMYK: all inks are converted to CMYK values• Gray: all inks are converted to Gray values.
Use link profile : Link profiles describe a transformation from 1 device dependent color space toanother. This is actually a concatenation of a forward transformation of 1 profile and a backwardtransformation of another profile. This means that all other options will be grayed out as the LinkProfile takes complete care of the color management.
Source profile : If any CMYK objects are to be converted, choose a source profile. The list shows allCMYK print profiles in the color database. The source profile defines the target that the destinationprofile is supposed to match.
Destination profile : Choose a color profile for your destination color space. The list shows all printprofiles in the color database. These profiles are either measured in Kaleidoscope or imported ICC-profiles.
Rendering intent
• Relative (No Background): Use this option if you do not want any background simulation. Thewhite point of the source will be mapped on the white point of the destination process. Thisrendering intent takes into account the ability of the human eye to adapt to the surrounding white.
• Absolute (Background): Use this option if you want background simulation and you want an exactcolor match, including the paper simulation.
Map black on black When toggled on, the CMY-part of the composite colors are convertedseparately from the black component. As a result, the type of black separation (Skeleton, UCR,GCR,...) is preserved by the conversion. (It is still possible that the black percentage changes slightlydue to different dot gain in the color profiles.) When toggled off, the converted CMYK colors arecompletely re-separated into the black behavior that is built into the destination profile.

9i-cut Layout
129
Use the document profile as source profile if available If there is a document profile defined,that will be used as a source profile. The one chosen from the Source Profile drop-down list will beoverruled.
Embed the Destination profile as an intermediate color space
If this toggle is off, the colors in the PDF file will not be tagged with an ICC color profile. The documentis device dependent and its colors will only be reproduced accurately if the PDF file is output on thedevice that is specified in the Destination Profile. This choice is preferable if we are sure the PDF filewill be sent to the device specified in the Destination Profile.
If this toggle is on, the color in the PDF file will be tagged with an ICC color profile. The documentthen becomes device independent, and its colors will be reproduced accurately even on devices witha color space different from the one specified in the Destination Profile. In this case, the DestinationProfile is an intermediate color space between the Source Profile and the color profile of the devicethat will eventually process the PDF file.This method is preferable when the PDF file will be sent toan unknown device.
Embed the document profile as PDF Output intent The output intent is an ICC profile that specifiesthe intended output device.If this option is toggled on, the document profile will be saved as thePDF output intent. For certain PDF flavors (PDF-X/3) an output intent is mandatory and this option isalways on. If no document profile was set explicitly, the default document profile (crom_offs) is usedinstead. If the document profile is a Kaleidoscope profile, it will first be converted to an ICC profile.
Rasterize
Output as image When this toggle is activated an image is made of the job. Enter the resolution.
Anti-aliasing is relevant for the line-art objects in your design, that need pre-processing and forwhich images are generated. Anti-aliasing smoothens the staircase effect you get in the generatedimages of lineart objects that need pre-processing.
Tip:
This option increases the readability of small text that is pre-processed to image.
Convert vignettes to image To avoid banding in the vignettes when exporting. Exporting vignettesto a PostScript Format, may result in blends and banding due to restrictions in PostScript. However,to obtain a nice result in your export file, activate Convert Vignettes to CT. All the vignettes presentin your design will be converted to images.
Vignette noise When exporting to PostScript, some vignettes or parts of vignettes will be convertedto images. This happens when the vignettes overlap other objects with translucency or overprintbetween the vignette and the other objects. When the option 'Convert Vignettes to Image' is activatedall vignettes are converted to images regardless of overlap with other objects. Vignettes that areconverted to images may have tone jumps in the final result. To reduce this banding effect, noise isapplied on the image. The amount of noise can be specified in the field Vignette Noise.
Compression
Encoding
9i-cut Layout
130
• Binary: The image data is represented as binary data. This results in compact files that are noteditable in a common ASCII editor however. Nor can these files be sent over a communicationline using a communication protocol that relies on control characters in the data stream itself.
• Hex: In this way, the PostScript file remains editable with an ASCII editor at all times. They canalso be sent over a communication line using whatever communication protocol is available. Thedrawback, however, is that hexadecimal image data may take up to twice as much size as binarydata.
• Ascii 85: Encodes binary data in an ASCII base-85 representation. This encoding uses nearly allof the printable ASCII character set. The resulting expansion factor is 4:5, making this encodingmore efficient then hexadecimal.
Compression : None, LZW or Flate (PostScript3 devices).
Downsampling The images referenced in your design are subsampled approximately to thespecified value. Activating this option, allows you not only to reduce the size of the generatedPostScript file, but also to speed up generation of the PostScript file. Select the unit for subsamplingfrom the drop-down list: lpmm or ppi. You can subsample both bitmaps and contones.
Advanced
Fonts
• Contourize fonts.
Note:
Protected CID fonts will be referenced by name.
• Embed BG and Type1 fonts: Allows you to include the used BG and Type 1 fonts of your designin your PostScript file.
Split Complex Paths
Caution:
These are workarounds for typical PostScript level 1 path limitations. Only use these when reallynecessary.
• Use Filled and stroked paths at X points to split linework with more than x points into severalsmaller linework parts. This option decreases the complexity of the linework. A suitable value forthe selected device type is calculated for this option.
• Use Clip paths at X points to split linework masks for images with more than x points into severalsmaller linework parts. This option decreases the complexity of the masks.
Workaround
• Ignore varnish inks Varnish inks will not be included while outputting to PostScript.• Resolve once identical one-ups in Step & repeat file Instead of resolving the complete Step &
Repeat file, identical one-ups will be resolved only once.• Resolve once identical external files Instead of resolving the complete file and all its external
references, identical external files will be resolved only once.• Resolve pure black overprint Overprints are normally resolved, but default, pure black is left alone,
if you want Rich Black to be resolved too, select this toggle. This toggle is only available whenthe Color Management options in the Color Management tab are activated.
9i-cut Layout
131
• Limit filename size to 31 characters Check this toggle if you want to make sure your imported filescan be seen/read from/by all Apple operating systems.
• Split separated output into multiple files Instead of writing one file containing all separations, thesystem will write one file per separation.
• Split multi page jobs into multiple files Every page will be output as a separate file.• Suppress Hairlines At Clips Due to the PostScript limitation of maximum points allowed for a
path, complex paths will be cut into smaller pieces. When the PostScript file is printed/exposedon some older PostScript Rips, hairlines may become visible. To avoid this problem, activateSuppress Hairlines at Clips.
• Image To Paper Edge To move the origin of the converted job to the lower left corner of the paperor film. Activate this toggle to align your job to the edge of the paper or film to use the full area.
Caution:
Exporting to a paper PostScript device: For most of these devices, there is always a border onthe output page where nothing can be imaged. Parts of your design in that border will be lost.
• Avoid Tabular Number Problems When digits are written as tabular numbers, exporting to somePostScript Rips may result in bad positioning of the numbers. The tabular numbers are notcorrectly placed at the text base line. To avoid this problem, activate Avoid Tabular NumberProblems.
• Disable path clipping By default, paths are clipped by the borders of the job, but there areinstances where you do not want the paths to be clipped, if so, select this toggle.
• Map spot color separations to CMYK This option is intended to export a job containing spot colorsto pre-separated PostScript for systems which are limited to handling process color separationsonly (e.g. Scitex Brisque Workflow). This option is available when Pre-Separated was selected.Spot color separations can be handled only on such systems by remapping them to a specificprocess separation. When this toggle is checked, spot colors will be exported as a C, Y, M or Kseparation. The mapping is done based on the lpi and angle of the spot color.
If the process Cyan ink has a given lpi of 120 and angle of 15, a spot color Reflex blue may bemapped to Cyan, if in the Paint menu it is given the same lpi and angle of process Cyan.
• Suffix for PANTONE ink names Enter a suffix, the default is C.• Maximum deviation of resolved curves During the resolving process Bezier curves are sometimes
approximated by vectors. The maximum allowed deviation of the curves can be entered here.

9i-cut Layout
132
Note:
When a Esko native file is exported to PostScript, certain elements in the job which cannot betranslated into PostScript will be resolved in order to get an exact result. The same happens whenexporting to PDF. PDF files however have several destinations and don't always need the highquality resolving because they may only serve as soft proof. If you want to obtain even smallerfiles than what you can get with the "PDF for RGB/CMYK proofing" settings, then this workaroundoption might help. When we resolve objects splines are converted to vectors (e.g. line mask). Thespline only has a 2 points but you need a lot of vector points to describe a curve. The resolverdefault deviation is 0.002 mm but you can reduce the amount of vector points by raising thedeviation value and thus reducing the size of the PDF. Which values? When comparing the default(0.002 = 1360 kb PDF) with 0.02 (326 kb PDF) you will end up with an acceptable result but it isclear that high values will alter the PDF too much. Keep in mind that this option will only modifyresolved vector curves, it will not "straighten" any other objects while exporting.
9.1.2 Edit menu
The Edit menu contains following items:
• Undo : To cancel the last editing function (or a series of editing functions) you performed.
The editing functions are undone one editing function at a time, starting from the most recent one.The last modification you made is undone and the job appears as it was before you performed theediting function.Continue to choose Undo to cancel other modifications that you made to the job.
Note:
The number of undos you can perform depends on the number of Undo Levels entered inPreferences.
Notice that 'remembering' the previous actions consumes memory that cannot be used for yourcurrent job anymore. If you are working with extremely complex jobs, it may be necessary to entera lower number of undo levels.
• Redo : To cancel the last undo (or series of undos) you performed.
Redo cancels one undo at a time, starting from the most recent occurrence and displaying thejob as it was before you performed an undo.Continue to choose Redo to cancel other undos thatyou made to the job.
Note:
The number of redos you can perform depends on the number of Undo Levels entered inPreferences.
If you change something to your job after an undo action, you cannot redo it anymore, or - inother words - redo only works immediately after an undo action.
• Delete : To delete an object or a group of objects.• Cut : To delete selected red objects from their current position in order to paste them into another
position.• Copy : To copy objects selected in red in order to paste them into another position.
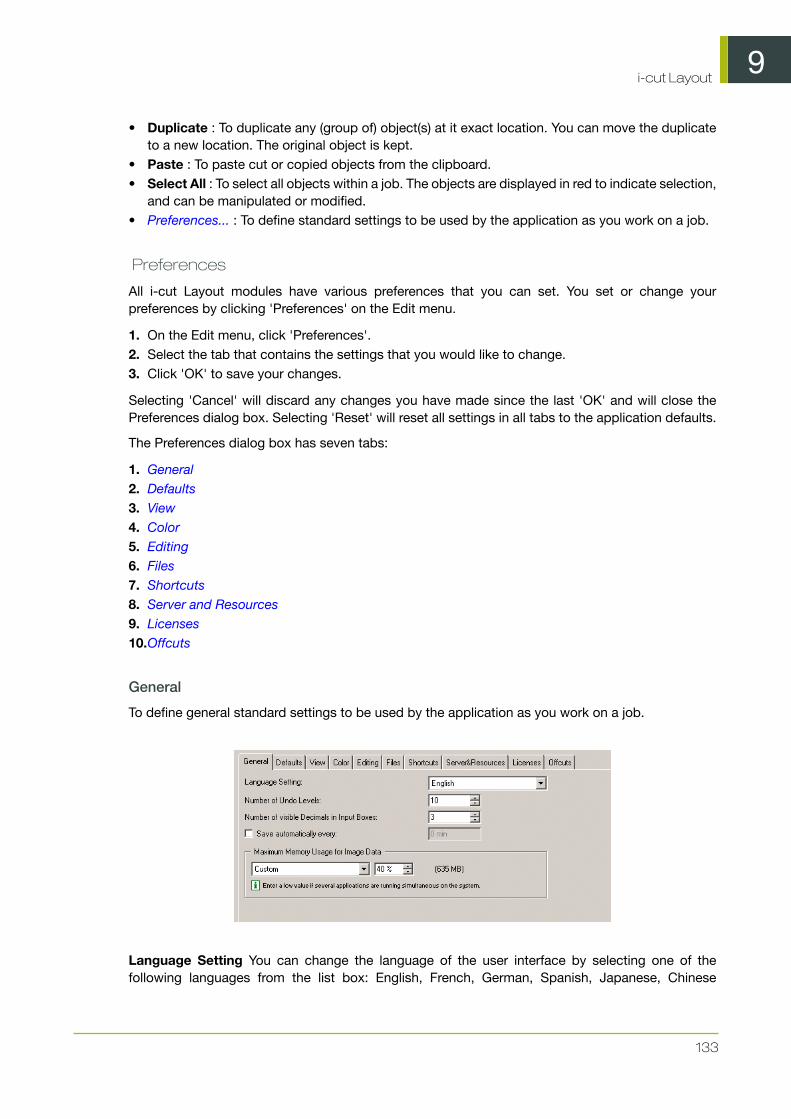
9i-cut Layout
133
• Duplicate : To duplicate any (group of) object(s) at it exact location. You can move the duplicateto a new location. The original object is kept.
• Paste : To paste cut or copied objects from the clipboard.• Select All : To select all objects within a job. The objects are displayed in red to indicate selection,
and can be manipulated or modified.• Preferences... : To define standard settings to be used by the application as you work on a job.
Preferences
All i-cut Layout modules have various preferences that you can set. You set or change yourpreferences by clicking 'Preferences' on the Edit menu.
1. On the Edit menu, click 'Preferences'.2. Select the tab that contains the settings that you would like to change.3. Click 'OK' to save your changes.
Selecting 'Cancel' will discard any changes you have made since the last 'OK' and will close thePreferences dialog box. Selecting 'Reset' will reset all settings in all tabs to the application defaults.
The Preferences dialog box has seven tabs:
1. General2. Defaults3. View4. Color5. Editing6. Files7. Shortcuts8. Server and Resources9. Licenses10.Offcuts
General
To define general standard settings to be used by the application as you work on a job.
Language Setting You can change the language of the user interface by selecting one of thefollowing languages from the list box: English, French, German, Spanish, Japanese, Chinese
9i-cut Layout
134
Simplified or Chinese Traditional. In case you prefer to have the localized online help documentation,however, you still need to install the language packs.
Note:
The editor needs to be restarted before the changes will be effective.
Number of Undo Levels Defines the minimum number of steps the system remembers for Undoand Redo. Enter a value between 0 and 1000.
Tip:
For complex jobs, it is best to keep the number low to save memory.
Number of visible Decimals in Input Boxes Defines the number of decimals displayed in the inputboxes.
Enter a value between 0 and 8.
Values are rounded when you enter more digits (into an input box) than the number defined in thisDecimals input box.
Save automatically every: Defines how often you want the application to save your workautomatically. The interval between 2 automatic saves is expressed in minutes. Your work is savedin a file called 'autosave.pla' or 'autosave.pdfpla' in the Temporary directory you have selected inthe Files tab sheet.
A value of 0 disables automatic save.
Maximum Memory Usage for Image Data : Defines the amount of RAM allocated for storing Imagedisplay images.
The higher the value, the more RAM the system has at its disposal for the display image(s), reducingthe need to reload display images from the hard disk.
Select "Low" when several application are running simultaneously on the system. The maximumamount of memory allocated by the editor is limited to make sure that other applications still haveenough memory. This setting is also recommended when the system has 512Mb or lower.
Select "Medium" for normal use and for the editor's most optimal performance. By choosing"Medium" there is still some free memory available for other applications and the system itself.
Select "High" when the editor is allowed to allocate most of the system resources. In this case mostimage data is stored in memory instead of written to temporary files on the disc. This setting is onlyrecommended when the editor is the only high-end application on the system and when the systemhas 1GB or more physical computer memory.
Select "Custom" to fill in the total percentage of the physical computer memory that can be allocatedby the editor for handling image data. Make sure there is enough other physical computer memoryavailable for the OS (250Mb), other applications and the memory needed to run the editor andhandling documents (200Mb).
Defaults
Use the Defaults tab to set the units and the default origin for new documents.

9i-cut Layout
135
Units Specify whether you want your measurements and calculations displayed in millimeters orinches.
Origin Choose the orientation of the axes in your document. Your preference will be stored inside thefile. Opening the file later will set the orientation in the same situation as in which the file was created.
Caution:
It is not possible to change the units or orientation while working at the job. New preference settingswill only be applied when creating a new job.
Default Die Ink In case you always use the same die ink, you can specify it here and it willautomatically be detected as the default die ink in the file.
Default Bleed The value entered will automatically be applied to all Graphics that are loaded in i-cutLayout. This will be indicated in the Bleed column of the SmartNest dialog box.
View
The View tab changes the way that your document is displayed. Changes made here do not affectthe structure of your document.
Image Display Quality defines the resolution used by the application to display images.
• Very High: the application creates a display image at the highest possible resolution, regardlessof the display information in the image file itself.
• High: the application creates a display image at a high resolution (72 dpi), regardless of the displayinformation in the image itself. This can take very long since all data of the images are read. If you
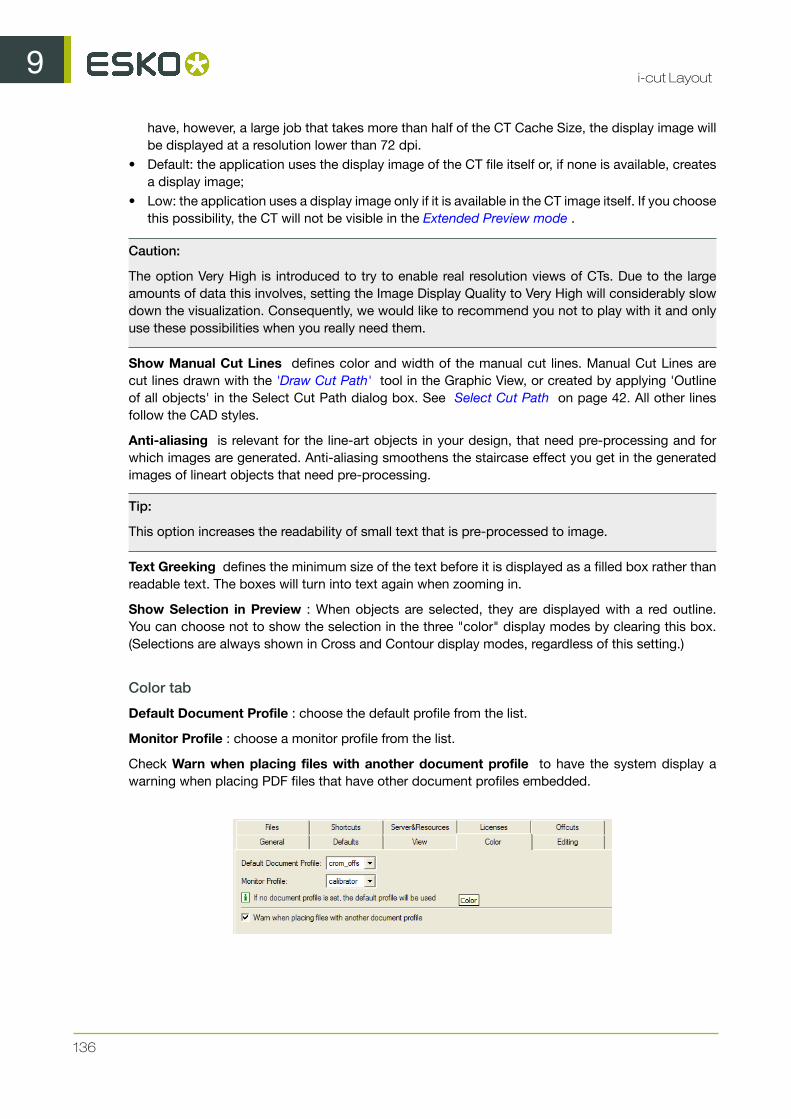
9i-cut Layout
136
have, however, a large job that takes more than half of the CT Cache Size, the display image willbe displayed at a resolution lower than 72 dpi.
• Default: the application uses the display image of the CT file itself or, if none is available, createsa display image;
• Low: the application uses a display image only if it is available in the CT image itself. If you choosethis possibility, the CT will not be visible in the Extended Preview mode .
Caution:
The option Very High is introduced to try to enable real resolution views of CTs. Due to the largeamounts of data this involves, setting the Image Display Quality to Very High will considerably slowdown the visualization. Consequently, we would like to recommend you not to play with it and onlyuse these possibilities when you really need them.
Show Manual Cut Lines defines color and width of the manual cut lines. Manual Cut Lines arecut lines drawn with the 'Draw Cut Path' tool in the Graphic View, or created by applying 'Outlineof all objects' in the Select Cut Path dialog box. See Select Cut Path on page 42. All other linesfollow the CAD styles.
Anti-aliasing is relevant for the line-art objects in your design, that need pre-processing and forwhich images are generated. Anti-aliasing smoothens the staircase effect you get in the generatedimages of lineart objects that need pre-processing.
Tip:
This option increases the readability of small text that is pre-processed to image.
Text Greeking defines the minimum size of the text before it is displayed as a filled box rather thanreadable text. The boxes will turn into text again when zooming in.
Show Selection in Preview : When objects are selected, they are displayed with a red outline.You can choose not to show the selection in the three "color" display modes by clearing this box.(Selections are always shown in Cross and Contour display modes, regardless of this setting.)
Color tab
Default Document Profile : choose the default profile from the list.
Monitor Profile : choose a monitor profile from the list.
Check Warn when placing files with another document profile to have the system display awarning when placing PDF files that have other document profiles embedded.

9i-cut Layout
137
Editing tab
The Editing tab sets i-cut Layout's defaults for editing. These defaults do not change the structureof your document; they only change your interaction with the application when editing files.
Gravity defines the distance in screen pixels where gravity (or snap) is in effect. The higher the value,the easier an object will snap to guides or other objects. Enter a value between 0 and 16.
Cursor Drag Delay defines the minimum distance in screen pixels the cursor must be moved beforeany transformation of an object takes place. Enter a value between 0 and 16.
Pan Overlap defines the percentage of overlap between the previous and new view when panning.For example, with the Pan Overlap set to "75", the new view after panning contains 75% of theprevious view and 25% of a new view.
'Shift and drag-select' reverses the selection : Dragging a selection over an object while holdingSHIFT actually deselects selected objects and selects unselected ones.
Create polygons by :
• One mouse click: click the top-left corner of the polygon (depending on the chosen orientation)and draw a polygon of the desired size.
• Two mouse clicks: click both the top-left and the bottom-right corner of the polygon.
Files tab
Use the Files tab to define file settings to be used by i-cut Layout as you work on a document.

9i-cut Layout
138
Temporary Files : The default temporary files directory is the \temp folder on your home folder.Click the Browse icon to choose another directory. Select a directory on the fastest hard disk of theworkstation.
Show file options in file selector dialog : Checking this checkbox will open the File Options dialogbox every time you open or import a file.
Show thumbnail preview in file selector dialog : The file selector shows File Info. Check thecheckbox to turn the preview on or off.
Create backup file (.bak) in same folder : Creates a backup file in the same folder. Indicate whetheryou want to create a backup file before saving or before loading.You need to change the .bak into .plain order to be able to read the file into the editor.
Update external files when they are modified checks whether the referenced files were changedsince the file has been loaded. Only happens when the workstation is idle (e.g. when a GRS is placedin i-cut Layout, but is edited in Esko PackEdge at the same time).
Place PDF files without normalization It is possible to place non-normalized PDF files, using thispreference option. When placing non-normalized PDF files, this will result in a non-rippable PDFPLAfile. This means that such a file will need pre-processing when further operations are applied (exposeto FlexRIP / Automation Engine operations) – during pre-processing a normalization ‘on-the-fly’ willhappen. As such, this workflow is only advisable when working in a standalone PDF environment(placing PDF files, exporting to PDF). When switching to a mode where the real data is needed (forexample switching to extended preview, applying trapping,…), a normalisation ‘on-the-fly’ is done.
Check Job Parameters It is possible to define Job Parameters on the BackStage server. JobParameters are settings (type of bar code, inks, certain RIP parameters,... ) that are predefined for aBackStage Job.The Check Job Parameters options allows you to check your files for inconsistenciesand to correct them (if necessary) when opening or saving a document.
Shortcuts tab
There are 2 sets of shortcuts: Esko shortcuts and DTP applications shortcuts. You can switchbetween both sets by selecting the appropriate set from the Shortcut Key drop-down list.
You can, however, modify whichever set of shortcuts to fit your personal needs.

9i-cut Layout
139
1. Select the right set of shortcuts, if it is not yet selected.2. Select the 'Category' (e.g., 'File') of which you want to personalize a shortcut.3. Select the command you wish to personalize (e.g., 'New')4. Now personalize your shortcut. Enter a key and click 'Assign'.
Note:
If you want to remove a shortcut , click 'Remove'.If you want to return to the original shortcuts, click'Reset All'.
Server and Resources tab
To define the Automation Engine server to connect to, and the Data Resources to be used by theapplication as you work on a job.
Note:
In case the application is connected to an Automation Engine or BackStage server, the DataResources are always used from this server. You can use the remote or local Data resources if theapplication is not connected to an Automation Engine or BackStage server.
Automation Engine Server
You can set the Server Name, User Name and Password to connect to Automation Engine.
Note:
If you are connected to an Automation Engine, a green notification will be shown.

9i-cut Layout
140
Data Resources
The common Data Resources used by the application are Color Engine Database, Marks, Fonts,Custom and DGC.
By default, these Data Resources are taken from the Automation Engine server. If you are notconnected to an Automation Engine, you can use the Data Resources installed with i-cut Layout,on your local machine.
However, it is possible for 2 or more stand-alone applications (without an Automation Engine server)to share the same data resources. This requires that the Data Resources are shared on a remotecomputer.
This can be used to install the Common Data Components on one computer, and use these fromevery computer running i-cut Layout. Tje Common Data Components kit is available as a separateinstaller on the i-cut Soite DVD. Installing this kit will give you an extensive list of available marks.
Note:
Changing the Data Resource settings requires a restart of the application.
Licenses tab
The License tab shows the active licenses in the application. You can disable and enable licensesin the list.
Offcuts tab
In the Offcuts tab you can define the Minimum Width or Height for an Offcut Sheet, the Safety Margin,and the Font, Weight and Size for the name of the Offcut Sheet to be printed on the Offcut Sheet

9i-cut Layout
141
See Offcut Preferences
9.1.3 View menu
The View menu gives access to commands that determine how the imposition job is previewed.
The View menu contains following items:
• Zoom In : To zoom in (by a factor of 2) on the displayed job in the active window.• Zoom Out : To zoom out (by a factor of 2) on the displayed size of the job in the active window.• Zoom to Selection : This function allows you to automatically zoom in on the selected area in
your job.• Total View : To display the entire job, including objects outside the sheet, after you have used
any of the other View options.• Previous View : To display the previous view of the active window after you have used any of
the other View options.• Repaint : To repaint the active window to remove stray pixels or to finish painting a large file on
screen.• Preview opens the Preview menu .
Tip:
The Preview Mode buttons also appear in the Preview Selector toolbar that can be added to thework environment via Window > Toolbars > Preview Selector.
• View Mode opens the View Mode submenu , allowing to choose between Sheet view andGraphic view. See Working in Graphic View
• Side allows you to switch between the front and back side of the sheet.• Show Technical Inks allows you to view the Technical Inks in the job window.• Viewer opens the Viewer window. See Viewer on page 142
Preview
The Preview menu makes it possible to easily switch between the different preview modes.
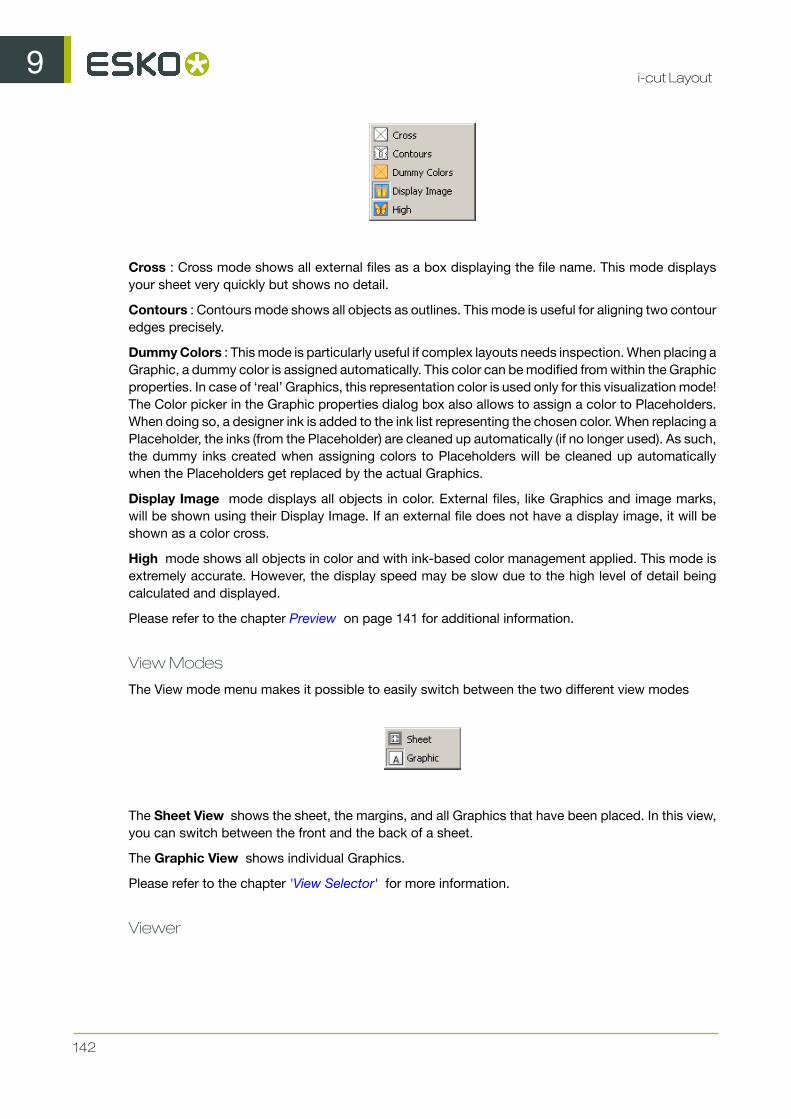
9i-cut Layout
142
Cross : Cross mode shows all external files as a box displaying the file name. This mode displaysyour sheet very quickly but shows no detail.
Contours : Contours mode shows all objects as outlines. This mode is useful for aligning two contouredges precisely.
Dummy Colors : This mode is particularly useful if complex layouts needs inspection. When placing aGraphic, a dummy color is assigned automatically. This color can be modified from within the Graphicproperties. In case of ‘real’ Graphics, this representation color is used only for this visualization mode!The Color picker in the Graphic properties dialog box also allows to assign a color to Placeholders.When doing so, a designer ink is added to the ink list representing the chosen color. When replacing aPlaceholder, the inks (from the Placeholder) are cleaned up automatically (if no longer used). As such,the dummy inks created when assigning colors to Placeholders will be cleaned up automaticallywhen the Placeholders get replaced by the actual Graphics.
Display Image mode displays all objects in color. External files, like Graphics and image marks,will be shown using their Display Image. If an external file does not have a display image, it will beshown as a color cross.
High mode shows all objects in color and with ink-based color management applied. This mode isextremely accurate. However, the display speed may be slow due to the high level of detail beingcalculated and displayed.
Please refer to the chapter Preview on page 141 for additional information.
View Modes
The View mode menu makes it possible to easily switch between the two different view modes
The Sheet View shows the sheet, the margins, and all Graphics that have been placed. In this view,you can switch between the front and the back of a sheet.
The Graphic View shows individual Graphics.
Please refer to the chapter 'View Selector' for more information.
Viewer

9i-cut Layout
143
Welcome to Viewer
Benefits of using Viewer
Viewer is a very accurate separation viewer with a lot of extra production tools. It eliminates the needfor separated proofs and will help you to avoid bad plate-making.
Fly-out menu options
A number of settings can be found in the Fly-out menu, by clicking the arrow at the top right of thedialog.
Show in All Windows
Use this to apply the Viewer preview settings to all the windows open in PackEdge (when you usedseveral windows).
Merge Similar Inks
This option affects how a separation containing objects with different halftone information isdisplayed in the separation list.
Leave it off to display a separate entry for each different halftone setting (as shown below at left), orselect it to display different halftone settings of the same separation as one entry (as shown belowat right).
Default
Click Default to use the Default Press Setting. For more information, see Define Press Settings
Manage Press Settings...
Click this option to create, duplicate, edit or delete Press Settings. See Define Press Settings.
Define Press Settings
Before you can start working with Viewer in a meaningful way, you should define your Press Settings.Without basic information on the properties of the press you are using, Viewer cannot simulateaccurately.
You can open the Press Settings window by selecting Press Settings... in the fly-out menu
The Default Press Settings
In the list of Press Settings, there is always one Press Setting called Default, which you can editbut not delete.
You can select it by clicking on Default in the Viewer dialog’s fly-out menu, and edit it using PressSettings...
Creating a Press Setting
To create a Press Setting in Viewer:
9i-cut Layout
144
1. Select Press Settings... in the fly-out menu .
2. Click New... in the Press Settings dialog.
3. Enter the name of the new press setting in the New dialog.
4. Click OK
Copying a Press Setting
To copy (duplicate) a Press Setting:
1. Select it in the Press Settings dialog.
2. Click the Copy... button.
3. Give it a new Name.
4. Change its parameters as you wish (see The Press Settings in Detail).
5. Click OK.
Editing a Press Setting
To edit a Press Setting:
1. Select it in the Press Settings dialog.
2. Click the Modify... button.
3. Change its parameters as you wish (see The Press Settings in Detail).
4. Click OK.
Deleting a Press Setting
To delete a Press Setting:
1. Select it in the Press Settings dialog.
2. Click the Delete button.
3. Confirm that you want to delete it.
Attention:
Deleting Press Settings might also affect other workstations.
Choosing a Press Setting
• To select a Press Setting, click on it in the Viewer dialog’s fly-out menu.
The Press Settings in Detail
First Dot (%)
Specifies which minimal gray value (expressed in %) in the file still will yield a dot on the plate,provided the RIP and platemaking occur under normal conditions.
Note:
Normal conditions indicate that the DGC must have been set up completely. The value does notcorrespond with any measurement that has been made prior or during DGC set up, nor does itcorrespond with any densitometer measurement on plate or on print. In fact, this value is (implicitly)chosen by the person who set up the DGC and plate-making. Typical values range from 0.4% to1.6%.

9i-cut Layout
145
PackEdge uses 8-bit precision, yielding 256 different possible gray values. A single gray value in animage may make the difference between a dot or no dot on a flexo plate. To allow for this precision,Viewer uses percentages with one decimal digit.
8-bit gray value in PackEdge Percentage
0 0.0%
1 0.4%
2 0.8%
3 1.2%
... ...
254 99.6%
255 100%
Note:
If you do not specify a first dot, you will not be able to use the following Viewer view modes for thispress setting:
• The Flexo Plate Preview• The Flexo Print Preview
Dot Gain in Highlights
When you have specified a First Dot job percentage, you can also specify how dark it should actuallyprint. Enable Dot Gain In Highlights and specify the dot gain parameters:
• First Dot Prints As: indicates the dot gain for the first dot. Typical values range from 5% to 15%depending on the substrate. The value is a job percentage, that will print on an ideal referencepress as dark as the first dot prints on this press.
• Range: while the previous value measured the amount of dot gain in the highlights, this valueexpresses how far this effect penetrates into the midtones. Typically plate making is configuredin such a way that the mid-tones print like an offset press.
Note:
If you do not specify Dot Gain In Highlights, you will not be able to use the following Viewer viewingmode: Flexo Print Preview.
Limited Total Area Coverage
The Total Area Coverage is the sum of percentages of the different channels on the same location.A higher total area coverage means more of the various inks is printed on top of each other.
If you want, you can specify the Maximum Total Area Coverage to specify the maximum amount ofink that the substrate can take on the same spot on your press.
Note:
Exceeding the Maximum Total Area Coverage for the press may cause drying problems, unexpectedcolor results, and other problems.

9i-cut Layout
146
Registration Error
Specifies the average maximum Registration Error on your press.
If you enable this option in the Press Settings, you can use the Registration Errors preview in Viewerto check whether your trapping is sufficient to compensate for possible registration errors on thepress.
Moiré Settings
In the Moiré Detection settings of the Press Settings, you can define the default values for the settingsin the Moiré Detection window.
For more info on the different settings, see Moire Detection
The Viewer windowViewing options
Options particular to certain Viewer previews are grouped under View Options. You can expand orcollapse them using the triangle beside View Options.
The following options are available in all Previews:
Separation visibility
In the Ink list, you can:
• Click the eye icon in front of a separation/color name to show or hide it.• Click the eye button above the separations/colors list to show or hide all separations/colors.• Click the ink name (not the eye button) to quicly hide all other separations and go in single-
separation mode.
Reverse Printing Order
Use the Reverse Printing Order button to view how your file would look like with its ink orderreversed.
When Reverse Printing Ink Order is enabled ( ), it is always used in all windows, and a red arrowicon is visible in the title bar of all the windows.
Orientation
The orientation buttons allow to change the orientation of the Preview of the job.
This is applied to all windows when Show in All Windows is active, or only to the current windowwhen Show in All Windows is inactive.
Note:
Keep in mind that this only changes the rotation of the preview, it does NOT actually rotate the job.
Separations
The first viewing mode shows a list of used inks.

9i-cut Layout
147
Mode
By default a separation is displayed in color. In order to see a separation as it would appear on film,you can switch to “Show as Film: Positive”.
By switching to “Show as Film: Negative”, the visible separation will be shown in negative.
Note:
As both “Show as Film: Positive” and “Show as Film: Negative” are more useful on a singleseparation, switching to one of those will show only one separation.
Highlight
Traps
The Traps checkbox highlights all automatic traps in the file, so you can check your trapping.
Transparency
This will highlight all objects that have an opacity percentage, a blend mode or an opacity mask(regardless of what is underneath).
Overprint
Highlight Overprint will highlight the areas where an “overprint” setting in the paint style takes effect.
Screening Conflict
The Screening Conflict checkbox highlights areas where a screening conflict can occur. They canoccur if an object with transparency (opacity mask, opacity percentage or blend mode) is overlappingon an object with another screening. The PDF definition clearly states that screening is always takenfrom the topmost object, even if that object is completely transparent in some areas. In most cases,this is not what you would expect.
In the example underneath, you can see a cyan rectangle, and a circle on top, with an opacity mask.The objects have a different screening. Where the circle is on top of the cyan rectangle, the cyanwill take the screening of the blended circle. Therefore, as shown on the right, these areas will behighlighted as Screen Conflict.

9i-cut Layout
148
Dim Artwork
When you enable an Highlight option, the document artwork is faded to the percentage you choosein Dim Artwork
Color
When you enable a Highlight option, the objects are highlighted in the color you chose in the ColorPicker.
Color
This viewing mode shows a list of used colors.
Click the eye-icons in front of the colors to show or hide them.
Click the eye button above the colors list to show or hide all colors.
Total Area Coverage
The Total Area Coverage (TAC) is the sum of all separation-densities at a certain point in yourdocument.
TAC Limit
The TAC Limit is the maximal Total Area Coverage that your document may contain. This valuedepends on the press and the substrate your design will be printed on. Your printer should provideyou with the TAC Limit value to use.
Defining the TAC Limit
The TAC limit is defined in the Press settings. See Define Press Settings). By default the TAC Limitis set to 270%.
Viewing areas over the TAC Limit
When you switch to the Total Area Coverage preview, the image in the preview pane will be dimmedand all areas where the sum of the densities is higher than the TAC limit specified in the current PressSetting will be displayed in 100% black.
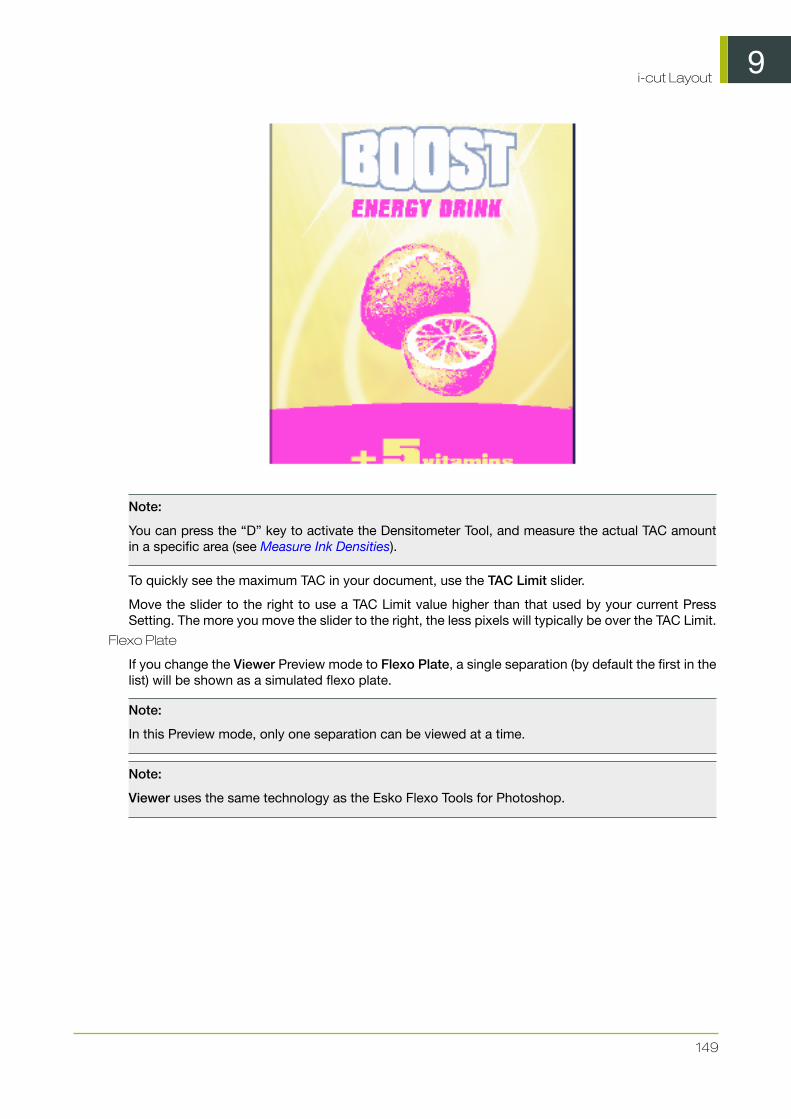
9i-cut Layout
149
Note:
You can press the “D” key to activate the Densitometer Tool, and measure the actual TAC amountin a specific area (see Measure Ink Densities).
To quickly see the maximum TAC in your document, use the TAC Limit slider.
Move the slider to the right to use a TAC Limit value higher than that used by your current PressSetting. The more you move the slider to the right, the less pixels will typically be over the TAC Limit.
Flexo Plate
If you change the Viewer Preview mode to Flexo Plate, a single separation (by default the first in thelist) will be shown as a simulated flexo plate.
Note:
In this Preview mode, only one separation can be viewed at a time.
Note:
Viewer uses the same technology as the Esko Flexo Tools for Photoshop.
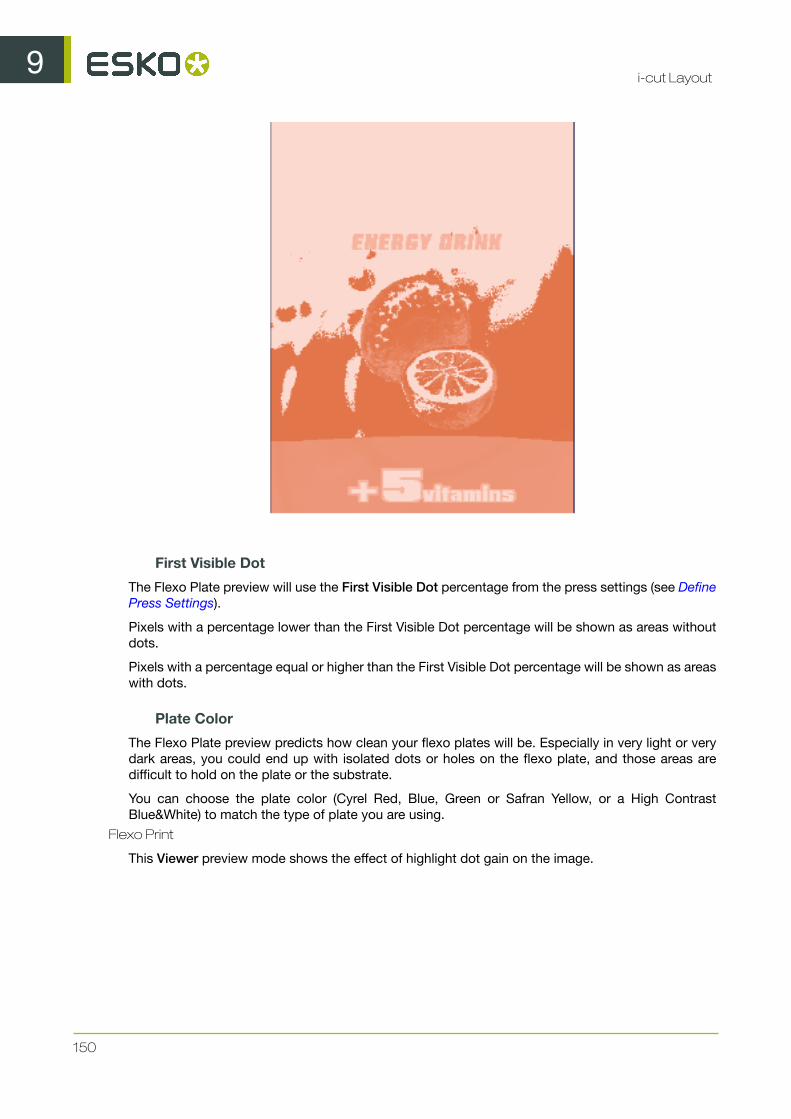
9i-cut Layout
150
First Visible Dot
The Flexo Plate preview will use the First Visible Dot percentage from the press settings (see DefinePress Settings).
Pixels with a percentage lower than the First Visible Dot percentage will be shown as areas withoutdots.
Pixels with a percentage equal or higher than the First Visible Dot percentage will be shown as areaswith dots.
Plate Color
The Flexo Plate preview predicts how clean your flexo plates will be. Especially in very light or verydark areas, you could end up with isolated dots or holes on the flexo plate, and those areas aredifficult to hold on the plate or the substrate.
You can choose the plate color (Cyrel Red, Blue, Green or Safran Yellow, or a High ContrastBlue&White) to match the type of plate you are using.
Flexo Print
This Viewer preview mode shows the effect of highlight dot gain on the image.
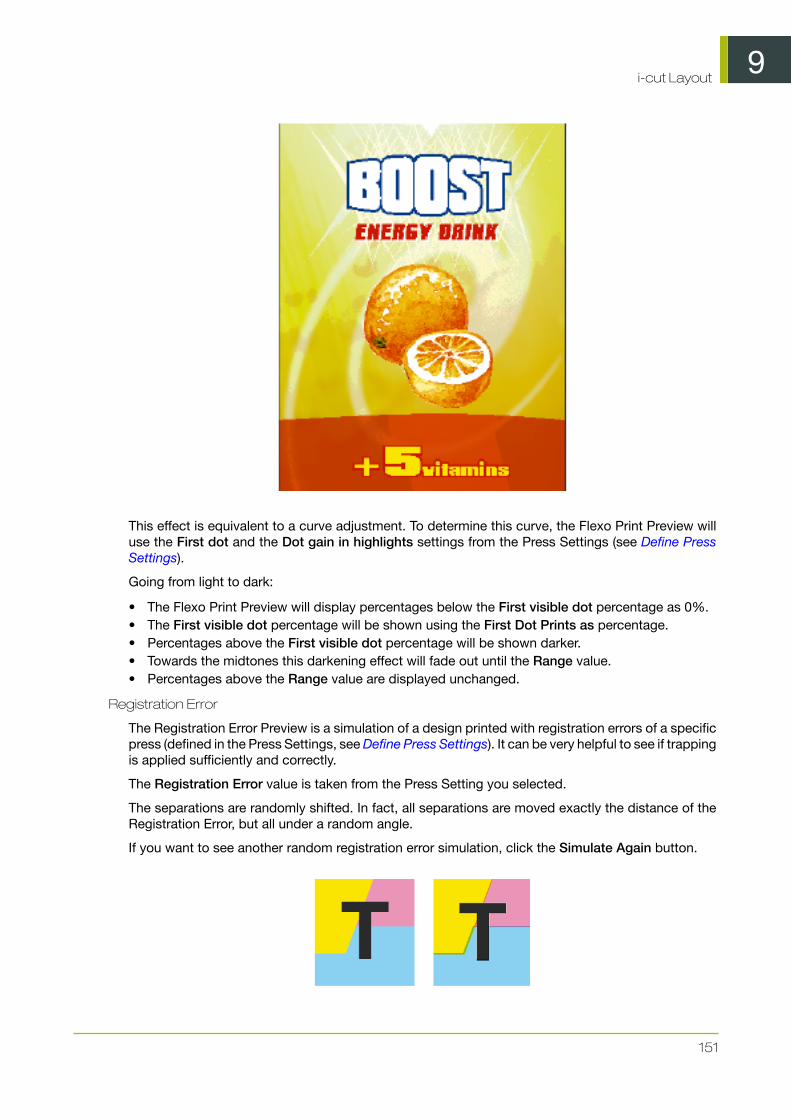
9i-cut Layout
151
This effect is equivalent to a curve adjustment. To determine this curve, the Flexo Print Preview willuse the First dot and the Dot gain in highlights settings from the Press Settings (see Define PressSettings).
Going from light to dark:
• The Flexo Print Preview will display percentages below the First visible dot percentage as 0%.• The First visible dot percentage will be shown using the First Dot Prints as percentage.• Percentages above the First visible dot percentage will be shown darker.• Towards the midtones this darkening effect will fade out until the Range value.• Percentages above the Range value are displayed unchanged.
Registration Error
The Registration Error Preview is a simulation of a design printed with registration errors of a specificpress (defined in the Press Settings, see Define Press Settings). It can be very helpful to see if trappingis applied sufficiently and correctly.
The Registration Error value is taken from the Press Setting you selected.
The separations are randomly shifted. In fact, all separations are moved exactly the distance of theRegistration Error, but all under a random angle.
If you want to see another random registration error simulation, click the Simulate Again button.

9i-cut Layout
152
In the example above, you can see a small area of a job in regular preview (left) and with registrationerrors (right). In this case, you can clearly see no trapping was applied, so white lines appear at theregistration shifts.
Breakout
A Breakout is an area where the percentage of a single separation is lower than the First Visible Dotvalue. This can be used to track areas that won’t show up on print because the values are too low.
Your printer should provide you with the First visible Dot value. The First visible dot is set in the PressSettings: see Define Press Settings.When switching to Breakout mode, the preview will be dimmedand all areas where a single separation has a value lower than the First Visible Dot value (but higherthan 0%), will be displayed in highlight color.
You can measure the actual percentages in that specific area using the densitometer (see MeasureInk Densities).
Moire Detection
Moire Detection allows to detect possible screening problems (Moire) in the file.
You can set the options to highlight overlapping areas, to detect situations in which Moire mightoccur:
• when the two overlapping areas have screening angles that do not differ 30 degrees.• when the two overlapping areas have the same angle• when the two overlapping areas have different rulings• when the two overlapping areas have different dot shapes.
You can use the Ignore inks option to ignore inks that have

9i-cut Layout
153
• a density lower than a certain value,• a density higher than a certain value• a Luminance higher than a certain value
as in all those cases, the Moire patterning will hardly be visible.
All these Moire Detection options are stored in the Press Settings. See Define Press Settings
Viewer Compare Tool
You can use the Viewer Compare tool to compare the active document with another document.
To compare the active job:
1. Go to Window > Esko > Viewer > Compare...
The Compare dialog opens, and the name for the Current Document is shown.
2. Select the file you want to compare the active document to:
• If you want to compare it to an open document, select its file name from the dropdown list• If you want to compare it to a document on disk, click the browse button and select the file
3. Define what to compare:
• all artwork• the current Artboard• only Trim Box or Media Box (if they are defined)• only the selected area.
4. Click OK
A Viewer Compare window will open, showing a comparison between the two jobs.
Note:
If you have a Trim Box defined in the Illustrator job, the Viewer Compare tool will only show what’sinside the trim box.
The Viewer Compare window
The Viewer Compare window shows the two jobs and their differences, and contains a number oftools and buttons to inspect these differences in various ways.
Move over a button with the cursor and the tooltip will indicate what it stands for.
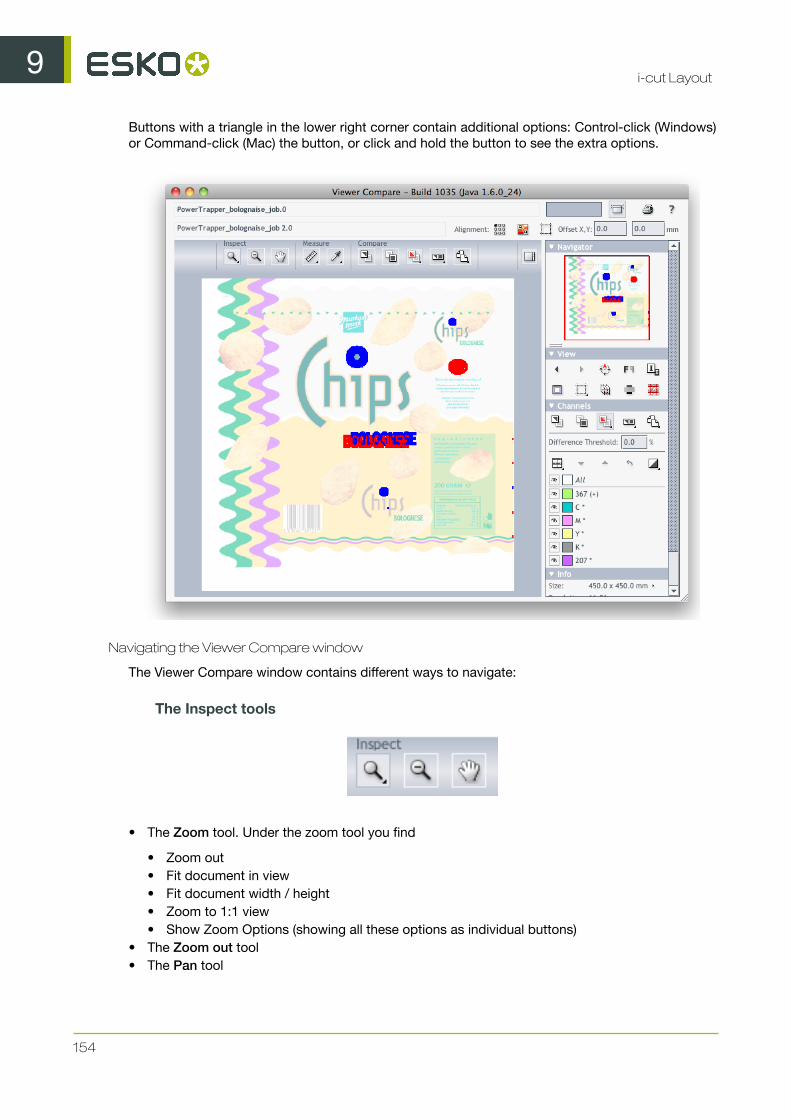
9i-cut Layout
154
Buttons with a triangle in the lower right corner contain additional options: Control-click (Windows)or Command-click (Mac) the button, or click and hold the button to see the extra options.
Navigating the Viewer Compare window
The Viewer Compare window contains different ways to navigate:
The Inspect tools
• The Zoom tool. Under the zoom tool you find
• Zoom out• Fit document in view• Fit document width / height• Zoom to 1:1 view• Show Zoom Options (showing all these options as individual buttons)
• The Zoom out tool• The Pan tool

9i-cut Layout
155
The Navigator
By dragging the red rectangle (when zoomed in), you can navigate through the job.
The View options
The View options allow to go back to the previous view, or use additional settings, such as rotate,invert or mirror the view.
Compare modes
Using the Compare butons, you can choose different Compare modes / views
• View Current version only• View Reference version only• View Both documents on top of each other.
Additional options:
• View Both in their original colors• View Both - Show difference: the differences will be shown in the "Added" and "Substracted"
highlight colors.• View Both - highlight difference: same as above, but the identical parts are dimmed.• View Both - only difference: same as above, but the identical parts are hidden.

9i-cut Layout
156
• Change "Added" Highlight Color, Change "Substracted" Highlight Color and Change BothHighlight Color, to change the colors in which differences are shown
• Reset Difference Highlight Colors to reset the default colors• Channel Matching, to match corresponding channels/inks for the two documents.
• View Both - side by side shows both versions next to each other. You can choose between
• Automatic tiling• Horizontal tiling• Vertical tiling.
• View both - mirror reference shows the current document on top of the mirrored referencedocument.
Alignment
Comparing files with different sizes may seem like a challenge as they are not aligned in the ViewerCompare window, but it provides some tools that make it very easy.
• Alignment
• on one of 9 corner / center points• Align From Ruler: see Align from Ruler• Auto Align From Ruler: see Auto Align from Ruler• Auto Align: see Auto Align
• Auto Align: see Auto Align• Use trim box for alignment• Offset, Horizontal and Vertical
Align from Ruler
The ruler tool works by defining two points (one in each file) that have to be aligned.
1.
Select the reference version of the file by clicking the icon.
2.
Select the Ruler tool
3. Indicate the ruler anchor point

9i-cut Layout
157
4.
Switch to the other version by clicking the icon (or use Ctrl + S).
The anchor point, here in the red circle, will be in a different location in the second file version.
5. Indicate the point that should be positioned on the ruler anchor point (here in the blue circle)
6.
Click the Alignment button and select Align From Ruler. The files are now aligned.
Note: Depending on how precisely you defined the second ruler point, you may have to zoom inand repeat the alignment procedure to align your files with more precision.
Auto Align from Ruler
Auto Align from Ruler is used the same way as the Align from Ruler tool, but is more accurate athigh resolution.
If the details of the alignment points match, the viewer will be able to increase the alignment precision(and have a good alignment with fewer iterations).
Auto Align
Auto Align does not use the ruler, but rather the currently visible view of the two compared imagesto attempt an automatic alignment.
For convenience, a separate tool button is available to perform an Auto Align operation without havingto open the Alignment pop-up menu. Clicking this button will perform an Auto Align from Ruler if aruler selection is active, otherwise an Auto Align (from view).

9i-cut Layout
158
Viewer Compare Preferences
You can open the Compare Preferences by choosing Illustrator > Preferences > Esko > ViewerCompare Preferences (on Mac OS) or Edit > Preferences > Esko > Viewer Compare Preferences(on Windows).
You can define the resolution for the Viewer Compare previews: either based on the document size,or at a fixed resolution. "Based on Document Size" will result in a low resolution for big documents,so e.g. aligning will become more difficult when zooming in. On the other hand, a "Fixed Resolution"can result in a very heavy preview calculation if the fixed resolution is high and the document is large.
You can define if anti-aliasing should be applied.
9.1.4 Arrange menu
The Arrange menu contains following items:
• To Front : To move an object on top of all other objects within the current layer.• To Back : To move an object underneath all other objects within the current layer.• Forward : To move an object one step up within the current layer.• Backward : To move an object one step down within the current layer.
9.1.5 Preparation menu
The Preparation menu contains following items:
• Edit Graphics File allows to open the graphics file in the default editor. This gives the same resultas double-clicking the graphics file in your operating system.
• Select Cut Path... allows you to select a (already existing) cut path. See Select Cut Path.• Create Cut Path... allows you to create a new cut path. See Create cut path.• Optimize Cut Path... allows you to optimize the cut path. See Optimize Cut Path.• Place Graphic... allows you to add a graphic and immediately place it in the layout you are
currently working on.• Replace by... allows you to replace a Graphic. See Replacing a graphic.• Assign Graphic to Design... allows you to assign a Graphic to a CAD design.• Replace by Graphics File... allows you to replace a Graphic. See Replacing a graphic..• Export Graphic... allows you to export a Graphic, including all changes you made, such as
creating a Cut Path, adding bleed, .... See Export Graphic..
9.1.6 Inks menu
The Inks menu contains following item:
• Inks... : To add, modify or remove Inks and to display the current inks in your job with theirproperties.
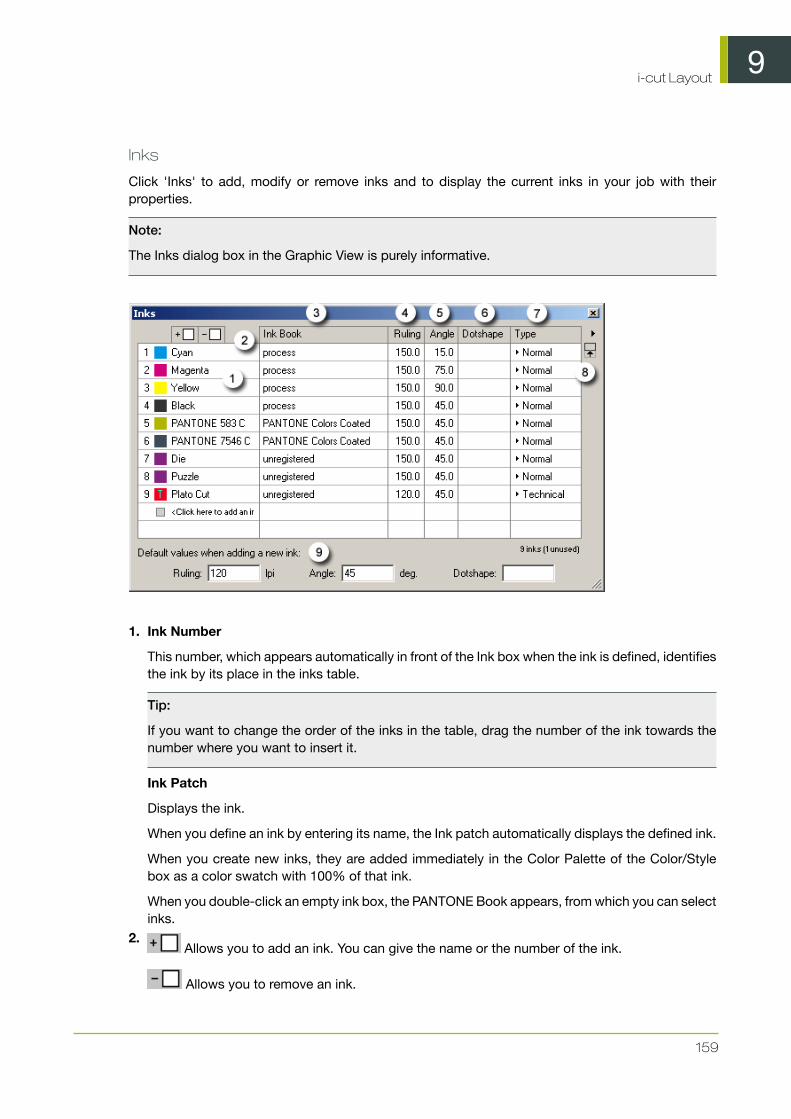
9i-cut Layout
159
Inks
Click 'Inks' to add, modify or remove inks and to display the current inks in your job with theirproperties.
Note:
The Inks dialog box in the Graphic View is purely informative.
1. Ink Number
This number, which appears automatically in front of the Ink box when the ink is defined, identifiesthe ink by its place in the inks table.
Tip:
If you want to change the order of the inks in the table, drag the number of the ink towards thenumber where you want to insert it.
Ink Patch
Displays the ink.
When you define an ink by entering its name, the Ink patch automatically displays the defined ink.
When you create new inks, they are added immediately in the Color Palette of the Color/Stylebox as a color swatch with 100% of that ink.
When you double-click an empty ink box, the PANTONE Book appears, from which you can selectinks.
2. Allows you to add an ink. You can give the name or the number of the ink.
Allows you to remove an ink.

9i-cut Layout
160
Caution: You cannot delete inks that are used in external references, nor are you allowed toremove the i-cut Layout Cut and i-cut Layout Crease inks.
3. Ink Book : Lists to which ink book the ink belongs. Information on the Ink Book is automaticallyassigned by i-cut Layout and is for your information only.
4. Ruling : To define the screen ruling for the ink (to obtain the appropriate printing quality).
The default value is 120 lines per inch. For more specific information on screen ruling, we referyou to the manual on Screens.
5. Angle : To define the screen angle for the ink (to avoid moiré patterns, especially when usingprocess inks). For more specific information on screen angles, we refer you to the manual onScreens.
6. Dotshape : To define the dot shape for the ink.
M for Monet, E for Elliptical, ...
For more specific information on dot shapes, we refer you to the manual on Screens7. The Inks Type : choose Normal, Opaque, Varnish or Technical from the drop-down list.
• Normal - Normal inks are inks that appear transparent when printed over other inks. Normalis the default type for all inks.
• Opaque - Opaque inks are inks that appear opaque when printed over other inks. Setting anink to the Opaque type affects only the display of the ink.
• Varnish - Varnish inks are inks that are used to create varnish sheets. An ink set to Varnishdoes not display its color. Setting an ink to the Varnish type affects only the display of the ink.
• Technical - Technical inks are inks that are used for layout purposes only. i-cut Layout's CutInk and Crease Ink are examples of Technical inks. Setting an ink to the Technical type doesnot affect the display but does affect their use in marks. Graphic Numbers, Geometry Marksand SmartMarks ignore technical inks.
8. Opens a new menu:
• Show Options: displays / hides the options at the bottom of the Inks dialog box.• Columns: select the columns you want to see.• Remove Unused Inks - removes inks that no longer are used in the document.• Remove Unused Colors and Inks - removes inks and colors that no longer are used in the
document. This option will combine colors in i-cut Layout's internal palette that are the sameand then remove inks and colors that no longer are used.
• Sort Light to Dark - sorts the inks in the document so that the lightest is first and the darkestis last.
9i-cut Layout
161
• Sort Dark to Light - sorts the inks in the document so that the darkest is first and the lightestis last.
• Change Dotshape and ruling of All Inks... opens a dialog box which allows you to define theruling and dotshape for all the inks.
9. Default values when adding a new ink : define the default settings for ruling, angle anddotshape, these settings will be used when new inks are added.
9.1.7 Tools menu
Note:
This menu will only be enabled in the Sheet View.
The Tools menu contains following items:
• The Adjust Masks tool is used to adjust overlapping Graphics.• Reset Masks removes all masks that were generated using the ‘Adjust Masks’ tool.• Turn Front to Back will rotate the sheet around the vertical center of the sheet and create the
back of the file. With this command, the left edge of the sheet becomes the right edge of thesheet on the back.
• Tumble Front to Back will rotate the sheet around the horizontal center of the sheet and createthe back of the file. With this command, the top of the sheet becomes the bottom of the sheeton the back.
• Delete Back deletes the back side of the sheet.• Tiling ... allows you to apply tiling to the selected Graphic. See Tiling Graphics• Jigsaw Tiling allows you to apply advanced tiling to the selected Graphic. See Jigsaw Tiling• Sheet Presets... opens the Sheet Presets. See Sheet Presets.
9.1.8 Production menu
The Production menu contains following item:
• SmartMarks opens the SmartMarks dialog box. See Working with SmartMarks• Studio Designer opens the Studio Designer window. See Studio Designer
Studio Designer
Studio Designer offers a 3D viewing environment where designers can see their artwork appliedinstantly on the packaging. It also includes navigation tools, and by writing a 3D PDF file from StudioDesigner, designers can share their ideas with clients for review and approval.
Studio reduces time-consuming mock-ups, spots design-errors faster and takes away theguesswork from 2D flats.
For folding carton or corrugated packaging, the shapes can be supplied by ArtiosCAD or Score!.
The Studio tools in i-cut Layout can be found in Production > Studio Designer

9i-cut Layout
162
Note:
Studio Designer inside i-cut Layout only contains preview functionality. Some of the functionsdescribed in the documentation underneath are NOT available in i-cut Layout.
Introduction
Welcome to the Studio Designer documentation.
This documentation describes Studio Designer as a plugin in Illustrator as well as Studio integrated inother EskoArtwork applications such as PackEdge. Although the documentation is based on StudioDesigner in Adobe Illustrator, the functionality is the same in other versions.
About Studio Designer
Studio Designer is a plug-in for Adobe Illustrator, ArtPro, PackEdge and Plato, for interactive 3Dpackaging design which helps designers make graphic designs or do pre-press for folding carton,bag files, cans, corrugated boxes, flexible packages and so on. Studio Designer works with structuraldesign files, created in ArtiosCAD or Studio Toolkit. These can be ARD files, .bag files or .dae/.zaefiles (Collada files with a printable part defined). Once a structural design file is placed in a document,Studio Designer can display a three-dimensional preview of the packaging with the artwork renderedon it. This allows designers to see how their graphics will look on the final package. Studio Designeralso lets you load a multi-part structural design file as a scene. Each part of the scene can getits graphics from another document. Studio Designer also contains productive tools for quick andaccurate aligning and duplicating graphic elements.
Studio Designer is able to export a three-dimensional package to PDF and it can export snapshotsof the three-dimensional package to an image file.
About Structural Design files
A structural design file should always contain 2D information, and possibly even 3D information. If thestructural design file contains 3D information, Studio Designer can show a folded 3D representationof the structural design file.
A structural design file (2D and 3D) contains all the cut and crease lines for a specific type of package.A structural design file may also contain folding angles that define how the package is to be foldedinto its final shape. The structural design file does not contain the graphics, only the structural lines.To bring the structural design and the graphic design together, a structural design file can be placedor opened.
Supported structural design file formats:
• ArtiosCAD or Studio Toolkit for Boxes (.ard files) for boxes• Studio Toolkit .bag files• Collada files with a printable part (.dae or .zae files)
In case a Collada file is placed, a check is performed to see if the Collada file has a printable partdefined. A printable part is an Esko extension to the Collada format.
Collada files with one or more printable parts can also be created in Studio Toolkit and ArtiosCAD.
You can also load a structural design file as an extra scene in the Studio window. Each part of thescene can get its graphics from another illustrator document. See Scenes and Multiple Documents
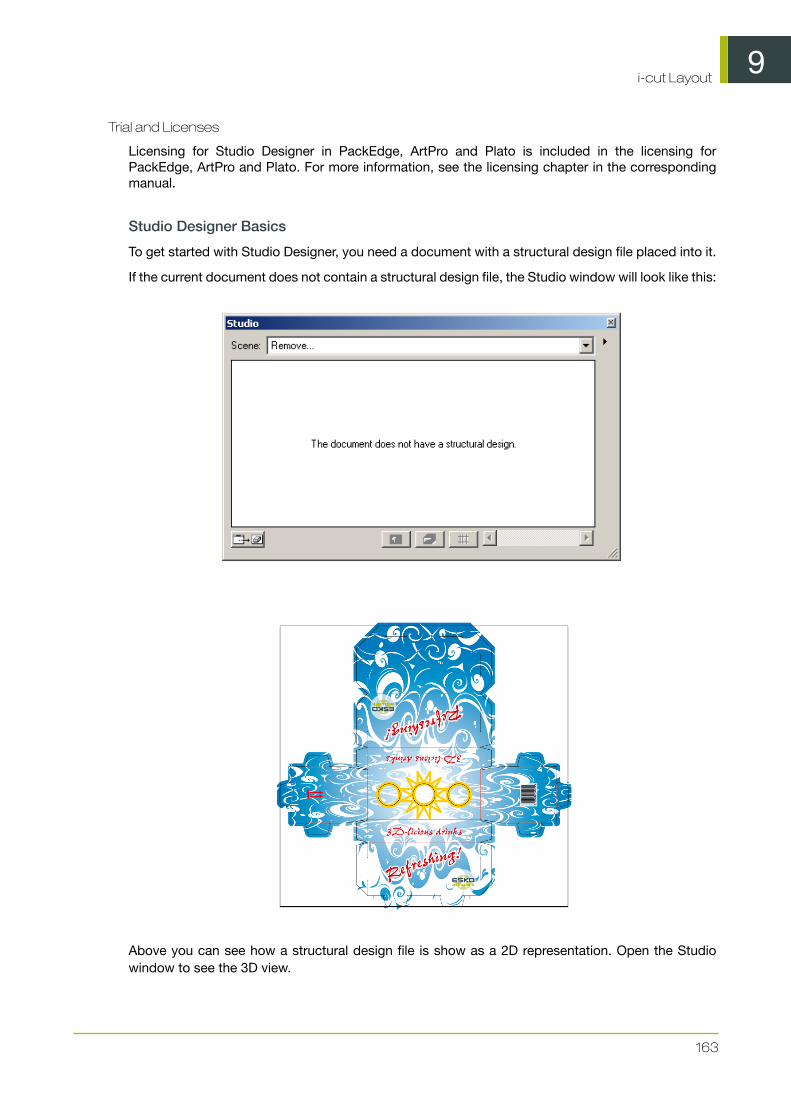
9i-cut Layout
163
Trial and Licenses
Licensing for Studio Designer in PackEdge, ArtPro and Plato is included in the licensing forPackEdge, ArtPro and Plato. For more information, see the licensing chapter in the correspondingmanual.
Studio Designer Basics
To get started with Studio Designer, you need a document with a structural design file placed into it.
If the current document does not contain a structural design file, the Studio window will look like this:
Above you can see how a structural design file is show as a 2D representation. Open the Studiowindow to see the 3D view.

9i-cut Layout
164
The Studio Window
The Studio window is the heart of Studio Designer. It is a floating palette where you can see thethree-dimensional shape of the package.
To view the Studio window, choose Production > Studio Designer...
Note:
If the placed ARD file does not contain folding angles, the plug-in cannot know how the box has tobe folded. In that case 90-degree foldings are assumed on all folding lines. If the resulting shape isnot the intended one, the proper folding angles need to be added to the ARD file, for example usingArtiosCAD or Studio Toolkit for Boxes.
Refreshing
By clicking the Refresh button in the bottom-left corner of the Studio Window, the graphicswill be drawn on the box. Every time the graphics change, the Studio Window will onlyupdate if you click the Refresh button.

9i-cut Layout
165
Refresh is also available via refresh in the fly-out window.
If Auto-Refresh is enabled in the fly-out window, the Studio Designer window willautomatically be refreshed every time your document is changed.
Changing the viewing Angle and Distance
In the Studio Window, you can look at the package from different angles. You can simplyclick and drag to rotate the 3D object.
To indicate that the package is not floating in mid-air, the floor concept was introduced. Apackage in the Studio Window is always positioned relative to the floor, giving the package atop and bottom definition. If the package (currently only boxes) is showing the wrong panelas top panel, then you can use the Turn Box option. See Turn Box
By moving the slider in the bottom-right corner you can look at the box from a closer orfurther distance.
Note:
When your box is facing the wrong way and when you have difficulty to turn your box upright,try using Turn Box... The turning around functionality has been designed in such a way thatit works fine if you have selected the right bottom panel.
Changing the Appearance
You can open the Appearance dialog by choosing Appearance from the fly-out menu.
In the Appearance dialog you can change several appearance settings. Depending on whichkind of structural design file is shown in your Studio Window you can modify the BackgroundColor and Inside Color, change the Floor Reflection, set the Shadows or Highlights or evenchange the Highlight Type of your flexible packaging substrate of a .bag file.
When working with boxes (ard files) there is also the Show board thickness option, withthis option on not only the board thickness is shown but also the corrugated edges fromthe board chosen in the ard file.

9i-cut Layout
166
When working with flexibles (bag files), the inside of the bag will be shown using thedefinedInside Color. As in a correctly designed bag the inside is not visible, setting a (bright)inside color can be used to visually check your bag files.
Note:
All settings, except the Floor Reflection, from the Appearance dialog are used in the Exportdialog.
Working with Panels
A box design and a bag design consist of a set of panels which are folded relative to each other.
Selecting Panels
In the Studio Window you can select a panel, simply by clicking on it. The selected panel isused by certain Studio Designer features and does not affect the selected artwork.
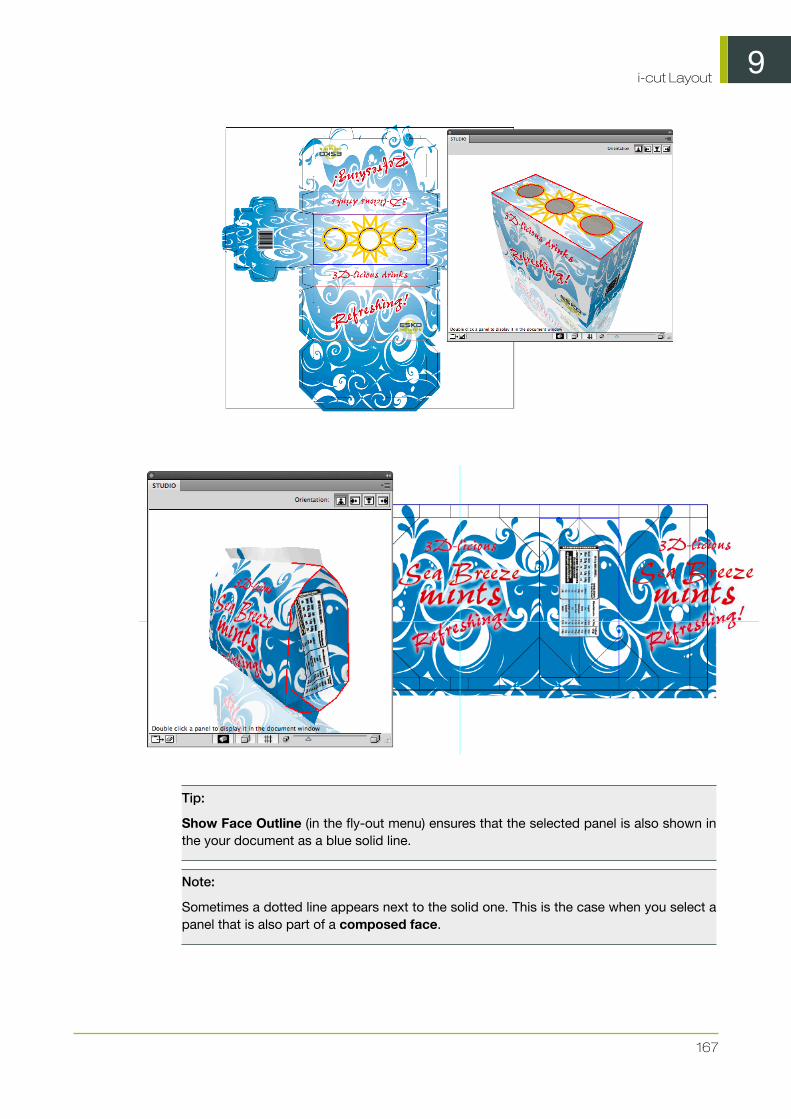
9i-cut Layout
167
Tip:
Show Face Outline (in the fly-out menu) ensures that the selected panel is also shown inthe your document as a blue solid line.
Note:
Sometimes a dotted line appears next to the solid one. This is the case when you select apanel that is also part of a composed face.
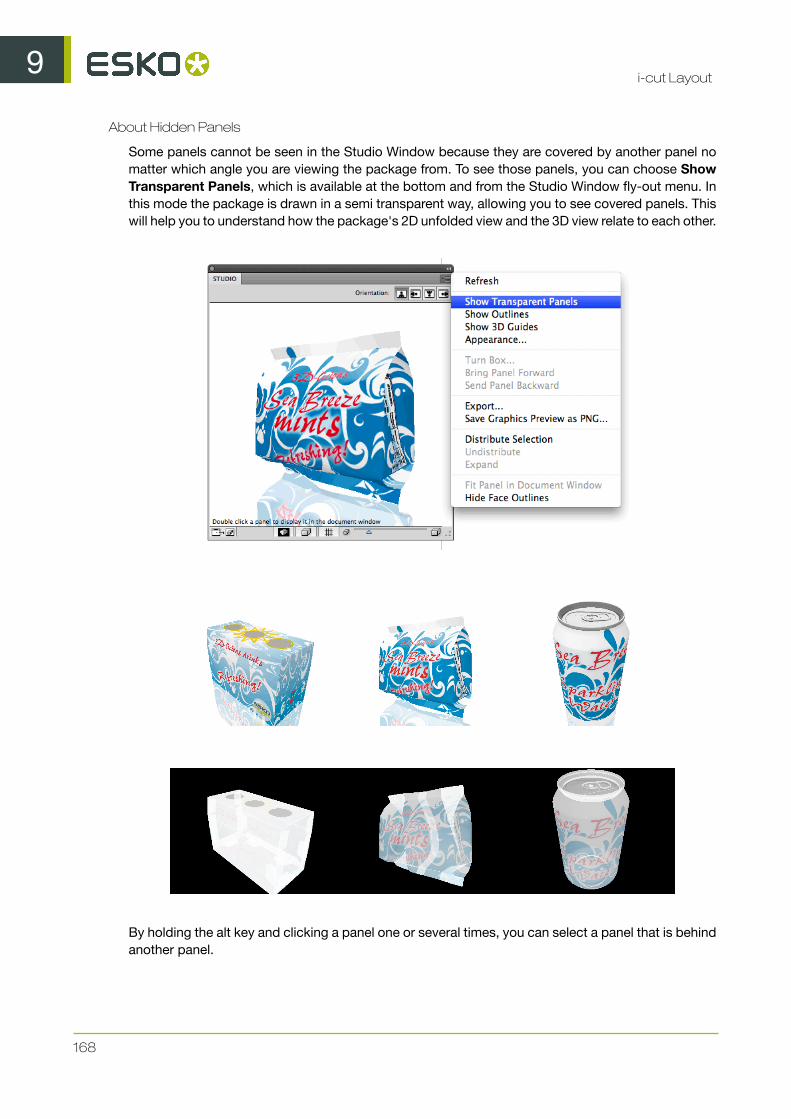
9i-cut Layout
168
About Hidden Panels
Some panels cannot be seen in the Studio Window because they are covered by another panel nomatter which angle you are viewing the package from. To see those panels, you can choose ShowTransparent Panels, which is available at the bottom and from the Studio Window fly-out menu. Inthis mode the package is drawn in a semi transparent way, allowing you to see covered panels. Thiswill help you to understand how the package's 2D unfolded view and the 3D view relate to each other.
By holding the alt key and clicking a panel one or several times, you can select a panel that is behindanother panel.

9i-cut Layout
169
Zooming in on Panels in the document window
If you double-click a panel (or if you select Fit Panel in Document Window from the StudioWindow's fly-out menu), the document window will zoom in on the corresponding part ofthe graphics.
If your graphics are in another document, then this document will become active.
Since only one document can be open at once, this will close the open document. If theopen document was changed, you will be asked if you want to save the document first.
Furthermore, the orientation of the document window will change to match the orientationin the Studio Window as closely as possible.
You can also zoom in by holding down the Ctrl key and dragging a rectangle around thearea you want to zoom in on.
By spinning the package and double-clicking the different panels, the Studio Window canbe used to navigate through the document.
Turn Box
When working with designs for folding carton or corrugated boxes, you might not be able toposition the box in the desired viewing angle in the Studio Window. This happens when thepackage has the wrong panel(s) facing up. You can change this e.g. in the structural designfile (by selecting another Base Panel in ArtiosCAD or Studio Toolkit for Boxes), but you canalso turn the box in the Studio Window. Just select a panel that should be facing up or downand select Turn Box from the Studio fly-out menu. The Turn Box functionality is linked withthe Floor concept, so e.g. The selected panel facing up means that the selected panelwill become the top panel relative to the floor.
Note:
The Turn Box option is only available for boxes (ard, vlm and scb files)

9i-cut Layout
170
Bring Panel Forward and Send Panel Backward
This functionality is only available for boxes and composed faces of which the panels are allin the same plane. Overlapping panels in the same plane can occur in any file. Sometimesthe order of these overlapping panels is incorrect. Most of the time, this will happen whenthe panels have been folded 90 degrees on top of each other. With Bring Panel Forwardand Send Panel Backward, you can correct this order.
If you wish to view another panel on top, you can select the panel, select Bring PanelForward from the Studio fly-out window and bring it forward.
Scenes and Multiple Documents
The 3D object that you see in the Studio window is typically the combination of two files: The artworkfrom the current Illustrator document and the shape from the structural design file that is placed inthat document.
However, sometimes you would like to make combinations of more than one Illustrator document ormore than one structural design file. Some examples are:
• A box with inside and outside artwork• A bottle with more than one label• A tray containing 6 cans• A complicated multi-piece display• ...
This chapter describes the different mechanisms behind these workflows.
Alternative scenesLoad Scene
At the top of the Studio Window is the Scene dropdown box. Here you can see which structuraldesign file is currently visible in the Studio Window. By default this is the same file that is placed inyour document, but from this drop down you can load other structural design files.
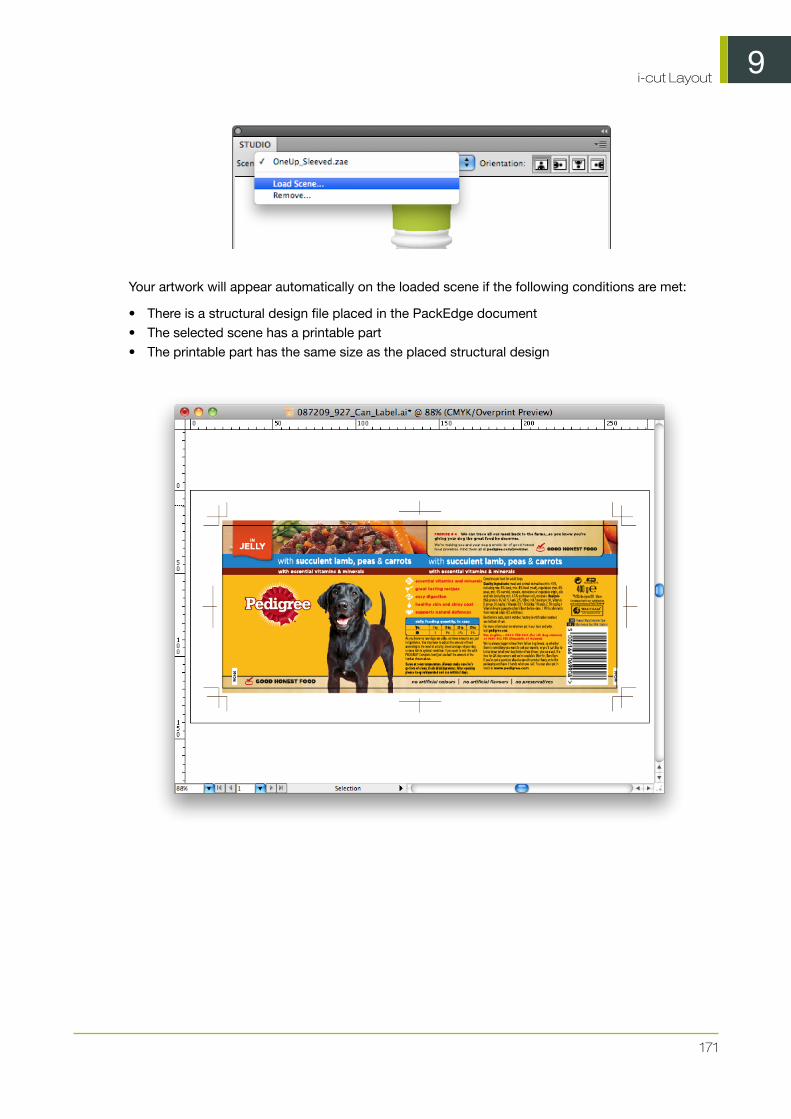
9i-cut Layout
171
Your artwork will appear automatically on the loaded scene if the following conditions are met:
• There is a structural design file placed in the PackEdge document• The selected scene has a printable part• The printable part has the same size as the placed structural design
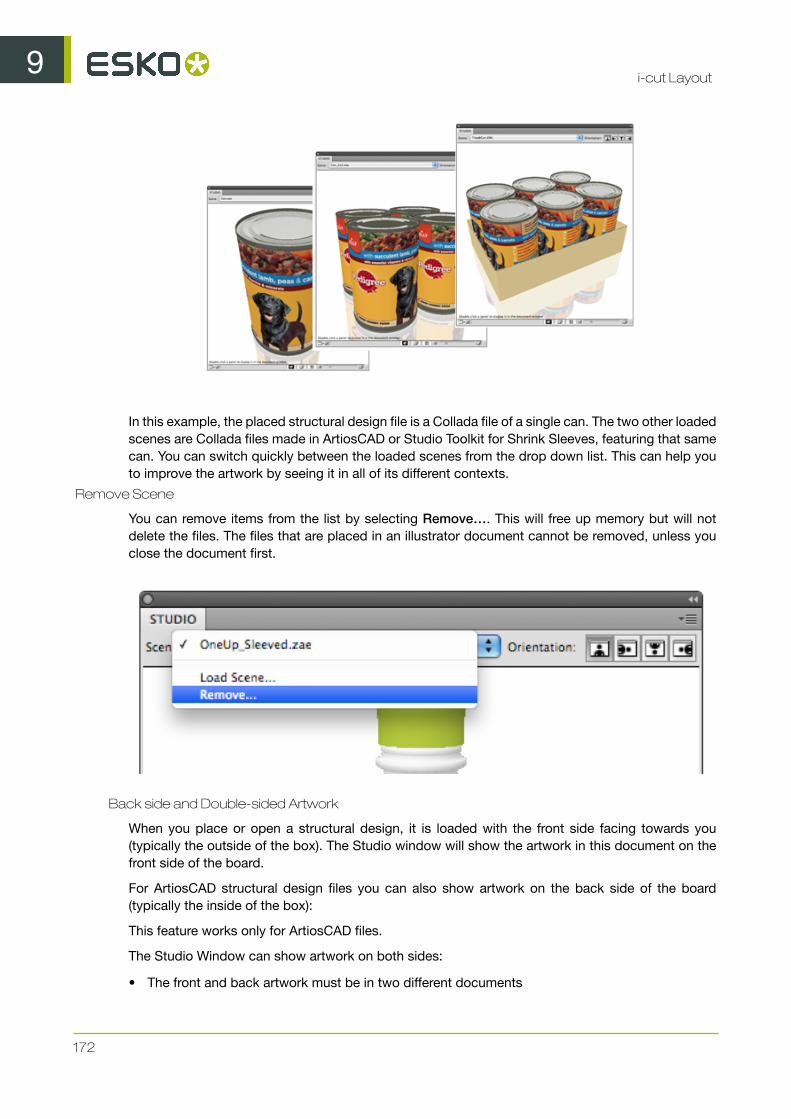
9i-cut Layout
172
In this example, the placed structural design file is a Collada file of a single can. The two other loadedscenes are Collada files made in ArtiosCAD or Studio Toolkit for Shrink Sleeves, featuring that samecan. You can switch quickly between the loaded scenes from the drop down list. This can help youto improve the artwork by seeing it in all of its different contexts.
Remove Scene
You can remove items from the list by selecting Remove…. This will free up memory but will notdelete the files. The files that are placed in an illustrator document cannot be removed, unless youclose the document first.
Back side and Double-sided Artwork
When you place or open a structural design, it is loaded with the front side facing towards you(typically the outside of the box). The Studio window will show the artwork in this document on thefront side of the board.
For ArtiosCAD structural design files you can also show artwork on the back side of the board(typically the inside of the box):
This feature works only for ArtiosCAD files.
The Studio Window can show artwork on both sides:
• The front and back artwork must be in two different documents
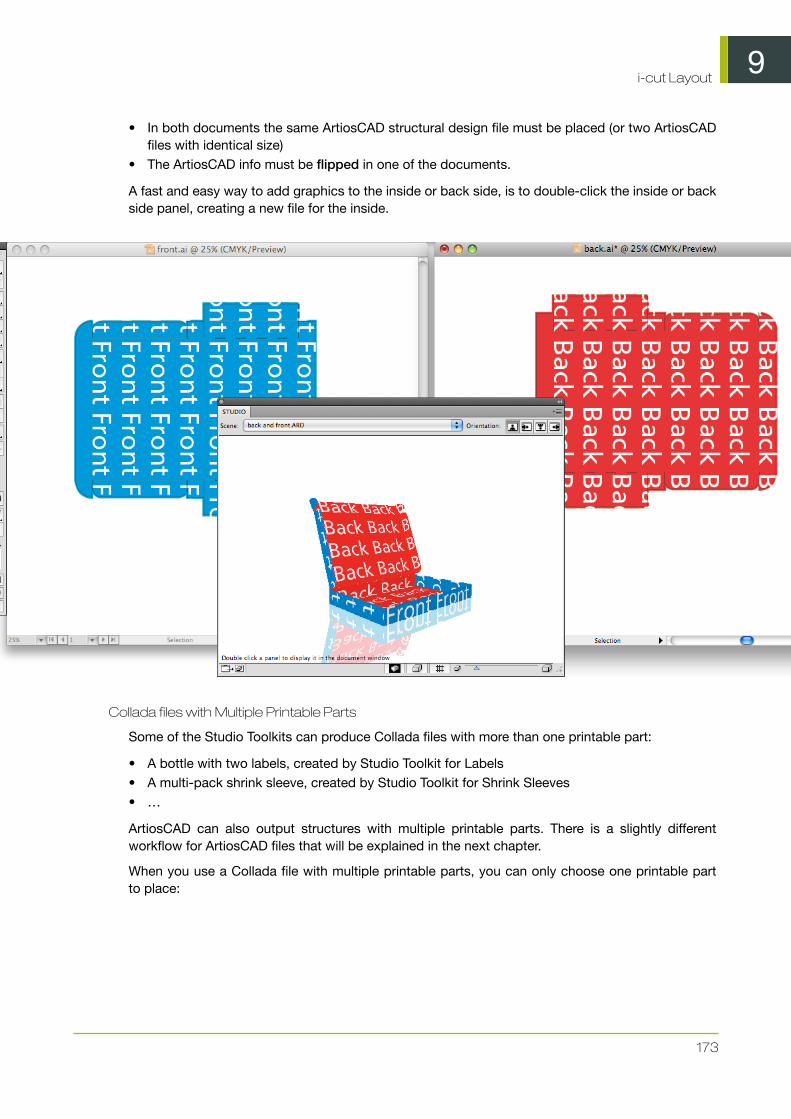
9i-cut Layout
173
• In both documents the same ArtiosCAD structural design file must be placed (or two ArtiosCADfiles with identical size)
• The ArtiosCAD info must be flipped in one of the documents.
A fast and easy way to add graphics to the inside or back side, is to double-click the inside or backside panel, creating a new file for the inside.
Collada files with Multiple Printable Parts
Some of the Studio Toolkits can produce Collada files with more than one printable part:
• A bottle with two labels, created by Studio Toolkit for Labels• A multi-pack shrink sleeve, created by Studio Toolkit for Shrink Sleeves• …
ArtiosCAD can also output structures with multiple printable parts. There is a slightly differentworkflow for ArtiosCAD files that will be explained in the next chapter.
When you use a Collada file with multiple printable parts, you can only choose one printable partto place:
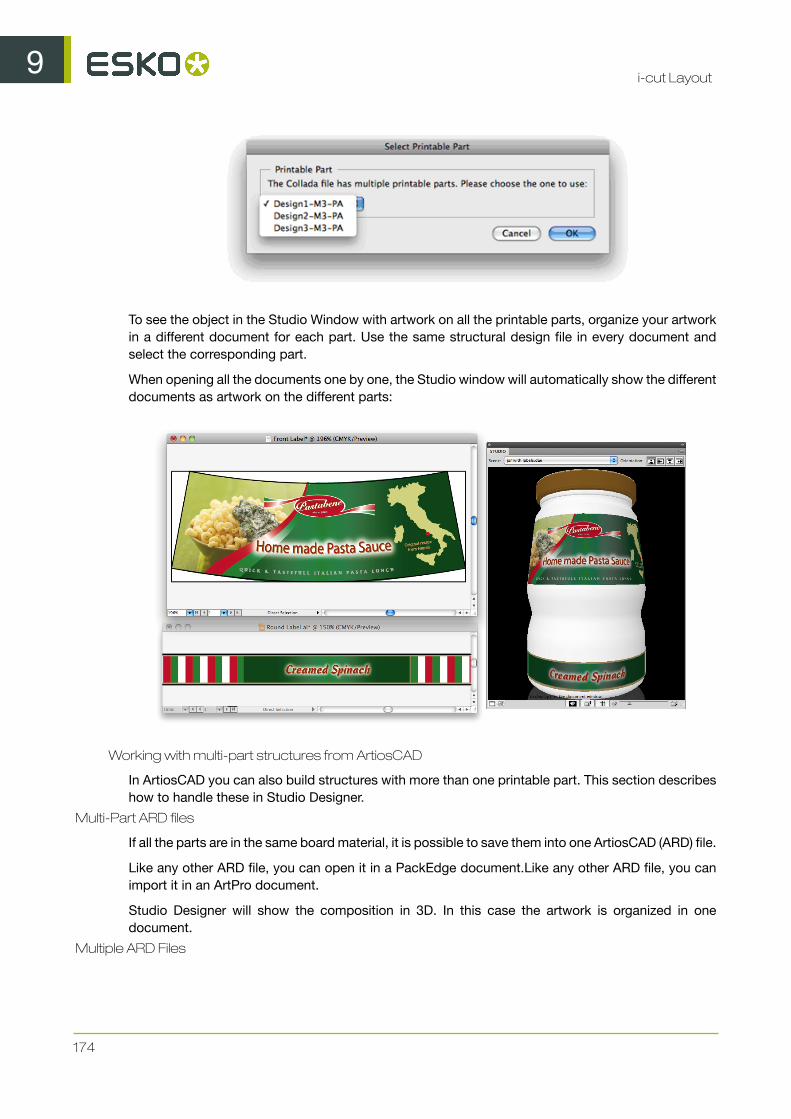
9i-cut Layout
174
To see the object in the Studio Window with artwork on all the printable parts, organize your artworkin a different document for each part. Use the same structural design file in every document andselect the corresponding part.
When opening all the documents one by one, the Studio window will automatically show the differentdocuments as artwork on the different parts:
Working with multi-part structures from ArtiosCAD
In ArtiosCAD you can also build structures with more than one printable part. This section describeshow to handle these in Studio Designer.
Multi-Part ARD files
If all the parts are in the same board material, it is possible to save them into one ArtiosCAD (ARD) file.
Like any other ARD file, you can open it in a PackEdge document.Like any other ARD file, you canimport it in an ArtPro document.
Studio Designer will show the composition in 3D. In this case the artwork is organized in onedocument.
Multiple ARD Files

9i-cut Layout
175
In ArtiosCAD it is also possible to combine multiple files into a 3D composition (this is typically storedas an A3D file). If you export as a Collada file, you could use the workflow described in 5.3. Butthen you loose some powerful features of the ArtiosCAD file format such as 'Create Varnish Plate','Distribute' and back-side. We suggest a workflow that uses both Collada and ArtiosCAD files:
In ArtiosCAD:
• Create an ARD file for every part• Combine the parts with ArtiosCAD 3D features.• Save the composition as a Collada file
In PackEdge:
Organize your artwork in a different document for every part. Place the corresponding ARD file ineach document.
The Structural Design layer shows the ArtiosCAD drawing. By default, the Studio window shows justthe one part. Repeat this for the other documents:

9i-cut Layout
176
To see the parts together in the Studio Window load the Collada file (from ArtiosCAD) as an alternativescene:
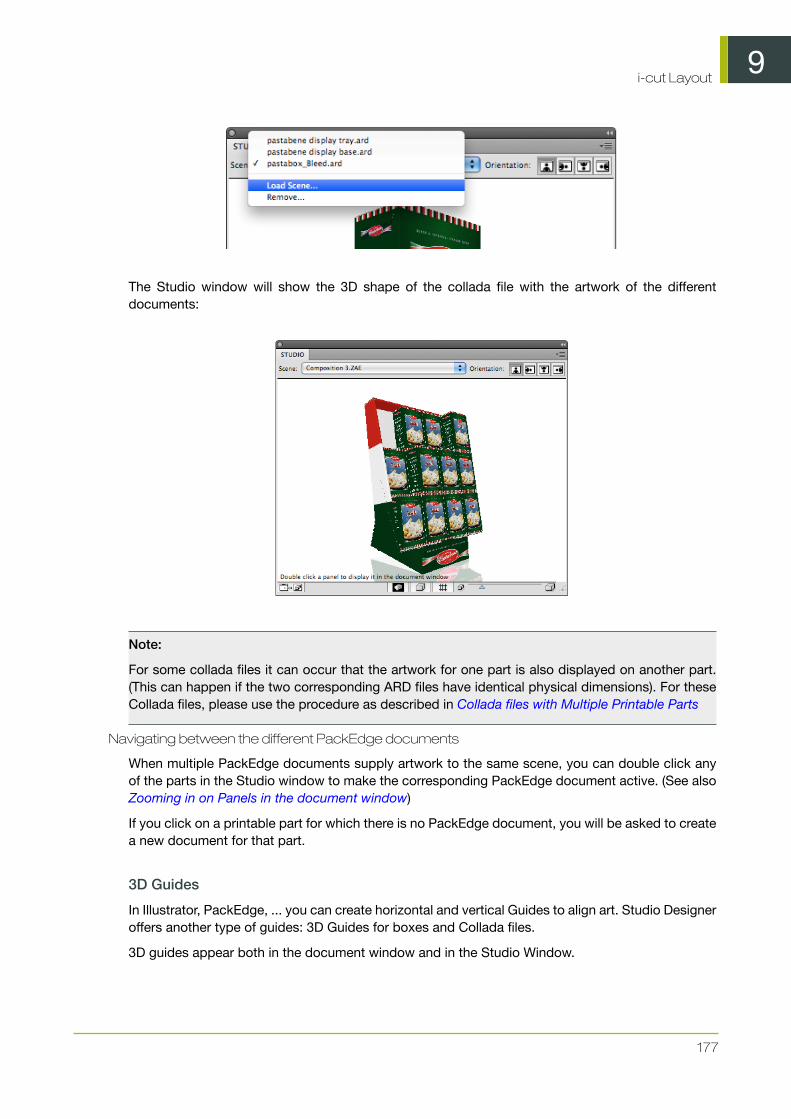
9i-cut Layout
177
The Studio window will show the 3D shape of the collada file with the artwork of the differentdocuments:
Note:
For some collada files it can occur that the artwork for one part is also displayed on another part.(This can happen if the two corresponding ARD files have identical physical dimensions). For theseCollada files, please use the procedure as described in Collada files with Multiple Printable Parts
Navigating between the different PackEdge documents
When multiple PackEdge documents supply artwork to the same scene, you can double click anyof the parts in the Studio window to make the corresponding PackEdge document active. (See alsoZooming in on Panels in the document window)
If you click on a printable part for which there is no PackEdge document, you will be asked to createa new document for that part.
3D Guides
In Illustrator, PackEdge, ... you can create horizontal and vertical Guides to align art. Studio Designeroffers another type of guides: 3D Guides for boxes and Collada files.
3D guides appear both in the document window and in the Studio Window.
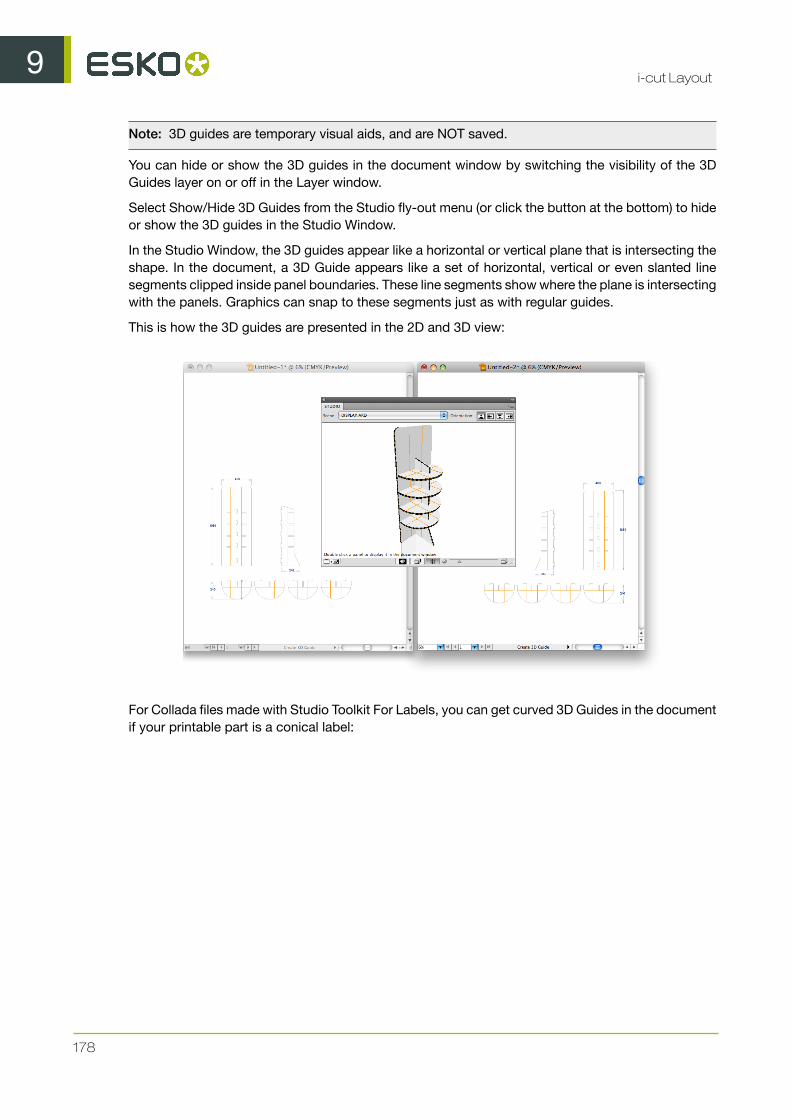
9i-cut Layout
178
Note: 3D guides are temporary visual aids, and are NOT saved.
You can hide or show the 3D guides in the document window by switching the visibility of the 3DGuides layer on or off in the Layer window.
Select Show/Hide 3D Guides from the Studio fly-out menu (or click the button at the bottom) to hideor show the 3D guides in the Studio Window.
In the Studio Window, the 3D guides appear like a horizontal or vertical plane that is intersecting theshape. In the document, a 3D Guide appears like a set of horizontal, vertical or even slanted linesegments clipped inside panel boundaries. These line segments show where the plane is intersectingwith the panels. Graphics can snap to these segments just as with regular guides.
This is how the 3D guides are presented in the 2D and 3D view:
For Collada files made with Studio Toolkit For Labels, you can get curved 3D Guides in the documentif your printable part is a conical label:

9i-cut Layout
179
Creating and Editing 3D Guides
To create or move a 3D guide, use the 3D Guide tool (in the applications toolbar). Click anddrag somewhere in the shape in the document to create or move a guide. By holding theoption (alt) key, you can switch between vertical and horizontal guides.
To delete a 3D guide, use the 3D guide tool and simply drag it outside the shape in thePackEdge document.
To delete all 3D guides, you can delete the “3D Guides” layer that contains all 3D guides.
Creating Copies with the Distribute command
Most of the faces of a package consist of a single panel. So there is just one rectangular area in thedocument that will make up this face. However, sometimes a face is made of several panels. The

9i-cut Layout
180
panels of such a “composed face” are spread across the document. They can even have a differentorientation. So for composed faces it is very difficult to create graphics that run continuous from onepanel into the other. Studio Designer can help you in this process with a feature called Distribute.
Note:
You can use Distribute on .bag and .ard files but not on Collada files.
Composed Faces
This is an example of a box with composed faces.-
This is an example of a bag.

9i-cut Layout
181
Viewing the Composed Face
If you select Show Face Outlines in the Studio fly-out menu and you click one panel thatis part of a composed face, 'ghost’ outlines will be drawn of the other panels of that face.These ghost outlines can give you a good impression of the size and shape of the composedface.
Distribute
If you draw some art within the boundaries of such a composed face, it will only appear onone panel, since the other panels are actually somewhere else in the Illustrator document.However, with Distribute, you can create copies of the art over several panels that areperfectly aligned to make it look continuous on the folded composed face.
This is how the folded package will look without applying Distribute.
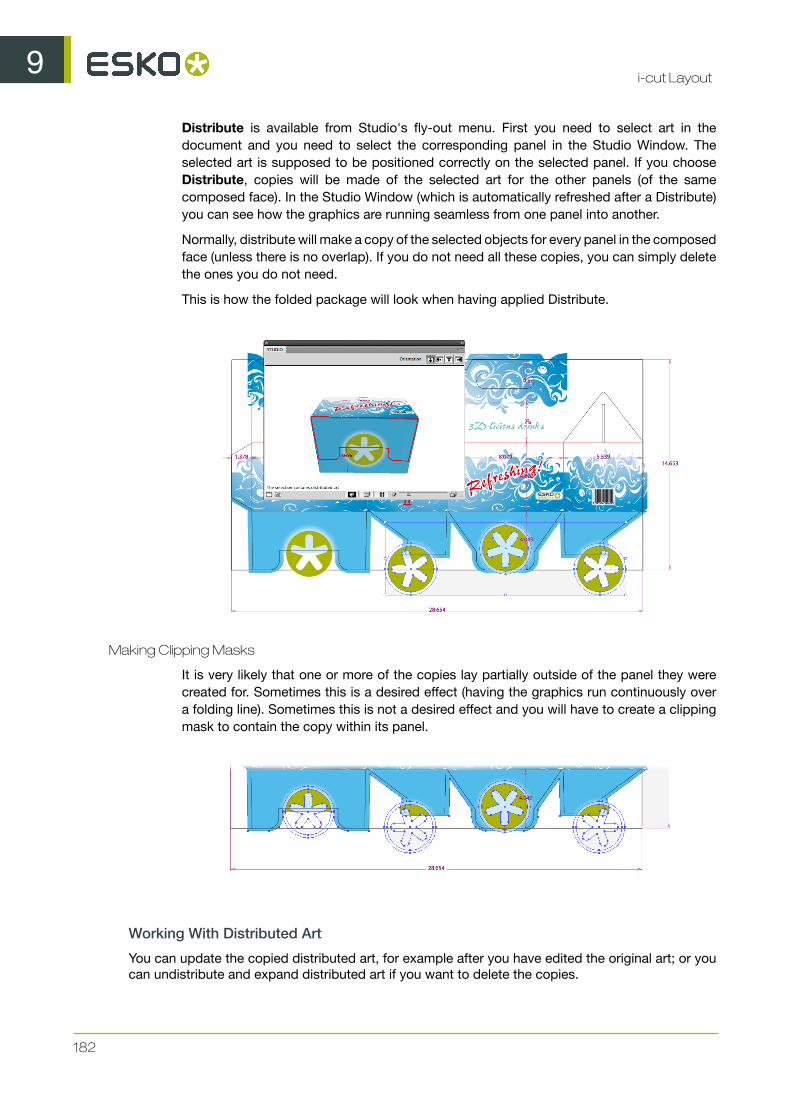
9i-cut Layout
182
Distribute is available from Studio's fly-out menu. First you need to select art in thedocument and you need to select the corresponding panel in the Studio Window. Theselected art is supposed to be positioned correctly on the selected panel. If you chooseDistribute, copies will be made of the selected art for the other panels (of the samecomposed face). In the Studio Window (which is automatically refreshed after a Distribute)you can see how the graphics are running seamless from one panel into another.
Normally, distribute will make a copy of the selected objects for every panel in the composedface (unless there is no overlap). If you do not need all these copies, you can simply deletethe ones you do not need.
This is how the folded package will look when having applied Distribute.
Making Clipping Masks
It is very likely that one or more of the copies lay partially outside of the panel they werecreated for. Sometimes this is a desired effect (having the graphics run continuously overa folding line). Sometimes this is not a desired effect and you will have to create a clippingmask to contain the copy within its panel.
Working With Distributed Art
You can update the copied distributed art, for example after you have edited the original art; or youcan undistribute and expand distributed art if you want to delete the copies.
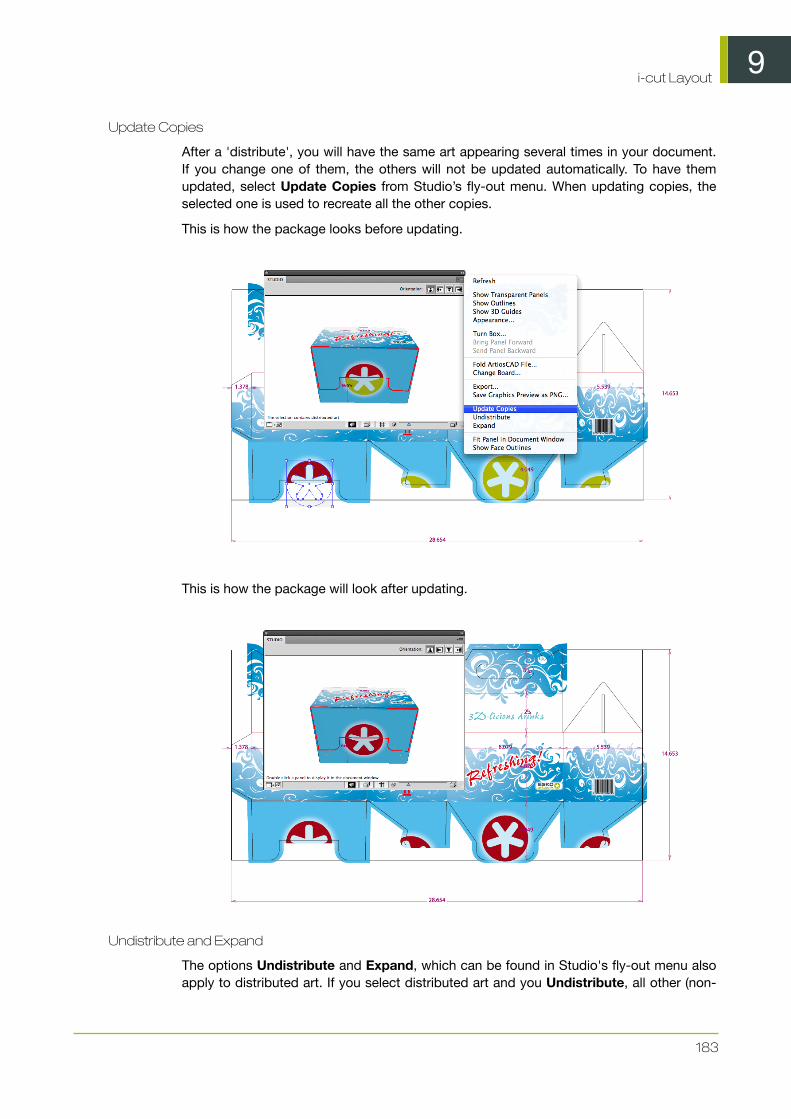
9i-cut Layout
183
Update Copies
After a 'distribute', you will have the same art appearing several times in your document.If you change one of them, the others will not be updated automatically. To have themupdated, select Update Copies from Studio’s fly-out menu. When updating copies, theselected one is used to recreate all the other copies.
This is how the package looks before updating.
This is how the package will look after updating.
Undistribute and Expand
The options Undistribute and Expand, which can be found in Studio's fly-out menu alsoapply to distributed art. If you select distributed art and you Undistribute, all other (non-

9i-cut Layout
184
selected) copies are deleted. If you have distributed art selected and you Expand, nothingwill change visually yet the selected art will loose its 'intelligence' and become regularartwork, insensitive to actions like Update Copies or Undistribute.
You will need to use Expand if you start copying and pasting distributed art. The copy willstill be considered as part of a distribution, by expanding it, it will no longer be seen as adistribution, but as an ordinary object.
Note:
When the distributed art is a group, ungrouping it is equivalent to applying Expand. The artdoes not longer know that it was distributed, even if you group it again.
Exporting
Studio Designer offers a variety of export options to a number of common formats.
Note:
The background color and other settings defined in the Appearance dialog will show up inyour exported file.
Writing TIFF Images
Studio Designer can export the 3D design to an RGB TIFF image with the graphics on top(much like the Studio window but at higher resolutions).
Choose Export… from Studio's fly-out menu. Choose TIFF Image as file type.
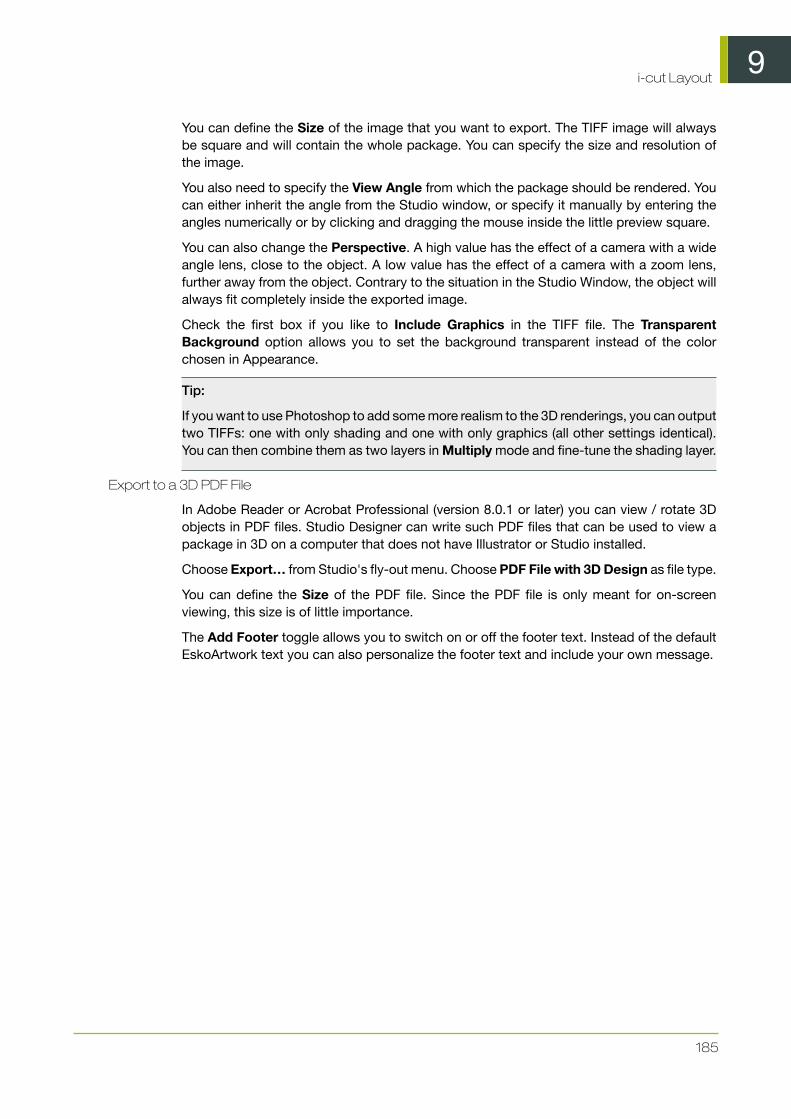
9i-cut Layout
185
You can define the Size of the image that you want to export. The TIFF image will alwaysbe square and will contain the whole package. You can specify the size and resolution ofthe image.
You also need to specify the View Angle from which the package should be rendered. Youcan either inherit the angle from the Studio window, or specify it manually by entering theangles numerically or by clicking and dragging the mouse inside the little preview square.
You can also change the Perspective. A high value has the effect of a camera with a wideangle lens, close to the object. A low value has the effect of a camera with a zoom lens,further away from the object. Contrary to the situation in the Studio Window, the object willalways fit completely inside the exported image.
Check the first box if you like to Include Graphics in the TIFF file. The TransparentBackground option allows you to set the background transparent instead of the colorchosen in Appearance.
Tip:
If you want to use Photoshop to add some more realism to the 3D renderings, you can outputtwo TIFFs: one with only shading and one with only graphics (all other settings identical).You can then combine them as two layers in Multiply mode and fine-tune the shading layer.
Export to a 3D PDF File
In Adobe Reader or Acrobat Professional (version 8.0.1 or later) you can view / rotate 3Dobjects in PDF files. Studio Designer can write such PDF files that can be used to view apackage in 3D on a computer that does not have Illustrator or Studio installed.
Choose Export… from Studio's fly-out menu. Choose PDF File with 3D Design as file type.
You can define the Size of the PDF file. Since the PDF file is only meant for on-screenviewing, this size is of little importance.
The Add Footer toggle allows you to switch on or off the footer text. Instead of the defaultEskoArtwork text you can also personalize the footer text and include your own message.

9i-cut Layout
186
Note:
To avoid z-fighting problems in the exported PDF files, you can use the Avoid Artefactsoption. This will make sure that whenever it is unclear which panel is on top (resulting inflickering graphics), a calculated choice will be made, cutting out the underlying part andgiving the top part carte blanche.

9i-cut Layout
187
Export to a U3D File
U3D is a common exchange format for 3D objects. For example, in Acrobat Professional8.0.1 or higher you can place U3D files in PDF files.
Choose Export... from Studio's fly-out menu. Choose U3D File as file type.

9i-cut Layout
188
Note:
To avoid z-fighting problems in the exported U3D files, you can use the Avoid Artefactsoption. This will make sure that whenever it is unclear which panel is on top (resulting inflickering graphics), a calculated choice will be made, cutting out the underlying part andgiving the top part carte blanche.
Export Collada Archive
Studio Designer can also export to a Collada Archive (*.zae), a common exchange format for 3Dmodels.
1. Choose Export... from Studio's fly-out menu.
2. Choose Collada Archives (*.zae) as file type.
3. Select Include Graphics at… to include the graphics at the desired resolution.
4. If you want to further use the Collada Archive in Studio Designer you need to select Keep PrintableParts.

9i-cut Layout
189
If Keep Printable Parts is enabled, the artwork is always exported at the default resolution.
5. Click the Save As button, and define name and location for the file.
Note:
The exported Collada Archives (.zae) can be further used in other EskoArtwork Studio applicationslike Studio Visualizer, Studio Toolkit for Shrink Sleeves or Esko Store Visualizer and ArtiosCAD oruploaded to the online EskoArtwork Studio Viewer.
Save Graphics Preview as PNG...
From within the Studio window, you can save a graphics preview file as a .png file, mainlyfor use in Studio Toolkit for Flexibles.
FAQThis section contains the answers to a number of Frequently Asked Questions.
This section contains the answers to a number of Frequently Asked Questions.
There is no overlap between the selected objects and the selected panel
I try to distribute a logo, and I am getting the error message There is no overlap betweenthe selected objects and the selected panel. Please select a panel thatoverlaps with the selected objects.
Whenever distributing for the first time, you will need to select two things: the graphics that youwant to distribute in the 2D view AND the source panel in the Studio window. The 'no overlap' errormessage indicates that you did select a panel in the Studio window, but in 2D there is no overlapbetween the selected panel and the selected art.
It is a good idea to switch on Show Face Outlines in Studio's fly-out menu.

9i-cut Layout
190
When Show Face Outlines is switched on, the selected panel in the Studio window will be shownin the 2D View:
You will immediately see that there is no overlap between the selected panel (the blue rectangle) andthe selected art (the star), so you basically selected the wrong panel. You need to select a panel thathas an overlap with the selected art:
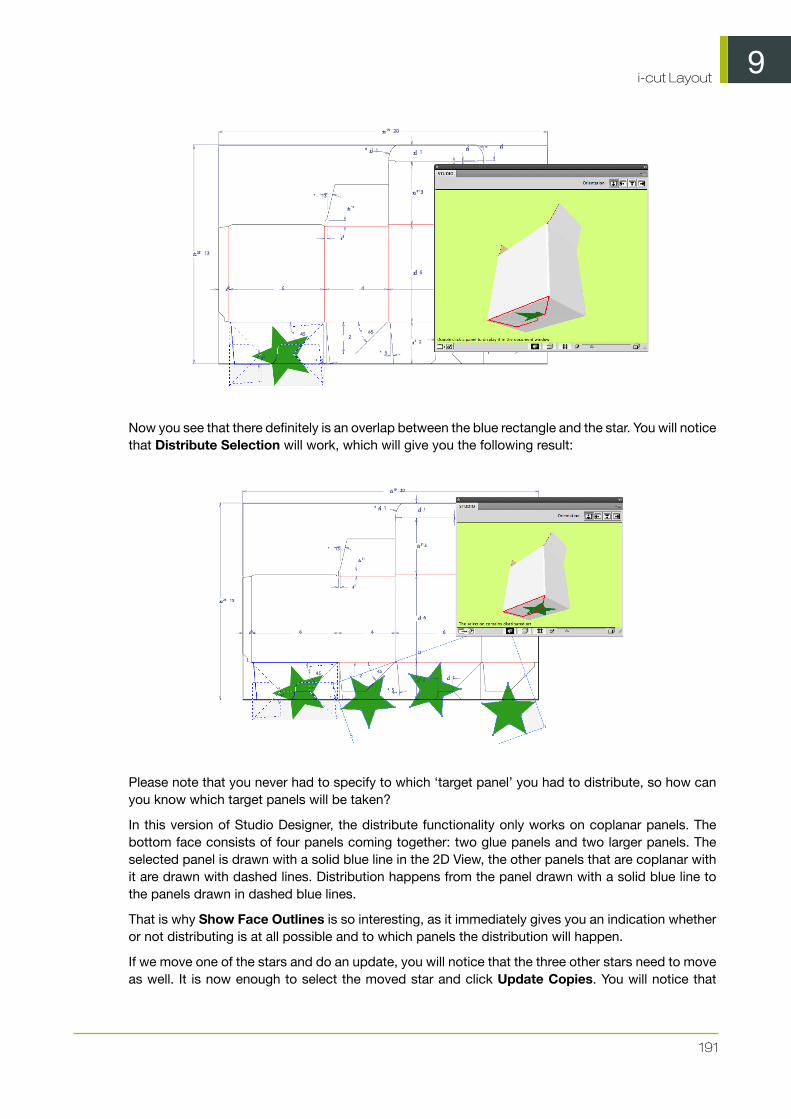
9i-cut Layout
191
Now you see that there definitely is an overlap between the blue rectangle and the star. You will noticethat Distribute Selection will work, which will give you the following result:
Please note that you never had to specify to which ‘target panel’ you had to distribute, so how canyou know which target panels will be taken?
In this version of Studio Designer, the distribute functionality only works on coplanar panels. Thebottom face consists of four panels coming together: two glue panels and two larger panels. Theselected panel is drawn with a solid blue line in the 2D View, the other panels that are coplanar withit are drawn with dashed lines. Distribution happens from the panel drawn with a solid blue line tothe panels drawn in dashed blue lines.
That is why Show Face Outlines is so interesting, as it immediately gives you an indication whetheror not distributing is at all possible and to which panels the distribution will happen.
If we move one of the stars and do an update, you will notice that the three other stars need to moveas well. It is now enough to select the moved star and click Update Copies. You will notice that

9i-cut Layout
192
Distribute Selection is now called Update Copies. There is no need anymore to select a panel inthe Studio window.
The selected art knows that it has been distributed before. An indication that you have selected“distributed art” is given in the info message in the Studio window: The selection containsdistributed art. This piece of distributed art has become a smart object that knows to whichpanel it belongs and which other art belongs to the same distribution. When clicking Update Copies,the other art that belongs to the same distribution (in our example, the other stars) will be replacedwith a new updated copy of the selected distributed art.
In the layer browser, you also have an indication which art is “distributed art” and hence smart. Thename of distributed art is always “Distribution”.
What can I do if the distribution looks wrong?
The graphics have been distributed to the correct coplanar panels, but the result of the distributionin the Studio window is still not correct.
In this case it is not that the distribution has positioned the copies in the wrong place, but that in the2D document window, the different copies are overlapping one another. This can happen wheneverthe graphic that you want to distribute is rather large.We will need to make clipping masks in thiscase, using the standard tools.
If we do this for every distributed copies and then refresh the Studio window, we will get the correctresult:
You only need to make the clipping masks once. Assume you would like to move the frog a little,then simply move one copy and click Update Copies. The other copies will also be updated andthey will keep their position under their clipping masks.
How can I distribute around a corner?
In this version of Studio Designer, distributing is only possible to other coplanar panels. Sometimesa distribution appears to go around the corner, but this only works if a panel that is attached to thepanel around the corner is coplanar with the selected panel.

9i-cut Layout
193
This is not the case with the box in the next example.
In this version of the software, we are not capable of doing this with the automatic distribute. Wehave limited the distribution functionality to panels that are coplanar. A face in the Studio windowcan be made up of different panels coming together. A beautiful example is the bottom of the boxin the picture below.
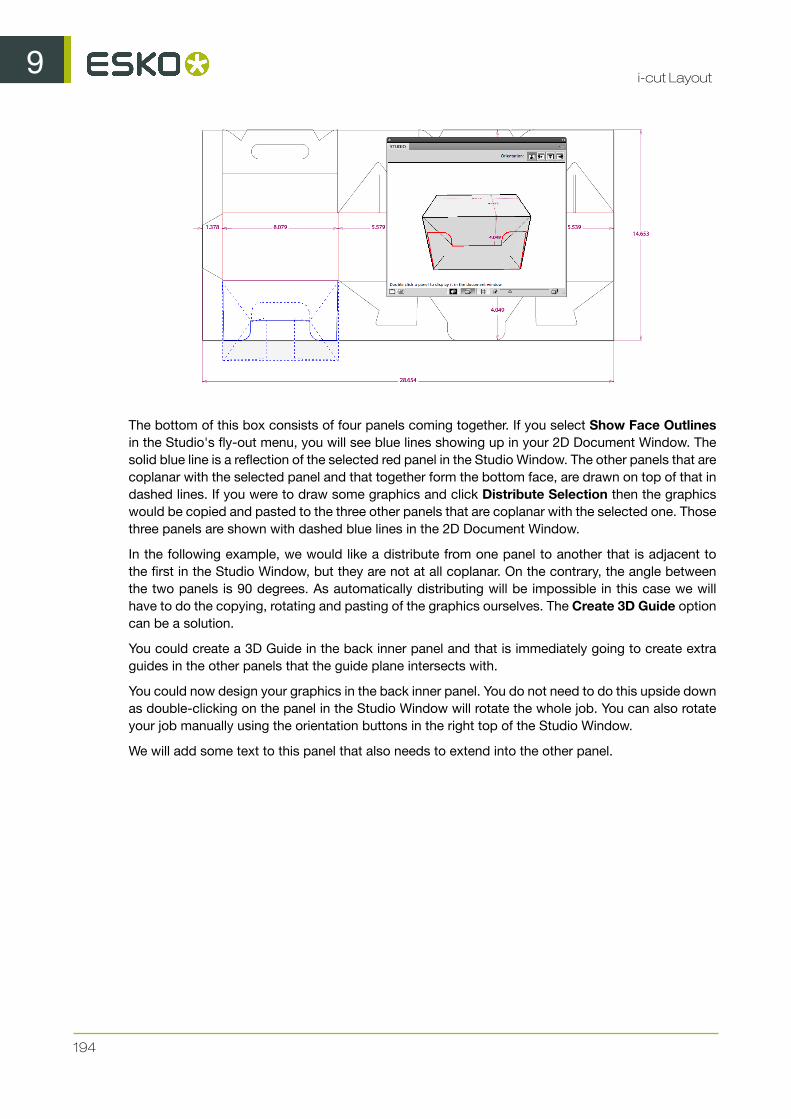
9i-cut Layout
194
The bottom of this box consists of four panels coming together. If you select Show Face Outlinesin the Studio's fly-out menu, you will see blue lines showing up in your 2D Document Window. Thesolid blue line is a reflection of the selected red panel in the Studio Window. The other panels that arecoplanar with the selected panel and that together form the bottom face, are drawn on top of that indashed lines. If you were to draw some graphics and click Distribute Selection then the graphicswould be copied and pasted to the three other panels that are coplanar with the selected one. Thosethree panels are shown with dashed blue lines in the 2D Document Window.
In the following example, we would like a distribute from one panel to another that is adjacent tothe first in the Studio Window, but they are not at all coplanar. On the contrary, the angle betweenthe two panels is 90 degrees. As automatically distributing will be impossible in this case we willhave to do the copying, rotating and pasting of the graphics ourselves. The Create 3D Guide optioncan be a solution.
You could create a 3D Guide in the back inner panel and that is immediately going to create extraguides in the other panels that the guide plane intersects with.
You could now design your graphics in the back inner panel. You do not need to do this upside downas double-clicking on the panel in the Studio Window will rotate the whole job. You can also rotateyour job manually using the orientation buttons in the right top of the Studio Window.
We will add some text to this panel that also needs to extend into the other panel.
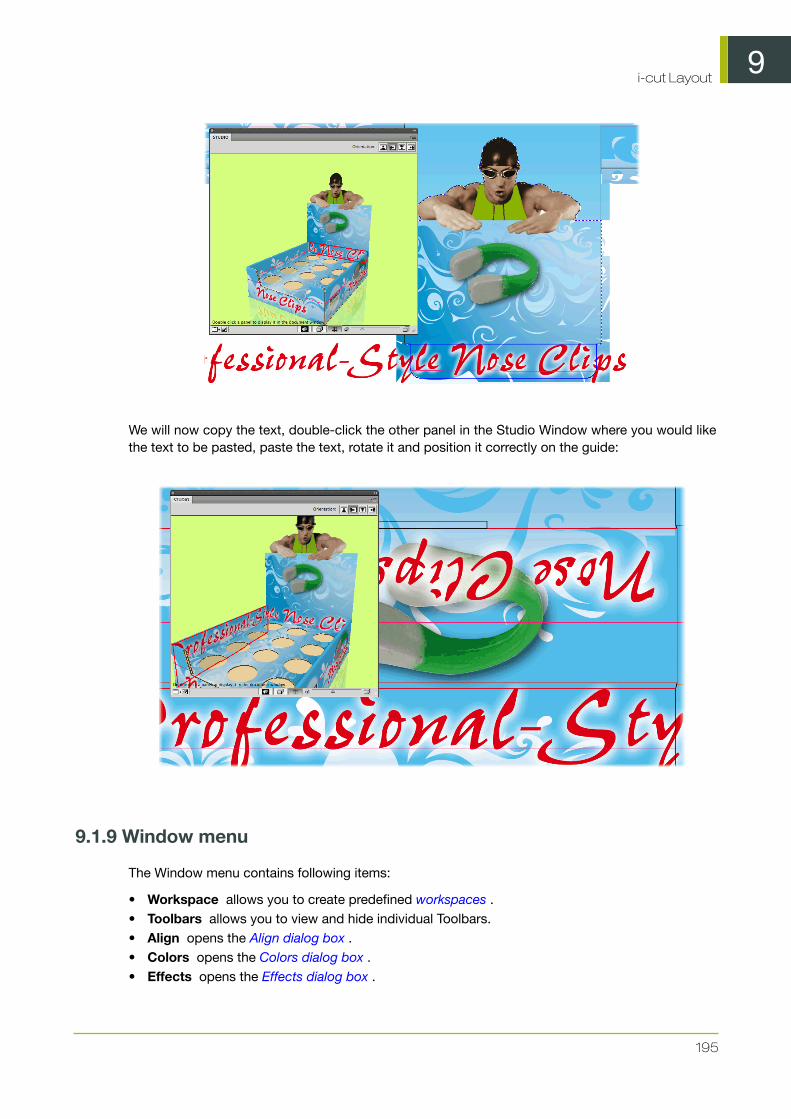
9i-cut Layout
195
We will now copy the text, double-click the other panel in the Studio Window where you would likethe text to be pasted, paste the text, rotate it and position it correctly on the guide:
9.1.9 Window menu
The Window menu contains following items:
• Workspace allows you to create predefined workspaces .• Toolbars allows you to view and hide individual Toolbars.• Align opens the Align dialog box .• Colors opens the Colors dialog box .• Effects opens the Effects dialog box .

9i-cut Layout
196
• Layer Browser opens the Layer Browser .• Messages opens the Info Window .• Pan Window opens the Pan window .• Shuttle opens the Shuttle window• Style opens the Style dialog box .• Transform opens the Transform dialog box .• Hide All will hide all opened dialog boxes.
Workspace
It is possible to save, for each opened dialog box and palette, its position, size and some dialog-specific settings like e.g.the width and visibility of the columns in the SmartNest dialog box. Thiskind of information is saved in a ‘workspace’.
• [Default]: switches back to the factory default.• Save• Manage
Save Workspace
Save a workspace and use Manage to rename or delete previously saved workspaces.Saving storesthe positions of all open palettes and dialog boxes when exiting the application.
After starting up i-cut Layout, all user interface dialog boxes will take the position they had whenexiting.
Tip:
All toolbars on the Window menu can either be used as docked tools or as proper dialog boxes.
Manage Workspace
The Workspace Layout Manager allows you to make some predefined workspaces of the userinterface dialog boxes and to switch from one to another with a single click. The positions of all openpalettes and dialog boxes are saved when exiting the application. You can start with default palettepositions or restore default positions. You can also save multiple layouts as different workspaces.

9i-cut Layout
197
Align
Click 'Align' on the Window menu to open the Align dialog box.
Align to Sheet - The Align to Sheet section aligns the center of a red selection to the center of thesheet. These options do not use green selection.
Center horizontally on Sheet - Aligns the center of the red selection to the center of the sheetfrom top to bottom.
Center vertically on Sheet - Aligns the center of the red selection to the center of the sheetfrom left to right.
Align by Attribute - The Align by Attribute section aligns the attribute of the red selection to the sameattribute of the green selection. The attributes that can be aligned are: left, right, top and bottomedges, and the center (vertical alignment) and middle (horizontal alignment) of the objects.
Align Left - Aligns the left edge of the red selection to the left edge of the green selection.Movement is horizontal only; vertical position of the red selection remains unchanged.
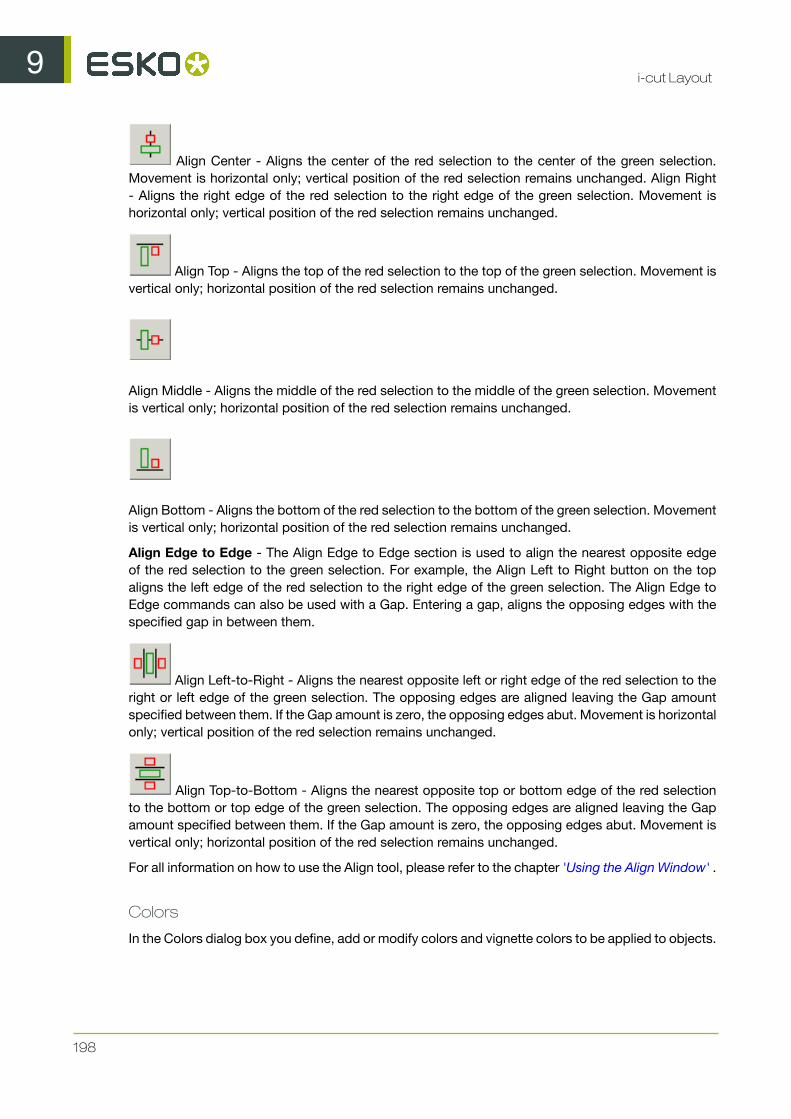
9i-cut Layout
198
Align Center - Aligns the center of the red selection to the center of the green selection.Movement is horizontal only; vertical position of the red selection remains unchanged. Align Right- Aligns the right edge of the red selection to the right edge of the green selection. Movement ishorizontal only; vertical position of the red selection remains unchanged.
Align Top - Aligns the top of the red selection to the top of the green selection. Movement isvertical only; horizontal position of the red selection remains unchanged.
Align Middle - Aligns the middle of the red selection to the middle of the green selection. Movementis vertical only; horizontal position of the red selection remains unchanged.
Align Bottom - Aligns the bottom of the red selection to the bottom of the green selection. Movementis vertical only; horizontal position of the red selection remains unchanged.
Align Edge to Edge - The Align Edge to Edge section is used to align the nearest opposite edgeof the red selection to the green selection. For example, the Align Left to Right button on the topaligns the left edge of the red selection to the right edge of the green selection. The Align Edge toEdge commands can also be used with a Gap. Entering a gap, aligns the opposing edges with thespecified gap in between them.
Align Left-to-Right - Aligns the nearest opposite left or right edge of the red selection to theright or left edge of the green selection. The opposing edges are aligned leaving the Gap amountspecified between them. If the Gap amount is zero, the opposing edges abut. Movement is horizontalonly; vertical position of the red selection remains unchanged.
Align Top-to-Bottom - Aligns the nearest opposite top or bottom edge of the red selectionto the bottom or top edge of the green selection. The opposing edges are aligned leaving the Gapamount specified between them. If the Gap amount is zero, the opposing edges abut. Movement isvertical only; horizontal position of the red selection remains unchanged.
For all information on how to use the Align tool, please refer to the chapter 'Using the Align Window' .
Colors
In the Colors dialog box you define, add or modify colors and vignette colors to be applied to objects.

9i-cut Layout
199
Note:
The Colors dialog box can only be used in combination with the Geometry Mark tool.
Color swatches To define, add or modify colors or vignette colors to be applied to objects.
When you click a color swatch to add a color, it is automatically filled with an empty color (white).
Note:
You can also resize the Style Bar horizontally, to display more color swatches.
Color Name input box To define a “work” name for the selected color swatch in the Color Palette,to help you to identify the color for a category of objects.
You created a drawing with a blue color for the sky and a blue color for the ocean. For the firstblue color, you can enter the name “sky” and for the second blue color, you can enter the name“Ocean”.
When you select the name, the color with that name becomes selected in the Color Palette.
Caution:
The name you enter in the Color Name input box is job related and is only a tool to quickly retrievecolors. It is NOT a designer ink that you create here.
There are 2 special entries in the color palette:
• registration color
• darkest color
Vignette
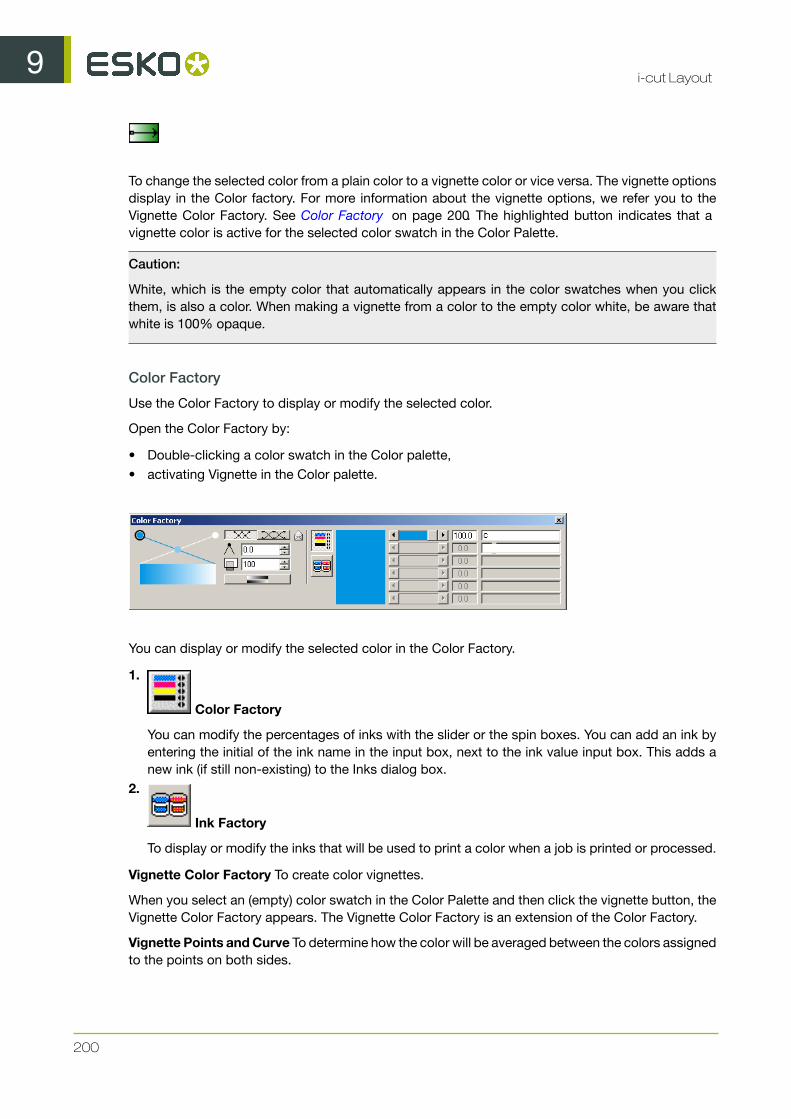
9i-cut Layout
200
To change the selected color from a plain color to a vignette color or vice versa. The vignette optionsdisplay in the Color factory. For more information about the vignette options, we refer you to theVignette Color Factory. See Color Factory on page 200. The highlighted button indicates that avignette color is active for the selected color swatch in the Color Palette.
Caution:
White, which is the empty color that automatically appears in the color swatches when you clickthem, is also a color. When making a vignette from a color to the empty color white, be aware thatwhite is 100% opaque.
Color Factory
Use the Color Factory to display or modify the selected color.
Open the Color Factory by:
• Double-clicking a color swatch in the Color palette,• activating Vignette in the Color palette.
You can display or modify the selected color in the Color Factory.
1.
Color Factory
You can modify the percentages of inks with the slider or the spin boxes. You can add an ink byentering the initial of the ink name in the input box, next to the ink value input box. This adds anew ink (if still non-existing) to the Inks dialog box.
2.
Ink Factory
To display or modify the inks that will be used to print a color when a job is printed or processed.
Vignette Color Factory To create color vignettes.
When you select an (empty) color swatch in the Color Palette and then click the vignette button, theVignette Color Factory appears. The Vignette Color Factory is an extension of the Color Factory.
Vignette Points and Curve To determine how the color will be averaged between the colors assignedto the points on both sides.

9i-cut Layout
201
• The vignette points are used to determine the color for the vignette, and the vignette curve is usedto determine how the colors (between two or more points) will be graded.
• Two curves (and their corresponding points) are displayed by default for the vignette. You mayadd curves and points by clicking the intersecting points and dragging the points to the top ofthe vignette curve, or by dragging and dropping additional colors to the intersecting points.
• Delete colors from the vignette by clicking the point that represents the color you want to deleteand dragging it downward, outside of the Vignette dialog box
Vignette Envelope The envelope in the vignette Color Factory contains the Color Factory or the InkFactory.
Smooth Vignette Button
Essentially, the smooth vignette button activates an automatic mechanism that determines thecourse of the colors in such a way that banding is no longer visible in the vignette.
Position of Vignette Color
Enter a numeric value in the input box to change the position of the vignette color.
The default is 50 for intersecting points and 100 for starting and ending points. The intersecting pointremains between 13 and 87.
The icon before the input box will change, depending on the vignette point you clicked on, into an
intersecting point or a beginning or ending point .
Opacity
Determine the opacity of the selected vignette color by entering a value in the input box.
Vignette Direction
Click this button to indicate the starting and ending point for the vignette in the job. The point youclick first is the point where the vignette starts. The second point you click is the point where thevignette ends. The points can be selected and replaced. If you replace the points within the vignettethe color for this vignette will also be adapted. Consequently also, the color swatch in the ColorPalette, displaying the vignette color, will be adapted.
Effects
The Effects dialog box can appear when setting the style of a geometry mark and allows you to addmore advanced transparency settings. In the Fill and Stroke tab entry you can apply transparencysettings on the fill and stroke attribute of the selected objects from the document, in the Group tabentry (when a group or combi-object is targeted) you can apply transparency effects to the objector group it self.
Fill and Stroke tab entry contain the same options.

9i-cut Layout
202
The Object/Group tab contains specific transparency options for PDF Transparency groups.
Opacity & Mask Define Knockout Shape checkbox keeps a knockout effect proportional to themasking object’s opacity. The knockout effect will be strong in areas of the mask that are close to100%; the knockout effect will be weaker in areas with less opacity.
The Isolate Blending checkbox prevents blending modes applied to objects within a group frombeing applied to objects beneath the group. This option is only useful when used on groups thatcontain at least one object with a blend mode other than Normal applied to them or when used onindividual objects that have a blending mode other than Normal applied on the stroke and fill attributeof the object.

9i-cut Layout
203
Check the Inherit Knockout Group from Parent checkbox if you want to group objects withoutinterfering with the knockout behavior determined by the enclosed layer or group. Clear the optionand check the Knockout Group checkbox to prevent transparency from revealing underlying objectswithin the group.To make sure that a layer or group of transparency objects will never knock eachother out, clear both the 'Inherit Knockout Group from Parent' and 'Knockout Group' checkboxes.
Changing the Opacity Gradient
The Opacity Gradient offers a wide range of opacity gradients to be applied to the object, fill and/orstroke attribute of an object. The Opacity value lets you vary the transparency with a constant value,but the Opacity Gradient tool allows you to set varying levels of transparency.
The Opacity Gradient dialog still contains the alpha modes that were available in PackEdge 5.0 andearlier versions, but make them clearly visualized by a small thumbnail preview: linear, linear updown,conical, conical updown, elliptical, elliptical updown, elliptical eccentric, elliptical updown eccentric,rectangle, rectangle updown, rectangle eccentric, rectangle updown eccentric, parallellogramic,parallellogramic updown, parallellogramic eccentric, parallellogramic updown eccentric, edge,softmask and CT mask.
Creating and Editing PDF Opacity Masks
The Opacity Gradient dialog allows you to create and edit PDF Opacity Masks in PackEdge 6.0.Any object in a document, even linked files, can be used as a mask for another object. The maskoverlays the selected object, covering entirely where the mask is solid or partially showing throughbased upon the shades of colors on the mask. The level of opacity is based on the difference ofthe luminance from the colors of the mask and the object: white is 100% opaque, black is 100%transparent and grays (colors change to grayscale on a mask) have varying levels.
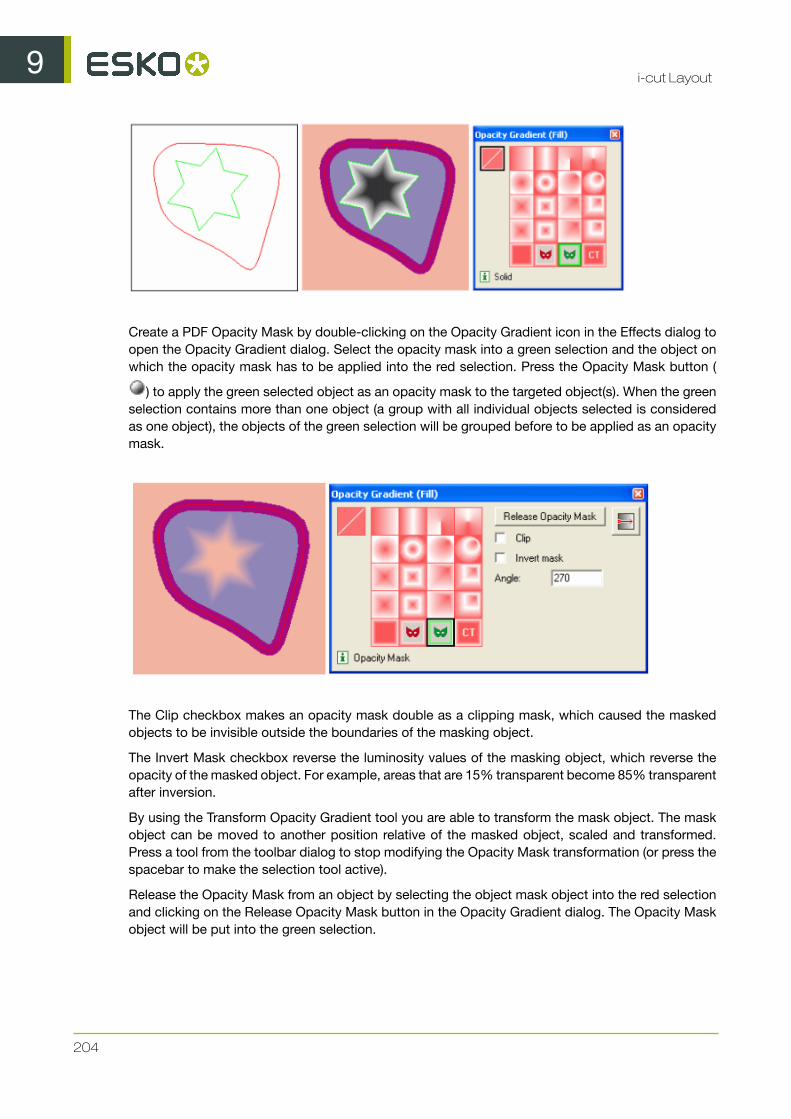
9i-cut Layout
204
Create a PDF Opacity Mask by double-clicking on the Opacity Gradient icon in the Effects dialog toopen the Opacity Gradient dialog. Select the opacity mask into a green selection and the object onwhich the opacity mask has to be applied into the red selection. Press the Opacity Mask button (
) to apply the green selected object as an opacity mask to the targeted object(s). When the greenselection contains more than one object (a group with all individual objects selected is consideredas one object), the objects of the green selection will be grouped before to be applied as an opacitymask.
The Clip checkbox makes an opacity mask double as a clipping mask, which caused the maskedobjects to be invisible outside the boundaries of the masking object.
The Invert Mask checkbox reverse the luminosity values of the masking object, which reverse theopacity of the masked object. For example, areas that are 15% transparent become 85% transparentafter inversion.
By using the Transform Opacity Gradient tool you are able to transform the mask object. The maskobject can be moved to another position relative of the masked object, scaled and transformed.Press a tool from the toolbar dialog to stop modifying the Opacity Mask transformation (or press thespacebar to make the selection tool active).
Release the Opacity Mask from an object by selecting the object mask object into the red selectionand clicking on the Release Opacity Mask button in the Opacity Gradient dialog. The Opacity Maskobject will be put into the green selection.
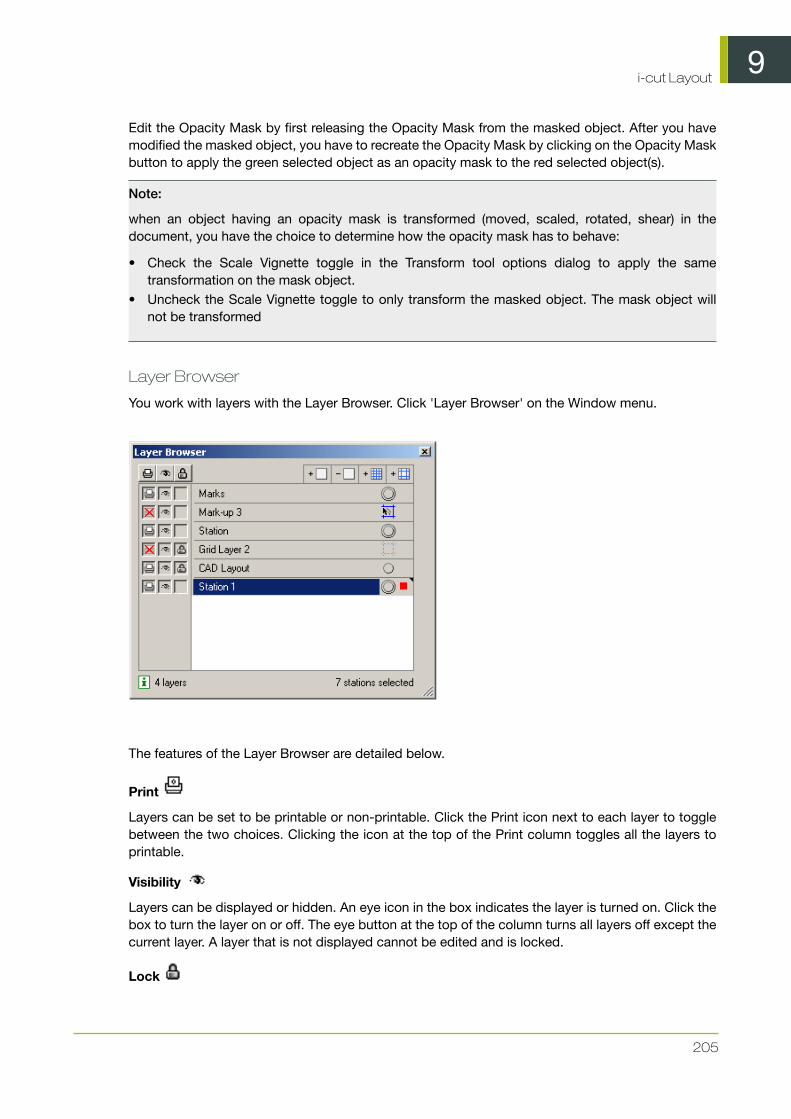
9i-cut Layout
205
Edit the Opacity Mask by first releasing the Opacity Mask from the masked object. After you havemodified the masked object, you have to recreate the Opacity Mask by clicking on the Opacity Maskbutton to apply the green selected object as an opacity mask to the red selected object(s).
Note:
when an object having an opacity mask is transformed (moved, scaled, rotated, shear) in thedocument, you have the choice to determine how the opacity mask has to behave:
• Check the Scale Vignette toggle in the Transform tool options dialog to apply the sametransformation on the mask object.
• Uncheck the Scale Vignette toggle to only transform the masked object. The mask object willnot be transformed
Layer Browser
You work with layers with the Layer Browser. Click 'Layer Browser' on the Window menu.
The features of the Layer Browser are detailed below.
Layers can be set to be printable or non-printable. Click the Print icon next to each layer to togglebetween the two choices. Clicking the icon at the top of the Print column toggles all the layers toprintable.
Visibility
Layers can be displayed or hidden. An eye icon in the box indicates the layer is turned on. Click thebox to turn the layer on or off. The eye button at the top of the column turns all layers off except thecurrent layer. A layer that is not displayed cannot be edited and is locked.
Lock

9i-cut Layout
206
Layers can be locked or unlocked. A padlock icon indicates the layer is locked and its contents maynot be selected or changed. Click the box to lock or unlock the layer. The padlock button at the topof the column locks or unlocks all layers.
Add/Delete Layer
Layers can be added or deleted from the document. From left to right, these icons are add a gridlayer, add a markup grid layer, add an object layer and delete a layer. The delete layer button can beused to delete any layer in the list. Deleting a layer deletes the layer and all the objects on the layer.
Allows you to add a new Grid Layer.
Allows you to add a new Markup Layer.
Active Layer The Active Layer is the layer to which all new objects will be added. The current ActiveLayer is shown with a black triangle at the top-right corner of the layer. To make a layer the activelayer, click its name in the layer list. There is a difference between a layer being selected and a layerbeing the active layer. For example, you can select a grid layer but it will not become the active layerbecause objects cannot be placed on grid layers.
A little red square indicates the layer contains red selected objects. A big red square indicatesthat all objects of a layer are selected in red.
A double ring ( ) indicates the object is targeted (or is the current active). The Style and Effectsdialog boxes show the properties of the object that is targeted.
Snap On/Off
Snap can be turned on or off for grid and markup layers. Click the 'Snap On/Off' icon for the layerto toggle between the two choices. In the window shown above, objects will not snap to the layernamed 'Markup Grid' but will snap to objects on the layers named 'Grid Layer'.
Note:
Clicking the object name in the Layer Browser does not select the object in the document, but selectsthe object in the list from the Layer Browser.
• The drag and drop functionality to move object to another position or into another group workson the objects selected in the list.
•Clicking the remove button will delete the objects selected in the list and not the objectsthat are selected in the document.
Setting up several grid layers and then choosing which ones to snap to is useful when creating acomplex layout. See below for details about creating grid and markup grid layers.
Messages Window
The Messages window displays information that the editor generates about the job.
Warnings are displayed in orange, errors are red.
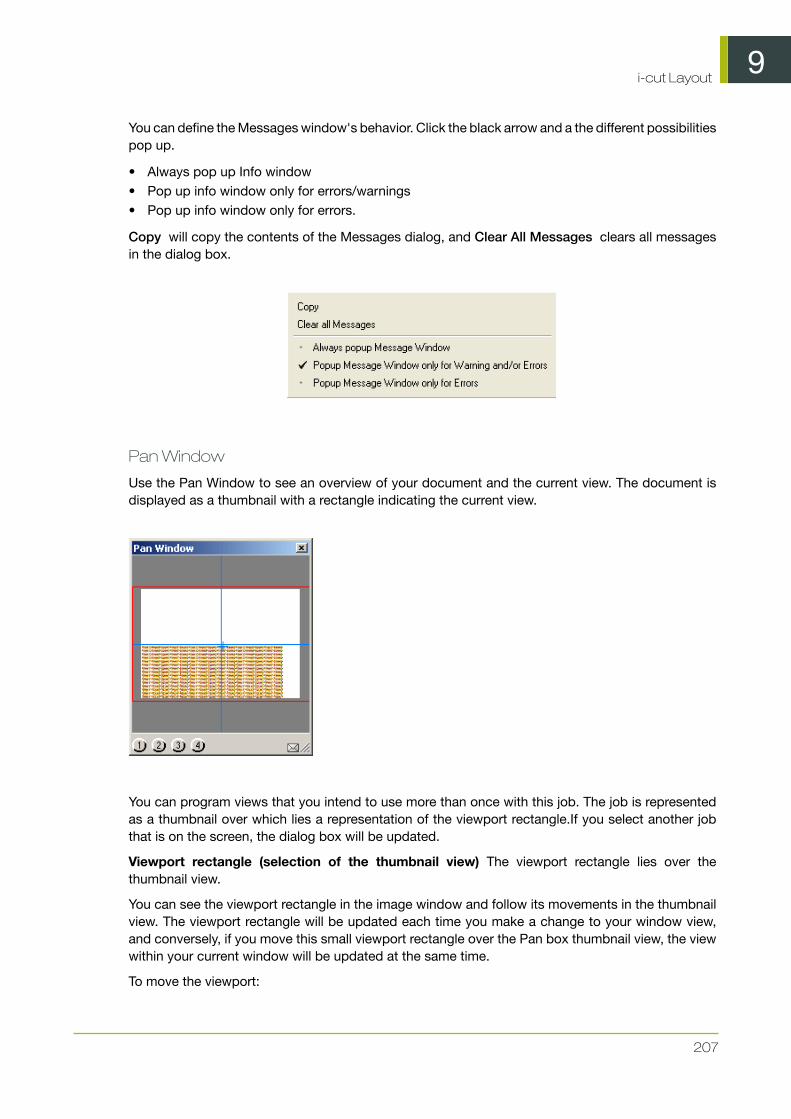
9i-cut Layout
207
You can define the Messages window's behavior. Click the black arrow and a the different possibilitiespop up.
• Always pop up Info window• Pop up info window only for errors/warnings• Pop up info window only for errors.
Copy will copy the contents of the Messages dialog, and Clear All Messages clears all messagesin the dialog box.
Pan Window
Use the Pan Window to see an overview of your document and the current view. The document isdisplayed as a thumbnail with a rectangle indicating the current view.
You can program views that you intend to use more than once with this job. The job is representedas a thumbnail over which lies a representation of the viewport rectangle.If you select another jobthat is on the screen, the dialog box will be updated.
Viewport rectangle (selection of the thumbnail view) The viewport rectangle lies over thethumbnail view.
You can see the viewport rectangle in the image window and follow its movements in the thumbnailview. The viewport rectangle will be updated each time you make a change to your window view,and conversely, if you move this small viewport rectangle over the Pan box thumbnail view, the viewwithin your current window will be updated at the same time.
To move the viewport:

9i-cut Layout
208
• Press the arrow keys on the keyboard.• Press the buttons that appear in the envelope.• Drag the viewport rectangle in the thumbnail view of the image.
If you click and hold the cursor over the thumbnail view, the viewport rectangle follows the point ofthe cursor until you release the mouse button and drop the viewport rectangle at the desired part.
• Or click the program buttons (if they have been programmed yet).
Program buttons To preset some view selections for each image on the screen. These settings willbe saved, to reuse them during your current session. The settings are kept as long as the image forwhich they were programmed stays on the screen.
Repaint To refresh the thumbnail view. If you moved the viewport rectangle in the thumbnail viewand you click Repaint, the thumbnail view is resized until it contains the complete viewport rectangleand the image in total view. Use the Repaint plug to automatically repaint the thumbnail view eachtime your job changes.
Please refer to the Pan tool chapter for more information on how to use the tool.
Style
The Style window allows you to set the parameters for the mark that you create. You can choosewhether your mark has a Fill, a Stroke or both. You can choose the colors of the fill and stroke aswell as the line width for the stroke. You can also set colors in Geometry Marks to overprint otherobjects. Finally, you can choose for the color to be Registration color, which means that the colorcontains 100% of all inks in the document.
To set the Style of a Geometry Mark, use the Style dialog box:
The Style dialog allows you to add a color for the fill and stroke and to apply some transparencyeffects to the Fill and Stroke attribute. Additional stroke options can be set when the Stroke groupis expanded in the user interface. New in the Style dialog is the possibility to apply a blend modeor opacity to an object or group. With the latter you create the so called PDF Transparency groups.
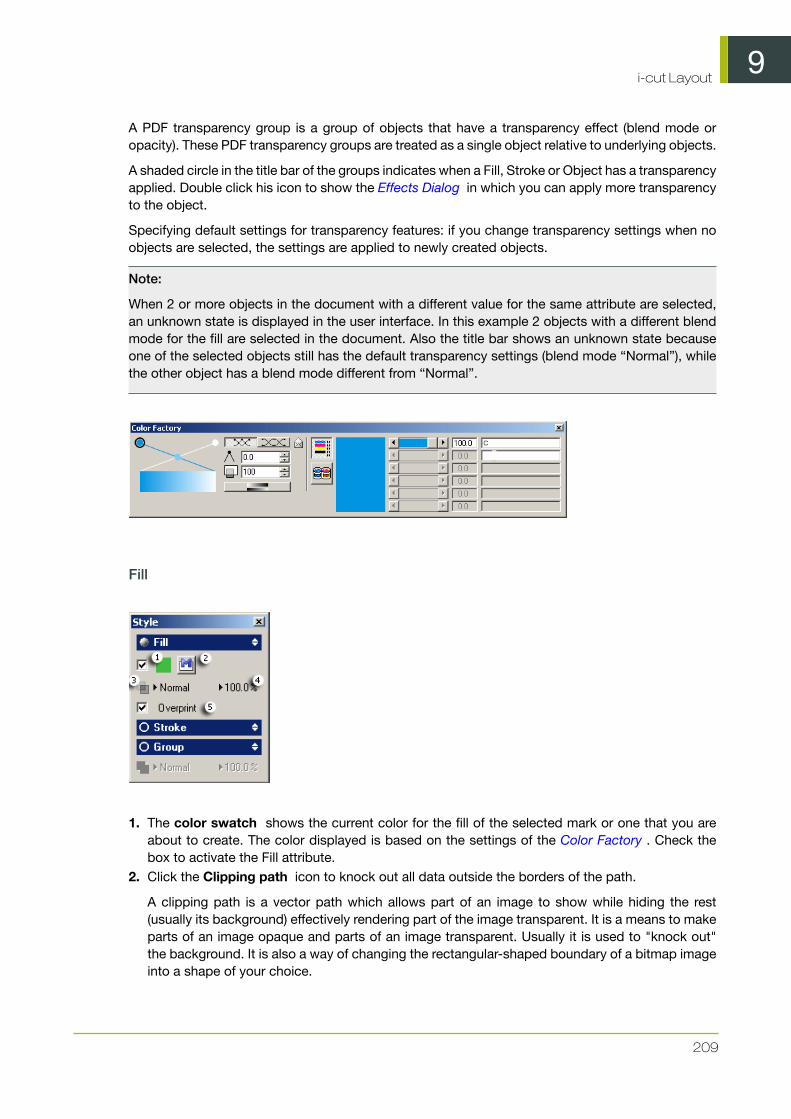
9i-cut Layout
209
A PDF transparency group is a group of objects that have a transparency effect (blend mode oropacity). These PDF transparency groups are treated as a single object relative to underlying objects.
A shaded circle in the title bar of the groups indicates when a Fill, Stroke or Object has a transparencyapplied. Double click his icon to show the Effects Dialog in which you can apply more transparencyto the object.
Specifying default settings for transparency features: if you change transparency settings when noobjects are selected, the settings are applied to newly created objects.
Note:
When 2 or more objects in the document with a different value for the same attribute are selected,an unknown state is displayed in the user interface. In this example 2 objects with a different blendmode for the fill are selected in the document. Also the title bar shows an unknown state becauseone of the selected objects still has the default transparency settings (blend mode “Normal”), whilethe other object has a blend mode different from “Normal”.
Fill
1. The color swatch shows the current color for the fill of the selected mark or one that you areabout to create. The color displayed is based on the settings of the Color Factory . Check thebox to activate the Fill attribute.
2. Click the Clipping path icon to knock out all data outside the borders of the path.
A clipping path is a vector path which allows part of an image to show while hiding the rest(usually its background) effectively rendering part of the image transparent. It is a means to makeparts of an image opaque and parts of an image transparent. Usually it is used to "knock out"the background. It is also a way of changing the rectangular-shaped boundary of a bitmap imageinto a shape of your choice.

9i-cut Layout
210
3. Click the arrow to select a blend mode from the list.4. Click the arrow to adjust the opacity using a slider.5. Turn overprint on or off by using the overprint checkbox.
The shaded circle indicates that certain attributes have a transparency applied.
Tip:
Clicking the arrows expands or contracts specific parts of the Style window.
Tip:
Clicking the Fill title bar opens the Effects dialog box .
Stroke
The Stroke Color box shows the current color for the stroke of the selected mark or one that youare about to create. The color displayed is based on the settings of the Ink Sliders.
The Stroke Width field shows the stroke width in the current units.
Click the arrow to adjust the transparency using a slider.
Turn overprint on or off by using the overprint checkbox.
Group
Adjust the opacity , click the arrow to adjust the transparency using a slider.
Transform
Click 'Transform' on the Window menu. The Transform Window appears:
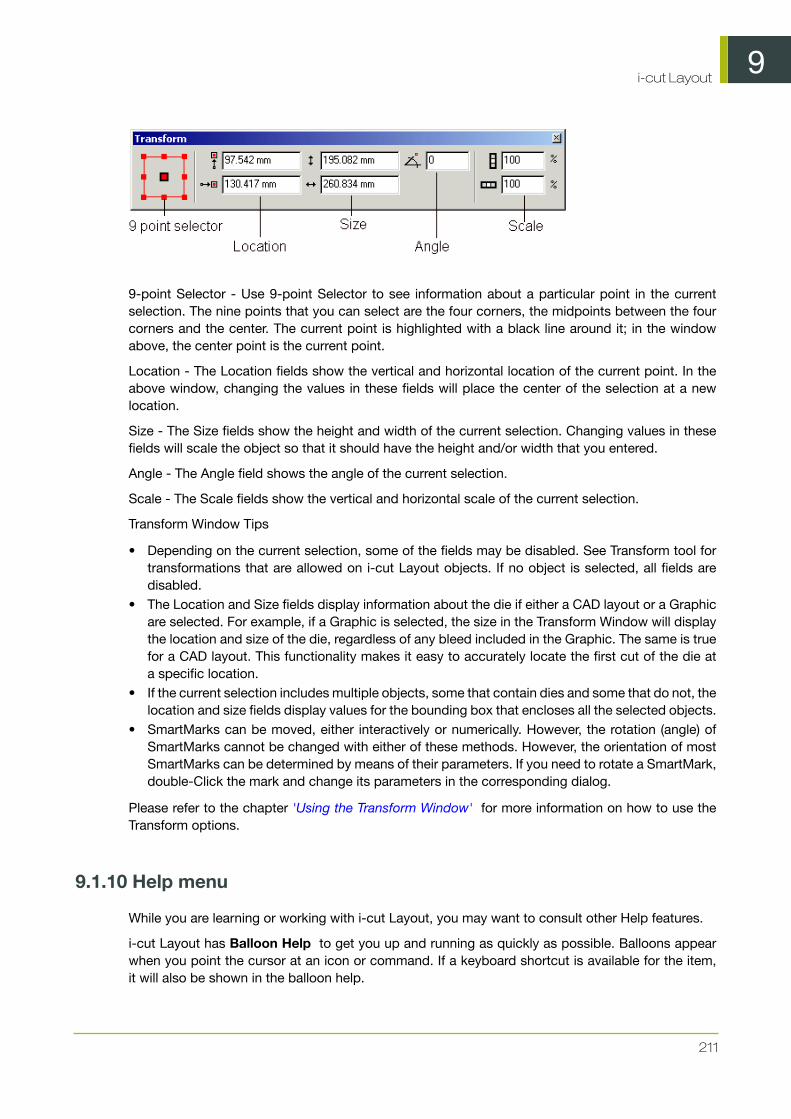
9i-cut Layout
211
9-point Selector - Use 9-point Selector to see information about a particular point in the currentselection. The nine points that you can select are the four corners, the midpoints between the fourcorners and the center. The current point is highlighted with a black line around it; in the windowabove, the center point is the current point.
Location - The Location fields show the vertical and horizontal location of the current point. In theabove window, changing the values in these fields will place the center of the selection at a newlocation.
Size - The Size fields show the height and width of the current selection. Changing values in thesefields will scale the object so that it should have the height and/or width that you entered.
Angle - The Angle field shows the angle of the current selection.
Scale - The Scale fields show the vertical and horizontal scale of the current selection.
Transform Window Tips
• Depending on the current selection, some of the fields may be disabled. See Transform tool fortransformations that are allowed on i-cut Layout objects. If no object is selected, all fields aredisabled.
• The Location and Size fields display information about the die if either a CAD layout or a Graphicare selected. For example, if a Graphic is selected, the size in the Transform Window will displaythe location and size of the die, regardless of any bleed included in the Graphic. The same is truefor a CAD layout. This functionality makes it easy to accurately locate the first cut of the die ata specific location.
• If the current selection includes multiple objects, some that contain dies and some that do not, thelocation and size fields display values for the bounding box that encloses all the selected objects.
• SmartMarks can be moved, either interactively or numerically. However, the rotation (angle) ofSmartMarks cannot be changed with either of these methods. However, the orientation of mostSmartMarks can be determined by means of their parameters. If you need to rotate a SmartMark,double-Click the mark and change its parameters in the corresponding dialog.
Please refer to the chapter 'Using the Transform Window' for more information on how to use theTransform options.
9.1.10 Help menu
While you are learning or working with i-cut Layout, you may want to consult other Help features.
i-cut Layout has Balloon Help to get you up and running as quickly as possible. Balloons appearwhen you point the cursor at an icon or command. If a keyboard shortcut is available for the item,it will also be shown in the balloon help.
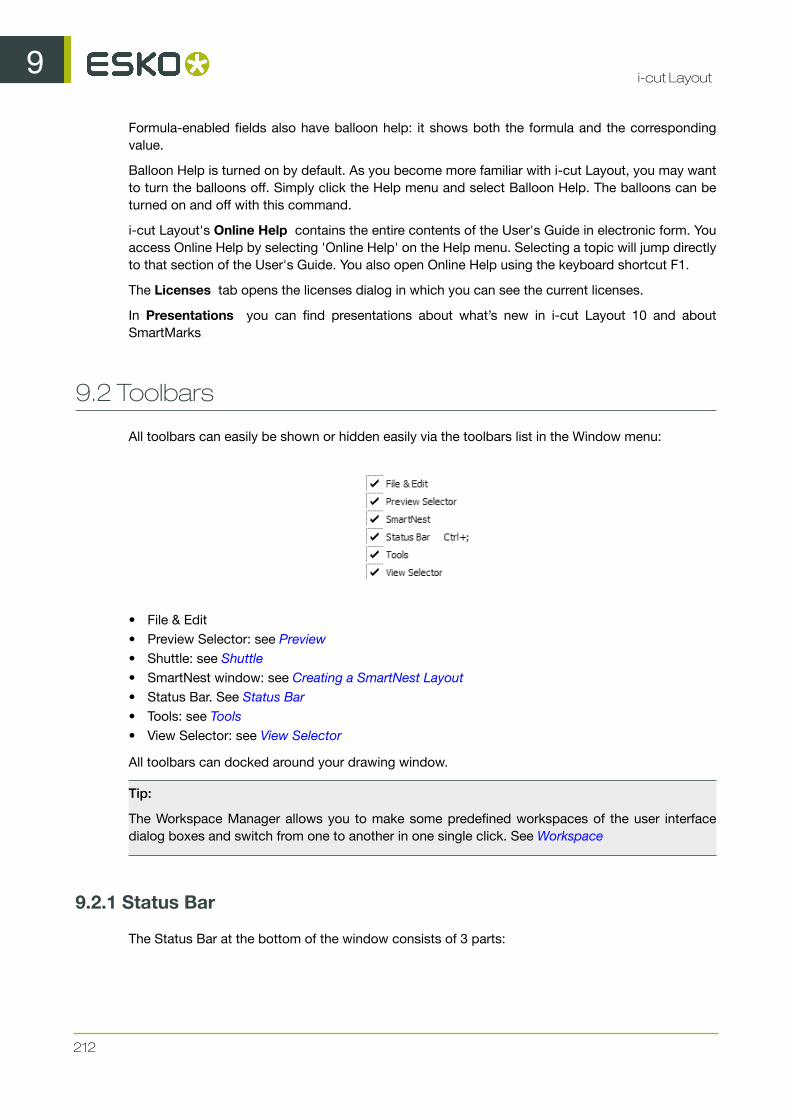
9i-cut Layout
212
Formula-enabled fields also have balloon help: it shows both the formula and the correspondingvalue.
Balloon Help is turned on by default. As you become more familiar with i-cut Layout, you may wantto turn the balloons off. Simply click the Help menu and select Balloon Help. The balloons can beturned on and off with this command.
i-cut Layout's Online Help contains the entire contents of the User's Guide in electronic form. Youaccess Online Help by selecting 'Online Help' on the Help menu. Selecting a topic will jump directlyto that section of the User's Guide. You also open Online Help using the keyboard shortcut F1.
The Licenses tab opens the licenses dialog in which you can see the current licenses.
In Presentations you can find presentations about what’s new in i-cut Layout 10 and aboutSmartMarks
9.2 Toolbars
All toolbars can easily be shown or hidden easily via the toolbars list in the Window menu:
• File & Edit• Preview Selector: see Preview• Shuttle: see Shuttle• SmartNest window: see Creating a SmartNest Layout• Status Bar. See Status Bar• Tools: see Tools• View Selector: see View Selector
All toolbars can docked around your drawing window.
Tip:
The Workspace Manager allows you to make some predefined workspaces of the user interfacedialog boxes and switch from one to another in one single click. See Workspace
9.2.1 Status Bar
The Status Bar at the bottom of the window consists of 3 parts:
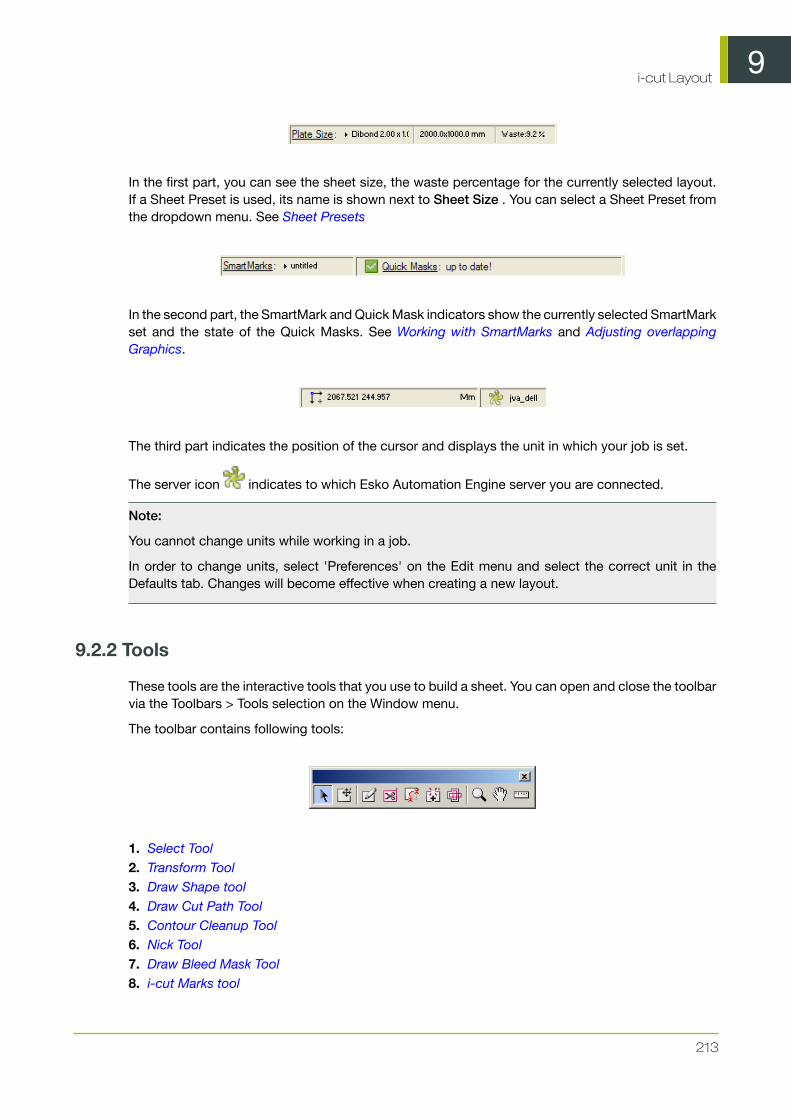
9i-cut Layout
213
In the first part, you can see the sheet size, the waste percentage for the currently selected layout.If a Sheet Preset is used, its name is shown next to Sheet Size . You can select a Sheet Preset fromthe dropdown menu. See Sheet Presets
In the second part, the SmartMark and Quick Mask indicators show the currently selected SmartMarkset and the state of the Quick Masks. See Working with SmartMarks and Adjusting overlappingGraphics.
The third part indicates the position of the cursor and displays the unit in which your job is set.
The server icon indicates to which Esko Automation Engine server you are connected.
Note:
You cannot change units while working in a job.
In order to change units, select 'Preferences' on the Edit menu and select the correct unit in theDefaults tab. Changes will become effective when creating a new layout.
9.2.2 Tools
These tools are the interactive tools that you use to build a sheet. You can open and close the toolbarvia the Toolbars > Tools selection on the Window menu.
The toolbar contains following tools:
1. Select Tool2. Transform Tool3. Draw Shape tool4. Draw Cut Path Tool5. Contour Cleanup Tool6. Nick Tool7. Draw Bleed Mask Tool8. i-cut Marks tool
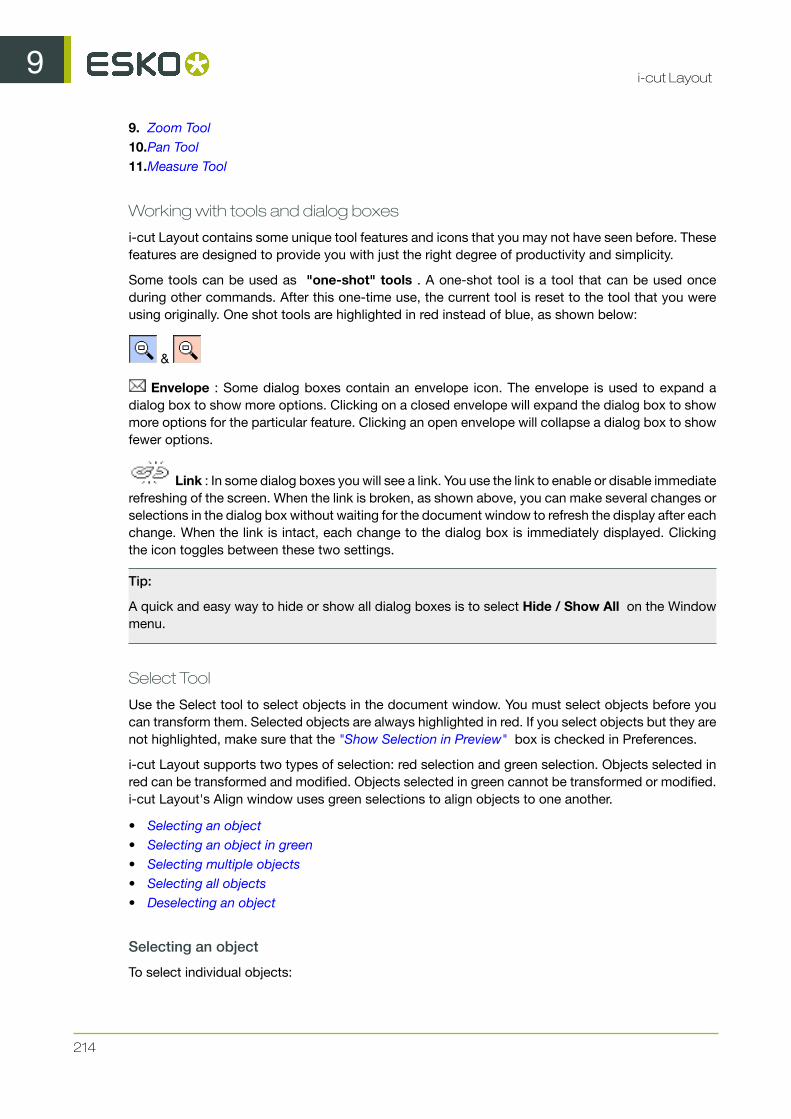
9i-cut Layout
214
9. Zoom Tool10.Pan Tool11.Measure Tool
Working with tools and dialog boxes
i-cut Layout contains some unique tool features and icons that you may not have seen before. Thesefeatures are designed to provide you with just the right degree of productivity and simplicity.
Some tools can be used as "one-shot" tools . A one-shot tool is a tool that can be used onceduring other commands. After this one-time use, the current tool is reset to the tool that you wereusing originally. One shot tools are highlighted in red instead of blue, as shown below:
&
Envelope : Some dialog boxes contain an envelope icon. The envelope is used to expand adialog box to show more options. Clicking on a closed envelope will expand the dialog box to showmore options for the particular feature. Clicking an open envelope will collapse a dialog box to showfewer options.
Link : In some dialog boxes you will see a link. You use the link to enable or disable immediaterefreshing of the screen. When the link is broken, as shown above, you can make several changes orselections in the dialog box without waiting for the document window to refresh the display after eachchange. When the link is intact, each change to the dialog box is immediately displayed. Clickingthe icon toggles between these two settings.
Tip:
A quick and easy way to hide or show all dialog boxes is to select Hide / Show All on the Windowmenu.
Select Tool
Use the Select tool to select objects in the document window. You must select objects before youcan transform them. Selected objects are always highlighted in red. If you select objects but they arenot highlighted, make sure that the "Show Selection in Preview" box is checked in Preferences.
i-cut Layout supports two types of selection: red selection and green selection. Objects selected inred can be transformed and modified. Objects selected in green cannot be transformed or modified.i-cut Layout's Align window uses green selections to align objects to one another.
• Selecting an object• Selecting an object in green• Selecting multiple objects• Selecting all objects• Deselecting an object
Selecting an object
To select individual objects:

9i-cut Layout
215
1. Click Select on the toolbar. The Select button changes to a blue button showing that it is theactive tool.
2. Click the object you want to select.
The object is selected in red, indicating that it can be transformed or modified.
Selecting an object
To select individual objects:
1. Click Select on the toolbar. The Select button changes to a blue button showing that it is theactive tool.
2. Click the object you want to select.
The object is selected in red, indicating that it can be transformed or modified.
Selecting an object in green
Use green selection to select an object while keeping it from being transformed or modified. To selectan object in green:
1. Click Select on the toolbar.2. Click the object that you want to select.3. Press the shortcut Ctrl-Alt-G to change the selection from red to green.
If you have some objects selected in red and some selected in green, pressing the shortcut Ctrl-Alt-G will toggle the objects between the two selections. That is, objects selected in red becomeselected in green and objects selected in green become selected in red.
For more information about shortcuts, please refer to the chapter 'Shortcuts' .
Selecting multiple objects
To add an object to the current selection:
1. Click Select on the toolbar and click the first object.2. Hold SHIFT and click each additional object that you would like to add.
Caution:
The Shift key is an Esko shortcut. If you are using DTP shortcuts, or created your own shorcuts, thekey could be different.
For more information about shortcuts, please refer to the chapter 'Shortcuts' .
To select all objects within an area:
1. Click Select on the toolbar.2. Position the cursor outside the objects you want to select, and click, hold and drag the mouse to
create a box around the objects. Release the mouse button.
You must entirely enclose an object with the selection box for it to be selected.

9i-cut Layout
216
Selecting all objects
To select all objects in the document:
On the Edit menu, click 'Select All'.
Deselecting an object
You can only deselect objects that are selected in red. To deselect objects selected in green, youmust first change them to objects selected in red by pressing the INSERT key.
Caution:
The Insert key is an Esko shortcut. If you are using DTP shortcuts, or created your own shorcuts,the key could be different.
For more information about shortcuts, please refer to the chapter 'Shortcuts' .
To deselect every object in the red selection:
1. Click 'Select' on the toolbar.2. Click anywhere in the document window outside the selected objects. All objects selected in red
become deselected.
To deselect a single object: right-click the object.
Tip:
There is a preference setting for reversing the selection of an object: SHIFT+select the object bydragging.
Transform Tool
Use the Transform tool to interactively move, scale or rotate a selected object. You can also transformobjects numerically using the Transform dialog box . Some objects in i-cut Layout cannot betransformed or can be transformed only partially. The following table shows the objects that may bein your document and their transformation properties:
Object Type Move Scale Rotate
Graphics Yes No Yes
GeometryMarks
Yes Yes Yes
Note:
Certain SmartMarks cannot be moved, e.g. the grid mark.
Click the Move tool to activate the fly-out toolbar. Select the appropriate tool and to enter a stepvalue if needed.

9i-cut Layout
217
Draw Shape tool
Use the Draw Shapes tool to create rectangles, ovals and polygons. Shapes that are designated asRegistration color or darkest color will update when inks are added to the sheet. You can use shapesto add new inks to the sheet. Shapes can be transformed like any other object. There is no limit tothe number of shapes in one sheet.
1. Click the 'Draw Rectangle' button on the toolbar.2. Select the type of shape you would like to create.
3. The Style window allows you to set the parameters for the mark that you create. You can choosewhether your mark has a Fill, a Stroke or both. You can choose the colors of the fill and strokeas well as the line width for the stroke. You can also set colors in Geometry Marks to overprintother objects. Finally, you can choose for the color to be Registration color, which means that thecolor contains 100% of all inks in the document.
To set the Style of a Geometry Mark, use the Style dialog box:
4. Draw the mark

9i-cut Layout
218
To draw a rectangle:
a. Starting where you want the top left corner of the rectangle, click, hold and drag to create therectangle. You can also simply click where you would like the top left corner of the rectangleand the bottom right corner of the rectangle. Holding the ALT key while dragging will draw therectangle from the center. You also use the rectangle tool to create a square. You constrainthe rectangle to a square by turning on constrain.
Tip:
Note that a preference setting allows you to draw a rectangle in a single click.
To draw an ellipse:
a. Starting where you want the top left corner of the ellipse, click, hold and drag to create theoval. You can also simply click where you would like the top left corner of the ellipse and thebottom right corner of the ellipse. Holding the ALT key while dragging will draw the ellipsefrom the center. You also use the ellipse tool to create a circle. You constrain the ellipse to acircle by turning on constrain.
Tip:
Note that a preference setting allows you to draw an ellipse in a single click.
To draw a polygon:
a. Select the 'Draw Polygon' button from the fly-out toolbar.b. Click where you want the first point of the polygon.c. Click to create each additional point in the polygon.d. Type 2 to close and end the contour. Type 3 to end the contour without closing it.
Note:
The Geometry Marks tool also allows you to draw splines. A simple click will create a new linesegment. If you click, hold and drag the mouse spline segments will be added.
Note:
• Once you have set the parameters for the Drah Shape tool, you can close the Style dialog. Allshapes that you create with the tool will use the parameters that you set in the dialog.
• Shapes can be transformed using the Transform tool on the toolbar or the Transform window .• If you want to change the parameters for a Shape that you have created already, double-click it.
The Style dialog box for the selected shape will appear.
Draw Cut Path Tool
In Graphic View mode, use the Draw Cut Path tool to draw cut path contours for your Graphic. TheGraphic View's default die is a rectangle (or a square, if the height and width are the same). Butsome jobs are not this shape. You can use the Draw Cut Path tool to create die contours that arerectangular or square, oval or round, or a polygon. You are not limited to a single die contour; youcan create multiple contours to create a more complex die. All contours created with the Draw Cut

9i-cut Layout
219
Path tool are die cut lines. Die contours can be transformed with the Transform tools to create theexact shape and size that you need.
Clean Cut Path Tool
Cut Path and Redraw Shortest Part To cut away the "smallest" part of the contour and to addthe contour segment(s) that you draw to the "largest" part.Click to indicate a point on or close to thecut path (it will snap) and redraw a segment (which can consist of different points). The end pointhas to be on or close to the contour so it will snap again.
Tip:
When you want to put an intermediate point of your line or curve segment near a contour, click themiddle mouse button instead of the left mouse button, to prevent that contour from being affected.
Move Point To move points and anchor points on a segment or an object. When you move thepoints, you can change the size and shape of the segment or object.
Delete Point To delete points from a segment or object. By deleting the points, you can changethe shape of the segment or object.
Change Start Point and Direction Click a point to define it as the starting point. Click the pointagain if you want to change the direction of the curve.
Nick Tool
Nicks are small pieces of substrate that are not cut by the table and thus create interruptions in thecut path when exporting to i -cut. As a result, the cut design will stay attached to the substrate.Nicks may be present in the design, but the nick tool allows you to add or remove extra nicks thatguarantee tiles to stay connected. You can specify the size of the nick in the box.Click the cut pathand add or remove nicks as you wish. When exporting, the position and size of the nicks will besaved in the .cut file.
Tip:
Press the Alt key to switch between the Add Nick and Remove Nick tools.

9i-cut Layout
220
Draw Bleed Mask Tool
Use the Draw Bleed Mask tool to create a mask for the graphic. The mask is based on the Graphicdie. You can add a bleed amount to the mask. If the cut path in your Graphic includes panels, youcan also specify which panels to include in the mask to create non-printing areas on the graphic.
Masks created with the Draw Bleed Mask tool are applied to the graphic only; other objects, likemarks are not masked by the Draw Bleed Mask tool.
The Draw Bleed Mask tool includes an option window:
The option window allows you to specify the Bleed amount that you would like on the mask. Thevalue that you enter is the amount of bleed outside the die. The option window also includes an Undobutton. You use the Undo button to undo any panel selections that you have made.
When you use the Draw Bleed Mask tool, the mask is displayed in a transparent color over the entireGraphic. The color of the mask is the same as the color used for the cut path lines. By default, thecut path lines in i-cut Layout are red, so the mask usually appears as a transparent red that simulatesRubyLith masking material:
The transparent red area indicates the part of the Graphic that will not be shown. Any part of thegraphic that is under the red transparent area will be not be visible or printable. The inside of themask will allow the graphic to show through.
You can add specific panels to the mask by clicking on them. Each time you click inside a panel,it is added to the mask.
9i-cut Layout
221
The selection of a panel can be undone by clicking the Undo button on the Create Bleed Maskwindow. The selection of panels is undone in the reverse order in which they were selected. Whenthere are no panels to undo, the Undo button is disabled.
Note:
Adding or removing panels is only applicable when using graphics containing a CAD as a cut path.
To complete a mask, click the close box of the Create Bleed Mask options window or simply clickany other tool in the toolbar. You can redo the mask at any time by selecting the Create Bleed Masktool again. The previous mask will be discarded and a new mask will be created.
• Drawing a mask• Deleting a mask• Replacing a mask
Drawing a mask
To mask the graphic:
1. Click the 'Create Bleed Mask' button on the toolbar.2. Enter a bleed amount.3. Click in the document window on any panels that you want to exclude from the mask.4. Click the Close button in the title bar.
You can use the Create Bleed Mask tool at any time, even if you use Placeholders. The exampleabove contains Placeholders. If you import a graphic later, the mask will be applied automaticallyto the imported graphic.
Deleting a mask
Because the mask is an unfilled and uncolored contour, it is difficult to select and delete it in thecolor view modes. However, you can easily identify and select the mask when you set the previewmode to 'Cross' . Masks are always displayed as blue outlines in Cross and Contour modes, makingthem easy to identify and select.
To delete a mask:
1. Set the display mode to Cross.2. Locate and select the blue mask outline.3. Press [Delete].
Replacing a mask
If you have an imported CAD die in your Graphic and then use the Draw Cut Path tool to createa new die, the imported CAD die is replaced with the contours that you create with the tool. Thisalso applies if the cut path is on the trim box of the job. If the die is created in another way (e.g.by extracting contours in a specific ink), this die is kept and should be deleted manually if it isno longer wanted .

9i-cut Layout
222
i-cut Marks tool
The i-cut Marks tool allows to manually add i-cut Marks.
For more on i-cut Marks and the available options, see i-cut Marks
Zoom Tool
Use the Zoom tool to magnify a portion of your workspace at an increased scale.
To zoom in, click with the left mouse button. To zoom out, click with the right mouse button. Or youcan move the mouse cursor to a corner of the area to zoom in upon, hold down the mouse button,and drag to the diagonally opposite corner.
Tip:
Use the Zoom In and Zoom Out commands in the View menu to zoom one zoom level at a time.
Pan Tool
Use the Pan tool to move around the document. You can change your view of the current documentby using the Pan tool or the Pan Window (see Using the Pan Window ). The Pan tool is located onthe Tools toolbar; the Pan Window is opened from the Window menu.
To use the Pan tool, select the tool and use the cursor to drag the document around in the documentwindow. You can also pan around the document using the window scroll bars.
Use the Pan Window to see an overview of your document and the current view. The document isdisplayed as a thumbnail with a rectangle indicating the current view.
1. On the Window menu, click 'Pan Window'. The Pan Window opens:
2. You change the view area by dragging the red view rectangle to other locations on the thumbnail.
You can also set the four Memory buttons at the bottom of the dialog box to remember previousviews. To store the current view in a Memory button:
1. Click and hold one of the memory buttons. The button will turn pink.

9i-cut Layout
223
2. An Info dialog box will be displayed to inform you that the current view has been stored.
The envelope in the Pan Window is used to expand the dialog box to show more options. Click theenvelope to expand the dialog:
The expanded Pan Window dialog box contains other features. You can use the arrow buttons tomove the view rectangle over the document. You can also force the application to repaint the displayby clicking the Repaint button.
Measure Tool
Use the Measure tool to measure one or two points in the document window. The measurements forthe points are shown relative to the current origin of your document.
• Measuring a single point• Measuring the distance between two points
Measuring a single point
To measure a single point:
1. Click the Measure icon on the toolbar. The Measure window appears.2. Click in the document window on the point that you want to measure.
The point you clicked is highlighted in the document window. The location of this point is shown inthe Measure window:
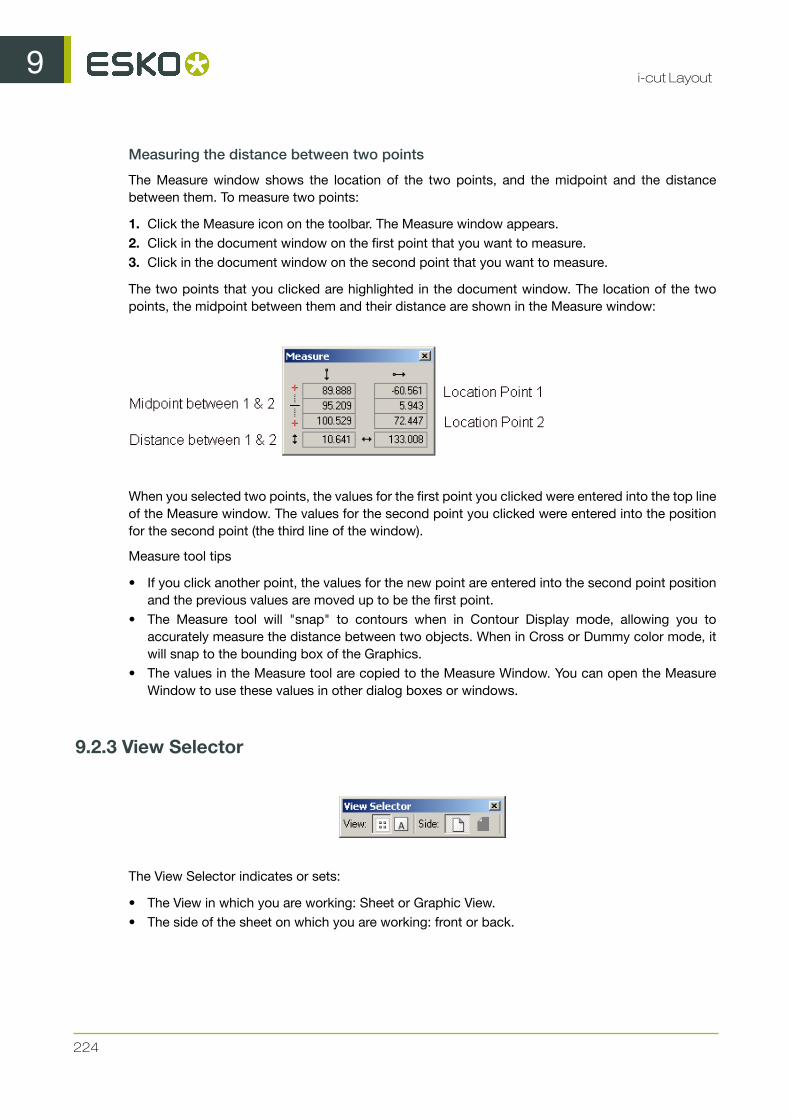
9i-cut Layout
224
Measuring the distance between two points
The Measure window shows the location of the two points, and the midpoint and the distancebetween them. To measure two points:
1. Click the Measure icon on the toolbar. The Measure window appears.2. Click in the document window on the first point that you want to measure.3. Click in the document window on the second point that you want to measure.
The two points that you clicked are highlighted in the document window. The location of the twopoints, the midpoint between them and their distance are shown in the Measure window:
When you selected two points, the values for the first point you clicked were entered into the top lineof the Measure window. The values for the second point you clicked were entered into the positionfor the second point (the third line of the window).
Measure tool tips
• If you click another point, the values for the new point are entered into the second point positionand the previous values are moved up to be the first point.
• The Measure tool will "snap" to contours when in Contour Display mode, allowing you toaccurately measure the distance between two objects. When in Cross or Dummy color mode, itwill snap to the bounding box of the Graphics.
• The values in the Measure tool are copied to the Measure Window. You can open the MeasureWindow to use these values in other dialog boxes or windows.
9.2.3 View Selector
The View Selector indicates or sets:
• The View in which you are working: Sheet or Graphic View.• The side of the sheet on which you are working: front or back.