Embed Size (px)
Citation preview

P A-A091 237 ARMY ENGINEER WATERWAYS EXPERIMENT STATION VICKSBURG--ETC F/6 20/4SPILLWAY FOR COOPER DAM. SULPHUR RIVER, TEXAS. HYDRAULIC MODEL -- ETC(U)
AUG 80 J F GEORGEUNCLASSIFIED WES/TR/HL80-15N-EEilIEEEEEE
I flIIII///Ilfl//lfE!!EEEEEEEEEEEEEEEE/IIIEEIIIIIIIIII

.4-
t~.
A
)
4.
I...
* *.-~pe ,~' . * -

SECURITY CLASSIFICATION OF THI~jS AGE1 V a.e Bfto
REPRTDCCUENATONPAE J9 DkIiSIIMUOONSRON
I. RORTIO STATEMEN 12.1 ACCESIO NOR- PXN*at)L UME
ApprovLEad fo ublic reeae ditrbuioERliEtd
"IS. KEY FOR (COOP E kA a, ZLte ede Heeemud IdVentt Fina block umi
Iydraulic Mdels sigtinSpillway
vedratigcs thebhyraulcpromacoftestutrroryrosfowcniinThe m.ox reproducedsaproxmtlg ,0-tln pahae, the entire
sevc sp.la S.Amnincl Dtig, nonertfWortios an400f 0o8xi0hanl
~473ERITOU@FNOV65 5OSSOETEUnclassified
sccumr Iv A CLASSIF ICATION F TIS P G A Del.
Appovd..r.ub.c...ese.d.trbuto..nlm.ed

UnclassifiedSWCURITY CLASSPICATION OF THIS PAOQtMhi DO& eMOS
20. ABSTRACT (Continued).
SModifications to the approach wing walls eliminated the buildup of the watersurface, but did not significantly improve the velocity distribution or flowconditions throughout the structure. The modified wing walls were considerablymore expensive to construct; therefore, the original wing wall design wasreinstalled.4 ,
Satisfactory flow conditions were observed on the trajectory and in thestilling basin with all tainter gates opened 3 ft and greater. However, un-satisfactory flow conditions occurred in the stilling basin when using equaltainter gate openings of 2 ft and less or sluice gates to regulate low dis-charges. The depth of tailwater did not allow the low discharges to spreadproperly across the lower parabolic trajectory, which resulted in unstableflow conditions in the stilling basin. Modifications consisting of chuteblocks and deflectors positioned on the trajectory and sluice outlets,respectively, were ineffective in improving flow conditions in the stillingbasin. Optimum combinations of sluice gate operations for regulating variousdischarges were determined with normal pool elevation (4o) and differenttailwater elevations. The same optimum arrangements were determined fortainter gate operations.
Riprap requirements were determined for the area immediately downstreamfrom the stilling basin and for the outlet channel.
UnclassifiedScuRITY CLA.ICATION oF T.IS PAGW(fhol D N,-en

PREFACE
The model investigation reported herein was authorized by the
Office, Chief of Engineers, U. S. Army, on 1 February 1978, at the
request of the U. S. Army Engineer District, New Orleans (LMNED). The
studies were conducted by personnel of the Hydraulics Laboratory, U. S.
Army Engineer Waterways Experiment Station (WES), during the period May
1978 to April 1979. Reassignment of responsibilities for the Cooper Dam
and Spillway from LMNED to the Fort Worth District became effective
1 September 1979. All studies were conducted under the direction of
Messrs. H. B. Simmons, Chief of the Hydraulics Laboratory, and J. L.
Grace, Jr., Chief of the Hydraulic Structures Division. The tests were
conducted by Messrs. J. F. George, J. H. Riley, and A. Allen under the
supervision of Mr. G. A. Pickering, Chief of the Locks and Conduits
Branch. This report was prepared by Mr. George.
Representatives from the Lower Mississippi Valley Division and
LMNED visited WES during the study to discuss test results and to corre-
late these results with concurrent design work.
Commanders and Directors of WES during the testing program and the
preparation and publication of this report were COL John L. Cannon, CE,
and COL Nelson P. Conover, CE. Technical Director was Mr. F. R. Brown.
Accession For
NTIS GERA&IDIDC TABUnannouncedJustification
Distri~but on/ ,.
~~CodesAvailad/orDist special
A _"A

CONTENTS
Page
PREFACE . 1
CONVERSION FACTORS, U. S. CUSTOMARY TO METRIC (SI)UNITS OF MASUREMENT................. 3
PART I: INTRODUCTION. .. ...................... 5
The Prototype..........................5Project Design Flood......................Purpose of Model Study....................6
PART II: THE MODEL .. .............. ... ..... 8Description. .................... ..... 8Model Appurtenances .... ................... 8Scale Relations .... ..................... 8
PART III: TESTS AND RESULTS. ................... 11
Approach Area .. ....................... 11Spilivay and Stilling Basin. ................. 12Riprap, Protection Plans. ................... 15
PART IV: DISCUSSION OF RESULTS .. ................. 19
TABLE 1.
PHOTOS 1-15
PLATES 1-23
2

II
CONVERSION FACTORS, U. S. CUSTOMARY TO METRIC (SI)UNITS OF MEASUREMENT
U. S. customary units of measurement used in this report can be con-
verted to metric (SI) units as follows:
k itiply By To Obtain
acre-feet 1233.482 cubic metres
cubic feet per second 0.02831685 cubic metres per second
feet O.3048 metres
feet per second 0.3048 metres per second
inches 25.4 millimetres
pounds (mass) 0.4535924 kilograms
3
- ., ,- -.

OKLAOMATEXAS I
NEW MEXICOLOAIN RK
EL PASOLA
RIO.
4f4
SAN__GALVESTON

SPILLWAY FOR COOPER DAM, SULPHUR RIVER, TEXAS
Hydraulic Model Investigation
PART I: INTRODUCTION
The Prototype
1. The Cooper Dam Spillway (Figure 1) which will be located on
V South Sulphur River, Texas, is designed to provide flood-control pro-
tection, a municipal and industrial water supply, and an area for rec-
reation for the surrounding area in Delta and Hopkins Counties. The
flood-control feature of the project is directly related to Wright
Patman Lake, in that in addition to providing protection to the flood-
plain between the two lakes the flood-control storage of 131,000 acre-ft*
in Cooper Lake will make available for conversion to water supply storage
120,000 acre-ft of the storage in Wright Patman Lake presently reserved
for flood control.
2. The service spillway, to be located on the south abutment ap-
proximately 5,300 ft from the main channel of South Sulphur River, will
consist of a weir controlled by five 40-ft-wide by 20-ft-high tainter
gates separated by 11-ft-wide piers. The weir will have an ogee shape
with crest elevation at 426.2"* and a iV-on-iH sloping upstream face.
The weir, classified as a low weir, is based on a design head of 26.6 ft
which is the maximum head on the spillway crest resulting from the
spillway design flood.
3. The spillway chute will be 244 ft wide between parallel walls
and will consist of a bucket curve with a 35-ft radius, a 14 .55-ft-long
1V-on-20H slope, a 45. 6-ft-long parabolic curve, a 3 4-ft-long lV-on-
3.5H slope, and a bucket curve with a 40-ft radius.
* A table of factors for converting metric (SI) units of measurement
to U. S. customary units is presented on page 3.00 All elevations (el) cited herein are in feet referred to mean sea
level (msl).
5

4. The stilling basin, also 244 ft wide, will be 114.5 ft long
from the point of tangency of the spillway chute to the apron. The
stilling basin will contairi two rows of 7-ft-high by 6-ft-wide baffle
blocks that will be spaced approximately 6 ft apart. The upstream row
of baffle blocks will be placed 43.5 ft from the downstream end of the
stilling basin.
5. In each of the four intermediate service spillway piers a 6-ft
by 6-ft conduit with intake invert at el 398.0 will be provided. The
conduits, controlled by vertical slide gates, will be approximately
70 ft long at a one percent grade and will discharge on the service
spillway chute. One pier will also contain two 24- by 36-in. sluices
to allow for selective withdrawal during low-flow periods. Details of
the structure are shown in Plates 1 and 2.
Project Design Flood
6. The maximum design discharge in determining the stilling basin
requirements was 110,000 cfs with the reservoir at el 452.8. The design
discharge consisted of approximately 103,000 cfs for the service spill-
way and approximately 7,000 cfs for the total capacity of the four con-
duits at the reservoir elevation of 452.8. The combined discharge was
considered to have the energy equivalent to a spillway discharge of the
same amount for developing the stilling basin design. At normal upper
pool (water supply pool) el 440.0 the service spillway discharge is
approximately 36,000 cfs and the combined capacity of the conduits
is 6,000 cfs.
Purpose of Model Study
7. A model was considered necessary to verify the adequacy of the
original design and develop, if necessary, a design that would provide
satisfactory flow conditions throughout the structure. Specifically,
the model study was to determine:
a. Approach conditions to the spillway.
6

b. Performance of the spillway and stilling basin for various
flow conditions.
c. Spillway rating curves with partial and full gate openings.
d. The optimum riprap protection plan for the exit channel V
downstream from the stilling basin.
7,.

PART II: THE MODEL
Description
8. The 1:36-scale model reproduced approximately a 1,300-ft-long
approach area, the entire service spillway including nonoverflow sec-
tions, and 800 ft of exit channel (Figure 2). The proposed spillway
and tainter gates were constructed of sheet metal, and all piers and
vertical slide gates were constructed of transparent plastic. The
stilling basin, baffle blocks, end sill, and stilling basin walls were
constructed of plastic-coated plywood. The approach channel, nonover-
flow sections, and exit channel were molded in sand and cement mortar
to sheet-metal templates initially to observe the performance of the
spillway with various flow conditions. The cement mortar was replaced
with riprap in later tests to determine the optimum channel protection
downstream of the structure. Filter cloth was placed between the sand
and graded riprap for all channel protection tests.
Model Appurtenances
9. Water used in the operation of the model was supplied by a
circulating system. Discharges were measured by means of venturi meters
installed in the flow lines and were baffled when entering the model.
Velocities were measured with pitot tubes that were mounted to permit
measurement of flow from any direction and at any depth. Water-surface
elevations were measured with point gages. Different designs, along
with various flow conditions, were recorded photographically.
Scale Relations
10. The accepted equations of hydraulic similitude, based on
the Froudian criteria, were used to express mathematical relations
between the dimensions and hydraulic quantities of the model and
prototype. General relations for the transference of model data
8

a. Looking downstream
b. Looking upstream
Figure 2. General view of model
_ _ _

to prototype equivalents are presented below:
Characteristic Dimension* Model :Prototype
Length L 1:36r
Area A L 1:1,296r r
Velocity V = Lu2 1:6r r
Discharge = L5 / 2 1:7,776
r
Volume V = 0 1:46,656r r
Weight W = L3 1:46,656r r
Time T = Ll/2 1:6r r
* Dimensions are in terms of length.
Model measurements of discharge, water-surface elevations, and velocities
can be transferred quantitatively to prototype equivalents by means of
the scale relations. Experimental data also indicate that the prototype-
to-model scale ratio is valid for scaling riprap in the sizes used in
this investigation.
10
$

PART III: TESTS AND RESULTS
Approach Area
11. The model reproduced an 800-ft-wide approach for a distance
of approximately 1,300 ft upstream from the spillway (Plate 1, Figure 2).
Although satisfactory flow conditions were observed in the approach area
upstream of the wing walls for all discharges up to the spillway design
flood of 110,000 cfs, buildup of the water surface along the piers at
the left and right sides of the spillway became significant with the de-
sign discharge (Photo 1). However, velocities measured on the crest and
in the stilling basin indicated that fairly uniform velocity distribu-
tion was present throughout the structure with the spillway design
flood (Plate 3).
12. Several modifications to the approach wing walls upstream of
the dam were tested in an attempt to reduce the buildup of the water
surface along each side of the spillway and to further improve flow con-
ditions throughout the structure. The type 2 design incorporated the
original design wing walls and curved walls positioned on the lV-on-3H
slopes on each side of the spillway as shown in Plate 4i. Test results
showed that the type 2 design was not effective in reducing the buildup
of flow along the walls. Velocities measured in the left bay (looking
downstream) with the maximum discharge are shown in Plate 5.
13. The type 3 wing wall design consisted of 56-ft-high walls on
each side of the spillway as shown in Plate 6 and Photo 2. This modi-
fication significantly reduced the buildup of flow along the walls
(Photo 2), but velocities measured in the left bay (Plate 5) indicated
little change in velocity distribution relative to the types 1 and 2
designs previously tested.
14i. The height of the type 3 wing wall was reduced 29 ft (type 4i)
so that the top of the wall was at el 425-0. Results of tests conducted
with this modification showed little difference in flow conditions than
were observed with the types 1 and 2 approach wing wall designs.
15. Flow conditions were observed with rock dikes located at

several locations on the lV-on-3H slopes with types 1 and 14 wing Wall
designs. Test results indicated that the dikes would have to be as high
as the maximum water-surface elevation to be effective in reducing the
buildup of flow along the walls.
16. The type 3 approach wing wall design reduced the buildup of
the water surface along the left and right walls of the spillway more
effectively than the other designs tested. However, little improvement
was obtained in the velocity distribution relative to the other designs
tested. Also, little change was observed in the discharge calibration
data obtained with the type 3 design as compared with the first two
approach wing wall designs tested (Plate 7). The expense of the addi-
tional wall height is probably not justifiable since the only benefit
derived from this design was a reduction in the water surface along the
sides of the spillway. Therefore, the original design (type 1) approach
wing walls were reinstalled.
Spillway and Stilling Basin
Tainter gate operations
17. Performance of the spillway and stilling basin was observed
and documented with discharges ranging from 8,000 cfs to 110,000 cfs and
various upper pool and tailvater elevations. At the normal upper pool
elevation of 4&40.0, flow conditions were satisfactory throughout the
spillway and stilling basin for the majority of gate openings and tail-
water elevations observed. Velocities measured on the spillway crest
and at several locations in the stilling basin with a discharge of
~40,000 cfs, the normal upper pool elevation, and all gates fully open
indicated uniform velocity distribution thrcughout the structure as
shown in Plate 8. Various flow conditions riith normal upper pool are
shown in Photo 3.
18. With the design discharge of 110,000 cfs, cross waves were
created by the piers in each gate bay (Photo 1). The cross waves were
confined to the surface since uniform velocity distributions were
observed throughout the depth of flow at the crest and in the stilling
12

basin (Plate 3). Flow conditions downstream of the stilling basin were
considerably rough with significant wave action occurring along the side
slopes immediately downstream from the structure (Photo 4).19. Calibration data obtained with the original design indicated
that the structure was slightly more efficient in passing large flows
than was anticipated (Plate 9). Gate openings used in calibration tests
were set using the shortest distances measured from the spillway to the
gate lip.
20. Flow conditions were observed with equal tainter gate opera-
tions for discharges ranging from 6,000 cfs to 16,500 cfs at normal
upper pool. Satisfactory flow conditions were observed with all gates
opened 3 ft and greater. However, unsatisfactory flow conditions oc-
curred in the stilling basin with 1- and 2-ft gate openings. With the
lower discharges, the depth of tailwater did not allow the flow to
spread properly across the lower parabolic trajectory, which resulted
in unstable flow conditions involving concentrated jets and eddies in
the stilling basin as shown in Photo 5. These concentrated jets and
eddies were present for all tests with tailwater elevations ranging
from normal tailwater elevations (Plates 10 and 11) to the minimum pos-
sible in the model due to the flow control by the downstream channel
(channel control depths, Plate 12). Tainter gate operations listed in
Table 1 are gate arrangements producing the weakest eddies in the still-
ing basin. Combinations using four tainter gates were not listed since
any four-gated arrangement produced small intense eddies that could pos-
sibly move rocks. The location and numbering system used to identify
the tainter gates are shown in Plate 13.
21. Tests were conducted to evaluate the effectiveness of placing
chute blocks on the spillway trajectory to spread and distribute the
flow entering the stilling basin. Several types of chute blocks
(Plate 14) were tested in an effort to improve flow distribution across
the lower parabolic trajectory of the spillway with gated discharges of
10,000 cfs and less. Little improvement in flow distribution and still-
ing basin performance was observed with these modifications and normal
tailwaters. Since modifications on the trajectory were ineffective in
13
j

improving flow conditions, gate combinations furnished in Table 1 should
be considered in regulating low discharges with the tainter gates.
Sluice gate operations
22. Tests were conducted to determine satisfactory gate operations
using sluice intake gates to regulate low discharges and avoid adverse
flow conditions in the stilling basin. Tests were conducted with dif-
ferent combinations of sluice gates fully open to regulate discharges
between 1,500 cfs and 6,000 cfs with normal upper pool elevation ofA40.0 and tailwater elevations ranging from normal to channel control
depths.
23. With normal tailwater depths, unsatisfactory flow conditions
were observed for any and all combinations of sluice gate operations
ranging from a single sluice gate to all sluice gates open (Photo 6).The unsatisfactory flow conditions resulted because the excessive tail-
water depths concentrated the discharge from the sluices rather than
spreading or distributing the flow properly across the lower parabolic
trajectory. The unstable flow conditions created small intense eddies
that could possibly move small rock and result in abrasive damage to
the stilling basin. Although mild eddies occurred in the basin, satis-
factory flow conditions were observed when tests were conducted with
tailwater depths resulting from channel control. Testr results indi-
cated that the maximum tailwater elevation for satisfactory flow con-
ditions with sluice gate operations was approximately 394.J. Flow con-
ditions with various sluice gate operations and a tailwater elevation
of 394.0 are shown in Photo 7.
24. Additional tests were conducted to determine the best arrange-
ments for operations with one, two and three sluice gates for both nor-
mal and channel control tailwater depths. Eddies developed in the basin
when using up to three sluice gates to regulate low discharges, regard-
less of the combination used or the elevation of the tailwater. However,
the sluice gate combinations listed in Table 1 produced the weakest ed-
dies in the stilling basin. The location and numbering system used to
identify the sluices are shown in Plate 13.
25. Deflectors with heights of 1, 2, and 3 ft (Plate 15) were
14*
placed on the invert of the sluice outlets in an attempt to spread and
distribute the flow entering the stilling basin. The deflectors were
found to be effective in spreading flow over a greater 'width of the
spillway trajectory. However, they did not improve stilling basin per-
formance with sluice discharge operations.
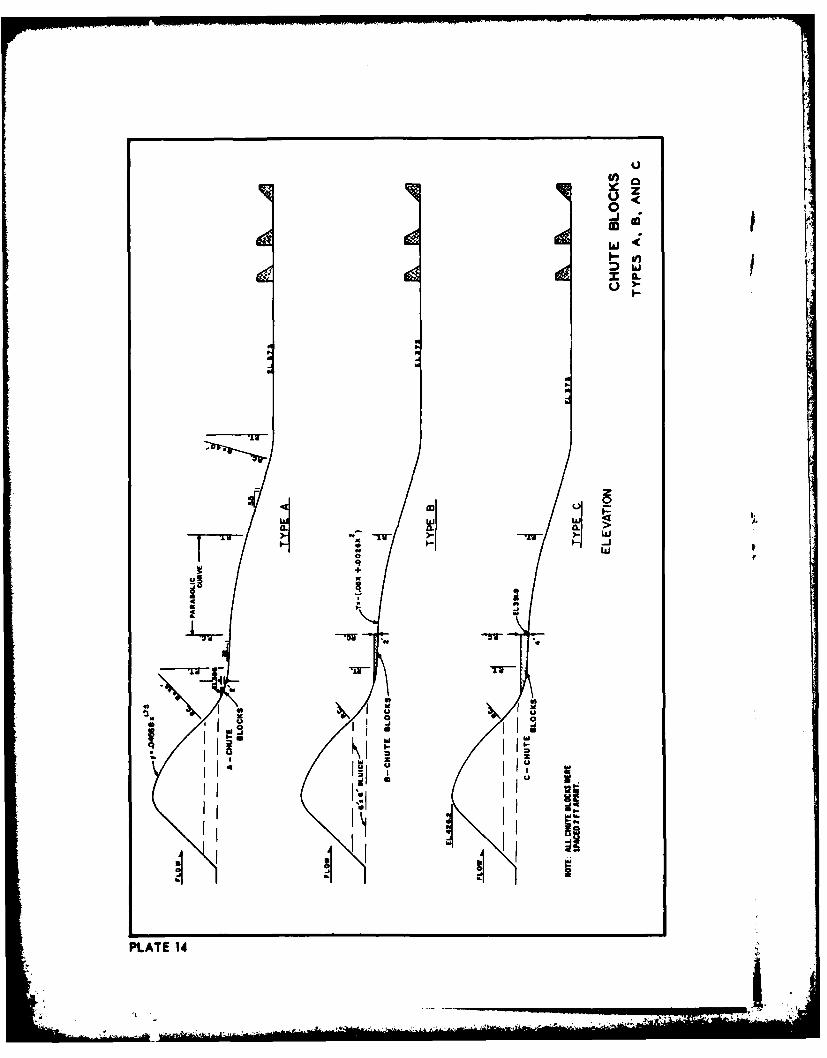
26. Various size chute blocks (Plate 14) were placed immediately
4downstream of the sluice outlets to aid in spreading the flow enteringthe stilling basin. The chute blocks were found to be ineffective in
spreading releases from the sluices across the trajectory with normaltailwater depths.
J 27. Since the sluice deflectors and chute blocks did not produce
significant beneficial improvement of flow conditions on the spillway
trajectory or in the stilling basin, it was recommended that the spill-
way be operated using gate arrangements furnished in Table 1. Tests
were not condcuted with combined sluice and tainter gate operations.
Riprap Protection Plans
28. Various riprap plans were tested to determine optimum riprap
protection for the area immediately downstream of the stilling basin and
for the outlet channel. Velocities were measured 1 ft above the channel
invert downstream of the stilling basin for discharges of 40,000 cl's
(normal pool el 440.0) and 110,000 cl's (design discharge) with all gates
fully open (Plates 16 and 17). Velocities measured approximately 500 ft
downstream from the stilling basin were higher than those in the area
immediately downstream from the basin due to the exit channel configu-
ration in that vicinity. Riprap tests conducted in an area that ex-
tended from the stilling basin to 287 ft downstream were not affected
since this increase In velocities occurred 213 ft farther downstream.
Area immediately downstreamfrom stilling basin
29. The type 1 riprap plan (Plate 1) consisted of riprap with an
average diameter (D 50) of 27 in. on the channel invert from the end
sill to 20 ft downstream, 18-in. (D 50) riprap from 20 ft to 126.67 ft
15

downstream, and 12.-in. (D5 0) riprap on the side slopes from the still-
ing basin to 126.6T ft downstream. The blanket thickness for each size
riprap was equivalent to one and one half times the average diameter of
the stones. Tests were conducted with flow conditions resulting from
discharges of 40,000 cfs and 110,000 cfs with all gates fully open andtailwater elevations of 406.0 and 410.5, respectively. Failure in the
type I riprap plan occurred almost immediately along the slopes and on
the channel invert as the discharge was increased to 110,000 cfs.
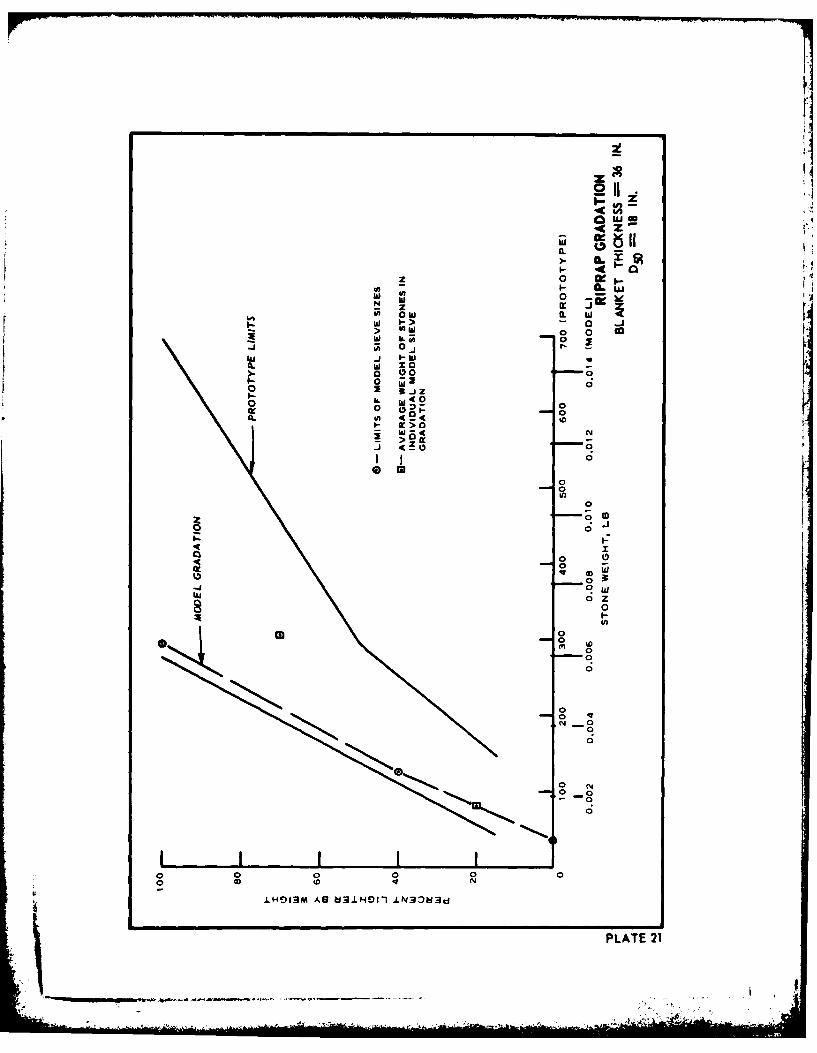
30. In the type 2 riprap plan, 27-in. (D50) stone was placed on
the entire channel invert with a blanket thickness of 54 in. The rip-
rap on the side slopes was increased to 18 in. (D 0) with a blanket
thickness of 36 in. The riprap protection for the channel invert and
the side slopes was extended from the stilling basin to 287 ft down-
stream (Photo 8). After a 36-hr (prototype) test with a discharge of
110,000 cfs, failure occurred just downstream of the end sill (Photo 8).
31. The size of the riprap on the channel invert was increased to
an average diameter of 32 in. for a distance of 127 ft downstream from
the end sill (type 3, Photo 9). Failure occurred just downstream of
the end sill after a 36-hr test with a discharge of 110,000 cfs.
32. The 32-in. (D5 0 ) riprap was replaced with 36-in. (D 0 ) riprap
with the 27-in. (D ) and 18-in. (D50 ) riprap protection covering the50 5same areas as in the previous test (type 4, Photo 10). Again, failure
was observed just downstream of the end sill after a 48-hr test with a
discharge of 110,000 cfs (Photo 10).
33. In the type 5 riprap plan (Photo 11) the small dip in the
channel invert immediately downstream of the end sill was eliminated,
and the channel invert was modified to a iV-on-45H upward slope from
the end sill to a location 90 ft downstream. The channel invert from
the end sill to a location 127 ft downstream was protected with 36-in.
(D 5) riprap, and the reach from 127 ft to 287 ft downstream was
covered with 27-in. (D 0) riprap. The side slopes were protected with
18-in. (D50 ) riprap. During a 36-hr test with the design discharge of
110,000 cfs, failure occurred in an area that extended from the end
sill to approximately 20 ft downstream.
16
4

34. The type 6 riprap plan (Plate 18, Photo 12) consisted of
basically the same riprap plan as the type 5 plan except for the area on
the channel invert from th end sill to 30 ft downstream. In this area
the size of the riprap was increased from 36-in. (D0) riprap to a uni-50 -
form gradation of stones varying from 36 in. to 45 in. in diameter (D50= 40 in.). No failure was observed after several 12-hr tests with a
discharge of 110,000 cfs. From the results of these tests, the type 6
riprap plan is recommended for the prototype for the area immediately
downstream of the stilling basin.
Outlet channel
35. Tests to determine the riprap requirements for the outlet
channel were conducted with discharges ranging from 8,000 cfs, bank-full
capacity of the outflow channel, to 110,000 cfs, the spillway design
discharge. The area immediately and for a distance of 287 ft downstream
of the stilling basin was protected with the type 6 riprap protection,
while tests were conducted to determine riprap requirements farther
downstream in the outlet channel.
36. Initially, the outlet channel in a reach from 287 ft to 867 ft
downstream of the end sill was protected with riprap with an average
diameter (D 50) of 27 in. and a blanket thickness of 54 in. placed on the
invert and side slopes (type 7, Photo 13). The type 7 riprap protection
plan remained stable throughout a series of tests consisting of a 6-hr
duration with a discharge of 8,000 cfs, 6 hr of 40,000 cfs, and 12 hr
of 110,000 cfs. The size of the riprap was reduced to an average diam-
eter of 18 in. and a blanket thickness of 36 in. (type 8, Photo 14). No
failure was observed in the type 8 riprap protection plan after being
subjected to the same series of flow conditions previously described.
37. In the type 9 riprap protection plan 12-in. (D 50) riprap with
a blanket thickness of 24 in. was placed on the invert and side slopes.
This riprap protection plan also remained stable throughout a series of
tests consisting of 12 hr of 8,000 cfs, 12 hr of 40,000 cfs, and 12 hr
of 110,000 cfs. Based on these tests and results, the type 9 riprap
protection plan (Plate 19, Photo 15) was considered to be adequate and
was recommended for prototype construction. Smaller riprap was not
17
. . . ..... m l I ]II II. .. .

tested, since it was deemed impractical. The gradations of the riprap,
tested in the model are shown in Plates 20-23.
18
.~.. V -.. - ,**W

PART IV: DISCUSSION OF RESULTS
38. Flow conditions in the approach area were satisfactory for the
range of anticipated discharges. Approach conditions immediately up-
stream of the spillway created a buildup of the water surface along the
piers at the left and right sides of the spillway which was significant
with the spillway design discharge. Velocities measured on thle crest
and in the stilling basin, however, indicated fairly uniform velocity
distribution throughout the structure.
39. Modifications to the approach wing walls reduced the buildup
of the water surface along the spillway walls, but little improvement
was obtained in the velocity distribution throughout the structure. The
expense of the additional wall height incorporated in the wing wall mod-
ifications is probably not justifiable since the only benefit derived
was a reduction in the water surface along the sides of the spillway.
Therefore, the original design approach wing walls were recommended for
the prototype.
40. Satisfactory flow conditions were observed on the spillway and
in the stilling basin with all tainter gates opened 3 ft and greater
with normal upper pool el 440. 0. With low and intermediate discharges,
the hydraulic ju~mp occurred on the spillway chute in the vicinity of the
lower parabolic curve. As the discharge increased to flood conditions,
the jump moved downstream into the stilling basin where satisfactory
energy dissipation occurred. With the design discharge of 110,000 cfs,
flow conditions downstream of the stilling basin were considerably rough
with significant wave action occurring along the side slopes immediately
downstream from the structure.
41. Calibration data obtained with the original design indicated
that the structure was slightly more efficient in passing large flows
than was anticipated.
i4 2. Unsatisfactory flow conditions were observed with all five
tainter gates opened 2 ft and less with normal upper pool el 440.0.
With discharges of 10,000 cfs and less, the depth of tailwater did not
allow the flow to spread properly across the lower parabolic trajectory.
19

This resulted in unstable flow conditions involving concentrated jets
and eddies in the stilling basin. These unstable flow conditions were
present with tailwater~elevations ranging from normal tailwater eleva-r
tions to the minimum possible in the model due to flow control by the
downstream channel.
143. Various size chute blocks were placed on the trajectory to
spread and distribute the flow entering the stilling basin. Little
improvement in flow conditions was observed with these modifications.
Since any tainter gate operations in regulating low discharges resulted
in unstable flow conditions, regardless of modification tested, gate
arrangements producing the weakest eddies in the stilling basin were
determined.
144. Unsatisfactory flow conditions were also observed when using
sluice intake gates to regulate low discharges with normal upper pool
and tailwater elevations. The unsatisfactory flow conditions resulted
because the excessive tailwater depths concentrated the discharge from
the sluices rather than spreading or distributing the flow properlyacross the lower parabolic trajectory. The unstable flow conditions
created small intense eddies that could possibly move small rock and
result in abrasive damage to the stilling basin. However, satisfactory
flow conditions were observed when tailvater elevations were at el 3914.0
and lower.
45. Different size chute blocks were placed on the trajectory
immediately downstream of the sluice outlets to aid in spreading the
flow entering the stilling basin, but little improvement in flow con-
ditions was obtained. Various size deflectors were then placed on the
invert of the sluice outlets in an attempt to spread and distribute the
flow entering the stifling basin. The deflectors were found to be ef-
fective in spreading flow over a greater width of the spillway trajec-
tory, but they did not improve stilling basin performance. Since mod-
ifications on the trajectory and at the sluice outlet did not produce
significant improvement of flow conditions on the spillway or in the
stilling basin, sluice gate arrangements producing the weakest eddies
in the stilling basin were determined.
20
Wimp"

46. Riprap protection plans were developed for the area inmedi-
ately downstream of the stilling basin (type 6) and for the outlet
channel farther downstream (type 9). The minimum riprap protection
requirements established were adequate for the full range of expected
flows and tailwaters.
1.
21
"' .. .. .. ..... .... h -'-, [ i~r " '
" &,f -. , /;' .. .. ..- ' " ~il ,T =
- .' -
.. .. ..

Table 1
Cooper Lake Spillvay Gate Operations
Gate Opening No. of Recommended Combinationft Gates of Gates
Tainter Gates
i 1 1lor 51 2 1&2or4 &5
1 3 1, 2, & 3 or 3, 4, & 5
1 4 - -
2 1 1or 52 2 1&2or 4 & 5
2 3 1, 2, & 3 or 3, 4, & 52 4 -
Sluice Gates
6 1 A or D
6 2 B&C
6 3 A, B, & C or B, C, & D

PHOTOGRAPHS

a. Gate opening 4 ft, discharge 16,000 cfs, tailweater el. 402.0
b. Gae opening 6 ft, discharge 23,000 cts, tailvater el 403.5
Photo 1. Looking downstream at flow conditions immediately upstreamof spillway; upper pool .1 440.0 (Sheet 1 of 3)

.4
d. All gates fully open, discharge 40,000 ct's, tailwater el 406.0
Photo 1. (Sheet 2 of 3)

e. All gates fully open, discharge 110,000 cfs, tailvater el 410.5
Photo 1. (Sheet 3 of 3)

a. Dry bed
b. All gates fully open, discharge 110,000 Cfs, upper pool el 452.3
Photo 2. Type 3 approach wing wall
a. Gate opening 4 ft, discharge 16,000 cfs, tailvater el 402.0
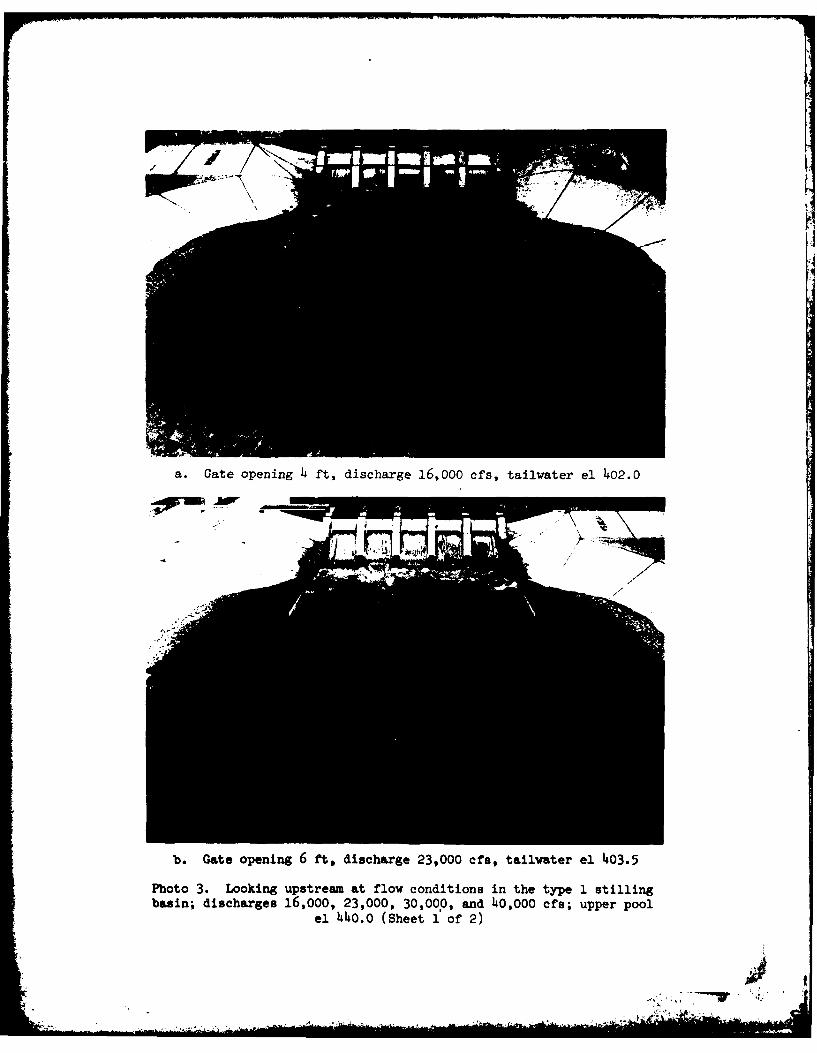
b. Gate opening 6 ft, discharge 23,000 cfs, tailvater el 403.5
Photo 3. Looking upstream at flow conditions in the type 1 stillingbasin; discharges 16,000, 23,000, 30,000, and 40,000 cfs; upper pool
el 4140.0 (Sheet 3. of 2)

c. Gate opening 8 ft, discharge 30,000 cfs, tailvater el 404.5
'FF
d. All gates fully open, discharge 40,000 cfs, tailvater el 406.0
Photo 3. (Sheet 2 of 2)
- mm .4k--

Photo 4. Looking upstream at flow conditions in the type 1 stilling
basin. All gates fully open, discharge 110,000 cfs, upper poolel 452.3, tailwater el 410.5
- - .. ~ . , 4

i
a. Gate opening I ft, discharge 6,000 cfs, tailwater el 399.2
b. Gate opening 2 ft, discharge 10,000 cfs, tailwater el 400.5
Photo 5. Looking upstream at flow conditions in the type 1 stilling
basin; discharges 6,000 and 10,000 cfs; upper pool el 440.0

a. Discharge passing through sluice D; discharge 1,500 cfs,tailwater el 397.3
b. Discharge passing through sluices B and C; discharge 3,000 cfs,tailwater el 398.0
Photo 6. Looking upstream at flow conditions in the type 1 stillingbasin; discharges 1,500, 3,000, 4,500, and 6,000 cfs; upper pool
el 440.0 (Sheet I of 2)

c. Discharge passing through sluices B, C, and D;discharge 4~,500 cf's, tailvater el 398.5
d. Discharge passing through all sluices;discharge 6,000 cf's, tailwater el 399.2
Photo 6. (Sheet 2 of' 2)

a. Discharge passing through sluice D; discharge 1,500 cfs
b. Discharge passing through sluices B and C; discharge 3,000 cfs
Photo T. Looking upstream at flow conditions in the type I stillingbasin; upper pool el 440.O, tailvater el 394.0 (Sheet 1 of 2)

L
c. Discharge passing through sluices B, C, and D; discharge 4,500 cfs
d. Discharge passing through all sluices; discharge 6,000 cfs
Photo 7. (Sheet 2 of 2)

INIIV,.
b. Dry bed showing failure after a 36-hr (prototype) test with dis-
charge 110,000 cfs, upper pool el, 452.3, and taiwater el 410.5
Photo 8. Type 2 riprap protection plan

Photo 9. Type 3 riprap protection plan

14-
a. Dry bed6
b. Dry bed showing failure after a h8-hr (prototype) test with dis-charge 110,000 cfs, upper pool el 452.3, and tailwater el 410.5
Photo 10. Type 4 riprap protection plan
Ii - - . i

-moot
Photo 11. Type 5 riprap protection plan
Photo 12. Type 6riprap protection plan

Photo 13. Ty-pe 7 riprap protection plan
Av."-
Photo 14l. Type 8 riprap protection plan

Photo 15. Type 9 riprap protection plan

isI
PLATE
CLI
'i WO. 0-

sin
qr
0
LI
- -. .. .. .. ..
PLATE 2
Z!

z CO
ic o
0n U) 0-
3m~q
%%%
* ~r
21 0
-. . z
'Ula.
I'U,
0
02
2
PLATE 3

-4
z
a ..0.
00
PLT 4

BAY 01
31 31 33-36 34' 31 31 31 31 3o 15
33536 38 36 36 36 36 35
;0 i4 39 41 4144 40 40 39 4? 4 436.
STA 0400 (SPILLWAY CREST)TYPE 2 APPROACH WING WALL
BAY it1
155 335 35 35 35 35 35353
., 40 40 40 40 40 40 40 403 9 <:* ii 2.
STA 0+00 (SPILLWAY CREST)TYPE 3 APPROACH WING WALL
MAXIMUM VELOCITIESTYPES 2 AND 3 APPROACH WING WALLS
DISCHARGE 110,000 CFSNOTE. VELOCITIES ARE IN PROTOTYPE UPPER POOL EL 452.2
FEET PER SECOND. TAILWATER EL 410.6LOOKING DOWNSTREAM.
PLATE 5

-J
0
z
0uJ 0.C
-J.0
-I-
00
01
0A ~r
PLT a

> 0
z0
Im -4L
0_ 00 0
0i 0 e_C;
< u
000 0
o0 0.00
N Ml
1. 0.wJ 0
Luu
0. 0
0
0 3
0
0
0
- -- - -in Q n 0
4W -r
1- -. '2,31

L1-
0~u C
%0.allwJ wij _
>J wiL
~ ow
44
-. 5.5.5 5.W.N
S.55.S.
F z
PLATE8
. ... .. ...

LU
00zzLUFat
Luig 0 t
0CL
0 -U
00
u -1 8_ _
_ _ _ - S0
U- 00-0
0
0
-- 0
0
0 o d-~ 0
Q0-- 0 0
6 N
N... 0010 -TS
-. 4. 0
In In Q IA0III N
4 4 4 40
CIO m0±A1
PLT8
97

- 4 _4 -% 0-C,
CL
0rn
0 0
-z co
Lu-I
UJU
-w &A 0
Lu~0
LUI l
-i-J
wwzu
ZE >
Ww
-I
---- 0W)If 0 in 0 00 8t 0 co coqq t m (
IS W .A 'NOI.LVA3-13 3zvjads-uLvm
PLATE 10

coI__
>
0 C)
U.J
J
uuI
____ 0 Lu
U. .a,' 0 -
ckt- u.Iqa-
0
-W
oW
ix"J
0 (
Nw
01 0
-- 0 0 10I 0
PLATE I1I

I- IuC)-
-J 4
1 .4
LAIL
J LiJ
0
0D
00
-
IA 'NII S1 aC wn-ia 0 I
PLATE 12

.......... - . . . . 2 \ ~ ..-.
.)
0
wj
'a
q+
iF i
.4-#4
40
PLATE 14

A
ShMICT~l
SECTION B-
TYPE 2
FLOW. SUC S4"
c SECTION C-C
TYPE 3
SLUCEDICECOR
TYPES 3,,AN
PLATE 15

MAXIMUM VELOCITIES1 FT ABOVE CHANNEL INVERT
ORIGINAL SPILLWAY DESIGNDISCHARGE 40.000 CFSump I. OEL 44,00
NOTE VELOCITIES ARE IN 0111TOrWE FEET FIX WCOdD TAILWATER EL 4060
LL PLATE 16

-7 ~ ~ FT ABV CHANNELT211 INVERT
ORIGINAL SPILLWAY DESIGNDISCHARGE 1,10 '000 CPSUPPER POOL EL 4525
NOTE VELOCITIES ARE IN PROTOTYPE FEET PER SECo o TAILWATER EL 4105
PLATE 17

(Li
tLLU iOSMO- 00M
000
-AC-
IuC4C 0MZ
'NJ PS 1
6LIC 13
'NJ P = ..19rp.s I I
-- 'N 9E 8 = ==
-c-J~~ ~ C auaaoaaoa o
PLATEN1

zQ z
.0.
0d .- z a
01i.
'A!0
0 . 06*11
'Il 09A 1 a0M* - qTOM
PLT 19

Ccc
ww
-j0 04 ~00
a - -
z
w 0
0z10 0
0 0
LU 0
Itw
>. 0
0. 00
LUG -
it - - 8 r.
0
0
0000
.LHOI3A AgU31J~4911 IN33d
PLATE 20
,v jI- Z
j~~~ LOFt
4II~I4
0 _uw
- 00 ~ ~ w L
0 J
- w
. zo0 00
0 o2
0 0 0a. 0
M. >o 1WN
-J a
I I ll0
* LW0
0
0 0
0
0z0
0070
0000
N
LH:)3 AG 63H IN3b I
PLATE 21

V)VU)U
o O
z 8
000
0 M
w
A $A
0 4
0 0
MJ W
0
0
K 0a)-
0 0
PLATE 22
7t

JW L ~
0-0
00
0- LCD 0_
z0 0
0 Wz0 I
r- 0
zc0 w
mw 0
XC 0201
wN
0 0c 000
0
aJ W
-8w
0
_00I000
0n0000
0
00
0
0
-0 N

In accordance with letter from DAEN-RDC, DAEN-ASI dated22 July 1977, Subject: Facsimile Catalog Cards forLaboratory Technical Publications, a facsimile catalogcard in Library of Congress MARC format is reproducedbelow.
George, John FSpillway for Cooper Dam, Sulphur River, Texas; hydraulic
model investigation / by John F. George. Vicksburg, Miss.U. S. Waterways Experiment Station ; Springfield, Va. :available from National Technical Information Service, 1980.
21, [191 p., [121 leaves of plates : ill. ; 27 cm.(Technical report - U. S. Army Engineer Waterways ExperimentStation ; HL-80-15)
Prepared for U. S. Army Engineer District, Fort Worth,Fort Worth, Texas.
1. Cooper Dam. 2. Flow characteristics. 3. Hydraulic models.4. Spillways. 5. Sulphur River. I. United States. Army.Corps of Engineers. Fort Worth District. II. Series: UnitedStates. Waterways Experiment Station, Vicksburg, Miss.Technical report ; HL-80-15.TA7.W34 no.HL-80-15


![))9ree9ED))E99)99)]9 EEEEEEEEEEE 9999E99]99]9 … · 2019. 7. 2. · D EEEEEEEEEEE 9999E99]99]9 E)))E9EEEEE)E))E)E)EE) Eeee9e)E)EEeee9eEEee9ee9 re)9eErerr99.. ..... f. ffffffffffffffffff.fffffffff.ffffff.fffffff..ffffffffff.fffffffffff](https://img.pdfslide.net/doc/110x75/600bc9328cb2c9652c1673b5/9ree9ede99999-eeeeeeeeeee-9999e99999-2019-7-2-d-eeeeeeeeeee-9999e99999.jpg)


![[ SSSSSSSSSSSSSSSSSSSS SSS Sfsi.uniza.sk/kkm/fireff/dokumenty/coneva_39.pdf · [ SSSSSSSSSSSSSSSSSSSS SSS S SSGSSSSSSSG ] eeeeeeeee eeeeeeeeee eeeeeeeeee eeeeeeeeeee eeeee ee eeeeee](https://img.pdfslide.net/doc/110x75/601277c6a304672fa7028c99/-ssssssssssssssssssss-sss-sfsiunizaskkkmfireffdokumentyconeva39pdf-.jpg)


![))9Aee9E9))E99)9])99]9 EEEEEEEEEEE 9999E99]99]9 E ......A EEEEEEEEEEE 9999E99]99]9 E)))E9EEEEE)E))E)E)EE) Eeee9e)E)EEeee9eEEee9ee9 re)9eEAerr99 ss](https://img.pdfslide.net/doc/110x75/61039dc3199f2b1d5216d7ac/9aee9e9e999999-eeeeeeeeeee-9999e99999-e-a-eeeeeeeeeee-9999e99999.jpg)