Embed Size (px)
Citation preview
I* Energy, Mines and Energie, Mines et Resources Canada Ressources Canada
GEOLOGICAL SURVEY PAPER 74-63
COMPUTER-BASED SYSTEMS FOR GEOLOGICAL FIELD DATA
An international state-of-the-art review for 1973 conducted by COGEOOATA, International Union of Geological Sciences, in collaboration with the Division of Earth and Environmental Sciences, UNESCO and the Canadian Centre for Geoscience Data.
W. W. HUTCHISON Chairman, COGEODATA
1975
@ Crown Copyrights reserved
Available by mail from Information Canada, Ottawa, KlA OS9 and at the following Information Canada bookshops:
HALIFAX
1683 Barrington Street
MONTREAL
640 St. Catherine Street West
OTTAWA
171 Slater Street
TORONTO
221 Yonge Street
WINNIPEG
393 Portage Avenue
VANCOUVER
800 Granville Street
or through your bookseller
Price : Canada : $4.00 Other Countries : $4.80 Catalogue No. M 44-74-63
Price subject to change without notice
Information Canada Ottawa, 1975
CONTENTS
Page
Foreword, by C. F. BURK, Jr. , Secretary, COGEODATA
Introduction to geological field data systems and generalized geological data management systems, by W. W. HUTCHISON, Chairman, COGEODATA ,, ,..... .,... .,.
Part 1: Geological Field Data Systems
Introduction, by W. D . McRITCHIE , Canada ...... .........................
GEOMAP, by H . BERNER, T. EKSTROM, R. LILLJEQUIST, 0. STEPHANSSON , and A. WIKSTROM , Sweden .......................
Use of geological field data systems in Finland: experiences and problems, by FREDRICK PIPPING, Finland .,. 19
Selected geological field data systems in Canada: a brief description of their capabilities and objectives, by W. D . McRITCHIE, Canada ,.... ..,..... ,. 21
Computer-based field data files in the Regional and Economic Geology Division, Geological Survey of Canada, by T. M . GORDON, Canada .,. .,.,
Sub-Area Retrieval System (SARS) used on the Coast Mountains Project of the Geological Survey of Canada, by W. W HUTCHISON and J .A. RODDICK, Canada ..,,.... .,.. .,,.,.
.....
........
29
32
Application of DASCH system ‘to geological field data and documentation files of the Geological Survey, Federal Republic of Germany, by R. VINKEN, Federal Republic of Germany
Aarhus University System II, by S . W. PLATOU, Denmark .,..
Part 2: Generalized Geological Data Management Systems
48
Introduction, by G D . WILLIAMS, Canada ..,,.. ..,,... ..,,.. .,,.... .,,
Le systeme SIGMI de I’Ecole Nationale Superieure des Mines de Paris, par M. KREMER, M. LENCI, et M.-T. LESAGE, -
39
43
47
France
1
7
8
SIGMI system of the National School of Mines of Paris, by M. KREMER, M. LENCI, and M.-T. LESAGE, France .,,.
G-EXEC: a generalized FORTRAN system for data handling, by KEITH G. JEFFERY and ELIZABETH M. GILL, United Kingdom
U. W . 0 SAFRAS system, by P G SUTTERLIN , Canada ..,..,..
Etat actuel du systeme d’information mis en oeuvre pour la geochimie au Centre de Recherches Petrographiques et Geochimiques (CRPG), par Ph. GRANDCLAUDE , France
Computer processing of cartographic data, by L. W. THORPE, United Kingdom
Particular requirements for the Dutch WIA Earth Science Information System, by T. de HEER and S. W. BIE, Netherlands
Land-use planning aided by computer cellular modelling/mapping system to combine remote sensing, natural resources, social, economic, and cadastral data, by HARRY W. SMEDES, United States of America ,...,,....,,,..,,..,.. ,.
Advantages of using a generalized system to manage geological data, by G .D. WILLIAMS, Canada ..,,... ..,
Geologic Retrieval and Storage Program (GRASP), by JOSEPH MOSES BOTBOL and ROGER W. BOWEN, United States of America
Data-base management system for environmental geological data in Czechoslovakia, by J HRUSKA, Czechoslovakia
Indexes to systems ,....,
54
59
62
68
73
78
82
84
89
94
99
FOREWORD
The Committee on Storage, Automatic Processing and Retrieval of Geological Data, known more commonly as “COGEODATA”, is a committee of the International Union of Geological Sciences. One of the purposes of COGEODATA is to appraise existing systems for storing geological and allied data. In an effort to meet this need COGEODATA convened a 5-day seminar at UNESCO headquarters, Paris, France, 5-9 November 1973, to discuss the use of computer- based techniques in geological field work and geological data-base management. With the assistance and cooperation of the International Geographical Union and UNESCO’s Division of Earth and Environmental Sciences, 41 invited participants attended, representing nearly all countries with significant achievement in this field. Included also were observers representing other organizations having an interest in the topic, including CODATA (International Council of Scientific Unions), the International Association for Mathematical Geology, and UNISIST (World Science Information System). This publication summarizes results of the seminar.
Each of the 18 contributions is a short summary of developments, concepts and plans reported at the seminar. For additional details readers are refered to the bibliographies following each paper and they are encouraged to correspond with the authors, whose complete mailing addresses are provided. Illustrations have been reproduced as received, in order to help expedite publication. COGEODATA acknowledges with thanks the additional contribution received from J.M. Botbol and R.W. Bowen, United States Geological Survey, who were not able to present their paper at the seminar.
In keeping with the spirit of this report, readers may be interested to know that authors’ typescripts were entered into a computer-based text-editing system for processing at the Canadian Centre for Geoscience Data, and subsequently set in type by a computer-driven photocomposition system (Alphatext Systems Limited, Ottawa). This is the second paper published by the Geological Survey of Canada to be so processed (the first being COGEODATA’s bibliography for 1970-72, GSC Paper 73-14) and I trust this experience augers well for the future application of modern information technology to geoscience.
Canadian Centre for Geoscience Data Ottawa, Canada
C.F. Burk, Jr. Secretary, COGEODATA
Introduction to geological field data systems and generalized geological data management systems
W. W. Hutchison, Chairman of COGEODATA Geological Survey of Canada 601 Booth Street Ottawa, Ontario KlA OE8 CANADA
During much of its existence, COGEODATA has devoted considerable energy to the standardiza- tion of geological data and the formalization of procedures for handling geological data. The series of papers which follow is, in a way, a departure from this trend but aims at one of the objectives of COGEODATA, namely: “an appraisal of existing systems for storing geological and allied data “. The reason for following this theme is as follows: regardless of how well we standardize, we must also establish how facile we will be in handling the data and at the same time discover empirically which appear to be ‘natural’ standards. Geological field data systems were chosen for the following reasons: the amount of activity in the area during the past 5 years, the lack of any effective communication among those researchers, and the fact that field data are fundamental to all geological information.
The meeting in Paris was originally planned following my appointment as Chairman of the Field Data Working Group of COGEODATA in 1972. The intention was for a small meeting of a working group to discuss the activities in this particular field. After some discussion, it was decided to bring together as many workers as possible in this field, because of the diversity of geological field mapping, and furthermore the diversity of systems that have been developed to cope with collection of field information. Moreover, if geological data are to have any meaning, then they must be related to the field setting and, accordingly, systems developed for the collection of geological field data fundamentally affect how we use the data derived during this initial exercise. Also, UNESCO kindly arranged for experts in spatial data systems of the International Geographical Union to participate in this meeting; their contribution and advice were most valuable.
The objectives of the meeting, held at Unesco headquarters, Paris, 5-9 November I973 were:
1. To determine the effectiveness of computer-based systems developed for geological field data,
2. To determine which types of geological terrain are most amenable to mapping, using computer-based techniques,
3.
4.
To analyze scientific procedures and their adaptation to computer-based systems,
To establish the nature of constraints versus the degree of freedom in current computer technology,
5. To inform users and potential users of the state of the art, and
6. To provide a forum for communication among a group of workers.
It was decided to add the topic of generalized geological data management systems to this program because of the major hiatus that has existed between computer scientists and geologists. In an effort to reduce this hiatus, it was decided that some experts in data management systems in geology should participate so that they could perhaps better appreciate some of the needs of geologists. Conversely, the field geologists should perhaps understand better the concepts and techniques of current data management systems. It should be stressed at this point that there is no implication that a generalized data management system cannot be used in geological field mapping. Nevertheless, very few field systems that have been developed utilize generalized systems.
Aim of this Publication
The aim of this publication is not to provide a detailed account of the meeting. Instead, it is a collection of ‘vignettes’ highlighting some aspects discussed at the Paris meeting. The reason for this is simple. A booklet with short, to-the-point comments is more likely to be read. Furthermore, most of the systems, models, and concepts discussed in Paris have already been published and references to these publications are contained in the bibliographies. Accordingly, the main aim of this publication is to communicate swiftly to users and to potential users, techniques and concepts currently in use, and in this way to act as a directory so that the user or potential user may contact that particular research worker directly. The state-of-the-art is evolving too quickly for us to pause and drain or divert substantial energy to a major comprehensive publication.
Historical Development
The First Wave. When COGEODATA first came into being, geological data were considered in terms of digits (in numerical or alphanumerical form). For geological data to be stored, retrieved and communicated, they had to be coded. Accordingly, initial efforts naturally stressed standardi- zation and normalization of procedures to handle geological data. To begin with, this showed great promise so that groups in industry (especially those in oil exploration and in mining production) very quickly adapted certain techniques for practical use. Large data management systems were quickly developed in some companies and to a lesser extent, in some government agencies, but a number of these grew and then, like the end of the dinosaurs, stagnated or collapsed. An analysis of why this happened could be exceedingly beneficial to the users and potential users currently appearing on the market. Some factors include: Lack of clear objectives in establishing a computer-based system; artificial constraints imposed by the system; and high costs and poor planning of documentation, editing and updating. Those systems that survived this first wave commonly indicate they were designed for specific purposes with a very clear idea of the problems and objectives.
The New Wave. During the last few years a number of practical operating systems for recording geological field data have appeared. Coupled with this, there is the fact that computer technology no longer requires us to be so constrained. We are no longer required to code our data and information so that it may be ‘squeezed’ through a narrow pipe. Instead the ‘diameter’ of the medium has vastly increased to the point in fact that any ‘normal’ field notes can now be economically typed into the computer (either directly or via tape or punch-card). These two points
2
are very important because they stress the fact that practicality has arrived in data capture and furthermore, as time goes on, the degree of freedom with which to analyze our data or information is quickly increasing.
Activity during the first wave was exceedingly beneficial. It fostered the growth of groups which set out initially to ‘mimic’ (using computer-based systems) the techniques which have been used by scientists in geological mapping over the last 50 years. At this point, I arrive at what I think is perhaps the most crucial juncture in this whole matter of geological data, computers and the science of geology itself, namely: the hierarchy of the data. In the past, comment has been made about the failure of the field geologist to record data systematically. Analysis of this comment brings one to realize that geological field data are often regarded as point sets of data as though they have been recorded digitally by some blind machine. The geologist does notstop at one point A, look down at his feet and record all significant data within a radius of three metres of his feet, then close his eyes and walk blindly onwards for a hundred metres or one kilometre and then stop, look down, open his eyes at point B and record all data within a radius of three metres. Instead he is more concerned in the first instance in establishing the relationship between data set A and data set B, and recognizing (using his own inboard computer) whether or not there is a difference, and if so, what its nature might be. Each hour and each day in the field is spent working essentially interactively with the rock patterns to build up a picture of the field setting. A highly skilled field geologist is perhaps one of the most discriminating and sensitive pure scientists. I would contend, therefore (Hutchison, 1973) that there has been a general failure to recognize that geological contacts are prime data located on geological field maps (they can easily be represented as a “stream” of x-y-z coordinates in the computer), whose nature results from observation of the relationship betweendata set A and data set B. On this basis, ‘spot’ data within units are therefore of a lower rank than the data for contacts between units. Systems which have been most successful are those used in terrain where contacts between units are not exposed or appear to be gradational.
The importance of capturing geological contacts is that they can then be utilized for production of maps (this has been done for a number of years at the Royal College of Art, Bickmore and Kelk, 1972 and Thorpe, this paper), for cartographic analysis and as a basis for a data management system.
Outcome of the Paris Meeting
Emerging from the Paris meeting was the appearance of three groups: one using the ‘medium’, where appropriate, as a means toward an end, the other in examining the ‘medium’ itself for handling geological data, and the third interested in both areas. As a consequence, all participants were not focused on the same research targets. Nevertheless, this divergence had a tempering influence, whereby geologists with diverse objectives could be informed of techniques currently being appraised, while researchers in data management systems could better appreciate geolo- gists’ needs.
Major contributions to advances in use of computer technology span the spectrum from the requirments of the scientists (see contribution by de Heer and Bie and also Gordon), to the production of final colour maps such as discussed by Thorpe. Within this spectrum we have contributions on some of the more successful field data systems, for example: GEOMAP - Berner, Ekstrom, Lilljequist, Stephansson, and Wikstrom; Canadian Systems - McRitchie; Finnish systems - Pipping; DASCH - Vinken; and SARS - Hutchison and Roddick. Generalized systems for laboratory and field data include Aarhus University System II - Platou, and the CRPG System - Grandclaude. The chief attributes of all these systems is the ability to systematically (implying some ‘standards’) record, store and retrieve large volumes of geological information so that selection may be analyzed by application programmes including plotting. Problems identified are the limited range of applicability of field systems (most are designed for
3
specific terrain ~ usually metamorphic or plutonic terrain in which well defined stratigraphy is not readily identifiable), the hiatus between geologist and computer, the need to formulate a workable and consistent methodology, and, where a high degree of success is encountered (such as GEOMAP), acquiring money and manpower to establish that system for a ‘beginner’.
Generalized data management systems include SAFRAS by Sutterlin, SIGMI by Kremer, Lenci and Lesage and G-EXEC by Jeffery and Gill. There are many more data management systems designed for or adapted to use in geology. However, the three above are interesting for a variety of reasons. For example, SAFRAS was the first portable DMS using free format allowing for repeating record types. It has a particularly powerful retrieval capability but the COBOL programs may hamper portability because of machine dependence.
SIGMI is a more sophisticated extension of the SAFRAS concept, allowing for a higher degree of ‘nesting’ in the hierarchy. In contrast with SAFRAS and SIGMI, G-EXEC is a generalized FORTRAN system which has been built as a series of modules. It is probably as portable as any generalized system may hope to be with respect to fundamental differences between computers. In terms of a small, comprehensive system, it has many attractive features, not the least of which is the varied yet heavy workload it has carried to date.
Again I would like to stress that there are many other geological data management systems as well as some spatial data systems which could easily be adapted for geological use. This publication is not intended to provide a list of such various systems. A potential user in selecting a system should, however, consider planned use of data, the constraints of the make (or makes) of computer a scientist may use, the operating system on that computer, financial budget, systems and programming staff available, and number of scientists to be supported. Also to be considered is the question of whether scientists will use computers largely as ‘accounting’ machines for routine computation and plots (batch mode), or whether they would wish to have the freedom to work on an instantly accessible basis to do ‘research’ on their data (interactive mode). I am convinced that on-line, interactive capabilities are (and will become) essential for certain research endeavours - yet again such a requirement puts a further constraint on the data management system which might be used.
Conclusions
In a general discussion there was a diversity of opinion concerning greatest needs for future effort. These reflect the diverse problems currently being encountered by the broad spectrum of participants.
There was general agreement to a proposal to have COGEODATA seek funds to sponsor an evaluation of operational field data systems. This matter will be followed up.
At the ‘systems’ level, there was interest in a codicil for data structure, for establishing a range of ‘system’ components, for increased collaboration on system development, evaluation of systems for data management and establishing standards for transfer of data.
At the ‘data collection’ level, there is a clear need to further reduce the gap between field geologist and computer, for greater systematization in both ‘standards’ and procedures in collection, and to reduce the constraints of current systems.
At the level of those not familiar with computer techniques in geology, there is a clear need for some education, and for participation of COGEODATA in activities of CODATA (ICSU) and IGCP (International Geological Correlation Programme).
4
Research on all these topics will be done, some perhaps under the aegis of COGEODATA. Each area, in its own right, demands research, but limited budgets and manpower dictate that priorities be set.
The Future
Readers will probably have been waiting for some sort of analysis of field data systems in terms of components, costs, applicability and effectiveness. Some data on these items are contained in the appendices. In spite of the tremendous progress made by the pioneers in field data systems, we still have a long way to go towards making such systems more widely applicable. At present, I would have little hesitation about strongly recommending use of a computer-based system in a long term mapping project in a metamorphic/granitic terrain where stratigraphy is largely lacking or obscured (by over-burden), and where many geologists will be employed.
For smaller, shorter term projects, and where stratigraphy is well defined, current techniques may be of limited assistance? requiring too much effort in implementation relative to compiling energy available. I regard a computer-based system as simply a medium, and it is for the field geologist to decide whether such a medium suits his work style better or has an advantage over pencil and paper. This assumes that the geologist’s notes are simply a temporary project file. If, however, it is decided that notes will be archived, this could be an added reason for a computer system. At present, I would be concerned that there could be energy loss through handicapping the geologist in the field, followed by additional effort required for effective curation of the field notes.
Field data files may quickly grow and with large files we tend to slip into one of the major pitfalls, namely: the amount of energy required for file management, editing and updating a large file tends to consume so much time that more time is spent managing the data than attaining the ultimate objective. Another pitfall is that a standard may have been prematurely established and imposes a stultifying effect.
Especially in field geology we must approach the matter of standards with care. Obviously each field data system is in a sense a closed system, and one would hope that standards used internally are consistent. Most standards (aside from those dealing with location) have nothing to do with computers. They are instead geological problems requiring resolution by geological experts in their particular field using data hierarchy and classification. A benefit from field data systems is that we can test proposed standards and present others which have naturally appeared or ‘evolved ‘.
At this point, I return to one of the comments I made earlier, that an excellent field geologist is “one of the most discriminating and sensitive pure scientists ” in this age of technology. The challenge, as I see it, is for the computer scientist to quietly follow such a field geologist and determine how computer techniques could facilitate the information collection. I feel that this is an area where much will be achieved in the near future. Such examples are new techniques for capturing data on tape at costs lower than normal typing through use of off-line terminals.
Digitization not only of point data but also of contacts, allows us to put the main elements of a map into the computer and thus potentially available for cartographic analysis. Of particular importance here, is that statistical and other analyses are not ‘one way’ synthesis but can be fed back, as part of an iteration, to allow evaluation of domain boundaries. In this way data may be given geological significance and as domain boundaries are changed, then so must the geological context of all contained data. Many geologists do this every day and it is essential that any computer system for field geology must have the same capability.
An example of what may become commonplace in the future is the contribution of Smedes, USGS, which demonstrates how a modelling-mapping system combining remote sensing, natural
5
resource, social, decision-making.
economic and cadastral data has been applied to planning and
I have no doubt in my own mind that computer techniques will give us a degree of freedom that we never had before. Through this we will be able to make a contribution to the science of geology and its application. However, I do not see this as an easy process that will develop quickly, and neither will it be comprehensive. Instead I anticipate that setbacks, frustration and higher than anticipated costs will be commonly encountered in development. For this reason, I would like to pay particular tribute to the participants of the Paris meeting. Through their efforts and determination, substantial hard-earned progress has been made, not only in accomplishment, but in discoveries of pitfalls. These pioneers have a wealth of experience. Thanks to the support of IUGS (through COGEODATA), and of UNESCO, the participants were brought together in one place to minimize duplication of effort required for future progress. This meeting was essential and valuable and I would suggest that the reader seeking further information should contact directly any contributor, or write to the COGEODATA Secretary, Dr. C. F. Burk, Jr.
Acknowledgments
I would like to acknowledge the vital assistance of Dr. C. F. Burk, Jr., our Secretary, and National Coordinator of the Canadian Centre for Geoscience Data, in planning the Paris meeting, and in editing and typesetting (appropriately, with the aid of a computer-based text editing and photocomposition system) the contents of this publication. Furthermore, I thank the Geological Survey of Canada for publishing the contributions in this paper.
Particular thanks must be given to Dr. K. Lange and his Secretary, Mme. Espinasse, who made arrangements to hold our meeting at UNESCO.
At the meeting, Drs. 0. Stephansson, M. Kremer, W. D. McRitchie, and G. D. Williams bore a substantial responsibility as Chairmen in fostering and guiding the many valuable discussions.
I wish to thank UNESCO and the International Geographical Union (IGU) for the participa- tion of A. R. Boyle, Saskatoon, Canada; H. W D. F. Marble, Buffalo, U.S.A.; W. R. Tobler, Ann Arbor, U.S.A.; and R. F. Tomlinson, Ottawa, Canada.
Above all, I thank the participants, because it is these pioneers whose efforts, sacrifices and determination have contributed so much to the progress that has been made to date.
Reference
Hutchison, W. W. 1973 GSC computerizing system for map production, analysis:
Northern Miner, v. 59, no. 37, p. 95.
PART 1: GEOLOGICAL FIELD DATA SYSTEMS
Introduction
W. D. McRitchie Department of Mines, Resources and
Environmental Management Geological Survey Section 993 Century Street Winnipeg, Manitoba R3H OW4 CANADA
For several years now many geologists have recognized the need for guidelines formulating a workable and consistent methodology for establishing data files that can be processed with a high degree of reliability. Many might claim that such guidelines are inherent in the efficient applications of existing geologically oriented field data gathering procedures. In practice, however, it is often found that standards vary or are not defined, inconsistencies exist both within and between files, and more often or not the data required have not been collected or recorded.
The following papers outline some of the initial attempts that have been made by geologists from many different countries to upgrade the consistency and reliability of geological data-gathering procedures in the hope that the data files so generated might be processed with an equal degree of meaningfulness and reliability.
One of the greatest limitations that most geologists are forced to work under is a lack of time. Time to collect the information they need, and time to work with the raw data, correcting, sifting, and analyzing it, searching for meaningful covariances which will lead them to resolve the problems they are confronted with. If the content of their data files is consistent, then the greatly enhanced capability for testing multiple working hypotheses and gaining a feel for the data through machine processing can lead to a more rigorous and profitable conceptual analysis of the perceptually derived data.
GEOMAP
H. Berner, T. Ekstrtim, R. Lilljequist, 0. Stephansson and A. Wikstrijm Uppsala Universitet Geologiska Institutionen Box 555 S-751 22 Uppsala 1 SWEDEN
Introduction
Increasing recognition of the ability of data processing systems to handle large amounts of current and potential geological data suggests the extension of data processing methods into geological mapping. For this reason the field data storage and retrieval system GEOMAP was developed in 1969-70. The system has been used for four field seasons in Scandinavia and was slightly modified in 1972. A meaningful use of computers calls for systematic recording of consistent observations. To fulfill this condition GEOMAP utilizes a standard field data sheet which serves as a checklist. Information not covered by the data sheet may be recorded as processable notes. The combination of a standard sheet with processable notes gives GEOMAP a high degree of flexibility.
The data base is linked to a data management system which contains a set of retrieval programs and routines for standard statistical methods.
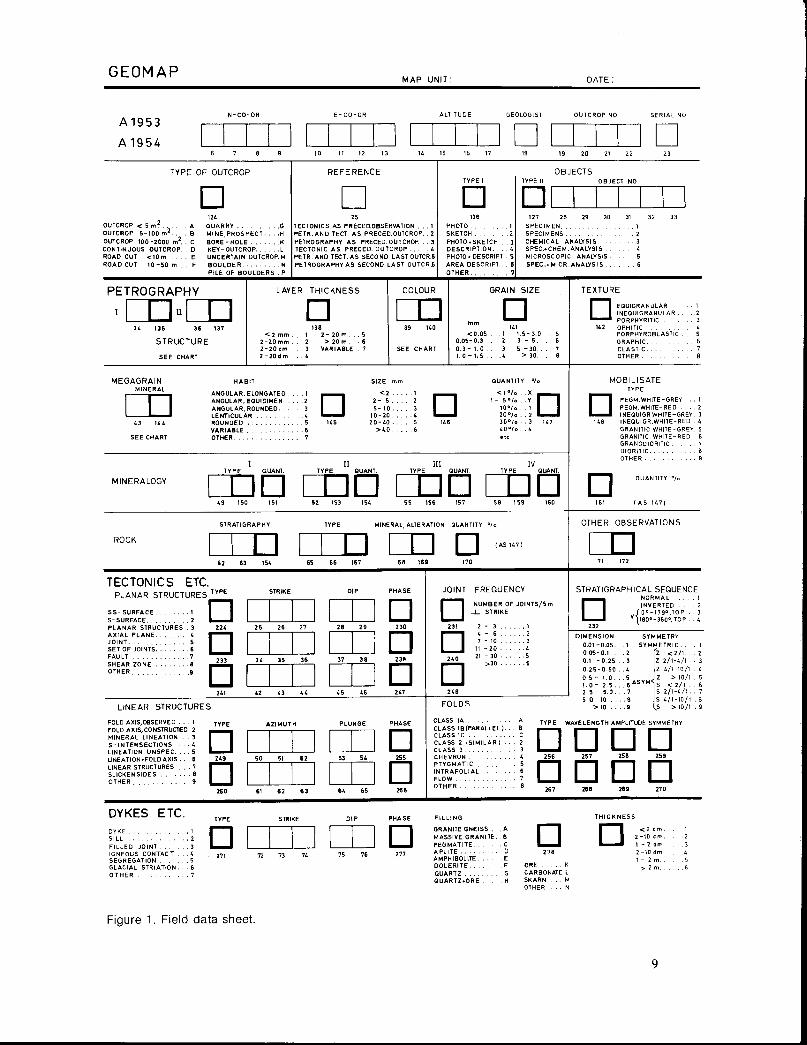
Field Data Sheet
Observations and measurements made on an outcrop are subdivided with reference to different rock types. Information about a rock type can be given on more than one sheet (Figure 1). The description includes:
1. Coding on the input document
2. Referenced notes on the back of the input document
3. Common notes on the back of the input document.
Only a few remarks about the field data sheet are made here; a special guide for the user is available upon request.
The sheet is divided into segments, for example, location and references, petrology, tectonics. Any orthogonal coordinate grid may be used for indicating the geographical location. If more detailed
8
GEOMAP MAP UNIT: DATE :
Al953 N-CO-OR E-Ccl-Of? ALT,T”OE GEOLOG,S, O”TCROi= NO SERIAL NO
Al954 LIIIIIlmutIlcluInn 6 7 8 9 ,o ,T 12 13 ,4 IS ,6 ,7 18 IS 20 *, *2 23
TYPE OF OUTCROP REFERENCE OBJECTS
PETROGRAPHV
4IKn 3L 13s 3s 137
STRUCTURE
COLOUR
m 3s NO
MEGAGRAIN N&BIT
P”ASE
lIzI 230 cl xl9 cl
LINEAR STRUCTURES
JOINT FREQUENCY
cl
NWBER OF JolNTs/s!n 1 STR,KE
2‘8
FOLDS
TEXTURE
OTHER OBSERVATIONS
STRATIGRAPHICAL SEQUENCE NOl?MAL ,
Figure 1. Field data sheet.
MAP UNIT KATRINEHOLM SW
N-CO-OR 704410 E-CO-OR 130430
TYPE ROAD CUT IO-SO M -------------------------------------
ROCK A
STRUCTURE 1 2
GRAIN SIZE
LAYER THICKNESS
ROCK TYPE
MOBILISATE
S-SURFACE
SS-SURFACE
FOLD AXES
FOLD TYPE 1
WAVE LENGTH
FILLED JOINT
PHOTO+SKETCH
NOTE(S):
OBJECT
SYMMETRY
ROCK TYPE
COMMON NOTE
QUANTITY BO %
UNIFORM BEDDING SCHISTOSITY
0.05-0.3 MM
2-2D MM
CARBONACEOUS SHALE
<I% PEGM WHITE GRAY
N 15 En 70 W
N 15 En 70 W
s 20 w, 10
CLASS 1 C
0.05-0.1 M
CARBONATE
---.
YEAR 1973 OUTCROP NO 6
GEOLOGIST 0 STEPHANSSON
------------------------------------------
TEXTURE EQUIGRANULAR
COLOUR MEDIUM DARK GRAY (74)
STRATIGRAPHY SIL
PHASE 1
PHASE 1
SYMMETRY SYMMETRIC
AMPLITUDE 0.05-0.1 M
N 5 En 90 E THICKNESS .c 2 CM
126,3 SEE COMMON NOTE
259,l SEE SKETCH+PHOTO
167, FOLDING IN CARBONATE RICH PARTS
PHOTO OF FDLDS IN CARBONATE RICH PARTS, FILM 1-3
---------------------------------------------------------------------------------- ROCK B QUANTITY 20 %
STRUCTURE 1 SCHISTOSITY 2 UNIFORM BEDDING
GRAIN SIZE ~0.05 MM TEXTURE EQUIGRANULAR
LAYER THICKNESS COLOUR MEDIUM DARK GRAY (74)
MINERAL 1 80% CARBONATE
ROCK TYPE MARBLE C58A) STRATIGRAPHY BER
S-SURFACE N 70 We 20 E PHASE 3
PHOTO+SKETCH
NOTE(S):
OBJECT 126,s PHOTO OF OUTCROP WITH OFFERDAL CHURCH IN BACKGROUND
TYPE PLANARSTRUCT 224,2 STRONGLY CRUSHED IN WESTERN PART OF OUTCROP
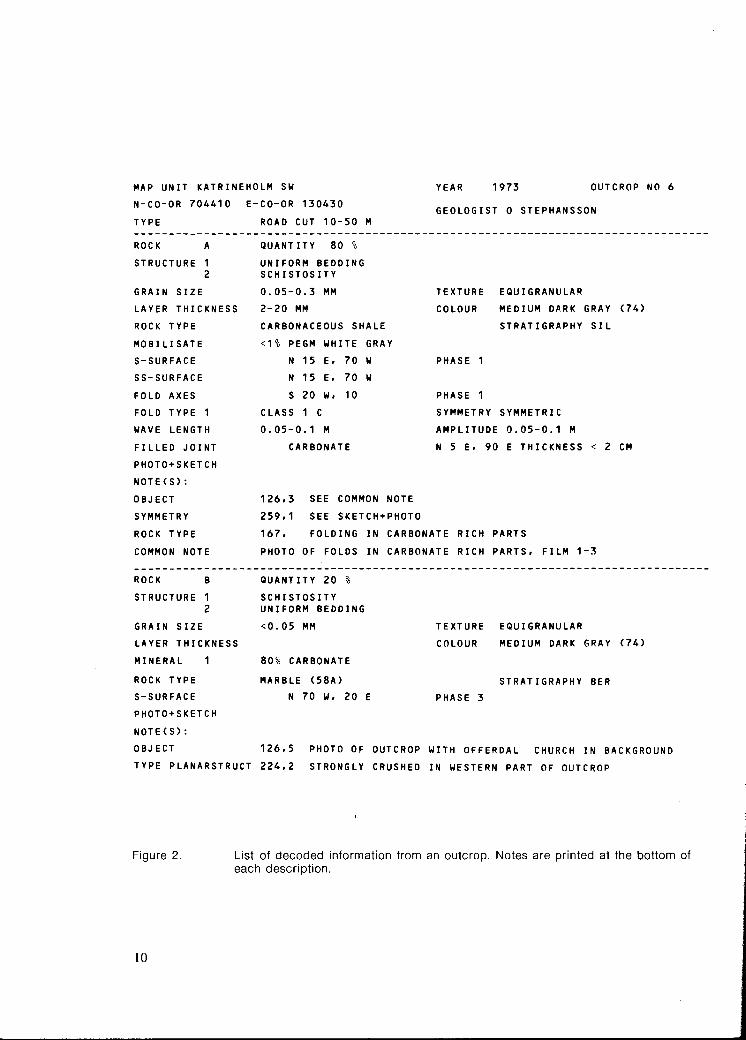
Figure 2. List of decoded information from an outcrop. Notes are printed at the bottom of each description.
10
mapping is desired, serial numbers can be used for switching the registration of coordinates into a tenth or a hundredth of the ordinary mapping scale.
The petrographical and tectonic data are coded numerically or alphanumerically. Some codes are preprinted on the sheet, but codes for structures, colours, minerals, rock types and folds are given on separate charts which the geologist carries together with the sheets in the field. The contents of the charts as well as the libraries of codes and decoded information within the data program can easily be updated and replaced. This allows the use of different schemes of rocks, structures, minerals, etc., which also makes GEOMAP more adaptable to different types of geological milieu.
The colours of the rocks are defined by means of a standard rock colour chart designed for field use.
In the ‘Mineralogy’ segment four major or minor minerals may be recorded on each field sheet. The relative abundances of the minerals are given in the ‘Quantity boxes’. For the description of ‘Rock type’ the entry ‘Stratigraphy’ is used for registering any litho-, chrono-, or biostratigraphic division or local name of the rock. The codes chosen by the geologist are processed by the computer just like any other parameter given on the sheet.
Up to now geologists in Scandinavia have used two different rock schemes. One is a genetic classification of Precambrian rocks used by the Mapping Department of the Swedish Geological Survey; the other is used by the Norwegian Survey and contains a classification of igneous rocks by Streckeisen.
In the tectonic segment of the data sheet linear and planar elements as well as dykes can be recorded for each rock type. Folds are coded according to the geometric classification of Ramsay.
The back of the sheet is used for notes and sketches. There are two types of notes in the GEOMAP system. Referenced notes are made to complete special information on the data sheet. These notes can be retrieved selectively with respect to any referenced observation from the data base. The general notes are only printed out together with all information about the rock types in the comprehensive outcrop list. These notes are used for more general descriptions and may have a considerable length.
Updating, Analysis and Retrieval of Data
The geological information is transferred to punch cards, checked for errors and sorted with respect to map unit, coordinates and serial number. A logical record in the data base will contain the information on one rock type from a locality.
All selections of information from the data base are handled by a program package called INTEREST. This system is characterized by an advanced retrieval facility in combination with a great number of statistical routines. The arguments for selections may consist of observation references, fixed arguments and conditions.
The retrieval programs of INTEREST have been completed with a number of routines for listing and plotting of geological information. Any information of the field sheet can be plotted with reference to the coordinates.
11
OBJECTS KATRINEHOLM SU
N CO-OR E-CO-OR ALT.CO-OR OUTCR.NO G SPECIMEN
4620 145 5200 5 5233 50
6260 9660 63ao 94ao 6420 94ao 6420 9420 6500 9430 330 6500 9500
6ooa 9470 6oao 9420 6250 9110 6475 a770 a040 a045 7690 a210 a006 6570 6150 a7ao 6140 a720 6130 a710
6130 a670 47a
6520 aa
9600 310 709 9705 9670 9640 5770 6a40 7400 6970 7750
69SO 7940 6950 79ao 7695 a215
7070 a725 7065 9150 6aao 9030 7690 9000 79ao a905 9500 7200 7796 7aoo
a36
157 159 161 ,A 161,B 162 167 l6a 'I69 170 171,A 171,B 177 iao qa7 ?a9 192 793.A 194 196 79a 199,A 199.B 200 200-B 200,c 204.A 204eB 2oa 209 210 211 212
213 214 215,A 215,B 216 217 252 263 266 2a4.B 307
S s S S X S S S S S S S S S S S S S S S S S S S s S S S S S s S
S S S S S S S S S S S
X
X
ANALYSIS PHOTO CHEM MICR
X X
X
X
X
SKETCH DESC. IMPORT. OTHER OUTCR.
X X X X X X X X X X X
X X X
X X X
X X
X
X
X
X X
X
X
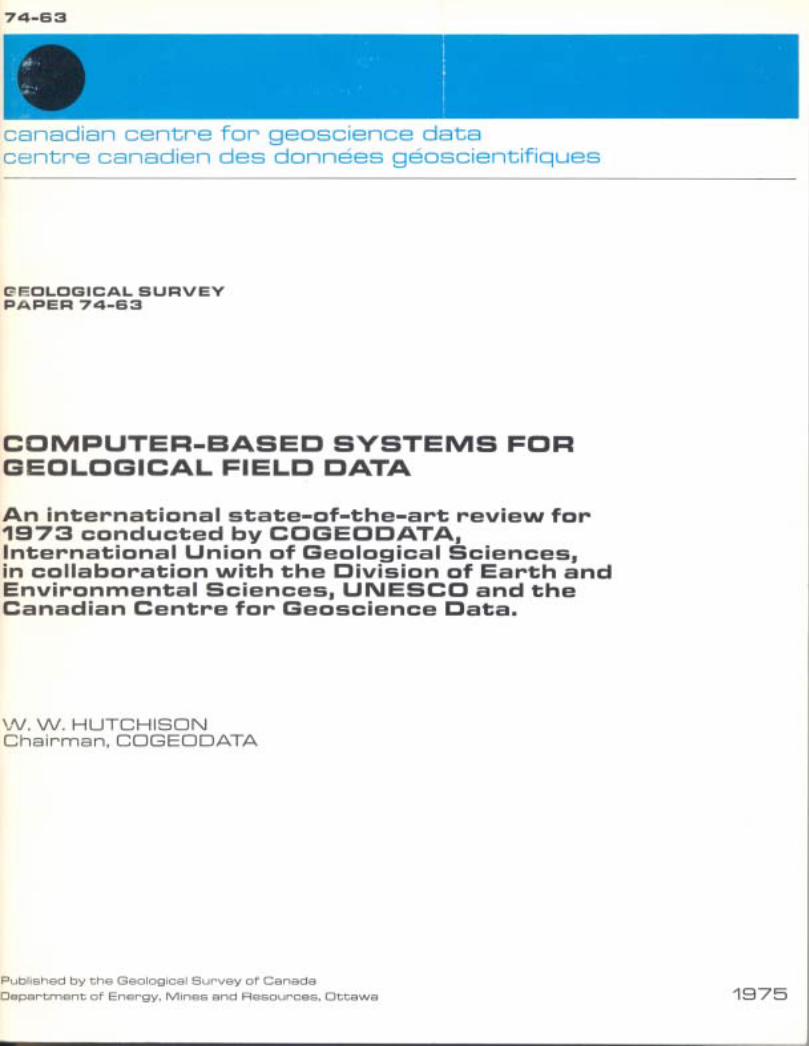
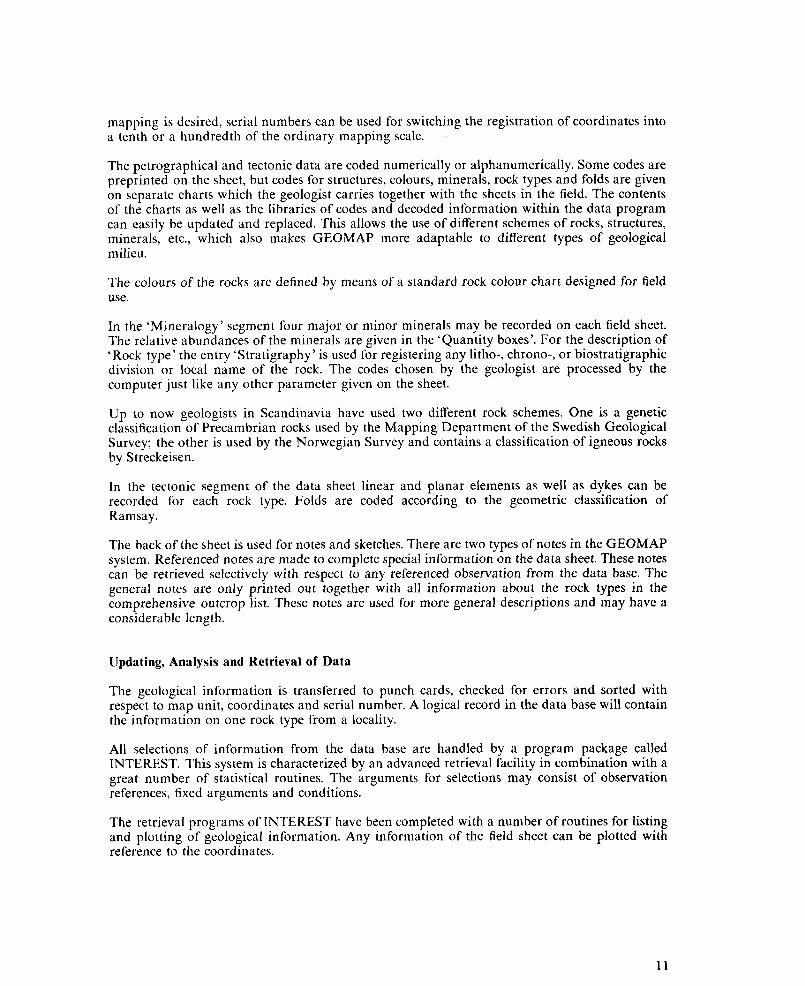
Figure 3. A standard cross list of objects.
12
Case Study
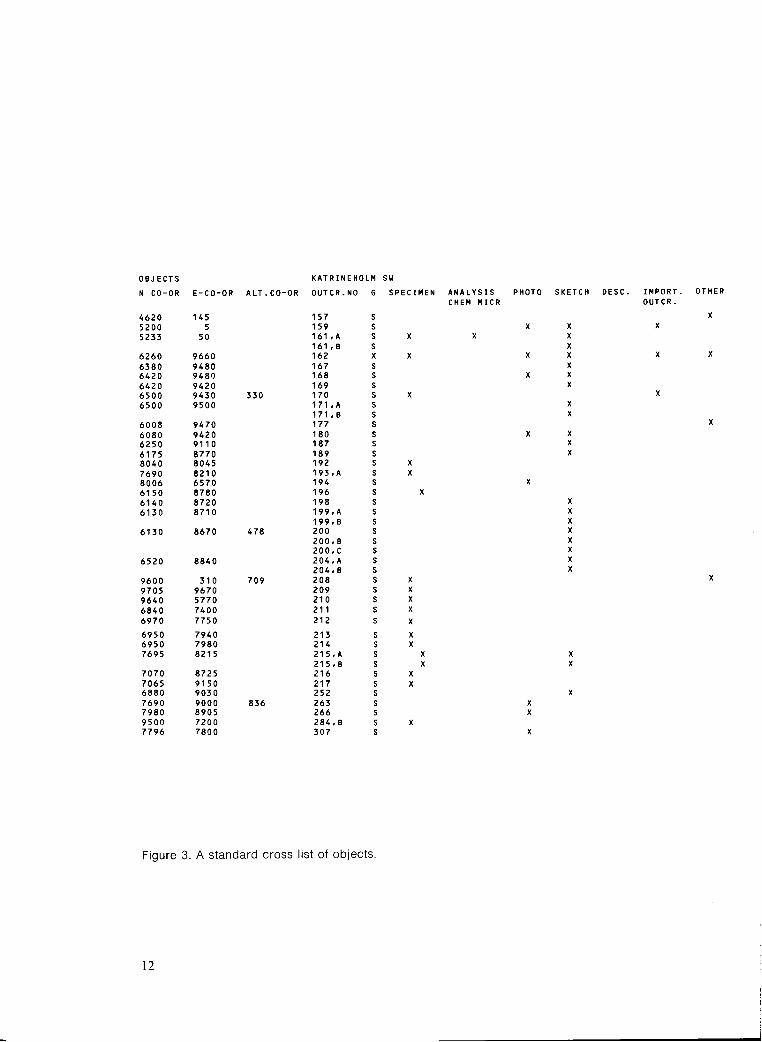
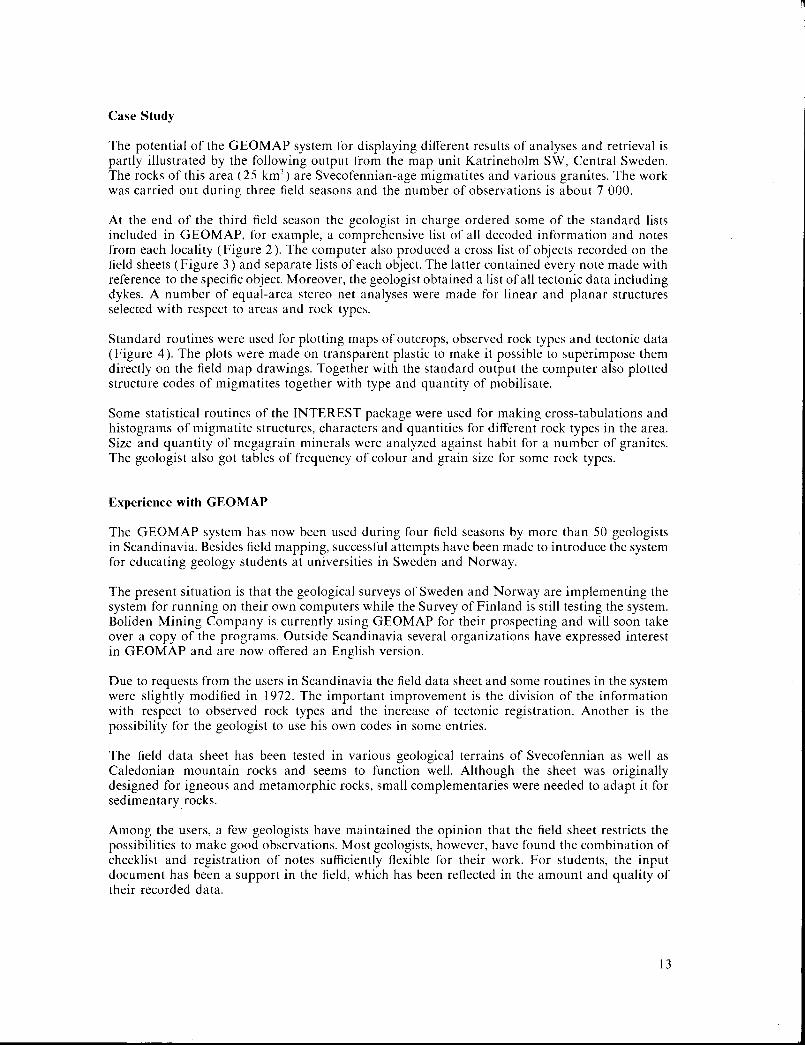
The potential of the GEOMAP system for displaying different results of analyses and retrieval is partly illustrated by the following output from the map unit Katrineholm SW, Central Sweden. The rocks of this area (25 km2) are Svecofennian-age migmatites and various granites. The work was carried out during three field seasons and the number of observations is about 7 000.
At the end of the third field season the geologist in charge ordered some of the standard lists included in GEOMAP, for example, a comprehensive list of all decoded information and notes from each locality (Figure 2). The computer also produced a cross list of objects recorded on the field sheets (Figure 3 ) and separate lists of each object. The latter contained every note made with reference to the specific object. Moreover, the geologist obtained a list of all tectonic data including dykes. A number of equal-area stereo net analyses were made for linear and planar structures selected with respect to areas and rock types.
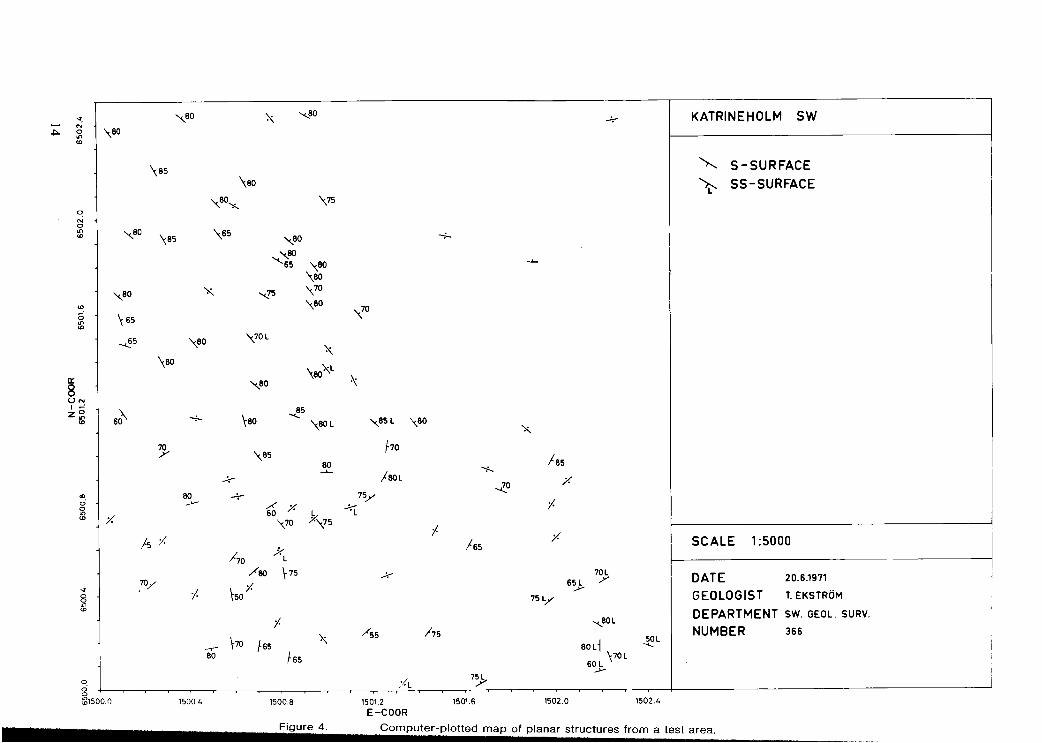
Standard routines were used for plotting maps of outcrops, observed rock types and tectonic data (Figure 4). The plots were made on transparent plastic to make it possible to superimpose them directly on the field map drawings. Together with the standard output the computer also plotted structure codes of migmatites together with type and quantity of mobilisate.
Some statistical routines of the INTEREST package were used for making cross-tabulations and histograms of migmatite structures, characters and quantities for different rock types in the area. Size and quantity of megagrain minerals were analyzed against habit for a number of granites. The geologist also got tables of frequency of colour and grain size for some rock types.
Experience with GEOMAP
The GEOMAP system has now been used during four field seasons by more than 50 geologists in Scandinavia. Besides field mapping, successful attempts have been made to introduce the system for educating geology students at universities in Sweden and Norway.
The present situation is that the geological surveys of Sweden and Norway are implementing the system for running on their own computers while the Survey of Finland is still testing the system. Boliden Mining Company is currently using GEOMAP for their prospecting and will soon take over a copy of the programs. Outside Scandinavia several organizations have expressed interest in GEOMAP and are now offered an English version.
Due to requests from the users in Scandinavia the field data sheet and some routines in the system were slightly modified in 1972. The important improvement is the division of the information with respect to observed rock types and the increase of tectonic registration. Another is the possibility for the geologist to use his own codes in some entries.
The field data sheet has been tested in various geological terrains of Svecofennian as well as Caledonian mountain rocks and seems to function well. Although the sheet was originally designed for igneous and metamorphic rocks, small complementaries were needed to adapt it for sedimentary rocks.
Among the users, a few geologists have maintained the opinion that the field sheet restricts the possibilities to make good observations. Most geologists, however, have found the combination of checklist and registration of notes sufficiently flexible for their work. For students, the input document has been a support in the field, which has been reflected in the amount and quality of their recorded data.
13
\ 60
% /65
/75
%
'OL 65& y
75L/
\6OL
6OLj
60L \701
5OL
15004 1500.6 1501.2 1501.6 1502.0 1502.4
E-COOR
KATRINEHOLM SW
y S-SURFACE ‘Q, SS-SURFACE
SCALE 1:SOOO
DATE 20.6.1971
GEOLOGIST T. EKSTRtjM
DEPARTMENT SW. GEOL. SURV.
NUMBER 366
Careful training is needed before geologists are able to make full use of the GEOMAP system. The amount of experience is obviously reflected in the number of errors and finally in the costs of processing of the collected material. Calculated on a collection of 500 outcrops, the cost of punching, storing and retrieval of a standard package of lists, plots and stereo net diagrams is about U.S. $0.75 per outcrop. Although the system is very user-oriented and easy to handle, the geologist usually prefers to order his jobs from a computer programmer. We are now working toward a closer collaboration between the geologist and the computer, using a time-sharing or interactive data system. This will reduce the costs and also train the geologist to use all the benefits of the computer system.
GEOMAP has a sister system called COREMAP. It is a data system for recording and processing information from drill cores and boreholes. The system may also be used in tunnels, adits, etc. The standard sheets include general, geological, chemical, joint and borehole deviation data but these may be extended to any other type of information. In COREMAP it is also possible to computerize notes.
GEOMAP Documentation: Publications
Berner, H. , Ekstrom, T. , Lilljequist, R. , Stephansson, 0. , and Wikstrom, A. 197 1 Data storage and processing in geological mapping. I: Field data
sheet II: Data file. Geol. Fore. Stockholm Forh. , 93, p. 855101 and p. 693-705.
Berner, H. , Ekstrom, T. , Lilljequist, R. , Stephansson, 0. , Wikstrom, A. 1972 GEOMAP - A data system for geological mapping: Proc. 24th Inter.
Geol. Congress, Section 16, p. 3-11, 6 figs.
Stephansson, 0. , Ekstrom, T. , Berner , H . 197 1 Computer techniques for geological mapping: Hornicka Program Ve
Vede a Technice, Tjeckosloakia .
Stephansson, 0. , Ekstrom, T. , Berner, H. , Lundin, S .E. 1972 ADB-system for geodata: IVA Bergmekanikkommitten .
Diskussionsmote, Feb.
System Reports
Berner, H. , Ekstrom, T. , Lilljequist, R. , Stephansson, 0. , Wikstrom, A. GEOMAP: the user’s guide to field data sheet.
University Data Centre: Geodata Group GEOMAP Manual.
Ekstrom, T.K. , Wirstam, A. , and Larsson L.-E. COREMAP - A data system for drill cores and bore-holes (in press).
15
Appendix
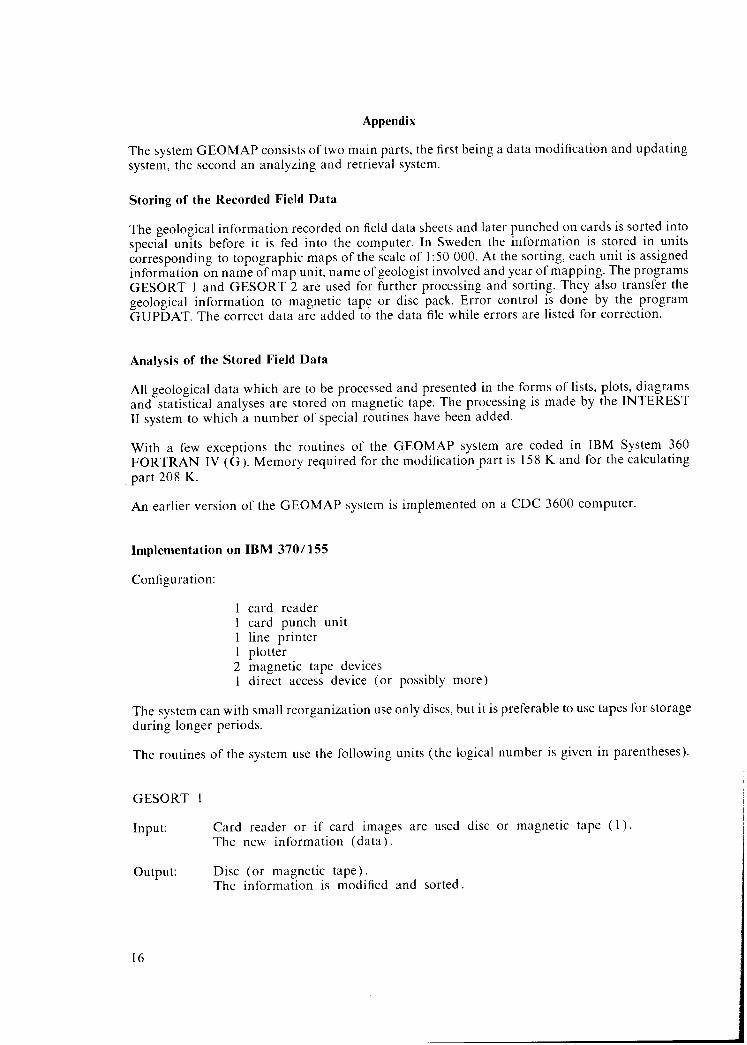
The system GEOMAP consists of two main parts, the first being a data modification and updating system, the second an analyzing and retrieval system.
Storing of the Recorded Field Data
The geological information recorded on field data sheets and later punched on cards is sorted into special units before it is fed into the computer. In Sweden the information is stored in units corresponding to topographic maps of the scale of 1:5O 000. At the sorting, each unit is assigned information on name of map unit, name of geologist involved and year of mapping. The programs GESORT 1 and GESORT 2 are used for further processing and sorting. They also transfer the geological information to magnetic tape or disc pack. Error control is done by the program GUPDAT. The correct data are added to the data file while errors are listed for correction.
Analysis of the Stored Field Data
All geological data which are to be processed and presented in the forms of lists, plots, diagrams and statistical analyses are stored on magnetic tape. The processing is made by the INTEREST II system to which a number of special routines have been added.
With a few exceptions the routines of the GEOMAP system are coded in IBM System 360 FORTRAN IV (G). Memory required for the modification part is 158 K and for the calculating part 208 K.
An earlier version of the GEOMAP system is implemented on a CDC 3600 computer.
Implementation on IBM 3701155
Configuration:
1 card reader 1 card punch unit 1 line printer 1 plotter 2 magnetic tape devices I direct access device (or possibly more)
The system can with small reorganization use only discs, but it is preferable to use tapes for storage during longer periods.
The routines of the system use the following units (the logical number is given in parentheses).
GESORT 1
Input: Card reader or if card images are used disc or magnetic tape ( 1) The new information (data).
output: Disc (or magnetic tape). The information is modified and sorted.
16
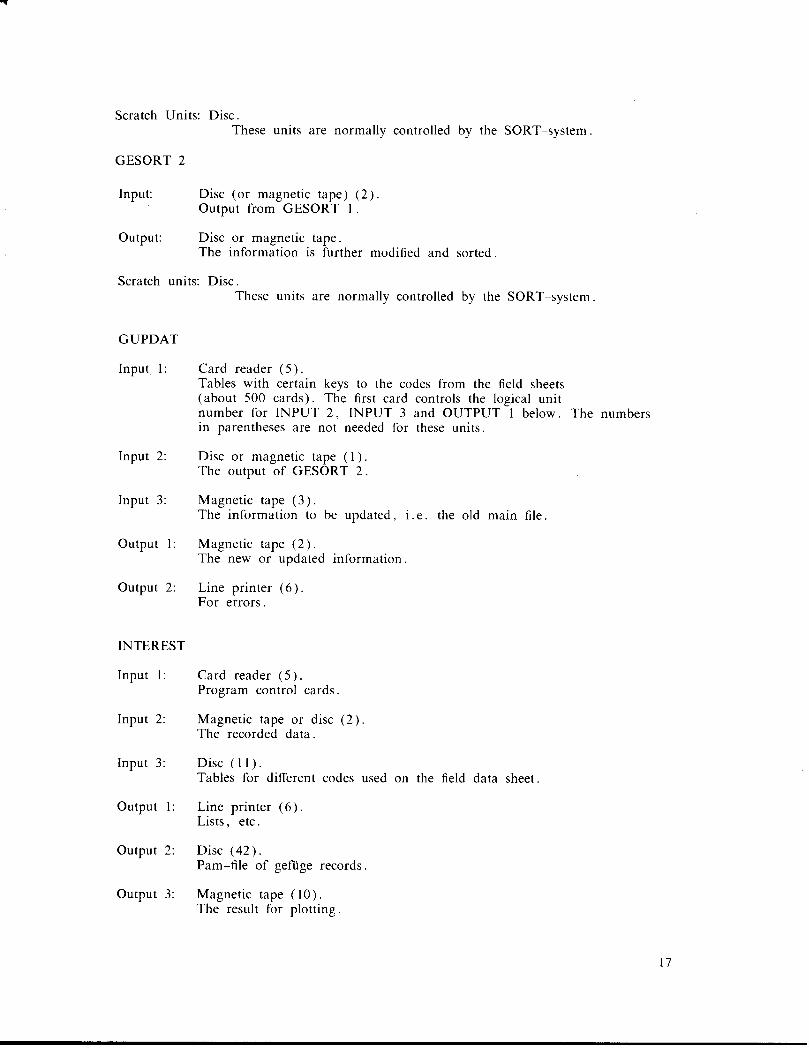
Scratch Units: Disc. These units are normally controlled by the SORT-system.
GESORT 2
Input: Disc (or magnetic tape) (2). Output from GESORT I
output: Disc or magnetic tape. The information is further modified and sorted.
Scratch units: Disc. These units are normally controlled by the SORT-system.
GUPDAT
Input 1:
Input 2:
Input 3:
output 1:
output 2:
INTEREST
Input 1:
Input 2:
Input 3:
output 1:
output 2:
output 3:
Card reader (5). Tables with certain keys to the codes from the field sheets (about 500 cards). The first card controls the logical unit number for INPUT 2, INPUT 3 and OUTPUT 1 below. The numbers in parentheses are not needed for these units.
Disc or magnetic tape ( 1) . The output of GESORT 2.
Magnetic tape (3). The information to be updated, i.e. the old main file.
Magnetic tape (2). The new or updated information.
Line printer (6). For errors.
Card reader (5). Program control cards.
Magnetic tape or disc (2). The recorded data.
Disc ( 11). Tables for different codes used on the field data sheet.
Line printer (6). Lists, etc.
Disc (42). Pam-file of geftige records.
Magnetic tape ( 10). The result for plotting.
17
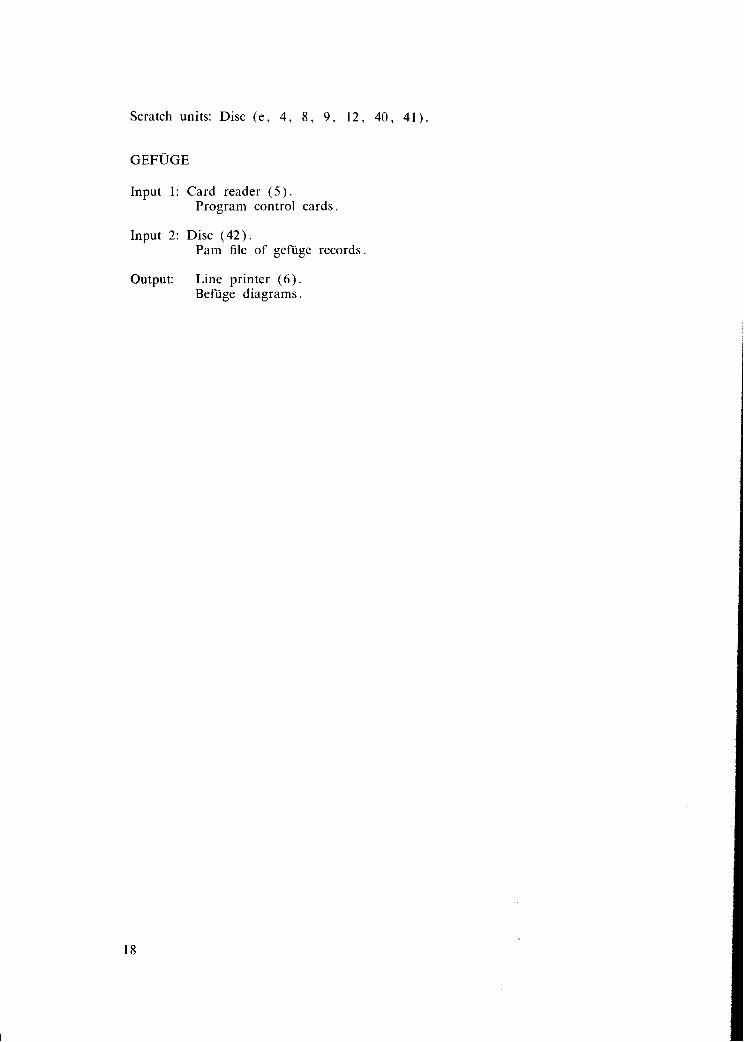
Scratch units: Disc (e, 4, 8, 9, 12, 40, 4 1) .
GEFUGE
Input 1: Card reader (5). Program control cards.
Input 2: Disc (42). Pam file of geftige records.
output: Line printer (6). Beftige diagrams.
18
Use of geological field data systems in Finland: experiences and problems
Fredrick Pipping Geological Survey of Finland SF 02150 Otaniemi FINLAND
Field Data Systems
Since 1968 the Finnish state-owned mining company Outokumpu Oy (base metals/sulphide ores) has been developing and designing an input, retrieval and processing system, GEOKU, for exploration mapping. It is now used by all the field parties of the company. An input document with a fair amount of data to be recorded is used. It is especially flexible with regard to the recording of tectonic and structural data. The system uses authorized lists of mnemonic codes that were established earlier for minerals and rocks and also for structural and textural terms. The storage program includes an automatic search for errors in the material, and rejecting storage before corrections have been made. The field data file is designed to save storage space, and as a result the data to be processed have to be retrieved through a special output file. The output is largely centred on the graphic presentation of the data. Structural data are displayed as maps and diagrams, petrographic and exploration data as symbol maps. The system is described in more detail in a recent publication by Gaal and Suokonautio (1973).
Another field data system, GEOULU, has been developed at the University of Oulu as a result of cooperation between the Geology and ADP departments. This project was financed by a special government grant for a survey of layered mafic intrusions in northern Finland. The GEOULU system is also largely conventional with a special input document, coding, etc. It seems likely that GEOULU and GEOKU will be combined at some future date. An agreement on cooperation and exchange of software has already been signed.
At the Geological Survey of Finland the department for bedrock mapping has participated in the Swedish GEOMAP system. Since 197 I GEOMAP has been tested in the field, and the Geological Survey has also shared some of the expenses for its development. However, a few practical difficulties have arisen, the most problematical of which are machine dependence and differences in hardware. GEOMAP was developed on Control pata and IBM machines, but the Geological Survey of Finland has a Hewlett-Packard unit. The data have to be processed in Sweden, which is highly impractical when experimenting on a large scale with a field data system! The situation will probably be improved by employing a programmer and a systems analyst in the mapping department, thus aiming at the full coordination of the computer processing of geoscience data at the Geological Survey.
A committee appointed by the Research Council of the Mining and Metallurgical Society of Finland to review the use of ADP in geological mapping in Finland should also be mentioned. In thecommittee report (dated February 1973) some technical recommendations on the input and
19
storage of geological field data were made. However, the idea of a national system was rejected for the time being.
This is, in short, the present state of geological field data systems in Finland.
Present and Future Problems
A few remarks on the experiences and problems of using geological field data systems may be appropriate. These remarks are made from the point of view of a field geologist working in Precambrian terrain where less than 4 per cent of the bedrock is exposed.
It seems that the solution of how data are recorded on the outcrop is crucial for any geological field data system. Present techniques demand that the field geologist translate his concepts and terminology into codes or other forms of “computer language”. It must be pointed out that the use of coding at this stage manifestly interferes with the very process of the geologist making and noting his observations. Geological language and vocabulary are stringent and purposeful, and generally international. A system that attempts to break down the entirety of accumulated scientific experience and definitions that constitute the geological vocabulary cannot work.
In geological field work, each region presents its special problems.and demands an “individual” approach. This is true not only for the general physical conditions but especially so for the geological millieu. The problems and concepts of research in the Precambrian, Paleozoic, Mesozoic and Quaternary are similar but far from identical.
All geological field work, in whatever context it is performed, has a certain purpose. This purpose leaves its first clear marks, whether intended or not, on the recording of data. Geological field work is always project-oriented in one way or other, and geologists tend to be specialized, for example, in petrology, stratigraphy, structural geology, paleontology, etc. This necessarily leaves its mark on the field work. It should, moreover, be borne in mind that as both the purpose itself and the methods of achieving this purpose may change considera- bly in the course of the field work, flexibility of the system is imperative.
Points like these have to be considered when trying to design a geologic field data system that will work. A geologist’s way of thinking in terms of interpolation and extrapolation with his data does not always agree with the logic of the computer, but one could hardly accuse the results of geological field work of being illogical. It should be remembered that a geological map is read in three physical dimensions, with a time dimension added, but that the informational units contained are counted by the dozen or more. Geologists tend to reshape methods and tools they borrow from other branches of science to suit geology and the earthy habits of geologists. The flexibility and capacity ofcomputer techniques are certainly great enough to transform ADP into a useful tool for field geologists. We should soak the computer with the logic of geology, rather than computerize the geologist.
Reference
Gaal, G. , and Suokonautio, V. 1973 An automatic data processing system for explorational mapping
in Precambrian terrain: GEOKU. Geol. Surv. Finland Bull. 226, 26 p., 8 figs.
20
Selected geological field data systems in Canada: A brief description of their capabilities and objectives
.W. D. McRitchie Department of Mines, Resources and
Environmental Management Geological Survey Section 993 Century street Winnipeg, Manitoba R3H OW4 CANADA
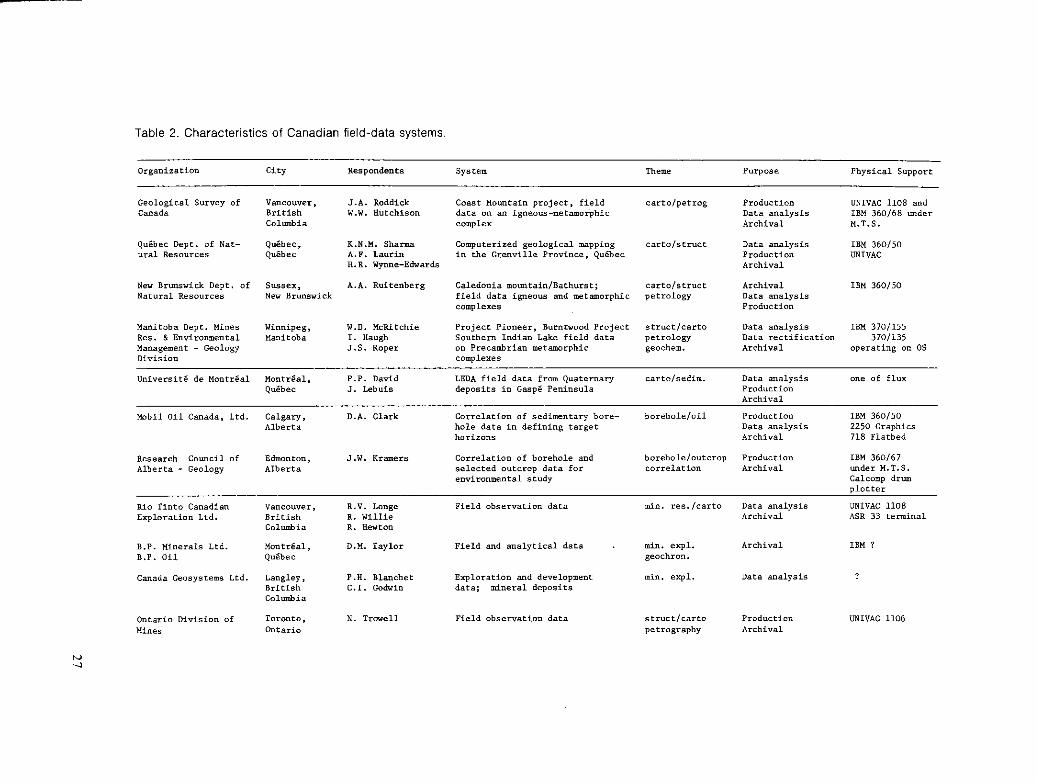
A number of systems now exist in Canada for the machine-processable collection, storage and retrieval of geological field data.
The brief description of some of the systems presented here is largely based on presentations made at meetings of the National Advisory Committee on Research in the Geological Sciences (NACRGS).appointed Working Group on Geological Field Data, and from replies received in response to a questionnaire that was distributed to the members of this working group.
The systems have been grouped for convenience of discussion on the basis of their geological objectives into those required for:
I Regional Mapping Programmes 2. Detailed Stratigraphic Studies 3. Subsurface drill/well hole correlation 4. Mineral exploration, property examination and detailed mapping,
Regional Mapping Programmes
Some idea of the scope of these projects and the nature of their limitations can he gained from Table 1.
In nearly all such programmes definitive coverage is precluded by time and budget restrictions. The geologist must work with data collected from discrete points or stations augmented by limited continuous profiles obtained along the lines of the ground traverses. The quality and intensity of the data points varies from continuous traverses spaced at l/2 km intervals to isolated stations 8 km apart.
The task is such that the geologist is confronted, in an exceptionally reduced time spell, with considerable problems of standardization, consistency and data volume saturation.
21
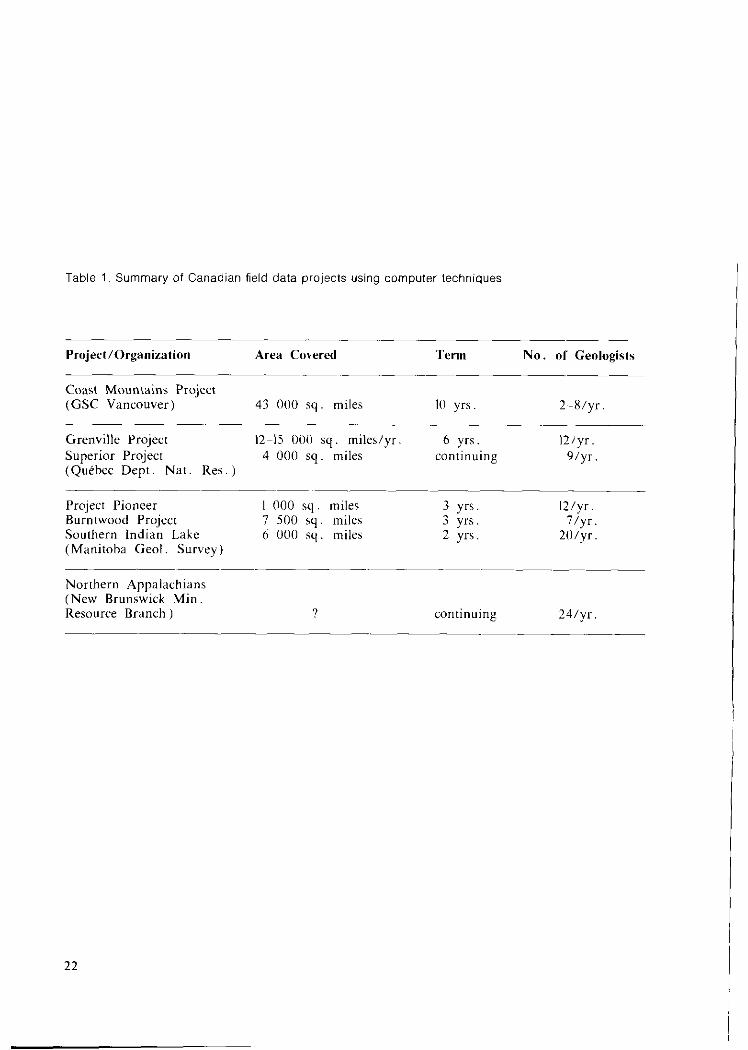
Table 1. Summary of Canadian field data projects using computer techniques
Project/Or~anization Area Covered Term No. of Geologists
Cwxt Mounuins Project (GSC varlcouver) 43 NICI q. miles IO yrs 2~-x/yr.
~~ Grenville Project 12-E 000 sq. miles/yr. 6 yrs. l2/yr. Superior Pro,ject 4 OfXl q. miles continuing 9/yr. (Qu&hec Dept. Nat. Res. )
Project Pioneer Burntwood Project Southern Indian Lake (Manitoba Geol. Survey)
I 000 x. miles 3 ya. I2 /yr 7 500 q. miles 3 yrs. 7/yt. 6 OOCI q. miles 2 yrs. 2wyr.
Northern Appalachians (New Brunswick Min. Resource Branch ]
22
GiOLOGlCAL FIELD DATA CHECKLIST
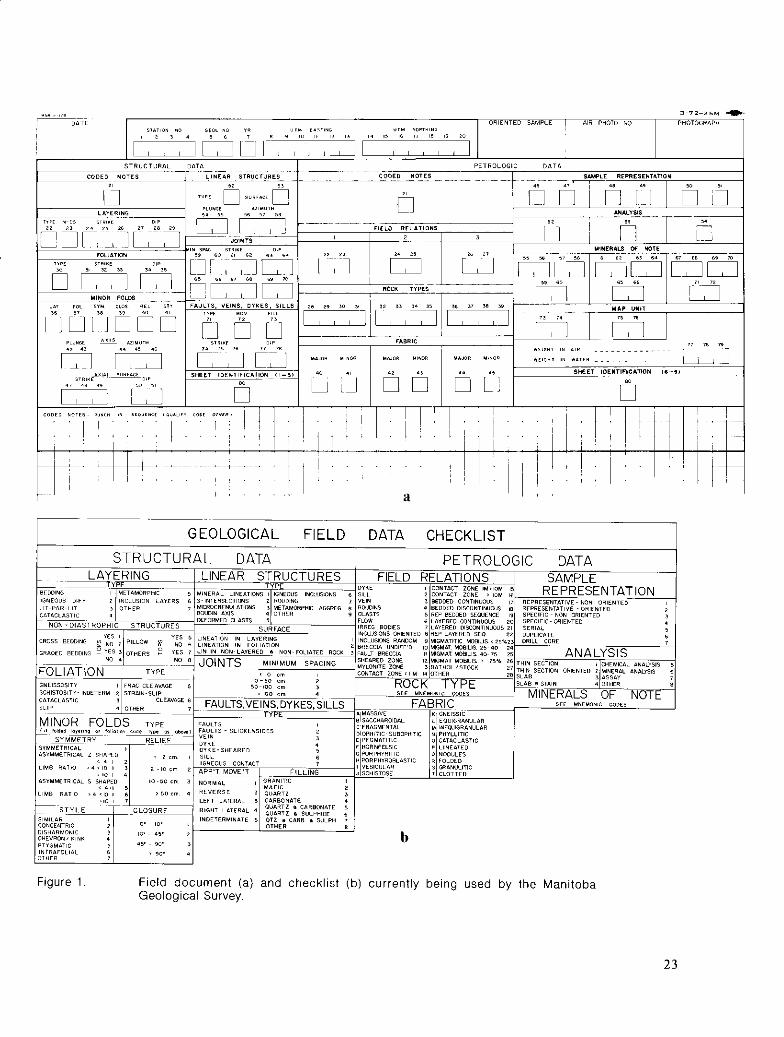
Figure 1. Field document (a) and checklisl (b) currently being used by the Manitoba Geological Survey.
23
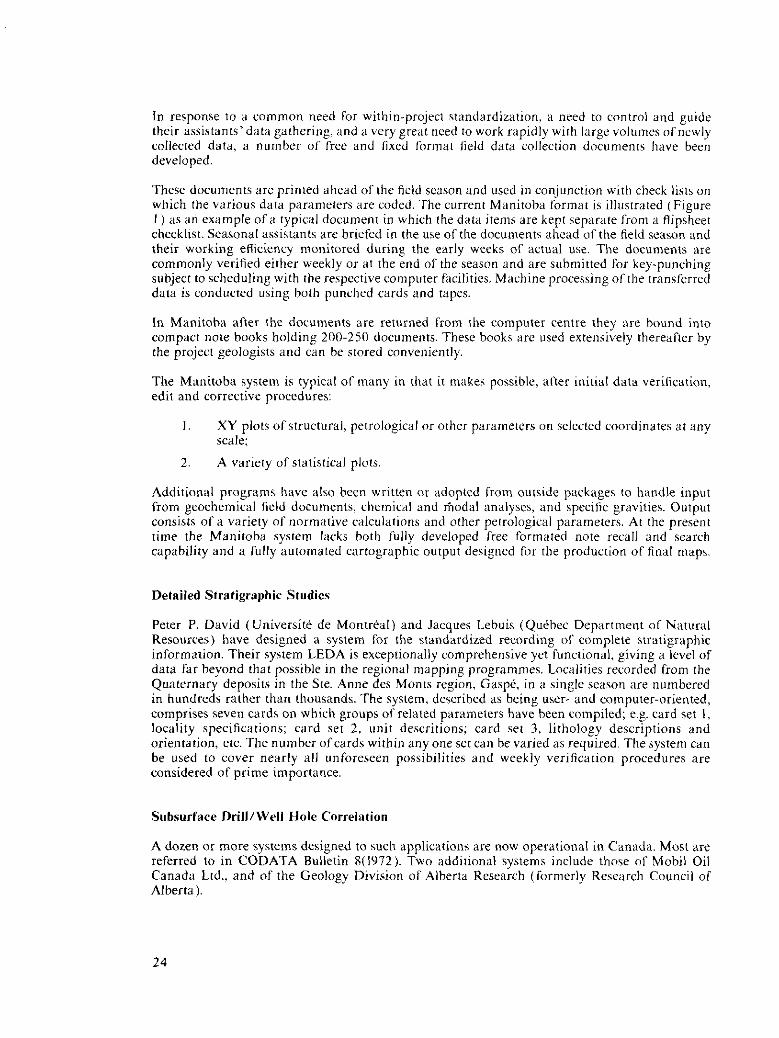
In response to a common need for wilhin-projxt standardization, a riced co control and guide their assistants’data gathering, and a very great need to work rapidly with large volumes ofnewly collected data, a number of free and fixed format field data collection douments have been developed.
These documents are primed ahead of the field season and used in conjunction with check lists on which the various data parameters are coded. The current Manitoba format is illatrated (Figure I ) as an example of a typical document in which the data items are kept separate from a flipsheet checklist. Seasonal assistants are briefed in the use of the documents ahead at” the field season and their working efficiency monitored during the early weeks of actual use, The documents ax commonly verified either weekly or at the end of the season and are submitted for key-punching subject to scheduling with the respective computer facilities. Machine processing of the transferred data is conducted using both punched cards and tapes.
In M&t&a after the documents are returned from the cornputtx ccntre they are bound into compact note books holding 200.250 documents. These books are used extensively thereafter by the project geologists and can he stored conveniently.
The Manitoba system is typical of many in that it makes possible, after initial data w&cation, edit and corrective procedures:
I. XY plots ofstructural, petrological or other pararmttxs on selected coordinates at any sale:
2. A variety of statistical plots.
Additional programs have also been written or adopted from outside packages to handlc input from geochemical field documents, chemiad and fiodat analyses, and specific gravities. Output consists of a variety of normative cakxlations and other p&ological parameters. At the present time the Manitoba system lacks both fully developed free formed note recall and search capability and a fully automated cartographic output designed for the production of final maps.
Detailed Stratigraphic Studies
Peter P. David (LJniversit6 de Montreal) and Jacques L&is (Quebec Department of Natural Resources) have designed a system for the svandardized recording of’ complete stratigraphic information. Their system LEDA is exceptionally comprehensive yet functional, giving a level of data far beyond that possible in the regional mapping programrnes. Localities recorded from the Quaternary deposits in the Ste. Anne des Moms region, Gasp& in a single season are numbered in hundreds rather than thousands. The system, described as being user- and computer-oriented, comprises seven cards on which groups of related puamete~s have heen compiled; e.g. card set t, tocahty specifications; card set 2, unit descritions; card set 3, lithotogy descriptions and orientation, etc. The number ofcards within any one set can lx varied as required. The system can be used to cover nearly all unforeseen possibilities and weekly verification procedures are considered of prime importance.
A dozen or more systems designed to such applications are now opemtioxtl in Canada. Most are referred to in CODATA Bulletin 8(l972). Two additionat systems include those of’ Mobil Oil Canada Ltd.. and of the Geology Division of Alberta Research (formerly Research Council of Alberta).
24
Mobil’s main concern lies with suhsurfxe data from oil wells, but they have also used computerized techniques for mapping surface exposures in the Arctic. Mobil’s data ate merged with data from the file of Canadian Stratigraphic Services Ltd. which is pertinent to their interests in specific horizons. The most important techniques are those of facies analysis using a Calcomp flathcd plotter for the 1~x11 output.
The Alhcrta EDMAT data file was established as part of an urban geological study of borehole and outuop data in the Edmonton area. Rapid map production is now possible from stratigraphic borehole data coded in a fixed format.
The fully functional Rio Tinto (R.T.) System was established to handle data from all possible geological environments. The extreme flexibility of the free-format system is one of its most attractive facets. Within any one lile there are a number of data RECORDS (stations), each of which contains a turnher of data SETS broken down into fixed sequences of PARAMETERS. Additional SETS can be sepcified as required and the PARAMETERS lields expanded or increased in numha, depending on the data requirements. Retrievals an he made for a turnher of statistical and graphical manipulations. At present, Rio Tinto has ahout 30 key (SET) words which can be used to describe almost any geological ohsewation. A thesaurus of allowable terms and within-project standardization procwxs ensure a maintenance of data compatahility. Geochemical data are recorded in lixed-format hut is changed to freeformat for processing hy the computer. Geologists working in areas with which they are already familiar preprint the data SET categories as checklists or guidelines to the type of information that they wish their assistants to record.
B.P. Minerals geologists in Montreal use a self-carhoning standardized data collection document based on an original devised hy the Institute of Geological Sciences in London. A turnher of variations ore this huic format have been designed for specilic activities. The systetn is designed to store and list field and analytical data and fc>r creating a tape file, plotting and contouring and analyzing.
Geolog and Geosystem have heen designed to bandIe both exploration and development projects, surface, open-pit and underground geological, geochetnical and geophysical suwcys in addition to the logging of drill core. cuttings and down-the-hole prohes. The data are integrated with the topographic and geomorphological data of the project areas. Output consists of a variety of graphical or statistical displays and manipulations.
The Gretwille System opented hy the Quebec Department of Natural Resources, originally developed at Queen’s University, is one of the tnost successful field data systems. It has successfully processed large volumes of field data taken from the complex metamorphic Gretwille province of southern Qu&bec and enabled more efficient study by research and economic geologists.
In Ontario a systetn is h&g developed by the OnLxio Division of Mines for application in the mapping of l/4 mile to I mile tnap areas and presentation of yearly reports. The system is SAFRAS-based, and includes a double-sided input document. It represents a successftd conclusion to efforts which were initially frustrated in trying to apply the early comprehensive lixed-format concepts, put forward hy regional geologists to detailed property examination.
In Manitoba the procedures primarily developed for Project Pioneer and suhseqwntly modified through several years ofdevelopm~nt have heen found to he equally cotnpatihle with the detailed mapping of individual 15.minute tnap areas and to tnore regionally directed projects.
2s
In a similar way the New Brunswick system has also met with considerable success in application to detailed mapping projects.
In gener~~l the data collection documents have been modified repeatedly over the years since their initial inception and a number of relevant trends can be identitied.
I. Standards are generally restricted to three simple conventions:
I. Station numbers are right-justified numer~s;
2. Positions are recorded using Universal Transverse Mercator (UTM) coordina- tes: zone, eating and northing;
3. The strikes of planar features are recorded as azimuths with dips to the right (including dips greater than 900).
These conventions greatly simplify the development of standard plotting programs to handle input from a variety of projects.
2. Decrease in emphasis in reliance of lied formats except in application to quantitative data, location coordinates, etc.
3.
4.
Emphasis on ease of use in field; limited or no duplication of entries
Separation of data into discrete fields for factual measurements, qualitative descrip- tions and sketches; this is based on the recognition that only specific categories of raw data reliably lend themselves to machine processing in bulk.
5. Emphasis on “in house” standardization as a means to making the data compatible within the sphere of the project rather than attempting to define universal srdndards. Documents are designed to specific projects.
By using these documents the survey geologist is now able to access and gain a feel for his data both manually and by automated means with much greater facility, but the main task of structuring his observations is Facilitated whether he has access to a computer or not. This is a most important achievement.
The arguments in favour of machine-processable files more often than not revolve around the processing, archival and recall capabilities of the systems but it is equally important to stress the grwtly enhanced qualitative and quantitative aspects of the dava gathering phase and the cue with which the improved organization of the raw data lends itself to a hitherto unparalleled opportunity for checking and validating the raw information prior to subsequent processing.
The full potential of many completed field data files is still limited, however, by inconsistencies in the more descriptive data items. Classifications evolve throughout the lield season and too often records of when “tonalite” was renamed “diorite” or when that funny pink mineral wa$ finally identified as andalusite, are not updated or even committed to writing. There is therefore a fundamental need to remind field geologists to record every instance when, as a result’of new observations, their ongoing classifications are modilied. The updating of the existing file can then be accomplished manually or by machine, but most important of ail it can be updated or merged reliably.
26
Ambach, H. I972 Description of computer progrunmes: Man. Mines Br., Unpuh
Rept
Grice, R. H. I971 Geologial data handling in urban areas: Canadian Gotech. Jour. ,
“. 8, “0. I, p. 134-13x, 2 figs.
Hugh, I.. Brisbin, W. C., and Turek, A. I967 A computer-oriented field sheet for structural data: Canadian Jour.
Earth Sciences, v. 4, no. 4, p. 657-662- 2 figs.
Lawin, A. F., Shuma, K. N. M, , Wynne-Edwards, H. R., and Franconi, A. I972 Application of data processin& techniques in the Grenville province,
Quebec: Canada: Proc. 24th Into Geol. Congress~ S&ion 16, p. 22-35, 9 tigs.
Lebuis, J. , and Davis, P. I973 Systems LEDA: Utilisation des fiches standardis&z pour enregistrer
les donn&s g&ologiques des dkp&s quaternaire: Ministerrc des Richesses Nat. du Qu&x Technical Document.
McRitchie, W. D., Turek, A., Haugh, I., and Brisbin, W. C. I970 Recording petrologic and structural data for machine processing;
Project Pioneer, Manitoba Mines Br , unpublished report.
Roddick, J. A., and Hutchison, W. W. I972 A computer-based system for geological lield data on the Coast
Mountains, British Columbia, Canada: Proc. 24th Inter. Geol. Congress, Section 16, p. 36 ~46, 5 figs.
Sharma, K. N. M., Laurin, A. F., Wynne-Edwards. H. R. 1973 Computer-hased geological field data system for the Cirenville
Project, Quebec: an operations manua ; I Ministare des Richesses Nat. du Qu&bec Publ.
WynneEdwards, H. R., Laurin, A. F. ~ Shama, K. N. M., Nandi, A., A., Kehlenhreck, M. M., and Franconi, A. 1970 Computerized geological mapping in the Grenville Province
Quebec: Canadian Jour. Earth Sci., v. 7, no. 6, p. 1357-1373, 10 ligs.
28
Computer-based field data files in tbe Regional and Economic Geology Division, Geological Survey of Canada
T. M. Gordon Geological Survey of Canada 601 Booth SV& Ottawa, Ontario KIA OE8 CANADA
The Task
Two years ago a study was initiated in Ottawa to investigate the use of computer technology in expediting the collection, storage and retrieval of geological field data for the preparation of geological maps and reports. This paper will outline the approach taken to this project in the context of the Geological Survey’s goals and constraints.
The Regional and Economic Geology Division of the Geological Survey of Canada has as one of its tasks the presentation of geological information on 1:250 000 scale tnaps. Much of the work based in Ottawa involves mapping in Precambrian terrain ~ gneisses, gwznstones, metasediments and intrusive igneous rocks. An average map sheet has an area of I I 000 km’ with field work normally taking three to six months to complete. Helicopter traversing is used extensively, resulting in observations with an average spacing of 3 km. A single geologist is responsible for compiling a map and report, although he will have two or three assistants also collecting field data. The primary users of the geological tnaps are mining and petroleum exploration companies, as well as resource potential evaluation groups in government, both of whom require syntheses and interpretations of geologic data rather than primary tield observations. This, combined with the reconnaissance nature of the work, minimizes the requirements for a comprehensive file of raw field data.
The Constraints
Geological. The wide variety of geological provinces in the Canadian Shield, each with differing lithologies and tectonic history, makes it impossible to define a standard mapping technique. Because of the limited time available for field observations, the raw data to be collected must be chosen to optimize the information that can be derived from them.
29
Psychological. Historically, Canadian field geologists have been strong individualists ~ as might be expected in a country where the geologist was often the first scientific observer in unexplored wilderness, This attribute has been sustained to the present by the “project approach” to geological mapping which requires a single scientist to be responsible for all phases of a mapping project ~ from logistic arrangements to scientific interpretation. The production of a tnap is thus a highly personal task ~ with no one more qualified to make geological decisions about the project than the scientist in charge. There is thus no practical way to arbitrarily impose standards for the recording of field data on this group of field officers.
Hardware. The Department of Energy, Mines and Resources, (EMR), of which the Geological Survey ofCanada forms a branch, operates its own Control Data Corporation Cyber 74 computer. It is departmental policy that virtually all computer work be done on this “in-house”installation. This prevents use of some important commercially available data-base management systems which are specific to other manuf&turers’ equipment.
Software. The Regional and Economic Geology Division does not have its own programming staff, but instead cornpete? with other EMR users for programming services provided by the departmental Computer Science Centre. Although the quality of programming is good, resources are scarce, hence there is often a time lag in program development, as well as a problem in setting priorities for various tasks.
The Computer Science Centre has installed and is knowledgeable with several generalized data handling systems, including MARS VI and SAFRAS.
The Approach
Over the past eighteen months, a series of pilot projects has been underway to assess the use of computer technology in expediting field mapping. From the first it was obvious that the wide variety of geological problems and mapping techniques precluded the use of any “swndardized” input document or file structure. Each project leader designed his own file and system to suit his particular needs. In this way we hoped to “mimic” what the field men were- already doing and avoid the pitfalls of grandiose super-system planning. This also gave us an extremely flexible mode of operation with virtually no geological constraints.
The price to be paid for this flexibility was additional effort by each individual in learning some fundamentals of computer programming. This required an educational programme designed specfically for field geologists. Fortunately, we have an excellent training officer in EMR.
Two sessions of an introductory FORTRAN course were given, attended by approximately 30 staff members. The course emphasized techniques for handling character-string information and input and output ~ essentials to any file-handling system. A total of five days, spread over two weeks, was required for the course. At the completion of the course, the students were capable of writing programs to edit, retrieve, and list data from their files. At the very least, they had become aware of the powers and limitations of computers and programmers.
Although there are several “generalized data-base management” systems (including SAFRAS and MARS VI) available to the GSC, it was decided that the best initial approach to field data files is to construct a card-image “fixed-format” file. Because field data are normally collected on preprinted checklists, the presence or absence of “free-format” capability is irrelevant. Highly structured card-image files have the advantage of being upward-compatible with any future developments in data handling. We have, in fact, developed methods for transferring these files to the MARS VI system and using the data validation and retrieval capabilities of MARS.
30
This approach is resulting in a convergence of file designs and sotne de facto “standardization” of file structure. vast files contain a maximum of three distinct card formats, corresponding to lithological, structural, and free-text data. A single field in all cards contains the station number, while a sepxate field identifies the format type and, if necessary, the sequence number of that particular cud. Such a lile is easily converted to fixed-length records on tape or disc using in-core read and write sub-routines.
“Standards” in the data itself are conlined to three simple conventions. Station numbers are right-justified numerics; positions ax recorded by UTM zone, awing, and northing; and the strikes of planar features are recorded as azimuths with dips to the right. These conventions greatly simplitied the development of a standard plotting program to handle input from a variety of projects.
Work is continuing to develop generalized utility programs to provide field officers with useful report and graphic output from their data files. We hope that by involving individual scientists at all stages of development we will attain a useful and practical “system” for Geological Survey of Canada mapping projects.
31
Sub-Area Retrieval System (SARS) used on the Coast Mountains Project of the Geological Survey of Canada
W. W. Hutchison and J. A. Roddick Geological Survey of Canada 100 West Pender S&et Vancouver, British Columbia V6B lR8 CANADA
In late 197 I the Geological Survey of Canada initiated a programrne of pilot projects to evaluate the usefulness of compwx-based techniques for collection, storage and manipulz&on of geologic field data and information. The following is a description of the most highly evolved of these projects.
The system used in the Coast Mountains Project had been in exiwnce since 1965, (Hutchison and Roddick, 1968). Major evolutionary stages in this system have been:
I965 Computerization of limited amount of field data
I969 Pkxting of strikes and dips on stable base to go directly to the printer
I970 Use of free text to complement data (all data and handwritten notes were keypunched at a coax of 2 per cent of field budget)
I973 - Compilation (using interactive terminal) by instantly x~rieving the complete data base for a map-unit sub area at one command and by interrogation, data reduction and synthesis of the generated sub-file.
For the lield geologist the last two stages of evolution were the most beneficial. Because these are potentially imporwnt and fundamentA and because they are commonly lacking in systems developed to date, this report illustrates these aspects as an example of one pilot project of the Geological Survey of Canada.
Coast Mountains Project
The Coast Mountains Project of the Geological Survey of Canada was set up in I962 to conduct geological reconnaissance mapping of the Coast Mountains in British Columbia from laitude 56O N to Vancouver (near 49O N). The art-a comprises about 43 000 square miles (I IO 000 sq. km.). So far data and information have been collected for 25 000 stations and 25 000 specimens. This information pertains to possibly the largest post-Precambrian plutonic complex in the world so
32
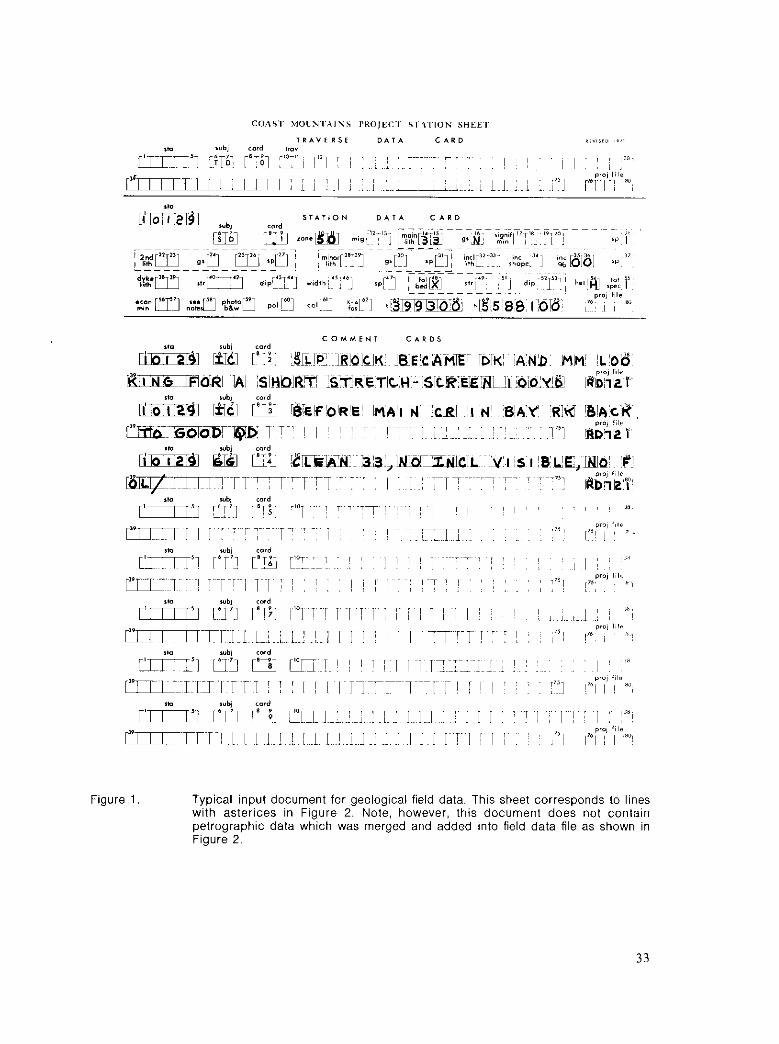
Figure I. Typical input document for geological field data. This sheet corresponds to lines with asterices in Figure 2. Note, however, this document does not contain petrographic data which was merged and added into field data file as shown in Figure 2.
33
it was decided some effort should he made to systematically synthesize the vast quantities of data and information and maintain these for further study.
Evolution of System
The development of the system is documented in Roddick and Hutch&n ( 1972)
current system
Input. The present systetn using pwprinted check sheets using standard 80 cohmm cards is still in use (see Roddick and Hutchison, 1972, for codes). An extdtnple of the cwra~t field station input document (Figure I ) is shown to illustrate the much greater allowance now made for recording free text. Station locations are measured at base camp using Romer measuring grids on a tnap printed with a Universal Transverse Mercator grid. A separate input document is used for petrographic information such as rock specimen data, specific gravity, mineral abundances and revised rock names (Roddick and Hutchison, 1972, Fig. 2).
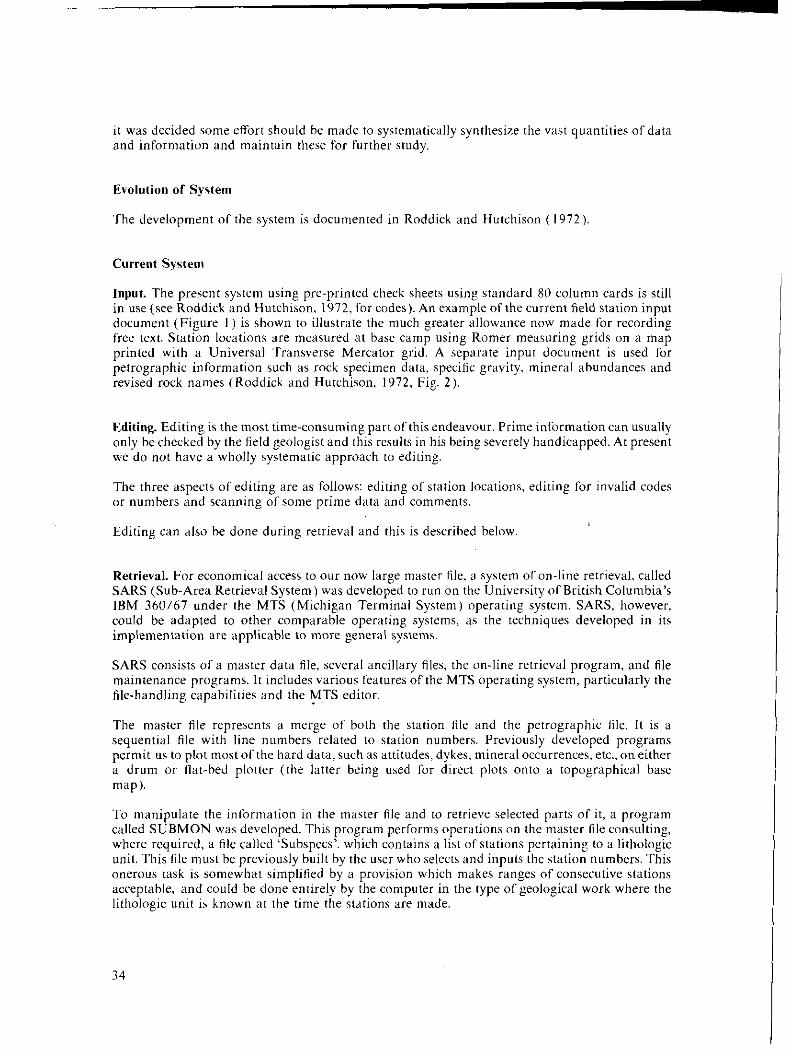
Rditittg. Editing is the tnost time-consuming part of this endeavour. Prime information can ttsually only be checked by the field geologist and this results in his being severely handicapped. At present we do not have a wholly systematic approach to editing.
The three aspects of editing are as follows: editing of station locations, editing for invalid codes or numbers and scanning of sotne prime data and cotnments.
Editing can &a he done during retrieval and this is described below.
Retrieval. For economical access to our now large toaster file, a systetn of on-line retrieval, called SARS (Sub-Area Retrieval System) was developed to run on the University of British Columbia’s IBM 360/67 under the MTS (Michigan Terminal System) operating systetn. SARS, however. could be adapted to other comparable operating systetns, as the techniques developed in its impletnen&tion are applicable to mox general systetns.
SARS consists of a tnaster data tile. several ancillary files, the on-line retrieval progratn, and file maintenance progratns. It includes various features of the MTS operating systetn, particularly the file-handling capabilities and the MTS editor. .
The master file txp~esents a tnerge of both the station lile and the petrographic file. It is a sequential file with line nunhers related to station numbers. Previously developed program permit us to plot most of the hard data, such as attitudes, dykes, mineral occurrences. etc., on either a drum or flat-bed plotter (the latter being used for direct plots onto a topographical base map).
To manipulate the information in the tnaster tile and to retrieve selected parts of it, a progran called SUBMON was developed. This progrun performs operations on the master lile consulting, where required, a fde called ‘Subspecs’. which contains a list of stations pertaining to a lithologic unit. This file must he previously built by the user who selects and inputs the station numbers. This onerous task is somewhat simplilied hy a provision which makes ranges of consecutive stations acceptable, and could be done entirely by the computer in the type of geological work where the lithologic unit is known at the time the stations are made.
34
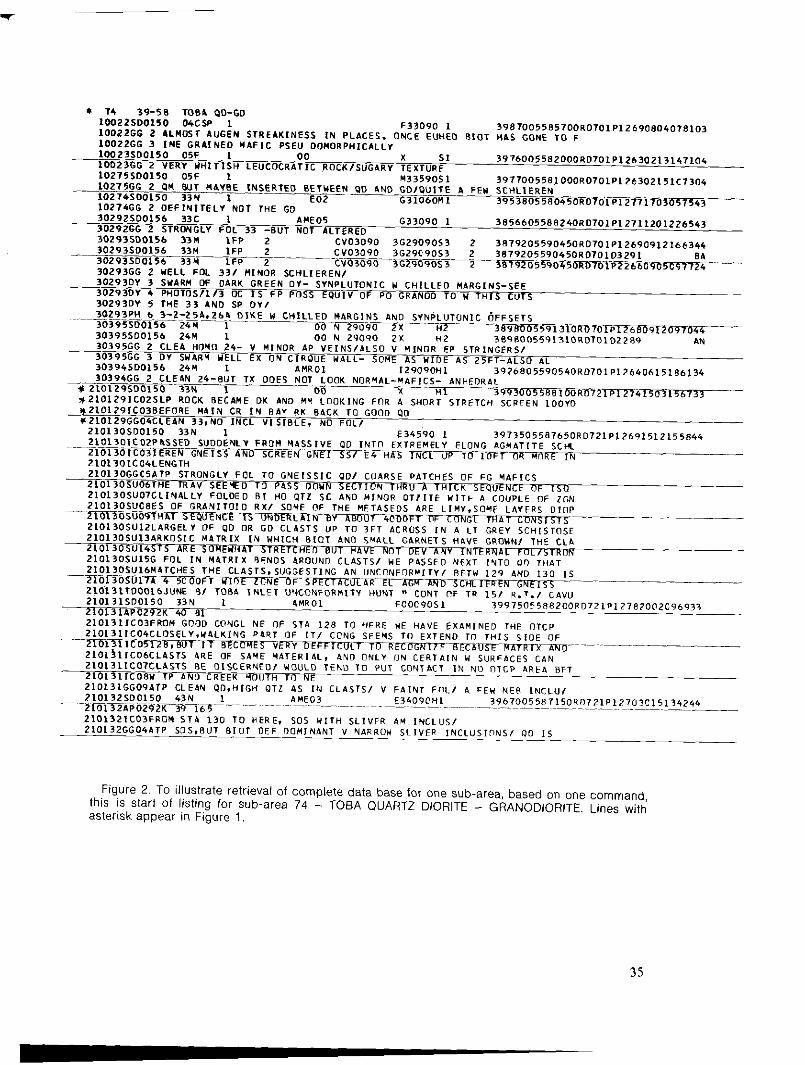
Figure 2. To illustrate retrieval of complete data base for one sub-area, based 0” one command this is start Of lisling for sub-area 74 - TOBA QUARTZ DIORITE - GRANODIORITE. Lines witi asterisk appear in Figure 1,
3s
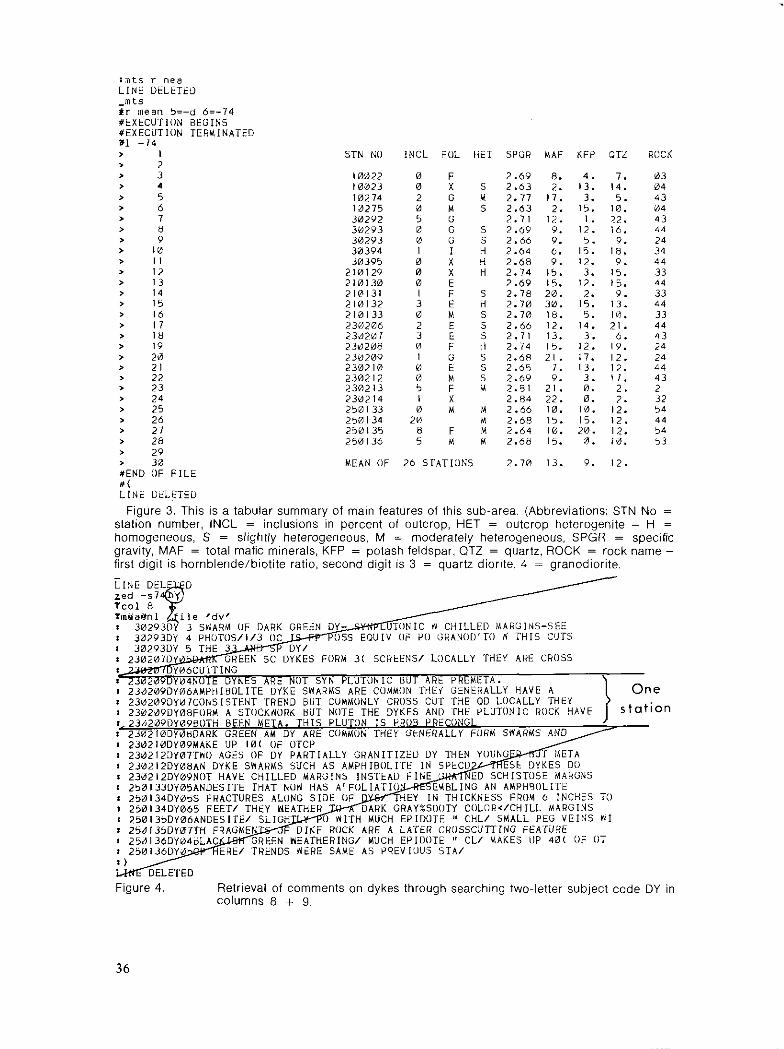
Figure 3. This is a tabular summary of main features of this sub-area. (Abbreviations: STN No = station number, INCL = inclusions in percent of outcrop, HET = cutcrop heterogenite - H = homogeneous, S = slightly heterogeneous, M = moderately heterogeneous, SPGR = specific gravity, MAF = total mafic minerals, KFP = potash feldspar, QTZ = quartz, ROCK = rock name - first digit is hornblende/biotite ratio, second digit is 3 = quartz diorite, 4 = granodiorite.
Figure 4. Reirieval of comments on dykes through searching two+tter subject code DY in columns 8 + g,
36
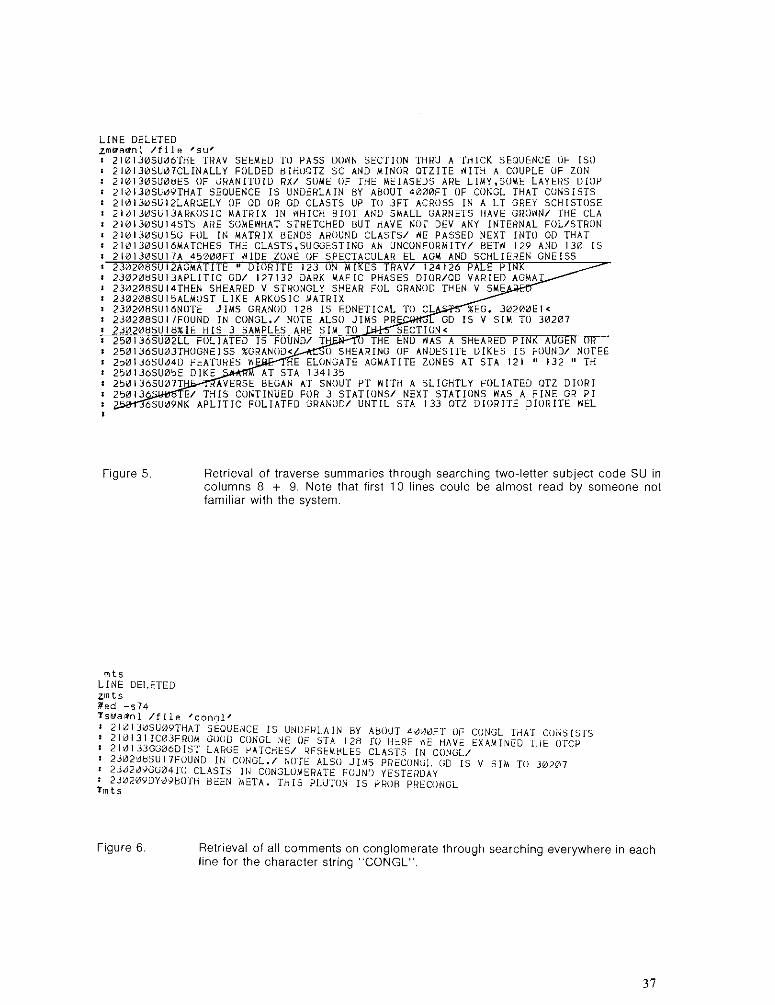
Figure 5. Retrieval of traverse summaries through searching two-letter subject code SU in columns 8 + 9. Note that firs1 10 lines could be almost read by someone not familiar wilh the system
Figure 6. Retrieval of all comments on conglomerate through searching everywhere in each line for the characier string “CONGL”.
31
The subspecs file permits listing of all information concerning a rock unit or specific types of information can be retrieved by simple character-string searches. Conditional searches require short FORTRAN progranx, as do calculations dn certain specified data and the production of special tables.
Considerable progress has been made in developing editing routines, but a general, verification- edit routine is not presently operational. The SUBMON program was developed with file maintenance in mind. Editing can be done on any sub-file retrieved. The corrected data are then consigned, hy one command, to an update file. Before searching the master tile, the program goes first to an update file and if it finds the station in question, then it bypasses the master file containing the uncorrected data. When the update file is large enough, it is incorporated into the master file (the progratn to do this, however, remains to be written).
Use of SARS. The basic concept of SARS is that it allows the field geologist to mimic the procedure he would normally use in compilation. Through SARS he tnay retrieve the complete data base for any map unit or sub-area as part of that tnap unit. He can then interrogate the sub-tile for all data and cotntnents concerning such topics as lithology, mineralogy, structure, grade of metamorphism, tnigmatites, dykes, relationships to other units, etc. From this point he can summarize the data, edit the data or nxtp houndaries and then re-compile rapidly. The technique is basically very powerful, fast and flcxihle. Furthermore, it contains the logic of a cartographic analysis system
Examples of retrieval follow. Figure 2 illustrates the start of the retrieval of the complete data base for a tnap unit, namely the TOBA QUARTZ DIORITE ~ GRANODIORITE, and Figure 3 is an example of the tabular swnmary of the main features of this sub-area. Comments on dykes selected by retrieving on DY in column 8 are listed in Figure 4. Inter-station comtnents appear in Figure 5 and illustrate the value of such textural information which would be lost using codes alone. Character-string searches anywhere within free text are also possible (Figure 6).
Conclusions
The following conclusions continue to he valid. (a) The system requires less time on outcrop; (b) less information is lost through illegible handwriting; (c) consistency of recording information is greatly improved hecause the preprinted sheets serve as checklists; and (d) manipulation and display of geological data can be accomplished in tnany tnore ways, both for analysis and publication, than has hitherto been thought practical.
Efficiency is greatly reduced by ti:me consumed on editing of input data, by programming efforts on part ofgeologists and a decepttve atnount of effort required for file and data-base tnanagetnent. Hopefully the pitfalls and progress of this project will increase the efficiency of successor projects of this nature.
Bibliography
Htttchison, W. W., and Roddick, J. A. I968 Recording geologic field data for machine retrieval and processing:
Western Miner, 4 I , p. 39-43.
Roddick, J. A., and Hutchison, W. W. 1972 A computer-based systetn for geological field data on the Coast
Mountains Project, British Columbia, Canada: 24th Inter. Geol. Congress, Section 16, p. 36-46.
38
Application of DASCH system to geological field data and documentation files of the Geological Survey, Federal Republic of Germany
R. Vinken Niedersaechsisches tandesamt
fuer Bodenforschung 3 HANNOVER BIJCHOLZ P. 0. B. 230153 FEDERAL REPUBLIC OF GERMANY
The computer-based system for geological tieId data currently in use at the Bundesanstalt fuer Bodenforschung (Federal Geological Survey) and the Niedersaechsisches Landesamt fuer Bodenforschung (Regional Geological Survey of Lower Saxony) comprises the three components described below:
Recording SysPan for Geological Field Work IMa
The first step towards automatic data processing was to compile a symbol code for a complete and, if necessary, detailed description ofgeological objects (Look and Vinken, I97 I ). In fixed sequence but in free format of variable length, the symbols conrain the descriptions of the following main gro”ps:
I. Swtigraphy (litho- and biostratigraphy; Precambrian to Quaternary, alpine and non-alpine terms as used in the Federat Republic of Germany)
2. Lithology (sedimentary, magmatic and metamorphic rocks; petrographic pranleters)
3. Genesis
4. COIOUI
5. Additional descriptive characters (e.g. tectonics; structural elements as bedding types, texture; paleontological data, etc.)
6. Sampling
Besides these main groups there appear the usual geographical data, thickness or depth of strata, author, etc.
Each symbol consists of a combination of capital and non-capital letters, tigwes and special characters. The symbols chosen for the code have been used with slight differences by many of the geoscientists of most of the Geological Surveys in Germany and are known to the map users, as
39
-1
they have lxxn printed in tt similar wty on the traditionttl geologicztl maps. The heimrchy tmd the logic of the symbols facilitate memorizing and permit the presentation of quntitative data.
The code contttins, at present, ahout 4 000 sytnhols. It is open for ammendtncnts, additions and deletions. The code was published hy the FederLtl Geolo&icttl Survey together with the Regional Surveys. A second edition of the code of I971 will appear in 1974. Newly introduced will he symbols from the fields of marine geology, p&xmtology ztnd enginwrin& geology.
For practical work field forms based on the symbol code system have been introduced. The annul number of objects documented is ztt present around IO 000, mostly horeholcs for mapping purposes with a depth between 2 and 25 tn, outcrops, deep boreholes of the oil compztnies and sotne hundreds ofhoreholes with zt depth ofsome IO0 tn for groundwater supply and engineering geology purposes. The stor~tge of ttll geological objects of the two Surveys in a sundudized dam tile has been started.
Up to now the dat;t have been stored on punch cards ?ts data carriers. Follwving instillation of our new cotnputer, a SIEMENS 4004 ( 12X K-bytes), stooge on tnagnctic tape and disc is envisttged. The structure of the data on the dzttzt rdrrier has the same order as within the field recording systetn described. Two punch-card formats xe used: The title card carries information in fixed format on sheet number, natne of geologist, outcrop number, coordinates, etc,. The description cards carry in free format the stratigraphic descriptions in the stttne order ~1s on the lield forms: sttxtigmphy up to sztmpling, and where possible sampling results.
According to our experience the use of the free format systetn with an ~tlphat~utneric code is tm ztbsolutely necessuy precondition to enable the geologist to record and to document the great variety of geological parameters.
The documentation tend retrieval systetn with the ttcronytn DASCH (Dokumentations-und Ahf~gesystem~~rSchi~ht~nverzeichnisse, Mtmdry, 1973) contains I7 subprogr~tms together with ttbout I200 FORTRAN commtmds. The necessuy core rdpttcity is 12X K-bytes. The program. package is relatively easy to adapt for different cotnputers; ttt present it is running at a UNIVAC I IOX, zt CDC Cyber 73 and a SIEMENS 4004.
The documentzttion put of DASCH supplies a list of the sections or stmtigmphic descriptions originally written in free format in fixed columns under the headings: depth intervttl, stratigrttphy, lithology, etc. In addition to the lists, a high-speed printer plots the distrihtttion of ttll records listed. A progratn for the decoding of the symbols and the printing in free text will be at hand in 1974. This complete text will enable ustotnex of the Surveys and laymen to read htnd understand the results tnore easily.
The second part of DASCH concerns scanningand data retrieval.The scttn commands or queries xe formed with the satne symbols which were used for the description of the geological sections. The stntcture of the queries is nearly the stttne as the structure of the field recording systetn and as the data structure on the data carriers. Therefore it is rttther easy for each geologist familiar with his own problems to fortnul~te the queries in order to reach his go:tl.
DASCH operates sequentially, with tt first screening ofthe hulk ofdata xcording to sheet nunher, coordinates, author, etc. and is therefore useful. Lo@ operators in the system we AND and OR, the relation operdtoIs are GREATER THAN, LESS THAN and FROM-TO. The hierwchiczdl construction of the symbols is used in the scanning for prefixes. For etch of the 6 main symbol groups (stmtigmphy, lithology etc.) up to 20 queries, each consisting of zt tmtxitnutn of 200 sytnhols that can be dealt with simultaneously,
40
As a result of the queries, a retrieval list is printed which contains the retrieved stratigraphic descriptions and an identification character according to the specific questions. At the end a statistical summary of the absolute and percentage number of strata found for each query is printed. A report on the nunher of strata not considered is given. A tirst plot shows the distribution of all investigated points considered and a second one indicates hy and + signs those horeholes or outcrops which have no swdturn or at least one stratum which satisfies a query. By means of the statistics and of the plots the operating geologist is able to immediately control his commands and the results. For further processing the identiliation character is coded together with sheet-numher, coordinates, etc., in such a way that the use of pure numerical progratns is possible.
Further Processing of General Geological Data Delivered by DASCH
Data retrieved from DASCH can he processed hy a numher of available routines (Mudry, P unpublished) as programs for one dimensional statis&, regression analysis, factor analysis,
cluster analysis, trend surface analysis, etc., including suhprogrdms for plotting (ZUSE Z 64 Graphomat).
Originally we considered the compilation of a program-package for all aspects connected with the computerization of geological mapping as compared with our field recording system. For further processing, however, the requiremen& of the users are too manifold; therefore a package proved impractical. The preparation of a set of specialized programs and the access to existing programs was unavoidable. A second aim was to cotx~r~~ct geologial maps by computer directly from the field data (outcrop and borehole descriptions, geomorphological investigations) in contrast with cartogmphic reproduction for printing after digitizing manuscripts prepared in a traditional Wty.
A contouring package is available (CDC Cyber 73, Z 64 plotter) especially for graphical manipulation. For example, for ahout 30 sheets at a scale of I : 25 000 covering the German Northsea coast, the isolines of the base of the marine Holocene sediments are constructed and plotted from all available drillhole descriptions (Barckhausen, in press). Isopach maps are for the total Holocene. Sand layers of the Holocene for the sane aa are in preparation and the construction of fxies maps is in the planning stage.
Other possibilities existing at the moment for the graphical representation of DASCH-retrieved data (Barckhausen, 1973) are the construction and plotting of geological sections directly from field descriptions, taking into account up to four different components (e.g. sand, clay, peat, lime content, or: sandstone, siltstone, limestone, clay content). There is, furthermore, the possibility to represent the distribution of different strata, which in part overlie each other, in so-called symbol-point maps. A program under development will lead to the representation of geological boundaries in these maps. Another development resulting from the existing program (sections and symbol points) is the construction of geological maps called “protile-type maps”(Hageman, 1962) which tnay represent up to lfl strata overlying each other and which for laymen are more easily readable, than the conventional geological maps, which have hecome more and more complicated.
Bibliography
Barckhausen, J. I973 Automat&h gewonnene Informationen aus geologischen Schichtenvw
zeichnissen and ihre Weitewerarheinmg: Gee. Jb. A7, S. 35-51, 5 Ahb., 3 Tab.
41
Hagernan, B. P. I962 Anweistmg zur Herstelhmd d:r Geologischen Karten in Marschengebieten:
Niederl. Cieo. Dienst (dt. Ubersetzug).
Look, E. R., and Vinken, R. 1971 Elektronische Datetwerarbeittmg bei da Aufnahme and Herstelltmg van
geologischen Karten. Mit einetn ausftihrlichen Anhang: Symbole au der Geologic for die elektronische Datenverarbeittmg, 181 S. , 5 Abb. , Btmdesanstalt ftir Bodenforschtmg tmd C&l. Landesamter da Bundare- publik Deutschland.
Mundry, E. I973 Ein Documentations tmd Abfrageprogramm ftir S~hi~htenverzei~hnisse
(DASCH): Geol. Jb. A 7, S, 25-33, I Tab.
42
Aarhus University System II
S. W. Platou lab&&t for Geofysik Geologisk lnstitut Aarhus Universitet Finiandsgade 6 8200 Aarhus N DENMARK
Introduction
SYSTEM II is an experimental da-processing system developed to handle geological field and laboratory data. The system is not project-oriented, as a group of’srandard parameters specified for each project make it possible for the system to handlc! the data. The system was originally developed to handle da& from mapping of Precambrian rocks in West Greenland and during this project the basic recording principles were developed (Platou, I97 I ). Later the system was used in projects of the following types: Geochemical prospecting for flour&, prospecting for nickel ores, petrological investigation ofa gahhro massif, handling ofpetrophysical properties ofgrdnitic rocks, and in mapsheet mapping by the Geological Survey ofSweden, where the system partly has replaced the GEOMAF sywm (Berner et. al., 1971).
The main system consists of 6 programs, as shown in Figure I. Two main program handle the initial treatment of the data and the administmtion of the project parameters. Four programs are used to sort> list and depict the data The progruns are written in ALGOL-60 and run on a Control Data 6400 computer with 32 K (decimal) core store available to the user. The progruns in the system require 18.28 K core store, ofwhich 8 K is used for the plotter sy~em. ALGOL was chosen as the programming language hecause of better output facilities and easier handling of logical expressions and DO statements, than in, for example, FORTRAN IV. BLH to reduce computing time, sonx of the routines have been written in FORTRAN, as combined FORTRAN/ALGOL programs can be run on the CDC 6400 computer. The computicg time required for running the system is mainly dependent on the amount of output wanted, for exanple, sorting out and printing of IO0 datasets from a 4 000 dataset tile can be done in 4-5 seconds CP-time, of which 1 second is used to load the program into the computer, and l-2 seconds are used for the sorting. The small computing time means that the system, to a large extent, can he operated interactively from a terminal and this is done by means of a Tektronix 40 IO- I graphical display terminal.
43
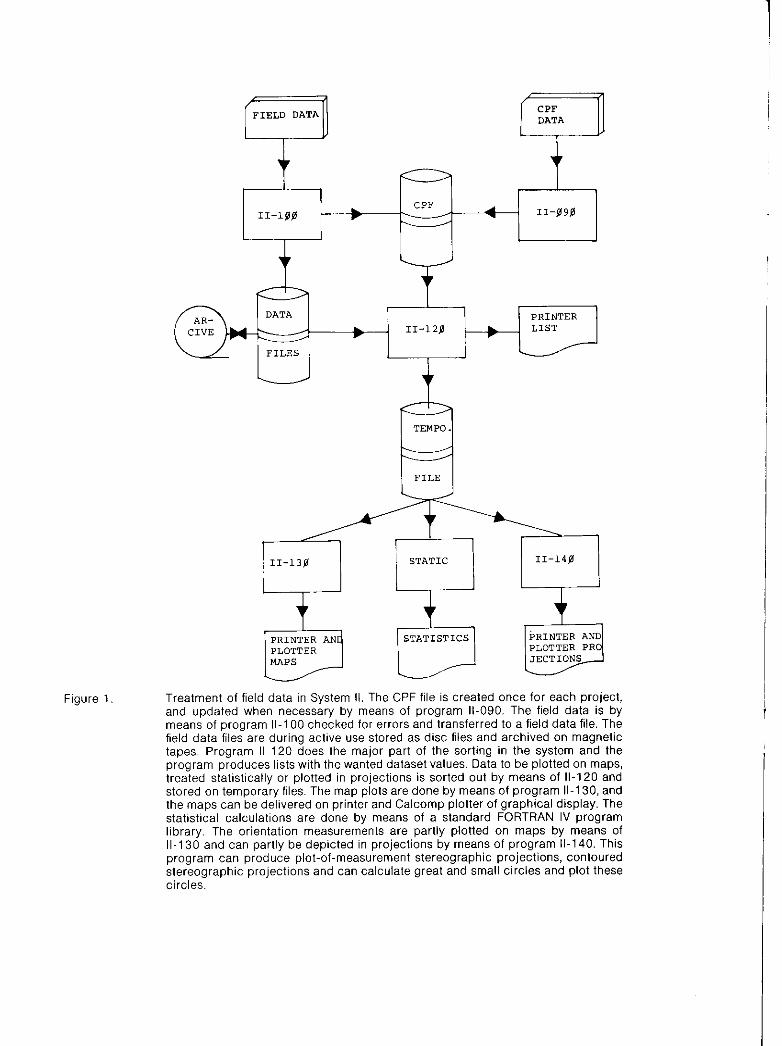
Figure 1. Treatment of field data in System Il. The CPF file is created once for each project and updated when necessary by means of prografn Ii-030. The field data is by means of program II-1 00 checked for errors and transferred to a field data file. The field data files are during active use stored as disc files and archived on magnetic tapes. Program II-1 20 does the major part of the sorting in the system and the program produces lists with the wanted dataset values. Data to be plotted on maps, treated statistically or plotted in projections is sorted out by means of II-120 and stored on temporary files. The map plots are done by means of program II-1 30, and the maps can be delivered on printer and Calcomp plotter of graphical display. The statistical calculations are done by means of a standard FORTRAN IV program library. The orientation measurements are partly plotted on maps by means of II-1 30 and can partly be depicted in projections by rwans of program 11-140. This program can produce plot-of-measurement stereographic projections, contoured stereographic projections and can calculate great and small circles and plot these circles.
User Facilities
The main purpose of developing the system was to create a system which could accept data of any tvoe. and allow the user to create recording sheets, which from the user’s point of view are as
2,
effective as possible. In practice this tneans-that the user can record what he wants and create recording sheets with very Ii~Gz empty space. This made it necessay to develop compleR?ly new recording principles which partly fulfill the geologist’s requirements and partly make computer treaunent of the data effective. This is only possible by a general use of coding in the datasets and by using standard recording structures, as described by Piatou ( I97 1). The extensive use of codes for texts have been found to be of major importance in making possible the fast computer treattnen~ of the data. None of the 30-35 geologists who have used the system, have had any trouble with the codes for three reasons: I. It takes less time to write a code vahx than to write a full text; 2. The number of recording errors and punching errors hecome very small; and 3. The number of codes regularly used, during tield work, is small and therefore learned during a couple of days field work.
Laboratory and field data are recorded using the same principles and are handled by the same programs. A number of auxiliary programs are connected with the system to handle petrological calculations and depicting, for example, triangular diagrams. The field and laboratory data can easily be treated together; for example, laboratory and field data may he plotted in the same nl”.
It was found naxssary to be able to use coordinates from any coordinate sysWm> mainly to treat data from local investigations together with more general information from an axx. But to make the use of coordinates easier, all coordinates in the data files are in the same system.
The output from the system is: I. Lists in which the user defines which values it should contain: 2, Printer and plotter maps on which two independent variables, one as symbols and the other as values or text, can be depicted; and 3. Various types of pro,jections with orientaGon medsureme~&. The problem for the user is to choose an output format, because the system conWins about 35 completely different ways of depicting data.
Data Management
The pammeters needed by the programs in the systun to handle data from a specific project, is stored in a separate file named the Common Project File (CPF). The CPF contains general project parameters, pwameters for each of the dataset values in the project, the text corresponding to the codes used and the paraneters for each of the data files in the pro.ject.
The CPF is fundamental to the ability of the system to do fast processing of the various data groups and files in a project. The content of the CPF allows the user to stipulate coordinates, scales, the values he wants and how he wants to depict the data.
The files treated by the system until now (up to I5 000 datasets) have not required reorganization of the data in the tiles. A reorganization seems not to be necessary as long as only the geologist himself, or the team working in a pro.@% is using the data. But if the da?d are to be a part of a larger data base and extraction and merging of da?d seem necessary, mainly to purge data which are not of interest and to combine data abwt the same items from various files, it would, for example, be possibe to combine field and laboratory data for various rock types and from several projects. Facilities for doing this are included in the system, because it is easy to create new recording formats similar to field sheets and to extract data from various files and merge them into such new formats.
4s
File Structure File Structure
Both data and tile structures are rather complex, but this is not noticed by the user because the Both data and tile structures are rather complex, but this is not noticed by the user because the programs by means of the CPT, do all the administration. The user need only know the names of programs by means of the CPT, do all the administration. The user need only know the names of the files he wants to use. the files he wants to use.
The content of a data lile is a combination of three hierarchial systetns which are all meant to make the sorting and datafile handling effective. The three systems are: l. The recording system; 2. The data file systetn; and 3. A sorting system. It is nearly impossible to briefly describe the various hierarchies, mainly because exh project has its own combination and hecause one level can he of major importance in one project and not even used in another project.
Future Development and Conclusions
A problem with System II is its many possible uses: one can record whatever is wanted and the data can he handled and depicted in a large number of different ways. But it is not unimportant how the recording is done in relation to what the user wants. A typical example is that the user wants to carry out intensive statistical treatmat on his data, hut he had not classified the data in such a way, during the recording, to make it possible for the computer to separate the various data groups in a simple way. Another serious problem is to make the records useahle for those other then the geologist himself. The major problem in the future seems, therefore, not to be a further sophistication of’ the computer programs, but an investigation of the relation between recording techniques and what the data should be used for. A geological map sheet is a good example of these problems. A geologists collect data, treat them by computer and produce a map. Another user takes the map and extracts the data he needs for his purpose, hut much is lost in this process, especially the possibility for judging the reliability of the data depicted on the map. It would be much better if the outside user could ask a data base for the information he needs. But it is unfortunately rather unknown what such a data base should contain, mainly because of lack of information from the outside users about what they would like to have in such a data base.
Another problem is the education of the geologist in the use ofcomputers because it does not seem to be generally realized that the effective use of a contputer requires just as much education as is the case in the use of a microscope. Most geologists use computers to do the sane work they do by hand, and only very few utilize the new possibilities offered.
References
Berner, H. , EkstrGm, T. , Lilljequist, R. , Stephansson, 0. , and Wikstrem, A. I971 Daed storage and processing in geological mapping. k Field data
sheet II: Data file. Cieol. Fare. Stockholm F6rh.. 93, p. X5-101 and p. 693-705.
Platou, s. w. I971 An electronic data-processing systctn for geological lield and
laboratory data. The E.D.P. system Agto. , Geological Survey of Greenland, Report no. 39, 42 p.
46
PART 2: GENERALIZED GEOLOGICAL DATA MANAGEMENT SYSTEMS
Introduction
G. D. Williams Department of Geology University of Alberta Edmonton, Alberta T6G ZEl CANADA
Geological field da& comprise an exceptionally broad spectrum ofobservations, analytical results, inferences and conclusions relating to points, linear features and areas of the crust, collected under diverse conditions, often by many individuals over a considerable time span. Because of the enormity of the task before him, the field geologist usually functions as an analog device, interpreting his observations as he makes them, analyzing the consequences, and often recording only the conclusions, usually in map, or other graphic form. Each individual performing this task reflects in the conclusions he draws, his training, experience and personal biases as well as the influence of local conditions under which he is operating. Many field data, therefore, have been considered to be so interpretive, so individualistic and so lacking in reproducibility that at best, special procedures are necessary in order to deal with them successfully in computer tiles, or at worst, computer processing should not be used because it destroys the unique relationship between the geologist, his field area and his conclusions by requiring unnatural rigidity in his operations.
Geological field data, however, form the foundation upon which is built virtually all of our knowledge of the earth. Because of this importance, ways must be found not only to collect it more efficiently and objectively, but to use it more effectively in the service of man and science: in the study and utilization of man’s environment and in providing for his needs in the form of energy, minerals and renewable resources, and in solving problems related to the origin and history of the earth and our universe. These are area of concern which have been identified specifically by UNESCO and ILJGS and upon which attention has been focussed through the International Geological Correlation Programme.
Efficient, effective and timely use of geological field data now is more essential than has ever been the case in the past, and can only be accomplished by application of modern techniques of data management and analysis. The papers which follow describe generalized computer systems which have been designed and used for managing geological data of diverse types, including field data. Whereas geological field data are undoubtedly unique in nuny aspects, the problems of managing the data, and to a large extent analyzing them are not, and can be most efficiently solved by application of generalized, rather than ad hoc techniques.
41
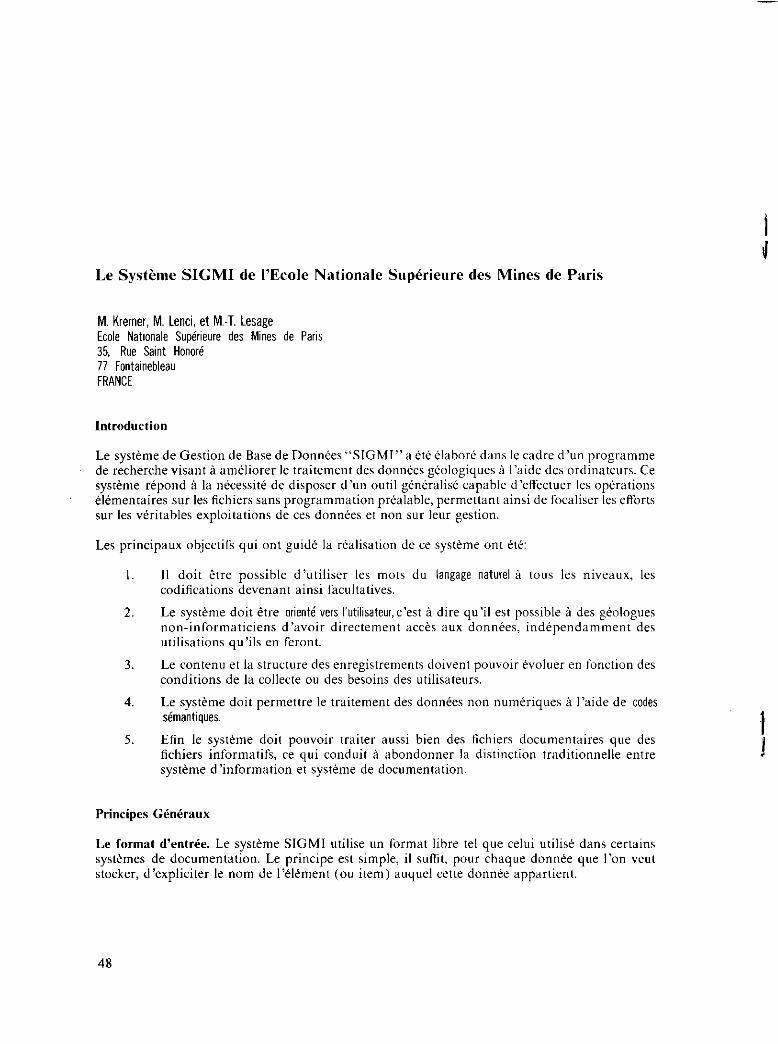
Le Systkme SIGMI de I’Ecole Nationale Sup&iettre des Mines de Paris
M. Kremer, M. lenci, et M.-T. tesage Ecole Nationale Sup&ewe des Mines de Paris 35, Rue Saint Honor6 77 Fontainebleau FRANCE
htroductinn
Le syst&me de Getion de Base de Dorm&~ ‘WGMI” a &k klahork dans le cadre d’un ~~o~mrnrne de recherche visant A am6liorer le traitemem des don&es gkologiques A l’aide des ordinateurs. Ce sys@me r&pond A la n&xssitk de disposer d’un ouil @n&dis6 capable d’effecuer les optrations &men&ires SW les fichiers saris programnation prkalahle, permettant ainsi de focaliser les efforts SW les vbritahles exploiWons de ces dorm&s et non sur leer getion.
Les principaux objectifs qui ant guid& la r&lisation de ce syst&me ant &tk:
I. II doit Stre possible d’utiliser les mats du langage nature1 Si tous les niveaux, les codit?caGons devenant ainsi faculmtives.
2. Le sys@me doit Stre orient6 vers l’utilisatewc’cs~ A dire qu’il est possible i des g&logues non-informaticiens d’woir directemen~ xc&s aux dorm&s, ind&pendammen~ des utilisations qu’ils en feront.
3. Le content et la structux des enregistrements doivent pouvoir t%oluer en fonction des conditions de la collccte ou des besoins des utilisateurs.
4. Le systkme doit permettre le trditement des dorm&s non numkriques A l’aide de codes Gmantiques.
5. Efin le systkrne doit pouvoir trditer aussi bien des tichiers documentaires que des fichiers informatifs, ce qui conduit A abondonner la distinction traditionnelle entre syst&me d’information et syst&me de documentation.
Le format d’entke. Le sys&me SIGMI utilise un format libre tel que celui utilis6 dam certains systkmes de documentation. Le principe est simple, il suffit, pour chaque dam&! que 1’0” vat stocker, d’expliciter le nom de IWment (ou item) auquel ct%w don”& appartient.
48
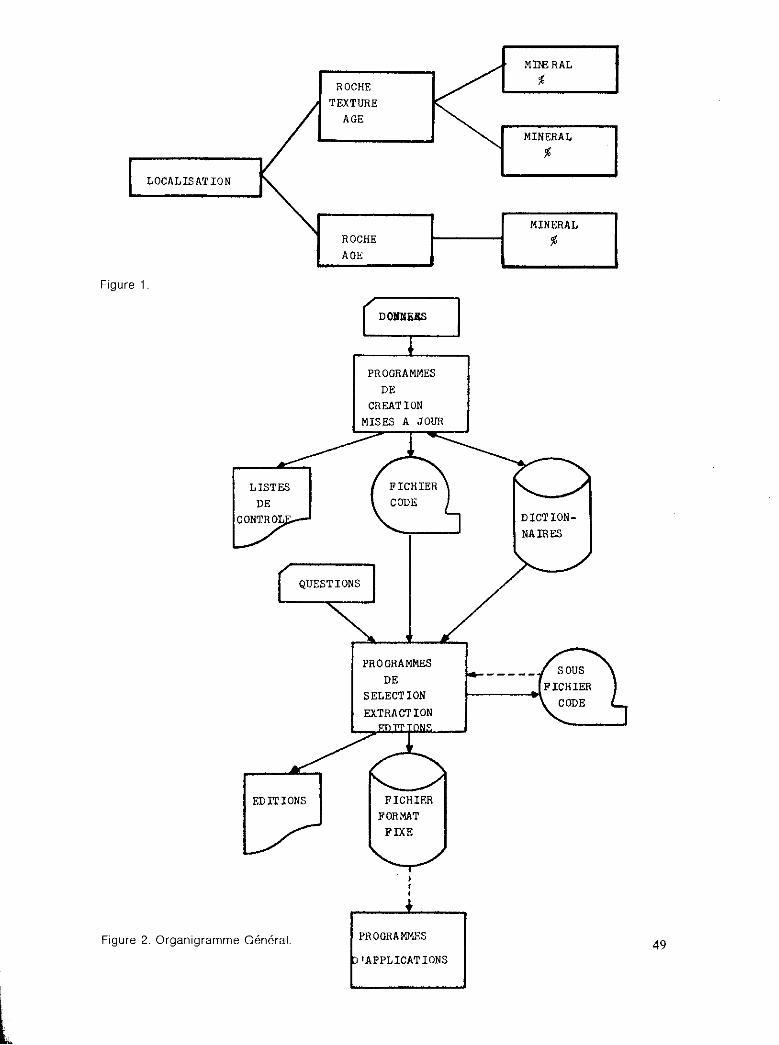
ROCHF.
LOCALISATION
MINEHAL
Figure 1
PROGRAMMES r- DE CREATION
LIST!!.?
DICTION-
QUESTIONS
PROGHAMMES
DE
EXTRACTION
Figure 2. Organigramme G6rkal. PROGRANWS
IAPPLICATIONS 49
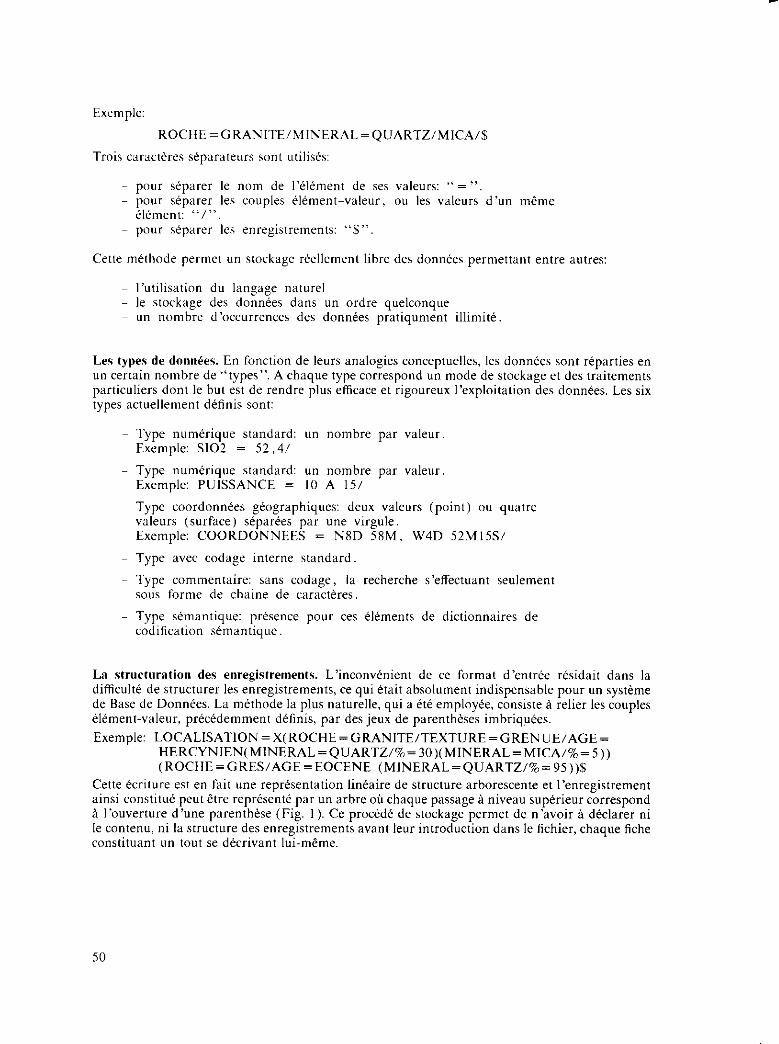
Exemple:
ROCHE=GRANlTE/MlNERAL=QLJARTZ/MlCA/$
pour s+arer Ia enregistrements: “$“.
Cette mtthode permet un stockage r&llement lihre des don”& permettant entre autres:
l’utilisation du langage nature1 le stockage des dorm&es dans un ordre quelconqw un nomhre d’occurrences des donn&s pratiqument illimitk
Les types de donn&s. En for&on de leurs analogies conceptwIles, les don&es sent r&parties en un certain nombre de “types”. A chaque type correspond un mode de stockage et des traitements particuliers dent le hut est de rendre plus efficace et rigoureux l’exploitation des don&es. Les six types actuellement d&inis sent:
Type num&ique standard: un nombre par valeur. Fxmple: SlO2 = 52,4/
Type num&ique standard: un nomhre par valeur. Exemple: PUISSANCE = IO A l5/
Type coordonn&s gkographiques: deu valeurs (point) ou quawe valetus (surface) s6par6es par une virgule. Exemple: COORDONNEES = N8D 58M. W4D 52Ml5S/
Type wet codage interne standard.
Type commentaire: sax codage, la recherche s’effectuant seulement sous forme de chaine de caract&es.
- Type s6mantique: pr&ence pour ces &&ments de dictionnaires de codifiation st!mantique.
La structuration des enregistrements. L’inconvknient de ce format d’entr& rtsidait dam la difficult6 de structures les enregistrements, ce qui &it absolument indispensable pour un syst&me de Base de Donn&x La m&hode la plus naturelIe, qui a 6t6 employ&, consiste a relier les couples &!mcnt-v&w, pr~c~demment d&inis, par des jew de parenth&es imhriqF&zs. Exemple: LOCALlSATlON=X(ROCHE=GRANlTE/TEXTURE=GRENUE/AGE=
HERCYNlEN(MINERAL=QUARTZ/%=3O)(MINERAL=MICA/%=5)) (ROCHE=GRES/AGE=EOCENE (MlNERAL=QUARTZ/%=95))$
Cette &xiture est en fait une repr&entation Iin&& de structure arhorescente et l’enregistrement ainsi constitw? pat &re repr&?nt&- par un arbre oti chaqw passage i niveau sup&riew correspond i l’ouverture d’une puenth&se (Fig. I). Ce pro&d& de stockage permet de n’avoir A d&larer ni le content, ni la structure da enregistrements avant leer introduction dam le lichier, chaqw fiche constituent un tout se d&xivant lui-msme.
50
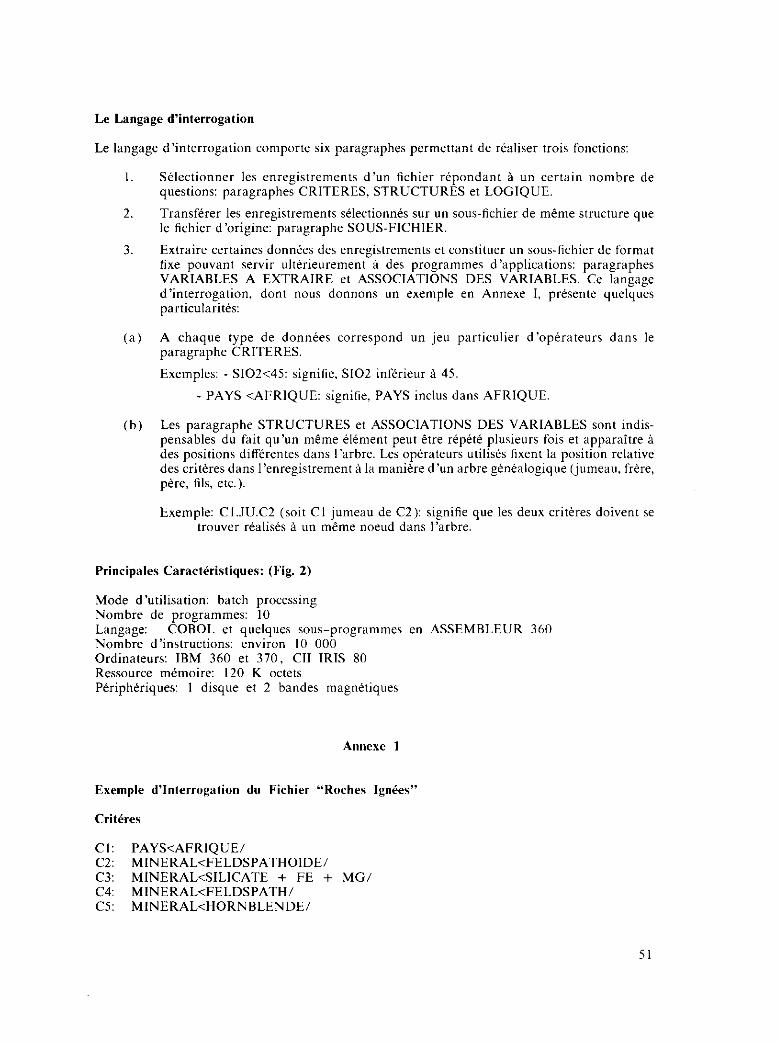
Le Langage d’interrogatim
Le langage d’interrogatio” comporte six paragrapha permettant de r&liser trois fonctions:
I. Skleckxner les enregistrements d’un tichier rkpondant & u” certain nomhre de questions: paragrapha CRITERES, STRUCTURES et LOGIQUE.
2. Transfkrer les enregistremcnts s&ctionn& sur “n sous-fichier de mkne structure que le tichier d’origine: paragraphe SOUS-FICHIER.
3. Extraire certaines dorm&s des enregistrements et ccmstituer u” sous-fkhier de format fix powant servir ult&kxreme”t i des programma d’applications: paragrapha VARIABLES A EXTRAIRE et ASSOCIATIONS DES VARIABLES. Ce langage d’interrogation, dcmt nous donnons u” exemple e” Annex I, prksente qwlqws particularitk
(a) A chaqw type de dorm&s correspond u” jeu pxticulier d’opkakurs dans le paragraphe CRITERES.
Exemplcs: - SI02~45: signit%, SI02 infkrieur A 45.
- PAYS <AFRlQUE: signit%, PAYS inclus dans AFRIQUE.
(b) La pardgraphe STRUCTURES et ASSOCIATIONS DES VARIABLES so”t indis- pensahles du fait qu’un m&me klirne”t peut &re r&p&k plusiwrs fois et apparaitre i des positions diff&entes dans l’arhre. Les opkrakurs utilisks fixent la position relative des critkres dans l’enregistrement i la ma”i&re d’un arhre g&&dogique (jumeau, fake, p&e, fils, etc.).
Exemple: Cl.JU.C2 (soit Cl jumeau de C2): signifie q”e les deux critkes doivent se tmuwr r&ilk& & u” meme noeud dam l’arhre.
Principales Caract&istiques: (Fig. 2)
Mode d’utilisation: hatch processing Nombre de progmmmes: IO Langdge: COBOL et quelques sous-programmes e” ASSEMBLEUR 3f,O Nombre d’instructions: environ IO 000 Ordinateurs: IBM 360 et 370, CII IRIS SO Ressource m&mire: I20 K octets Pkriphkiques: I disque et 2 handes magnktiques
Exemple d’Interrogation du Fichier “Roches Ign&s”
Cl: PAYS<AFRIQUE/ C2: MINERAL<FELDSPATHOIDE/ C3: MINERALcSILICATE + FE + MC/ C4 MlNERAL<FELDSPATH/ C5: MINERAL<HORNBLENDE/
C6: MlNERAL<BIOTlTE/ C7: MlNERALcOXYDE + FE/ C8: SIO2>39/ C9: SIO2<45/ CIO: NA20> = 5/ Cll: CAO> = S/
structures
Sl: C8.ID.C9/ S2: Sl.JU.Cl~~.JU,Cll/
Cl ET C2 ET C3 ET NON C4 ET (C5 OU C6 OU C7) ET S2/
Sow-Fichia
out/
VI: GEOL (16)/ V2: SlO2 (F7.2)/ V3: AL203 (F7.2)/ V4: NA20 (F7.2)/ V5: CA0 (F7.2)/ V6: K20 (F7.2)/ V7: Nl (E9.2) F/ V8: CO (E9.2) F/
Al: V2.JU.V3.JU.V4..lU.V5.JU.V6.JU.V7,JU.W/ A2: Al.FI.Vl/
Biblingrdphie
Kremer, M. I972 Essai de structuration de dorm&s dam un fichier d’archive
gblogique ci format like: Rapport interne E.M.P. , CIG/U72/l
Kremer, M., Lerxi, M. T.
52
Kremer, M. et Lesage, M. T. I972 Syst+me d’information gkologiqw et mini&e: exploitation d’un
fichier “Cartes et Plans”: in Traitk d’Informatiqw Gblogique i la dir. de P. L&itte, Mason, Paris.
Laffitte, P. I969 La codification s&mantiqw en informatique g.+ologique: Ann&s des
Mines, D&c. 69, p. 75-83.
Lenci, M. I972 Notions de base de la codiliwtion skmantique: Rapport interme
E.M.P., COG/R72/4.
Lesage, M. T. I970 Programme SIGMI: Fichiers Cartes et Plans: Rapport interne E. M P. ,
CIG/R70/5.
53
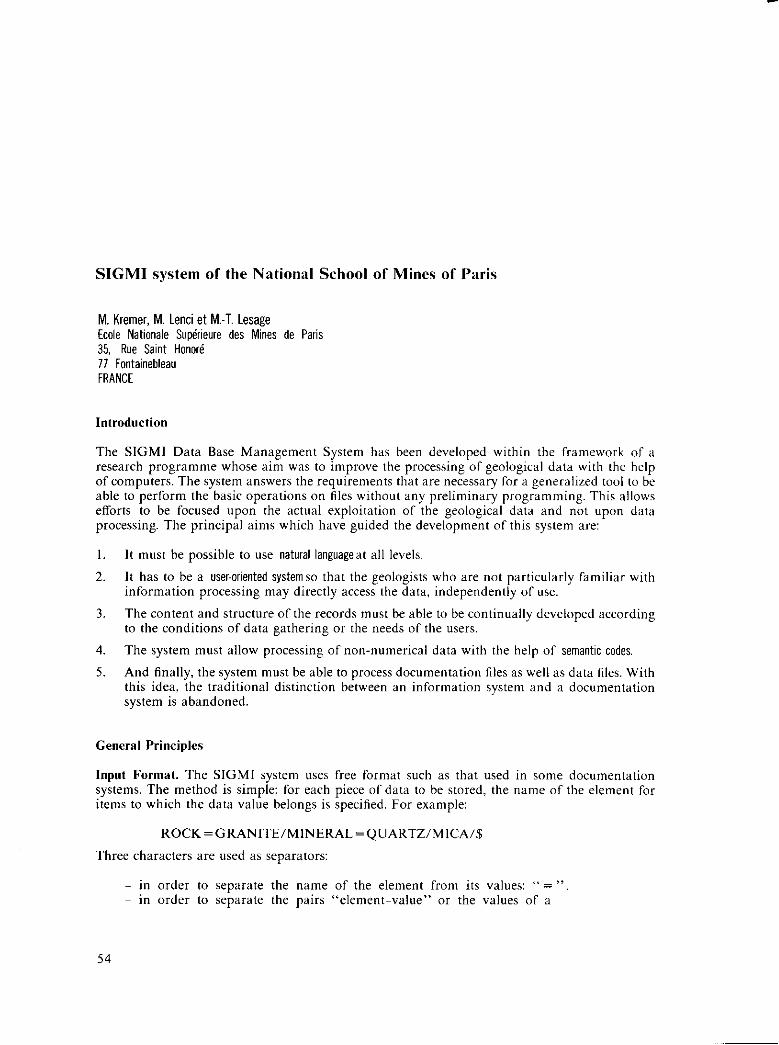
SIGMI system of the National School of Mines of Paris
M. Kremer, M. lenci et M.-T. lesage Ecole Nakxle Suphrieure des Mines de Paris 35, Rue Saint Honor6 11 Fottkinebleau FRANCE
Introduction
The SIGMI Data Base Management System has been developed within the framework of a research programme whose aim was to improve the processing of geological data with the help of computers. The system answers the requirements that are necessary for a generalized tool to be able to perform the basic operations on files without any preliminary programming. This allows efforts to be focused upon the actual exploitation of the geological data and not upon data processing. The principal aims which have guided the development of this system are:
I. It must he possible to use nabxal languageat all levels.
2. It has to he a user-oriented system so that the geologists who are not particularly familiar with information processing may directly access the daw, independently of use.
3. The content and structure of the records must be able to be continually developed according to the conditions of data gathering or the needs of the users.
4. The system must allow processing of non-numerical data with the help of semantic codes,
5. And finally, the system must be able to process documentation files as well as data files. With this idea, the traditional distinction between an information system and a documentation system is abandoned.
General Principles
Input Format. The SIGMI system uses free format such as that used in some documentation systems. The method is simple: for each piece of data to he stored, the name of the element for items to which the data value belongs is specified. For example:
ROCK=GRANITE/MINERAL=QUARTZ/MICA/$
Three characters are used as separators:
- in order to separate the nanx of the element from its values: “ = ” in order to separate the pairs “element-value” or the values of a
54
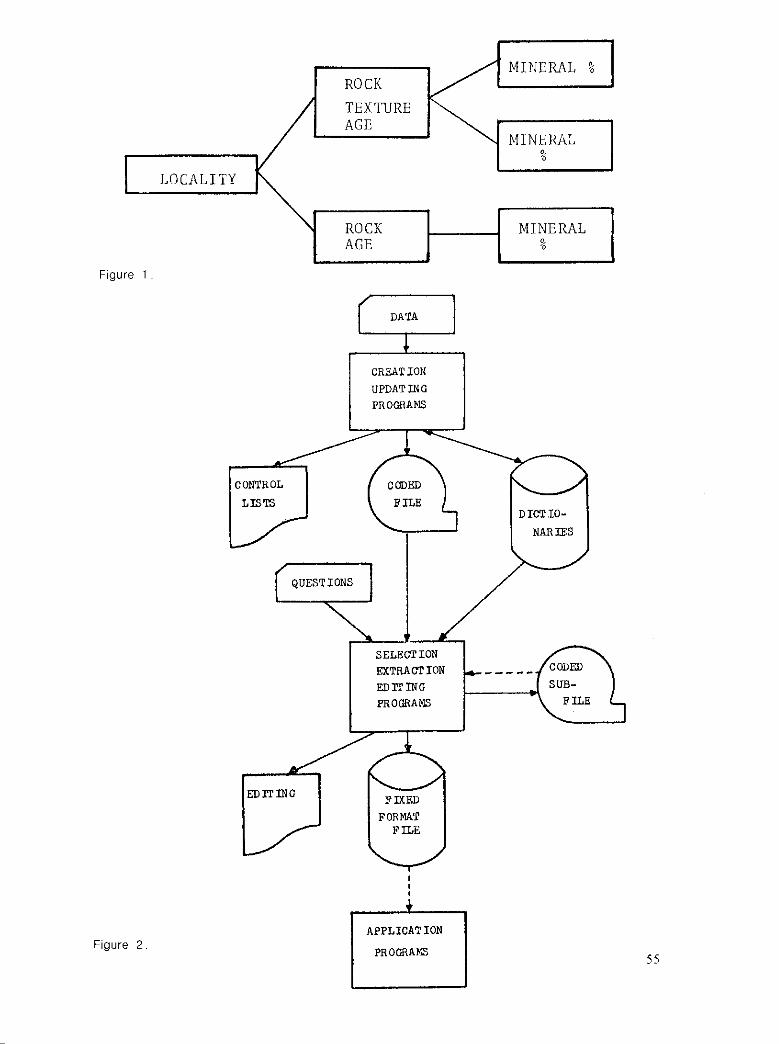
ROCK
I
%
J>OCALITY
MINERAL AGE %
Figure I
EDITING
0 Figure 2
SELECTION EXTRACl'ION !mlTING PROGSAiS
FIXFOE FORMAT
FILE
APPLICATION
-----
55
?,a”le &ment: “/“.
This rn~lhod allows an absolutely independent storage of the data permilting:
Data types. According to their conceptual analogies, the data are divided into a certain numher of “types”. To each type there corresponds a special way of storage and processes so that the data operations are snore efficiem and more rigorous.
The six types actually delined are:
aandard numerical type: a numher per value For example: SlO2 = 52,4/
~- numerical type wilh two limi&: two nunhers per value For example: THICKNESS = 10 TO l5/
geographic coordinates: two values (point) or four values (surface) separated hy a comrna. For example: COORDINATES = N8D 58M, W4D 52Ml5S/
type with an internal standard coding
cornnxntary type: no coding so the sexc h is only made on character strings
semantic type: for these elements, existence of dictionaries dealing with semantic coding.
Record structure. The draw-hack of this input format could he found in the difficulty of structuring the records which is absolutely necessary for a data base system The following method has heen used: it consists of linking together the value-element couples which have been formerly defined hy imhriated brackets. For example:
LOCALlTY=X(ROCK=CiRANITE/TEXTURE=CiRANULAR/ AGE=HERCYNIAN(MINERAL=QUARTZ/~=3~)(MINERAL=MICA/~=5)) (ROCK = SANDSTONE/AGE = EOCENE( MINERAL = QUARTZ/% = 95 ))$
This writing is, in fxx, a linear representation of an arborescent structure and the record thus realized may he represented hy a tree in which each entry to a higher level corresponds to the opening of a bracket (Figure I ). This method of storage does not require the declaration of the content nor the record structure before their introduction into the file, each data sheet being an entity which describes itself.
The imerrogation language is composed of six paragraphs allowing three functions:
I. The selection of file records answering a certain number of questions: CRITERIA, STRUC- TURE and LOGIC padgraphs.
56
2. The transfer of the selected records into a sub-file of the same structure as the original file: SUB-FILE Paragraph.
3. The extraction of certain data from records and the constitution of a fixed format sub-file which may be used at a later date for application programs: VARIABLES TO BE EXTRACTED and ASSOCIATIONS OF VARIABLES. This interrogation language, a” example of which is give” i” Appendix I, shows a few particular points:
(a) To each type of data corresponds a particular set of operators in the CRITERIA paragraph. For example:
SIO2<45: mea”s, SlO2 less than 45. - COUNTRY AFRICAx mans, COUNTRY included in AFRICA.
(h) The paragraphs STRUCTURE and ASSOCIATIONS OF VARIABLES are necessary owing to the fact that the same element may he repeated several times and appear o” different positions in the tree. The operators used fix the relative position of criteria in the record as in a genealogical tree (twin, brother, Pather, etc.). For example:
Cl.JU.C2 (Cl twin ofC2): this “xans that both criteria have tc~ occur at the same node in the tree.
Main Characteristics: (Figure 2)
Processing method: hatch processing Number of programs: IO Language: COBOL and a few sub-programs in Assembler 360 Number of instructions: ahout IO 000 Computers: IBM 360 and 370, CII IRIS 80 Core storage space: I20 K bytes Peripherals: I disc and 2 magnetic tapes
Appendix I
Example of Interrogation of “Igneous Rocks” File
Criteria
Cl: COUNTRY<AFRICA/ C2: MINERAL<FELDSPATHOID/ C3: MINERAL<SILICATE + FE + MCi/ C4: MINERAL<FELDSPATH/ C5: MINERAL<HORNBLENDE/ C6: MINERAL<BlOTITE/ C7: MINERAL<OXIDE + FE/ C8: SIO2>39/ C9: SIO2<45/ CIO: NA20> = 51 Cll: CAO> = S/
Sl: CS.ID.C9/
57
s2: sl.JlJ.cl~l,JY.cll/
Logic
Cl AND C2 AND C3 AND NOT C4 AND (CS OR C6 OR C7) AND S2/
Sub-File l
YES/
Varizdhles lo he Extracted
VI: GEOL (l6)/ V2: SIO2 (F7.2)/ V3: AL203 (F7.2)/ V4: NA20 (F7.2)/ V5: CA0 (F7.2)/ V6: K20 (F7.2)/ V7: Nl (E9.2) F/ V8: CO (E9.2) F/
Al: V2,JU.V3.JU.V4.JU.V5.JU.V6.JU.V7.JU.V8/ A2: Al .FLVl/
Bibliography
Kremer, M. I972 Essai de structuraticm de dorm&s dam un fishier d’archive
gkologique A format libre: Rapport inlane E.M.P. , COB/R72/l
Kraner, M. , Lenci, M. et Lesage, M. T. I973 SIGMI: un nouveau systkme d’interrogation de fichiers orient& wrs
l’ulilisateur: Rapport intune E. M. P. , CIG/R73/5.
Kremer, M. et Lesage, M. T. I972 Sys16me d’information gkologique ct mini&: exploitation d’tm
lkbier “Cartes et Plans”: in Trait6 d’Informatique Gkologique sous Ia direction de P. Laffitte, Masson, Paris.
Laffitte, P. I969 La codilication skrxmtique en informatique g&logique: Annales des
Mines, dkemhre 1969, p. 75-83.
Lenci, M. I972 Notions de base de la codilicxtion skmantique: Rapport intune
E.M.P., ClG/R72/4.
Lesage, M.-T. I970 Programme SIGMA: Fichiers Cartes et Plans: Rapport interne
E.M.P., CIG/R70/5.
G-EXEC: a generalized FORTRAN system for data handling
Keith G. Jeffrey Institute of Geological Sciences Exhibition Road London SW7 ZDE UNITED KINGDOM
Elizabeth M. Gill Atlas Computer Laboratory Science Research Council Chilton, Didcot Eerkhire UNITED KINGDOM
During the spring and swnmer of 1972, staff of the IGS Computer Unit analyzed IGS data handling needs. These were formulated into a set of objectives, and against these goals some currently available data handling systems were evaluated. This study resulted in a decision to develop our own data handling system to meet these same objectives.
The objectives were that the system should handle almost any kind of data (generalization) and that the system should be ‘portable’ (run on any medium-sized computer). We also required integration through data management, data analysis and data display and the system had to be amenable to modification and extension by programmem Finally, the system had to handle ‘project’ data and ‘archival’ data with equal ease.
To meet these objectives G-EXEC was designed to be highly modular. This allows ready building, amendment and updating of program segtnents. It also saves on storage of the object code in the system program library. The software is written in FORTRAN IV so that it may be handled by most computers. The system is implemented from this ‘pool’ of modules, and the main (central) system uses the same modules as the small (satellite) subsystems. Furthermore, this technique allows experimentation in dii%xent data management or analysis methods without rewriting the software.
The files in G-EXEC are norm4 computer files, as may be handled by a normal FORTRAN program. There are no constraints on the input in terms of field positions and there is no need for special information to allow the system to structure the data. Single files may be added to the system and may or may not enter the data base. All file linkages are externally detined (in the present implementation) and so great flexibility is achieved. The constraints on the files are that
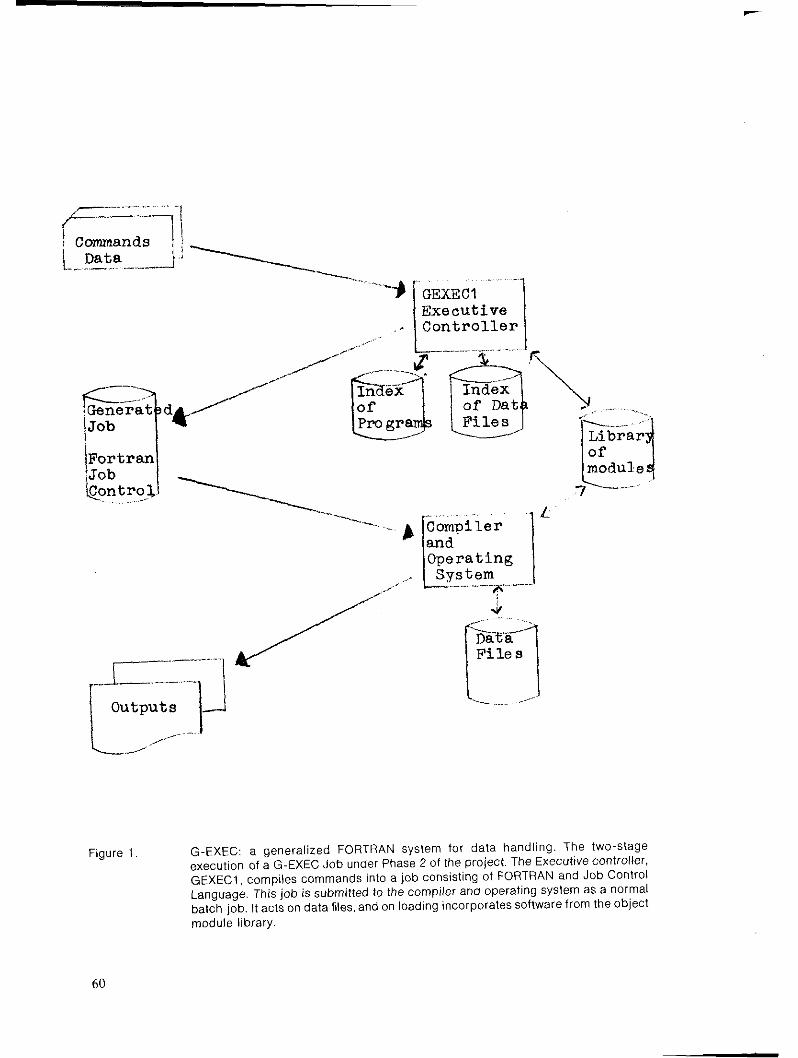
Figure i. G-EXEC: a generalized FORTRAN system for dala handling. T!e two-stage execution of a G-EXEC Job under Phase 2 of the project. The E,vxuttVe C~nt~OllW,
GEXECI, compiles commands into a job consisting of FORTRAN and Job Control Language, This job is submitted to the compiler and operating SyStm as a rwvna~ batch job. tt acts on data files, and on loading incorporates software from the objecl module library.
60
all records must contain the same fields, and that each lield tnust be of the sane length and type throughout all records in the tile. This standard tile allows integration.
The other aspect of file design is concerned with generalirdtion. A data description of standard form is added to each lile. Programs processing the file access the data in the file through the data description, and so ate data independent. The data description contains information on the tutne, length, type and input format of a lield vector. together with its maximum and minimum value and a code representing ahsent data as opposed to zero value in that field. The data description also allows a dictionary segment to he specilied for each tield vector to allow coding or decoding to or rrotn the stored form.
The design of the software (highly modular) and of the files (vector storage) hoth allow for efficient processing. and look to fourth generation techniques.
The implementation of the systetn on the IBM 370/ I95 at Rutherford High Energy Laboratory, and accessed via the Atlas Computer Laboratory, has proceeded in planned phases. In Phase I the system was largely in the current state of thtz satellite subsystems, requiring a small atnount of FORTRAN programming (typically 5 statements) and sotnc Joh Control Language to specify the files required to the operating system. In Phase 2 a modular Exewtiw Controller has heen written. This controller is slightly machine dependent, and some parts would need differently coded modules on other computers. However, this could he made geneml at the expense of run-time efficiency. Under this controller, the user only inputs simple commands, and the software ‘compiles’ the commands into a joh consistin& of FORTRAN and Joh Control statanents. This joh then actually processes the task (Figure I ).
Throughout the G-EXEC System there are three faces, The user sees a systetn with capability to handle his data, and with which he interacts hy simple commands. The progratntner sees a collection of modules. and can build new applications software or subsystems which can be accessed hy usas. The system manager sees an audit trail ofwhat the system has done, and he can keep records of users, the processing progratns they used and the liles they accessed. Furthermore, he has a report of the resources used by each task, ready for an accounting run at periodic intervals.
In conclusion, a few ligures are provided to show the systetn in perspective. The software consists of 28 000 lines of source code, split among sotnc 180 modules. There are, at pt’esent, over I00 tetnporary work-liles stored on the system, occupying 50 megabytes, and at any one time there are up to 200 liles using the system hut not being stored, representing another 20 megabytes. Data files currently being processed hy the system on an experimental hasis concern petrology, paleontology, regional geochemistry, mineral assesstnent. structural geology, mineral trade and production statistics, hydrogeology, lithology and stmtigraphy (both surface and boreholes), geotechnial properties and sedimentary structures, as well as personnel and accounting files. The systetn uses I IBM 100 megabyte disc pack as the ‘active area’ for both progra~~s and data. The current workload averages I00 seconds per day on the IBM 370/ 195.
We should like to thank our colleagues for their constructive criticism and hope that the software va are now developing will eliminate some of the deficiencies in the system.
61

U.W.O. SAFRAS system
P. G. Sutterlin Department of Geology University of Western Ontario London, Ontario N6A 3K7 CANADA
Introduction
The SAFRAS system is the direct result of a cooperative project initiated in the spring gf 1968. At that time, the Onkuio Department of Mines (now the Division of Mines, Ministry of Natural Resources) and the Department of Geology of the University of Western Ontario, on the basis of data which had been collected on silver deposits in Ontario, agreed to build a computer- processahle tile of these data The tile design and programming functions were to be carried out at the Univeristy under a Special Grant of the Geological Survey of Canada. The Special Grants themselves were a result of the recommendations of an ad hoc Committee of the National Advisory Commiwze on Research in the Geologial Sciences (Brishin and Ediger, 1967). the intent of which was to promote research in suppo*, of the National System concept enunciakd by the ad hoc Crmmi~tee.
It soon became apparent that, with a slight shift of emphasis, the project could result in the development of a number of computer programs which could he applied to sets of data other than just those pertaining to the Ontario silver deposits. It was then agreed that the project would conce”,rate on the development of a system to store, edit, selectively retrieve and otherwise manipulate a range of geological data by cotnpukx It was also stipulated that the system he as user-oriented as possible and that it be relatively easily transferable from one type of computer to another. It was with these considerations in mind that the SAFRAS system was designed and developed.
The SAFRAS system consists of twelve COBOL programs. The decision to use COBOL as a programming language was hased on kvo considerations. Due to the natux of much geologic4 datzz, a progrunming language with good charackr manipulation apabiliks was required. In addition, a programming language which could be used on a number of different computers necessitated the selection of a standard high-level language. In practice, it has been found that, despite claims to the contrary, not all COBOL compilers, even among different machines of the same manufacturer, are the same. However, the differences ax fewer than is the case with many other compilers.
62
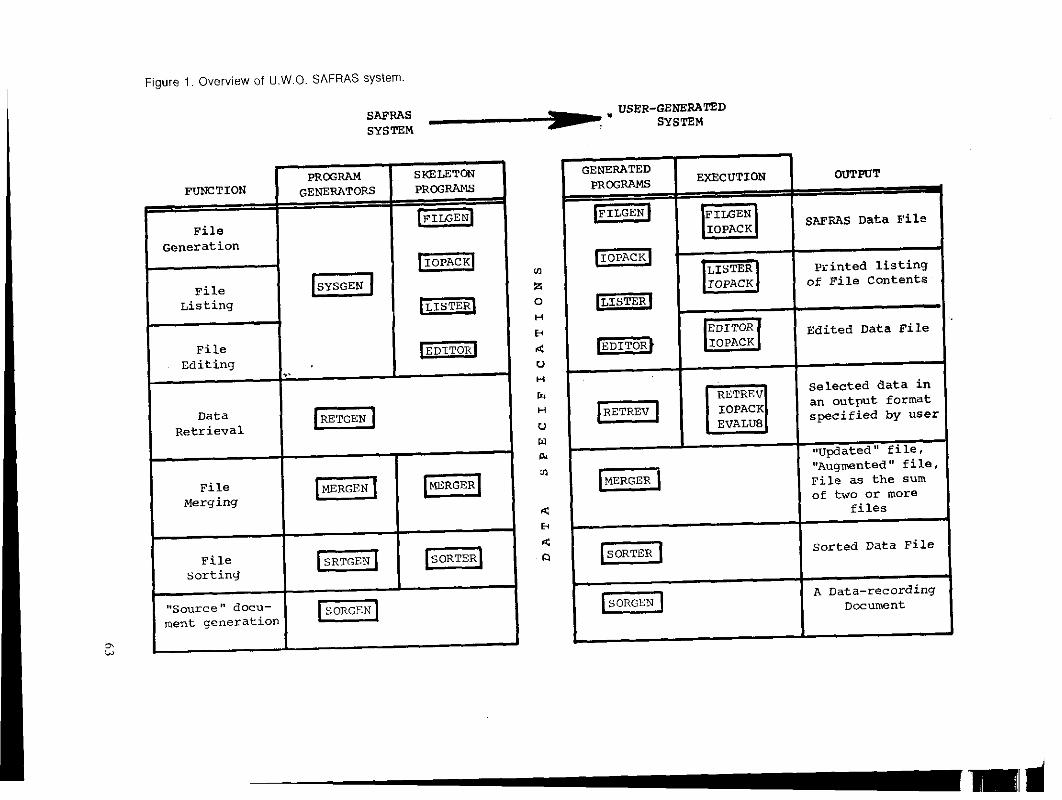
Figure 1. Overview of Ll.W.0. SAFRAS system
F"XCTION
File Generation
File Listing
File Editing
Data Retrieval
File Merging
File sorting
PFUXRAN GENERATORS
GENERATED GENERATED PR@XAMS PR@XAMS EXECUTION EXECUTION OUTPUT
m
SAFRAS Data Fil5
Printed listing of File Contents
Edited Data File
selected data in an 0"tput format specified by user
csu&&edm file, wAugnented" file, File as the sum of two clr inore
Sorted Data File
I
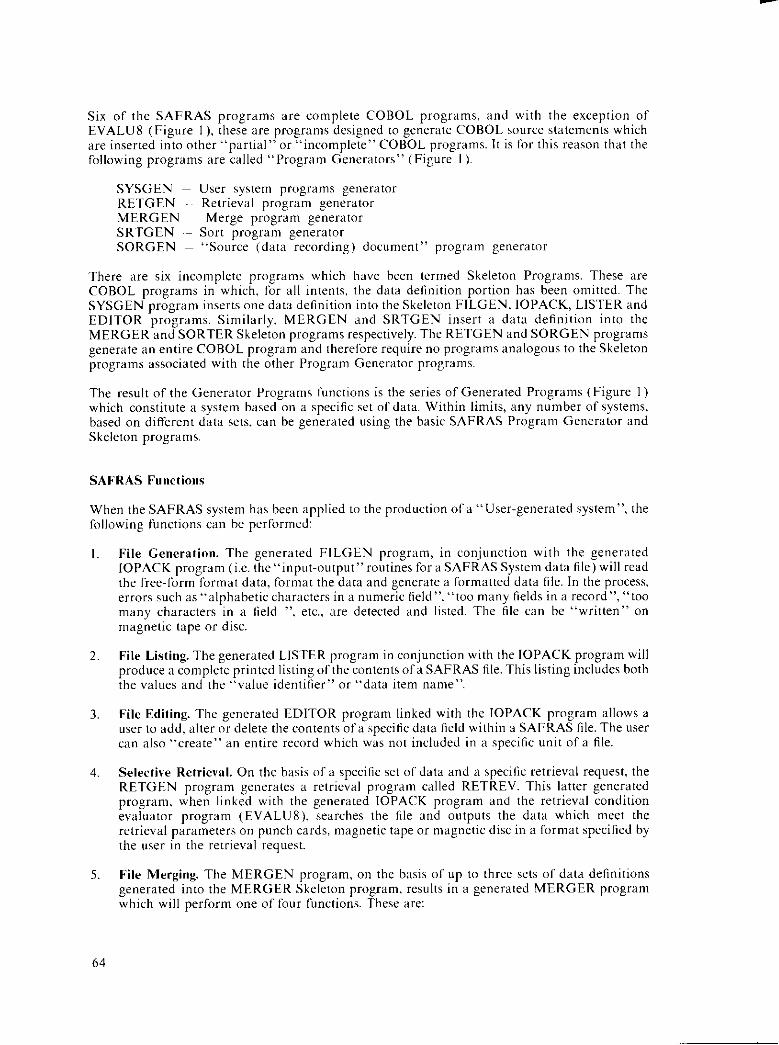
Six of the SAFRAS programs are complete COBOL programs, and with the exception of EVALU8 (Figure I ), these are progmrns designed to generate COBOL source statetnents which are inserted into other “partial” or “incotnple~e” COBOL programs. It is for this reason that the following programs are called “Program Generators” (Figure I ).
SORGEN ~ “Source (data recording) document” program generator
There are six incomplete programs which have been termed Skeleton Programs. These are COBOL programs in which, for all intents, the diva delinition portion has been omitted. The SYSGEN program inserts one data delinition into the Skeleton FILGEN, IOPACK, LISTER and EDITOR programs. Similarly, MERGEN and SRTGEN insert a data definition inm the MERGER and SORTER Skeleton progratns respectively. The RETGEN and SORGEN programs generate an entire COBOL program and therefore require no programs analogous to the Skeleton progratns associated with the other Program Generator programs.
The result of the Generator Programs functions is the series of Generated Programs (Figure I) which constitute a system based on a specific set of data. Within limits, any number of systems, based on different data sets, can be generated using the basic SAFRAS Progwm Generator and Skeleton programs.
SAFRAS Functions
When the SAFRAS system has been applied to the production of a “User-generated system”, the fc>llowing functions can he performed:
File Genetxtion. The generated FILGEN program, in con,iuxtion with the generated IOPACK program (i.e. the ~‘input-~utput”r~utines for a SAFRAS System data file) will read the free-form format data, format the data and generate a formatted data file. In the process, errors such as“alphabetic characters in a numeric field”. “too many fields in a record”, “too many characters in a lield “, etc., are detected and listed. The file an be “written” on magnetic tape or disc.
File Listing. The generated LISTER progratn in conjunction with the IOPACK program will produce a complete printed listing ofthe contents ofa SAFRAS file. This listing includes both the values and the “value identifier” or “data item name”.
File Editing. The generated EDITOR progran linked with the IOPACK program allows a user to add, alter or delete the contents of a specitic data lield within a SAFRAS file. The user can also “create” an entire record which was not included in a specific unit of a file.
Selective Retrieval. On the hasis of a specilic set of data and a specilic retrieval request, the RETGEN program generates a retrieval program alled RETREV. This lawx generated program, when linked with the generated IOPACK program and the retrieval condition evaluator program (EVALU8), searches the lile and outputs the data which meet the retrieval parameters on punch cards, magnetic tape or magnetic disc in a format specified by the user in the retrieval request.
File Merging. The MERGEN program, on the basis of up to three sets of data definitions generated into the MERGER Skeleton progrxn, results in a generated MERGER program which will perform one of four functions. These are:
64
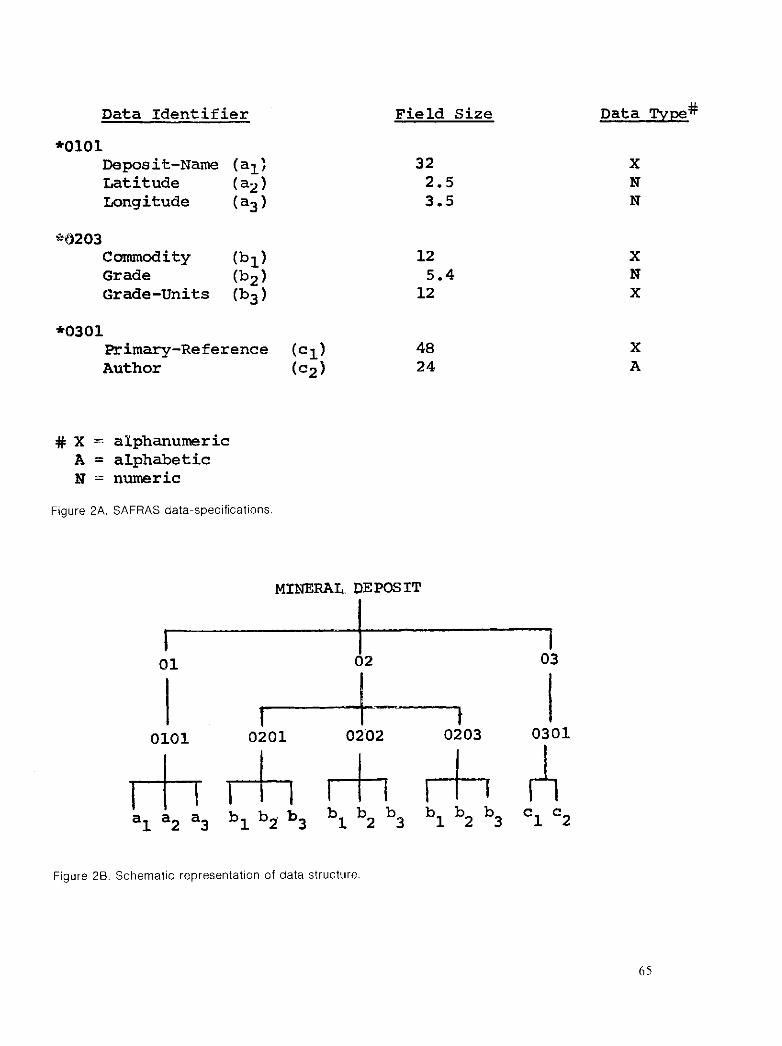
Data Identifier
*0101 Deposit-Name (al) Latitude (a21 Longitude (a31
'%203 Commodity Oql Grade b21 Grade-Units (b3)
*0301 Primary-Reference (cl) Author (91
Field Size Data Type#
32 X 2.5 N 3.5 N
12 5.4
12
48 X 24 A
# X = alphanumeric A = alphabetic N = numeric
Figure ZA, SAFRAS data-specifications.
MINEPAL DEPOSIT
a1 a2 a3 blb2 b3 bl b2 b3 bl b2 b3 cl c2
X N X
Figure 33 Schematic representation of data structure.
I. File Updating: If, say, the basic unit of a file is a mineral deposit, the MERGEN program will allow the user to add additional mineral deposits to an exiting fde which has the same data definition as the one included in the MERGEN program being used.
2. Subtile Creation: On the basis of two data definitions, the generaVzd MERGER program will produce a file which although basically the same as an “original” file, has fewer items of data in each basic unit of the file.
3. File Augment&ion: On the basis of three sets of daea definitions generated into the MERGER program, provision can be made to add data to an existing file. The distinction between this function and the EDITOR ftmtion is that file augmentation involves the creation of “new” data fields which were not in the “original” file.
4. File Merging: Again, on the basis of three sets of data definitions generated into the MERGER program, any two (or more ~ two at a time) SAFRAS files having the same basic file unit can be combined into a single file.
6. File Sorting. In order to merge two (or more) sequential files, the tile basic units must be in the same order. The generated SORTER program will sort one or more SAFRAS tiles into a sequence based on any numher of sort pammeters, For example, the deposits in a mineral deposit iile could he sorted according to latitude within longitude within country.
I. Source Document Generation. A document, containing all the required control character information to generate a SAFRAS tile from free-form format data input, can he produced in the form of a printed listing hy the generated SORGEN program. This document is, of sourse, different for each set of data.
Data Specifications
The data specifications, which describe a specific hierarchical data structure, are the link between the SAFRAS System programs and the User-generated System programs (Figure I ). It is these data specifications which are translated hy the Program Generator programs into COBOL data definitions. A simple set of data specifications, along with the structure they would represent are illustrated in Figures 2A and 2B respectively. The first two numhers which follow the asterisk at the head of each group of data item designators serves to identify that “set”. The second two “urnhers dictate the maximum numher of times a particular set can occur in each basic unit of the file, thus defining the hierarchy.
Summary and Conclusions
In order to provide a mechanism to support the SAFRAS system for potential users of the system, a copyright and a registered trade mark for “lJ.W.0. SAFRAS” were obtained and consigned to the University of Western Ontario. The University licenses the system for a nominal sum, in return for which the University commits itself to providing one year’s support. Although expenses have consistently exceeded revenue, it is felt that the advantages of a supported system, together with the low aquisition cost, have heen significant factors in encouraging ten organizations in Canada, the United States of America and Japan to license and use the SAFRAS system. What has been even more significant is that a continuing dialogue has developed with many of the system’s users which is resulting in modifications to the system which should ultimately hewfit all the users, present and future. This dialogue has heen expedited hy the Canadian Centre for Geoscience Data.
66
Brisbin, W. C., and Ed&r: N.M., Editors I967 A national system for storage and retrieval of geological data in
Canada: Nat. Adv. Comm. Res. Geol. Sci. (available from the Geological Survey of Canada, Ottawa), 175 p.
Burk, C. F., Jr. I971 Computer~based geological data systems: an emerging hasis for
international communication: Proc. 8th World Petrol. Congress, v. 2. p. 327-335.
I973 A new geological tool - the data: Earth Science Reviews, 9, p. 159-196.
Laznicka, P Laznicka, P in in MANIFILE: the University of Manitoba computer-based file of MANIFILE: the University of Manitoba computer-based file of
press p?SS World’s nonferrous metallic deposits: Canadian Centre for World’s nonferrous metallic deposits: Canadian Centre for Geoscience Data, Ottawa, Geological Survey of Canada Paper 75-20, Geoscience Data, Ottawa, Geological Survey of Canada Paper 75-20,
Sutterlin, P. G , and De Plancke, J. 1969 Development of a flexible computer~processahle file for storage
and retrieval of mineral deposits data: Proc. Symp. on Decision- Making in Mineral Expl. II, Feb. 1969, Univ. British Columbia, p. 11-42, II figs.
Sutterlin, P. G I971 The design of computer-processible information systems: in
Decision-making in the Mineral Industry, Canadian Inst. Min. and Metallurgy, Spec. v. 12, p. 399-403.
Williams, G. D., Dickie, G. J., and Steiner, J. I972 Computer storage and retrieval of geological data on coal deposits:
Proc. First Gal. Conf. on Western Canadian Coal, Res. Council of Alberta Info. Series. Series no. 60, p. 73.84.
67
Etat actuel du systkme d’information mis en oeuvre pour la gkochimie au Centre de Recherches Pktrographiques et Gbochimiques (CRPG)
Ph. Grandclaude Centre de Aecherches P&trogtaphiques
et Gbchimiques 15, Rue N. 4 des Pauvres Case Officielle No 1 54. Vandoeuvre-l&Nancy FRANCE
Introduction
La mix en place au Centre de Recherches Pktrographiques et Gkxhimiques d’un quantom&re ARL a perks, depuis 1960, de produire chaque annke plusieurs milliers d’analyses (majeurs et traces) de roches et de minkraux. Un tel volume de donnkes, trop abondantes pour 2tre communiqukes au moyen des supports d’information traditionnels exigeait de nouvelles prockdu- res et de nouveaux outils de stockage, traitemr:nt et communication de I’information.
En 1966, se tient & Nancy, sous I’kgide de 1’I.U.G.S. la premikre rkmion “pour le stockage, la recherche documentaire et le traitement automatique de dorm&s gkhimiques”, qui rassemblait les reprkentants d’organismes confront& sur le plan local i des problemes similaires et dksireux, sur le plan international, de faciliter la communication des donnks qu’il convenait de joindre aux don&s g&xhimiques.
C’est d partir de cette liste que fut con~u un “syst&me descripteur” des kchantillons gkxhimiques, prksente sous la forme d’un “carnet opCrationnel” utilisable pour la collecte des dorm&es de terrain et de laboratoire (localisation, conditions de prtlkment, environnement gkologique local, ige, description pktrographique et minCralogique). Ce carnet est utilisk au CRPG depuis 1968 par les gkologues demandeurs d’analyses. Join& aux dorm&x gCochimiques, les donnk correspon- dances sent centraliskes et stock&s sur ordinateur. Ceci en we de rendre accessible a une large collectivitk, pour des recherches aussi diversifiks que possible, des dorm&x gkxhimiques cr&s au depart B des tins particulikres.
Le Bilan en 1973
Plus de 30 000 analyses de roches et de min&ux ont ete produites par le quantomktre, I’analyse standard fournissant actuellement I7 Ckments dont 7 4kments de traces. Ces analyses sent effectukes dans le cadre de projets vari&, depuis I’etude syst&natique des massifs granitiques jusqu’a des t-tudes gkchimiques de series skdimentaires.
68
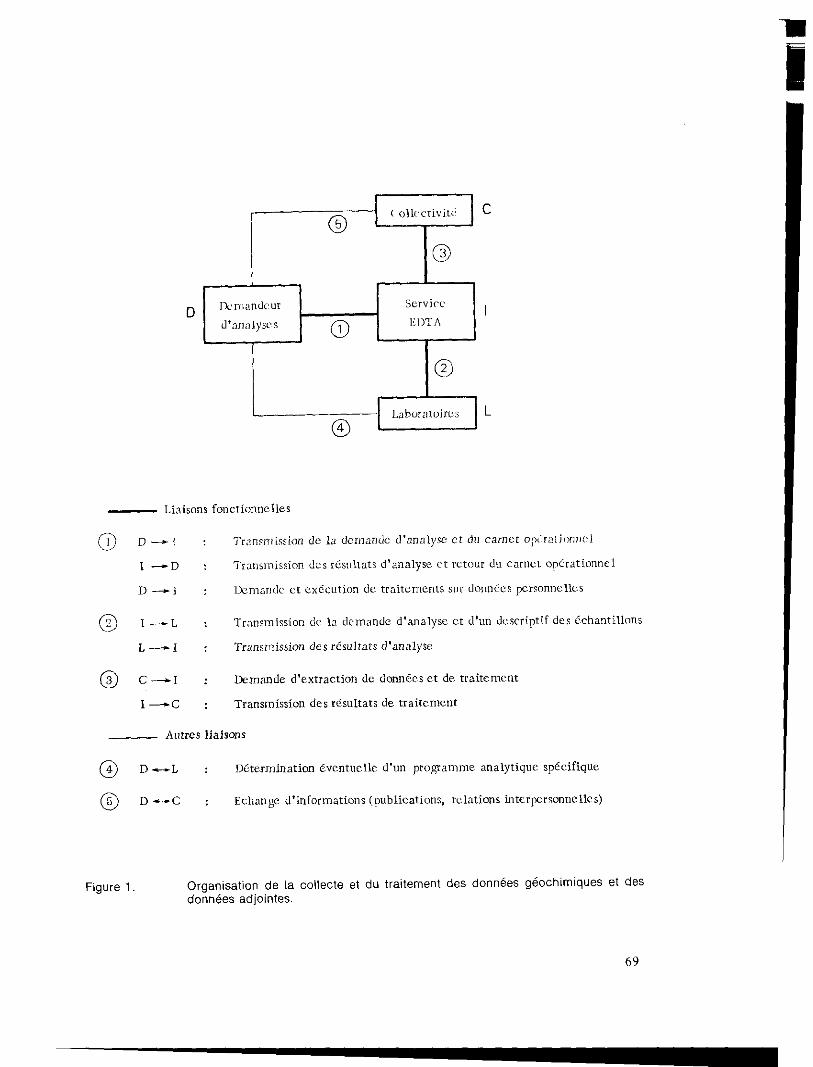
- Linisons fonctionneller
0 D-I : Tr;tnsmission de la demnndc d’nnnlyrc ct du carnet opir;~lJiX7JWl
I-D : Transmission dcs r~wltats d’analyse i‘t retour du cxnct opirationncl
D-i : lk2inandc et ex&xtion de traitements sur donnics jxrsonncllcs
@ I-L : Transmission dc In dcmandc d’analysc ct d’un dcscriptif des Cchanrillons
L-I : Transmission des r&ulrats d’annlyse
0 Cd1 : Demande d’exrraction de donnecs et de traitement
I-C : Transmission des rtsultafs de traitement
Autres liaisons
@ D-L : Ditermination 6ventuelle d’un pro~amme analytique spkifique
0 D-C : Ecbange d’informations (publications, relations inrerpcrsonnelles)
Figure 1. Organisation de la collecte et du traitement des donnks geochimiques et Ues donn&s adjointes.
69
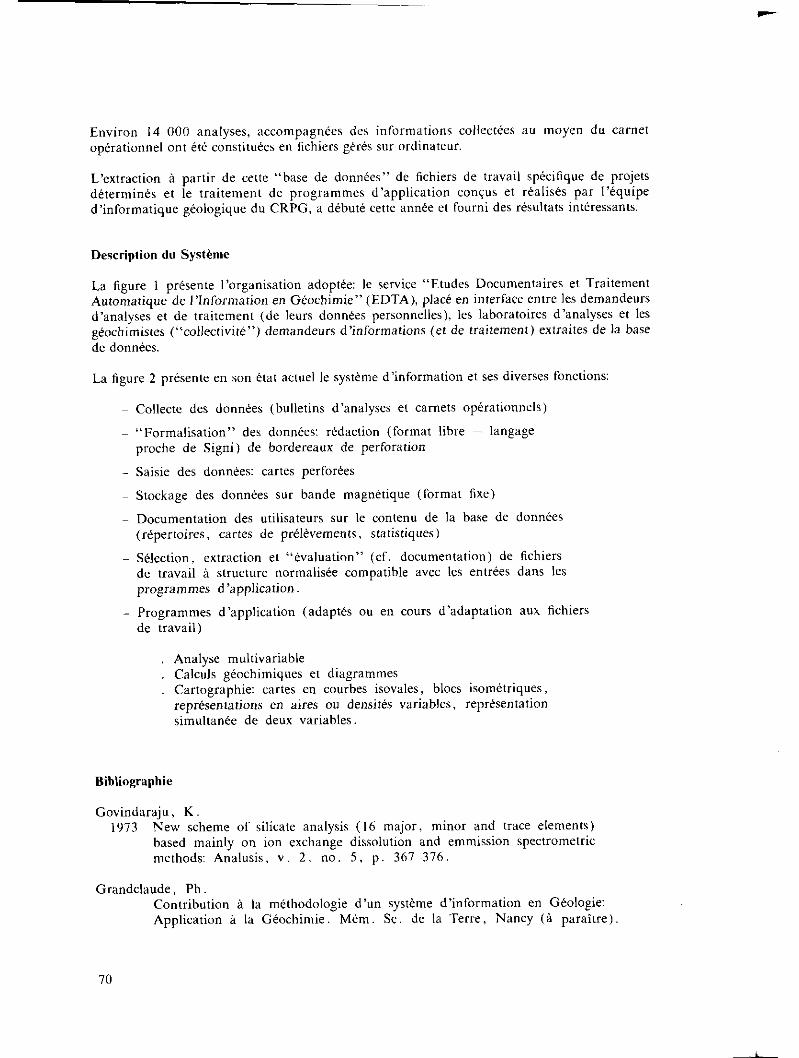
Environ 14 000 analyses, accompagn&s des informations collect&s au moyen du carnet operationnel ont &te constituCes en fichiers g&&s sur ordinateur.
L’extraction a partir de cette “base de donn&s” de fichiers de travail specitique de projets d&erminCs et le traitement de programmes d’application con$us et r&lis& par I’tZquipe d’informatique geologique du CRPG, a dCbutC cette am& et fourni des r&ultats int&ressants.
Description du Syst&me
La figure I pr&ente I’organisation adopt&: le service “Etudes Documentaires et Traitement Automatique de I’lnformation en G&xhimie” (EDTA), placC en inrerface entre les demandeurs d’analyses et de traitement (de leurs donnees personnelles), les laboratoires d’analyses et les gCochimistes (“collectivite?“) demandeurs d’informations (et de traitement) extraites de la base de don&es.
La figure 2 pr&nte en son &tat actuel le systeme d’information et ses diverses fonctions:
Collecte des dam&s (bulletins d’analyses et carnets op&rationnels)
“Formalisation” des dorm&es: ridaction (format libre - langage proche de Signi) de bordereaux de perforation
- Saisie des don”&: cartes perforCes
Stockage des dorm&s sur bande magnetique (format fixe)
Documentation des utilisateurs SW le contenu de la base de donn&es (r+ertoires, cartes de pr&l&ements, statistiques)
Wection, extraction et “&aluation” (cf. documentation) de fichiers de travail B structure normalis& compatible avec les entrkes dans les programmes d ‘application.
- Programmes d’application (adapt&s ou en tours d’adaptation aux iichiers de travail)
Analyse multivariable Calculs geochimiques et diagrammes Cartographic cartes en courbes isovales, blocs isom&triques, repr&entations en aira ou densites variables, reprCsenration simultanee de deux variables.
Bibliographic
Govindaraju, K 1973 New scheme of silicate analysis (I6 major, minor and trace elements)
based mainly on ion exchange dissolution and emmission spectrometric methods: Analusis, v. 2. no. 5, p. 367-376.
Grandclaude, Ph. Contribution B la methodologie d’un systeme d’information en Geologic: Application g la Gkochimie. M&m. SC. de la Terre, Nancy (B paraitre)
70
f Stuckage
Fichier g&&al (bare de donn&s) sut bande magnCtique
Visualisation II Cartes de
points Resultas Cartes en Blocs iso- St&&3 lmpos. Aires Graphique
list& isovaleurs meuiques ZOll& variables
Figure 2. Organigramme ge%ral simplifi6 de la constitution et de I’exploitation de la base de dorm&x du C.R.P.G.
71
lsnard, P. 1970 Analyse statistique multivariable des don&es g&ochimiques par
traitement autotnatique: Application au massit” granitiqw de la Marche Orient&. Sc. de la Terre, Nancy, 15, no. 2, p. 103-143.
La Rochc, H. (de) I968 L’evoltttion des tichiers g~ochimiques et leer adaptation i la
communication: CRPG, Nancy, dot. ron&o. , 6 p.
La Roche, H. (de) et Grdndclaude, Ph. I968 Un syst&ne descripteur des &zhantillons giochimiques: Pr&entation
du projet du &mitt! pour le Stockage, la Recherche Documentaire et ie Traitetnent Atttomatiqw de Donn&s G&ochimiques, CRPG. Nancy, dot ronio, 9 p.
La Roche, H. (de) I969 Enqttete SW la pr&ntation des dam&s g&xhimiques: CRPG, Nancy,
dot. ron& Fr. et An@., I6 p.
La Roche, H. (de) I970 Observations et don&es concernant les &chantillons g~ochitniqttes:
Notice d’utilisation du carnet op&tionnel et exemples-type. CRPG, Nancy, dot. ronko., 50 p.
La Roche, H. (de) I973 Le service d’analyse de roches et de min&atx: Courier de CNRS,
no. 8, p. 36-43.
Leymarie, P I970 Contribution aux tnethodes d’acqttisition, de repr&entation et de
traitement de l’infornution cn Gkologie. Sc. de la Terre, Nancy, m&moire no. 18, I70 p.
Mallet, J. L. Mkthodes et techniques de cartographic atttotnatique num&iqw. M&n. SC. de la Terre, Nancy, (A para!tre).
Masset, J. M. I973 Un syst&ne de visualisation des variations g&ogcaphiqttes d’ttn
param&e g~oiogiqtte. Mkm. Sc. de la Terre, Nancy.
72
Cnmputer processing of cartographic data
t. N Thorpe Experimental Cartography Unit Royal Calle@ of Art 6A Cromwell Place London, S. W. 1 UNITED KINGDOM
The Experimental Cartography Unit (ECU) is basically an organization carrying out expaimen- tal work in developing, using and assessing carto&raphic editing systems.
The systetn presently being developed consists of approximately I4 progratns which deal with data from the stage of digitization from base maps on a digitizing table, to the accurae replay of the processed and edited data on a higlvresolution flat-bed plotter, the output from this device being suitable for printing purposes.
The following is a brief description of each of the pqqatns:
On-line Digitization
An interactive program run on a PDP I I computer, via an interfaced D Mac digitizing table, which block-formats the coordinate data and associated feature code information of selected portions of a total map to be digitized onto a DEC tape. Illegal sequences of operations are prevented. Digitizing mistakes recognized by the operator at the time of digitizing can be corrected or edited out. Maximum and minimum values of feature codes and number of feature codes associated with each tnap element are checked and diagnostic messages given in cases of etTo1s.
The DEC tape is subsequently processed via a PDP 9 or I5 onto a high-density magnetic tape. This tape has a header block containing geographical, mnemonic, projectional and scaling information about the tnap that follows. The tape may contain more than one map sheet and each sheet is prefaced hy such a header block. The data on each sheet is stored as X-Y coordinates, either in the form of a line or a point.
This program checks each ofthe tnap sheets on a magnetic tape for the presence ofdigitized corner points and internal consistent y of character strings. Any errors present on the tape produce
13
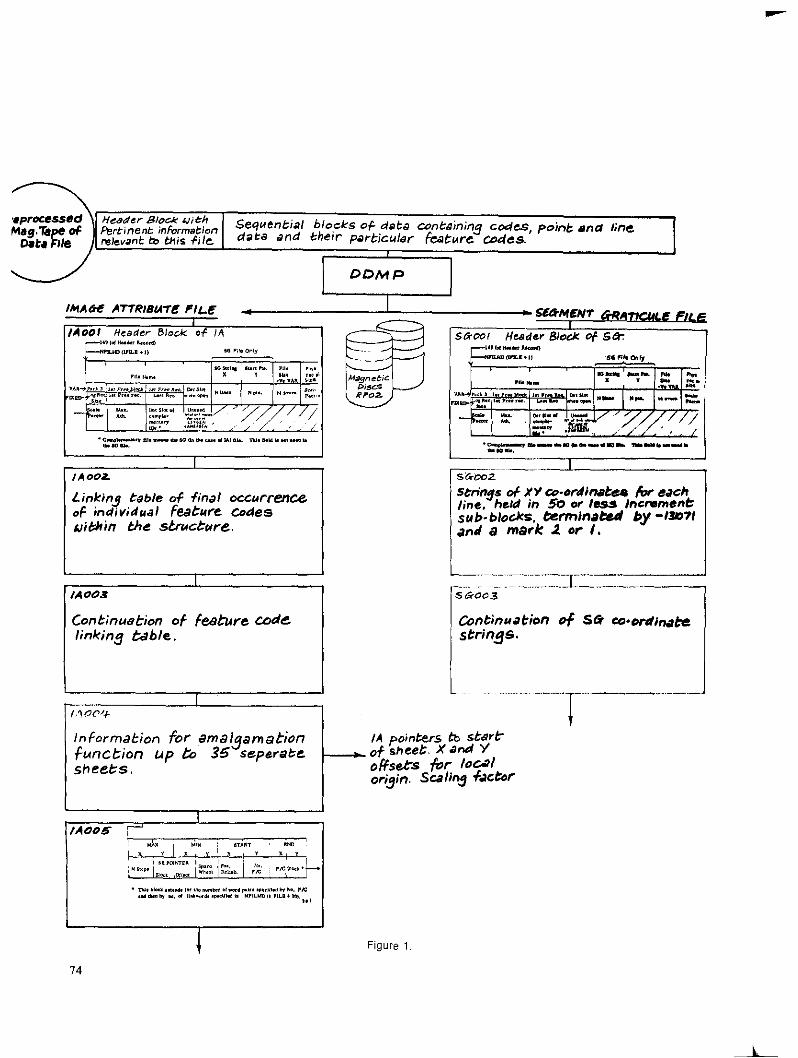
r -... ~~.~ .~.~..-- -... L--.--.--- s &ms
Continuation of SG a*or&m& strings.
information for amalgamation function up I% 35 stzpwate
t-
IA pointws b StJ& & sheet, A’ Jd Y
sheets. offset= for feat or;j;n, Sdhj f&30~
Figure 1.
diagnostic output and where possible are zwomatically corrected. The corrected tape has the header updated with the number of points, incremen~s,lines and maximum number of feature codes associated with any line or point on this sheet. This information is used in the preceding program to d&x random z~ccess areas on fixed or moving head discs. Reordering of the sheets on the tape is also available.
Line Start/End and Code Verification
Each map sheet is generally digitized by one opera~r and then just the starts and ends of lines with their codes arc redigitized hy a second operator. These two files are processed by the previous progmms to the svage where they are a~~orn~&illy compared to produce diagnostic output about any code differences, and line or point omissions, of one lile compared with the other. This technique produces a good check that all the lines to be digitized have been, and that their codes are whzi~ they should be.
Disc Editing
Online editing of the d~~a in the structure KI delete lines, points and change fez~~re codes cm elements of the map recognized by progmrn 4 to have possible errors.
Linking of Feature Codes
This program has the fxility to give a listing of all the elements of the map, with their starts and end points and their feature codes, plus the facility to produce a table, in blocks I and II of the Image Attribute file shown in Figure I, of fe~~ux! codes, and a pointer to the end of a ‘LAST IN FIRST OUT’ list. This technique allows efficient retrieval of elements of the map comaining particular feature codes or combinations of feature codes.
lnterwlive Graphics and Editing
This program displays the map on a CRT screen. It allows the display of the total map or selected regions at different scale: elemer~~s with seleaed feature codes or combinations of feature codes can be displayed at the selaxed scale, in various pecking and hatching pz~Werns, 11 is possible to direaly delete lines or points, or alter their fez~ture codes. Lines can be spli!, joined togethe! and even new lines directly inserted. Similarly poin& may be inserted. Various grids can be supwmposed on the screen represeming the geographical IoaGons, digilizing scale, or even screen coordinate systml.
Sheets that have heen checked and intcraaively edited can be amalgamated into larger files, This an be done in a vertical or horizontal sense, i.e.. a weather map of an area can be amalgamated with a geological or political boundary map or two adjacent geological maps may be amalgamated
15
together. Any number of such sheets can be added together in one operation of the progratn or subsequent operations.
Overlaying of Two or More Vertically Amal~dmated Sheets
The output from the previous progratn will in general contain lines that intersect. This can be envisaged using the weather and political boundary map quoted earlier. This program lowtes all line intersections and updates the structure to contain such lines split at these points of intersection.
Thus the output of this progratn will contain no line that intersects with any other line.
Logical Combination of Feature Codes
This progratn retrieves from the data structure two sets of elements with specified feature codes. It then produces a seqt~ence of pointers on the pxticular IA records that satisfy the BOOLEAN OPERATION specified for these codes.
The available operations include AND, ORR, NOT, and OXR. Having once produced a combination in this way one may combine this set with others as described above. These sets may be retrieved in any of the relevant prograns making up this system for further checking, or further processing by progratns described later.
Closed Area Recognition and Retrieval
Sets of lines that have hem developed by the previous program or a set of lines with a particular feature code may form a number ofclosed areas. A program exists to automatically recognize such closed loops and update the structure with AREA records that describe the area in a similar manner as lines are described.
These areas can be retrieved and displayed, areas can he measured, and a point can he associated with the areas within the closed loop, i.e. the point in polygon.
Unamalgamation of Data Sets
When a numher of vertical and horizontal amalgamations have hen performed and overlayed, the data set becomes quite large and possibly a little cumbersome for some applications. Similarly when two very large files have heen amalgamated and a edge-match problem exists, a small file in the region of the edge-match error is much easier to handle than the total tile. This progratn allows a selected rectangular area of a file to he created on a separate structure for further editing work hefore being reamalgamated into the final file.
Unformating of Disc onto Magnetic Tape
For plotting purposes and long-term storage the total disc structures can he dumped onto tape or selected elements tray he dumped. The sets that an be retrieved are the different feature code sets, the feature code combinations, and the area sets.
16
High-Accuracy Plolter The tape produced hy the previous program can be plotted on the high accuracy plotter by a ‘universal plotting package’ and the output is quite suitable for printing and publication pposes.
A number of other programs exist that have not hecn included in the ahove list, which are used for data reduction in the sense of salient point production alon& lines and then the recreation of the original points from these salient points hy splicing. Two programs exist for very close examination of the data on the disc in a block by block examination mode, and block by block editing mode.
11
Particular requirements for the Dutch WIA Earth Science Information System
T. de Heer IWIS-TN0 P. 0. Box 297 The Hague NETHERLANOS
S. W. Bie WIA, Stiboka P. 0. Box 98 Wageningen NETHERLANOS
The Geological Survey of the Netherlands and Netherlands Soil Survey Institute, in recognition of the considerable similarity of their tasks, have joined forces in development of an automated information system for earth science data (WIA). Preliminary discussions started in 1970, with a construction phase commencing in the auturrm of 1972. We envisage the framework of the system operating by the end of 1975.
The project is seen by the Dutch government as an expwiment in the more general problems of environmental and planning information systems. It is therefore our objective to make a generalized system, where ad hoc data structures and retrieval systems have no place. A close review of the data collected by the two surveys similarly illustrate the desirability ofa generalized Sp3ll.
Input Dala Requirements
We find that our main objection to nearly all existing data base managemau systans is that they are unable to handle satisfactorily “fre&mguage” information with variable record lengths and structures. So here we will concentrate on this problem.
The Geological Survey has at present about I25 000 logs ofshallow boreholes illustrated in Figure I, increasing by 10 000 per year. In addition, they have some 45 000 deep borehole records of similar type. The Survey requires most of these records to he available in an automated system. The recording and translation into numeric form of fixed format of all these data requires unacceptable inwstments of rnanpowr, time and money. Most critically there are not the kind of skilled personnel available and willing to do it. The alternative is to build a system which will
78
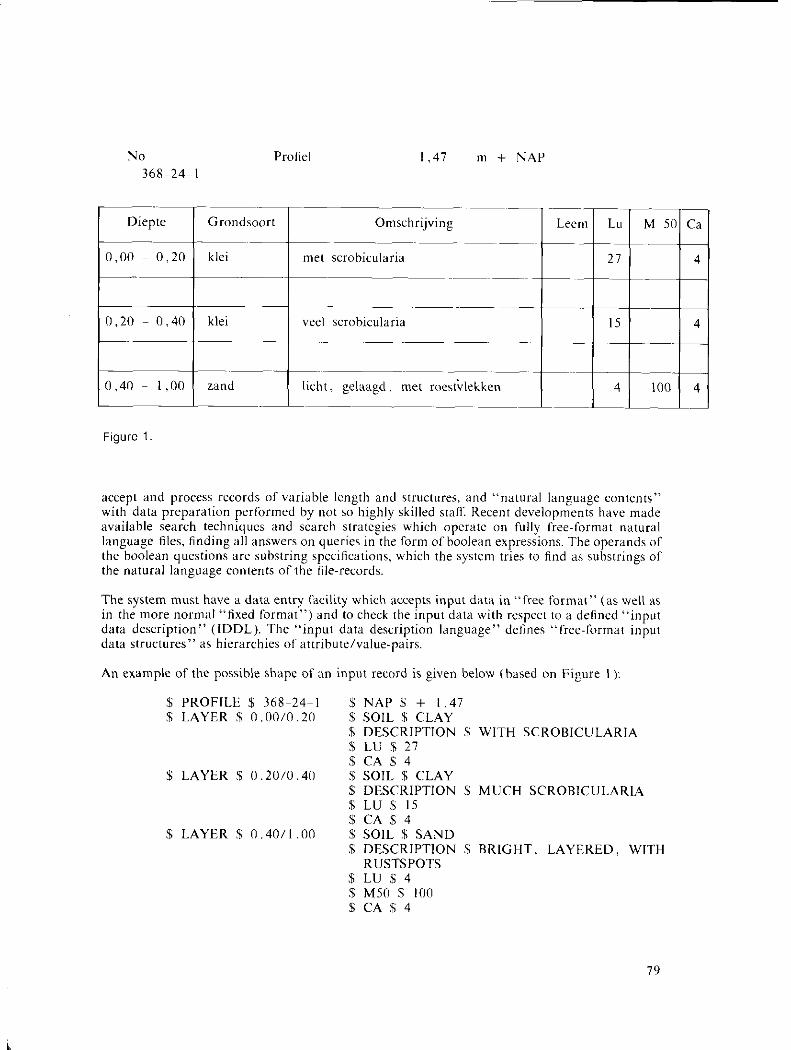
Figure 1.
The system must have a data entry fxility which xxpts input dau in “free format” (as well as in the more normaI “fixed format”) and to check the input data with respect to a defined “input data description” (IDDL). The “input data description lan~~~~e” data structures” as hierarchies of ~tttribut~/v~lue-stirs.
deiines “free-format input
An erdmple of the possible shape of an input record is given below (based on Figure I ):
$ PROFILE $ 368-24-l $ NAP$ + I.47 $ LAYER $ O.OO/O.20 $ SOIL $ CLAY
$ DESCRIPTION S WITH SCROBICULARIA $ LU S 27 S CA S 4
$ LAYER $ O.20/0.40 $ SOIL $ CLAY $ DESCRIPTION $ MUCH SCROBICULARIA s LU S I5 $ CA $4
$ LAYER $ 0.4O/l.OO $ SOIL % SAND $ DESCRIPTION S BRIGHT, LAYEKED, WITH
RUSTSPOTS $ LIJ $4 $ M5n $ IO0 S CA $4
79
NAME = “PROFILE”; VALUESET=“-2-l”; GROUP: l-‘ORMAT=FREE: MANDATORY NAME = “NAP”; SUB=(PROFlLE): VAL[J~SET=‘~N(~l~/5~0)“~ FORMAT=FREE;
MANDATORY: SINGLE NAME = “LAYER”; SUB=(PROFlLE): VALUESET=-Nl .2(0/12)$( i)‘$Nl .2((1/12)“:
GROUP: FORMAT=FREE; MANDATORY NAME = “SOIL”; SUB=(LAYER(PROFlLE)); VALUESET=(CLAY,SAND): FORMAT=FREE;
MANDATORY; SINGLE NAME = ‘cDISCRIPTION”; SUB=(LAYER(PROFlLE)); FORMAT=FREE; SINGLE NAME = “LU”: SUB=(LAYER(PROFlLE)); VALUESET=“I3”: FORMAT=FREE; SINGLE NAME = “M50”; i&m NAME = “CA”: idem
the set ofvalues allowed for that attribute (VALUESET = valuset specifications with structure code)
The system should accept and answer questions put to the systems hy the users as follows:
queries should he allowed in the form of boolean expressions
the operands of the boolean expression should specify a simple condition with respect to the value of a single attruhute
the simple conditions should, in addition to the normal relational expressions like NAP s l,5O,LU < 20 or DESCRIPTION = “WITH SCROBICULARIA”, provide the possibility of “suhstring specifications “, such as DESCRlPTlON.SU.“SCROBlC”.
A third reqirement is that the datehase system should he able to handle relations between the systemohjects (records) of the data sets such as:
relations between point-records and line-segments telling the system that a geolographical point lies to the right or to the left of a given line segment with respect to the direction of its point-chain representation
Fourthly the data-base system must have a two-directional interface with a tnap drawing systan which may consist of small computes and drawing machines, display units and tnap digitizers and to be available for inter-active work.
b’ifthly! we desire that the DBMS have a high degree of portability.
Our data handling involves the scanning of large and varied data sets. We do not have manpower available for standardization and coding ofgeological horelogs. We need a system that can accept and process natural language of vxiahle lengths and structure and offer powerful input checking procedures. To these specilications we wish to construct or modify an earth science information systan
81
Land-use planning aided hy computer cellular modelling/mapping system to combine remote sensing, natural resources, social, economic, and cadastral data
Harry W. Smedes United States Geological Survey Building 25, Federal Center Denver, Colorado 80225 UNITED STATES OF AMERICA
Land-use planning, land-management, and evaluations of the environmental impact of specific changes in land use require a consideration ofthe total environment. Included are map, point, and tabular data of such varied ztttrihutes as land-cover or terrain types; surfidce and subsurface natural physical features such as slope, landform, lithology, thickness and natu~ of surficial deposits, surfxe and suhsurfxe hydrology, vegepdtion, soils, wildlife habitat, and rzmgeland quality; ecology; social-economic features such as income, ethnic concentrations, and available labor skills; and point features such as locations of key facilities,
Some of these types of dztta can be acquired by remote sensing, and others trust be acquired from conventional souses. In order to consider the total environment, we must accelerate the acquisition of pertinent data. However, remote sensing and each of the many separate and necessxy disciplines whose sound basic data are essential to this total land-use decision-making have lxgely developed independently. Consequently, many of the available data xe peer-oriented and not readily comprehensible to users outside each discipline. Therefore, there is an urgent need to devise a system of combining and manipulating these new and existing data, and to present them in understandable form.
This paper pxsents a means for combining and zmalyzing these diverse types of environmental data in a common format by way of a cellular composite computer mapping system. In experiments in Jefferson County, Colomdo, and in southeastern Missouri, this systetn is effectively h&g used as an aid in working toward the timely solution of such commonly occurring land-use problems as selecting optimum sites for: acquisition of c~pen-space and greenbelts, sanitary land-fill, sewage trezttment lagoons, septic tanks, and housing developments.
Each attribute that is considered important in this land selection procedure (i.e., geology, soils, etc.) is mapped over the entire uea. Each resulting conventional tnap is cellularized to produce a cellular matrix map. The values ascribed to each cell xp~esent the characteristic of the selected attribute for that pztrticular rectangular land xea.
x2
Cellular map matrices can then be quantitatively weighted, manipulated and combined according to land-use strate&ies determined hy the local planners. Alternative solutions can he tested and evaluated. Later, using any one map as a dependent variable, an investigator can make a multiple regression analysis of the remainin& independent vxiahles (tmaps) to determine the possible predictable relations hetween tnaps, for example determining the relation of health to environ- mental factors. In addition. sensitivity analysis can be performed. that is. an analysis of the degree to which the result reflects changes in the weights assigned to a specific attribute. This analysis can give insights into the minimum turnher or minimum acc~rq of attributes needed to make the optimum decision.
Especially important is that the County and State users have heen actively involved in the design, evaluation, and evolution of these tests from the start. ln Jefferson County, Colorado. users plan to take over the project at the completion of the research phase,
Whereas, each aspect was formerly considered separately, the present systetn enables them to he combined and manipulated for analysis; results have heen synergistic.
This systetn involves the use of cellular data in digital format. Developments in retnote sensing enable us to use computa (programmed with rnultispectr~l cellular digital dau from xnsors in satellites and aircraft) to tnap such terrain classes as water, vegetation, and soils, as well as changes in land coxr. I envisage that these thematic maps an soon be linked as an important direct input into the composite cotnputer mapping system.
Acknmvledgnwnts
These studies are sponsored by the Ll S. Department of the Interior Resource and Land Information (RALI) Program in cooperation with the Missouri Geological Survey. the Federation of Rocky Mountain States, Jel?erson County Open Space Advisory Committee and County Pluming Department: the Colorado School of Mines, and the citizen’s group Plan Jeffco.
Of the many people who contributed to this study, I wish especially to thank Douglas Mutter, George Nez, Larry Salmen, John Reed, and the late Edwin Lutzen.
Appendix
The particular cellular mapping system used was the Composite Computer Mapping (CCM) system developed hy the University of Utah for the Economic Development Administration ofthe Department of Commerce. The original programs were written for UNIVAC I I08 computers. They have heen rewritten for use with CDC 6400 series cotnputers and are presently being rewritten for IBM ttnd for PDP- IO con?pwr~.
Hachtnan, F.C. , Bigler, C. and Weaver, R. I971 Report on the implementation of composite cotnputu mapping:
Bureau of Economic and Business Research, Centre for Economic and Community Development, University of Utah, Salt Lake City% Utah, U.S.A., 227 p.
R3
Advantages of using a generalized system to manage geological data
G. D. Williams Department of Geology University of Alberta Edmonton, Alberta T6G ZEl CANADA
The terms ‘data’ and ‘information’ ue sometimes used interchangeably, and sometimes attempts are made to separate objective, reproducible facts (‘data’) and the conclusions drawn from them (‘information’). It ran he shown however, that ‘data’ and ‘information’ are puts of a hierarchy ofknowlcdgc in which any element may he ~ith~r~d~~~‘o~‘infornl~ti~ll’(Figure I ). For example, a surveyor uses ‘data’ in the form of inswument readings. angles and lengths, zmd produces ‘information’ in the form of point locations and elevations. A geologist may use, as ‘data’, this information, in conjunction with information produced by chemists, petrographers and others, process them and produce ‘information’ pertaining to the size, shape, type and origin ofa mineral deposit, for example. This geological information, in turn may become ‘data’ for subsequent processing and ultimate production of tnore new ‘information’. The distinction between ‘data’ and ‘information’ thus depends entirely upon our point ofview, and the degree of reproducibility (or ohjeclivity) of any ‘data’ depends upon their position in the hierarchy.
Many geological data can only he recorded with a low degree of precision, and in a very large number ofcases, particularly in field geology, it is easier and more convenient to record only the conclusions drawn and inferences made, rather than the observations which led to the conclusions and inferences. In this regard, the field geologist usually functions as an interactive analog cotnputer, inRrpreting ohserwtions as they are made and drawing conclusions from them, hased upon his training, experience, personal hias and the influence of lord1 conditions under which he is operating. In many cases the observations made and stimuli received hy the geologist do not lend themselves to being recorded as data; consequently only the conclusions are recorded, often in map or other graphic form.
Although this procedure is undouhwdly effective in many cases, it is also extremely dangerous, hecause it may lead to neglecting even those observations which can be recorded for future study. The result is that at some later time, it may not be possible to verify the validity of the conclusions, perhaps in the light of new dat;i or changes in geological philosophy. Even more crucial is the possibility that a critical item of data may not have been recorded, either through oversight or hecause it was so obvious at the time the observations were heing made,
The use of computers to manage geological field data has focussed attention on the need to he systematic in the collection of the data. It has also hecome apparent that both factual observations, and the conclusions based on them should be recorded and distinguised as clearly as possible.
84
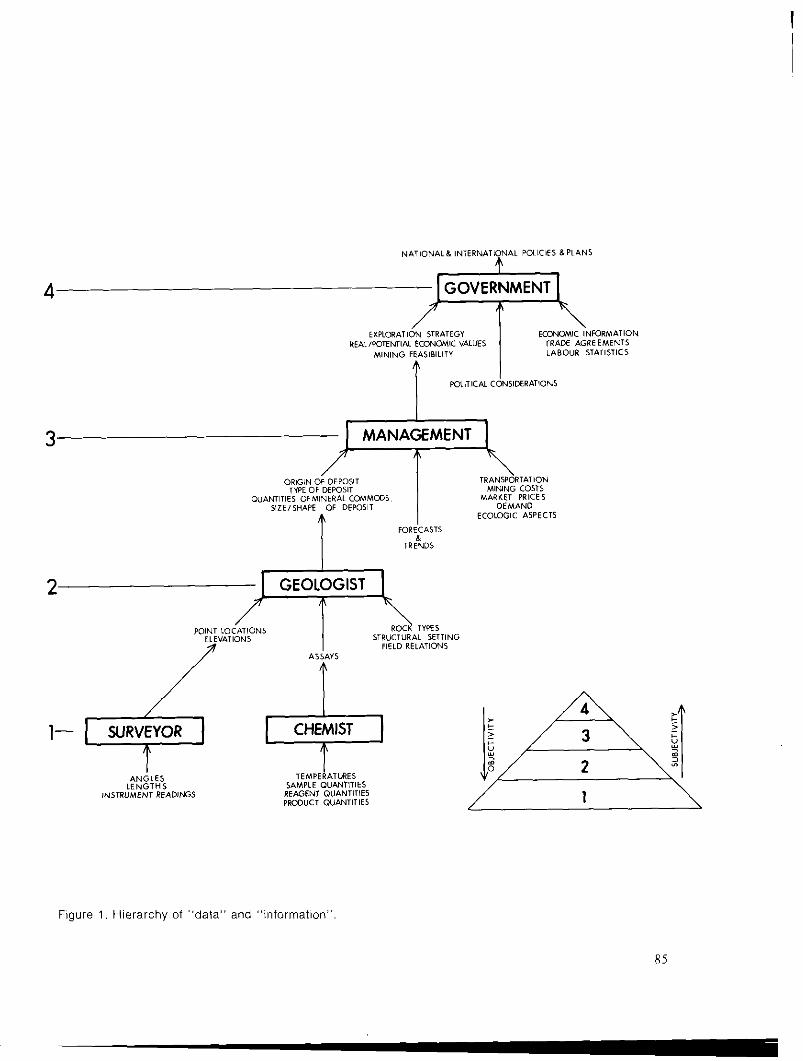
2 YJ=Px
/ 1 \
Figure 1, Hierarchy of “data” and ‘%formalion
Only a finite, small number of operations can be performed on data:
I Collection 2. stomge 3. Updating 4. Rearrangement 5. Retrieval 6. Display 7. Analysis
Once data are collected, using whatever techniques are necessary, they may be subjected to any of these operations in any sequence. For example, data may be displayed (as lists, charts, maps, etc.) before or after updating, rearrangement, or analysis; errors are often detected by analyzing or displaying the data or analytical results; rearrangement, retrieval and display of selected items may indicate what new types of data should be collected, and so on. Where the quantity of data is relatively small, it is possible, and often convenient to go directly from collection to display and analysis without consciously considering the intervening operations. Indeed, many data are collected specifically to fit predetermined display or analytical schemes. Much of the collection, storage, display and analysis of geological field data for example, typifies this situation. This procedure becomes inefficient or unworkable, however, it?
I. The quantity of data becomes very large
2. The data are collected, even by a single individual, over a considerable period of time, or
3. The data are collected by several individuals in succession over a long period of time, or simultaneously owr a large geographic area or from diverse souses.
To forestall these problems, a systematic formalized procedure must be used to handle the data collected, This involves building an organized structure for the data (a data file) and emphasizing the four managanent functions listed above (storage, updating, rearrangement and retrieval). Unfortunately, many geologists seem to believe that the way data are collected in the field (codes, input documents used, etc.) determines the way in which they can be processed, or that the kind of storage and retrieval (management) system determines how the data must be collected in the field. Although it may be convenient to record data in formats or on special input sheets which will facilitate subsequent computer processing, the processes and procedures involved in data collection are for the most part entirely separate from those involved in data managetnent, and linking these two aspects merely imposes additional hardships and constraints on the field geologist. Whereas geological field data are undoubtedly unique in many aspects, the problems of managing them ax not.
Data files may be managed either by constructing an ad hoc system tailored specifically to the dava in the file and the perceived or anticipated uses to which they will be put, or hy making use of a generalized management system designed to handle a wide range of data files and types.
An ad hoc system can he wry efficient in its use ofcomputer time, but it normally requires the user to have a considerable atnount of computer knowledge and experience, or that he have access to a progratnmer or systems analyst who is knowledgeable in the user’s speciality. The expense associated with anything more than the very simplest ad hoc system is usually quite large, because each operation performed on the file, be it entry of new data, retrieving and sorting or correcting (updating) data, requires the writing of a separate program or programs, and programming costs are high. Moreover, the builder usually finds that after a file has been partially constructed, he wished to change it in some way - add or delete data items, use different formats for smne items, split items into two or more, etc., and for an ad hoc system, this almost invariably requires
86
complete redesign and repro&ramming, with attendant expense and loss of time, effort and sometimes information. Unfortunately, there is every likelihood that the builder will want to make further changes when the ‘new’ file is partially constructed, and this procedure may be repeated several times, or the builder may decide to proceed using a system which is less than adequate. Expenses a~? likely to be high, regardless of the procedure adopted.
Generalized data managetnent systems have been defined as “....user-oriented, generalized software packages designed for the maintenance of and selective retrieval from...tiles of various types and structures. The primary goal of these systems is the ability to manipulate data files, performing functions related to file definition, tile creation, file interrogation and file maintenan- CC.” (Dolan et al., 1970). Key phrases in the detinition include:
I. “user-oriented” the user should be able to manage his own data without having to hecome a computer expert first, or without continuing assistance from professional p~OgEt”l”l~X
2. “files of various types and structures” although most generalized systems have been designed for business applications, they can often be used equally well for scientific purposes; a few have been designed specilically for scientific uses.
3. “functions related to file definition, tile creation, file interrogation and file maintenan- ce” ~ a good system will assist the builder with all aspects of data management, from defining and creating a tile to selective extmction of data items from it. Not all systems perform all functions with equal success; some systems may have good retrieval capabilities but may be woefully we&k in their file-building or updating functions, or vice versa. For scientific a pplications, a system should be able to retrieve data in forms which can be used directly as input to analytical or display program and packages. A good system is well balanced.
At the present time, there are several hundred systems available which purport to be “generali- zed’. Some are distributed by hardware manufacturers and some are marketed by companies specializing in software. The latter often have a fairly broad compatibility with different types of computer hardware, in contrast to the former.
The cost of acquiring a generalized data management system varies as widely as the range of services provided, from ahout $3OOtl to $50 000, and the most expensive is not always the best for a puticular application. Obviously the anxunt of anticipaed use must be able to justify the cost of acquisition, which on lirst inspection may seem to be inordinately high. However, when costs are being considered, it must he remembered that many thousands of dollars may have been spent to collect the data, and that many thousands more can very quickly be spent for salaries of programmers, analysts and geologists in trying to make a poorly-designed or otherwise recalcitrant system operate satisfactorily, not to mention the indirect costs of frustration created and time lost in the process.
Finally, on the subject of costs, it is totally unrealistic to believe that the use of any kind of computer data managetnent system will lower the absolute costs related to using any collection of data. However, although absolute costs will normally increase, an effective system will increase cost efficiency, lower cost per unit of operations, and provide the opportunity to undertake tasks which otherwise would have been impossible to contemplate.
87
Boehm, B. W. I973 Software and its impcl: a quantitative assessment; Datamation,
May, 1973, p. 48-59.
Brisbin, W. C., and EdjEer, N. M., Editors I967 A national systek for storage and retrieval of geological data in
Canada; National Advisory Committee on Research in the Geological Sciences, Canada, Geological Survey, I75 p.
DoIan, I970
Madill, I971
Moody, I972
F. T., Dust, N. H., and Woodcock, J. R. Evaluation of generalized data management systems; Internal Report, University of Calgary, Calgary, Alhata.
J. P., and Kuss, J. Study and recommendations for acquisition of generalized data management systems; Internal Report, Simon Fraser University, Burnaby, British Colunhia.
D. W. Applications of generalized information systems to the storage and retrieval of geological and geographic information; Proc. 24th Int. Gcol. Congress, Section 16, p, 161-16X.
Roddick, J. A., and Hutchison, W. W. I972 A computer-based systan for geological field data on the Coast
Mountains project, British Columbia, Canada; Proc. 24th lnt. Geol. Congress, Section 16, p. 36-46.
Williams, G. D., Dickie, G. J., Gordon, T. M, , Green, H. A. ~ Kelly, A. M. I972 ~Future development of the SAFRAS generalized data base
management system; Internal Report, Canadian Centre for Geoscience Data, Canada, Geological Survey. Ottawa,
88
Genlogic Retrieval and Storage Program (GRASP)
Joseph Moses Botbol and Roger W. Bowen United States Geological Survey National Cmtre Mail Stop 904 12201 Sunrise Valley Drive Reston, Virginia 22092 UNITED STATES OF AMERICA
The U. S. Geolo&ical Survey developed a Geologic Retrieval and Storage Program (GRASP) in response to WI immediate need Yor interactive oil and gas pool data processing. The design philosophy of GRASP was largely governed by four parameters: complete systctn portability, immediate data access simplicity of operation* and geoscience orientation. There are 400 variables ror each pool in the oil and gas data lile. In addition. there is a graphics lile containing the boundary vectors for each pool. The files are linked via a unique identilication number. Tahulx data ue input to GRASP via a twin magnetic tape cassette terminal or, if the data are computerized, hy rel’ormatting. Graphics data are input via a cathode ray tube (CRT) and drum-scanner technique. Output f’rom the systetn is primarily via CRT, although future plans call [or the use of’other peripheral output devices that can he addressed from the CRT.
Ahout two years ago. the U. S. Geological Survey determined that hatch storage and retrieval of tahulu data were inadequate to meet progratntne demands. Furthermore, as geologists traditio- nally use maps for graphical representation of’ their data, any pro,jccted storage and retrieval systetr would have to have the capability ot” generating maps.
The U. S, Geological Survey, the American Association of Petrolurn Geologists, and the University of Oklahoma, working on a cooperative oil and gas pool data bank project, evaluated tnany ‘in-house’ and commercially available information systetns and decided that modilication of any existing system would he both conceptually and mechanically too conlining. The most efficient route, that ofdevcloping a Geologic Retrieval and Storage System (GRASP) that had the ability to manipulate both tabular and graphics data, was adopted by the U. S. Geological sumy.
The design philosophy of the GRASP systetn was governed by the rollowing considerations:
I. Complete portability. The system can he installed on any system that has a standard ANSI FORTRAN IV compiler.
2. Immediate data access. The system was designed to he implemented in a time-sharing mode. This, ol’course, does not preclude its optxation in hatch mode.
89
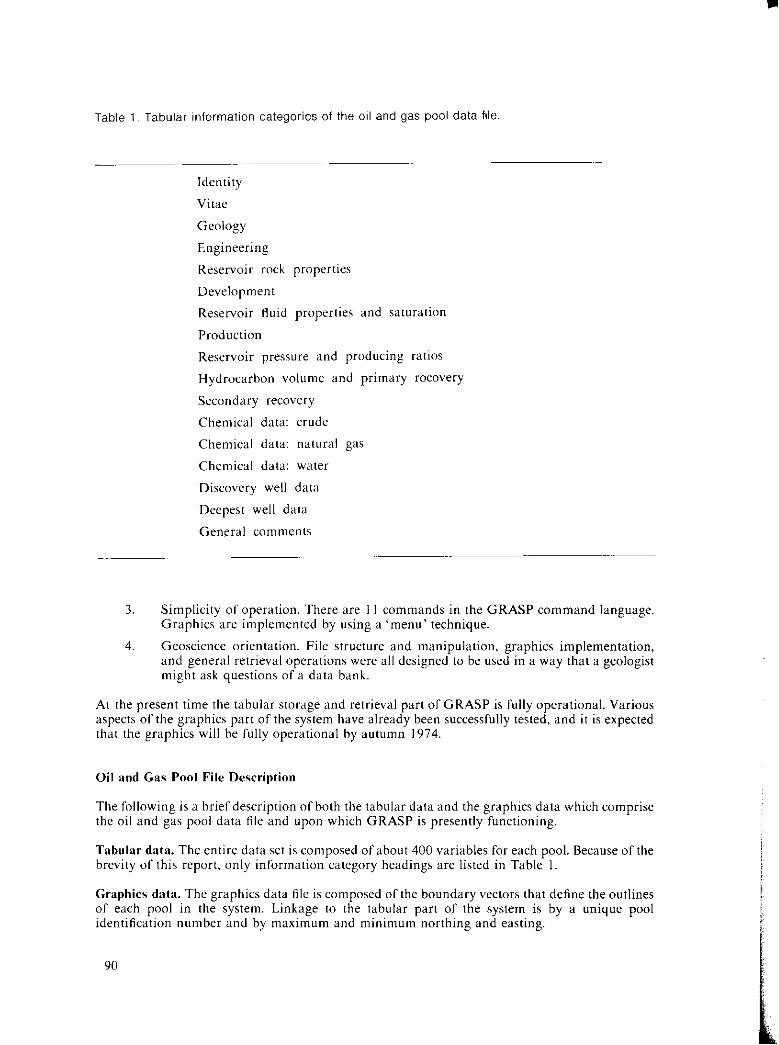
Table I. Tabular information categories of the oil and gas pool data file.
Identity
Vitae
Gfd0gy
Engineering
Reservoir rock properties
Development
Reservoir fluid properties and saturation
Production
Reservoir pressure and producing ratios
Hydrocarbon volume and primary recovery
Secondary recovery
Chemical data: crude
Chemical data: natural gas
Chemical data: veer
Discovery well data
Deepest well daa
Gentxal c”“lments
3. Simplicity of operation. There are I I commands in the GRASP command language. Graphics are implemented hy using a ‘menu’ technique.
4. Geoscience orientation. File struc-,ure and manipul~lion, graphics implementation, and general retrieval operations VJWS all designed to he used in a way tha a geologist might ask questions of a data hank.
At the present time the tabular storage and rfz~rieval part of GRASP is fully operational. Various aspects of the graphics part of the system have already been successfully lewd, and it is expected that the graphics will be fully operational hy autumn 1974.
Oil and Gas Pool File Description
The following is a briefdescription ofb~~h the tabular data and the graphics data which comprise the oil and gas pool Dada file and upcm which GRASP is presently functioning.
Tabular data. The entire data set is composed of about 400 variables for each pool. Because of the brevity of this report, only information category headings are listed in Table I.
Graphics data. The graphics data file is composed of the boundary venders thaw define the outlines of each pool in the system Linkage to the tabular part of the system is by a unique pool identification numher and by maximum and minimum northing and eating.
90
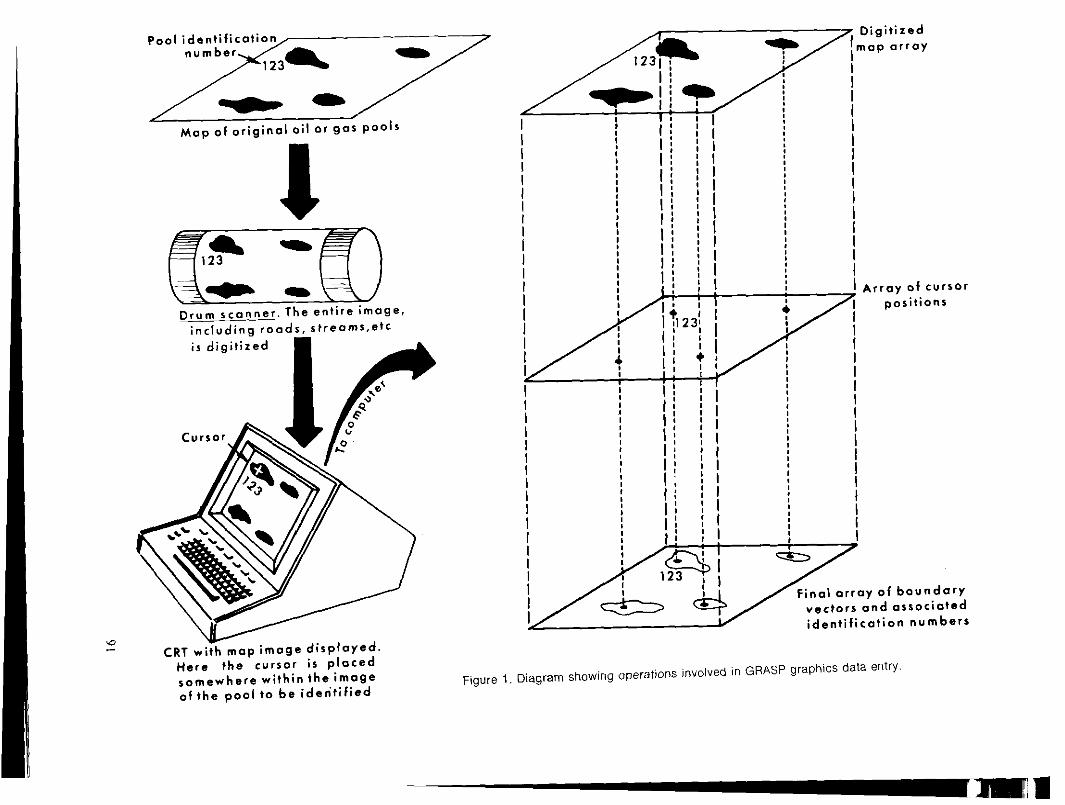
91
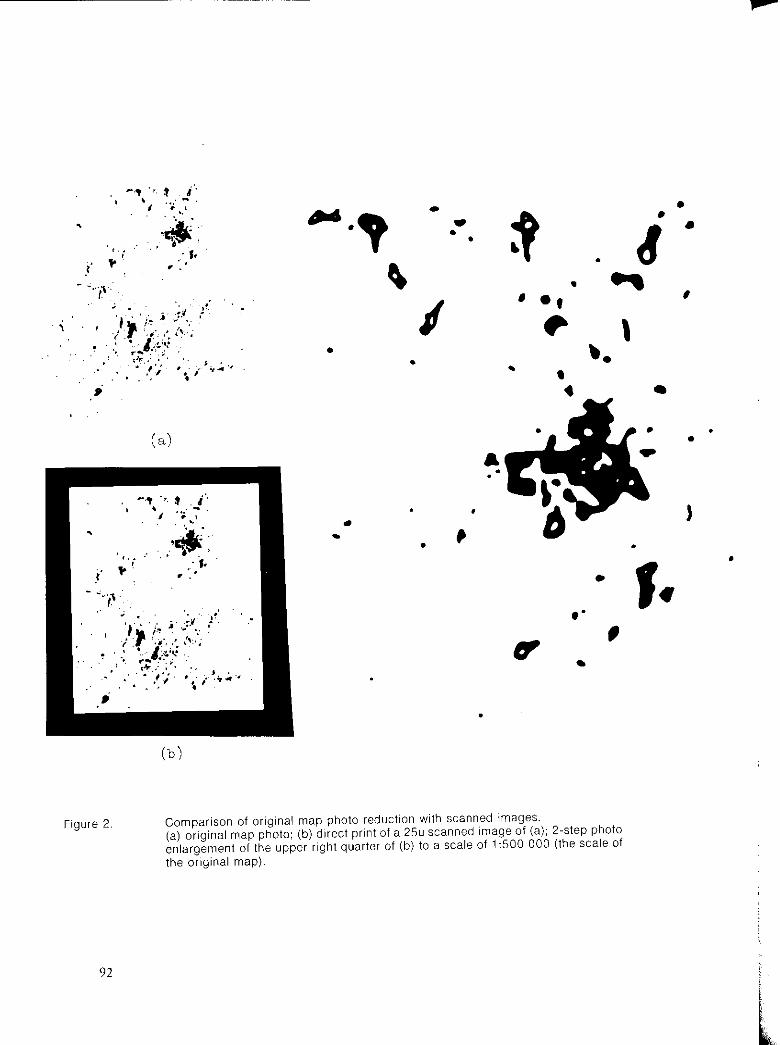
.
Figure 2. Comparison of original map phoio reduction wiih scann,ed images. (a) original map photo; (b) direct print of a 25~ scanned Image of (a); Z-step photo enlargement of the upper righi quarter of (b) to a scale of 1:500 000 (the scale of the original map).
92
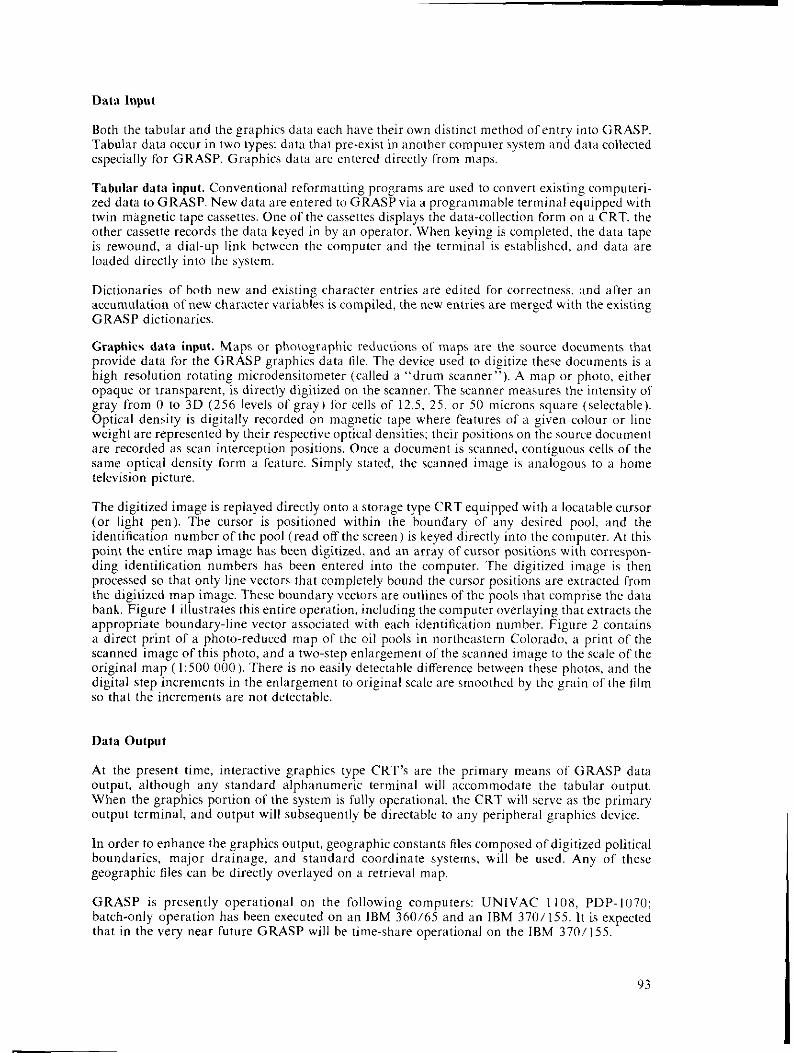
Data Input
Both the tabular and the graphics data each have their own distinct method ofentry into GRASP. Tabular data tocar in two types: data that preexist in another computer systetn and data collected especially for GRASP. Graphics data ue entered directly from maps.
Tabular data input. Conventional reformatting programs are used to convert existing compute& zed data to GRASP. New data are entered to GRASP via a programmable terminal equipped with twin tnLtgnetic tape cassettes. One of the cassettes displays the data-collection form on a CRT. the other cassette records the data keyed in by an operator. When keying is completed, the data tape is rewound, a dial-up link between the computer and the terminal is established, and data are loaded directly into the system.
Dictionaries of hoth new and existing character entries are edited for correctne&, and after an accumulation of new character var~ahles is compiled, the new entries are merged with the existing GRASP dictionaries.
Graphics data input. Maps or photographic reductions of maps are the source documents that provide data for the GRASP graphics data lile. The device used to digitize these documents is a high resolution rotating microdensitometer (called a “drum swmer”). A tnap or photo, either opaque or transparent: is directly digitized on the scanner. The scanner meaura the intensity of gray from 0 to 3D (256 levels of gray) for cells of 12.5, 25, or 50 microns square (,selectable). Optical density is digitally recorded on magnetic tape where features of a given colour or line weight are represented hy their respective opt&l densities; their positions on the source document ax recorded as scan interception positions. Once a document is scanned, contiguous cells of the sane optical density form a feature. Simply stated, the scanned image is analogous to a home television picture.
The digitized image is replayed directly onto a storage type CRT equipped with a locatable cursor (or light pen). The cursor is positioned within the boundary of any desired pool, and the identilicdtion numher of the pool (read off the screen) is keyed directly into the computer. At this point the entire tnap ima&e has been digitized, and an array of cusor positions with correspon- ding identification nunhers has been entered into the computer. The digitized image is then processed so that only line vectors that completely hound the cursor positions are extracted from the digitized tnap image. These boundary vectors are outlines of the pools that comprise the data bank. Figure I illustrates this entire operation, including the computer overlaying that extracts the appropriate boundary-line vector associated with each identification number. Figure 2 contains a direct print of a photo-reduced tnap of the oil pools in northeastern Colorado, a print of the scanned image of this photo, and a two-step enlargement of the scanned image to the scale of the original tnap ( l:SfKI 000). There is no easily detectable difference between these photos, and the digital step increments in the enlargement to original scale are smoothed hy the grain of the tilm so that the increments are not detectable.
Data Output
At the present time, interxtive graphics type CRT’s are the primary tnwns of GRASP data output, although any standard alphanumeric terminal will accommodate the tabular output, When the graphics portion of the systetn is fully operational, the CRT will serve as the primary output terminal, and output will subsequently be directable to any peripheral graphics device.
In order to enhance the graphics output, geographic constants files composed of digitized political houndaries, major drainage, and standard coordinate systems, will he used. Any of these geographic files can be directly overlayed on a retrieval tnap.
GRASP is presently operational on the following computers: UNIVAC I IOX, PDP-lu70; hatch-only operation has heen executed on an IBM 360165 and an IBM 370/ 155. lt is expected that in the very near future GRASP will be time-share operational on the IBM 370/ 155.
93
Data-base management system for environmental geological data in Czechoslovakia
J. Hruska Geairtdustria Praha IJ Pruhonu 32 Praha 1 CZECHOSLOVAKIA
In Czechoslovakia a system has heen developed for environmental (spati;tl) data storage and retrieval pertaining to regional planning, natural environment and economic minerals evalwttion. Czechoslovakia’s intensive economic activities tnust take account of further restrictions imposed on new building sites and development areas in order to save natural resources, as yet unexhtwsted, for generations to conw. In the framework of a National System I.S.U. (Integrated National System ofTerritorial Information), the organizations ofgeological suwcys and Geofond have prepared or ax prepzuing a GEOLOGICAL SUBSYSTEM of the I.S.1. datahank. This subsystem has now reached a development and experiment of IO tiles, connected by a unique cotnputer system, cotntnon minimum data items and comtnon lile structure. These files, in various stages of implementation, have a content and purpose as follows:
I Mineral deposits (including industrial minerals) 2. Geological field tnaps 3. Waste deposits, undermined areas, etc. 4. Nature conservation objects and are:ts 5. Potable groundwater sources 6. Mineral ground waters and spas-arex 7. Landslides and other geodymtmic phenomena 8. Hydrologiwl and water-engineering da?d 9. Engineering geological tnaps and site investigation reports 1r.l. Engineering geological horehole-descriptions and tests.
Every year the Czech Geological Office and Geofond ~ the Cxch documentation s&w service ~ complies with hundreds of requests for information on tnany practical problems, summarizing and furnishing highly relevant records to professional workers who make use of them for specilic tasks. More and snore qwtntitatively oriented demands such as in tahie or graphic form, statistical reviews, etc. have been required recently. This has taken into consider;+tion a project of environmental geological compatible tiles based on existing information sources in the first stage. Establishing elements and standards of a national spatially conceived system will facilitate dissemination, exchange and correlation of data by computer.
94
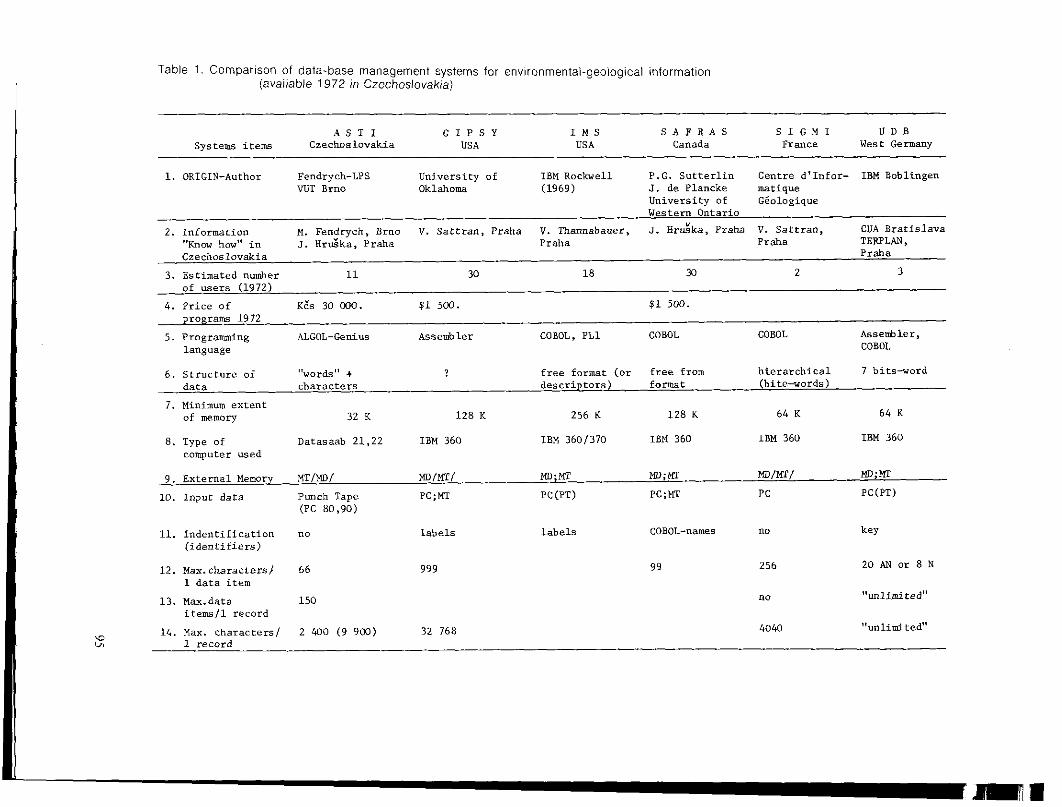
Table 1. Comparison of data-base management systems lor environmental-geological information (available 1972 in Czechoslovakia)
Alier we had experimented with two smaller files in 1970, we created a task group for systtxn selection.
First, inf’ormation was ohtaincd Srom a report ol’ CODASYL system’s commission ( I971 ) “Analysis ol’properties general da&-base systetns”. This report concerns ten major systems. From these ten systems only two were actually tested or prepared in regard to areal application:
NlPS/FFS IMS
Next, inl’ormation was obtained room Huska and Burk ( I Y7 I ). After excluding non-available and pilot project systczms. there remained only [our available computer systems.
Finally, program systems developed and applied in Czechoslovakia were added (see Fig. I ).
Building l&w Mincwdls File: A Case Study
During the past five years GEOINDUSTRIA n.p.. in cooperation with Geofond, collected geological3 technical and economic information ror about I6 000 quarries, gravel and sand pits, either operating or abandoned. and geologically advantageous outcrops for possible exploitation. This information recorded on unique “open-language” format was compiled hy tnany professio- nals partly from existing documents (maps, lechnicxl reports, mineral reserve calculations, etc.) and partly hy lield ohsawnon.
File content was developed alIe competent discussions. A standard record ft~rn~ contains I20 data items divided into eight parts (Figure I).
Mineral Building Raw Materials File A system design was tested hy using progarns of the ASTI system The experiment on 2YX records of carbonate industrial deposits ol’ Bohemia and Moravia was very &Went for storage and user-oriented retrieval. Prospective aims of compatibility and integration ol’ files with the official KU. datahank has been l?xecast. so that the input l’orm is now available ror hoth systems. as well as a data hax, manuals and Formats.
Primary records location and geologic description of the horeholes and exposures, as well as results of’ laboratory tests or physical properties of grounds were fcxmalized. punched and processed through the 1.S.U. standardized routine. The En~in~erin~-&~olo~i~~l Map selected routine was used to select and calculate constructional values houndaries and thickness of individual beds ahove sea level and groundwater level.
The program vas also helpf’ul in transforming the coordinates and processing hoth the selected and calculated values so as to assume the shape required for an interpolating routine input. The interpolation routine was that of SYMAP, version V. with graphical output represented by the niaps showing contour lines of the respective constructional elements (IBM .360/4(I). Seven
96
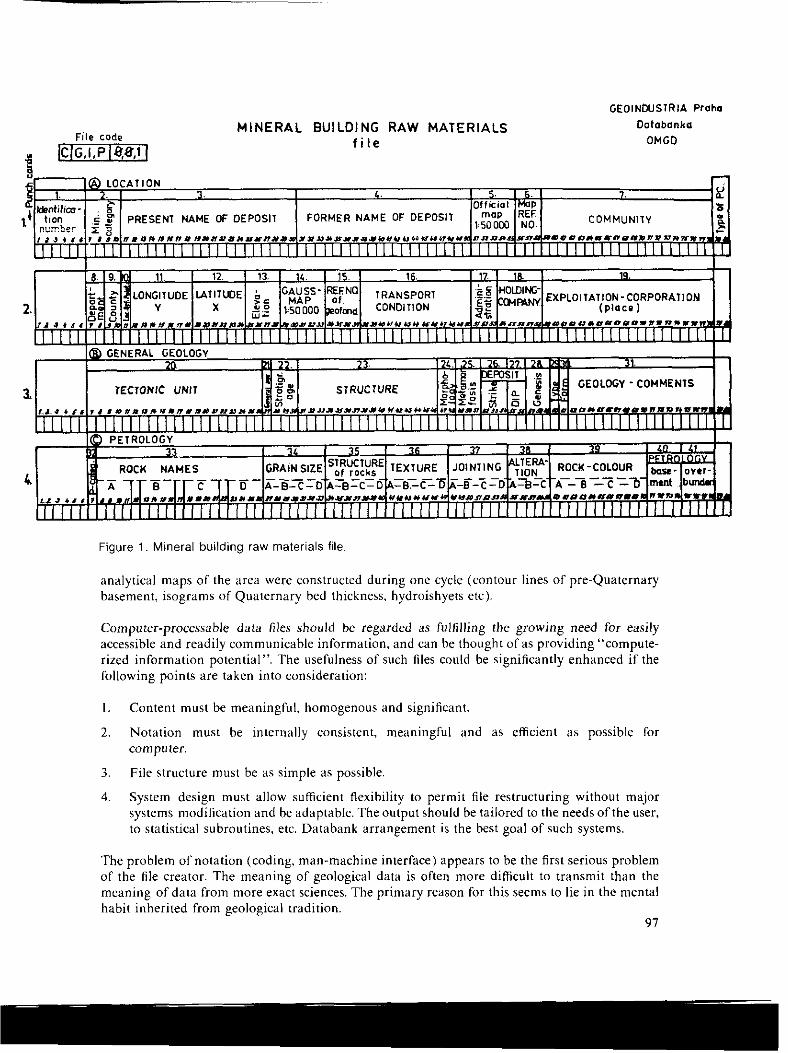
MINERAL BUILDING RAW MATERIALS file
GEOINWSIRIA Proho
Oatabonka
OMGD
PRESENT NAME OF DEPOSIT FORMER NAME OF DEPOSIT COt4M”NtlY
1 t utl 22. I 23. l2L.l - lb 1%
3. KClONlC UN11 GEOLOGY - COMMENlS
?a 33 I 3‘ I 35 I 36 I 37 I 3* I 3s t ‘”
ROCK NAMES GRAIN S,ZE s;v’$;y;E 1EXlURE JOtNllNG -COLOLJFt =‘on’
x ---
-rrrt-i-rr-rrD ------ A-B-C-DA-EM-O -- ----- 4-C-D 4-C
Figure 1. Mineral building raw materials file
analyticA maps of the area were constructed during one cycle (contour lines of pre-Quaternary basement, isograms of Quaternary bed thickness, hydroishyets etc).
Computer-processable data files should be regarded as fulfilling the growing need for easily accessible and readily communicable information, and can be thought of as providing “compute- rized information potential”. The usefulness of such tiles could be signiticxntly enhanced if the following points are taken into consideration:
I. Content must be meaningful, homogenous and significant
2. Notation must be internally consistent, meaningful and as efficient as possible for amp ter.
3. File structure must be as simple as possible
4. System design tnust allow sufficient flexibility to permit file restructuring without major systems moditication and be adaptable. The output should be tailored to the needs ofthe user, to statistical subroutines, etc. Databank arrangement is the best goal of such systems.
The problem of notation (coding, man-machine interface) appears to be the tirst serious problem of the file creator. The meaning of geological data is often more difficult to transmit than the meaning of data from tnox exact sciences. The primary reason for this seems to lie in the mental habit inherited from geological tradition.
97
Bibliography
Hruska, .I., and Burk, C. F., Jr. 197 I Computer-hued stc~rage and retrieval of geoscience information:
Bibliography 1946-69; Geol. Survey of Canada, GSC Paper 71-40, s2 p.
Buzkova, H , and Shanelec, V. I973 Computerization of engineering geological map (in Czech), In:
Bulletin of “Hornicka Pribram ve vede 1973” sekce M, p. 465 486.
Fendrych, M , and Fogl, J. I971 Automated system for information retrieval ASTILSAAB in
Czechoslovakia; Inform. Star Retrieval (U.S. A. ), vol. 7, 1971, no. 5, p. 245-248.
Hruska, .I. I97 I A short review of data processing in the earth sciences in
,Czechoslovakia; Jour. Inter. Assoc. Math. Geol., v. 3, no. 4, p. 369-373, 2 figs.
V&r, A., and Shanelec, V. I971 Regional planning aspects in developing of geological information
system (in Czech): in Bulletin Hornicka Pribram ve vede 1971, part M 22, 8 p.
98
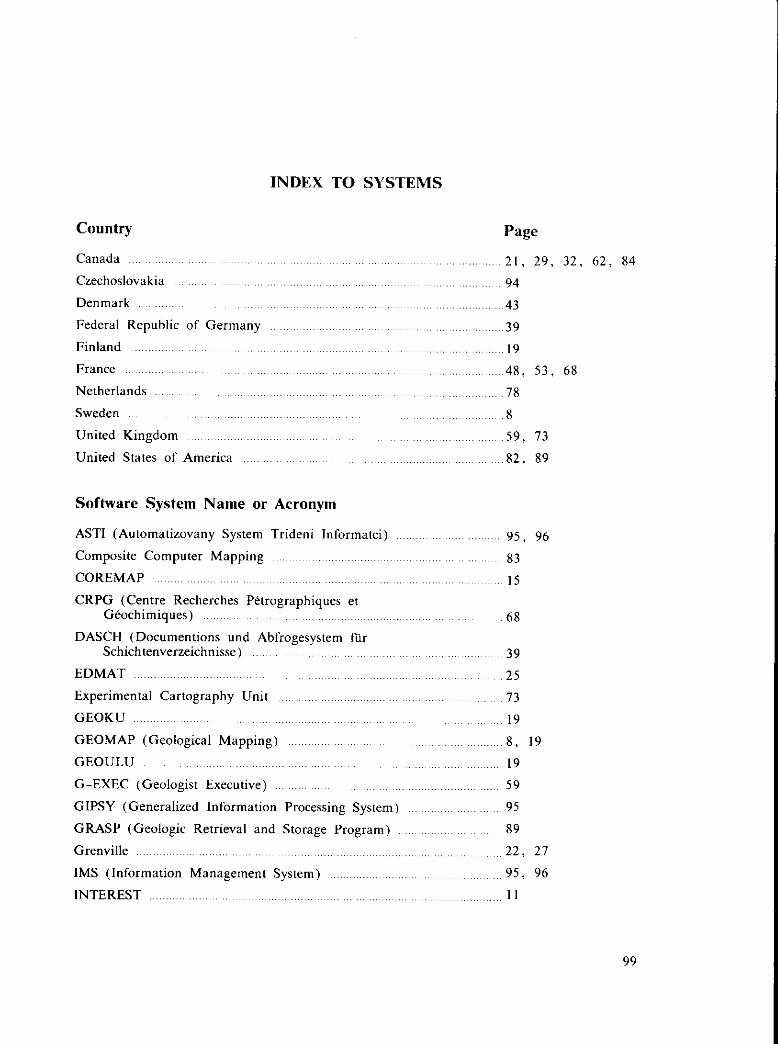
INDEX TO SYSTEMS
Software System Name or Acronym
ASTI (Automatizovany System Trideni Informatci) ,....,. .,,....,,...,, 95, 96
Composite Computer Mapping .,,. ~~~~~ ~.~ ..,,...,...,,...,. ~~~,,~ ..,....,,..,,,,....,.. 83
COREMAP ..~ ~~~~~~~~~~ ,......,,...,,....,...,. ,...,,..,,,..,,...,,...,,.. ~.~ ~~~~ ,,,. 15
CRPG (Centre Recherches P&ographiques et G&xhimiques) ~~.,~~~~ ..,,,...,,,...,,..,,. ~~~,.~ .,,...,...,,,...,,....,, ~~~~ ~~~. 68
DASCH (Documentions und Abfrogesystem fttr Schichtenverzeichnisse) ~. ~~~~~ ..~ ..,...,,...,...,. ~~,~~~~ ~~~,.~ .,,...,,,..,,,....,,. ~~~~ 39
EDMAT ~~~~~~ ~...~~~~~ .~~~ .,,....,,...,,...,. ~~,~~~.~~.,.~ .,,..,,...,,,..,,,.. ~.~, ~~~,,. 25
Experimental Cartography Unit .,..,,..,,,..,,,..,,.. ~~~~ ,....,,.. 73
GEOKU ~~~~~~~,..~ ..,....,,....,,. ~~~~~~~~~,.~~ ,,..,,...,..,,...,. ~.. ~~~~ .,....,,,,..,,,. ~. I9
GEOMAP (Geological Mapping) ~~~~~ .,.. .,,..,,,..,,..,, ~.,~~~~~~~~ .,...,....,,....,,.. ~..~~~~~ 8, I9
GEOUISJ .~.~ .~~~~ ...,........,,,,.. .,,. ~~~~ ,,,....,,...,,...,.. ~. ~~,~~~.,.~ .,,...,,...,,....,, ~~~~ ~~~., I9
G-EXEC (Geologist Executive) ..,,,...,,.....,. ~~~~~~ .,...,...,..,,,..,,. .,.. ~~~~~.~~~ ..,,...,,, 59
GIPSY (Generalized Information Processing System) ~~~~,,.~ .,,....,,,...,,.. 95
GRASP (Geologic Retrieval and Storage Program) ,,....,,..,,,....,,...., 89
Grenville ...~~~~~~~ ~~~~~ .,,.........,,.. ..,.. .,,....,,,...,,. ~.,.~~ ~~.,.~ .,,..,,....,....,....,, ~~~~ ,.... 22, 27
IMS (Information Management System) ~~~~~~~,.~ .,..,,...,,...,. ..,. ~~~~~ ,.....,,..., 95, 96
INTEREST ,.........,,.......,,,,. ~~~~~~~~~ .,.....,,,....,,. .,...,...,...,...,,...,.. ~..~~~~~~~~~ .,.....,,...., I I
99
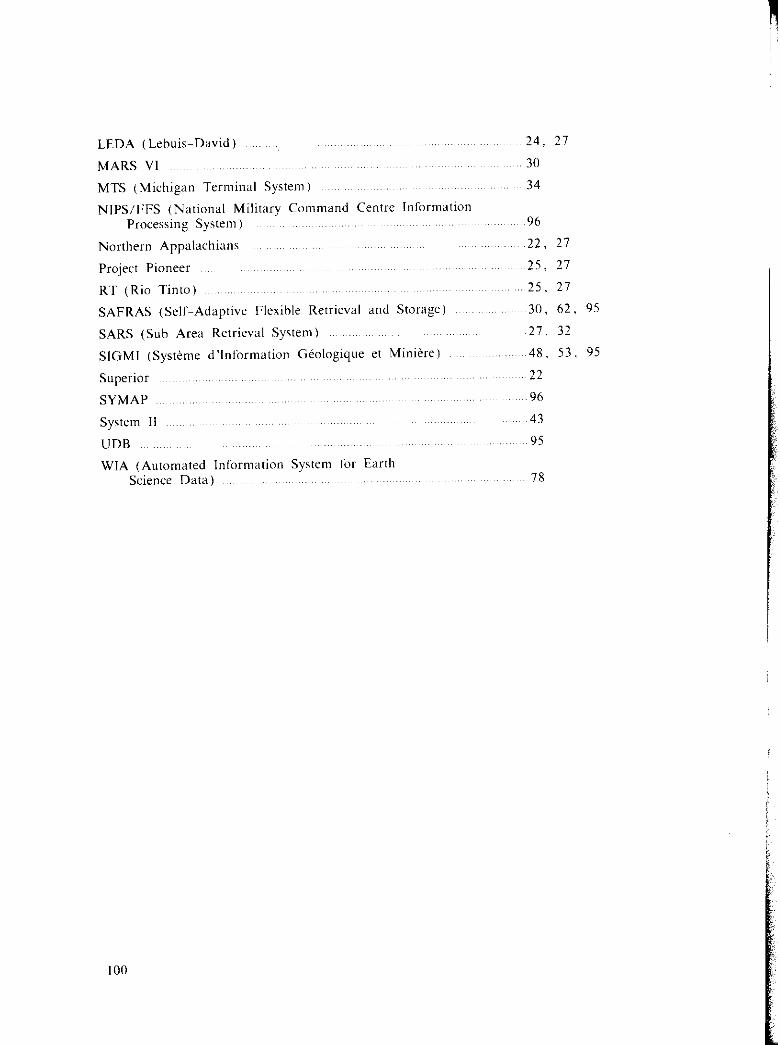
IO0