Embed Size (px)
Citation preview

7/11/2012
1
.
I-Introduction
• Main risk factors associated
with chronic diseases in Brazil
*VIGITEL Brazil 2006 - www.saude.gov.br / bvs # Hearts of Brazil Atlas / SBC; 2005
Prevalence of risk factors

7/11/2012
2
%
+76,5
-36,6
MONTEIRO C & CONDE WL. Brazilian Archives Endocrinology Metabolism 1999; 43: 1586-196.
NUTRITION TRANSITION
ENDEF (N=89.772), 1975 VERSUS PNSN (N=14.602), 1989
malnutrition
0
2
4
6
8
10
12
14
16
18
20
Men Women
1975
1989
2003
2009
Source: Instituto Brasileiro de Geografia e Estatística. National Household Budget Survey 2008-2009:
Nutritional Status in Brazil. Rio de Janeiro, Brazil: IBGE, 2010
Secular trends of obesity %
In the young population:
Prevalence of overweight: 63%
Frequent presence of subclinical atherosclerosis,
Risk for obesity in the long term, statistically verified by the
increase in abdominal circumference and a positive correlation
with BMI.
CASSANI, R. S.L. et al. Arq Bras Cardiol 2009; 92:16-22.
INGELSSON, E. et al. Circulation 2007; 116: 375-384.
Overweight and obesity:
Epidemiologic study in Brazil
50
60
70
80
90
100
110
120
130
140
3 4 5 6 7 8 9 10 11 12
Abdominal Waist (cm)
Fasting - Dinner (Hours)
p =0,021
r= 0,230
Malerbi D et al. Diabetes Care, 1992;15:1509
Distribuição por grupo etário
2,7
5,5
12,6
17,4
7,5
%
Distribution by age group
30-39 40-49 50-59 60-69 70-79
GI and DM: Epidemiologic study in Brazil
High prevalence of subjects with GI: 40%.
• Overweight and GI:
Greater possibility of future occurrence of diabetes by maintaining lifestyle
habits inadequate.
American Diabetes Association. Diabetes Care 2007; 30: S42-S47.
CASSANI, R. S.L. et al. Arquivos Brasileiros de Cardiologia 2009; 92:16-22.

7/11/2012
3
0
5
10
15
20
25
30
35
55 65 75 85 95 105 115 125
Fatt
y ac
id n
-3 (
g)
Glycemia (mg/dl)
32,1
14,5 15,3
11,0
5,5
21,7
Cardiovascular Disease
External causes
Cancer
Respiratory Disease
Infectious and parasitic
Diseases
Other+ Perinatal
%
• Mortality Brazil – 2001
Adapted data from MS / Funasa / CENEPI - Information System (SIM) - published in Jan 2004
0,00
0,10
0,20
0,30
0,40
0,50
0,60
0,70
0,80
0,90
50 100 150 200 250 300
Fatt
y ac
id n
-6 (
% k
cal V
CT)
Triglycerides (mg/dl)
• Household Budget Surveys (Programa de Orçamento Familiar- POF):
Sources of food consumption indicators,
Increasing use in developing countries.
• POF – 2003:
Evaluation of national availability of food.
• POF-2008/2009:
Evaluation of the individual consumption.
LEVY-COSTA, R. B. et al. Journal of Public Health 2005; 39: 530-540.
Alteration of food consumption
• The average per capita consumption (g / day) in rural areas was higher for traditional Brazilian foods, such as rice, beans, sweet potates, cassava flour, fresh and salted fish and salted meat
• In urban areas it is highlighted the consumption of ready-to-eat and processed: salt bread, sandwiches, deep-fried snacks, stuffed biscuits, pizzas, sodas, juices and beers.
Rice, Beans,
Corn and preparations,
Lettuce, Cabbage, Raw
salad , Pumpkin, Carrot,
Cucumber, Tomato
Potato, Cassava
Other tubers,
Pineapple, Banana,
Orange
Apple, Papaya,
Watermelon, Grapes
Other fruits
POF: Brazil 2008-2009

7/11/2012
4
Juices
23%
40%
83% reported using sugar
to sweeten juices
and coffee
Data source: National Dietary Survey 2008-2009, Brazil, day 1, weighted
Per capita consumption of beverages in the diet of selected adolescents, adults
and the elderly - Brazil-period 2008-2009
Source: IBGE, Research, Coordination of Work and Income, Household Budget Survey 2008-2009
adolescents adults elderly
soda Juice and
refreshments Yogurt Milk integral Milk drink
0
2
4
6
8
10
12
14
16
18
4 4,5 5 5,5 6 6,5 7
Fructose (mg)
Glycated Hemoglobin (%)
p= 0,033
r =0,346
Consumption of food items selected in adolescents, adults and elderly
Source: IBGE, Research, Coordination of Work and Income, Household Budget Survey 2008-2009.
adolescents adults elderly
Stuffed biscuit cheese Salada raw Sandwiches
g/day
Data source: National Dietary Survey 2008-2009, Brazil, day 1, weighted
Mean intake of specific foods/food groups according to quartiles of income Average intake of sodium
Data source: National Dietary Survey 2008-2009, Brazil

7/11/2012
5
Food groups most consumed away from home
Data source: National Dietary Survey 2008-2009, Brazilian urban areas, day 1, weighted
Changes in diet POF 2003
• CH: the kind of it is worrying !
1/5 of CH diet (12% to 56%): rapid absorption CH
Sugar and derivatives: maximum 10% of the VCT.
• FAT:
Maximum limit was exceeded!
Saturated fat: increase between the surveys (maximum 7% of the VCT)
• POF 2003: 9.6%.
• PTN:
Percentage of calories suitable for the VCT.
YOKOO, E. M. et al. Journal of Nutrition 2008; 21: 767-776
Changes in diet
Increasing the quality and decreasing the amount.
• Food problem was basically deficient and quantitative.
ENDEF 1974-1975
• Excessive caloric intake
• Lack of Fe, Ca and Vit A and other micronutrients
35 years later
Very common
Uncommon

7/11/2012
6
Evaluations Time 1 Time 2 Time 3 Time 4 Time 5
Weight (kg) 96,4 85,4 80,4 76,1 75,2
Abdominal
circumference (cm) 110 99 94 90 88
Waist circumference
(cm) 110 104 99 99 97
Midarm circumference
(cm) 35 30 28 28 28
Biceps skinfold
thickness (mm) 09 09 05 04 04
Triceps skinfold
thickness (mm) 11 10 10 06 06
Subscapular skinfold
thickness (mm) 32 21 17 14 14
Abdominal skinfold
thickness (mm)
≥ 67 25 20 15 15
Interval time: 30 days
Time Glycemia
(mg/dL)
CT
(mg/dL)
HDL -c
(mg/dL)
LDL-c
(mg/dL)
TG
(mg/dL) Uric acid
(mg/dL)
1 163 231 41 155 173 7,6
5 97 160 44 104 62 5,2
Time 1: pre-intervention
Time 5: post-intervention
CT: Total cholesterol ; LDL-c: Low density lipoprotein cholesterol; HDL-c: High denisty lipoprotein cholesterol;
TG: triglycerides; mg/dL: miligrams/decilitres.
ELETRIC BIOIMPEDANCE
Percentage (%) Time 1 Time 5
Fat 24 15
Lean Mass 76 85
Water 54 63
Goal
Variation (kg) 85 - 91 76 - 80
Time 1: pre-intervention
Time 5: post-intervention
INDIRECT CALORIMETRY
Results Time 1 Time 5
BMR Prediction (Kcal) 1704 1941
BMR ( Kcal) 2304 1152
VO 2 333 167
% TMB variation 26 ↓ 68 ↑
Time 1: pre-intervention
Time 5: post-intervention
cal: calories;TMB: Basal Metabolic Rate; vo2: Oxygen volume

7/11/2012
7
Nutritional Survey
• Detection of proper and inadequate eating habits,
• Identifying of certain eating behaviors,
• Verification of sizes and types of food used,
• Times and places where meals are taken,
• Establishing an emotional bond between professional and patient:
“ The dietary behavior is not always completely negative, often small
changes can lead to large positive differences.”
Meal Time Food Households measure Quantity
Breakfast 1
French bread
Salami
Yellow cheese
Fat milk
Coffee
Sugar
Fresh Fruit Juice:
(2 oranges and half a papaya)
Unit
Medium slice
Medium slice
Medium glass
Cup
Table spoon
Medium glass
-
1
4
2
200ml
1
1
1
-
Morning Snack 1 - - -
Lunch 1
White rice
Beans
Lettuce
Cooked chayote
Carrots
Red Meat
Olive oil
Soy oil
Fresh orange juice
Table spoon
Table spoon
Table plate
Table spoon
Table spoon
Medium Steak
Tea spoon
Table spoon
Large glass
10
4
1
2
2
240g
1
2
200ml
Afternoon Snack 1 Sweet cake Medium slice 2
Dinner
1
White rice
Red meat
Cooked potato
Mussarela
Soy oil
Olive oil
Cream Ice- cream
Table spoon
Medium Steak
Medium unit
Medium slice
Table spoon
Tea spoon
Scoop
10
240g
2
2
1
1
2
Supper 1 - - -
Lipids 29%
Protein 20%
Carbohydrate 51%
lipídios Proteína HC carbohydrate lipids protein
Percentage of energy
Men Women
Data source: National Dietary Survey 2008-2009, Brazil, day 1, weighted
• Carbohydrates,
• Lipids and
• Proteins
Balance between the proportions of macronutrients
However, with excessive
caloric intake
Increasing the quality and decreasing the amount.
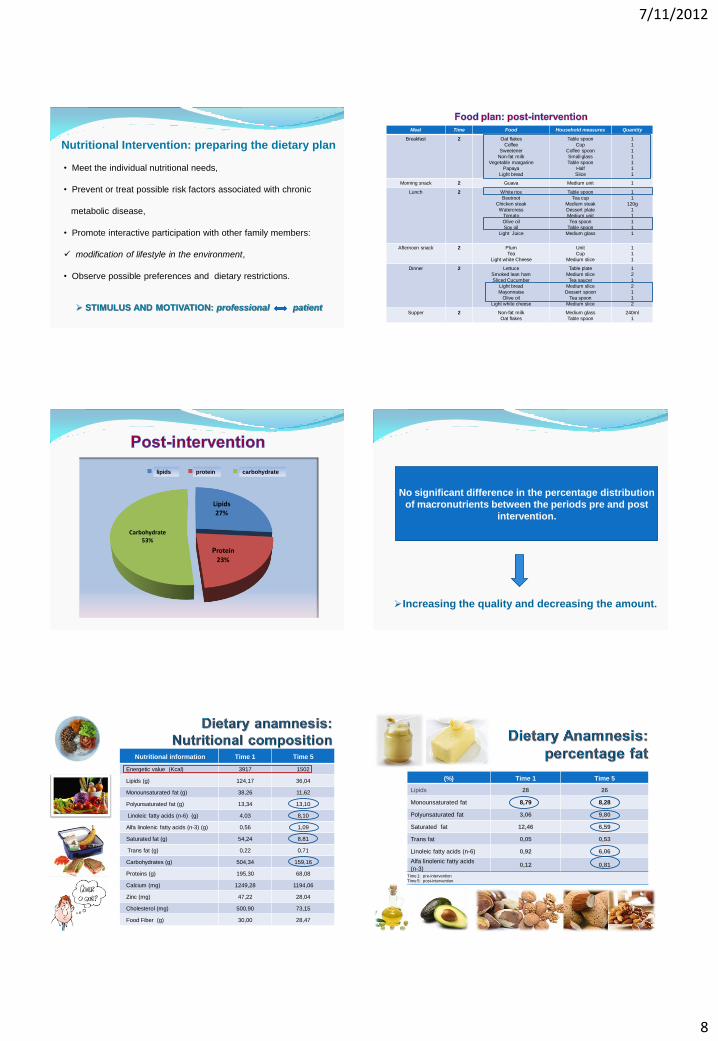
7/11/2012
8
Nutritional Intervention: preparing the dietary plan
• Meet the individual nutritional needs,
• Prevent or treat possible risk factors associated with chronic
metabolic disease,
• Promote interactive participation with other family members:
modification of lifestyle in the environment,
• Observe possible preferences and dietary restrictions.
STIMULUS AND MOTIVATION: professional patient
Meal Time Food Household measures Quantity
Breakfast 2 Oat flakes
Coffee
Sweetener
Non-fat milk
Vegetable margarine
Papaya
Light bread
Table spoon
Cup
Coffee spoon
Small glass
Table spoon
Half
Slice
1
1
1
1
1
1
1
Morning snack 2 Guava Medium unit 1
Lunch 2 White rice
Beetroot
Chicken steak
Watercress
Tomato
Olive oil
Soy oil
Light Juice
Table spoon
Tea cup
Medium steak
Dessert plate
Medium unit
Tea spoon
Table spoon
Medium glass
1
1
120g
1
1
1
1
1
Afternoon snack 2 Plum
Tea
Light white Cheese
Unit
Cup
Medium slice
1
1
1
Dinner
2 Lettuce
Smoked lean ham
Sliced Cucumber
Light bread
Mayonnaise
Olive oil
Light white cheese
Table plate
Medium slice
Tea saucer
Medium slice
Dessert spoon
Tea spoon
Medium slice
1
2
1
2
1
1
2
Supper 2 Non-fat milk
Oat flakes
Medium glass
Table spoon
240ml
1
Lipids 27%
Protein
23%
Carbohydrate 53%
lipídios Proteína HC lipids protein carbohydrate
Increasing the quality and decreasing the amount.
No significant difference in the percentage distribution
of macronutrients between the periods pre and post
intervention.
Nutritional information Time 1 Time 5
Energetic value (Kcal) 3917 1502
Lipids (g) 124,17 36,04
Monounsaturated fat (g) 38,26 11,62
Polyunsaturated fat (g) 13,34 13,10
Linoleic fatty acids (n-6) (g) 4,03 8,10
Alfa linolenic fatty acids (n-3) (g) 0,56 1,09
Saturated fat (g) 54,24 8,81
Trans fat (g) 0,22 0,71
Carbohydrates (g) 504,34 159,16
Proteins (g) 195,30 68,08
Calcium (mg) 1249,28 1194,06
Zinc (mg) 47,22 28,04
Cholesterol (mg) 500,90 73,15
Food Fiber (g) 30,00 28,47
(%) Time 1 Time 5
Lipids 28 26
Monounsaturated fat 8,79 8,28
Polyunsaturated fat 3,06 9,80
Saturated fat 12,46 6,59
Trans fat 0,05 0,53
Linoleic fatty acids (n-6) 0,92 6,06
Alfa linolenic fatty acids
(n-3) 0,12 0,81
Time 1: pre-intervention
Time 5: post-intervention

7/11/2012
9
RECOMMENDATIONS
Total fat 30 – 35% E
Maximum saturated 10%E
Essential fatty acids PUFA (w-6 e w-3) 6 – 10% E
Trans fatty acids ↓ 1% E
Remainder of calories from fats: monounsaturated.
Nutritional counseling
• Practical guidance on sizes and household measures,
• Assimilation of food groups present in the list of substitution,
• Provision of practical and viable food recipes, which may be
included in the patient's routine,
• Knowledge of the patient`s daily life and his structure:
Family, employees, workplace, times and numbers of meals.

7/11/2012
10
Theme courses and Groups
• Target Audience:
Practical sessions with client / patient (adults or children)
Staff who work at home:
Training for active participation in the process of changing lifestyle of
the individual and / or family,
Organization, presentation of dishes, meal preparation time.
• Objective: Dietary Technique
Elaborate preparations differentiated, tasty, nutritious that visually
stimulate adherence to dietary proposed new concepts.
Awareness and bond (professionals and clients / patients),
Relaxation,
Involvement ,
Sensorial stimulation: taste, smell.
Greater compliance for lifestyle modification.
Gourmet Space
Colocar aqui uma foto do treiamento de funcionaria Weder ou Ana Rosa !
Monitoring the patient
Beginning of the plan:
• The goal is: set the menu with the necessary adaptations.
• Home visits: defined with the patient.
Termination of the plan:
• Objective: Adherence to treatment
• Tip: Maintenance plans

7/11/2012
11
• THE DIET CAN BE MODIFIED !
A single nutrient: different metabolic responses.
The response in post-prandial:
Type and amount of nutrients
"Calorie is a calorie“: concept can be misleading.
EBBELING, C.B. et al. American Journal Clinical Nutrition. 2005; 81(5): 976-982.
RADULIAN, G. et al. Nutrition Journal. 2009; 8(5): 1-8. 2009.

7/11/2012
12
CASSANI, R. S.L. et al. Arquivos Brasileiros de Cardiologia 2009; 92:16-22.
CASSANI, R. S. L. et al. American Journal of Hypertension2009; 22: 980-984.
• Diet: modifiable risk factor
• Educational programs, on nutrition, for prevention
and control of complications from a unhealthy
lifestyle identified.
Conceptual, Motivators, sensitizers, possible and
frequent !