Embed Size (px)
Citation preview

I. Logistic Growth (Chap. 11, continued)A. Patterns: Sigmoidal curveB. EquationC. What limits population growth?
Density dependent factorsDensity independent factors
II. Human demographics A. DistributionB. Growth rates and carrying capacityC. Age Structure
Population Ecology 3Logistic Growth and Human Demographics

Bottom line of exponential growth:
When there are no limits, populations grow faster,
and FASTER
and FASTER!

What happens if there are limits? (And eventually there ALWAYS are!)
LOGISTIC POPULATION GROWTH

A. Patterns
11.6

11.9

11.11
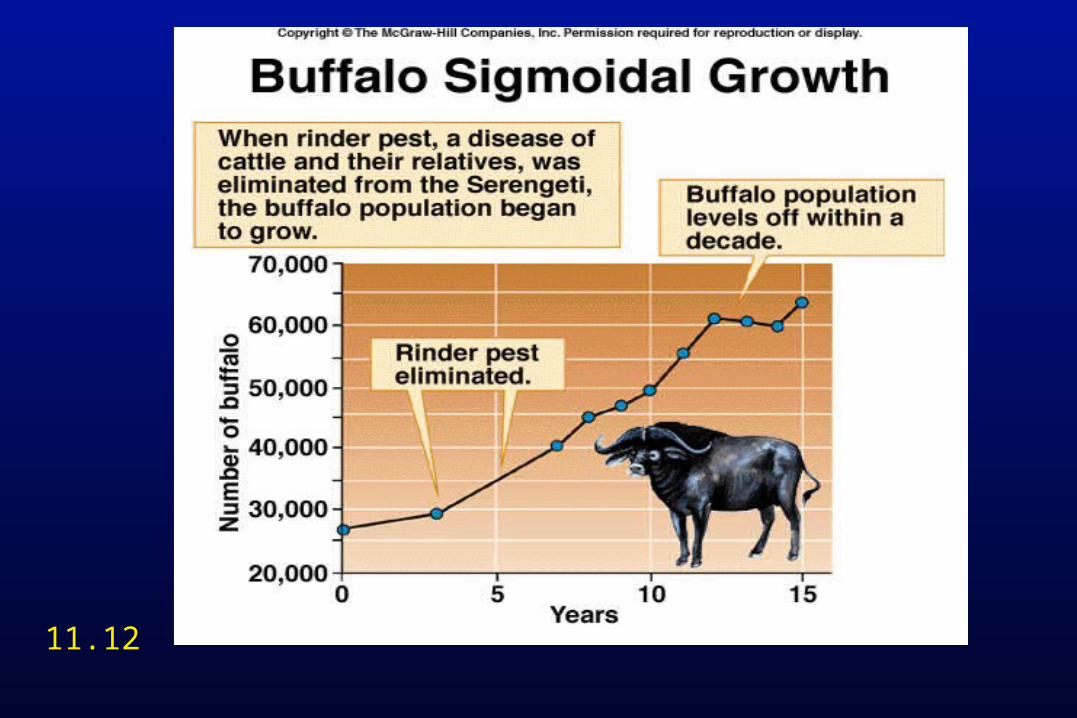
11.12

The sigmoidal curve defines the shape of logistic growth.
Draw it. What are the axes?What is r? Is it constant or changing?Where is r at its maximum?Where is dN/dt at it’s maximum?

B. The equation

11.14
Higher N leads to lower realized r

Assumptions of logistic
1) Assumes rapid feedback from pop. size to b and d.
2) No minimum size (e.g., difficulty finding mates, social organization, etc.)
3) Constant K

C. What limits population growth?
1. Density dependent factors
2. Density independent factors

11.16

11.18

II. Human demographics
A. DistributionB. Growth rates and carrying capacityC. Age structure

A. Human population distribution is uneven at large and small scales
Fig. 11.22, 11.23

Population distribution in Washington State?Whatcom County?
http://www.wamaps.com/front_maps/population_density_2000.gif

B. Human population growth and carrying capacity
11.27

Whatcom County population growth:just birth and death rates?
http://www.censusscope.org/us/s53/c73/chart_popl.html

What is carrying capacity of planet?

Human activities affect resource availability
Human activitiesGlobal
changes
BiodiversityEcosystem processes
Ecosystem services

K depends on human impact
Depends on Total human populationConsumption by each individualEcological impact of each unit of consumption
I = PAT (Ehrlich and Ehrlich)P = populationA = affluenceT = technology

How is population likely to grow in the future?
C. Age structure entrains population growth rates based on per capita birth and death rates
http://www.nhm.ac.uk

How is population likely to grow in the future?
C. Age structure entrains population growth rates based on per capita birth and death rates

11.25

Summary
1. Logistic growth incorporates density-dependent population regulation.
2. Realized r is greatest at low population size, whereas dN/dt is greatest at K/2.
3. Human population distribution is uneven.4. Human K is unknown.5. Age structure influences future population growth rates.