Embed Size (px)
Citation preview
INTRODUCTION TO LINEAR FUNCTIONS

WHAT DID WE LEARN ABOUT FUNCTIONS?
We spent the last unit discussing functions. We found the
independent variable, __, the dependent variable, __,
the __________, the ______, and the ________for the function. This
unit we will be looking at a specific type of function –
___________________.
xy
equation
tablegraph
Linear Functions
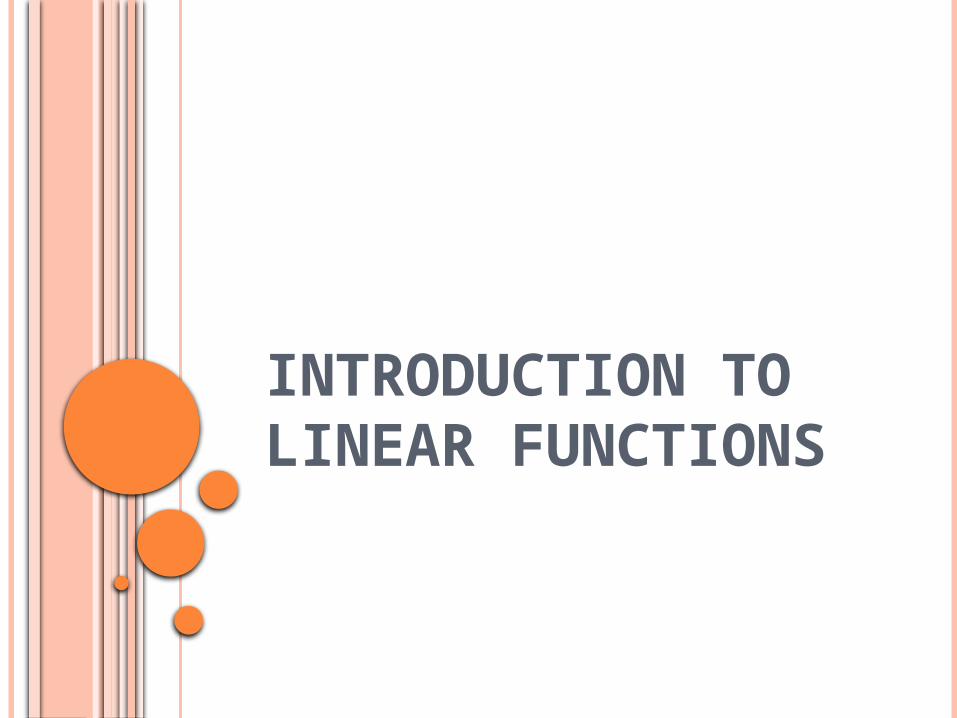
SIMILARTIES
Functions Linear Functions
Differences:
Both have tables.Both have graphs.
Both have equations.
Both have a domain and rangeBoth have independent and
dependent variables.
Both can be continuous, the data is connected.
Functions can be discrete, the data is not connected.
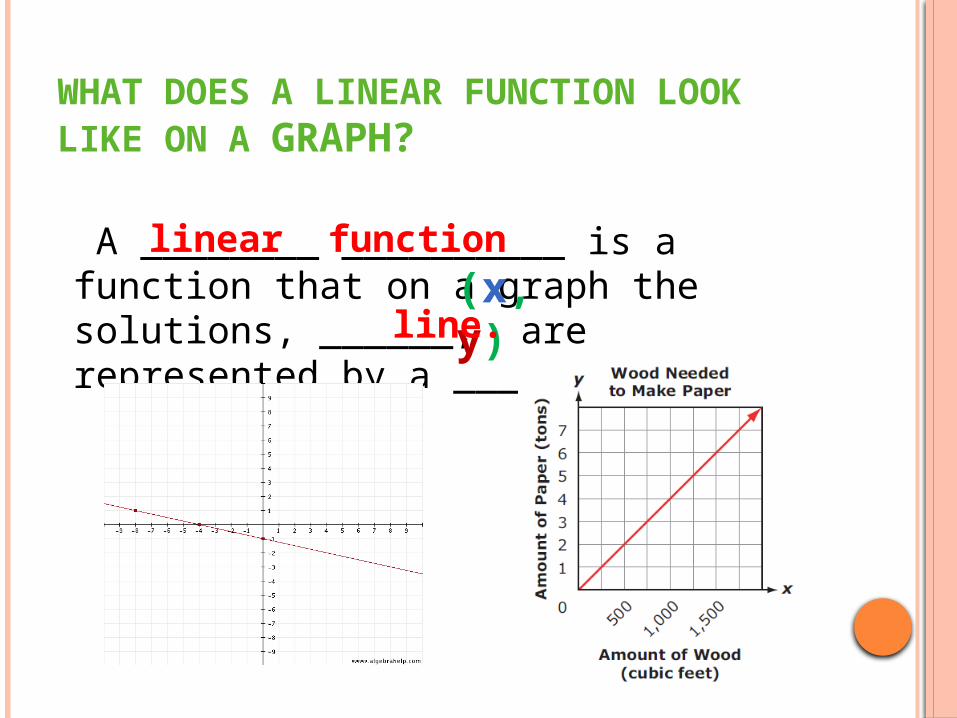
WHAT DOES A LINEAR FUNCTION LOOK LIKE ON A GRAPH?
A ________ __________ is a function that on a graph the solutions, ______, are represented by a _________
linear function(x,y)line.

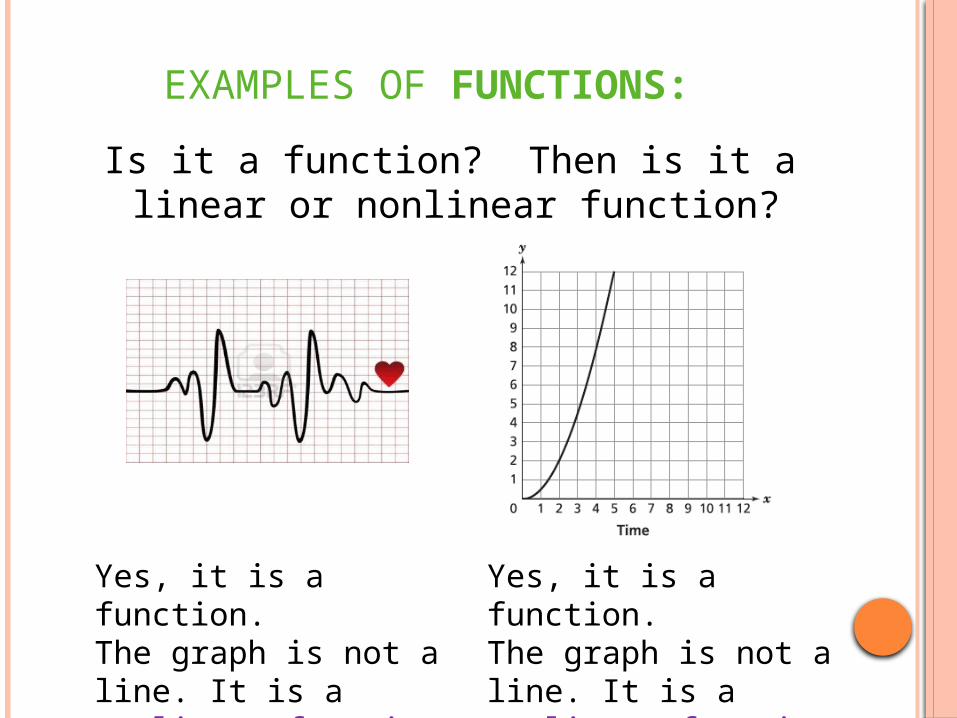
EXAMPLES OF FUNCTIONS:
Is it a function? Then is it a linear or nonlinear function?
Yes, it is a function.The graph is a line. It is a linear function.
Yes, it is a function.The graph is not a line. It is a nonlinear function.

EXAMPLES OF FUNCTIONS:
Is it a function? Then is it a linear or nonlinear function?
Yes, it is a function.The graph is a line. It is a linear function.
Yes, it is a function.The graph is not a line. It is a nonlinear function.

EXAMPLES OF FUNCTIONS:
Is it a function? Then is it a linear or nonlinear function?
Yes, it is a function.The graph is a line. It is a linear function.
No, not a function.

EXAMPLES OF FUNCTIONS:
Is it a function? Then is it a linear or nonlinear function?
No, not a function. Yes, it is a function.The graph is not a line. It is a nonlinear function.
EXAMPLES OF FUNCTIONS:
Is it a function? Then is it a linear or nonlinear function?
Yes, it is a function.The graph is not a line. It is a nonlinear function.
Yes, it is a function.The graph is not a line. It is a nonlinear function.

EXAMPLES OF FUNCTIONS:
Is it a function? Then is it a linear or nonlinear function?
No, not a function.Yes, it is a function.The graph is a line. It is a linear function.

EXAMPLES OF FUNCTIONS:
Is it a function? Then is it a linear or nonlinear function?
Yes, it is a function.The graph is a line. It is a linear function.
Yes, it is a function.The graph is not a line. It is a nonlinear function.

VOCABULARY FOR LINEAR FUNCTIONS
Linear function – function with a graph that is continuous
Linear equation – equation whose graph is a straight line
X intercept – the point where a line crosses the x axis of a graph
Y intercept – the point where a line crosses the y axis
Rate of change – how the steepness of a line is changing
Slope – the steepness of the line on a graph
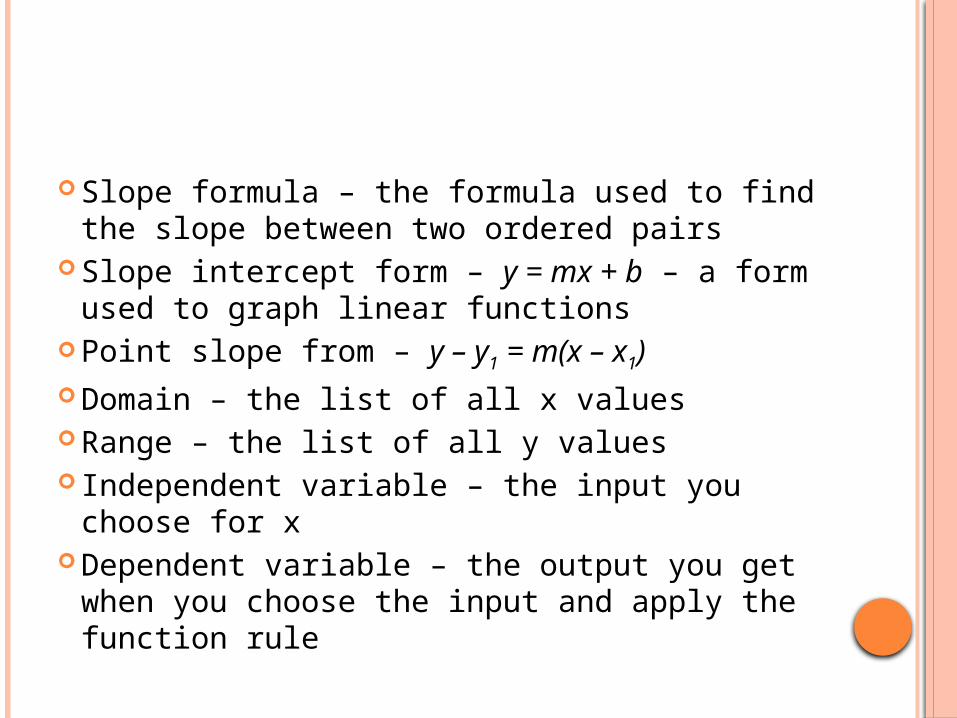
Slope formula – the formula used to find the slope between two ordered pairs
Slope intercept form – y = mx + b – a form used to graph linear functions
Point slope from – y – y1 = m(x – x1) Domain – the list of all x values Range – the list of all y values Independent variable – the input you choose
for x Dependent variable – the output you get
when you choose the input and apply the function rule

Function rule – the rule that defines the relationship between x and y

Function rule – the rule that defines the relationship between x and y
Positive slope – the line on a graph moves in an upward direction from left to right
Function rule – the rule that defines the relationship between x and y
Positive slope – the line on a graph moves in an upward direction from left to right
Negative slope – the line on a graph moves in a downward graph from left to right
Function rule – the rule that defines the relationship between x and y
Positive slope – the line on a graph moves in an upward direction from left to right
Negative slope – the line on a graph moves in a downward graph from left to right
Zero slope – the slope of a horizontal line
Function rule – the rule that defines the relationship between x and y
Positive slope – the line on a graph moves in an upward direction from left to right
Negative slope – the line on a graph moves in a downward graph from left to right
Zero slope – the slope of a horizontal line Undefined slope – the slope of a vertical
line