Embed Size (px)
Citation preview
1
IMPACT OF SCHOOL-BASED SUPPORT ON
EDUCATIONAL OUTCOMES OF TEEN-MOTHERS:
EVIDENCE FROM NEW ZEALAND’S “TEEN PARENT
UNITS”
Rhema Vaithianathan, School of Economics, Auckland University of Technology (AUT)1
Tim Maloney, School of Economics, AUT
Moira Wilson, Ministry of Social Development (MSD)
Anita Staneva, School of Economics, AUT
Nan Jiang, School of Economics, AUT
Working Paper
February 2017
1 Please send correspondence to: [email protected].

2
Acknowledgements
This research was supported by funding from MSD and in-kind contributions from AUT and
MSD. The authors gratefully acknowledge the assistance and advice provided by the many
people who helped at different stages of the project. Particular thanks are due to Associate
Professor Tue Gørgens (Research School of Economics, Australian National University
College of Business & Economics) and Dr Dean Hyslop (Senior Fellow, Motu Economic and
Public Policy Research) for statistical advice and Dr Beverly Lawton (University of Otago
Wellington) and members of the MSD Publications Committee for helpful comments on an
earlier draft. We gratefully acknowledge the support provided by Rissa Ota (MSD), Sarah
Tumen (the Treasury) and Ashlee Cuneen (Ministry of Education).
Agency Disclaimers Access to the data used in this study was provided by Statistics New
Zealand under conditions designed to give effect to the security and confidentiality
provisions of the Statistics Act 1975. The results presented in this study are the work of the
authors, not Statistics New Zealand. The views expressed are those of the researchers. They
do not necessarily reflect the position of MSD or those involved in the advisory or review
processes. MSD has made every effort to ensure the information in this report is reliable, but
does not guarantee its accuracy and does not accept liability for any errors.
Note on Random Rounding
All counts presented in this study have had Statistics New Zealand confidentiality rules
applied. This includes the random rounding of all counts to base 3. Therefore, the sample
counts presented are not exact, and in some cases aggregating sub-samples will not yield the
exact population counts.
Published
Ministry of Social Development, Wellington.
ISBN
978-0-947513-69-6 (Online)
3
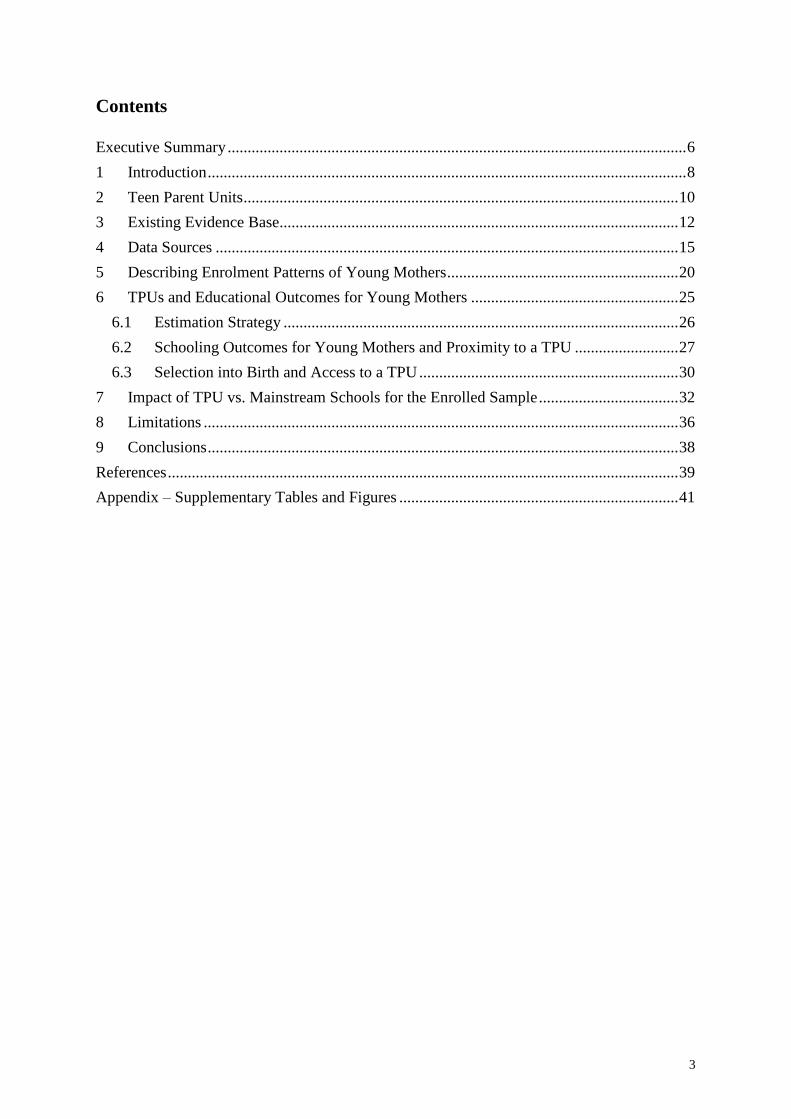
Contents
Executive Summary ................................................................................................................... 6
1 Introduction ........................................................................................................................ 8
2 Teen Parent Units ............................................................................................................. 10
3 Existing Evidence Base.................................................................................................... 12
4 Data Sources .................................................................................................................... 15
5 Describing Enrolment Patterns of Young Mothers .......................................................... 20
6 TPUs and Educational Outcomes for Young Mothers .................................................... 25
6.1 Estimation Strategy ................................................................................................... 26
6.2 Schooling Outcomes for Young Mothers and Proximity to a TPU .......................... 27
6.3 Selection into Birth and Access to a TPU ................................................................. 30
7 Impact of TPU vs. Mainstream Schools for the Enrolled Sample ................................... 32
8 Limitations ....................................................................................................................... 36
9 Conclusions ...................................................................................................................... 38
References ................................................................................................................................ 39
Appendix – Supplementary Tables and Figures ...................................................................... 41
4
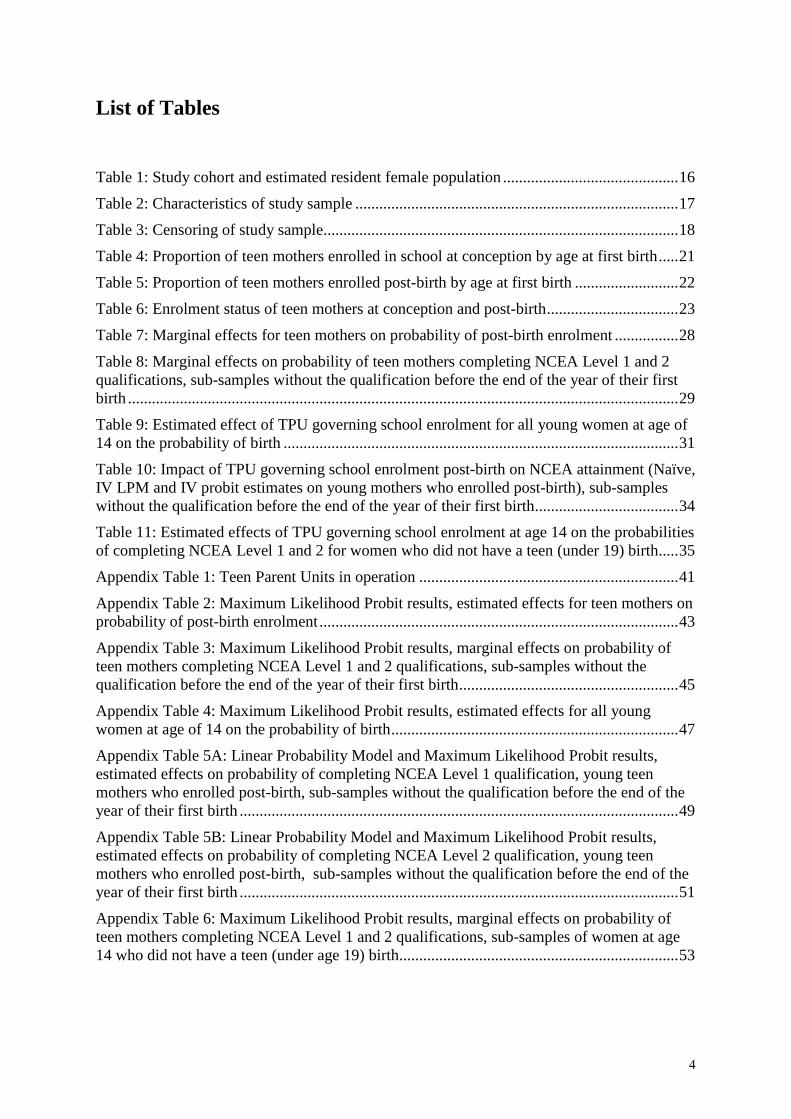
List of Tables
Table 1: Study cohort and estimated resident female population ............................................ 16
Table 2: Characteristics of study sample ................................................................................. 17
Table 3: Censoring of study sample......................................................................................... 18
Table 4: Proportion of teen mothers enrolled in school at conception by age at first birth ..... 21
Table 5: Proportion of teen mothers enrolled post-birth by age at first birth .......................... 22
Table 6: Enrolment status of teen mothers at conception and post-birth ................................. 23
Table 7: Marginal effects for teen mothers on probability of post-birth enrolment ................ 28
Table 8: Marginal effects on probability of teen mothers completing NCEA Level 1 and 2
qualifications, sub-samples without the qualification before the end of the year of their first
birth .......................................................................................................................................... 29
Table 9: Estimated effect of TPU governing school enrolment for all young women at age of
14 on the probability of birth ................................................................................................... 31
Table 10: Impact of TPU governing school enrolment post-birth on NCEA attainment (Naïve,
IV LPM and IV probit estimates on young mothers who enrolled post-birth), sub-samples
without the qualification before the end of the year of their first birth .................................... 34
Table 11: Estimated effects of TPU governing school enrolment at age 14 on the probabilities
of completing NCEA Level 1 and 2 for women who did not have a teen (under 19) birth..... 35
Appendix Table 1: Teen Parent Units in operation ................................................................. 41
Appendix Table 2: Maximum Likelihood Probit results, estimated effects for teen mothers on
probability of post-birth enrolment .......................................................................................... 43
Appendix Table 3: Maximum Likelihood Probit results, marginal effects on probability of
teen mothers completing NCEA Level 1 and 2 qualifications, sub-samples without the
qualification before the end of the year of their first birth ....................................................... 45
Appendix Table 4: Maximum Likelihood Probit results, estimated effects for all young
women at age of 14 on the probability of birth ........................................................................ 47
Appendix Table 5A: Linear Probability Model and Maximum Likelihood Probit results,
estimated effects on probability of completing NCEA Level 1 qualification, young teen
mothers who enrolled post-birth, sub-samples without the qualification before the end of the
year of their first birth .............................................................................................................. 49
Appendix Table 5B: Linear Probability Model and Maximum Likelihood Probit results,
estimated effects on probability of completing NCEA Level 2 qualification, young teen
mothers who enrolled post-birth, sub-samples without the qualification before the end of the
year of their first birth .............................................................................................................. 51
Appendix Table 6: Maximum Likelihood Probit results, marginal effects on probability of
teen mothers completing NCEA Level 1 and 2 qualifications, sub-samples of women at age
14 who did not have a teen (under age 19) birth ...................................................................... 53

5
List of Figures
Appendix Figure 1: Historical teen fertility rates in New Zealand .......................................... 42
6
Executive Summary
This report evaluates a unique intervention in New Zealand, where some teenage mothers
have the opportunity to complete their secondary schooling at a Teen Parent Unit (TPU).
TPUs are governed by mainstream high schools (“TPU governing schools”), and are
specifically designed for teenagers who are pregnant or parents. Units provide childcare
(often on-site), links to health and other social services, and guidance and mentoring. To date
there has been no quantitative study that establishes whether TPUs are effective in improving
educational outcomes.
We find that for the cohorts studied, access to a TPU increased school enrolment rates and
school qualifications for teenage mothers aged under 19 at their first birth.
The school enrolment rate after birth for the teenage mothers studied was 35 percent. Those
who had access to a TPU within 20 km were 4 percentage points more likely to enrol in
school after giving birth (significant at the 5 percent level). Those who had access to a TPU
by virtue of being enrolled in a TPU governing school at conception were an additional 11
percentage points more likely to enrol (significant at the 1 percent level), and were estimated
to be more likely to attain National Certificate in Educational Achievement (NCEA) Level 1
and 2 post-birth (significant at the 1 and 5 percent levels respectively).
We estimate that for teen mothers without qualifications who enrolled in school post-birth,
enrolling in a school with a TPU increased the probability of attaining NCEA Level 1 from
37 to 59 percent (significant at the 5 percent level).
We checked whether the effects found can be interpreted as causal by testing alternative
hypotheses. One such alternative hypothesis is that TPU governing schools were generally
“better quality” schools and therefore the impact observed for teen mothers is due partly to
the nature of the governing schools rather than a causal impact of the fact that the schools
hosted a TPU. We test whether TPU governing schools generally perform better for young
women. Results suggests that, overall, TPU governing schools tend to be associated with
7
poorer educational outcomes for young women overall, strengthening our confidence that we
have estimated the impacts of the TPUs, rather than the effects of more general differences in
outcomes for all students in the governing schools.
A second alternative hypothesis is that young women with access to TPU schools were more
likely to continue their pregnancy to term. This might lead to selection on unobserved
variables, since more motivated or ambitious young women might be more likely to continue
their pregnancy because they were able to make use of the TPU to continue their study. We
find no evidence of such a phenomenon.
Impact evaluation based on administrative data has a number of limitations. It does not allow
all of the outcomes sought by programmes to be measured, and errors in data linkage and
data limitations inevitably result in some degree of imprecision in the estimation of true
impacts. In this study, for example, in the absence of data on TPU enrolment we assume a
young mother was enrolled in a TPU post-birth if she enrolled in a TPU governing school.
This may not always have been the case.
In addition, while the quasi-experimental methods that we use seek to control and test for
unobserved selection, this may not have been adequately controlled for in our analysis. Only
a randomised control trial can fully remove any doubts about selection effects. Nevertheless,
quasi-experimental impact evaluations using administrative data can form a useful part of the
evidence-base on programme effectiveness.
Overall, our findings indicate that specialist school-based services designed to meet the needs
of teenage mothers can reduce the school enrolment gap between teen women who give birth
and those who do not. Additionally, these services can substantially raise the achievement
levels of teen mothers who do enrol in school.
8
1 Introduction
New Zealand has historically had one of the highest teenage birth rates in the OECD –
second only to the United States (Families Commission, 2011). Teen births are highly
concentrated amongst young women from poor families and amongst Māori and Pacifica.
The causal impacts of a teenage birth on economic outcomes such as education and wages are
a point of contention amongst scholars — especially economists. Simple correlations tend to
show that teen mothers have substantially worse economic and educational outcomes.
However, it is likely that teenage mothers are from a selected sample of the population who
would have had poorer outcomes even if they had delayed child-birth beyond their teenage
years. In summarising the literature, Kearney and Levine (2012) conclude that a “substantial
majority of the observed correlation between teen childbearing and inferior outcomes is the
result of underlying differences between those who give birth as a teen and those who do
not.” (p.161.)
New Zealand, with its high teen birth rate and concentration of teenage births amongst
economically deprived populations, has taken a two-track approach. While introducing some
policies designed to reduce teenage pregnancies, the Government has also tried to minimise
the disruption in schooling for young women enrolled in school before giving birth, and to
promote second-chance learning for young women who were disengaged from schooling
prior to the birth of their child. As the Families Commission overview of teenage pregnancy
and parenting noted, teen mothers often struggle to maintain engagement with school.
“Inflexible school policies and procedures, a lack of adequate childcare and other practical
difficulties make continuing education in mainstream schools very difficult” (p.15, Families
Commission, 2011).
This paper evaluates a unique intervention in New Zealand where some teenage mothers have
the opportunity to receive their schooling at a Teen Parent Unit (TPU). These TPUs are
specifically designed for teenagers who are pregnant or already parents.
Evaluation of this intervention helps to establish whether poor schooling outcomes for teen
mothers can be off-set through schooling opportunities that are designed around the needs of

9
young mothers. Our study uses distance to TPUs as a proxy for access. Since TPUs are not
available across all areas of the country, some young women have no access to a TPU in the
surrounding area. We compare enrolment rates and educational qualifications of teen mothers
in close proximity to a TPU to those further afield. We use linked administrative data, which
allows us to track a near census of young women through their school-age years and observe
their birth and educational outcomes.
Our findings are consistent with TPUs having two effects on the educational outcomes of
teen mothers: they increase enrolment rates, and raise the probability of attaining a
qualification once enrolment has taken place.
Improved educational outcomes associated with TPUs suggest that teenage birth might
indeed have a causal impact on outcomes such as education. That the intervention is effective
suggests that teenage birth and resulting barriers to participation and achievement play at
least some role in explaining the poor schooling outcomes observed among young mothers
(over and above underlying differences between those who give birth as a teen and those who
do not). However, the findings from our study are not able to establish this conclusively.
This paper is organised as follows. In Section 2, we outline some details of how TPUs
function. Section 3 briefly reviews the existing evidence base on similar programmes and
their estimated effects. Section 4 outlines the construction of the data used in this study.
Section 5 sets out some descriptive statistics on school enrolment patterns of young mothers,
and Sections 6 and 7 contain the main part of the analysis. Discussion of some limitations of
this study and conclusions appear in Sections 8 and 9. The Appendix contains supplementary
tables and details of the location of the TPUs across the country.
10
2 Teen Parent Units
TPUs were set up to improve access to schooling and to promote positive educational
outcomes for teenagers who are pregnant or parents. TPUs are separate units that are
governed by mainstream high schools (“TPU governing schools”). The TPU is usually sited
within the governing school, but in some cases is in another location. TPUs enrol pregnant
and parenting teenagers2 who are taught by registered teachers according to their individual
needs. Students may also be enrolled at Te Kura — the Correspondence School, to ensure
access to a wide range of curriculum areas. In these situations, courses are supervised by TPU
teachers, but teaching resources and evaluations are provided remotely. In some cases,
students may also access classes on-site at the governing school.
Apart from the standard high school curriculum, TPU students receive wrap-around support,
pastoral care, mentoring and additional lifestyle courses (such as budgeting training). TPUs
also provide early childhood education services (often on-site), and commonly have close
links with other community programmes such as home-visiting services, family doctors, and
Well Child/Tamariki Ora health checks for children.
Over the period covered by this study, there were no national guidelines setting out the roles
and responsibilities of TPUs. Instead, these were set out in individual Memoranda of
Understanding with the Ministry of Education (Education Review Office (ERO), 2014). The
units could vary in what they offered students, due to deviations both in these agreements,
and in the resources available in the governing school and local community. National
guidelines were developed in 2014 and implemented by 2015.
The first TPU was set up in Porirua in 1994 (Baragwanath, 1997). Since then, new units have
progressively been established in other parts of the country. Establishment is driven by
community interest and national need. Before establishing a new TPU there needs to be
interest from a potential governing school, evidence that a minimum of 15 students are ready
to enrol, evidence of roll sustainability, space available to accommodate a TPU and links
2 While teen fathers are also able to enrol, in practice few attend these units (Families Commission, 2011).

11
with an early childhood education service. The Ministry of Education is the final arbiter on
resourcing a new TPU (ERO, 2007; ERO, 2011; ERO, 2014).
At the time of writing, the Ministry of Education funded 23 TPUs.3 Young parents in many
parts of the country did not have access to a TPU. In 2014, the Ministry set up the “Teen
Parents in Mainstream Schools” pilot programme to provide additional support to schools
and students in areas where a TPU was either not available, or an existing unit did not have
the capacity to take on additional students. At the time of this writing, this pilot programme
was undergoing evaluation.
3 See Appendix Table 1 for details of the locations of these units.
12
3 Existing Evidence Base
Consistent with international literature, New Zealand’s long-standing Christchurch and
Dunedin longitudinal studies have shown strong associations between adversity in childhood
and adolescence, early transition to parenthood, and educational underachievement and other
poor outcomes in adulthood (Woodward and Fergusson, 1999; Fergusson and Woodward,
2000; Boden et al., 2008; Gibb et al., 2015; Jaffee et al., 2001). A study on the more recent
Growing Up in New Zealand cohort highlights the clustering of young maternal age with
other risk factors such as having no partner, low education level, smoking during pregnancy
and receipt of an income-tested welfare benefit (Morton et al., 2015).
Other New Zealand studies have documented the very high needs of many of the students
attending TPUs (Johnson and Denny, 2007), and the barriers young mothers can face in
accessing information, health services and other support services (Makowharemahihi et al.,
2014; Johnson and Denny, 2007; Rawiri, 2007).
While these studies provide evidence that supports the provision of specialist and intensive
services for young parents and their children, to date there has been no quantitative study that
establishes whether TPUs are effective in improving the educational outcomes for teenage
parents (ERO, 2014). Nor has there been any investigation of their efficacy and cost
effectiveness relative to other interventions such as intensive home visiting, supported
housing, or enhanced services in mainstream school settings.
Those studies that are available have provided some cause for optimism that TPUs do have a
positive effect. In a small in-depth longitudinal qualitative study, young mothers who had
attended a TPU reported it as being helpful in changing the course of their lives for the better.
They had gained access to a service that gave them the opportunity to continue their
education, gave focus to their lives, led to new relationships with skilled and competent
adults, and provided ready access to services for themselves and their children (Collins,
2010).
These themes are echoed in a student writing project (He Huarahi Tamariki, 2015) and a
small study focused on the experiences of Māori teenage mothers, most of whom attended a
13
TPU (Rawiri, 2007). Results from a survey of 220 students from 19 TPUs showed that most
felt safe and supported by their TPU, had plans to get more education or training after leaving
the TPU, and reported that their expectations for the future had become more positive since
having their baby (Johnson and Denny, 2007).
There have been multiple reports on TPUs by ERO, the Government agency responsible for
evaluating and reporting on the education and care of students in schools and early childhood
services. These reports are qualitative in nature, and have looked closely at performance,
process and governance issues. They document a range of practices that would be expected to
lead to better educational, social, health and well-being outcomes for students, and stories of
students’ success. At the same time, however, they highlight difficulties with student
attendance and retention, and while most TPUs are assessed as performing well, some are not
(ERO, 2007; ERO, 2011; ERO, 2014).
Initial development and design of TPUs was informed by specialised “schools-within-
schools” operating in the United States (Baragwanath, 1997; Eisenhower Fellowships, no
date). There have been few robust studies of the effectiveness of these schools, or other
United States school-based interventions for adolescent parents and their children (Lachance
et al., 2012; Pinzon and Jones, 2012; Seitz and Apfel, 1999).
Some of the strongest evidence that specialised school-based services can improve outcomes
comes from an evaluation of the New Haven McCabe Centre, a school for pregnant
teenagers. Women whose enrolment in the school was delayed due to the long summer
vacation were more likely than other enrollees to have a pre-term birth. Maximum possible
duration of enrolment in the school was, in effect, randomly allocated because students were
only allowed to attend until the end of the school quarter in which their baby was born. After
disregarding students who dropped out early, those allowed to remain in the school longer
than seven weeks post-birth were less likely to have a subsequent child after a five year
follow-up than those who were allowed to remain for a shorter period. In addition, for
students who had been performing poorly prior to becoming pregnant, there was a positive
association between the length of time they were allowed to attend and their educational
outcomes (Seitz and Apfel, 1999).
14
Additional evidence suggestive of a positive impact on educational outcomes from a teen-
parent school programme comes from an impact evaluation of on-site high-quality childcare
that was made available to teen mothers in New York State conditional on their school
attendance. The childcare centres were a source of advocacy and support, parent education,
and connection to other community agencies. The evaluation compared mothers who enrolled
in the programme with those who applied for enrolment and were placed on a waiting list but
did not go on to participate. The latter group of mothers who were used as a control group
showed significantly more adverse pre-programme histories compared to those who were
enrolled. While the study found positive impacts after controlling for these differences,
unobserved differences in risk and motivation may have remained (Crean et al., 2001).
Other programmes that are not school-based, but have some similarities to TPUs in the
package of support services they provide, have been examined in a series of randomised
controlled trials in the United States. A systematic review by Harden and colleagues (2006)
found that programmes for teenage mothers that encouraged them to go back to school or
college and provided assistance with childcare were successful in encouraging participation
in education or training. High-quality programmes that focused on young mothers’ education
and career development without use of sanctions were more effective than those that used
sanctions and incentives as part of the intervention. Across both types of programmes (those
that used sanctions and incentives, and those that focused on education and career
development), positive effects on participation in education and training did not necessarily
translate into better rates of employment in the short-term. Young mothers in the intervention
and control groups had very similar employment rates two to four years later (Harden et al.,
2006).
The aim of the present study is to examine the impact of New Zealand’s TPUs on educational
outcomes. Our findings strengthen the international evidence-base on specialised school-
based services for teen parents.

15
4 Data Sources
The data used for this study are from a de-identified linkage of New Zealand Government-
held administrative data.4 Included in the linkage are data from the Ministry of Education
(MoE) ENROL system, which covers private, public, correspondence, denominational and
special schools, that is, all registered schools.5 Also included are New Zealand Qualifications
Authority data held by the MoE on standards attained, associated credit values, and years of
attainment.
The MoE ENROL data coverage expanded from 2006 to the end of 2007 by which time it
covered all schools. The data include enrolment episodes, with the start and finish dates of
spells at each school in which the student is enrolled. A limitation for our purposes is that
these records do not allow us to establish whether a young woman who has had a teen birth is
enrolled in a TPU, only whether she is enrolled in a school that is a governing school for a
TPU. The data were extracted for our study in April 2014.
To be included in our study, a young woman had to be born between 1 Jan 1991 and 31
December 1994 and enrolled in a New Zealand school for at least one day between the start
of the ENROL data in 2006 and 1 January 2008.6 This yields 125,760 young women in the
study sample.
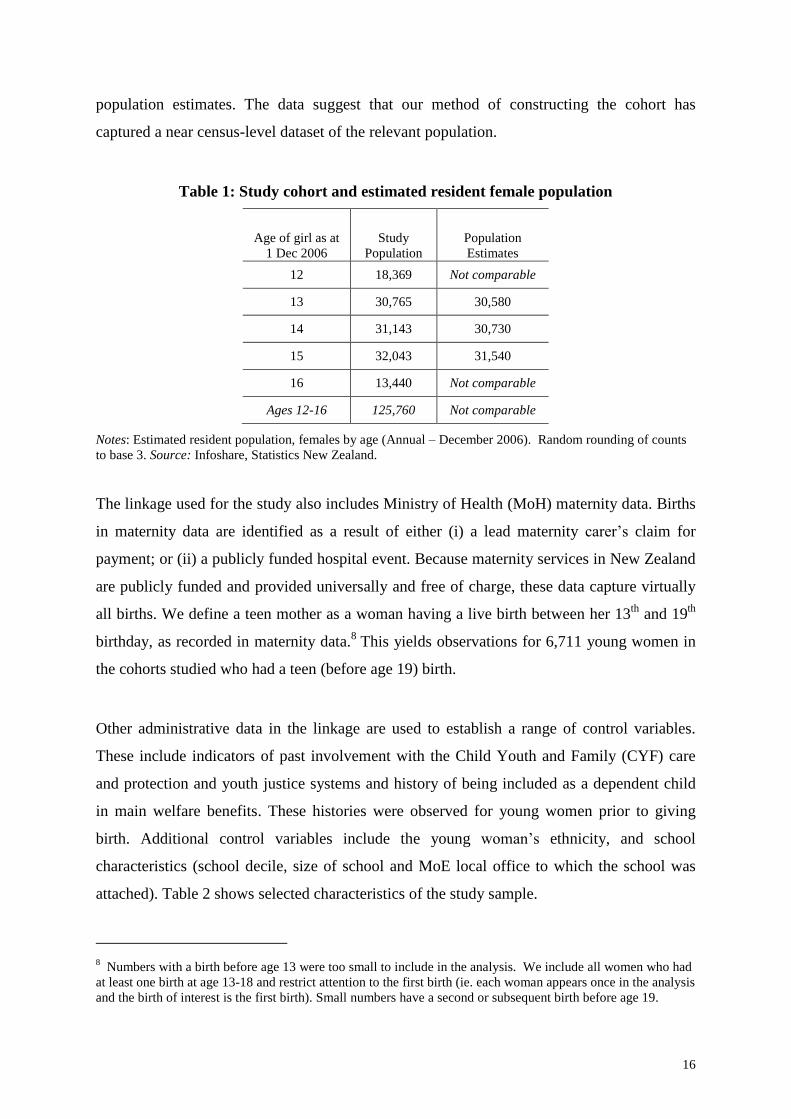
To establish how comprehensive the data are, Table 1 shows the population size in the study
and compares it to national population estimates as at 1 December 2006. 7
We have only
partial cohorts for both 12 and 16 year olds. The analysis suggests that we have around 1,000
more individuals in our sample than the Statistics New Zealand December 2006 population
estimates. Discrepancies could be due to young women migrating to New Zealand between
December 2006 and 1 Jan 2008 who would be included in our data but not necessarily in the
4 This linkage is held in the Statistics New Zealand Data Lab. It is not part of the Statistics New Zealand
Integrated Data Infrastructure. 5 Children and young people in home education are not included in the data set.
6 We drop women whose first enrolment record is after 1 January 2008 because we assume these young women
were immigrants and we therefore cannot tell if they have given birth prior to entering the country. 7 Based on Statistics New Zealand Infoshare downloaded on 20/01/16. Table reference DPE058AA.
16
population estimates. The data suggest that our method of constructing the cohort has
captured a near census-level dataset of the relevant population.
Table 1: Study cohort and estimated resident female population
Age of girl as at
1 Dec 2006
Study
Population
Population
Estimates
12 18,369 Not comparable
13 30,765 30,580
14 31,143 30,730
15 32,043 31,540
16 13,440 Not comparable
Ages 12-16 125,760 Not comparable
Notes: Estimated resident population, females by age (Annual – December 2006). Random rounding of counts
to base 3. Source: Infoshare, Statistics New Zealand.
The linkage used for the study also includes Ministry of Health (MoH) maternity data. Births
in maternity data are identified as a result of either (i) a lead maternity carer’s claim for
payment; or (ii) a publicly funded hospital event. Because maternity services in New Zealand
are publicly funded and provided universally and free of charge, these data capture virtually
all births. We define a teen mother as a woman having a live birth between her 13th
and 19th
birthday, as recorded in maternity data.8 This yields observations for 6,711 young women in
the cohorts studied who had a teen (before age 19) birth.
Other administrative data in the linkage are used to establish a range of control variables.
These include indicators of past involvement with the Child Youth and Family (CYF) care
and protection and youth justice systems and history of being included as a dependent child
in main welfare benefits. These histories were observed for young women prior to giving
birth. Additional control variables include the young woman’s ethnicity, and school
characteristics (school decile, size of school and MoE local office to which the school was
attached). Table 2 shows selected characteristics of the study sample.
8 Numbers with a birth before age 13 were too small to include in the analysis. We include all women who had
at least one birth at age 13-18 and restrict attention to the first birth (ie. each woman appears once in the analysis
and the birth of interest is the first birth). Small numbers have a second or subsequent birth before age 19.

17
Table 2: Characteristics of study sample
Teen Mothers Rest of Sample All
European 45% 65% 64%
Māori 52% 20% 22%
Pacific 13% 10% 10%
Asian 2% 11% 10%
Other ethnic group 1% 2% 2%
1991 Birth Cohort 31% 26% 26%
1992 Birth Cohort 29% 25% 25%
1993 Birth Cohort 26% 25% 25%
1994 Birth Cohort 14% 25% 24%
Main Urban Area 67% 75% 75%
Minor Urban area 15% 12% 12%
Rural Area 3% 3% 23%
Any CYF placement prior to
birth of child 13% 2% 3%
Any CYF Youth Justice
referral prior to birth of child 13% 2% 2%
First observed school was
Decile 1-3 36% 19% 20%
n 6,711 119,052 125,763
Notes: Study sample of young women in cohorts born between 1 Jan 1991 and 31 December 1994 and enrolled
in a New Zealand school for at least one day between the start of ENROL in 2006 and 1 January 2008. Teen
mothers are those who recorded a live birth between 13th
and 19th
birthday in the MoH maternity data. Ethnic
identity variables refer to non-prioritised ‘total response’ measures derived from MoE Enrol data (Ethnic1,
Ethnic2 and Ethnic3 variables).
Outcomes that we are concerned with in this study are enrolment in a school by the young
woman after giving birth and eventual attainment of NCEA Level 1 and 2 qualifications.
ENROL data allow us to examine post-birth enrolment status of young mothers in the study.
While schooling is compulsory up until the 16th
birthday, 83 percent of students overall
remain at school to their 17th
birthday or beyond.9
The NCEA system is New Zealand’s main national qualification standard for secondary
students. Students generally begin NCEA Level 1 in year 11 (typically commencing at age
15) and continue on to NCEA Level 2 in year 12. As noted, we are able to access data that
9 See http://www.educationcounts.govt.nz/indicators/main/student-engagement-participation/1955.
18
provide detailed information about the standards and associated credits achieved by each
student. Using information about how credits translate into qualifications (i.e., the
requirements for the completion of NCEA Level 1 and 2 qualifications) we estimate whether
the student received the qualification,10
and also the calendar year in which it was completed.
This allows us to estimate whether the young mothers in our study obtained a qualification
after giving birth.
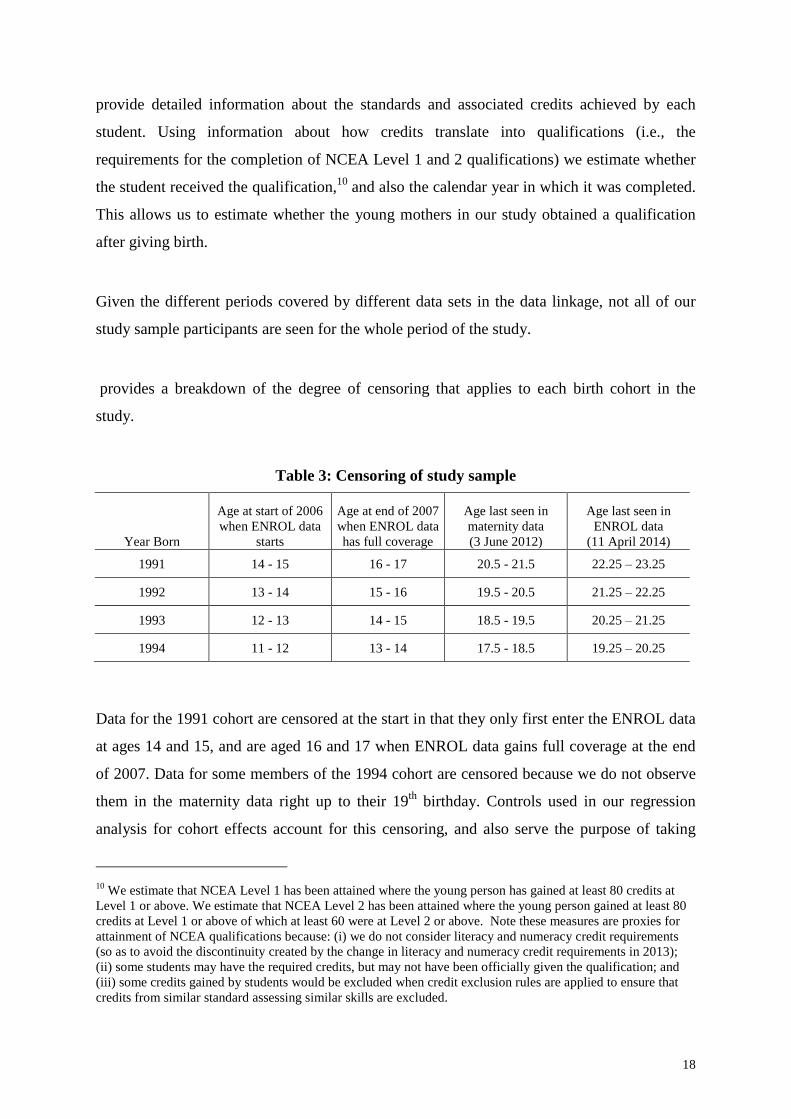
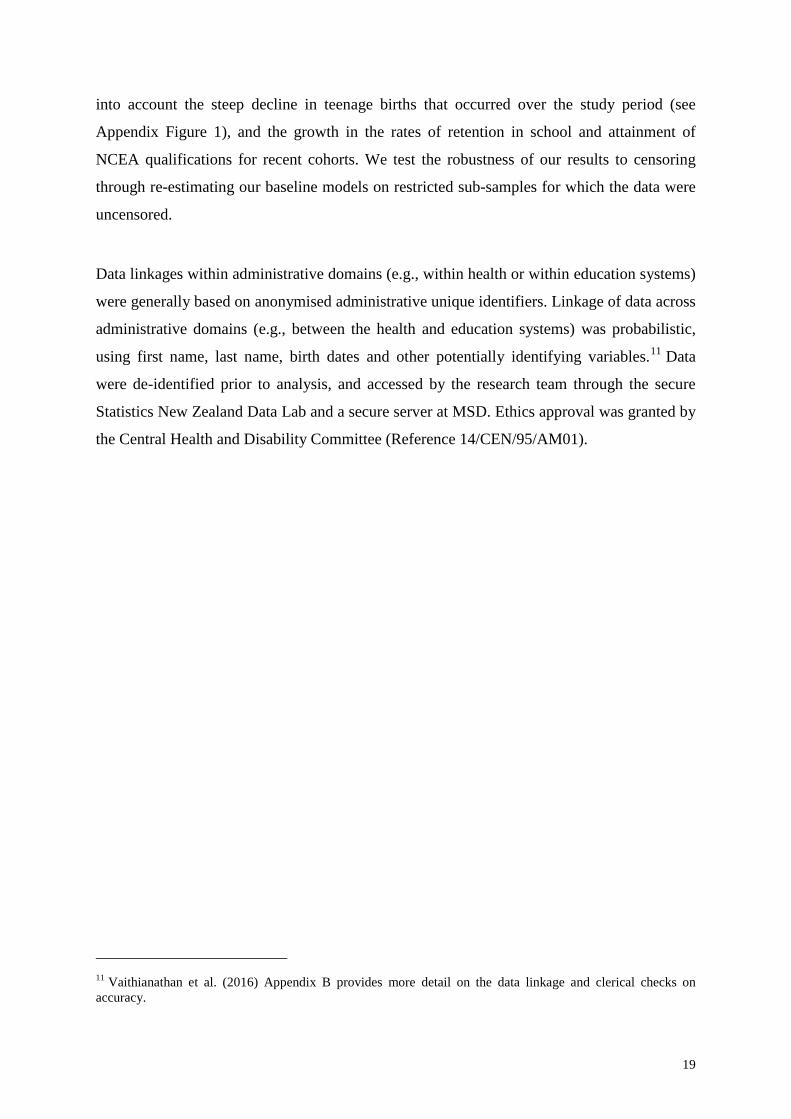
Given the different periods covered by different data sets in the data linkage, not all of our
study sample participants are seen for the whole period of the study.
provides a breakdown of the degree of censoring that applies to each birth cohort in the
study.
Table 3: Censoring of study sample
Year Born
Age at start of 2006
when ENROL data
starts
Age at end of 2007
when ENROL data
has full coverage
Age last seen in
maternity data
(3 June 2012)
Age last seen in
ENROL data
(11 April 2014)
1991 14 - 15 16 - 17 20.5 - 21.5 22.25 – 23.25
1992 13 - 14 15 - 16 19.5 - 20.5 21.25 – 22.25
1993 12 - 13 14 - 15 18.5 - 19.5 20.25 – 21.25
1994 11 - 12 13 - 14 17.5 - 18.5 19.25 – 20.25
Data for the 1991 cohort are censored at the start in that they only first enter the ENROL data
at ages 14 and 15, and are aged 16 and 17 when ENROL data gains full coverage at the end
of 2007. Data for some members of the 1994 cohort are censored because we do not observe
them in the maternity data right up to their 19th
birthday. Controls used in our regression
analysis for cohort effects account for this censoring, and also serve the purpose of taking
10
We estimate that NCEA Level 1 has been attained where the young person has gained at least 80 credits at
Level 1 or above. We estimate that NCEA Level 2 has been attained where the young person gained at least 80
credits at Level 1 or above of which at least 60 were at Level 2 or above. Note these measures are proxies for
attainment of NCEA qualifications because: (i) we do not consider literacy and numeracy credit requirements
(so as to avoid the discontinuity created by the change in literacy and numeracy credit requirements in 2013);
(ii) some students may have the required credits, but may not have been officially given the qualification; and
(iii) some credits gained by students would be excluded when credit exclusion rules are applied to ensure that
credits from similar standard assessing similar skills are excluded.
19
into account the steep decline in teenage births that occurred over the study period (see
Appendix Figure 1), and the growth in the rates of retention in school and attainment of
NCEA qualifications for recent cohorts. We test the robustness of our results to censoring
through re-estimating our baseline models on restricted sub-samples for which the data were
uncensored.
Data linkages within administrative domains (e.g., within health or within education systems)
were generally based on anonymised administrative unique identifiers. Linkage of data across
administrative domains (e.g., between the health and education systems) was probabilistic,
using first name, last name, birth dates and other potentially identifying variables.11
Data
were de-identified prior to analysis, and accessed by the research team through the secure
Statistics New Zealand Data Lab and a secure server at MSD. Ethics approval was granted by
the Central Health and Disability Committee (Reference 14/CEN/95/AM01).
11
Vaithianathan et al. (2016) Appendix B provides more detail on the data linkage and clerical checks on
accuracy.
20
5 Describing Enrolment Patterns of Young Mothers
Before turning to our main analysis, it is useful to understand the enrolment patterns of young
women who give birth. For this purpose, we define a conception date as the (approximate)
date on which the young woman conceived. We utilise maternity data, which record the
gestational age of the baby at birth. By subtracting the gestational age from the baby’s date of
birth, we are able to establish the approximate date of conception. We define the young
woman’s enrolment status at conception as either: (i) enrolled in a TPU governing school; (ii)
enrolled in a non-TPU school; or (iii) unenrolled.
We find that some of our sample end a spell of enrolment in December at the end of the
school year, and then re-enrol in February after the summer break (although this is not the
case for the majority of young women who are officially recorded as being enrolled through
the summer break). In the case of these summer unenrolled sample members, if the young
woman conceived during this summer period, we cannot know if she was intending to return
to school. In the descriptive tables below, we consider her unenrolled if she was unenrolled at
the start of the summer in which she conceived (i.e. we assume she would not have re-
enrolled after the summer). We test sensitivity to excluding women who conceived in the
summer break.
We define enrolment status post-birth based on a young woman’s schooling engagement after
the birth of her baby and before the last date where we are able to observe her in the ENROL
data (April 2014). A young woman’s post-birth enrolment status can be defined as either: (i)
enrolled in a TPU governing school;12
(ii) enrolled in a non-TPU school; or (iii) unenrolled.
We prioritise TPU governing school enrolment so that a young woman who has at any point
enrolled in a TPU governing school post-birth is classified as enrolled in a TPU governing
school. If she enrols after birth but never enrolled in a TPU governing school, we classify her
as enrolled in a non-TPU school. Error! Reference source not found. describes the
enrolment status of teen mothers at conception including and excluding those who conceived
in the summer periods. We also calculate this statistic for young women who conceived in
12
Recall that we are not able to see if a woman is enrolled in and attending the TPU, only that she is enrolled at
a governing school for a TPU.
21
2008 or later. This is to address the concerns about data censoring – data on enrolment status
at conception for those who conceived in 2006 and 2007 might be patchy due to ENROL data
not being comprehensive until the end of 2007.
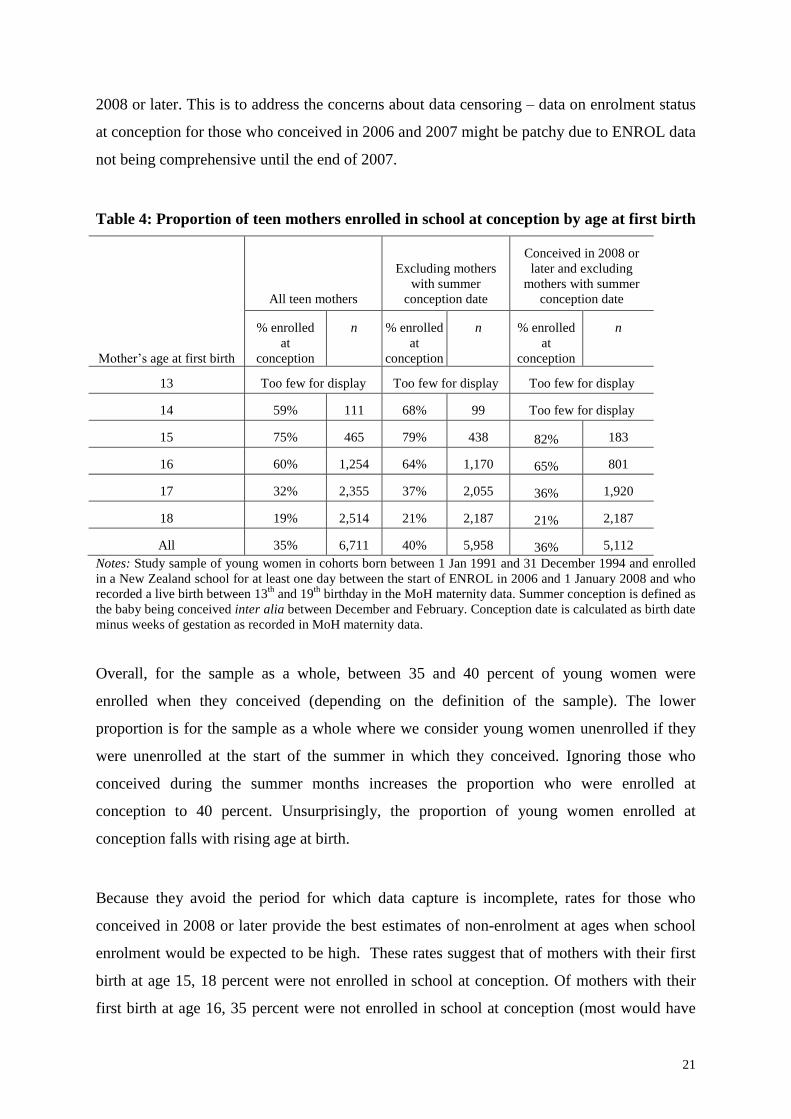
Table 4: Proportion of teen mothers enrolled in school at conception by age at first birth
Mother’s age at first birth
All teen mothers
Excluding mothers
with summer
conception date
Conceived in 2008 or
later and excluding
mothers with summer
conception date
% enrolled
at
conception
n % enrolled
at
conception
n % enrolled
at
conception
n
13 Too few for display Too few for display Too few for display
14 59% 111 68% 99 Too few for display
15 75% 465 79% 438 82% 183
16 60% 1,254 64% 1,170 65% 801
17 32% 2,355 37% 2,055 36% 1,920
18 19% 2,514 21% 2,187 21% 2,187
All 35% 6,711 40% 5,958 36% 5,112
Notes: Study sample of young women in cohorts born between 1 Jan 1991 and 31 December 1994 and enrolled
in a New Zealand school for at least one day between the start of ENROL in 2006 and 1 January 2008 and who
recorded a live birth between 13th
and 19th
birthday in the MoH maternity data. Summer conception is defined as
the baby being conceived inter alia between December and February. Conception date is calculated as birth date
minus weeks of gestation as recorded in MoH maternity data.
Overall, for the sample as a whole, between 35 and 40 percent of young women were
enrolled when they conceived (depending on the definition of the sample). The lower
proportion is for the sample as a whole where we consider young women unenrolled if they
were unenrolled at the start of the summer in which they conceived. Ignoring those who
conceived during the summer months increases the proportion who were enrolled at
conception to 40 percent. Unsurprisingly, the proportion of young women enrolled at
conception falls with rising age at birth.
Because they avoid the period for which data capture is incomplete, rates for those who
conceived in 2008 or later provide the best estimates of non-enrolment at ages when school
enrolment would be expected to be high. These rates suggest that of mothers with their first
birth at age 15, 18 percent were not enrolled in school at conception. Of mothers with their
first birth at age 16, 35 percent were not enrolled in school at conception (most would have
22
been of compulsory school age at conception). Consistent with findings for the Christchurch
birth cohort (Fergusson and Woodward, 2000), these data show that even prior to giving
birth, young mothers had a low rate of engagement with schooling.
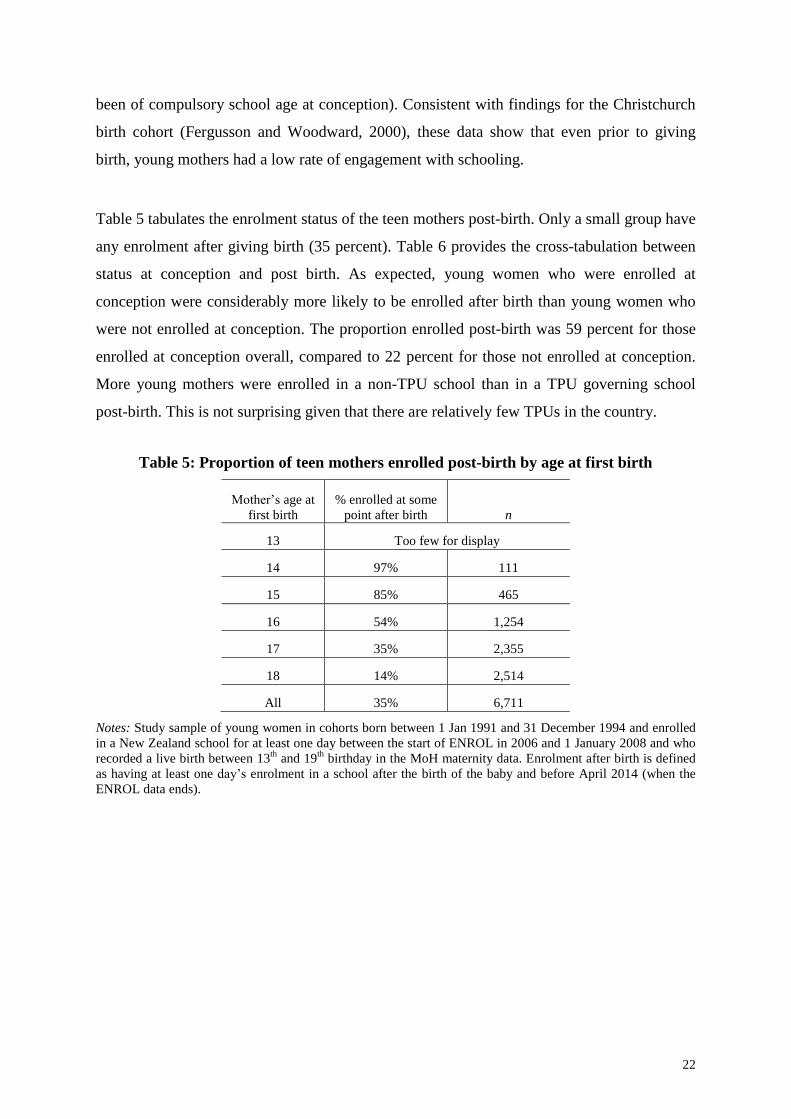
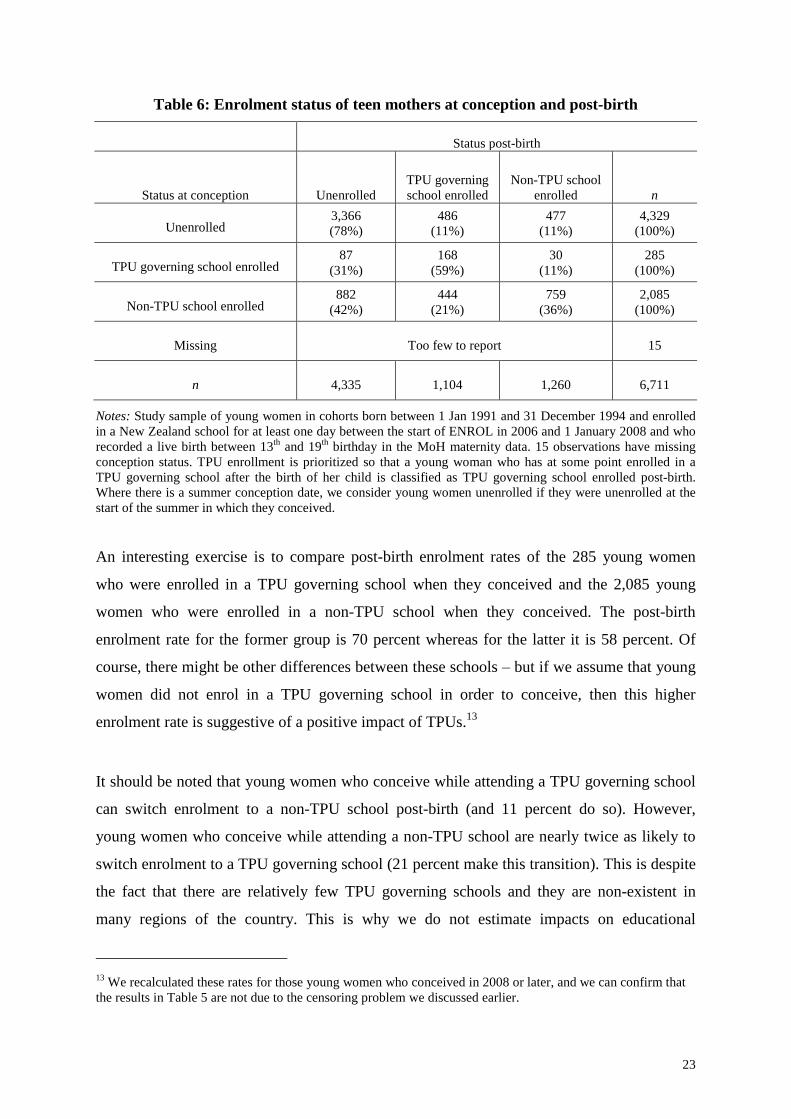
Table 5 tabulates the enrolment status of the teen mothers post-birth. Only a small group have
any enrolment after giving birth (35 percent). Table 6 provides the cross-tabulation between
status at conception and post birth. As expected, young women who were enrolled at
conception were considerably more likely to be enrolled after birth than young women who
were not enrolled at conception. The proportion enrolled post-birth was 59 percent for those
enrolled at conception overall, compared to 22 percent for those not enrolled at conception.
More young mothers were enrolled in a non-TPU school than in a TPU governing school
post-birth. This is not surprising given that there are relatively few TPUs in the country.
Table 5: Proportion of teen mothers enrolled post-birth by age at first birth
Mother’s age at
first birth
% enrolled at some
point after birth n
13 Too few for display
14 97% 111
15 85% 465
16 54% 1,254
17 35% 2,355
18 14% 2,514
All 35% 6,711
Notes: Study sample of young women in cohorts born between 1 Jan 1991 and 31 December 1994 and enrolled
in a New Zealand school for at least one day between the start of ENROL in 2006 and 1 January 2008 and who
recorded a live birth between 13th
and 19th
birthday in the MoH maternity data. Enrolment after birth is defined
as having at least one day’s enrolment in a school after the birth of the baby and before April 2014 (when the
ENROL data ends).
23
Table 6: Enrolment status of teen mothers at conception and post-birth
Status post-birth
Status at conception Unenrolled
TPU governing
school enrolled
Non-TPU school
enrolled n
Unenrolled 3,366
(78%)
486
(11%)
477
(11%)
4,329
(100%)
TPU governing school enrolled 87
(31%)
168
(59%)
30
(11%)
285
(100%)
Non-TPU school enrolled 882
(42%)
444
(21%)
759
(36%)
2,085
(100%)
Missing Too few to report 15
n 4,335 1,104 1,260 6,711
Notes: Study sample of young women in cohorts born between 1 Jan 1991 and 31 December 1994 and enrolled
in a New Zealand school for at least one day between the start of ENROL in 2006 and 1 January 2008 and who
recorded a live birth between 13th
and 19th
birthday in the MoH maternity data. 15 observations have missing
conception status. TPU enrollment is prioritized so that a young woman who has at some point enrolled in a
TPU governing school after the birth of her child is classified as TPU governing school enrolled post-birth.
Where there is a summer conception date, we consider young women unenrolled if they were unenrolled at the
start of the summer in which they conceived.
An interesting exercise is to compare post-birth enrolment rates of the 285 young women
who were enrolled in a TPU governing school when they conceived and the 2,085 young
women who were enrolled in a non-TPU school when they conceived. The post-birth
enrolment rate for the former group is 70 percent whereas for the latter it is 58 percent. Of
course, there might be other differences between these schools – but if we assume that young
women did not enrol in a TPU governing school in order to conceive, then this higher
enrolment rate is suggestive of a positive impact of TPUs.13
It should be noted that young women who conceive while attending a TPU governing school
can switch enrolment to a non-TPU school post-birth (and 11 percent do so). However,
young women who conceive while attending a non-TPU school are nearly twice as likely to
switch enrolment to a TPU governing school (21 percent make this transition). This is despite
the fact that there are relatively few TPU governing schools and they are non-existent in
many regions of the country. This is why we do not estimate impacts on educational
13
We recalculated these rates for those young women who conceived in 2008 or later, and we can confirm that
the results in Table 5 are not due to the censoring problem we discussed earlier.

24
attendance and attainment based on enrolment in a TPU governing school post-birth. If we
were to use such an estimation strategy, potential sample selection effects resulting from
more motivated teen mothers migrating to these units could bias the estimated impacts of
TPUs on the educational outcomes of teen mothers.
25
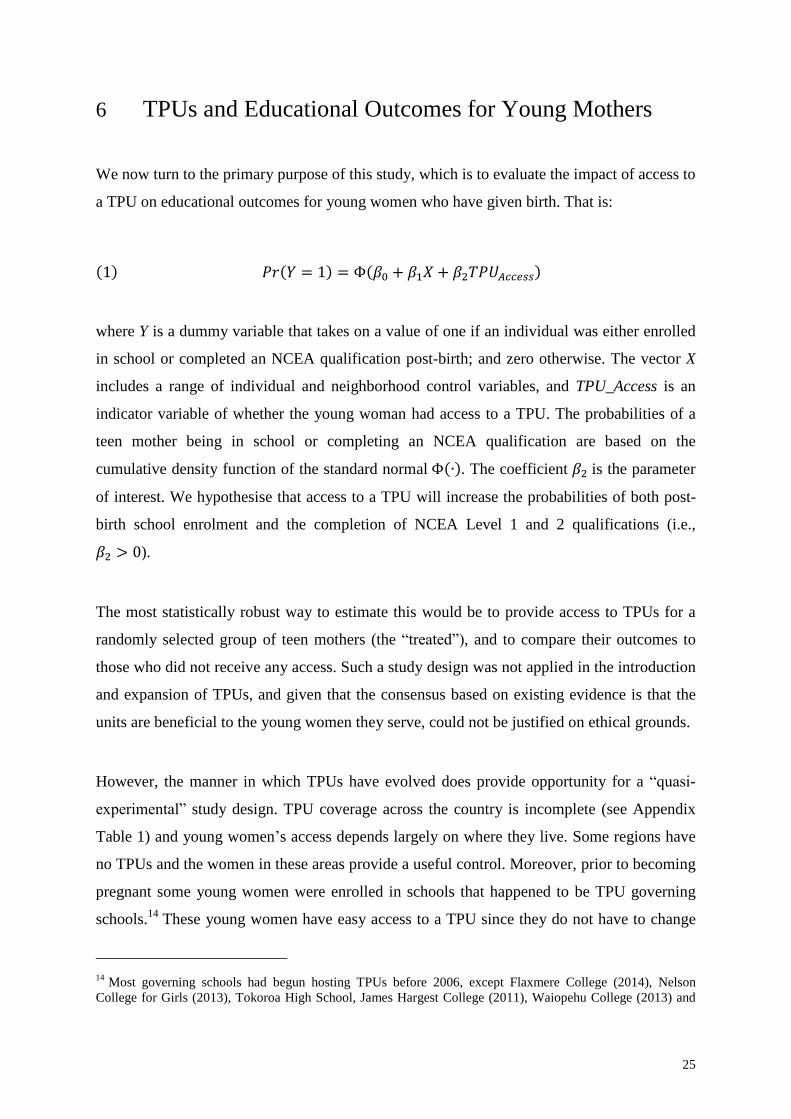
6 TPUs and Educational Outcomes for Young Mothers
We now turn to the primary purpose of this study, which is to evaluate the impact of access to
a TPU on educational outcomes for young women who have given birth. That is:
(1) 𝑃𝑟(𝑌 = 1) = Φ(𝛽0 + 𝛽1𝑋 + 𝛽2𝑇𝑃𝑈𝐴𝑐𝑐𝑒𝑠𝑠)
where Y is a dummy variable that takes on a value of one if an individual was either enrolled
in school or completed an NCEA qualification post-birth; and zero otherwise. The vector X
includes a range of individual and neighborhood control variables, and TPU_Access is an
indicator variable of whether the young woman had access to a TPU. The probabilities of a
teen mother being in school or completing an NCEA qualification are based on the
cumulative density function of the standard normal Φ(∙). The coefficient 𝛽2 is the parameter
of interest. We hypothesise that access to a TPU will increase the probabilities of both post-
birth school enrolment and the completion of NCEA Level 1 and 2 qualifications (i.e.,
𝛽2 > 0).
The most statistically robust way to estimate this would be to provide access to TPUs for a
randomly selected group of teen mothers (the “treated”), and to compare their outcomes to
those who did not receive any access. Such a study design was not applied in the introduction
and expansion of TPUs, and given that the consensus based on existing evidence is that the
units are beneficial to the young women they serve, could not be justified on ethical grounds.
However, the manner in which TPUs have evolved does provide opportunity for a “quasi-
experimental” study design. TPU coverage across the country is incomplete (see Appendix
Table 1) and young women’s access depends largely on where they live. Some regions have
no TPUs and the women in these areas provide a useful control. Moreover, prior to becoming
pregnant some young women were enrolled in schools that happened to be TPU governing
schools.14
These young women have easy access to a TPU since they do not have to change
14
Most governing schools had begun hosting TPUs before 2006, except Flaxmere College (2014), Nelson
College for Girls (2013), Tokoroa High School, James Hargest College (2011), Waiopehu College (2013) and
26
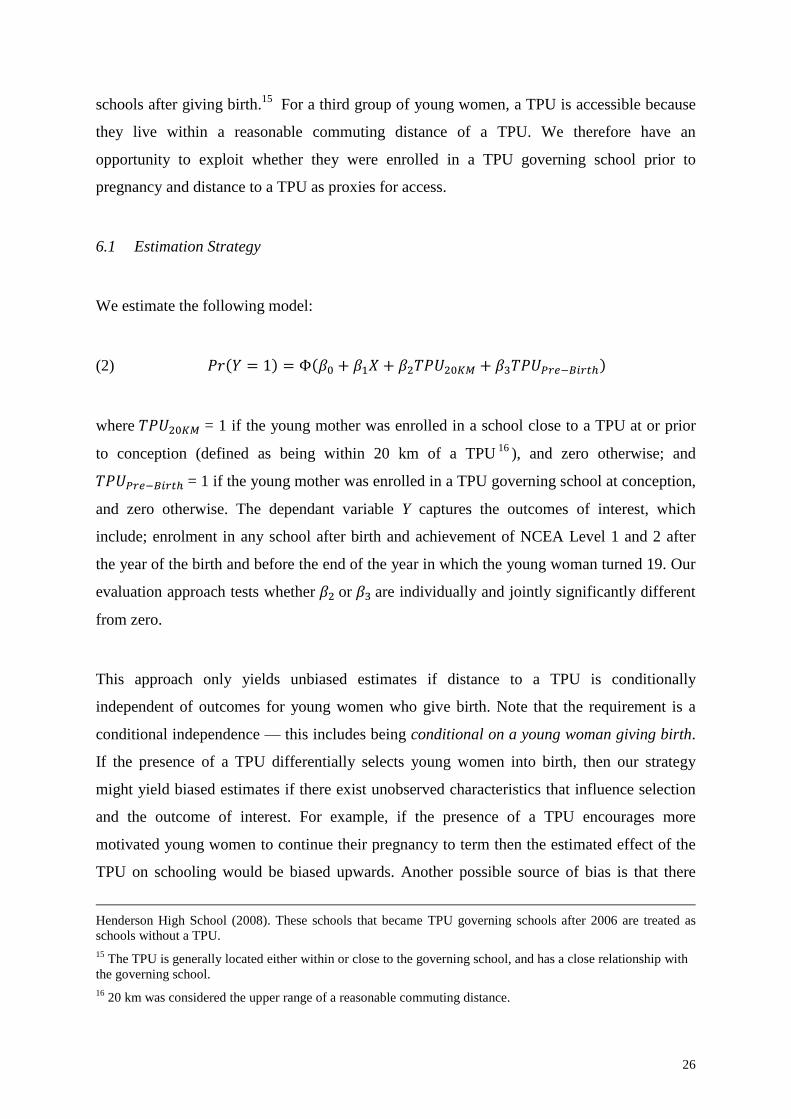
schools after giving birth.15
For a third group of young women, a TPU is accessible because
they live within a reasonable commuting distance of a TPU. We therefore have an
opportunity to exploit whether they were enrolled in a TPU governing school prior to
pregnancy and distance to a TPU as proxies for access.
6.1 Estimation Strategy
We estimate the following model:
(2) 𝑃𝑟(𝑌 = 1) = Φ(𝛽0 + 𝛽1𝑋 + 𝛽2𝑇𝑃𝑈20𝐾𝑀 + 𝛽3𝑇𝑃𝑈𝑃𝑟𝑒−𝐵𝑖𝑟𝑡ℎ)
where 𝑇𝑃𝑈20𝐾𝑀 = 1 if the young mother was enrolled in a school close to a TPU at or prior
to conception (defined as being within 20 km of a TPU16
), and zero otherwise; and
𝑇𝑃𝑈𝑃𝑟𝑒−𝐵𝑖𝑟𝑡ℎ = 1 if the young mother was enrolled in a TPU governing school at conception,
and zero otherwise. The dependant variable Y captures the outcomes of interest, which
include; enrolment in any school after birth and achievement of NCEA Level 1 and 2 after
the year of the birth and before the end of the year in which the young woman turned 19. Our
evaluation approach tests whether 𝛽2 or 𝛽3 are individually and jointly significantly different
from zero.
This approach only yields unbiased estimates if distance to a TPU is conditionally
independent of outcomes for young women who give birth. Note that the requirement is a
conditional independence — this includes being conditional on a young woman giving birth.
If the presence of a TPU differentially selects young women into birth, then our strategy
might yield biased estimates if there exist unobserved characteristics that influence selection
and the outcome of interest. For example, if the presence of a TPU encourages more
motivated young women to continue their pregnancy to term then the estimated effect of the
TPU on schooling would be biased upwards. Another possible source of bias is that there
Henderson High School (2008). These schools that became TPU governing schools after 2006 are treated as
schools without a TPU.
15 The TPU is generally located either within or close to the governing school, and has a close relationship with
the governing school.
16 20 km was considered the upper range of a reasonable commuting distance.
27
may exist unobserved differences in the quality of schooling and supports for young mothers
in areas that do and do not have access to TPUs. A priori it is unclear what the sign of these
potential biases would be. In any case, we address these contamination issues later in this
paper by undertaking robustness testing.
In constructing the distance dummy (𝑇𝑃𝑈20𝐾𝑀), we do not have information on the young
woman’s home address and therefore use distance between the school in which the young
woman was enrolled at conception and the closest TPU. For those young women who were
not enrolled at the time of conception, we use the distance of the last school in which they
were enrolled prior to conception to the nearest TPU. We use a proximity measure defined as
less than 20 km driving distance from the conception school. 17
6.2 Schooling Outcomes for Young Mothers and Proximity to a TPU
We now turn to the results of estimating the model given in equation (2) for young women
who have a teen (under 19) birth. The term 𝑋𝑖 represents a vector of characteristics at the
individual, school and neighbourhood levels. At the individual level, we include whether the
young woman was enrolled at the time of conception, her birth cohort, age at first birth,
ethnicity, indicators of her previous involvement with CYF care and protection and CYF
Youth Justice services; and the count of days the young woman was included in a main
welfare benefit before age five, a proxy for early exposure to poverty. School level controls
include whether the first school the young woman was observed enrolled in was decile 1-3
(based on 2014 school deciles), and the MoE local office. Neighbourhood controls include
the rural or urban classification of the young woman’s census area as at the time of her
child’s birth (from MoH maternity data).18
17
We used a ‘macro’ that Google Searches the origin and destination and returns the corresponding distance
between the TPU governing school and conception school locations in km. Where the physical address of the
governing school was different to the physical address of the TPU, we use the physical address of the TPU.
18 There are 954 individuals with missing data on distance between pre-conception school and the nearest TPU,
which represents 14.2 percent of the sample. These observations were excluded from our regression analysis
because of this key missing covariate.
28
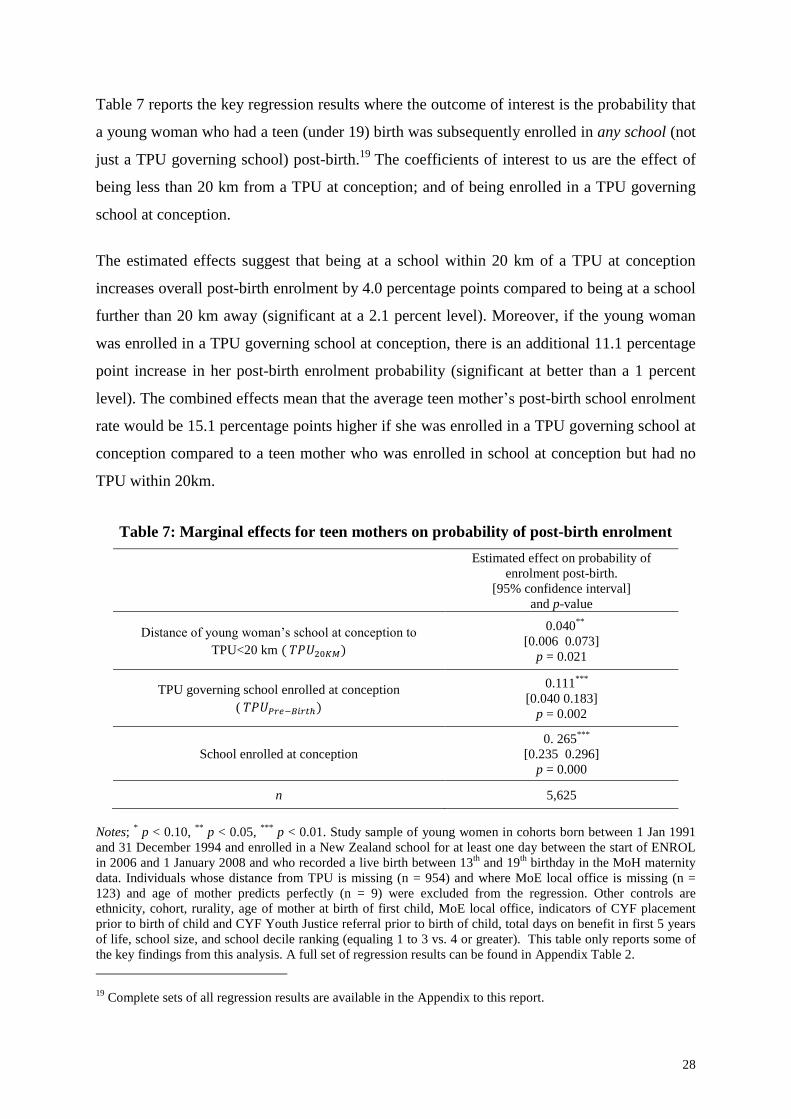
Table 7 reports the key regression results where the outcome of interest is the probability that
a young woman who had a teen (under 19) birth was subsequently enrolled in any school (not
just a TPU governing school) post-birth.19
The coefficients of interest to us are the effect of
being less than 20 km from a TPU at conception; and of being enrolled in a TPU governing
school at conception.
The estimated effects suggest that being at a school within 20 km of a TPU at conception
increases overall post-birth enrolment by 4.0 percentage points compared to being at a school
further than 20 km away (significant at a 2.1 percent level). Moreover, if the young woman
was enrolled in a TPU governing school at conception, there is an additional 11.1 percentage
point increase in her post-birth enrolment probability (significant at better than a 1 percent
level). The combined effects mean that the average teen mother’s post-birth school enrolment
rate would be 15.1 percentage points higher if she was enrolled in a TPU governing school at
conception compared to a teen mother who was enrolled in school at conception but had no
TPU within 20km.
Table 7: Marginal effects for teen mothers on probability of post-birth enrolment
Estimated effect on probability of
enrolment post-birth.
[95% confidence interval]
and p-value
Distance of young woman’s school at conception to
TPU<20 km ( 𝑇𝑃𝑈20𝐾𝑀)
0.040**
[0.006 0.073] p = 0.021
TPU governing school enrolled at conception
( 𝑇𝑃𝑈𝑃𝑟𝑒−𝐵𝑖𝑟𝑡ℎ)
0.111***
[0.040 0.183] p = 0.002
School enrolled at conception 0. 265
*** [0.235 0.296]
p = 0.000
n 5,625
Notes; * p < 0.10,
** p < 0.05,
*** p < 0.01. Study sample of young women in cohorts born between 1 Jan 1991
and 31 December 1994 and enrolled in a New Zealand school for at least one day between the start of ENROL
in 2006 and 1 January 2008 and who recorded a live birth between 13th
and 19th
birthday in the MoH maternity
data. Individuals whose distance from TPU is missing (n = 954) and where MoE local office is missing (n =
123) and age of mother predicts perfectly (n = 9) were excluded from the regression. Other controls are
ethnicity, cohort, rurality, age of mother at birth of first child, MoE local office, indicators of CYF placement
prior to birth of child and CYF Youth Justice referral prior to birth of child, total days on benefit in first 5 years
of life, school size, and school decile ranking (equaling 1 to 3 vs. 4 or greater). This table only reports some of
the key findings from this analysis. A full set of regression results can be found in Appendix Table 2.
19
Complete sets of all regression results are available in the Appendix to this report.

29
30
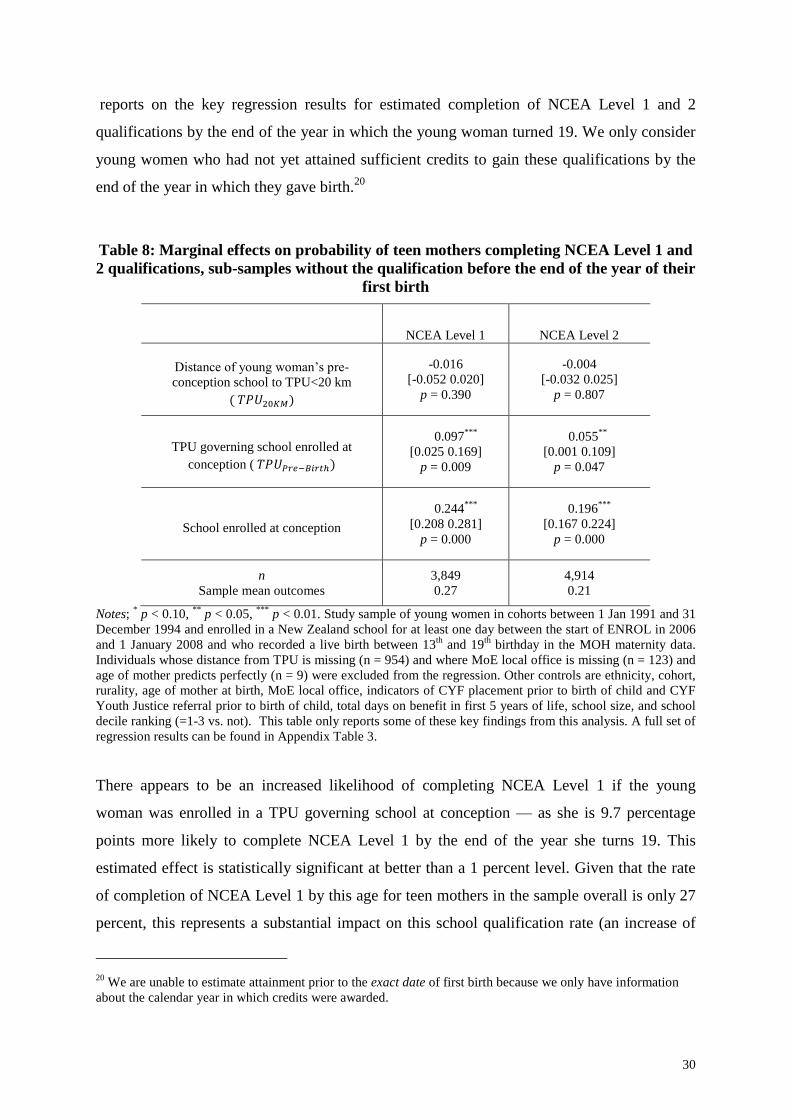
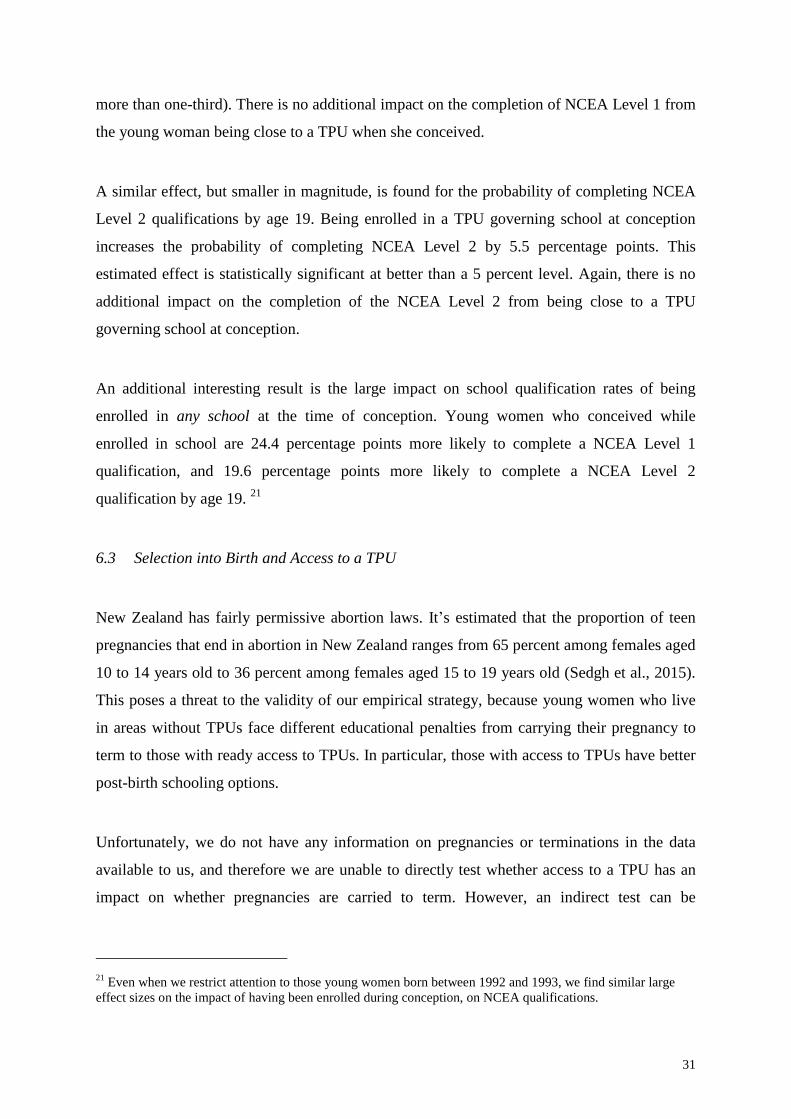
reports on the key regression results for estimated completion of NCEA Level 1 and 2
qualifications by the end of the year in which the young woman turned 19. We only consider
young women who had not yet attained sufficient credits to gain these qualifications by the
end of the year in which they gave birth.20
Table 8: Marginal effects on probability of teen mothers completing NCEA Level 1 and
2 qualifications, sub-samples without the qualification before the end of the year of their
first birth
NCEA Level 1 NCEA Level 2
Distance of young woman’s pre-
conception school to TPU<20 km
( 𝑇𝑃𝑈20𝐾𝑀)
-0.016
[-0.052 0.020]
p = 0.390
-0.004
[-0.032 0.025]
p = 0.807
TPU governing school enrolled at
conception ( 𝑇𝑃𝑈𝑃𝑟𝑒−𝐵𝑖𝑟𝑡ℎ)
0.097***
[0.025 0.169]
p = 0.009
0.055**
[0.001 0.109]
p = 0.047
School enrolled at conception
0.244***
[0.208 0.281]
p = 0.000
0.196***
[0.167 0.224]
p = 0.000
n
Sample mean outcomes
3,849
0.27
4,914
0.21
Notes; * p < 0.10,
** p < 0.05,
*** p < 0.01. Study sample of young women in cohorts between 1 Jan 1991 and 31
December 1994 and enrolled in a New Zealand school for at least one day between the start of ENROL in 2006
and 1 January 2008 and who recorded a live birth between 13th
and 19th
birthday in the MOH maternity data.
Individuals whose distance from TPU is missing (n = 954) and where MoE local office is missing (n = 123) and
age of mother predicts perfectly (n = 9) were excluded from the regression. Other controls are ethnicity, cohort,
rurality, age of mother at birth, MoE local office, indicators of CYF placement prior to birth of child and CYF
Youth Justice referral prior to birth of child, total days on benefit in first 5 years of life, school size, and school
decile ranking (=1-3 vs. not). This table only reports some of these key findings from this analysis. A full set of
regression results can be found in Appendix Table 3.
There appears to be an increased likelihood of completing NCEA Level 1 if the young
woman was enrolled in a TPU governing school at conception — as she is 9.7 percentage
points more likely to complete NCEA Level 1 by the end of the year she turns 19. This
estimated effect is statistically significant at better than a 1 percent level. Given that the rate
of completion of NCEA Level 1 by this age for teen mothers in the sample overall is only 27
percent, this represents a substantial impact on this school qualification rate (an increase of
20
We are unable to estimate attainment prior to the exact date of first birth because we only have information
about the calendar year in which credits were awarded.
31
more than one-third). There is no additional impact on the completion of NCEA Level 1 from
the young woman being close to a TPU when she conceived.
A similar effect, but smaller in magnitude, is found for the probability of completing NCEA
Level 2 qualifications by age 19. Being enrolled in a TPU governing school at conception
increases the probability of completing NCEA Level 2 by 5.5 percentage points. This
estimated effect is statistically significant at better than a 5 percent level. Again, there is no
additional impact on the completion of the NCEA Level 2 from being close to a TPU
governing school at conception.
An additional interesting result is the large impact on school qualification rates of being
enrolled in any school at the time of conception. Young women who conceived while
enrolled in school are 24.4 percentage points more likely to complete a NCEA Level 1
qualification, and 19.6 percentage points more likely to complete a NCEA Level 2
qualification by age 19. 21
6.3 Selection into Birth and Access to a TPU
New Zealand has fairly permissive abortion laws. It’s estimated that the proportion of teen
pregnancies that end in abortion in New Zealand ranges from 65 percent among females aged
10 to 14 years old to 36 percent among females aged 15 to 19 years old (Sedgh et al., 2015).
This poses a threat to the validity of our empirical strategy, because young women who live
in areas without TPUs face different educational penalties from carrying their pregnancy to
term to those with ready access to TPUs. In particular, those with access to TPUs have better
post-birth schooling options.
Unfortunately, we do not have any information on pregnancies or terminations in the data
available to us, and therefore we are unable to directly test whether access to a TPU has an
impact on whether pregnancies are carried to term. However, an indirect test can be
21
Even when we restrict attention to those young women born between 1992 and 1993, we find similar large
effect sizes on the impact of having been enrolled during conception, on NCEA qualifications.
32
undertaken by estimating the following model for all young women who were enrolled at age
14.
(3) 𝑃𝑟(𝐵𝐼𝑅𝑇𝐻 = 1) = Φ(𝛾0 + 𝛾1𝑍 + 𝛾2𝑇𝑃𝑈𝑎𝑔𝑒=14)
where BIRTH indicates whether or not a young woman became a teen mother, Z is a set of
control variables and TPUage=14 indicates whether the young woman was enrolled in a TPU
governing school at age 14 (and prior to any conception). The sign of the coefficient γ2 is of
interest to us as it indicates whether easy access to a TPU increases the teenage birth rate.
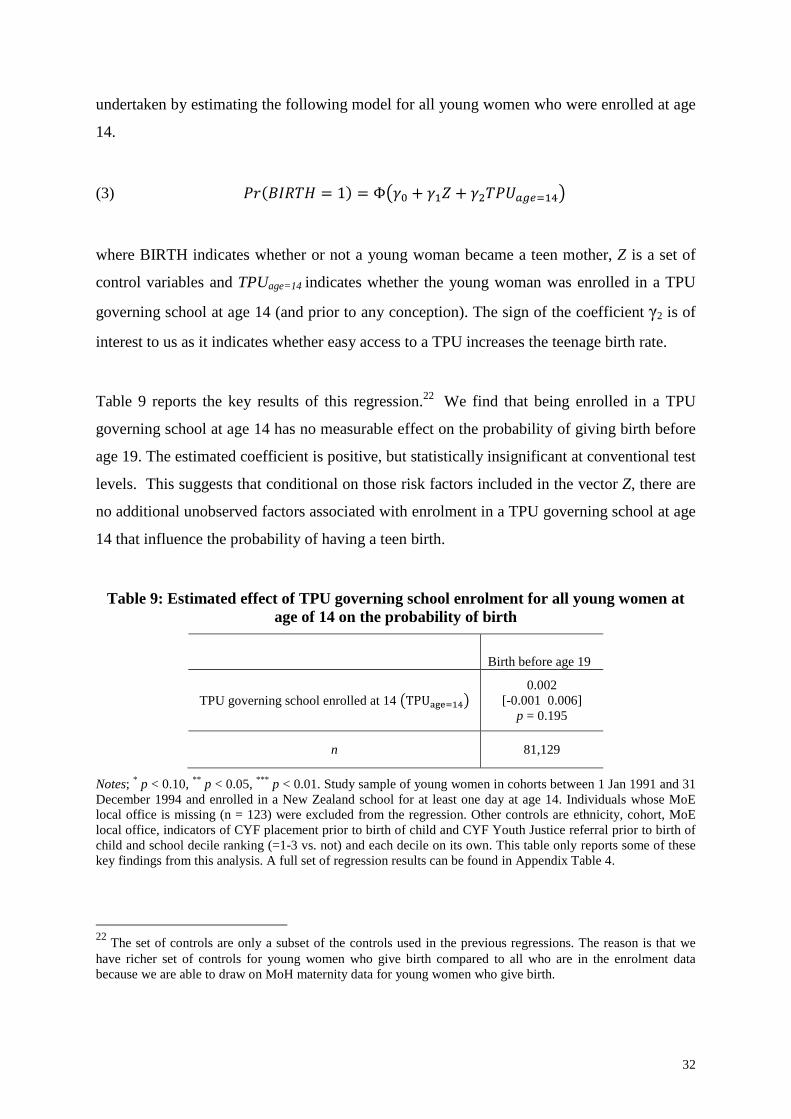
Table 9 reports the key results of this regression.22
We find that being enrolled in a TPU
governing school at age 14 has no measurable effect on the probability of giving birth before
age 19. The estimated coefficient is positive, but statistically insignificant at conventional test
levels. This suggests that conditional on those risk factors included in the vector Z, there are
no additional unobserved factors associated with enrolment in a TPU governing school at age
14 that influence the probability of having a teen birth.
Table 9: Estimated effect of TPU governing school enrolment for all young women at
age of 14 on the probability of birth
Birth before age 19
TPU governing school enrolled at 14 (TPUage=14) 0.002
[-0.001 0.006] p = 0.195
n 81,129
Notes; * p < 0.10,
** p < 0.05,
*** p < 0.01. Study sample of young women in cohorts between 1 Jan 1991 and 31
December 1994 and enrolled in a New Zealand school for at least one day at age 14. Individuals whose MoE
local office is missing (n = 123) were excluded from the regression. Other controls are ethnicity, cohort, MoE
local office, indicators of CYF placement prior to birth of child and CYF Youth Justice referral prior to birth of
child and school decile ranking (=1-3 vs. not) and each decile on its own. This table only reports some of these
key findings from this analysis. A full set of regression results can be found in Appendix Table 4.
22
The set of controls are only a subset of the controls used in the previous regressions. The reason is that we
have richer set of controls for young women who give birth compared to all who are in the enrolment data
because we are able to draw on MoH maternity data for young women who give birth.
33
7 Impact of TPUs vs. Mainstream Schools for the Enrolled
Sample
The previous section presented results that suggested that access to a TPU governing school
has measurable effects on NCEA attainment. There are potentially two ways in which access
to a TPU could improve qualifications. One is that access to a TPU could result in more
young women enrolling after birth. The other is that once teen mothers are enrolled, TPUs
might be more successful than mainstream schools at supporting them to achieve NCEA
qualifications.
In this section, we consider the impact on NCEA achievement of enrolling in a TPU
governing school vs. a non-TPU school. However, this is not straightforward as there are
likely to be unobservable factors that have an impact on post-birth enrolment and on NCEA
attainment.
For example, consider estimating the following simple regression model on those young
women who enrol in a school after they give birth:
(4) 𝑃𝑟(𝑁𝐶𝐸𝐴 = 1) = Φ(𝛽1 + 𝛽2𝑇𝑃𝑈)
where NCEA is the outcome of interest, and TPU is equal to 1 if the young woman enrols in a
TPU governing school after birth, and zero if she enrols in a non-TPU school after birth.
The problem with interpreting 𝛽2 as the causal effect of enrolling in a TPU vs. non-TPU
school is that students who attend TPU schools may be those who face unusually low
propensities to complete NCEA qualifications. To the extent that this propensity is
unobserved, it is captured in the error term and the TPU variable and disturbances would be
negatively correlated. This would bias downward the estimator for 𝛽2. Therefore, we use an
34
Instrumental Variable (IV) method to mitigate this bias and produce the causal inference that
we want.23
We use distance (in kms) to the nearest TPU governing school prior to conception and
enrolment in a TPU governing school at the conception date as the two valid instruments for
this analysis. The main exclusion restriction is the assumption we have maintained
throughout this paper — which is that the presence of a TPU did not affect a young woman’s
decision to continue her pregnancy to term. Indeed, we did provide some earlier evidence that
the young women who were enrolled in a TPU governing school prior to conception did not
have a differential teen birth rate after controlling for other characteristics.
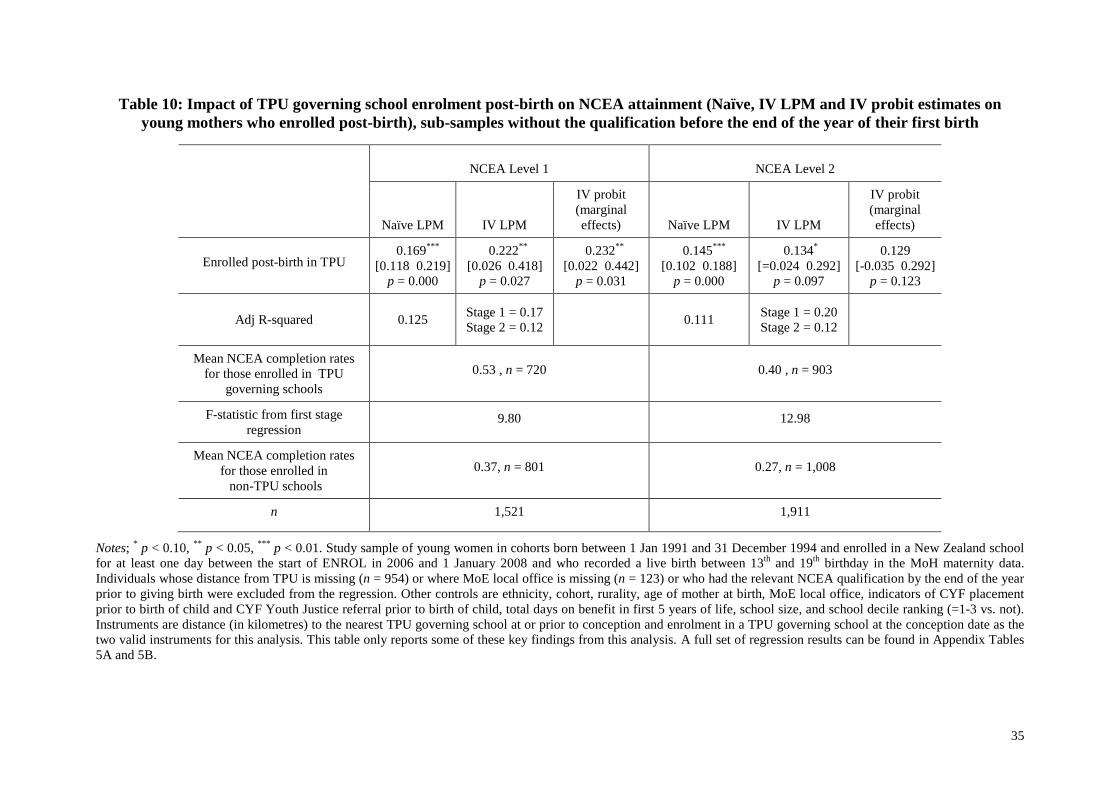
Table 10 provides the main estimates for a “Naïve” model (the simple regression model
specified in equation (4)), an IV linear probability model (LPM), and the corresponding
marginal effects from an IV probit model.
For NCEA Level 1, the estimated effects show that those who enrolled in a TPU post-birth
had 22.2 and 23.2 percentage point increases in their likelihood of completing NCEA Level 1
in the linear and non-linear IV models. These effects are both significantly different from
zero at a 5 percent level. These estimated effects are considerably larger than those from the
Naïve model (16.9 percentage points), which suggests that young women who were more
likely to enrol in TPUs after birth were generally less likely to complete NCEA Level 1 than
those who enrolled in non-TPU schools after birth. In other words, the presence of TPU
governing schools tends to draw teen mothers with lower overall propensities to complete
NCEA level qualifications back to school.
23
An instrumental variable must be correlated with the regressor (TPU), but uncorrelated with the disturbance
term. A valid instrument would be something that influences the propensity to be enrolled in a TPU governing
school post-birth, but is statistically unrelated to the unmeasured factors that influence the propensity to
complete NCEA qualifications. We argue that distance to the nearest TPU governing school prior to conception
meets these criteria.
35
Table 10: Impact of TPU governing school enrolment post-birth on NCEA attainment (Naïve, IV LPM and IV probit estimates on
young mothers who enrolled post-birth), sub-samples without the qualification before the end of the year of their first birth
NCEA Level 1 NCEA Level 2
Naïve LPM IV LPM
IV probit
(marginal
effects) Naïve LPM IV LPM
IV probit
(marginal
effects)
Enrolled post-birth in TPU 0.169
***
[0.118 0.219]
p = 0.000
0.222**
[0.026 0.418]
p = 0.027
0.232**
[0.022 0.442]
p = 0.031
0.145***
[0.102 0.188]
p = 0.000
0.134*
[=0.024 0.292]
p = 0.097
0.129
[-0.035 0.292]
p = 0.123
Adj R-squared 0.125 Stage 1 = 0.17
Stage 2 = 0.12 0.111
Stage 1 = 0.20
Stage 2 = 0.12
Mean NCEA completion rates
for those enrolled in TPU
governing schools
0.53 , n = 720 0.40 , n = 903
F-statistic from first stage
regression 9.80 12.98
Mean NCEA completion rates
for those enrolled in
non-TPU schools
0.37, n = 801 0.27, n = 1,008
n 1,521 1,911
Notes; * p < 0.10,
** p < 0.05,
*** p < 0.01. Study sample of young women in cohorts born between 1 Jan 1991 and 31 December 1994 and enrolled in a New Zealand school
for at least one day between the start of ENROL in 2006 and 1 January 2008 and who recorded a live birth between 13th
and 19th
birthday in the MoH maternity data.
Individuals whose distance from TPU is missing (n = 954) or where MoE local office is missing (n = 123) or who had the relevant NCEA qualification by the end of the year
prior to giving birth were excluded from the regression. Other controls are ethnicity, cohort, rurality, age of mother at birth, MoE local office, indicators of CYF placement
prior to birth of child and CYF Youth Justice referral prior to birth of child, total days on benefit in first 5 years of life, school size, and school decile ranking (=1-3 vs. not). Instruments are distance (in kilometres) to the nearest TPU governing school at or prior to conception and enrolment in a TPU governing school at the conception date as the
two valid instruments for this analysis. This table only reports some of these key findings from this analysis. A full set of regression results can be found in Appendix Tables
5A and 5B.
36
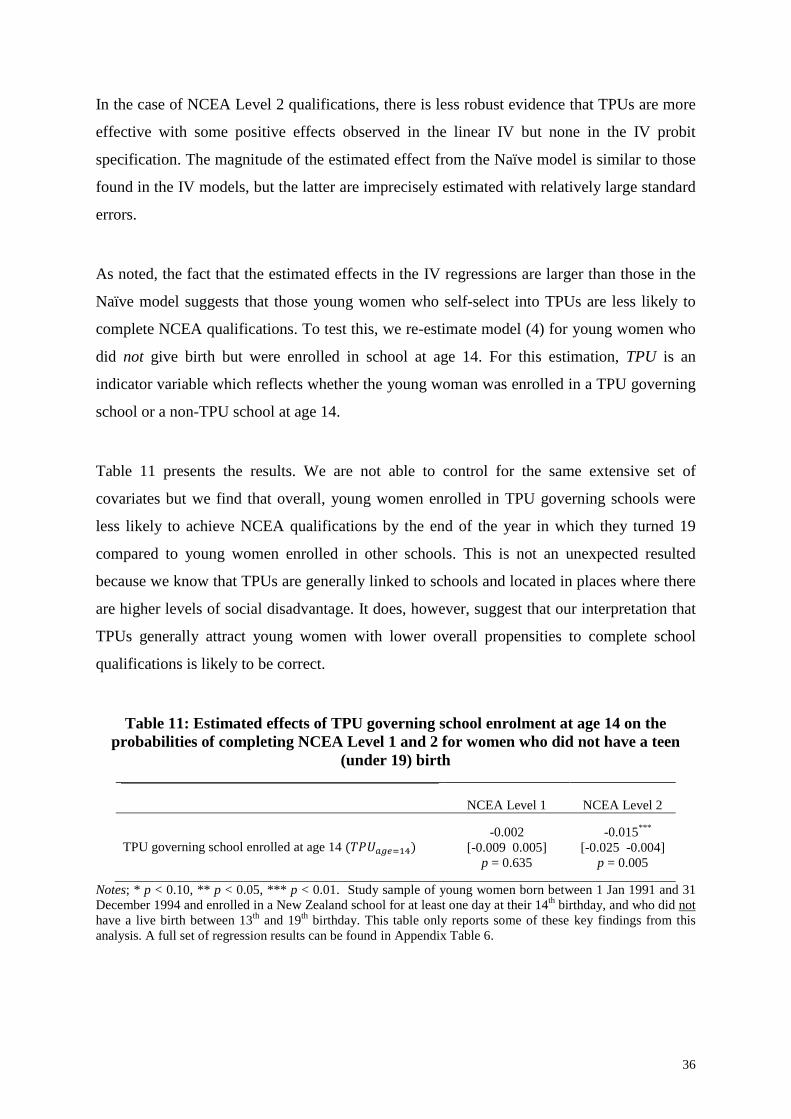
In the case of NCEA Level 2 qualifications, there is less robust evidence that TPUs are more
effective with some positive effects observed in the linear IV but none in the IV probit
specification. The magnitude of the estimated effect from the Naïve model is similar to those
found in the IV models, but the latter are imprecisely estimated with relatively large standard
errors.
As noted, the fact that the estimated effects in the IV regressions are larger than those in the
Naïve model suggests that those young women who self-select into TPUs are less likely to
complete NCEA qualifications. To test this, we re-estimate model (4) for young women who
did not give birth but were enrolled in school at age 14. For this estimation, TPU is an
indicator variable which reflects whether the young woman was enrolled in a TPU governing
school or a non-TPU school at age 14.
Table 11 presents the results. We are not able to control for the same extensive set of
covariates but we find that overall, young women enrolled in TPU governing schools were
less likely to achieve NCEA qualifications by the end of the year in which they turned 19
compared to young women enrolled in other schools. This is not an unexpected resulted
because we know that TPUs are generally linked to schools and located in places where there
are higher levels of social disadvantage. It does, however, suggest that our interpretation that
TPUs generally attract young women with lower overall propensities to complete school
qualifications is likely to be correct.
Table 11: Estimated effects of TPU governing school enrolment at age 14 on the
probabilities of completing NCEA Level 1 and 2 for women who did not have a teen
(under 19) birth
NCEA Level 1 NCEA Level 2
TPU governing school enrolled at age 14 (𝑇𝑃𝑈𝑎𝑔𝑒=14) -0.002
[-0.009 0.005]
p = 0.635
-0.015***
[-0.025 -0.004]
p = 0.005
Notes; * p < 0.10, ** p < 0.05, *** p < 0.01. Study sample of young women born between 1 Jan 1991 and 31
December 1994 and enrolled in a New Zealand school for at least one day at their 14th
birthday, and who did not
have a live birth between 13th
and 19th
birthday. This table only reports some of these key findings from this
analysis. A full set of regression results can be found in Appendix Table 6.
37
8 Limitations
There are a number of limitations that need to be considered in interpreting the results of this
study.
Data linking is probabilistic and some errors are inevitable. The data available to us capture
information collected or generated in the process of administering government services, and
inevitably may embody errors in measurement, reporting and recording that occur in those
processes. Data limitations result in some degree of imprecision in the estimation of true
impacts. Most critically, we cannot observe whether a young mother was actually enrolled in
a TPU, only whether she was enrolled in TPU governing school. In addition, we do not have
access to data on place of residence, and so rely on the address of the last school of
attendance to estimate a young mother’s proximity to a TPU. In addition, in some cases
young women who gave birth may not have gone on to parent their children, and given the
data available to us we are unable to restrict the analysis to just those young women who
were engaged in parenting. Finally, given the constraints of the data linkage our analysis fails
to capture educational outcomes for young women who left the country through outward
migration.
There are also limitations in the methods that we used. There may be unobserved selection,
particularly on community level characteristics, that we may not have adequately controlled
for in our analysis. We estimate NCEA level attainment from credits attained and the
estimation method we use results in a degree of imprecision. There is some censoring of
data24
but we did not want to drop cohorts from the analysis if possible. We test the
robustness of the NCEA results by re-analysing for two sub-samples that exclude cases
affected by censoring: (1) including only sample members whose conception date was after
the date that they first appeared in the ENROL data; and (2) including only sample members
in birth cohorts born in 1992 and 1993 (who experienced no censoring in their inclusion in
24
We include the 1991 cohort. However, the MoE ENROL data start at the beginning of 2006 when members of
this cohort were aged 14-15. Young women in this cohort who gave birth at 13 or 14, and left school before the
beginning of 2006, or before their school came on to the ENROL system (which could be in 2007), are absent
from our study.

38
the ENROL data). Our qualitative results were not affected by these alternative
specifications.
Variability in practice and performance across TPUs has been a theme in ERO reviews
(ERO, 2007; ERO, 2011; ERO, 2014). Individual TPU performance is not the focus of this
study. We are not able to say from our analysis whether all TPUs generated positive impacts.
Nor are we able to establish which parts of the programme are the most important in helping
young mothers increase their educational attainment and achievement. In this study, we
examined particular birth cohorts, and examined educational outcomes within a finite follow-
up period. It may not be possible to generalise our findings to other birth cohorts, to
outcomes at older ages, or to outcomes in other domains.
Future studies using newly available and more extensive linked data held in the Statistics
New Zealand Integrated Data Infrastructure (IDI) are recommended. IDI data would allow a
more comprehensive examination of the impact of TPUs on outcomes, including mothers’
post-school educational participation, earnings and welfare benefit receipt, and including
children’s health and early childhood education participation.
An important topic for future study is investigating whether the impact of TPUs has altered
with policy changes introduced in late 2012. These changes made enrolment in education,
training or work-based learning compulsory for young parents aged 16 to 18 receiving social
welfare benefits once their children reach 6 or 12 months of age (6 months if a place at a TPU
is available) (ERO, 2014; Work and Income, no date).

39
9 Conclusions
This evaluation finds that for the cohorts studied, access to a TPU increased school enrolment
rates and increased school qualifications of teenage mothers. The baseline school enrolment
rate after birth for the teenage mothers studied was 35 percent. Those who had access to a
TPU within 20 km at conception were 4 percentage points more likely to enrol in a school
after giving birth. Those who had good access to a TPU by virtue of being enrolled in a TPU
governing school at conception were an additional 11.1 percentage points more likely to
enrol and were estimated to be more likely to attain NCEA Level 1 and 2 qualifications post-
birth.
Examining teenage mothers without qualifications who enrolled after giving birth, those
enrolling in a school with a TPU were at least 22.2 percentage points more likely to attain an
NCEA Level 1 qualification than those who enrolled in a non-TPU school.
The findings provided in this report indicate that TPU services designed to meet the needs of
teenage mothers can reduce the school enrolment gap between teen mothers and young
women who do not give birth, and improve NCEA achievement levels of enrolled teen
mothers.
40
References
Baragwanath, S. (1997). The Education of Teenage Mothers in New Zealand: A Policy Vacuum and a
Practical Example of Assistance. Social Policy Journal of New Zealand Issue 9.
Boden, J. M., Fergusson, D. M., and John Horwood, L. (2008). Early motherhood and subsequent life
outcomes. Journal of Child Psychology and Psychiatry, 49 (2): 151–160.
Collins, B. (2010). Resilience in teenage mothers: A follow-up study. Wellington: Ministry of Social
Development.
Crean, Hugh F., A. D. Hightower, and Marjorie J. Allan. (2001) School-based child care for children
of teen parents: Evaluation of an urban programme designed to keep young mothers in
school. Evaluation and Programme Planning 24 (3): 267-275.
Education Review Office (2007) Teen Parent Units: An Evaluation. Wellington: Education Review
Office.
Education Review Office (2011) Evaluation of Teen Parent Units. Wellington: Education Review
Office.
Education Review Office (2014) Evaluation of Teen Parent Units. Wellington: Education Review
Office.
Eisenhower Fellowships (no date) Celebrating 60 Years: Dr Susan Cave Baragwanath, 1994 New
Zealand.
Families Commission (2011) Teenage Pregnancy and Parenting: An Overview. Wellington: Families’
Commission.
Fergusson, D. and L. Woodward (2000). Teenage pregnancy and female educational
underachievement: A prospective study of a New Zealand birth cohort. Journal of Marriage
and Family 62 (1): 147-161.
Gibb, S., Fergusson, D., Horwood, J. and Boden, J. (2015). Early Motherhood and Long‐Term
Economic Outcomes: Findings From a 30‐Year Longitudinal Study. Journal of Research on
Adolescence 25 (1): 163-172.
Harden, A., Brunton, G., Fletcher, A., Oakley, A., Burchett, H., Backhans, M. (2006) Young people,
pregnancy and social exclusion: A systematic synthesis of research evidence to identify
effective, appropriate and promising approaches for prevention and support. London: EPPI-
Centre, Social Science Research Unit, Institute of Education, University of London.
He Huarahi Tamariki (2015) Tuawahine: A Journal of Student Work. Wellington: He Huarahi
Tamariki School for Teenage Parents.
Jaffee, S. R., Caspi, A., Moffitt, T. E., Taylor, A., and Dickson, N. (2001). Predicting early
fatherhood and whether young fathers live with their children: Prospective findings and
policy reconsiderations. Institute for Research on Poverty. Discussion Paper No. 1235-01.
Johnson, R. and Denny, S. (2007). The health and wellbeing of secondary school students attending
Teen Parent Units in New Zealand, The University of Auckland.
41
Kearney, M. S., and Levine, P. B. (2012). Why is the Teen Birth Rate in the United States so High
and Why Does it Matter? Journal of Economic Perspectives. 26 (2): 141-166.
Lachance, C., Burrus, B., Scott, A. (2012). Building an evidence base to inform interventions for
pregnant and parenting adolescents: A call for rigorous evaluation. American Journal of
Public Health. 102:1826–1832.
Makowharemahihi, C., Lawton, B. A., Cram, F., Ngata, T., Brown, S. and Robson, B.
(2014). Initiation of maternity care for young Māori women under 20 years of age. The New
Zealand Medical Journal 127:1393.
Morton, S. M. B., Atatoa Carr, P. E., Grant, C. C., Berry, S. D., Mohal, J., Pillai, A. (2015). Growing
Up in New Zealand: A longitudinal study of New Zealand children and their families.
Vulnerability Report 2: Transitions in exposure to vulnerability in the first 1000 days of life.
Auckland: Growing Up in New Zealand.
Pinzon, J., and Jones, V. (2012). Care of Adolescent Parents and their Children. American Academy of
Pediatrics, 130 (6): 1-16.
Rawiri, C. (2007). Adolescent Maori mothers’ experiences with social support during pregnancy,
birth and motherhood, and their participation in education. The Bulletin No. 109:13-15.
Seitz, V., and Apfel, N. (1999). Effective interventions for adolescent mothers. Clinical Psychology:
Science and Practice, 6 (1): 50–66.
Sedgh, G., Finer, L., Bankole, A., Eilers, M., and Singh, S. (2015). Adolescent pregnancy, birth and
abortion rates across countries: levels and recent trends, Journal of Adolescent Health, 56:
223-230.
Vaithianathan, R., Wilson, M., Maloney, T. and Baird, S. (2016). The Impact of the Family Start
Home Visiting Programme on Outcomes for Mothers and Children: A Quasi-Experimental
Study. Wellington: Ministry of Social Development.
Woodward, L. and D. Fergusson (1999). Early conduct problems and later risk of teenage pregnancy
in girls. Development and Psychopathology 11 (01): 127-141.
Work and Income (no date) Young Parent Payment.
http://www.workandincome.govt.nz/individuals/a-z-benefits/young-parent-payment.html
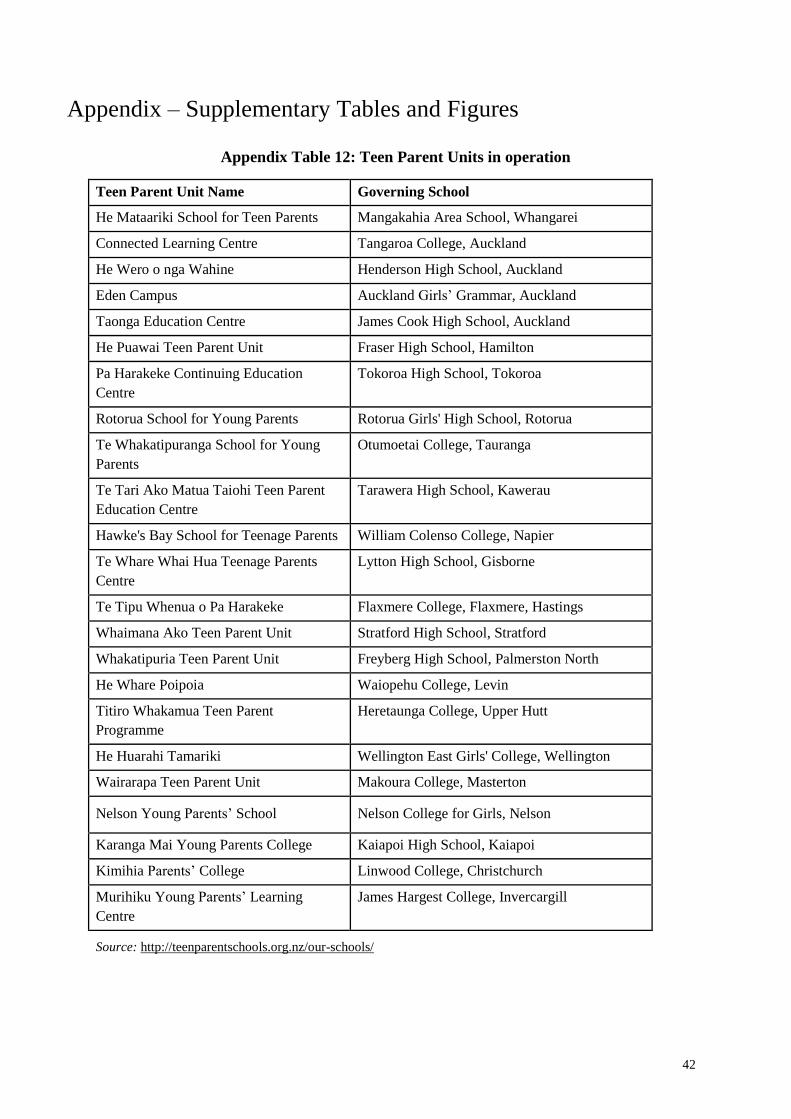
42
Appendix – Supplementary Tables and Figures
Appendix Table 12: Teen Parent Units in operation
Teen Parent Unit Name Governing School
He Mataariki School for Teen Parents Mangakahia Area School, Whangarei
Connected Learning Centre Tangaroa College, Auckland
He Wero o nga Wahine Henderson High School, Auckland
Eden Campus Auckland Girls’ Grammar, Auckland
Taonga Education Centre James Cook High School, Auckland
He Puawai Teen Parent Unit Fraser High School, Hamilton
Pa Harakeke Continuing Education
Centre
Tokoroa High School, Tokoroa
Rotorua School for Young Parents Rotorua Girls' High School, Rotorua
Te Whakatipuranga School for Young
Parents
Otumoetai College, Tauranga
Te Tari Ako Matua Taiohi Teen Parent
Education Centre
Tarawera High School, Kawerau
Hawke's Bay School for Teenage Parents William Colenso College, Napier
Te Whare Whai Hua Teenage Parents
Centre
Lytton High School, Gisborne
Te Tipu Whenua o Pa Harakeke Flaxmere College, Flaxmere, Hastings
Whaimana Ako Teen Parent Unit Stratford High School, Stratford
Whakatipuria Teen Parent Unit Freyberg High School, Palmerston North
He Whare Poipoia Waiopehu College, Levin
Titiro Whakamua Teen Parent
Programme
Heretaunga College, Upper Hutt
He Huarahi Tamariki Wellington East Girls' College, Wellington
Wairarapa Teen Parent Unit Makoura College, Masterton
Nelson Young Parents’ School Nelson College for Girls, Nelson
Karanga Mai Young Parents College Kaiapoi High School, Kaiapoi
Kimihia Parents’ College Linwood College, Christchurch
Murihiku Young Parents’ Learning
Centre
James Hargest College, Invercargill
Source: http://teenparentschools.org.nz/our-schools/
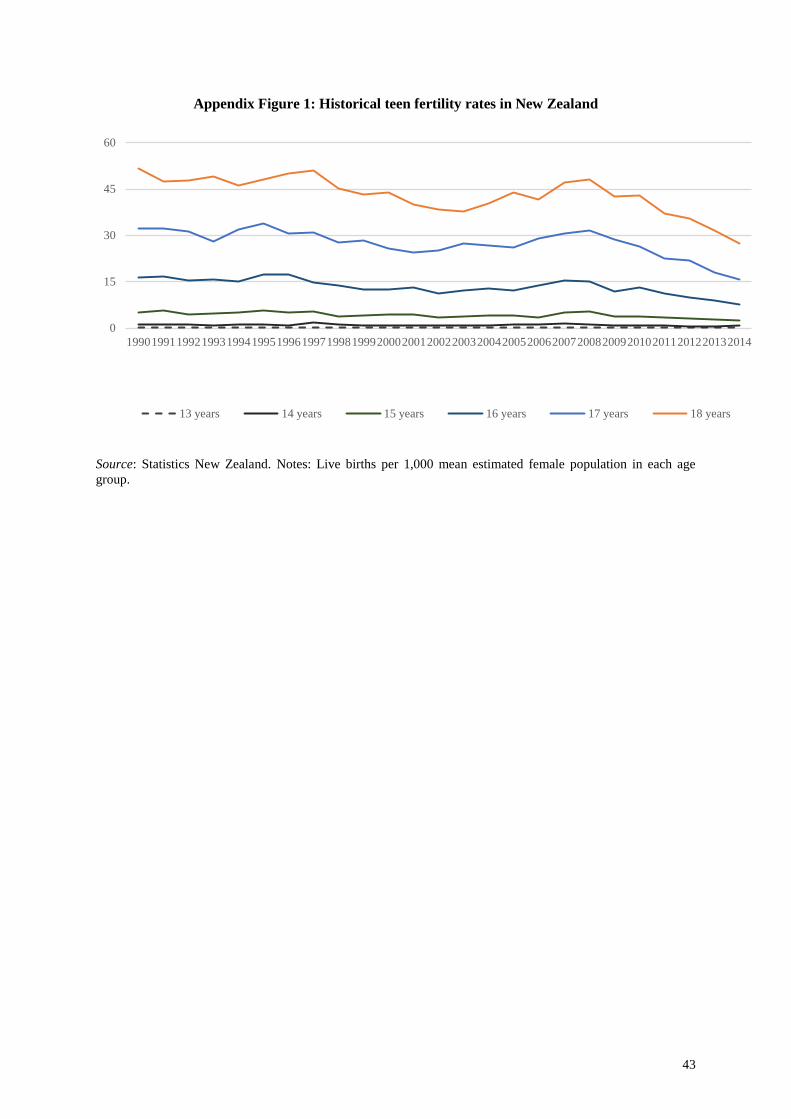
43
Appendix Figure 1: Historical teen fertility rates in New Zealand
Source: Statistics New Zealand. Notes: Live births per 1,000 mean estimated female population in each age
group.
0
15
30
45
60
1990199119921993199419951996199719981999200020012002200320042005200620072008200920102011201220132014
13 years 14 years 15 years 16 years 17 years 18 years
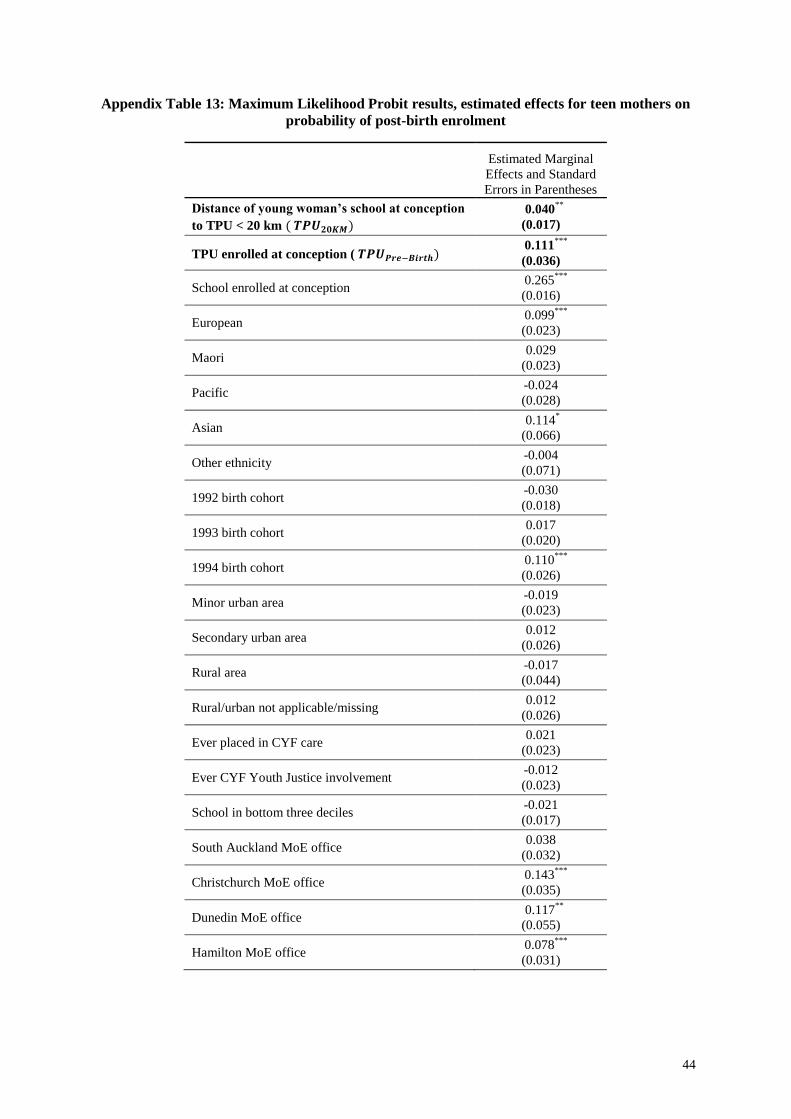
44
Appendix Table 13: Maximum Likelihood Probit results, estimated effects for teen mothers on
probability of post-birth enrolment
Estimated Marginal
Effects and Standard
Errors in Parentheses
Distance of young woman’s school at conception
to TPU < 20 km ( 𝑻𝑷𝑼𝟐𝟎𝑲𝑴)
0.040**
(0.017)
TPU enrolled at conception ( 𝑻𝑷𝑼𝑷𝒓𝒆−𝑩𝒊𝒓𝒕𝒉) 0.111
***
(0.036)
School enrolled at conception 0.265
*** (0.016)
European 0.099
*** (0.023)
Maori 0.029
(0.023)
Pacific -0.024 (0.028)
Asian 0.114
* (0.066)
Other ethnicity -0.004 (0.071)
1992 birth cohort -0.030 (0.018)
1993 birth cohort 0.017
(0.020)
1994 birth cohort 0.110
*** (0.026)
Minor urban area -0.019 (0.023)
Secondary urban area 0.012
(0.026)
Rural area -0.017 (0.044)
Rural/urban not applicable/missing 0.012
(0.026)
Ever placed in CYF care 0.021
(0.023)
Ever CYF Youth Justice involvement -0.012 (0.023)
School in bottom three deciles -0.021 (0.017)
South Auckland MoE office 0.038
(0.032)
Christchurch MoE office 0.143
*** (0.035)
Dunedin MoE office 0.117
** (0.055)
Hamilton MoE office 0.078
*** (0.031)

45
Appendix Table 2 continued
Invercargill MoE office 0.159
*** (0.052)
Napier MoE office 0.138
*** (0.035)
Nelson MoE office -0.019 (0.047)
Rotorua MoE office 0.166
*** (0.033)
Wellington MoE office 0.205
*** (0.030)
Whanganui MoE office 0.164
*** (0.034)
Whangarei MoE office 0.151
*** (0.039)
n 5,625
Log-Likelihood Function -2,791.12
Pseudo R2 Statistic 0.2416
Notes:
Full set of regression results. See the notes at the bottom of Table 7 in the main body of this report for more
information on this estimation procedure. Excluded categories are birth cohort =1991, urban area = Main Urban
Area and MoE Office = Auckland North.
***
Estimated partial derivative significantly different from zero at a 1% level using a t test **
Estimated partial derivative significantly different from zero at a 5% level using a t test * Estimated partial derivative significantly different from zero at a 10% level using a t test

46
Appendix Table 14: Maximum Likelihood Probit results, marginal effects on probability of teen
mothers completing NCEA Level 1 and 2 qualifications, sub-samples without the qualification
before the end of the year of their first birth
Estimated Marginal Effects
Standard Errors in Parentheses
NCEA
Level 1 NCEA
Level 2
Distance of young woman’s pre-conception
school to TPU < 20 km ( 𝑻𝑷𝑼𝟐𝟎𝑲𝑴)
-0.016 (0.018)
-0.004 (0.015)
TPU enrolled at conception ( 𝑻𝑷𝑼𝑷𝒓𝒆−𝑩𝒊𝒓𝒕𝒉) 0.097
***
(0.037)
0.055**
(0.028)
School enrolled at conception 0.244
*** (0.019)
0.196***
(0.015)
European 0.057
** (0.024)
0.034*
(0.018)
Maori -0.001 (0.023)
-0.003 (0.018)
Pacific 0.078
** (0.032)
0.045*
(0.024)
Asian -0.013 (0.064)
0.037 (0.054)
Other ethnicity 0.176
** (0.085)
0.211***
(0.078)
1992 birth cohort -0.004 (0.019)
-0.026*
(0.015)
1993 birth cohort -0.019 (0.020)
-0.005 (0.016)
1994 birth cohort -0.007 (0.024)
-0.005 (0.019)
Minor urban area -0.039
* (0.023)
-0.055***
(0.017)
Secondary urban area 0.014
(0.027)
0.020 (0.022)
Rural area -0.027 (0.045)
-0.027 (0.034)
Rural/urban not applicable/missing -0.159
*** (0.036)
-0.102***
(0.034)
Ever placed in CYF care -0.040
* (0.021)
-0.038**
(0.018)
Ever CYF Youth Justice involvement -0.088
*** (0.019)
-0.103***
(0.015)
School in bottom three deciles -0.026 (0.017)
-0.028**
(0.013)
South Auckland MoE office -0.029 (0.029)
-0.035 (0.021)
Christchurch MoE office -0.081
*** (0.028)
-0.099***
(0.019)
Dunedin MoE office -0.055 (0.050)
-0.033 (0.036)
Hamilton MoE office -0.019 (0.028)
-0.013 (0.022)
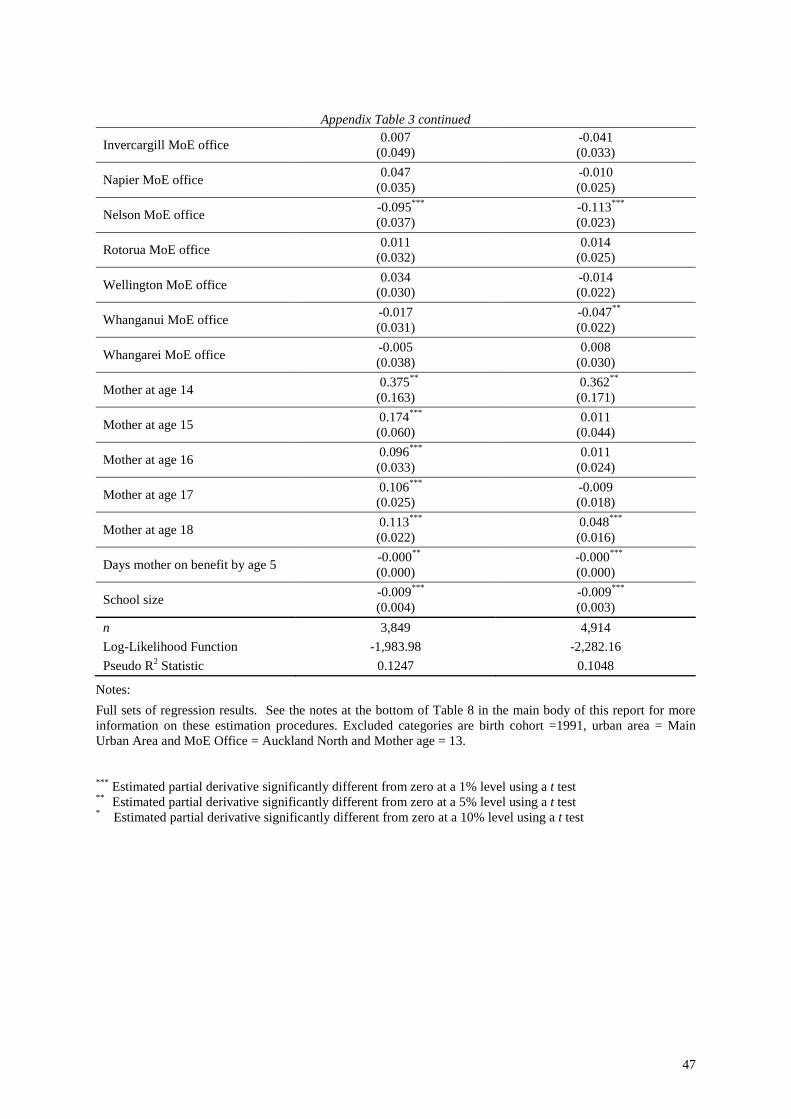
47
Appendix Table 3 continued
Invercargill MoE office 0.007
(0.049)
-0.041 (0.033)
Napier MoE office 0.047
(0.035)
-0.010 (0.025)
Nelson MoE office -0.095
*** (0.037)
-0.113***
(0.023)
Rotorua MoE office 0.011
(0.032)
0.014 (0.025)
Wellington MoE office 0.034
(0.030)
-0.014 (0.022)
Whanganui MoE office -0.017 (0.031)
-0.047**
(0.022)
Whangarei MoE office -0.005 (0.038)
0.008 (0.030)
Mother at age 14 0.375
**
(0.163)
0.362**
(0.171)
Mother at age 15 0.174
***
(0.060)
0.011
(0.044)
Mother at age 16 0.096
***
(0.033)
0.011
(0.024)
Mother at age 17 0.106
***
(0.025)
-0.009
(0.018)
Mother at age 18 0.113
***
(0.022)
0.048***
(0.016)
Days mother on benefit by age 5 -0.000
**
(0.000)
-0.000***
(0.000)
School size -0.009
***
(0.004)
-0.009***
(0.003)
n 3,849 4,914
Log-Likelihood Function -1,983.98 -2,282.16
Pseudo R2 Statistic 0.1247 0.1048
Notes:
Full sets of regression results. See the notes at the bottom of Table 8 in the main body of this report for more
information on these estimation procedures. Excluded categories are birth cohort =1991, urban area = Main
Urban Area and MoE Office = Auckland North and Mother age = 13.
***
Estimated partial derivative significantly different from zero at a 1% level using a t test **
Estimated partial derivative significantly different from zero at a 5% level using a t test * Estimated partial derivative significantly different from zero at a 10% level using a t test

48
Appendix Table 15: Maximum Likelihood Probit results, estimated effects for all young women
at age of 14 on the probability of birth
Estimated Marginal
Effects and Standard
Errors in Parentheses
TPU governing school enrolled at age 14 ( 𝑻𝑷𝑼𝒂𝒈𝒆=𝟏𝟒) 0.002
(0.002)
European -0.006
*** (0.002)
Maori 0.036
*** (0.003)
Pacific 0.003
(0.002)
Asian -0.022
*** (0.001)
Other ethnicity -0.013
*** (0.003)
1992 birth cohort -0.001 (0.002)
1993 birth cohort -0.006
*** (0.001)
1994 birth cohort -0.021
*** (0.001)
Minor urban area -0.001 (0.002)
Secondary urban area 0.002
(0.002)
Rural area -0.004 (0.003)
Rural/urban not applicable/missing -0.009 (0.011)
Ever placed in CYF care 0.056
*** (0.006)
Ever CYF Youth Justice involvement 0.085
*** (0.008)
School in bottom three deciles 0.000
(0.016)
South Auckland MoE office -0.005
*** (0.002)
Christchurch MoE office -0.006
*** (0.002)
Dunedin MoE office -0.006
** (0.003)
Hamilton MoE office 0.001
(0.003)
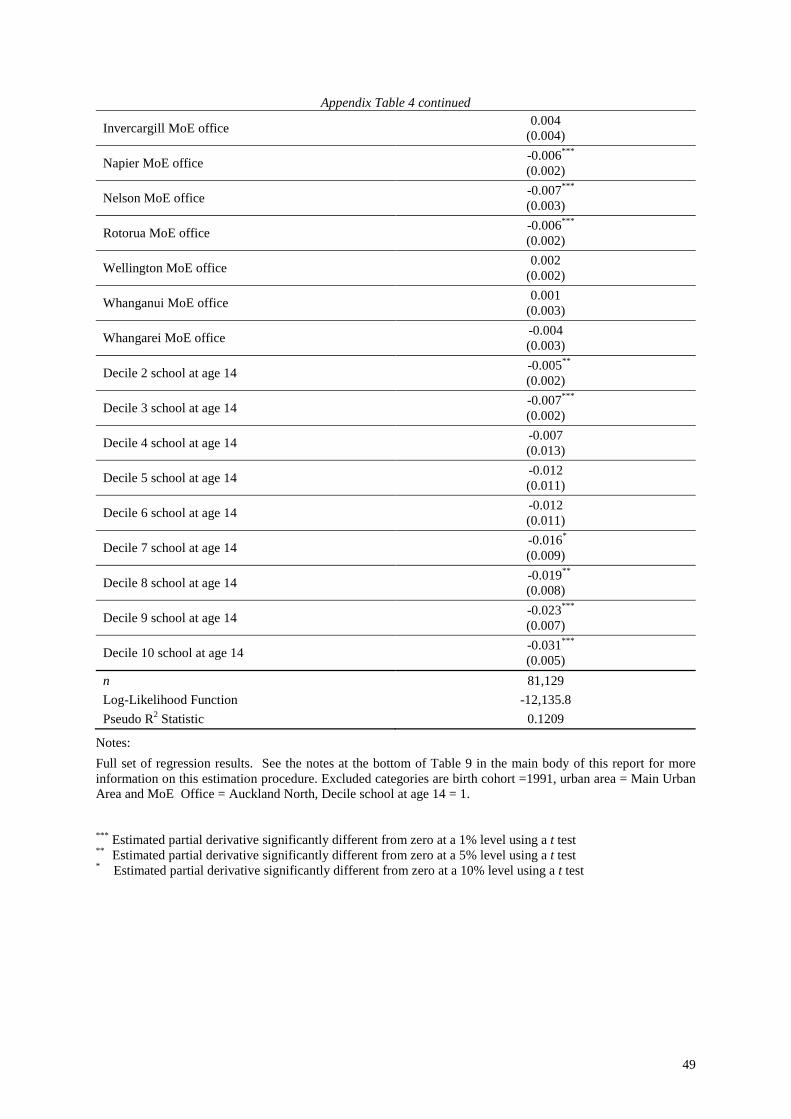
49
Appendix Table 4 continued
Invercargill MoE office 0.004
(0.004)
Napier MoE office -0.006
*** (0.002)
Nelson MoE office -0.007
*** (0.003)
Rotorua MoE office -0.006
*** (0.002)
Wellington MoE office 0.002
(0.002)
Whanganui MoE office 0.001
(0.003)
Whangarei MoE office -0.004 (0.003)
Decile 2 school at age 14 -0.005
** (0.002)
Decile 3 school at age 14 -0.007
*** (0.002)
Decile 4 school at age 14 -0.007 (0.013)
Decile 5 school at age 14 -0.012 (0.011)
Decile 6 school at age 14 -0.012 (0.011)
Decile 7 school at age 14 -0.016
* (0.009)
Decile 8 school at age 14 -0.019
** (0.008)
Decile 9 school at age 14 -0.023
*** (0.007)
Decile 10 school at age 14 -0.031
*** (0.005)
n 81,129
Log-Likelihood Function -12,135.8
Pseudo R2 Statistic 0.1209
Notes:
Full set of regression results. See the notes at the bottom of Table 9 in the main body of this report for more
information on this estimation procedure. Excluded categories are birth cohort =1991, urban area = Main Urban
Area and MoE Office = Auckland North, Decile school at age 14 = 1.
***
Estimated partial derivative significantly different from zero at a 1% level using a t test **
Estimated partial derivative significantly different from zero at a 5% level using a t test * Estimated partial derivative significantly different from zero at a 10% level using a t test

50
Appendix Table 16A: Linear Probability Model and Maximum Likelihood Probit results,
estimated effects on probability of completing NCEA Level 1 qualification, young teen mothers
who enrolled post-birth, sub-samples without the qualification before the end of the year
of their first birth
Estimated Coefficients or Marginal Effects
Standard Errors in Parentheses
Naïve
LPM IV
LPM
IV
Probit
Enrolled post-birth in TPU 0.169
***
(0.026)
0.222**
(0.100)
0.232**
(0.107)
School enrolled at conception 0.220
***
(0.028) 0.222
***
(0.028)
0.238***
(0.029)
European 0.102
*** (0.039)
0.104***
(0.039)
0.111**
(0.044)
Maori 0.002
(0.038)
0.001 (0.038)
-0.002 (0.043)
Pacific 0.059
(0.048)
0.051 (0.051)
0.052 (0.058)
Asian -0.095 (0.104)
-0.100 (0.105)
-0.107 (0.109)
Other ethnicity 0.401
*** (0.122)
0.400***
(0.123)
0.434***
(0.093)
1992 birth cohort -0.040 (0.034)
-0.038 (0.034)
-0.046 (0.038)
1993 birth cohort -0.062
* (0.035)
-0.061*
(0.034)
-0.071*
(0.038)
1994 birth cohort -0.067
* (0.038)
-0.068*
(0.039)
-0.077*
(0.042)
Minor urban area -0.004 (0.039)
0.009 (0.045)
0.007 (0.051)
Secondary urban area 0.039
(0.043)
0.048 (0.046)
0.053 (0.052)
Rural area 0.120
(0.082)
0.129 (0.083)
0.129 (0.092)
Rural/urban not applicable/missing -0.152
* (0.089)
-0.127 (0.100)
-0.188*
(0.102)
Ever placed in CYF care -0.076
** (0.036)
-0.077**
(0.036)
-0.093**
(0.040)
Ever CYF Youth Justice involvement -0.137
*** (0.036)
-0.138***
(0.036)
-0.156***
(0.038)
School in bottom three deciles -0.034 (0.029)
-0.031 (0.030)
-0.030 (0.033)
South Auckland MoE office -0.044 (0.054)
-0.035 (0.057)
-0.036 (0.062)
Christchurch MoE office -0.154
*** (0.054)
-0.164***
(0.057)
-0.171***
(0.056)
Dunedin MoE office -0.003 (0.104)
0.009 (0.107)
0.013 (0.118)
Hamilton MoE office -0.071 (0.049)
-0.072 (0.049)
-0.071 (0.053)
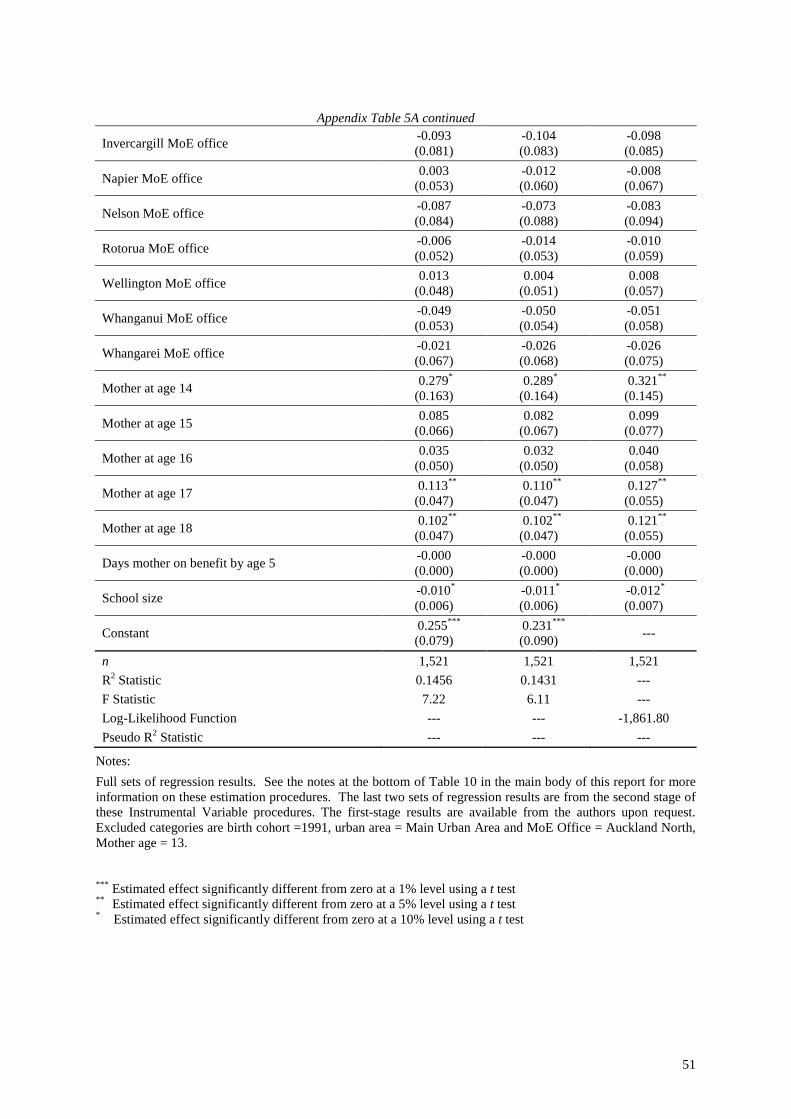
51
Appendix Table 5A continued
Invercargill MoE office -0.093 (0.081)
-0.104 (0.083)
-0.098 (0.085)
Napier MoE office 0.003
(0.053)
-0.012 (0.060)
-0.008 (0.067)
Nelson MoE office -0.087 (0.084)
-0.073 (0.088)
-0.083 (0.094)
Rotorua MoE office -0.006 (0.052)
-0.014 (0.053)
-0.010 (0.059)
Wellington MoE office 0.013
(0.048)
0.004 (0.051)
0.008 (0.057)
Whanganui MoE office -0.049 (0.053)
-0.050 (0.054)
-0.051 (0.058)
Whangarei MoE office -0.021 (0.067)
-0.026 (0.068)
-0.026 (0.075)
Mother at age 14 0.279
*
(0.163)
0.289*
(0.164)
0.321**
(0.145)
Mother at age 15 0.085
(0.066)
0.082
(0.067)
0.099
(0.077)
Mother at age 16 0.035
(0.050)
0.032
(0.050)
0.040
(0.058)
Mother at age 17 0.113
**
(0.047)
0.110**
(0.047)
0.127**
(0.055)
Mother at age 18 0.102
**
(0.047)
0.102**
(0.047)
0.121**
(0.055)
Days mother on benefit by age 5 -0.000
(0.000)
-0.000
(0.000)
-0.000
(0.000)
School size -0.010
*
(0.006)
-0.011*
(0.006)
-0.012*
(0.007)
Constant 0.255
***
(0.079)
0.231***
(0.090) ---
n 1,521 1,521 1,521
R2 Statistic 0.1456 0.1431 ---
F Statistic 7.22 6.11 ---
Log-Likelihood Function --- --- -1,861.80
Pseudo R2 Statistic --- --- ---
Notes:
Full sets of regression results. See the notes at the bottom of Table 10 in the main body of this report for more
information on these estimation procedures. The last two sets of regression results are from the second stage of
these Instrumental Variable procedures. The first-stage results are available from the authors upon request.
Excluded categories are birth cohort =1991, urban area = Main Urban Area and MoE Office = Auckland North,
Mother age = 13.
***
Estimated effect significantly different from zero at a 1% level using a t test **
Estimated effect significantly different from zero at a 5% level using a t test * Estimated effect significantly different from zero at a 10% level using a t test
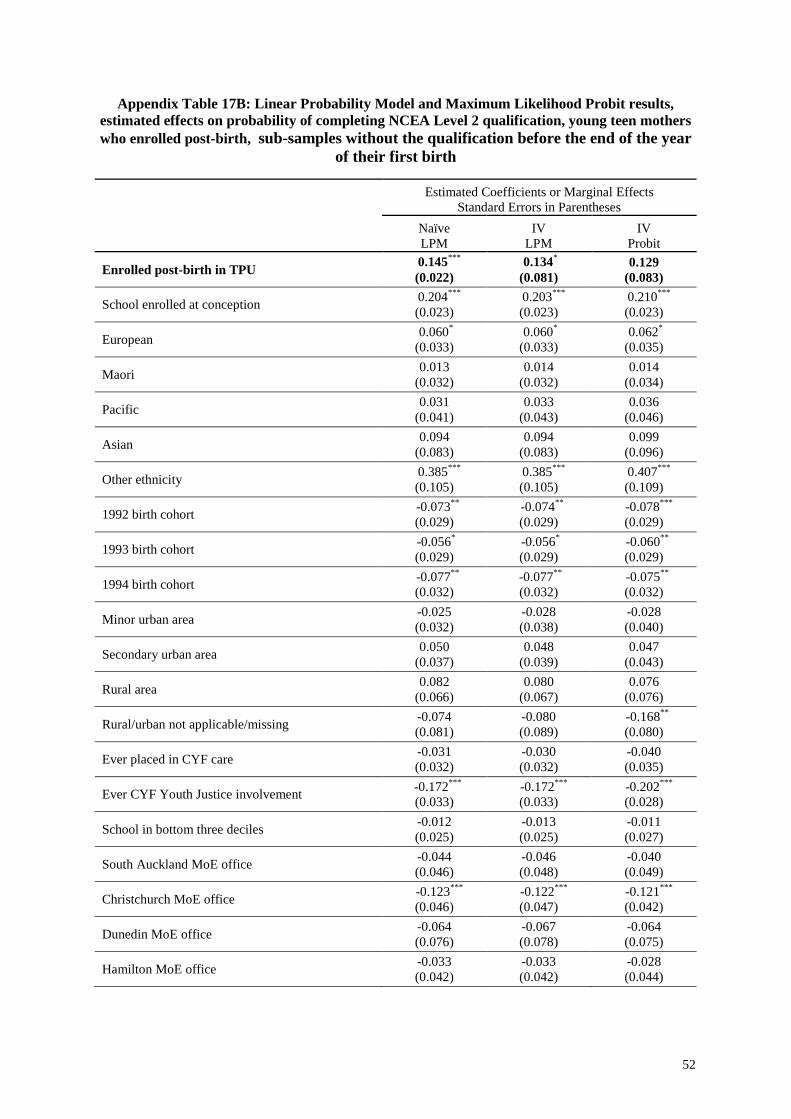
52
Appendix Table 17B: Linear Probability Model and Maximum Likelihood Probit results,
estimated effects on probability of completing NCEA Level 2 qualification, young teen mothers
who enrolled post-birth, sub-samples without the qualification before the end of the year
of their first birth
Estimated Coefficients or Marginal Effects
Standard Errors in Parentheses
Naïve
LPM IV
LPM
IV
Probit
Enrolled post-birth in TPU 0.145
***
(0.022)
0.134*
(0.081)
0.129 (0.083)
School enrolled at conception 0.204
***
(0.023) 0.203
***
(0.023)
0.210***
(0.023)
European 0.060
* (0.033)
0.060*
(0.033)
0.062*
(0.035)
Maori 0.013
(0.032)
0.014 (0.032)
0.014 (0.034)
Pacific 0.031
(0.041)
0.033 (0.043)
0.036 (0.046)
Asian 0.094
(0.083)
0.094 (0.083)
0.099 (0.096)
Other ethnicity 0.385
*** (0.105)
0.385***
(0.105)
0.407***
(0.109)
1992 birth cohort -0.073
** (0.029)
-0.074**
(0.029)
-0.078***
(0.029)
1993 birth cohort -0.056
* (0.029)
-0.056*
(0.029)
-0.060**
(0.029)
1994 birth cohort -0.077
** (0.032)
-0.077**
(0.032)
-0.075**
(0.032)
Minor urban area -0.025 (0.032)
-0.028 (0.038)
-0.028 (0.040)
Secondary urban area 0.050
(0.037)
0.048 (0.039)
0.047 (0.043)
Rural area 0.082
(0.066)
0.080 (0.067)
0.076 (0.076)
Rural/urban not applicable/missing -0.074 (0.081)
-0.080 (0.089)
-0.168**
(0.080)
Ever placed in CYF care -0.031 (0.032)
-0.030 (0.032)
-0.040 (0.035)
Ever CYF Youth Justice involvement -0.172
*** (0.033)
-0.172***
(0.033)
-0.202***
(0.028)
School in bottom three deciles -0.012 (0.025)
-0.013 (0.025)
-0.011 (0.027)
South Auckland MoE office -0.044 (0.046)
-0.046 (0.048)
-0.040 (0.049)
Christchurch MoE office -0.123
*** (0.046)
-0.122***
(0.047)
-0.121***
(0.042)
Dunedin MoE office -0.064 (0.076)
-0.067 (0.078)
-0.064 (0.075)
Hamilton MoE office -0.033 (0.042)
-0.033 (0.042)
-0.028 (0.044)
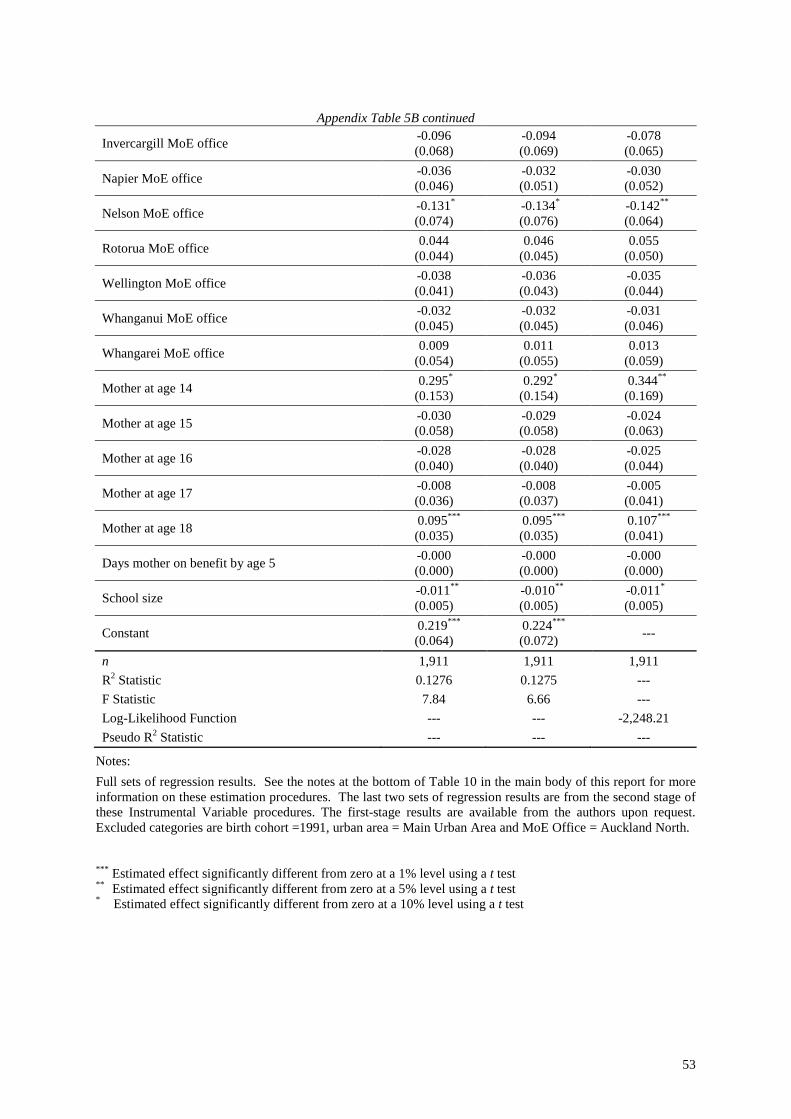
53
Appendix Table 5B continued
Invercargill MoE office -0.096 (0.068)
-0.094 (0.069)
-0.078 (0.065)
Napier MoE office -0.036 (0.046)
-0.032 (0.051)
-0.030 (0.052)
Nelson MoE office -0.131
* (0.074)
-0.134*
(0.076)
-0.142**
(0.064)
Rotorua MoE office 0.044
(0.044)
0.046 (0.045)
0.055 (0.050)
Wellington MoE office -0.038 (0.041)
-0.036 (0.043)
-0.035 (0.044)
Whanganui MoE office -0.032 (0.045)
-0.032 (0.045)
-0.031 (0.046)
Whangarei MoE office 0.009
(0.054)
0.011 (0.055)
0.013 (0.059)
Mother at age 14 0.295
*
(0.153)
0.292*
(0.154)
0.344**
(0.169)
Mother at age 15 -0.030
(0.058)
-0.029
(0.058)
-0.024
(0.063)
Mother at age 16 -0.028
(0.040)
-0.028
(0.040)
-0.025
(0.044)
Mother at age 17 -0.008
(0.036)
-0.008
(0.037)
-0.005
(0.041)
Mother at age 18 0.095
***
(0.035)
0.095***
(0.035)
0.107***
(0.041)
Days mother on benefit by age 5 -0.000
(0.000)
-0.000
(0.000)
-0.000
(0.000)
School size -0.011
**
(0.005)
-0.010**
(0.005)
-0.011*
(0.005)
Constant 0.219
***
(0.064)
0.224***
(0.072) ---
n 1,911 1,911 1,911
R2 Statistic 0.1276 0.1275 ---
F Statistic 7.84 6.66 ---
Log-Likelihood Function --- --- -2,248.21
Pseudo R2 Statistic --- --- ---
Notes:
Full sets of regression results. See the notes at the bottom of Table 10 in the main body of this report for more
information on these estimation procedures. The last two sets of regression results are from the second stage of
these Instrumental Variable procedures. The first-stage results are available from the authors upon request.
Excluded categories are birth cohort =1991, urban area = Main Urban Area and MoE Office = Auckland North.
***
Estimated effect significantly different from zero at a 1% level using a t test **
Estimated effect significantly different from zero at a 5% level using a t test * Estimated effect significantly different from zero at a 10% level using a t test
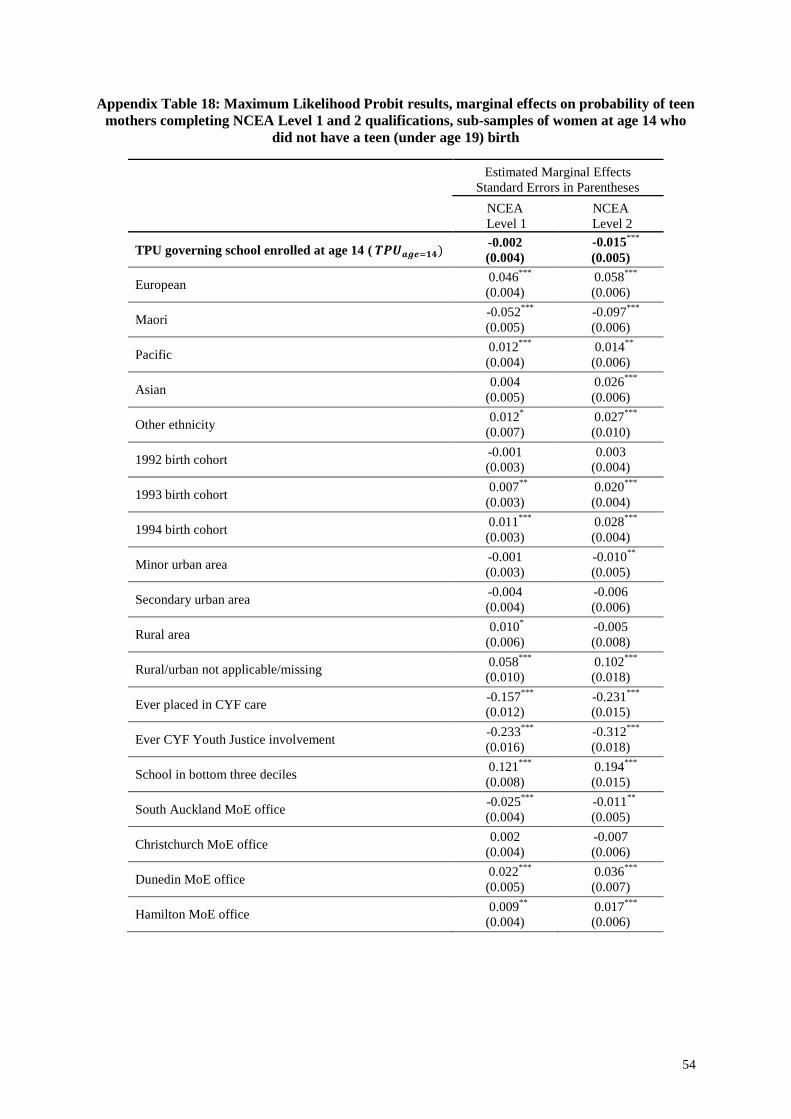
54
Appendix Table 18: Maximum Likelihood Probit results, marginal effects on probability of teen
mothers completing NCEA Level 1 and 2 qualifications, sub-samples of women at age 14 who
did not have a teen (under age 19) birth
Estimated Marginal Effects
Standard Errors in Parentheses
NCEA
Level 1 NCEA
Level 2
TPU governing school enrolled at age 14 ( 𝑻𝑷𝑼𝒂𝒈𝒆=𝟏𝟒) -0.002 (0.004)
-0.015***
(0.005)
European 0.046
*** (0.004)
0.058***
(0.006)
Maori -0.052
*** (0.005)
-0.097***
(0.006)
Pacific 0.012
*** (0.004)
0.014**
(0.006)
Asian 0.004
(0.005)
0.026***
(0.006)
Other ethnicity 0.012
* (0.007)
0.027***
(0.010)
1992 birth cohort -0.001 (0.003)
0.003 (0.004)
1993 birth cohort 0.007
** (0.003)
0.020***
(0.004)
1994 birth cohort 0.011
*** (0.003)
0.028***
(0.004)
Minor urban area -0.001 (0.003)
-0.010**
(0.005)
Secondary urban area -0.004 (0.004)
-0.006 (0.006)
Rural area 0.010
* (0.006)
-0.005 (0.008)
Rural/urban not applicable/missing 0.058
*** (0.010)
0.102***
(0.018)
Ever placed in CYF care -0.157
*** (0.012)
-0.231***
(0.015)
Ever CYF Youth Justice involvement -0.233
*** (0.016)
-0.312***
(0.018)
School in bottom three deciles 0.121
*** (0.008)
0.194***
(0.015)
South Auckland MoE office -0.025
*** (0.004)
-0.011**
(0.005)
Christchurch MoE office 0.002
(0.004)
-0.007 (0.006)
Dunedin MoE office 0.022
*** (0.005)
0.036***
(0.007)
Hamilton MoE office 0.009
** (0.004)
0.017***
(0.006)
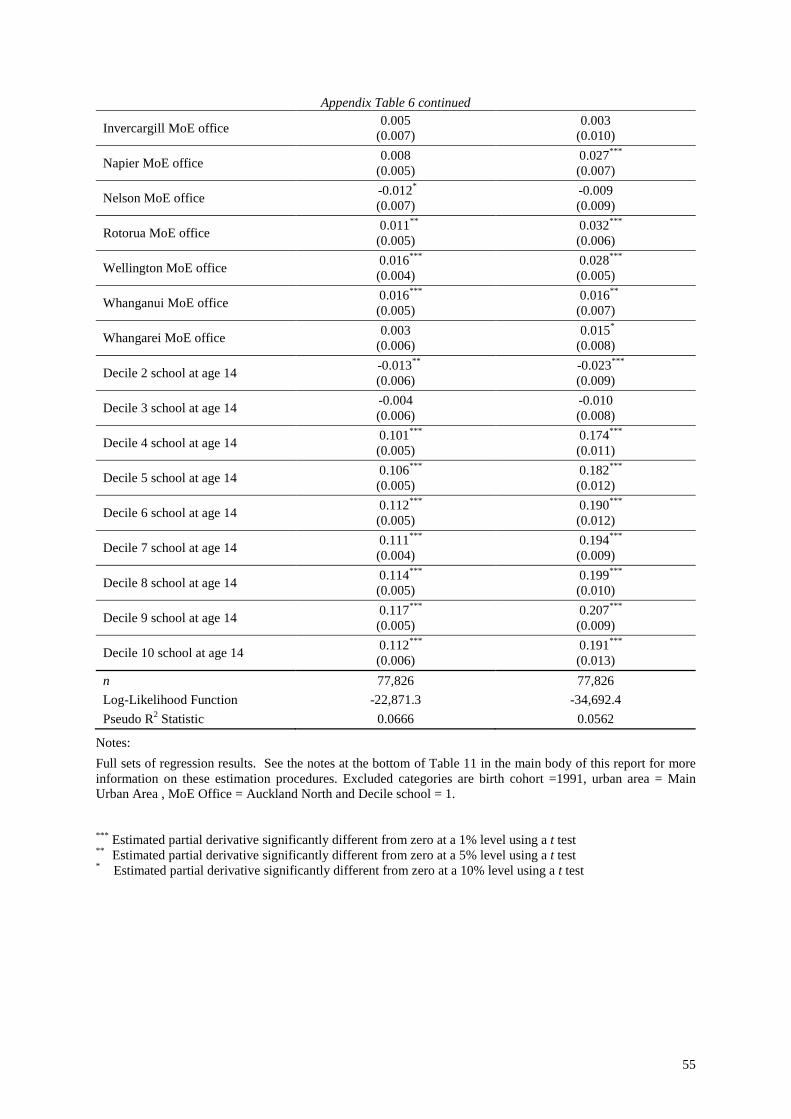
55
Appendix Table 6 continued
Invercargill MoE office 0.005
(0.007)
0.003 (0.010)
Napier MoE office 0.008
(0.005)
0.027***
(0.007)
Nelson MoE office -0.012
* (0.007)
-0.009 (0.009)
Rotorua MoE office 0.011
** (0.005)
0.032***
(0.006)
Wellington MoE office 0.016
*** (0.004)
0.028***
(0.005)
Whanganui MoE office 0.016
*** (0.005)
0.016**
(0.007)
Whangarei MoE office 0.003
(0.006)
0.015*
(0.008)
Decile 2 school at age 14 -0.013
**
(0.006)
-0.023***
(0.009)
Decile 3 school at age 14 -0.004
(0.006)
-0.010
(0.008)
Decile 4 school at age 14 0.101
***
(0.005)
0.174***
(0.011)
Decile 5 school at age 14 0.106
***
(0.005)
0.182***
(0.012)
Decile 6 school at age 14 0.112
***
(0.005)
0.190***
(0.012)
Decile 7 school at age 14 0.111
***
(0.004)
0.194***
(0.009)
Decile 8 school at age 14 0.114
***
(0.005)
0.199***
(0.010)
Decile 9 school at age 14 0.117
***
(0.005)
0.207***
(0.009)
Decile 10 school at age 14 0.112
***
(0.006)
0.191***
(0.013)
n 77,826 77,826
Log-Likelihood Function -22,871.3 -34,692.4
Pseudo R2 Statistic 0.0666 0.0562
Notes:
Full sets of regression results. See the notes at the bottom of Table 11 in the main body of this report for more
information on these estimation procedures. Excluded categories are birth cohort =1991, urban area = Main
Urban Area , MoE Office = Auckland North and Decile school = 1.
***
Estimated partial derivative significantly different from zero at a 1% level using a t test **
Estimated partial derivative significantly different from zero at a 5% level using a t test * Estimated partial derivative significantly different from zero at a 10% level using a t test


![[PPT]PowerPoint Presentationluc.edu/media/lucedu/hhhci/pdf/Binns presentation... · Web viewClasses for teen mothers. Safety Kit provided. ... Working together – we can make a difference!](https://img.pdfslide.net/doc/110x75/5ab5773e7f8b9a86428cbc84/pptpowerpoint-presentationweb-viewclasses-for-teen-mothers-safety-kit-provided.jpg)