Embed Size (px)
Citation preview
i
SEISMIC PERFORMANCE OF WATER TANK TOWER
FADRUL HAFIZ BIN ISMAIL
A project report submitted in partial fulfillment of the
requirements for the award of the degree of
Master of Engineering (Civil-Structure)
Faculty of Civil Engineering
Universiti Teknologi Malaysia
JUNE 2009
ii
“I declare that this project report is the result of my own work except as cited
in the references. The project report has not been accepted for any degree
and is not concurrently submitted in candidature of any other degree.
Signature :
Name : FADRUL HAFIZ BIN ISMAIL
Date :

PSZ 19:16 (Pind. 1/07)
DECLARATION OF THESIS / UNDERGRADUATE PROJECT PAPER AND COPYRIGHT
FADRUL HAFIZ BIN ISMAIL Author’s full name : Date of birth : 15 / 03 / 1985 Title : SEISMIC PERFORMANCE OF WATER TANK TOWER 2008/2009 Academic Session : I declare that this thesis is classified as: I acknowledged that Universiti Teknologi Malaysia reserves the right as follows :
1. The thesis is the property of Universiti Teknologi Malaysia. 2. The Library of Universiti Teknologi Malaysia has the right to make copies for the purpose
of research only. 3. The Library has the right to make copies of the thesis for academic exchange.
Certified by:
SIGNATURE SIGNATURE OF SUPERVISOR 850315-71-5045 PROF DR. AZLAN BIN ADNAN (NEW IC NO. /PASSPORT NO.) NAME OF SUPERVISOR
Date : 30th June 2009 Date : 30th June 2009
NOTES : * If the thesis is CONFIDENTIAL or RESTRICTED, please attach with the letter from the organisation with period and reasons for confidentiality or restriction.
UNIVERSITI TEKNOLOGI MALAYSIA
CONFIDENTIAL (Contains confidential information under the Official Secret Act 1972)*
RESTRICTED (Contains restricted information as specified by the organisation where research was done)*
OPEN ACCESS I agree that my thesis to be published as online open access (full text)
iii
DEDICATION
“.... teristimewa buat mama dan ayah,
Puan Adzura Abdullah dan Encik Ismail Ishak,
ini adalah hasil titik peluh anakmu…
kepada kakak dan adik-adik tersayang,
Zira, Keyi, Radi, Zana, Ashraf, dan Wani
ini adalah hasil usaha Apis di menara gading…
dan kepada rakan-rakan seperjuangan,
ini adalah usaha kita bersama
.…”
iv
ACKNOWLEDGEMENT
Alhamdulillah syukur ke hadrat Ilahi kerana dengan limpah kurniaNya
laporan ini dapat disiapkan dengan jayanya. Bersempena dengan itu, saya dengan
berbesar hati ingin mengucapkan jutaan terima kasih kepada penyelia saya Prof. Dr.
Azlan Bin Adnan kerana telah memberi tunjuk ajar yang berguna dalam penghasilan
laporan projek ini.
Saya juga ingin merakamkan jutaan terima kasih saya terutama kepada ibu
bapa saya Puan Adzura Binti Abdullah, Encik Ismail Bin Ishak dan kakak dan adik-
adik yang banyak membantu saya dalam menyiapkan projek ini. Tanpa mereka tidak
mungkin projek ini berjaya disiapkan Terima kasih juga kepada rakan-rakan
kumpulan Projek Sarjana dibawah penyeliaan Prof Dr Azlan, Mohd Saffuan dan Ong
kerana banyak memberi kerjasama dalam perbincangan projek. Tidak lupa juga
kepada rakan-rakan Siti Rahmah, Meldy, Nik Zainab, Kusafirah, Haijan, Hanis,
Hazwan, Midun serta rakan-rakan lain secara tak langsung membantu dalam proses
perjalanan projek ini.
Harapan saya agar laporan ini dapat menyumbangkan sedikit sebanyak ilmu
untuk kita semua. Segala yang berlaku adalah kehendak ilahi dan sesungguhnya ilmu
yang ada pada manusia adalah diibaratkan setitik air dihujung jarum berbanding air
di lautan, itulah ilmu Allah S.W.T.
“Sekalung budi setinggi-tinggi penghargaan”
TERIMA KASIH SEMUA.
- Fadrul Hafiz Bin Ismail -
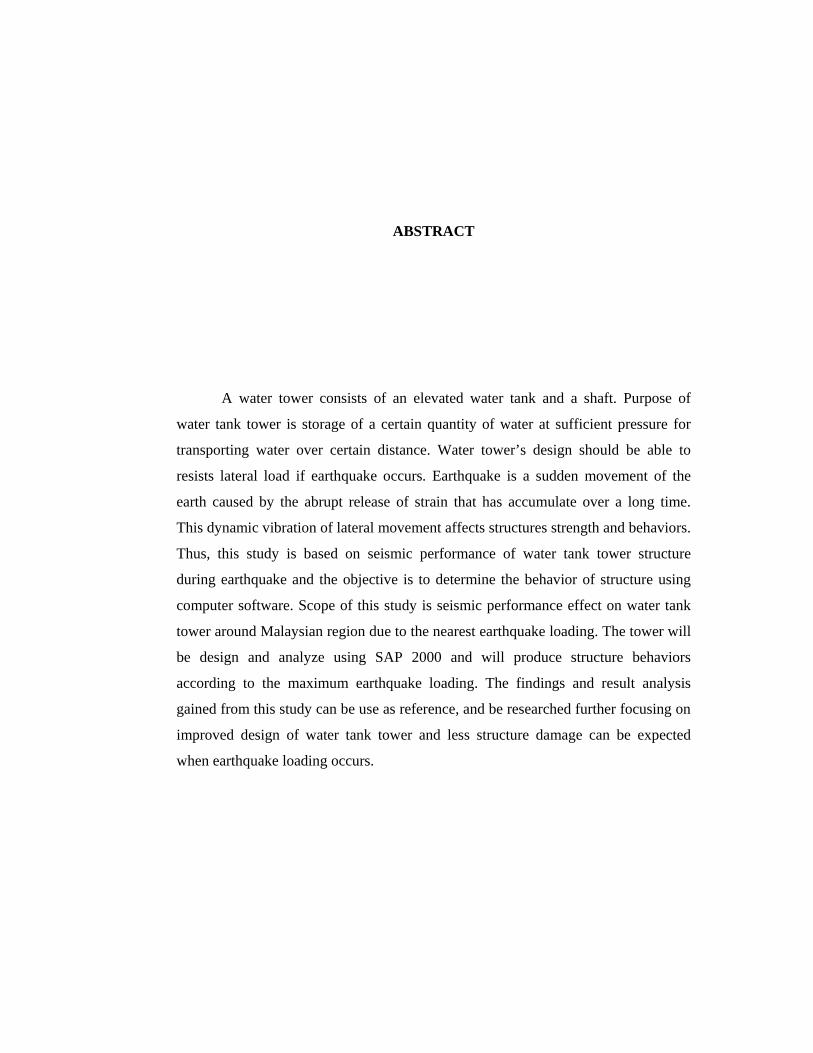
ABSTRACT
A water tower consists of an elevated water tank and a shaft. Purpose of
water tank tower is storage of a certain quantity of water at sufficient pressure for
transporting water over certain distance. Water tower’s design should be able to
resists lateral load if earthquake occurs. Earthquake is a sudden movement of the
earth caused by the abrupt release of strain that has accumulate over a long time.
This dynamic vibration of lateral movement affects structures strength and behaviors.
Thus, this study is based on seismic performance of water tank tower structure
during earthquake and the objective is to determine the behavior of structure using
computer software. Scope of this study is seismic performance effect on water tank
tower around Malaysian region due to the nearest earthquake loading. The tower will
be design and analyze using SAP 2000 and will produce structure behaviors
according to the maximum earthquake loading. The findings and result analysis
gained from this study can be use as reference, and be researched further focusing on
improved design of water tank tower and less structure damage can be expected
when earthquake loading occurs.
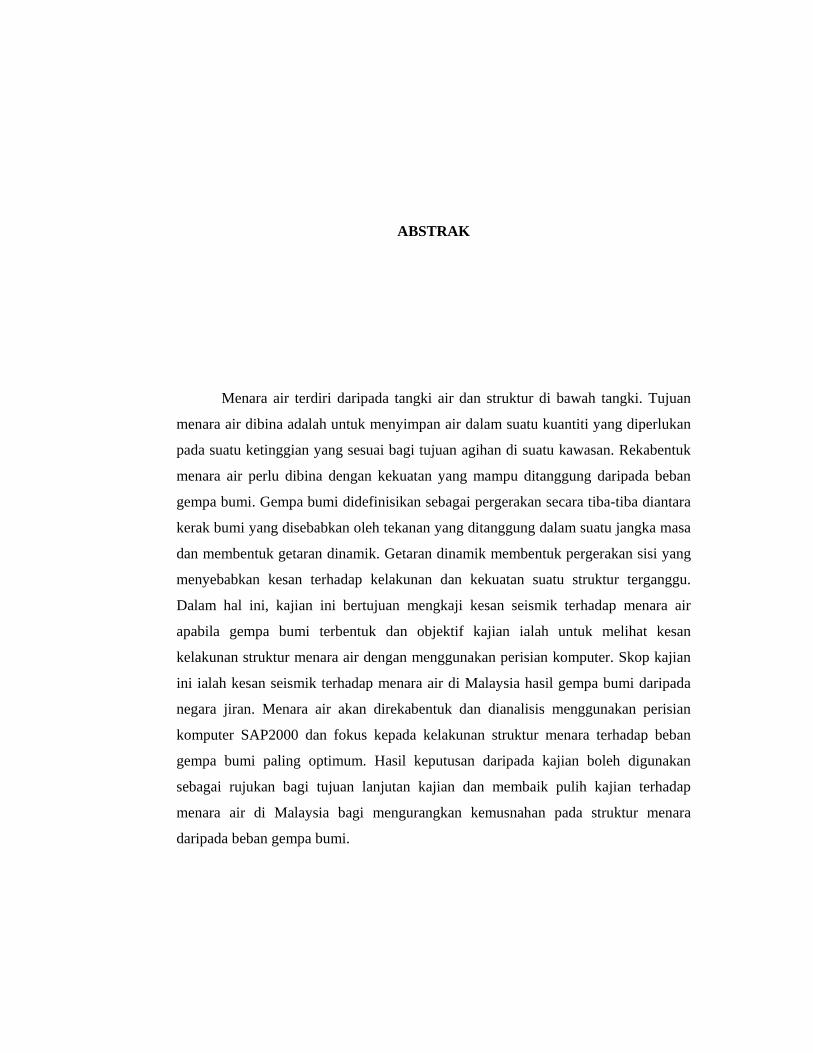
ABSTRAK
Menara air terdiri daripada tangki air dan struktur di bawah tangki. Tujuan
menara air dibina adalah untuk menyimpan air dalam suatu kuantiti yang diperlukan
pada suatu ketinggian yang sesuai bagi tujuan agihan di suatu kawasan. Rekabentuk
menara air perlu dibina dengan kekuatan yang mampu ditanggung daripada beban
gempa bumi. Gempa bumi didefinisikan sebagai pergerakan secara tiba-tiba diantara
kerak bumi yang disebabkan oleh tekanan yang ditanggung dalam suatu jangka masa
dan membentuk getaran dinamik. Getaran dinamik membentuk pergerakan sisi yang
menyebabkan kesan terhadap kelakunan dan kekuatan suatu struktur terganggu.
Dalam hal ini, kajian ini bertujuan mengkaji kesan seismik terhadap menara air
apabila gempa bumi terbentuk dan objektif kajian ialah untuk melihat kesan
kelakunan struktur menara air dengan menggunakan perisian komputer. Skop kajian
ini ialah kesan seismik terhadap menara air di Malaysia hasil gempa bumi daripada
negara jiran. Menara air akan direkabentuk dan dianalisis menggunakan perisian
komputer SAP2000 dan fokus kepada kelakunan struktur menara terhadap beban
gempa bumi paling optimum. Hasil keputusan daripada kajian boleh digunakan
sebagai rujukan bagi tujuan lanjutan kajian dan membaik pulih kajian terhadap
menara air di Malaysia bagi mengurangkan kemusnahan pada struktur menara
daripada beban gempa bumi.
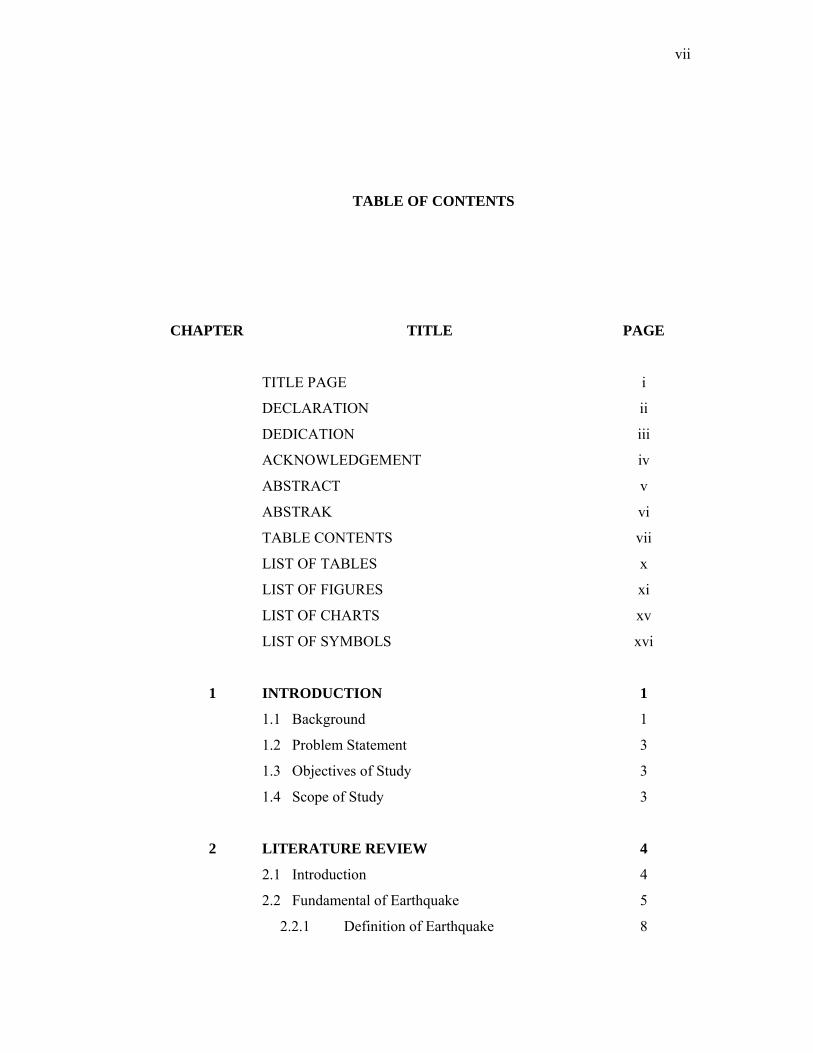
vii
TABLE OF CONTENTS
CHAPTER
TITLE
PAGE
1
TITLE PAGE
DECLARATION
DEDICATION
ACKNOWLEDGEMENT
ABSTRACT
ABSTRAK
TABLE CONTENTS
LIST OF TABLES
LIST OF FIGURES
LIST OF CHARTS
LIST OF SYMBOLS
INTRODUCTION
1.1 Background
1.2 Problem Statement
1.3 Objectives of Study
1.4 Scope of Study
i
ii
iii
iv
v
vi
vii
x
xi
xv
xvi
1
1
3
3
3
2 LITERATURE REVIEW 4
2.1 Introduction
2.2 Fundamental of Earthquake
2.2.1 Definition of Earthquake
4
5
8
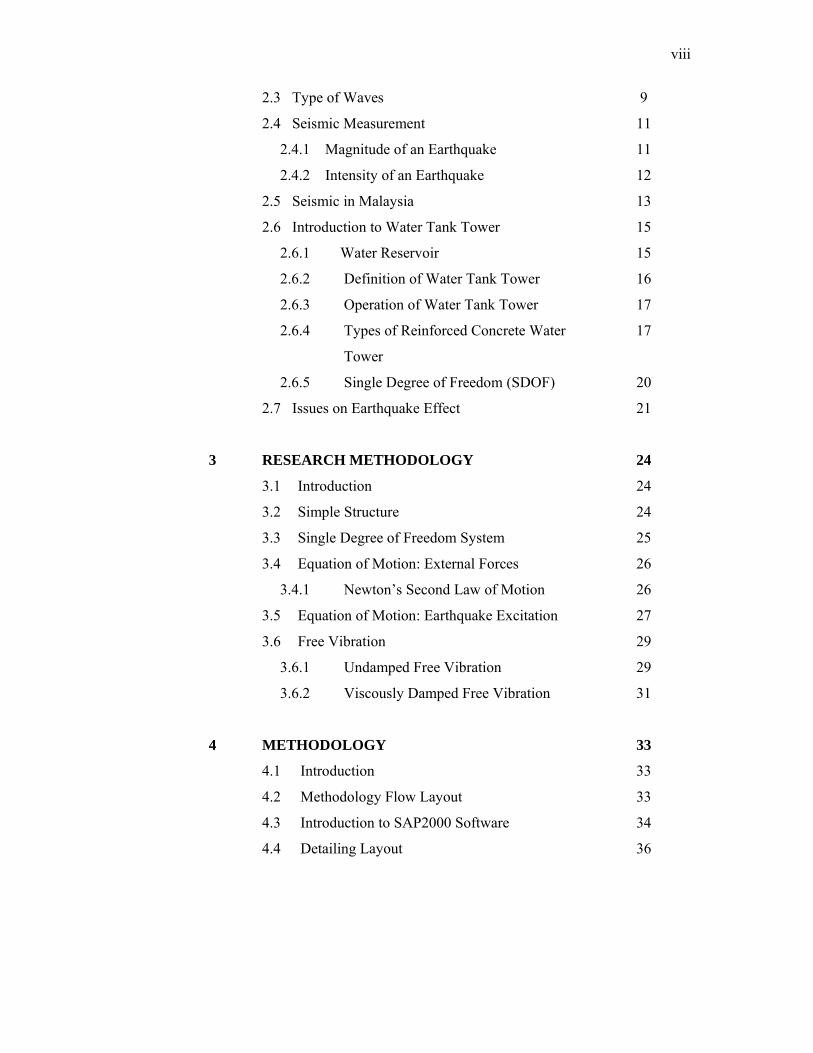
viii
2.3 Type of Waves
2.4 Seismic Measurement
2.4.1 Magnitude of an Earthquake
2.4.2 Intensity of an Earthquake
2.5 Seismic in Malaysia
2.6 Introduction to Water Tank Tower
2.6.1 Water Reservoir
2.6.2 Definition of Water Tank Tower
2.6.3 Operation of Water Tank Tower
2.6.4 Types of Reinforced Concrete Water
Tower
2.6.5 Single Degree of Freedom (SDOF)
2.7 Issues on Earthquake Effect
9
11
11
12
13
15
15
16
17
17
20
21
3 RESEARCH METHODOLOGY 24
3.1 Introduction
3.2 Simple Structure
3.3 Single Degree of Freedom System
3.4 Equation of Motion: External Forces
3.4.1 Newton’s Second Law of Motion
3.5 Equation of Motion: Earthquake Excitation
3.6 Free Vibration
3.6.1 Undamped Free Vibration
3.6.2 Viscously Damped Free Vibration
24
24
25
26
26
27
29
29
31
4 METHODOLOGY 33
4.1 Introduction
4.2 Methodology Flow Layout
4.3 Introduction to SAP2000 Software
4.4 Detailing Layout
33
33
34
36
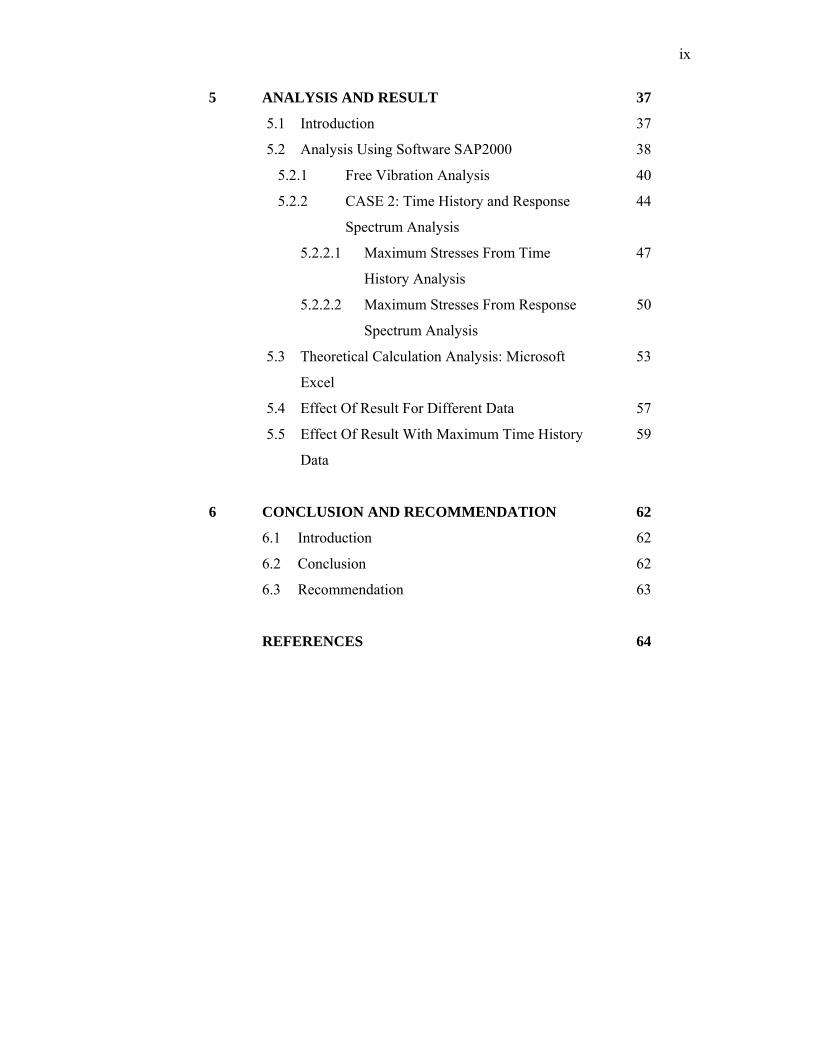
ix
5 ANALYSIS AND RESULT 37
5.1 Introduction
5.2 Analysis Using Software SAP2000
5.2.1 Free Vibration Analysis
5.2.2 CASE 2: Time History and Response
Spectrum Analysis
5.2.2.1 Maximum Stresses From Time
History Analysis
5.2.2.2 Maximum Stresses From Response
Spectrum Analysis
5.3 Theoretical Calculation Analysis: Microsoft
Excel
5.4 Effect Of Result For Different Data
5.5 Effect Of Result With Maximum Time History
Data
37
38
40
44
47
50
53
57
59
6 CONCLUSION AND RECOMMENDATION 62
6.1 Introduction
6.2 Conclusion
6.3 Recommendation
62
62
63
REFERENCES
64
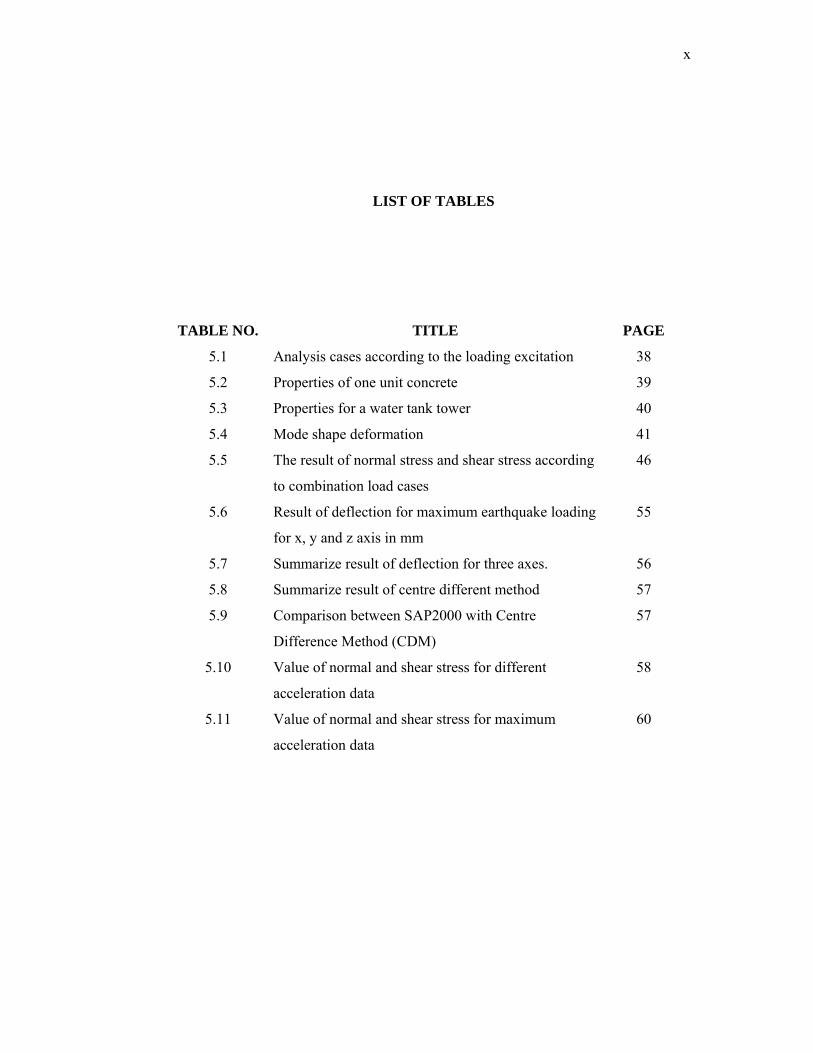
x
LIST OF TABLES
TABLE NO. TITLE PAGE
5.1
5.2
5.3
5.4
5.5
5.6
5.7
5.8
5.9
5.10
5.11
Analysis cases according to the loading excitation
Properties of one unit concrete
Properties for a water tank tower
Mode shape deformation
The result of normal stress and shear stress according
to combination load cases
Result of deflection for maximum earthquake loading
for x, y and z axis in mm
Summarize result of deflection for three axes.
Summarize result of centre different method
Comparison between SAP2000 with Centre
Difference Method (CDM)
Value of normal and shear stress for different
acceleration data
Value of normal and shear stress for maximum
acceleration data
38
39
40
41
46
55
56
57
57
58
60
xi
LIST OF FIGURES
FIGURE NO. TITLE PAGE
2.1
2.2
2.3
2.4
2.5
2.6
2.7
2.8
2.9
World Plate Tectonic Map (Source: Park & Plates:
R.J. Lillie, 2005)Empirical Equations for Es (Bowles,
1998)
Three types of boundaries (Source: USGS, 2002)
Relation between divergent and convergent
boundaries and other types of plate tectonic activities
(Source: Park & Plates: R.J. Lillie, 2005)
Several types of faults from plate tectonic movement
(Source: Park & Plates: R.J. Lillie, 2005)
A P-wave travels through a medium by means of
compression and dilation (Source: Lawrence Braile,
UPSeis.com, 2000)
An S-wave travels through a medium causes shearing
deformation (Source: Lawrence Braile, UPSeis.com,
2000)
Both Love and Rayleigh are surface wave
(Source: Lawrence Braile, UPSeis.com, 2000)
Peninsular Malaysia near the Sumatra Fault and
surrounded by Sumatra Trench and Java Trench
(Source: Huchon and Le Pichon, 1984)
Various types of water tank tower (Source: Sara
Hamm, 2004 and W.S. Gray, 1973)
5
6
6
7
9
10
11
14
15
xii
2.10
2.11
2.12
2.13
2.14
2.15
2.16
3.1
3.2
3.3
3.4
3.5
(a) Typical inclined legs of water tower, (b) Haifa,
Israel legs straight water tower (Source: W.S. Gray,
1973)
Typical water tower supported by shafts - Sheffield
water tower (Source: W.S. Gray, 1973)
A large diameter tanks supported by both columns
and shaft separately – Thundersley and Mucking
water tower (Source: W.S. Gray, 1973)
A large tank separate by two compartments for
different usage – Cantley water tower (Source: W.S.
Gray, 1973)
The economize water tower combined with chimney
in one structure – Aldridge, Staffordshire water tower
(Source: W.S. Gray, 1973)
Idealized water tank tower for SDOF system and free
vibration graph due to initial displacement (Source:
W.S. Gray, 1973, and A.K. Chopra, 2007)
Water tank in Chobari village, India collapse due to
Bhuj earthquake about 20 KM from epicenter.
(Source: Durgesh C. Rai, M.EERI, 2002)
Single Degree of Freedom system (a) Applied Force;
(b) earthquake induced ground motion (Source: A.K.
Chopra, 2007)
Idealize simple structure subjected to applied force
(Source: A.K. Chopra, 2007)
Idealize simple structure subjected to applied
earthquake excitation (Source: A.K. Chopra, 2007)
Free vibration of a system without damping (Source:
A.K. Chopra, 2007)
Graph of free vibration of underdamped, critically
damped, and overdamped systems (Source: A.K.
Chopra, 2007)
18
18
19
19
20
21
22
26
26
28
30
31
xiii
3.6
4.1
5.1
5.2
5.3
5.4
5.5
5.6
5.7
5.8
5.9
5.10
5.11
5.12
5.13
5.14
5.15
5.16
5.17
5.18
Graph of free vibration of underdamped compared
with undamped structure systems (Source: A.K.
Chopra, 2007)
Flow Layout to analyze water tank tower structure
Dimension of water tower’s model in SAP2000
Ground acceleration graph (RapidKL)
Response spectrum of Rapid KL
Selected section area to compare the result
Maximum normal stress of time history analysis from
external loading
Maximum shear stress of time history analysis from
external loading
Maximum normal stress from combination load due
to external loading in KN/m2
Maximum shear stress from combination load due to
external loading in KN/m2
Maximum normal stress from response spectrum
analysis. Results value is in KN/m2
Maximum shear stress from response spectrum
analysis. Result value is in KN/m2
Maximum normal stress from combination load due
to external loading in KN/m2
Maximum shear stress from combination load due to
external loading in KN/m2
Selected point to get maximum deflection in
SAP2000
Deformation of water tower when external loading
occur.
Example of Spreadsheet for manual calculation of
central difference method
Example of data taken for analysis
Graph of ground acceleration versus stress
Example of data taken for optimum analysis
32
34
39
45
45
46
48
48
49
50
51
51
52
53
54
54
56
58
59
60

xiv
5.19 Graph of ground acceleration versus stress 61
xv
LIST OF CHARTS
CHART
NO.
TITLE PAGE
4.1 Water tank tower design analysis flow chart 34
xvi
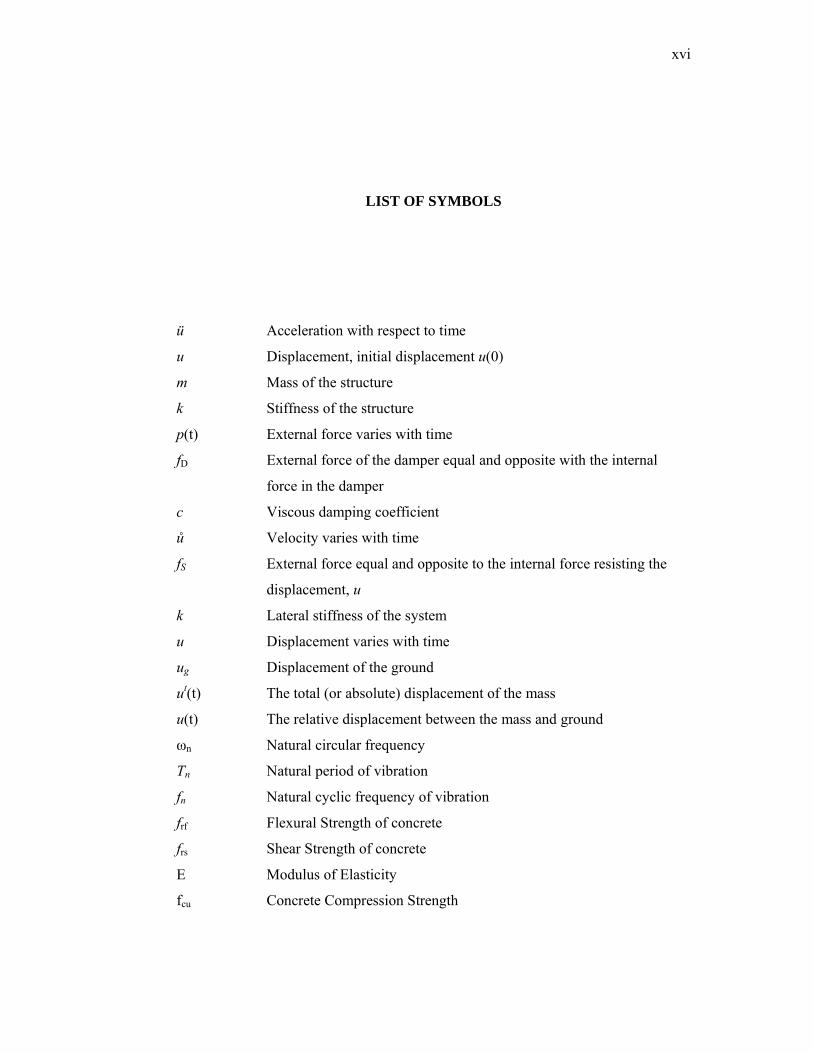
LIST OF SYMBOLS
ü Acceleration with respect to time
u Displacement, initial displacement u(0)
m Mass of the structure
k Stiffness of the structure
p(t) External force varies with time
fD External force of the damper equal and opposite with the internal
force in the damper
c Viscous damping coefficient
ů Velocity varies with time
fS External force equal and opposite to the internal force resisting the
displacement, u
k Lateral stiffness of the system
u Displacement varies with time
ug Displacement of the ground
ut(t) The total (or absolute) displacement of the mass
u(t) The relative displacement between the mass and ground
ωn Natural circular frequency
Tn Natural period of vibration
fn Natural cyclic frequency of vibration
frf Flexural Strength of concrete
frs Shear Strength of concrete
E Modulus of Elasticity
fcu Concrete Compression Strength
1
CHAPTER 1
INTRODUCTION
1.1 BACKGROUND
Water is human basic needs for daily life. Sufficient water distribution
depends on design of a water tank in certain area. An elevated water tank or water
tank tower is a large water storage container constructed for the purpose of holding
water supply at certain height to pressurise the water distribution system.
Pressurisation occurs through the elevation of water on the tower height as per
requirement of the distribution system. Water tank should be placed at the highest
point and at the centre of the pipeline system. Size of water tank depends on the
quantity of water needed at the maximum daily peak usage.
The first water supply system complex was developed in Germany in the
middle of the 19th century, leads to an important improvement in hygenic standard.
A central element of this modern water supply system was the water tank tower. This
is where water storage and elevation of water were united for the first time. In the
beginning of 1900 , and thirty to forty years later the largest number of water tower
were built when the villages and cities were equiped with public water distribution
system. When comes to 20th century, many tall building was built and the water tank
tower starts to lose their importance as the tanks were incorporated within the
2
building. However, water tank tower still presented asthetically to the industrial and
town development of certain places in some countrries and remain with its design
elements of structure. (Sara Hamm, 2004)
Apart from the design of water tank tower structure, the main purpose of its
built is to distribute water effectively and sufficiently. Water is important to human
being for their daily usage in residential and commercial service. It being important,
we should think of what will happen to water tank tower if earthquake occurs?
Earthquake was proven to cause worst phenomenon that can happen in
human life with a lot of damages. Earthquake happened when two tectonic plates
moved or slipped from its placed and produced energy that transfered to the earth’s
surface. The energy is transform into a seismic wave or vibration of the ground
motion. The ground acceleration from the wave are recorded and keep as time
history analysis data.
Based on seismotechnic setting map, Malaysia is located outside of
earthquake active zone. However, there is still a small percentage effect on
earthquake vibration that would reached Malaysia because of its location surrounded
by active earthquake zone. The nearest seismically active faults around Malaysia are
Indonesia and Philippines archipelagos as well as in the east and northeast of Sabah
(Azlan, 1999).
Therefore according to the above situation, Malaysia shall not be considered
as one of the totally free vibration country or totally safe from earthquake. Structure
design within Malaysian region must include the seismic effect which will increase
the safety factor of the structure including the structure of the water tank tower. This
paper is written to elustrate the analysis from a study an effect to a water tank tower
design in Malaysia when earthquake vibration occurs.
3
1.2 PROBLEM STATEMENT
It is known that water tank tower in Malaysia have low intensity of seismic
influence effect. The conventional structure design does not include the seismic
loading. Therefore, this study is conducted to observe the effect and the performance
of the water tower structure to resist the earthquake loading.
1.3 OBJECTIVE OF STUDY
The objectives of this study are:
(a) To study the dynamic characteristic of the structure.
(b) To determine the behavior of water tank tower structure when earthquake
occurs.
(c) To compare performance of structure under seismic loading with the
design capacity of the water tank tower.
(d) To compare the performance of structure using SAP2000 software with
the theoretical calculation.
1.4 SCOPE OF STUDY
The scope of study is limited to only one type of water tank tower structure.
The tower is analyzed using SAP2000 to see the behavior of the structure so that it
can be designed with less structural damages caused by earthquake vibration. The
result from SAP2000 will be compared with the theoretical calculation method using
Microsoft Excel as a medium to solve the problem. The water tower’s located at
UITM Shah Alam, Selangor is taken as a model for this study and the earthquake
data for analysis purposes is taken from RapidKL's data simulation for seismic
hazard assessment for Malaysia Region.
4
CHAPTER 2
LITERATURE REVIEW
2.1 INTRODUCTION
Simple way to describe an earthquake is dynamic vibration which will cause
disaster. Many definition was produced by researchers about theory of earthquake,
what causes earthquake and what it’s relationship with plate theory. This chapter will
be look into detail about the fundamental of earthquake, types of fault and waves,
how to measure earthquake and mesurement that has been used to determine the
earthquake. This chapter also will explain about the introduction of water tank tower,
types of elevated water tank that exists, examples of seismic performance of water
tank tower, and simple briefing about relation between water tank tower and single
degree of freedom theory.
5
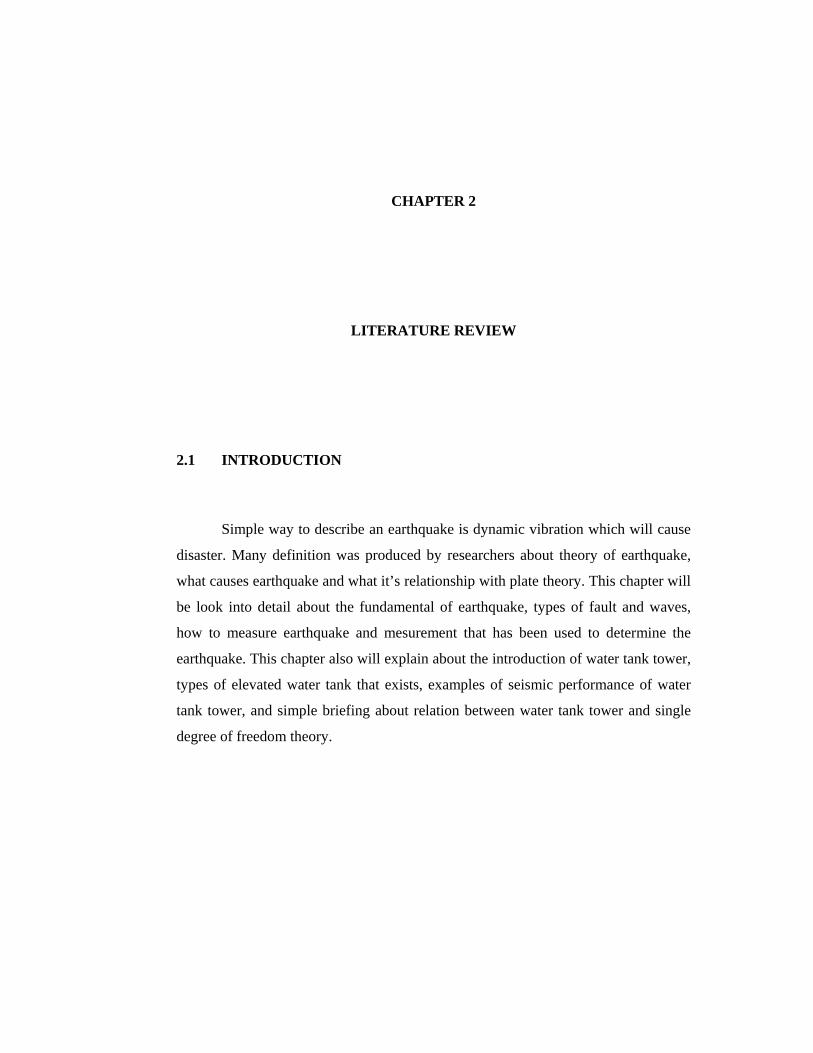
2.2 FUNDAMENTAL OF EARTHQUAKE
Earthquake is closely related to plate tectonic theory. The plate tectonics
theory in 1960s helped us to understand the theory behind the earthquake’s
definition. According to plate tectonic theory, the earth’s surface contains tectonic
plates also known as lithosphere plates. Each plate consists of the crust and the more
rigid part of the upper mantle. Earthquake is related to the movement between plate’s
boundaries from its original places (Robert, 2002).
Figure 2.1: World Plate Tectonic Map (Source: Park & Plates: R.J. Lillie, 2005)
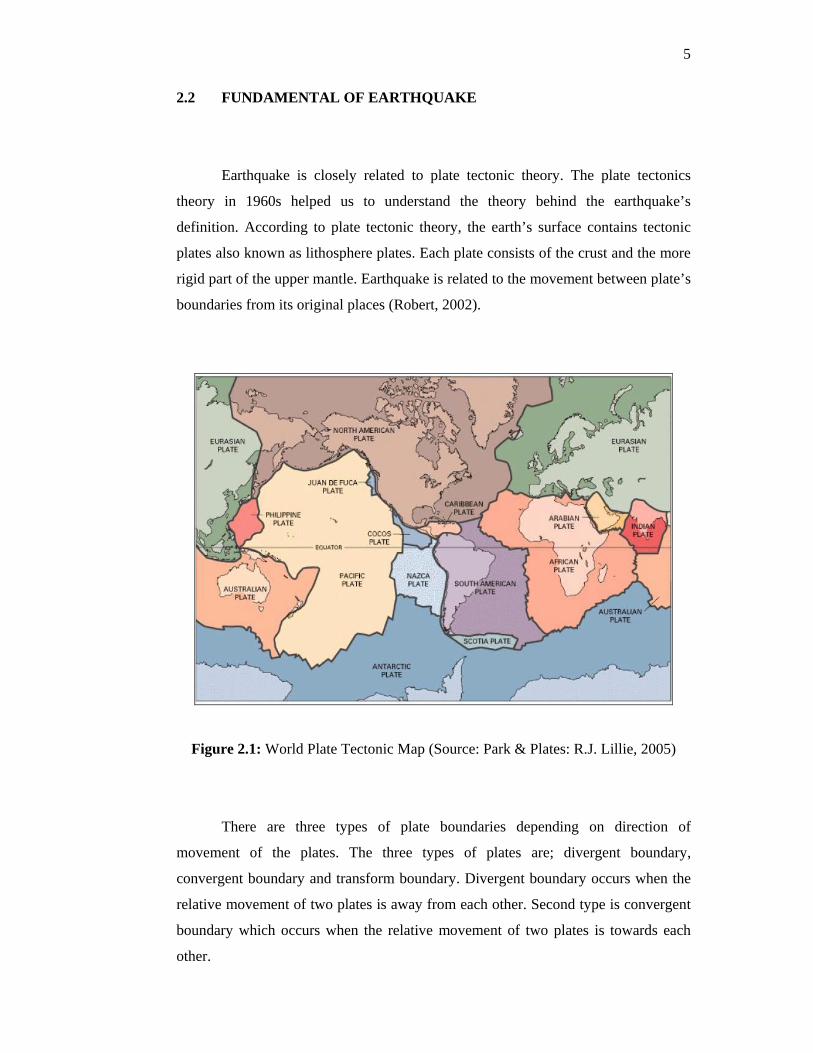
There are three types of plate boundaries depending on direction of
movement of the plates. The three types of plates are; divergent boundary,
convergent boundary and transform boundary. Divergent boundary occurs when the
relative movement of two plates is away from each other. Second type is convergent
boundary which occurs when the relative movement of two plates is towards each
other.
6
There is relation between divergent and convergent boundary which means if
divergent boundary happened at one area, convergent boundary must occur in
another area because earth’s surface remain relatively constant. The third type of
plate boundaries is transform boundary which involves the plates sliding past each
other without the construction or destruction of the earth’s crust.
Figure 2.2: Three types of boundaries (Source: USGS, 2002)
Figure 2.3: Relation between divergent and convergent boundaries and other types
of plate tectonic activities (Source: Park & Plates: R.J. Lillie, 2005)
7
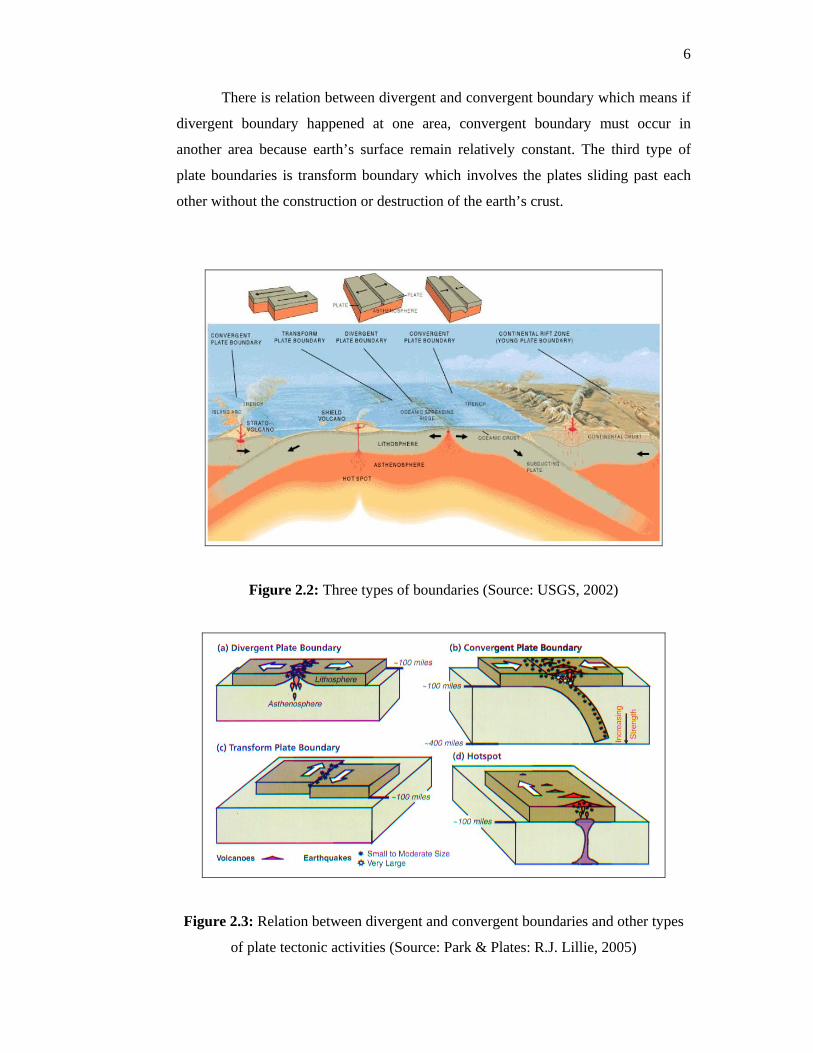
These three types of plate boundaries form from many types of faults. A fault
is defined as a fracture or a zone fracture in rock along which displacement has
occurred. This sudden displacement releases the energy and sometimes cause
earthquake. Earthquake will generate the motion of the earth’s surface and form the
seismic wave. Seismic wave is divided in two basic types which is body wave
(motion past through the interior of the earth) and surface waves (motion observed
close to the surface of the earth). The motion due to seismic waves is recorded by the
instrument called seismograph.
Figure 2.4: Several types of faults from plate tectonic movement
(Source: Park & Plates: R.J. Lillie, 2005)
8
2.2.1 DEFINITION OF EARTHQUAKE
Many different definition term and theory have been produced by researcher
but the basic it still related to theory of plate. According to Y.X. Hu and S.C. Liu in
1996,
“Earthquake related to global tectonic processes that are continually
altering the configuration of the earth’s surface. There are several
geographical regions in which earthquakes occurs most frequently which
are the Circum-Pacific belt around the Pacific Ocean, The Alphide belt
through western and also at the central Asia the areas where damage to
man-made systems.”
By Robert, 2002, says;
“Most earthquakes are caused by the release of energy due to sudden
displacements on faults. The major earthquake is characterized by the
buildup of stress and then the sudden release of this stress as the fault
rupture. And a fault is defined as a fracture in rock along which
displacement occurred.”
Others view is from Salman Abu-Sitta, 1980 expressed that;
“The event of earthquake is centre at a focus that is the point at which the
rupture initiates. The point on the surface of the ground about the focus is
the epicenter and the vertical separation of these two points is the focal
depth. This rupture occurs because of the excess straining and releases
energy that spread in various directions.”
Therefore from these several definitions, it shows that the earthquake occur
when two plates tectonic moved or slipped from its place and produce energy that
transfer on the earth’s surface. It is possible for the energy to transform into a seismic
wave or vibration of the ground motion.
9
2.3 TYPE OF WAVES
A fault rapture cause the acceleration of the ground motion on surface and
generated various seismic waves. There are two basic types of seismic waves; body
wave and surface wave.
P and S waves are both called body wave because they can pass through the
interior of the earth. Surface waves are only observed on the surface of the earth.
Surface wave is divided into two types which are Love wave and Rayleigh waves.
Surface wave happened from the interaction between body wave and the surficial
earth materials.
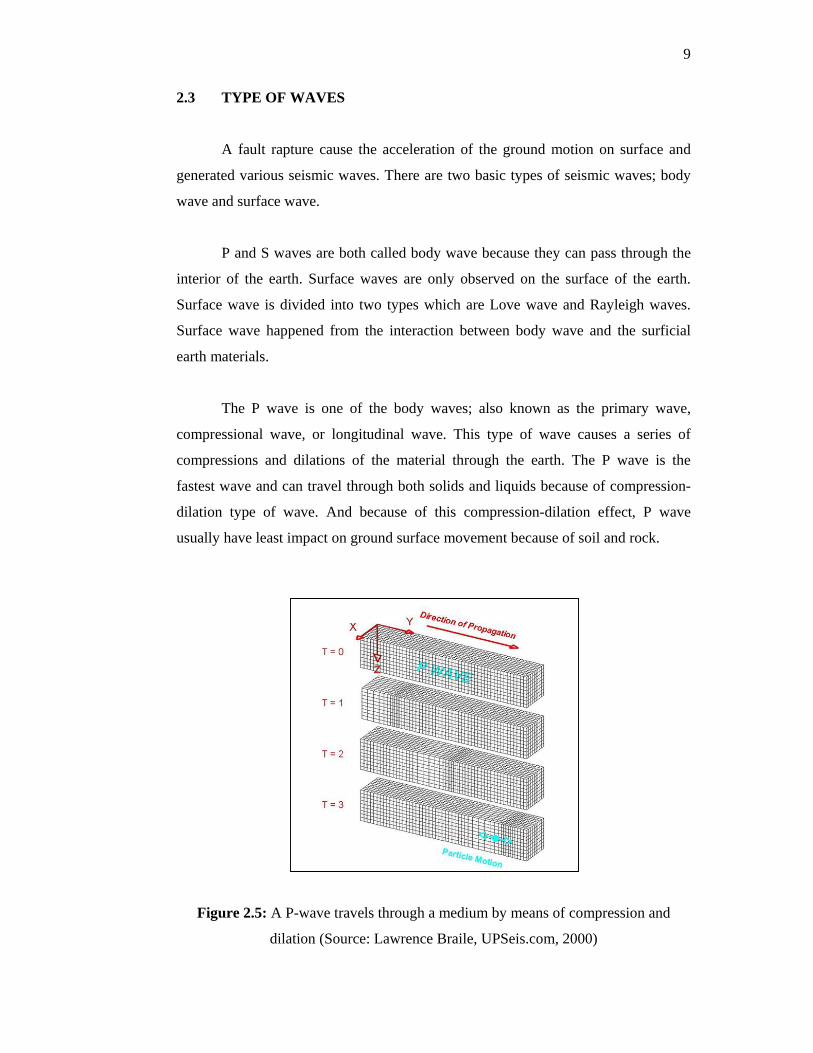
The P wave is one of the body waves; also known as the primary wave,
compressional wave, or longitudinal wave. This type of wave causes a series of
compressions and dilations of the material through the earth. The P wave is the
fastest wave and can travel through both solids and liquids because of compression-
dilation type of wave. And because of this compression-dilation effect, P wave
usually have least impact on ground surface movement because of soil and rock.
Figure 2.5: A P-wave travels through a medium by means of compression and
dilation (Source: Lawrence Braile, UPSeis.com, 2000)
10
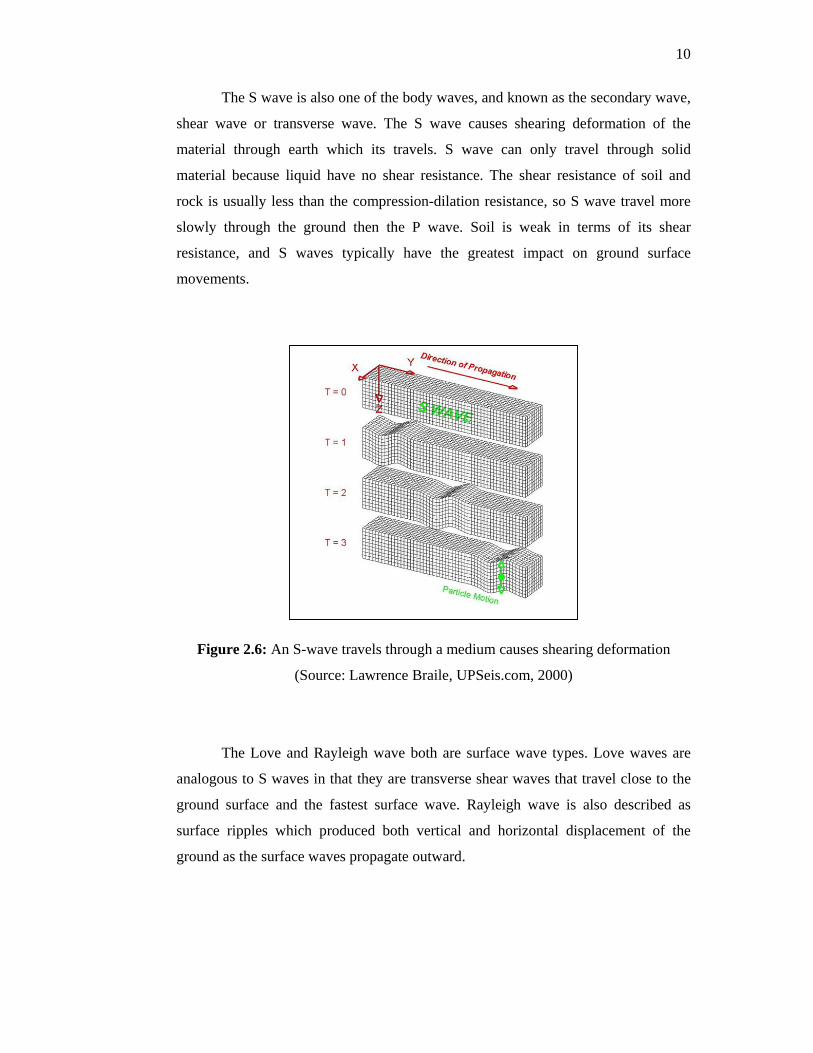
The S wave is also one of the body waves, and known as the secondary wave,
shear wave or transverse wave. The S wave causes shearing deformation of the
material through earth which its travels. S wave can only travel through solid
material because liquid have no shear resistance. The shear resistance of soil and
rock is usually less than the compression-dilation resistance, so S wave travel more
slowly through the ground then the P wave. Soil is weak in terms of its shear
resistance, and S waves typically have the greatest impact on ground surface
movements.
Figure 2.6: An S-wave travels through a medium causes shearing deformation
(Source: Lawrence Braile, UPSeis.com, 2000)
The Love and Rayleigh wave both are surface wave types. Love waves are
analogous to S waves in that they are transverse shear waves that travel close to the
ground surface and the fastest surface wave. Rayleigh wave is also described as
surface ripples which produced both vertical and horizontal displacement of the
ground as the surface waves propagate outward.
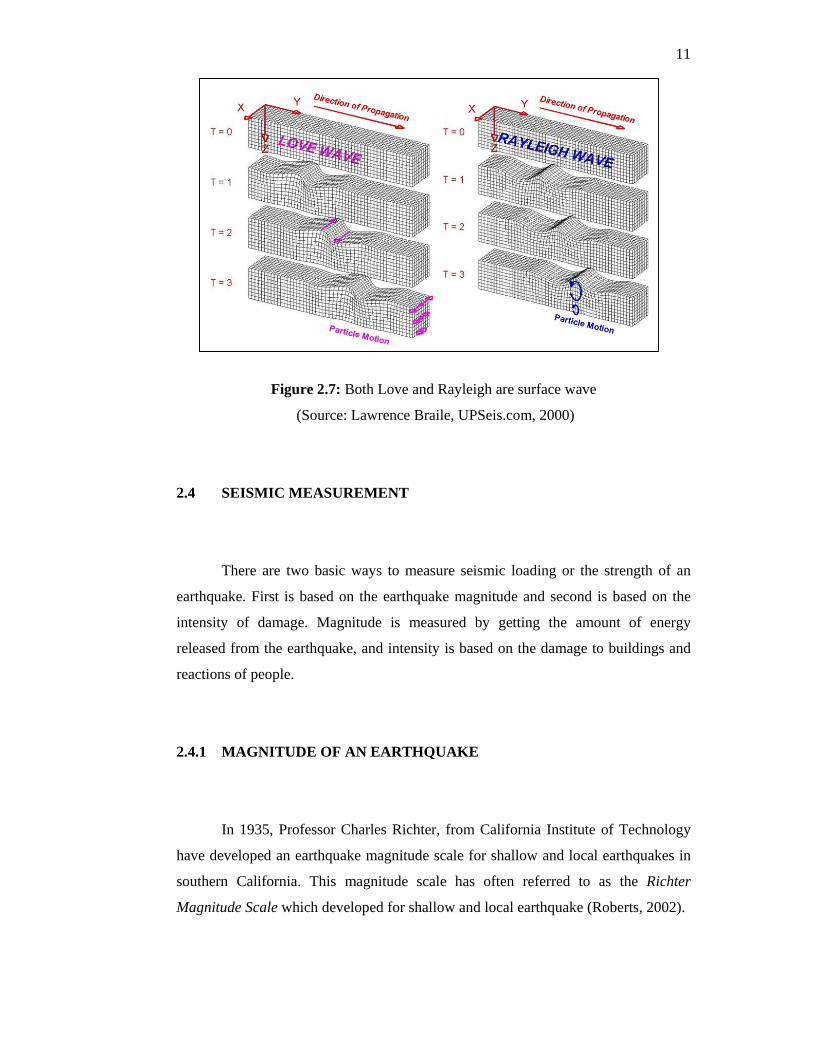
11
Figure 2.7: Both Love and Rayleigh are surface wave
(Source: Lawrence Braile, UPSeis.com, 2000)
2.4 SEISMIC MEASUREMENT
There are two basic ways to measure seismic loading or the strength of an
earthquake. First is based on the earthquake magnitude and second is based on the
intensity of damage. Magnitude is measured by getting the amount of energy
released from the earthquake, and intensity is based on the damage to buildings and
reactions of people.
2.4.1 MAGNITUDE OF AN EARTHQUAKE
In 1935, Professor Charles Richter, from California Institute of Technology
have developed an earthquake magnitude scale for shallow and local earthquakes in
southern California. This magnitude scale has often referred to as the Richter
Magnitude Scale which developed for shallow and local earthquake (Roberts, 2002).
12
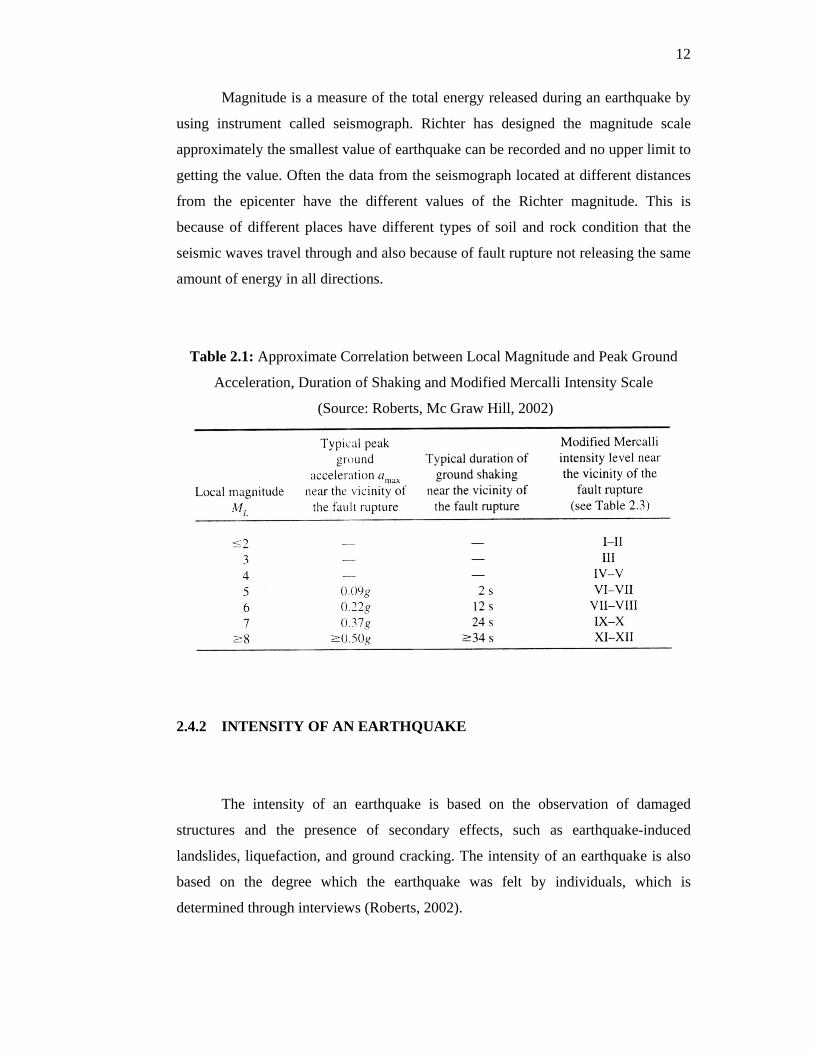
Magnitude is a measure of the total energy released during an earthquake by
using instrument called seismograph. Richter has designed the magnitude scale
approximately the smallest value of earthquake can be recorded and no upper limit to
getting the value. Often the data from the seismograph located at different distances
from the epicenter have the different values of the Richter magnitude. This is
because of different places have different types of soil and rock condition that the
seismic waves travel through and also because of fault rupture not releasing the same
amount of energy in all directions.
Table 2.1: Approximate Correlation between Local Magnitude and Peak Ground
Acceleration, Duration of Shaking and Modified Mercalli Intensity Scale
(Source: Roberts, Mc Graw Hill, 2002)
2.4.2 INTENSITY OF AN EARTHQUAKE
The intensity of an earthquake is based on the observation of damaged
structures and the presence of secondary effects, such as earthquake-induced
landslides, liquefaction, and ground cracking. The intensity of an earthquake is also
based on the degree which the earthquake was felt by individuals, which is
determined through interviews (Roberts, 2002).
13
The intensity may be easy to be predicted or determined in an urban area
because when earthquake happened, there will be a lot of structure damages and this
can be evaluated, where it is difficult to evaluate in rural area as the damages cannot
be quantified. The most commonly used scale for the determination of earthquake
intensity is the Modified Mercalli intensity scale which indicate the description of
damage and felt according to range of scale. (See appendix A for Modified Mercalli
Intensity Scale detailed description).
2.5 SEISMIC IN MALAYSIA
Malaysia has experienced a lot of other natural disaster but not earthquakes.
Malaysia has been known to experience seismic tremors originating from
neighboring countries, such as Indonesia and the Philippines (C. Jeffrey, 2008).
There are a few active fault lines in East Malaysia, but overall, the West Peninsular
Malaysia is relatively free from direct seismic action. Though, Peninsular Malaysia
can still be affected by earthquake loading because of influences from subduction
zones of Sumatra, Indonesia.
Other perspective viewer say Indonesia has been well known as one of the
most seismically active countries in the world. This is due to its location which is
surrounded by three major active tectonic plates of the earth; Eurasian, Indo-
Australian, and Philippine plates (Irsyam, 2008).
According to Azlan and N.A. Yusoff, a seismic feature of the Indonesian
region that will be explicitly affected the Malaysian local seismic hazard evaluations
is the Barisan Fault which runs along the length of Sumatera in a direction parallel to
the Java trench. This fault is a seismically active right-lateral strike-slip fault, with
many shallow focus earthquakes (Azlan, N.AYusoff, 1999).
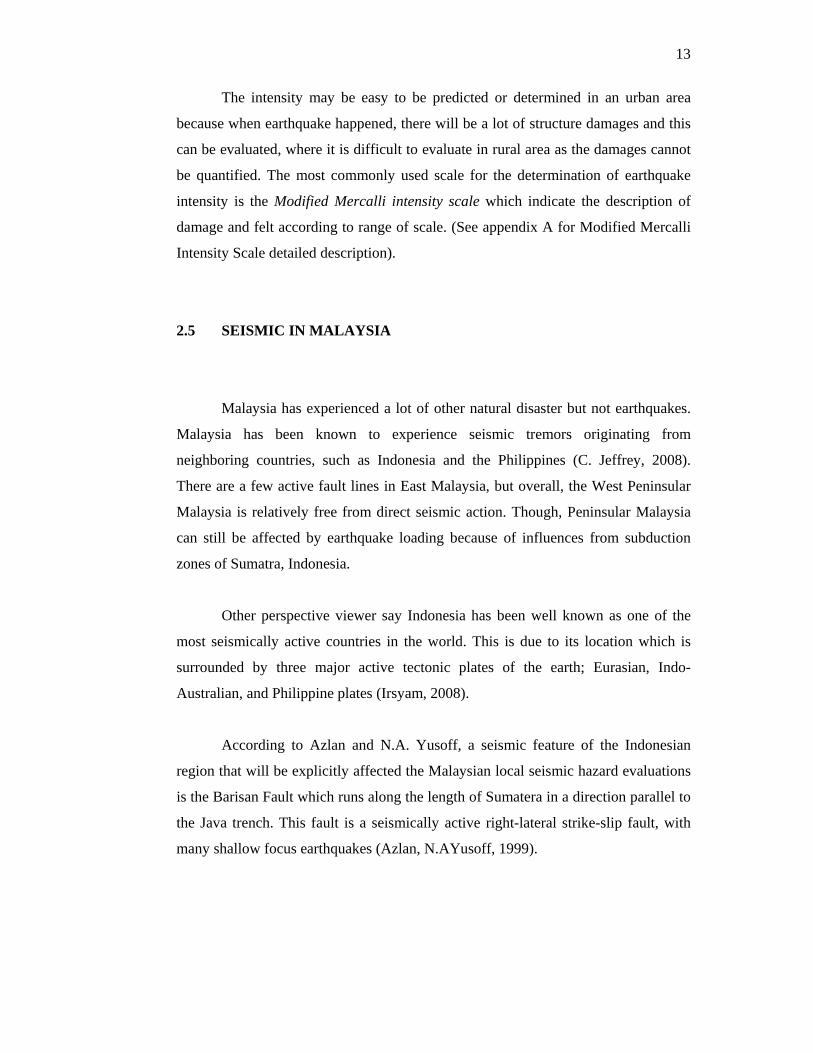
14
Figure 2.8: Peninsular Malaysia near the Sumatra Fault and surrounded by Sumatra
Trench and Java Trench (Source: Huchon and Le Pichon, 1984)
Therefore Malaysia is not totally saved according to researcher due to many
years research on seismic effect to Malaysian region especially earthquake from
Indonesia that can generate tsunami and ground movements to Peninsular Malaysia.
For East Malaysia, (Sabah Borneo, and Sarawak) they have minor and major fault
line especially in north Sabah and indicated as moderate active fault have been
recorded. So, there is possibility of earthquake disaster in entire Malaysia.
The record of earthquake using instruments such as seismograph in Malaysia
started in 1970 which was a contribution from UNESCO on “the seismological
Programmed for Southeast Asia “. Several seismology stations have been produced
using seismograph system from this program and after that total of seven seismology
station have been indicated around Malaysia (K.K. Lee, 1991).
15
From this program Malaysia researcher started to produce their own
observation intensity map. The study was based on the Modified Marcelli Intensity
(MMI) to get the peak ground acceleration magnitude for ease references for
Malaysian design structure. (See appendix B and C for Maximum Intensity Map for
Peninsular Malaysia and East Malaysia).
2.6 INTRODUCTION TO WATER TANK TOWER
2.6.1 WATER RESERVOIR
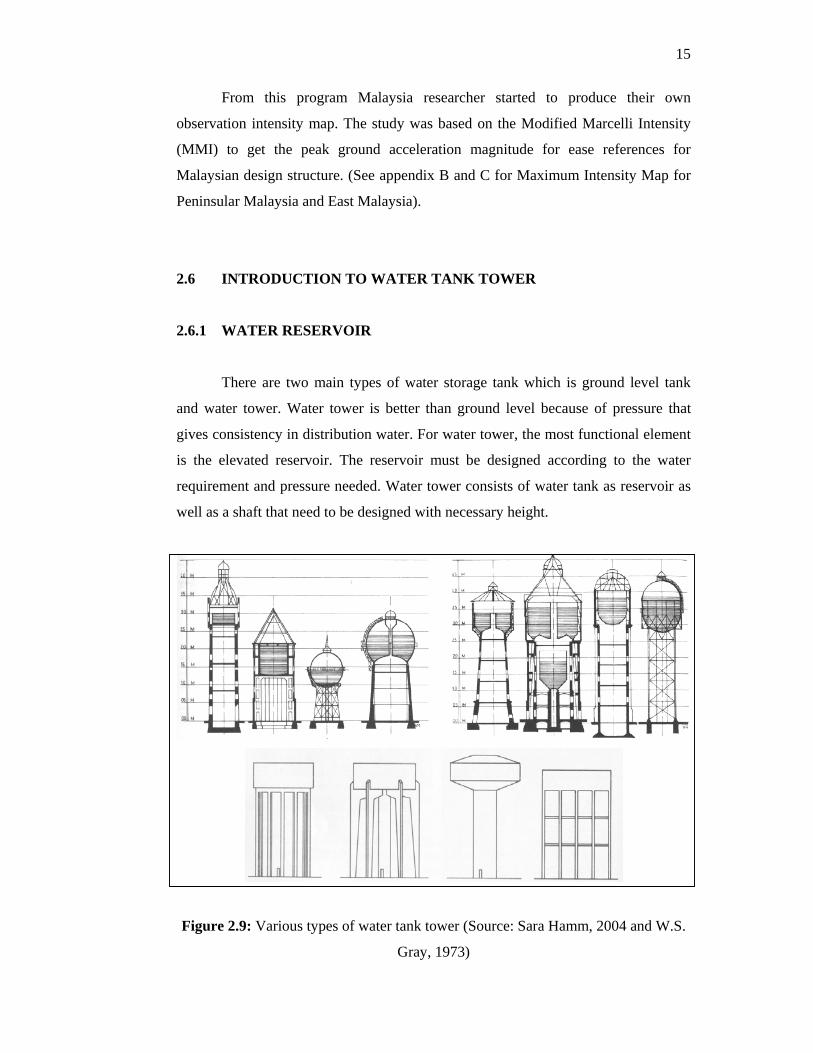
There are two main types of water storage tank which is ground level tank
and water tower. Water tower is better than ground level because of pressure that
gives consistency in distribution water. For water tower, the most functional element
is the elevated reservoir. The reservoir must be designed according to the water
requirement and pressure needed. Water tower consists of water tank as reservoir as
well as a shaft that need to be designed with necessary height.
Figure 2.9: Various types of water tank tower (Source: Sara Hamm, 2004 and W.S.
Gray, 1973)
16
2.6.2 DEFINITION OF WATER TANK TOWER
Generally, water tank tower is one of the water storage facilities to distribute
clean water to certain area efficiently. Water tank tower consist of elevated tank that
is supported by structure whether space structure (trusses) or solid structure.
Water tank tower is designed according to the amount of water required in the
area. At certain places water tower was designed for aesthetic purposes and as a
landmark for certain places. Some water tanks are converted to apartment or
exclusive penthouse as living places (Sara Hamm, 2004).
W.S.Gray elaborate elevated water tanks generally are erected for one of
several purposes, such as to act as service reservoirs or balancing tanks in water-
supply systems, as sources of supply for sprinklers or fire-fighting, or to replenish the
tanks of locomotives (W.S.Gray, 1973). W.S.Gray mentioned generally about
purpose of water tower is for water supply and other purposes especially for services
usage.
Others definition expressed water tower as a storage facility consist of
reservoirs, tower, and tanks providing storage for treated water before it is
distributed. The water distribution system should have storage so that it is capable to
provide for basic domestic purposes, commercial and industrial uses, and to
accommodate flow necessary for emergencies.
The main purpose of design water tank tower is to supply water needed to the
area sufficiently. Water tower should have enough height to pressurise water where if
not sufficient several problems may occur such as; water not reaching users with
sufficient flow or pressure too low. Another further purpose of a water tower is to
supply sufficient water during peak usage and able to supply water when or during
power outages (water rely only on gravity to be pressurised).
17
2.6.3 OPERATION OF WATER TANK TOWER
The height of the tower provides the hydrostatic pressure for the water supply
system, and it is supplemented with a pump to pump-up water to the elevated tower.
The volume of the reservoir and diameter of the piping provide and sustain flow rate.
Using pump to distribute water is costly. Therefore to reduce cost, pump is active
only to pump water up to elevated reservoir during low demand and pressurized
water during peak period. The water tower reduces the need for electrical
consumption of cycling pumps further reduces cost especially on pump operation.
2.6.4 TYPES OF REINFORCED CONCRETE WATER TOWER
Although all reinforced concrete water towers may be basically the same in
structural design, they can be in many forms depending on the purpose and
environment. The size of tank depends on the quantity of water to be stored, the
height of the tower depends on the pressure-head required, and the shape may
depend on economics.
There are many types of shape especially in tank design such as cylindrical,
polygonal or rectangular, or have more than one compartment. There are several
types of reinforced concrete water tower such as:
• Cylindrical Tank on Braced Columns
A typical water tower comprising a cylindrical tank supported on six
braced column. The legs are straight or inclined slightly inwards
thereby adding to stability and probably to the appearance to the
structure.
18
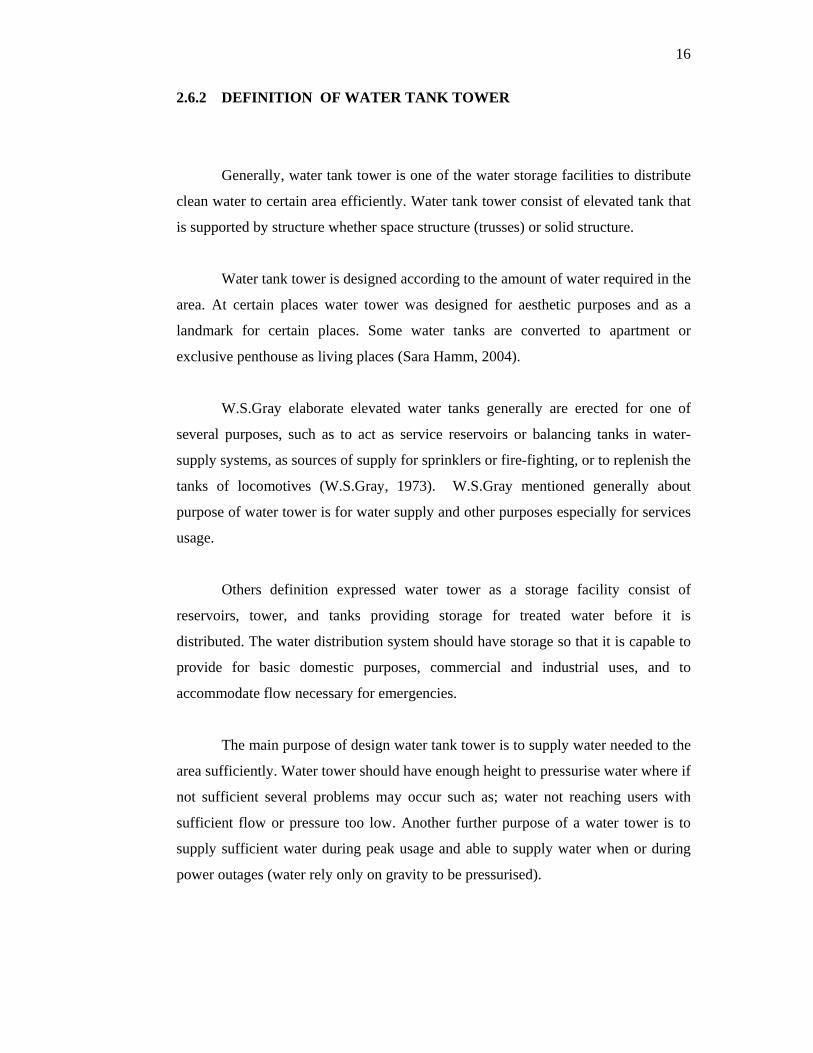
(a) (b)
Figure 2.10: (a) Typical inclined legs of water tower, (b) Haifa, Israel legs straight
water tower (Source: W.S. Gray, 1973)
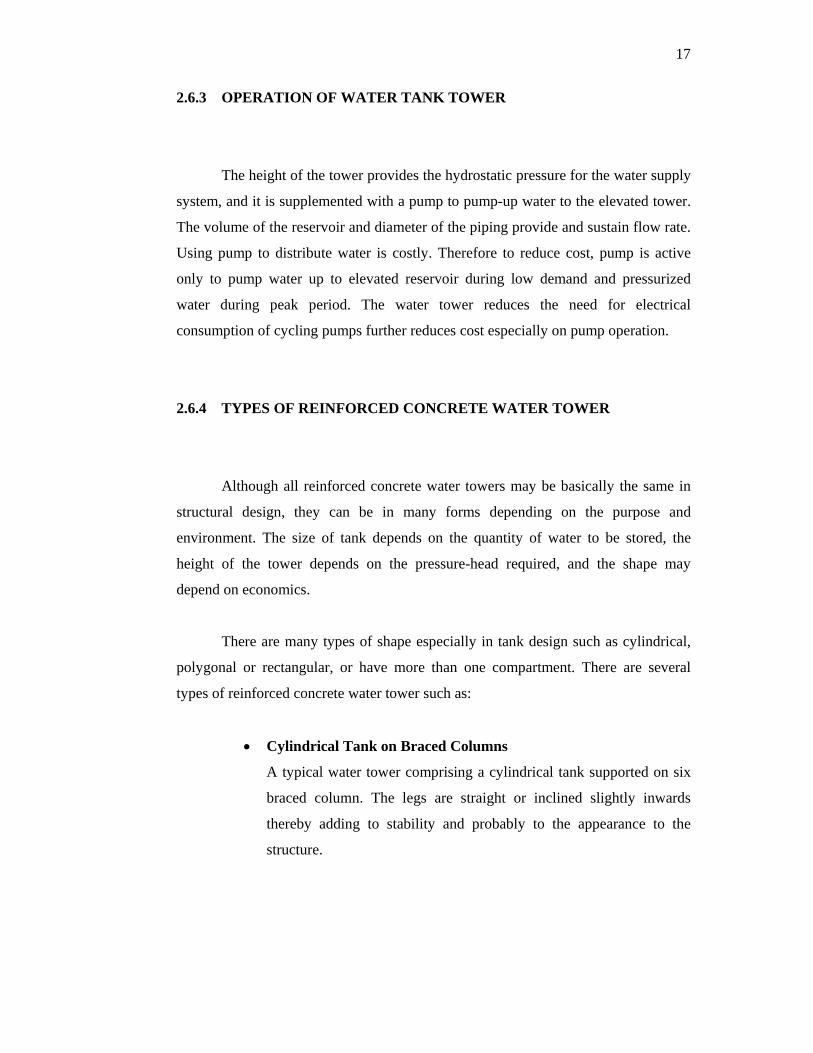
• Cylindrical Tanks on Shafts
A typical water tower in which a cylindrical tank is supported on a
shaft structure. Access stairs, pipes and pumps are accommodated in
the shaft.
Figure 2.11: Typical water tower supported by shafts - Sheffield water tower
(Source: W.S. Gray, 1973)
19
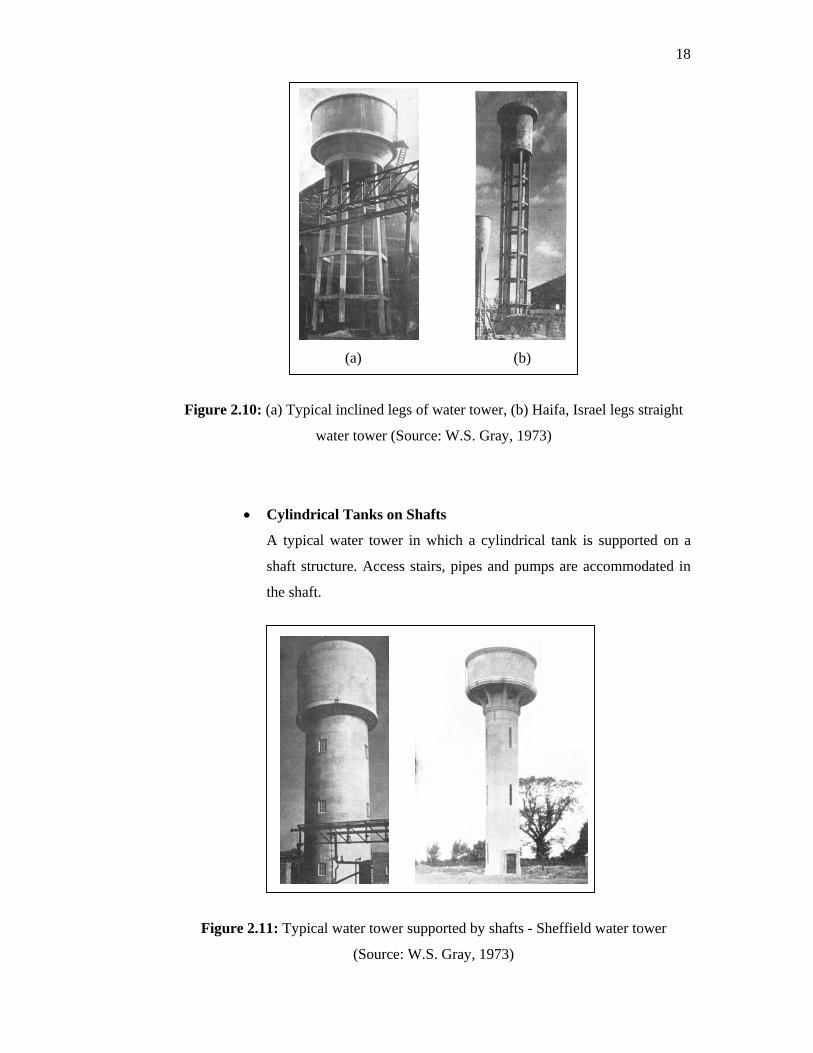
• Tanks on Shafts and Separate Columns
A tank of large diameter supported centrally on a shaft may require
additional columns to aid in carrying the weight of the tanks and its
contents.
Figure 2.12: A large diameter tanks supported by both columns and shaft separately
– Thundersley and Mucking water tower (Source: W.S. Gray, 1973)
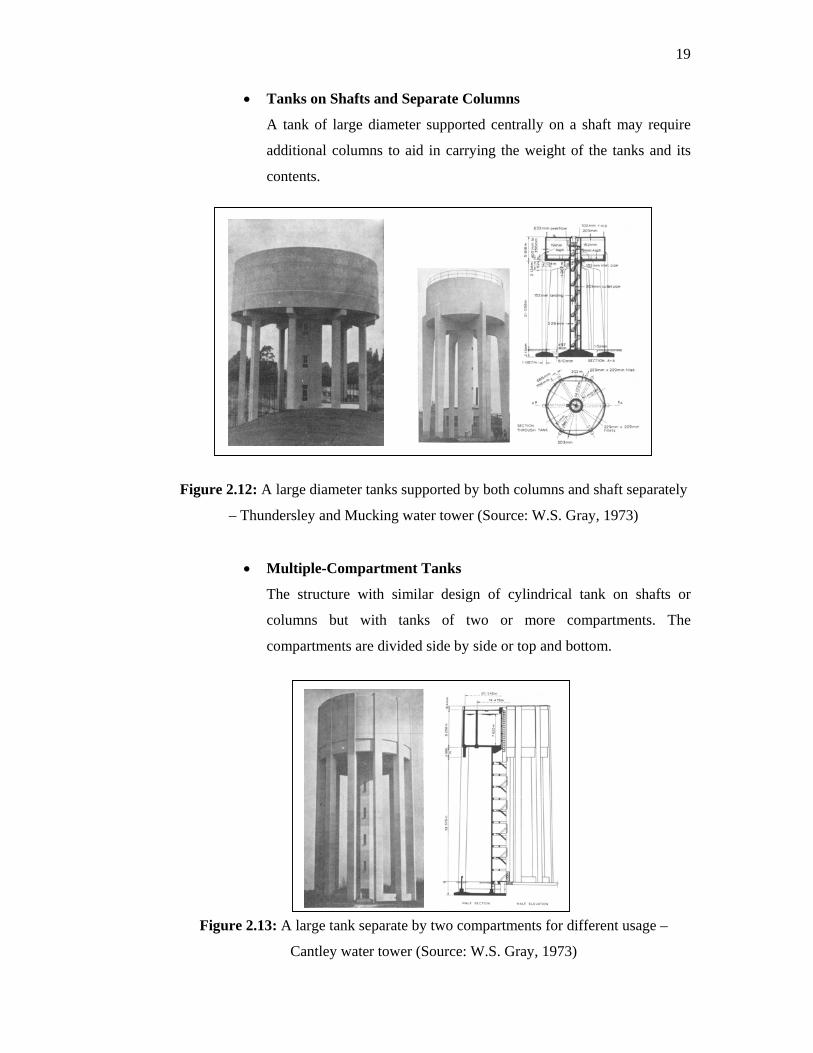
• Multiple-Compartment Tanks
The structure with similar design of cylindrical tank on shafts or
columns but with tanks of two or more compartments. The
compartments are divided side by side or top and bottom.
Figure 2.13: A large tank separate by two compartments for different usage –
Cantley water tower (Source: W.S. Gray, 1973)
20
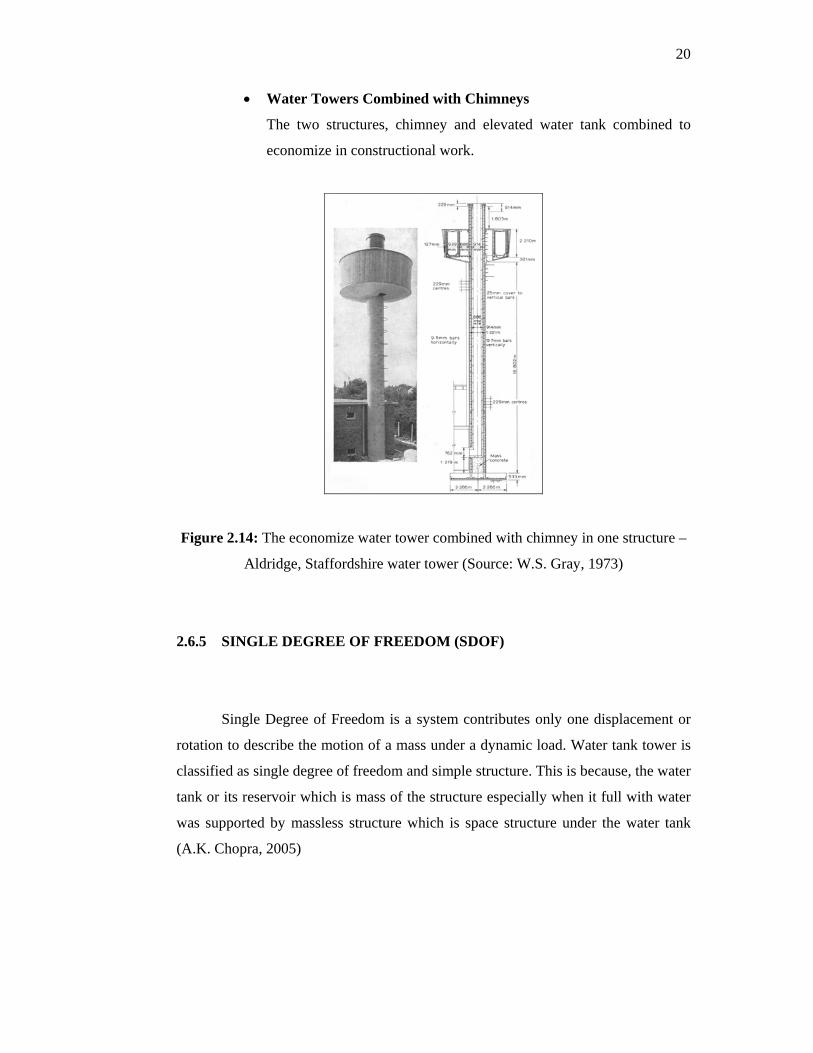
• Water Towers Combined with Chimneys
The two structures, chimney and elevated water tank combined to
economize in constructional work.
Figure 2.14: The economize water tower combined with chimney in one structure –
Aldridge, Staffordshire water tower (Source: W.S. Gray, 1973)
2.6.5 SINGLE DEGREE OF FREEDOM (SDOF)
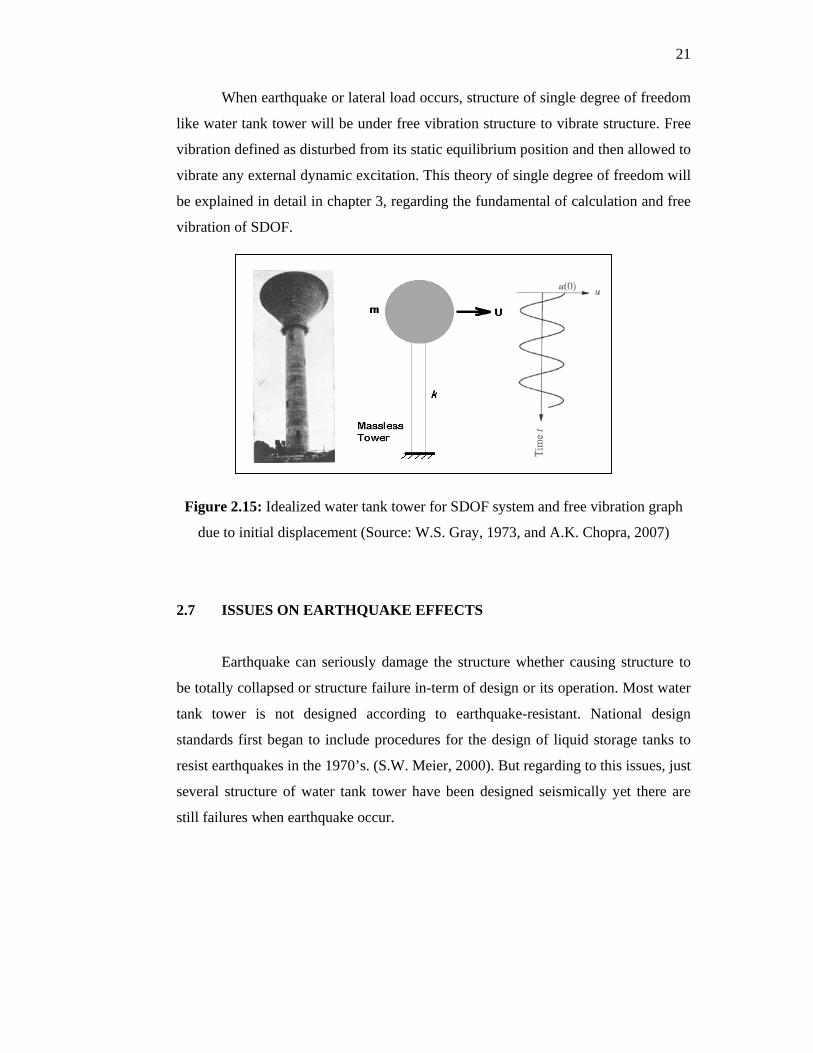
Single Degree of Freedom is a system contributes only one displacement or
rotation to describe the motion of a mass under a dynamic load. Water tank tower is
classified as single degree of freedom and simple structure. This is because, the water
tank or its reservoir which is mass of the structure especially when it full with water
was supported by massless structure which is space structure under the water tank
(A.K. Chopra, 2005)
21
When earthquake or lateral load occurs, structure of single degree of freedom
like water tank tower will be under free vibration structure to vibrate structure. Free
vibration defined as disturbed from its static equilibrium position and then allowed to
vibrate any external dynamic excitation. This theory of single degree of freedom will
be explained in detail in chapter 3, regarding the fundamental of calculation and free
vibration of SDOF.
Figure 2.15: Idealized water tank tower for SDOF system and free vibration graph
due to initial displacement (Source: W.S. Gray, 1973, and A.K. Chopra, 2007)
2.7 ISSUES ON EARTHQUAKE EFFECTS
Earthquake can seriously damage the structure whether causing structure to
be totally collapsed or structure failure in-term of design or its operation. Most water
tank tower is not designed according to earthquake-resistant. National design
standards first began to include procedures for the design of liquid storage tanks to
resist earthquakes in the 1970’s. (S.W. Meier, 2000). But regarding to this issues, just
several structure of water tank tower have been designed seismically yet there are
still failures when earthquake occur.
22
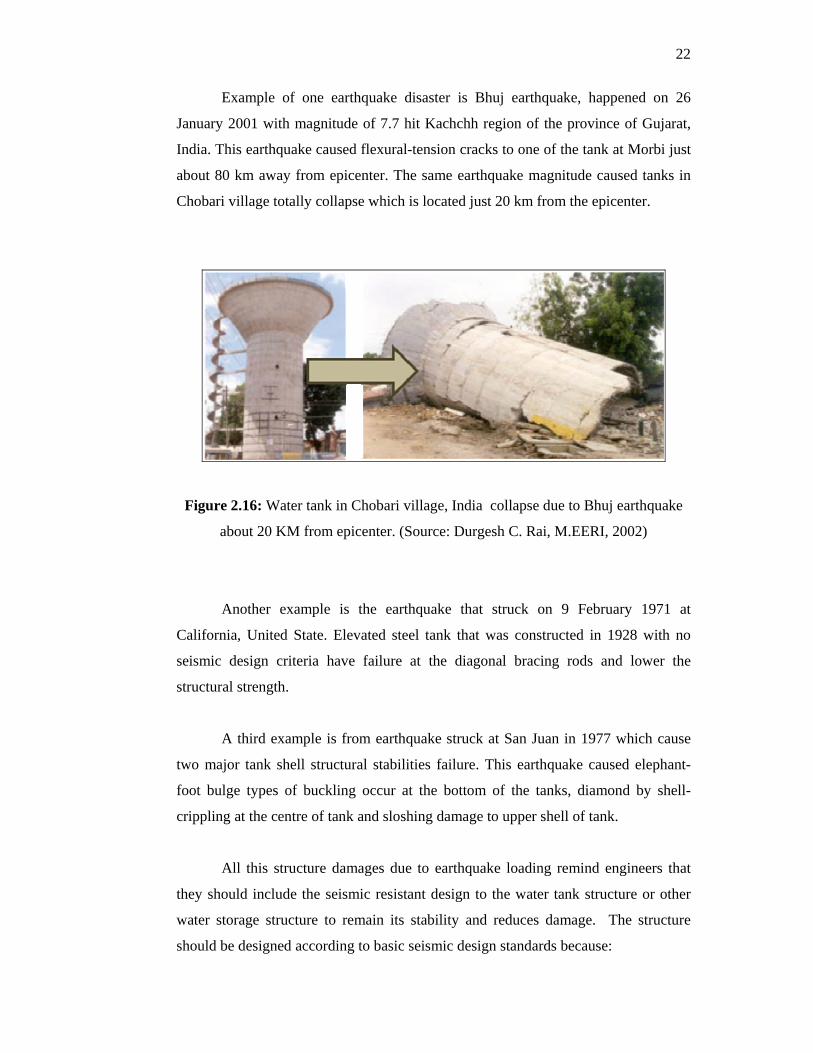
Example of one earthquake disaster is Bhuj earthquake, happened on 26
January 2001 with magnitude of 7.7 hit Kachchh region of the province of Gujarat,
India. This earthquake caused flexural-tension cracks to one of the tank at Morbi just
about 80 km away from epicenter. The same earthquake magnitude caused tanks in
Chobari village totally collapse which is located just 20 km from the epicenter.
Figure 2.16: Water tank in Chobari village, India collapse due to Bhuj earthquake
about 20 KM from epicenter. (Source: Durgesh C. Rai, M.EERI, 2002)
Another example is the earthquake that struck on 9 February 1971 at
California, United State. Elevated steel tank that was constructed in 1928 with no
seismic design criteria have failure at the diagonal bracing rods and lower the
structural strength.
A third example is from earthquake struck at San Juan in 1977 which cause
two major tank shell structural stabilities failure. This earthquake caused elephant-
foot bulge types of buckling occur at the bottom of the tanks, diamond by shell-
crippling at the centre of tank and sloshing damage to upper shell of tank.
All this structure damages due to earthquake loading remind engineers that
they should include the seismic resistant design to the water tank structure or other
water storage structure to remain its stability and reduces damage. The structure
should be designed according to basic seismic design standards because:
23
• Reduces the frequency and the severity of problems with storage tank
when exposed to ground motion
• Minimize the hazard to life
• Increase the expected performance of water storage strcuture with a
greater importance or hazard to the public.
• To improve the capability of water storage structure essential for the
welfare of the public after an earthquake.
24
CHAPTER 3
THEORITICAL BACKGROUND
3.1 INTRODUCTION
This chapter will be explaining about the structural dynamic that contributes
to water tank tower calculations. The system that will be considered for water tank
tower is Single Degree of Freedom (SDOF). Therefore, this chapter will show the
equations that are involved to calculate the SDOF problem and related calculations
such as free vibration, time history and response spectrum.
3.2 SIMPLE STRUCTURE
Water tank tower is one of the simple structure because it can be idealized as
a concentrated or lumped mass, m supported by the massless structure with the
stiffness, k in the lateral direction. Concentrated mass in water tank tower is the
elevated tank with full of water and supported by a relatively light tower that can be
assumed as massless. For the simple structure, assume that the lateral motion of this
structure is small in the sense that supporting structure deform within their linear
elastic limit.
25
The equation for the simple structure if there are without any external
excitation applied force or ground motion is
mü + ku = 0
Where;
ü = acceleration with respect to time
u = displacement, initial displacement u(0)
m = mass of the structure
k = stiffness of the structure
3.3 SINGLE-DEGREE-OF-FREEDOM SYSTEM
This system considered as simple structure which consist of a mass, m
concentrated at the top of the structure, a massless frame that provided stiffness to
the system, and a viscous damper that dissipates vibrational energy of the system.
Damping is the process by which vibration steadily diminishes in amplitude (A.K.
Chopra, 2007). This water tank tower may be considered as an idealization of a one-
story structure.
In one story structure, there are properties which concentrated as three
separate component; mass, stiffness, and damping. The number of independent
required to define the displaced position of all the masses relative to their original
position is called the number of degrees of freedom (DOFs) for dynamic analysis.
One story structure constrained to move only in the direction of the
excitation. In this case, if there is only one force contributing there will only have
one DOF and for dynamic analysis if it is idealized with mass concentrated at one
location, typically at the top of the structure where mass is located. This system is
called single-degree-of-freedom (SDOF) system.
26
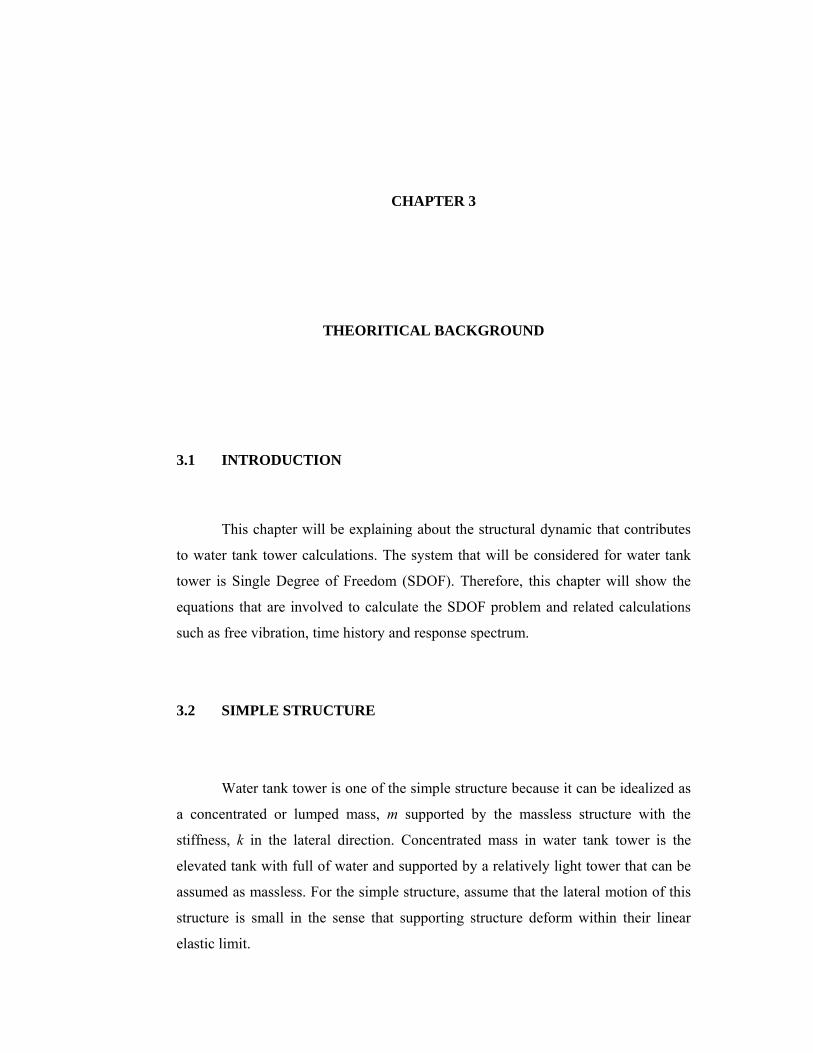
(a) (b)
Figure 3.1: Single Degree of Freedom system (a) Applied Force; (b) earthquake
induced ground motion (Source: A.K. Chopra, 2007)
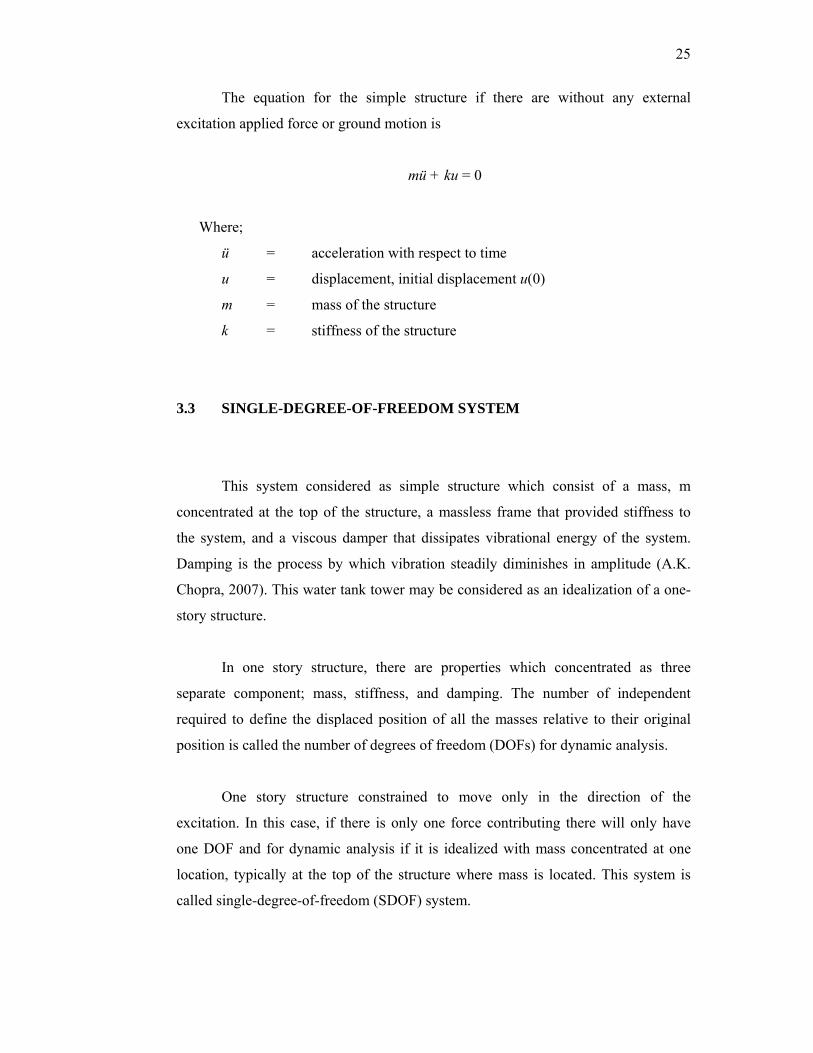
3.4 EQUATION OF MOTION: EXTERNAL FORCES
The structure of one story frame or simple structure subjected to an externally
applied dynamic force p(t) in the direction of the DOF displacement cause of motion.
There are two method that can be derived from this dynamic which are, Newton
second law of motion and dynamic equilibrium.
3.4.1 NEWTON’S SECOND LAW OF MOTION
The force acting on the mass at the one-story frame structure at some instant
of time include the external force, p(t) , the elastic or inelastic resisting force, fS, and
the damping resisting force, fD. In the equation, the external force acting at the
opposite direction with the structure component; mass, stiffness and damping
because of the component are the internal forces that resist the deformation and
velocity that cause by external excitation.
Figure 3.2: Idealize simple structure subjected to applied force
(Source: A.K. Chopra, 2007)
27
The Newton’s second law of motion gives:
mü + fD + fS = p(t)
Where;
p(t) = External force varies with time
fD = external force of the damper equal and opposite with
the internal force in the damper
= ců
c = Viscous damping coefficient
ů = velocity varies with time
fS = External force equal and opposite to the internal force
resisting the displacement, u
= ku
k = lateral stiffness of the system
u = displacement varies with time
From the derivation, equation become
mü + ců + ku = p(t)
This is the general equation of motion governing the deformation or
displacement u(t) if the idealized simple structure, assumed to be linearly elastic,
subjected to an external dynamic force p(t).
3.5 EQUATION OF MOTION: EARTHQUAKE EXCITATION
In earthquake-prone regions, the principal problem of structural dynamics
that concern structural engineers is the behavior of structures subjected to
earthquake-induced motion of the base of the structure. At each instant of time these
displacements are related by
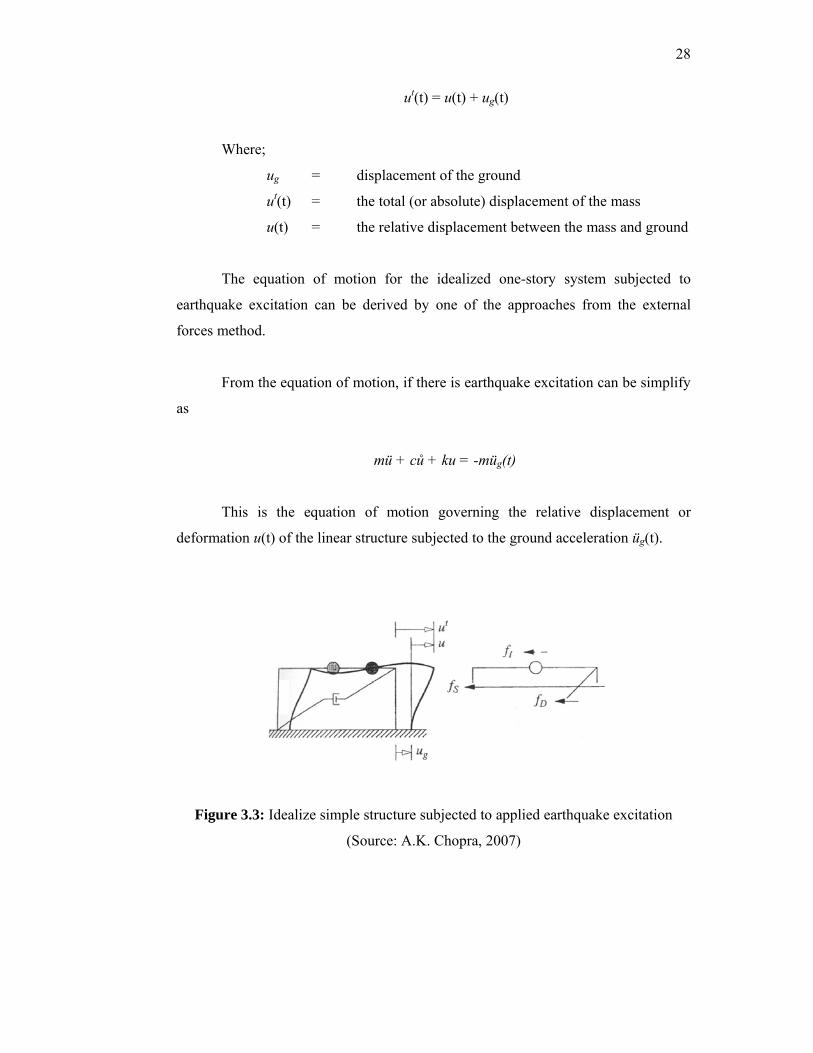
28
ut(t) = u(t) + ug(t)
Where;
ug = displacement of the ground
ut(t) = the total (or absolute) displacement of the mass
u(t) = the relative displacement between the mass and ground
The equation of motion for the idealized one-story system subjected to
earthquake excitation can be derived by one of the approaches from the external
forces method.
From the equation of motion, if there is earthquake excitation can be simplify
as
mü + ců + ku = -müg(t)
This is the equation of motion governing the relative displacement or
deformation u(t) of the linear structure subjected to the ground acceleration üg(t).
Figure 3.3: Idealize simple structure subjected to applied earthquake excitation
(Source: A.K. Chopra, 2007)
29
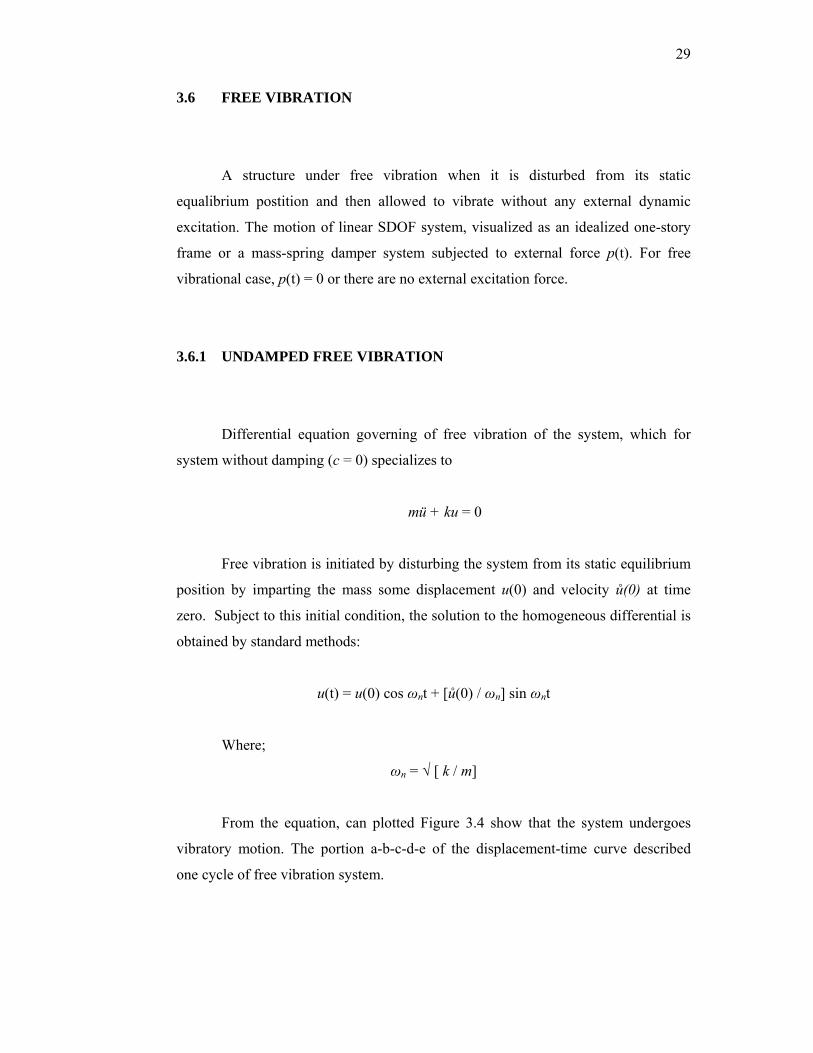
3.6 FREE VIBRATION
A structure under free vibration when it is disturbed from its static
equalibrium postition and then allowed to vibrate without any external dynamic
excitation. The motion of linear SDOF system, visualized as an idealized one-story
frame or a mass-spring damper system subjected to external force p(t). For free
vibrational case, p(t) = 0 or there are no external excitation force.
3.6.1 UNDAMPED FREE VIBRATION
Differential equation governing of free vibration of the system, which for
system without damping (c = 0) specializes to
mü + ku = 0
Free vibration is initiated by disturbing the system from its static equilibrium
position by imparting the mass some displacement u(0) and velocity ů(0) at time
zero. Subject to this initial condition, the solution to the homogeneous differential is
obtained by standard methods:
u(t) = u(0) cos ωnt + [ů(0) / ωn] sin ωnt
Where;
ωn = √ [ k / m]
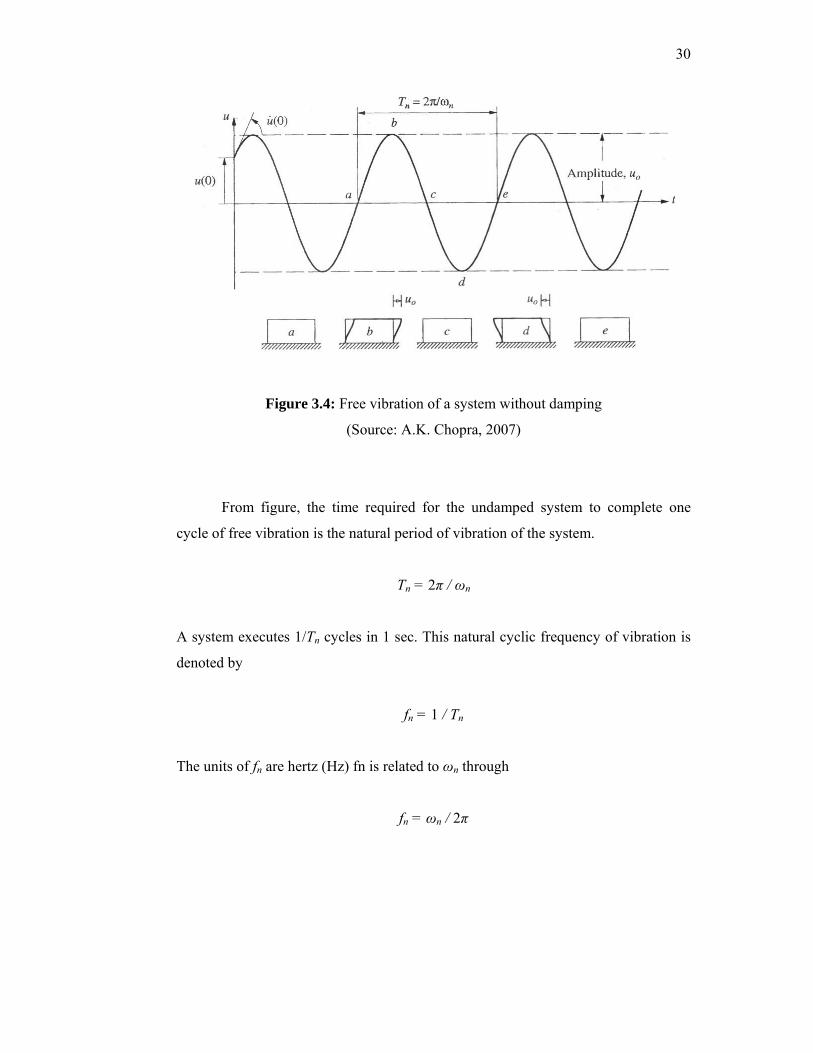
From the equation, can plotted Figure 3.4 show that the system undergoes
vibratory motion. The portion a-b-c-d-e of the displacement-time curve described
one cycle of free vibration system.
30
Figure 3.4: Free vibration of a system without damping
(Source: A.K. Chopra, 2007)
From figure, the time required for the undamped system to complete one
cycle of free vibration is the natural period of vibration of the system.
Tn = 2π / ωn
A system executes 1/Tn cycles in 1 sec. This natural cyclic frequency of vibration is
denoted by
fn = 1 / Tn
The units of fn are hertz (Hz) fn is related to ωn through
fn = ωn / 2π
31
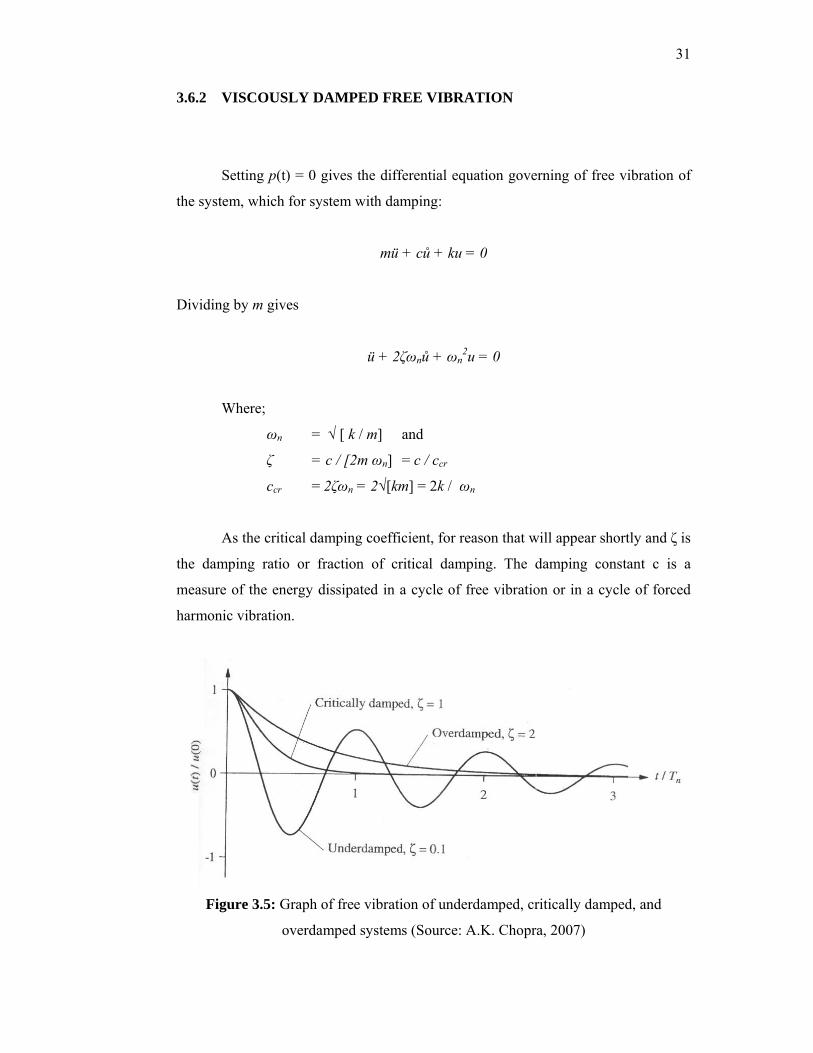
3.6.2 VISCOUSLY DAMPED FREE VIBRATION
Setting p(t) = 0 gives the differential equation governing of free vibration of
the system, which for system with damping:
mü + ců + ku = 0
Dividing by m gives
ü + 2ζωnů + ωn2u = 0
Where;
ωn = √ [ k / m] and
ζ = c / [2m ωn] = c / ccr
ccr = 2ζωn = 2√[km] = 2k / ωn
As the critical damping coefficient, for reason that will appear shortly and ζ is
the damping ratio or fraction of critical damping. The damping constant c is a
measure of the energy dissipated in a cycle of free vibration or in a cycle of forced
harmonic vibration.
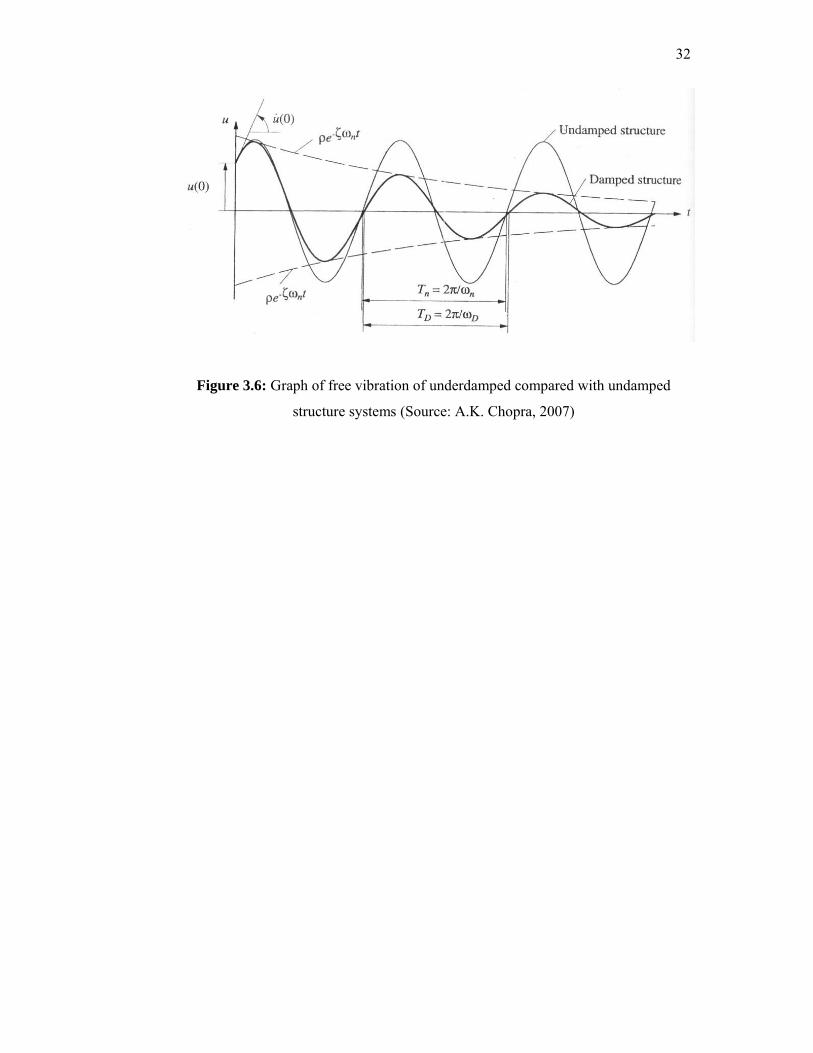
Figure 3.5: Graph of free vibration of underdamped, critically damped, and
overdamped systems (Source: A.K. Chopra, 2007)
32
Figure 3.6: Graph of free vibration of underdamped compared with undamped
structure systems (Source: A.K. Chopra, 2007)
33
CHAPTER 4
METHODOLOGY
4.1 INTRODUCTION
This chapter will be explaining about the method of the study research.
Method that will be used in this study is analyzing structure of water tank tower
using software name SAP2000. This software have been chosen to do this analysis is
because of its speciality in terms of analyzing the seismic performance design. The
SAP2000 will not only show the result of the behaviour of the structure but also will
produce the time history and response spectrum for researchers to do their references.
This chapter also will show the detailing of the structure that need to be analyzed
which is cylindrical tank on shaft type of structure at UITM Shah Alam.
4.2 METHODOLOGY FLOW LAYOUT
Below is the flow layout step by step from getting the data to detailing
drawing from the consultant, modeling and analysing until get the result. Analysing
structure will be done both with and without seismic loading for comparison of the
structure behaviors.
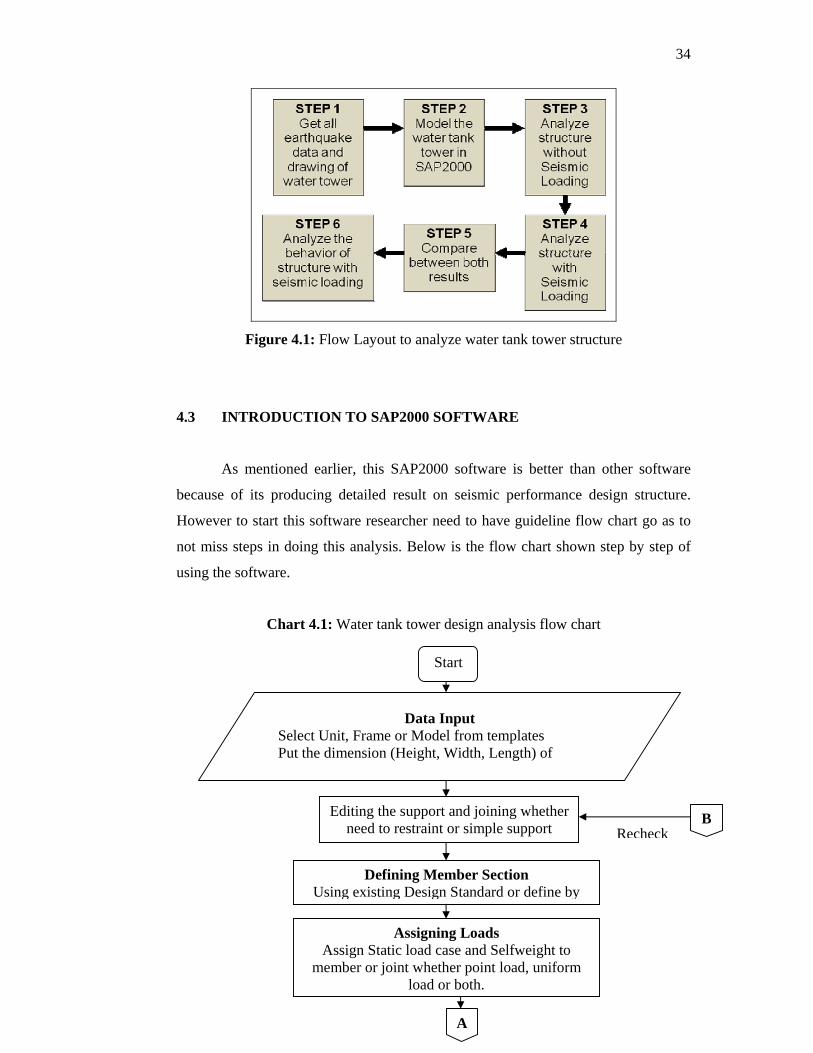
34
Figure 4.1: Flow Layout to analyze water tank tower structure
4.3 INTRODUCTION TO SAP2000 SOFTWARE
As mentioned earlier, this SAP2000 software is better than other software
because of its producing detailed result on seismic performance design structure.
However to start this software researcher need to have guideline flow chart go as to
not miss steps in doing this analysis. Below is the flow chart shown step by step of
using the software.
Chart 4.1: Water tank tower design analysis flow chart
Start
Data Input Select Unit, Frame or Model from templates Put the dimension (Height, Width, Length) of
Editing the support and joining whether need to restraint or simple support
Defining Member Section Using existing Design Standard or define by
Assigning Loads Assign Static load case and Selfweight to
member or joint whether point load, uniform load or both.
A
B Recheck
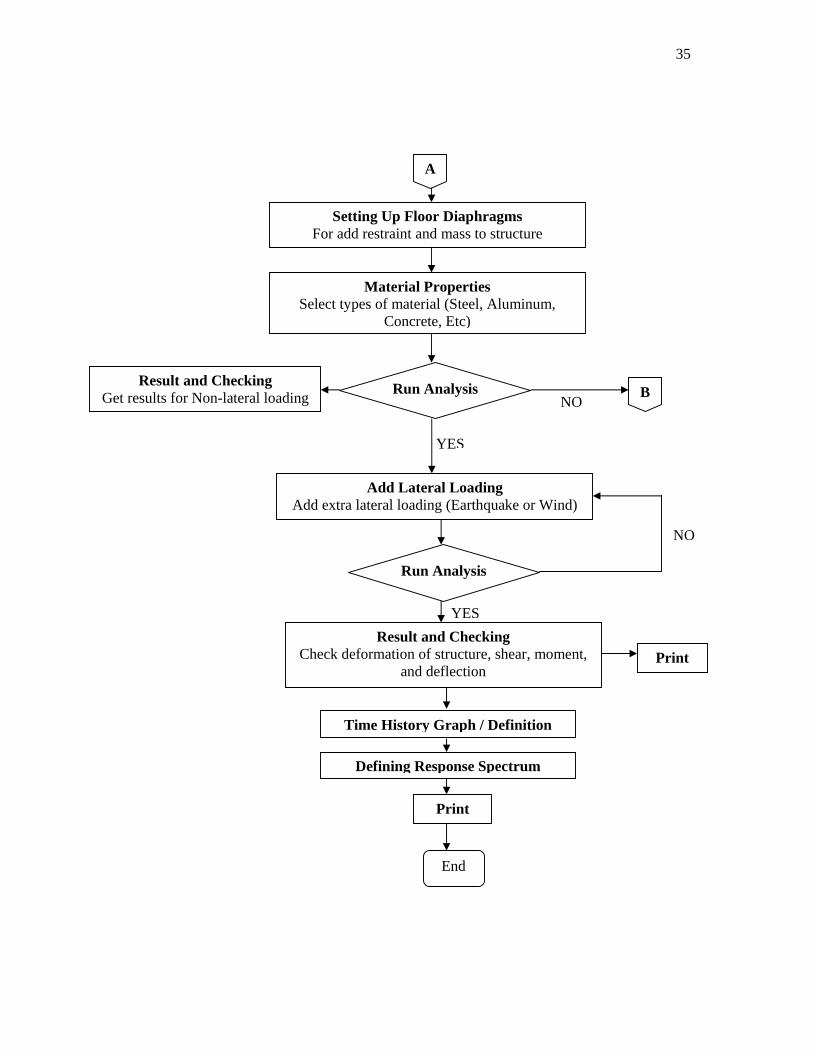
35
A
Setting Up Floor Diaphragms For add restraint and mass to structure
Material Properties Select types of material (Steel, Aluminum,
Concrete, Etc)
Run Analysis B
Add Lateral Loading Add extra lateral loading (Earthquake or Wind)
Result and Checking Get results for Non-lateral loading
YES
NO
Run Analysis
Result and Checking Check deformation of structure, shear, moment,
and deflection Print
Time History Graph / Definition
Defining Response Spectrum
End
YES
NO
36
From the result, the performances of the structure behavior between both
loadings will be obtained. To verify the analytical result, manual calculation is
needed for best reference and comparison.
4.4 DETAILING LAYOUT
Type of water tower is typical water tank supported by shaft. The height of
the structure is 32.45m which is about 10 storey building. With this height, this water
tower structure should include seismic in the design analysis. The diameter of
elevated for this water tower is 15.9m with capacity of 100,000 gallant of water. (See
appendix D and E for detailing drawing)
37
CHAPTER 5
ANALYSIS AND RESULT
5.1 INTRODUCTION
This chapter will explain details about the analysis and result for water tank
tower due to earthquake loading. The results are from finite element modeling
analyze using SAP2000 software and compared with theoretical calculation using
Microsoft Excel as medium to solve the mathematical problem. The parameters that
involved in comparison to see the behavior of water tower are the displacement,
rotation, and the stresses.
Water tank tower is one of the single degree of freedom systems, which have
several methods suitable to calculate the displacement, u of structure such as
Interpolation of Excitation Method, Central Difference Method, and Newmark’s
Method. For this study, central difference method have been chosen and used as
compared method. This method based on a finite difference approximation of the
time derivation of displacement and is the simplest method.
From SAP2000 analysis result, there will be two cases, one is free vibration
analysis and case two is time history and response spectrum analysis.
38
5.2 ANALYSIS USING SOFTWARE: SAP2000
As mentioned earlier, this software analysis is divided into two cases
according to the analysis method on the water tower structure. The result analysis
from software divided into two cases according to the loading excitation on the water
tower structure. Case 1 is the free vibration analysis which is consist only
gravitational load from self-weight (dead load) and additional of water pressure (load
from water). Analysis in Case 2 result includes the external excitation which is load
from earthquake. Both cases are analyzed using linear analysis and structure is
undamped which means no damped component to stiffen the structure from
earthquake.
For this study purposes, data of Rapid KL is used for time history analysis
and response spectrum analysis which produced by SEER, UTM group research.
Using software analysis, result for deflection, rotation, moment and shear will
produce in 3-dimensional results which are in direction of x-axis, y-axis and z-axis.
Table below show the loading involved in each analysis cases.
Table 5.1: Analysis cases according to the loading excitation
CASE ANALYSIS LOADING DESCRIPTION
1 Free Vibration Selfweight of structure including the water pressure load.
Dead Load + Water Pressure
2 Harmonic Vibration
Selfweigth, water pressure include the earthquake loading.
Dead Load + Water Pressure + EQ Load (Time History and
Response Spectrum)
As the control for this software analysis, manual calculation has been done
for all analysis (Free Vibration analysis, Time History analysis and Response
Spectrum analysis). The model analysis was conducted using same parameter as
shown in table 5.2 below.
39
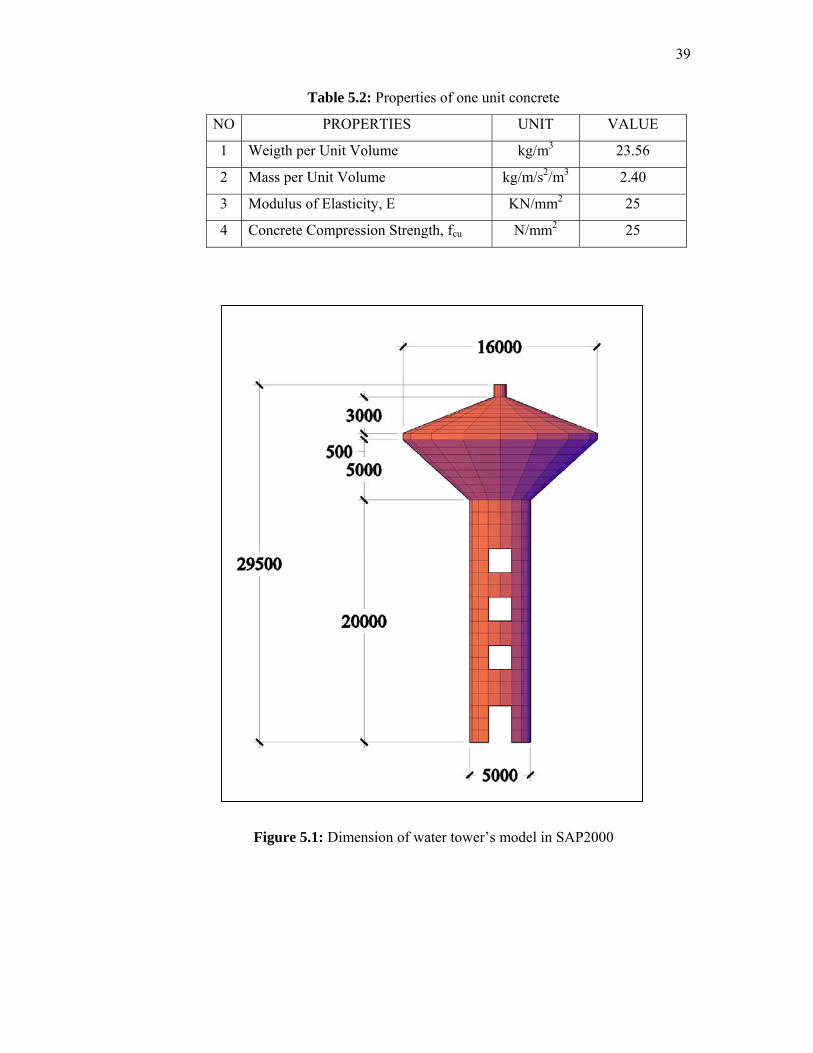
Table 5.2: Properties of one unit concrete
NO PROPERTIES UNIT VALUE
1 Weigth per Unit Volume kg/m3 23.56
2 Mass per Unit Volume kg/m/s2/m3 2.40
3 Modulus of Elasticity, E KN/mm2 25
4 Concrete Compression Strength, fcu N/mm2 25
Figure 5.1: Dimension of water tower’s model in SAP2000
40
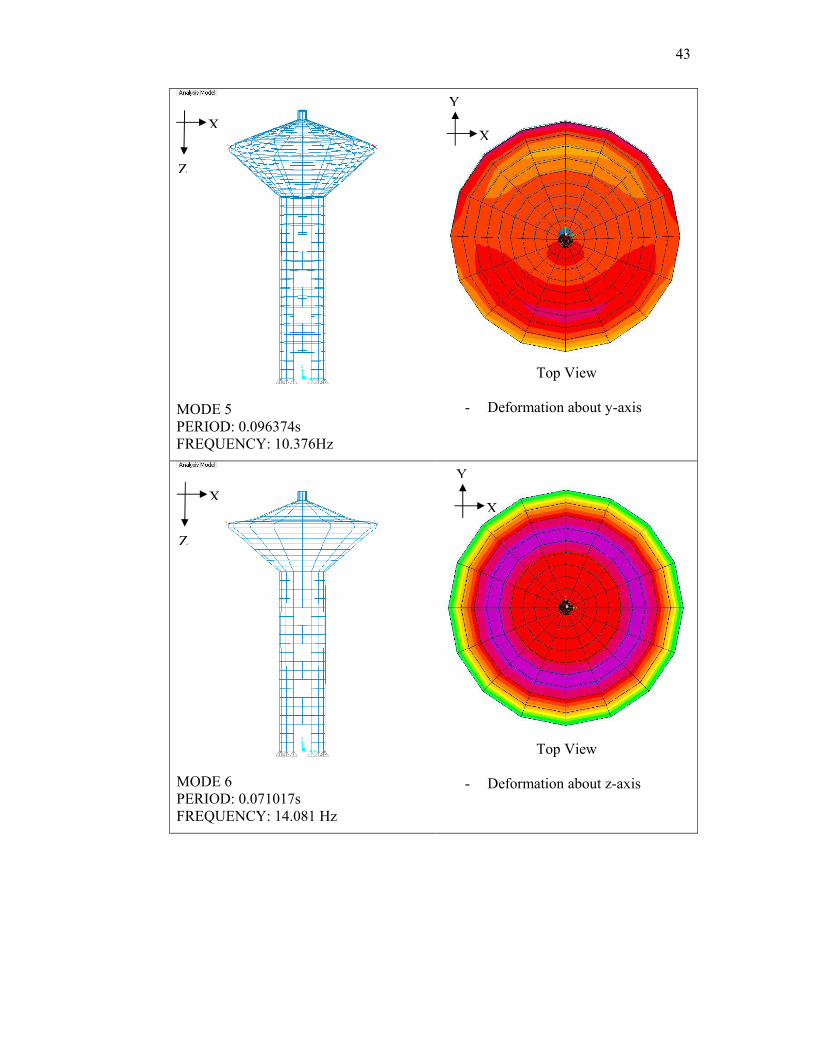
Table 5.3: Properties for a water tank tower
NO PROPERTIES UNIT VALUE
1 Volume of structure m3 744.189
2 Volume of water m3 454
3 Weigth total Volume kg 2240957
4 Mass per Volume kg/m/s2 228438
5 Moment of Inertia m4 456.08
6 Stiffness, k KN/m 17.103 x 10⁶
5.2.1 CASE 1: FREE VIBRATION ANALYSIS
This case, structure were analyse without any external dynamic excitation
(earthquake loading) or free vibration analysis. This analysis allowed seeing the
behavior of the structure in frequencies without any external loading. The structure
only cater loading from selfweight and water pressure due to gravity. Gravity load
evaluated as acceleration which is 9.81m/s2 and 1.0 factored from dead load of the
structure. The result from gravitational cause the p-delta effect and deformed of
structure as shown in Figure 5.2 below.
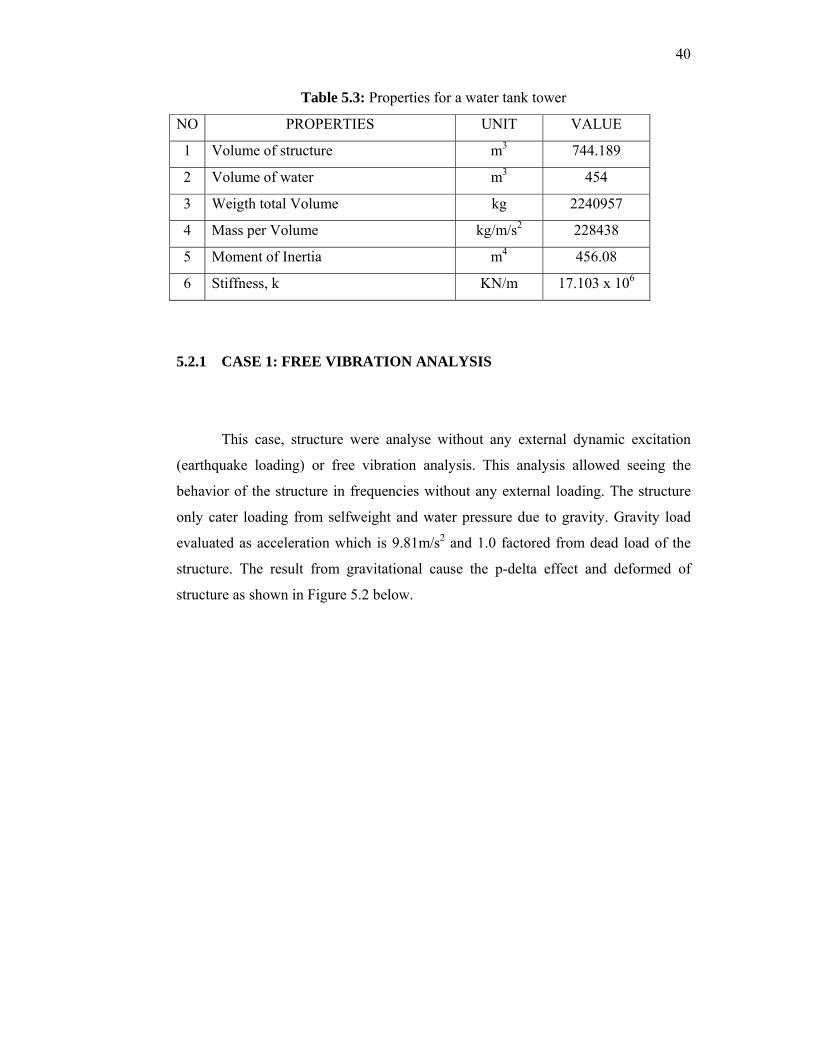
41
Table 5.4: Mode shape deformation
MODE 1 PERIOD: 0.554168s FREQUENCY: 1.8045 Hz
Top View
- Deformation about y-axis
MODE 2 PERIOD: 0.458023s FREQUENCY: 2.1833 Hz
Top View
- Deformation about x-axis
Y
X
Z
X
Y
X
Z
X
42
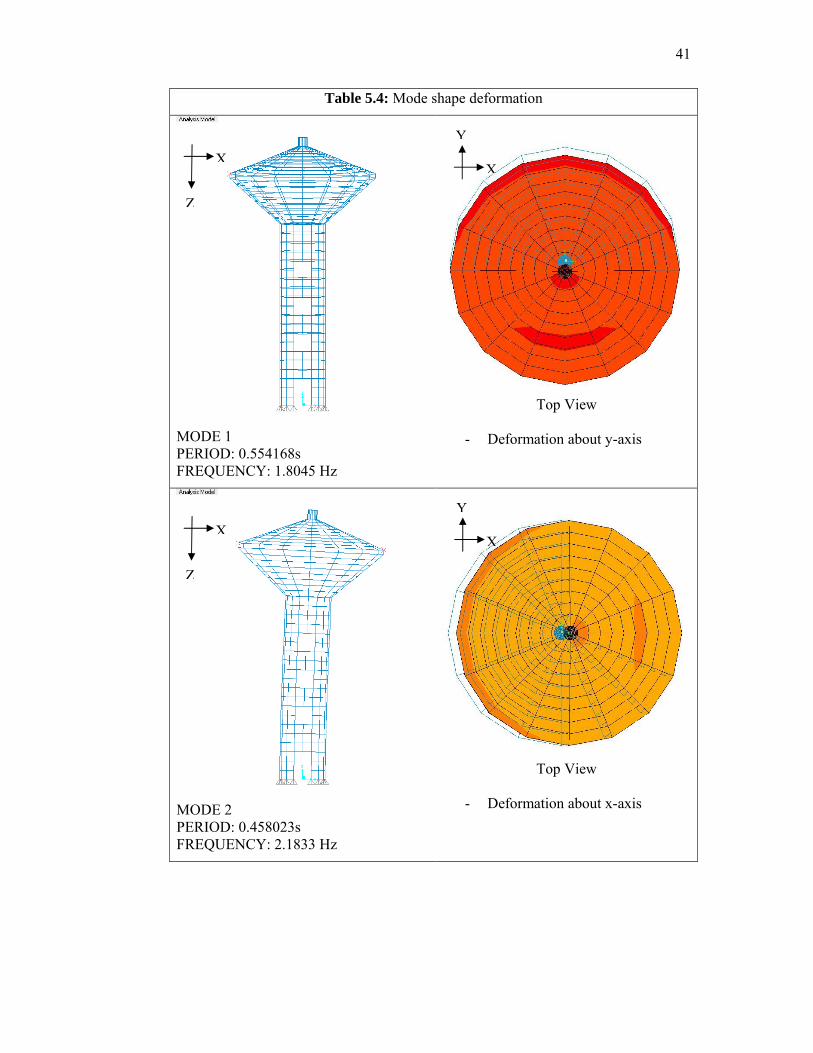
MODE 3 PERIOD: 0.237173s FREQUENCY: 4.2163 Hz
Top View
- Rotation about z-axis (counter-clockwise)
MODE 4 PERIOD: 0.101847s FREQUENCY: 9.8187 Hz
Top View
- Deformation about x-axis
Y
X
Z
X
Y
X
Z
X
43
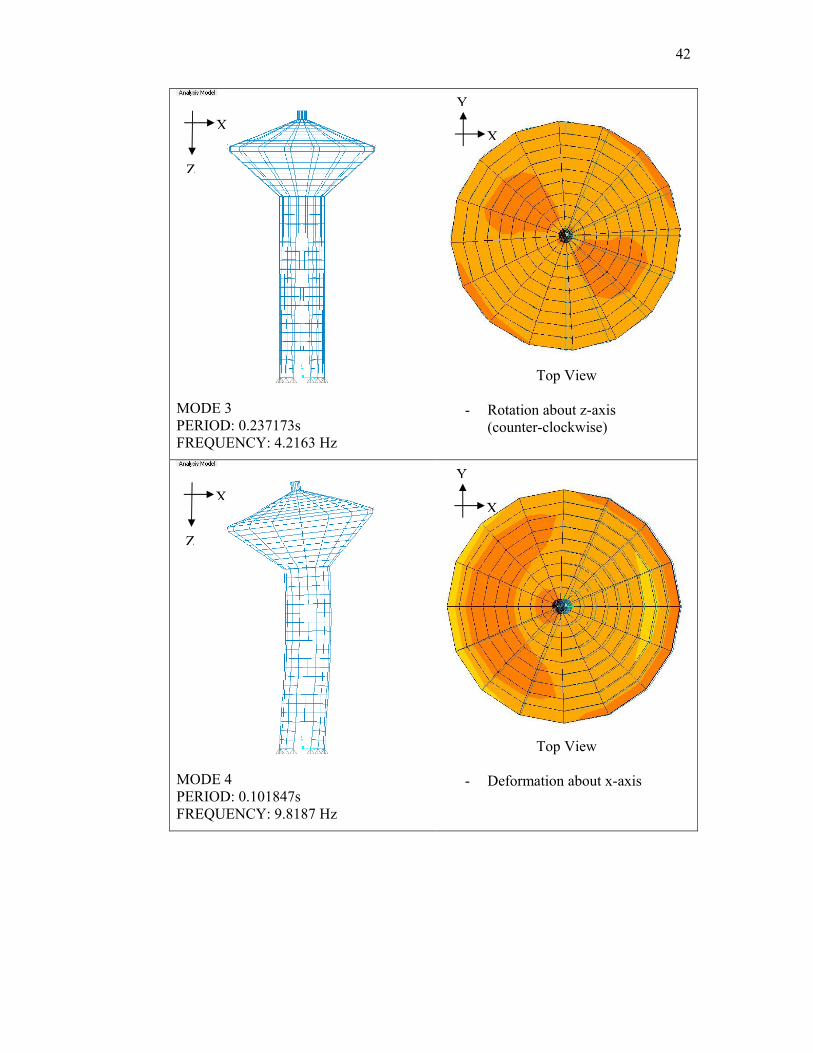
MODE 5 PERIOD: 0.096374s FREQUENCY: 10.376Hz
Top View
- Deformation about y-axis
MODE 6 PERIOD: 0.071017s FREQUENCY: 14.081 Hz
Top View
- Deformation about z-axis
Y
X
Z
X
Y
X
Z
X
44
Analysis above can be compared with calculation with an assumption of the
water tower structure as single degree of structure, natural circular frequency for
lumped mass, m and shaft as fixed at the ground base with stiffness, k is
Natural period of lumped mass is
Natural cyclic frequency of lumped mass is
In calculation, structures are assumed as two dimensional, and the value of
frequency that is acquired from the calculation is compared to the software analysis
and the result is closes to mode shape 1.
5.2.2 CASE 2: TIME HISTORY AND RESPONSE SPECTRUM ANALYSIS
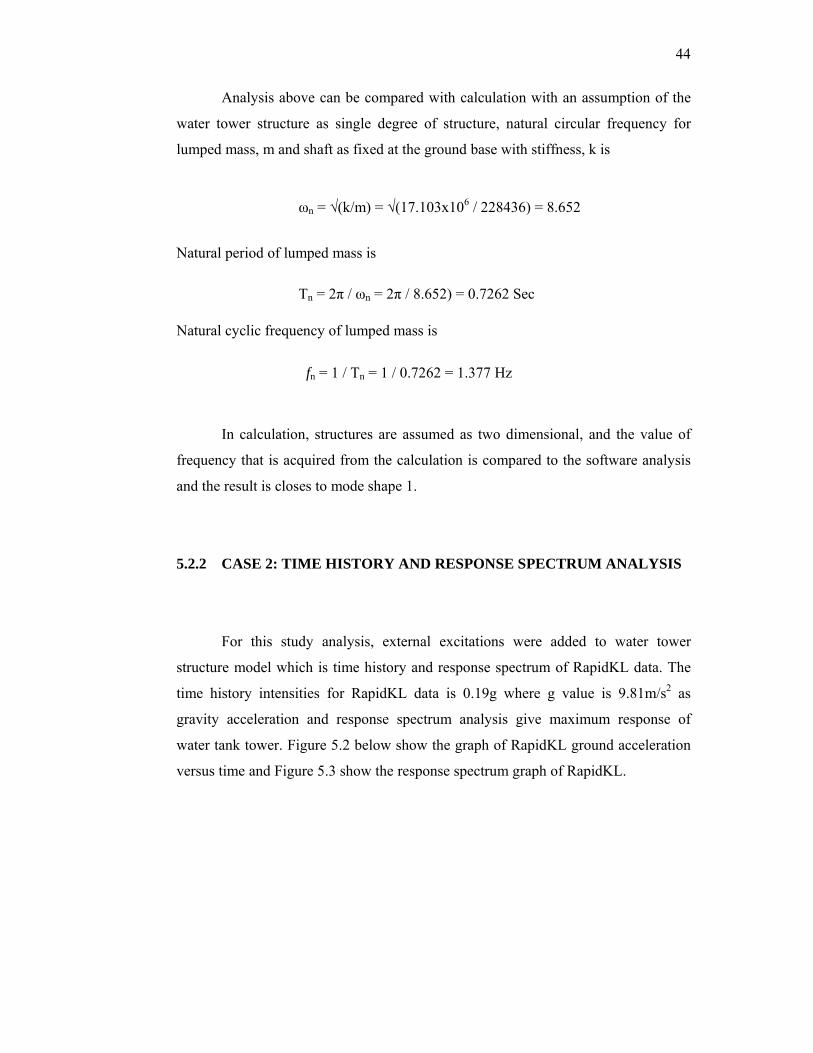
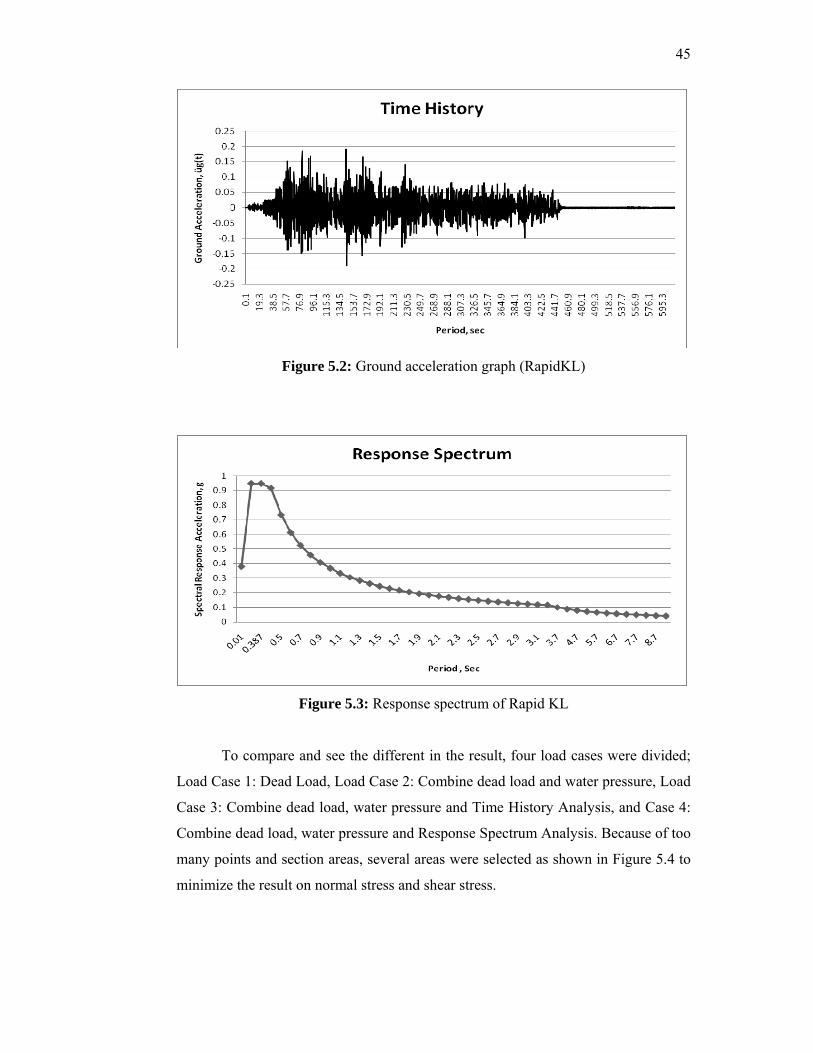
For this study analysis, external excitations were added to water tower
structure model which is time history and response spectrum of RapidKL data. The
time history intensities for RapidKL data is 0.19g where g value is 9.81m/s2 as
gravity acceleration and response spectrum analysis give maximum response of
water tank tower. Figure 5.2 below show the graph of RapidKL ground acceleration
versus time and Figure 5.3 show the response spectrum graph of RapidKL.
ωn = √(k/m) = √(17.103x10⁶ / 228436) = 8.652
Tn = 2π / ωn = 2π / 8.652) = 0.7262 Sec
fn = 1 / Tn = 1 / 0.7262 = 1.377 Hz
45
Figure 5.2: Ground acceleration graph (RapidKL)
Figure 5.3: Response spectrum of Rapid KL
To compare and see the different in the result, four load cases were divided;
Load Case 1: Dead Load, Load Case 2: Combine dead load and water pressure, Load
Case 3: Combine dead load, water pressure and Time History Analysis, and Case 4:
Combine dead load, water pressure and Response Spectrum Analysis. Because of too
many points and section areas, several areas were selected as shown in Figure 5.4 to
minimize the result on normal stress and shear stress.
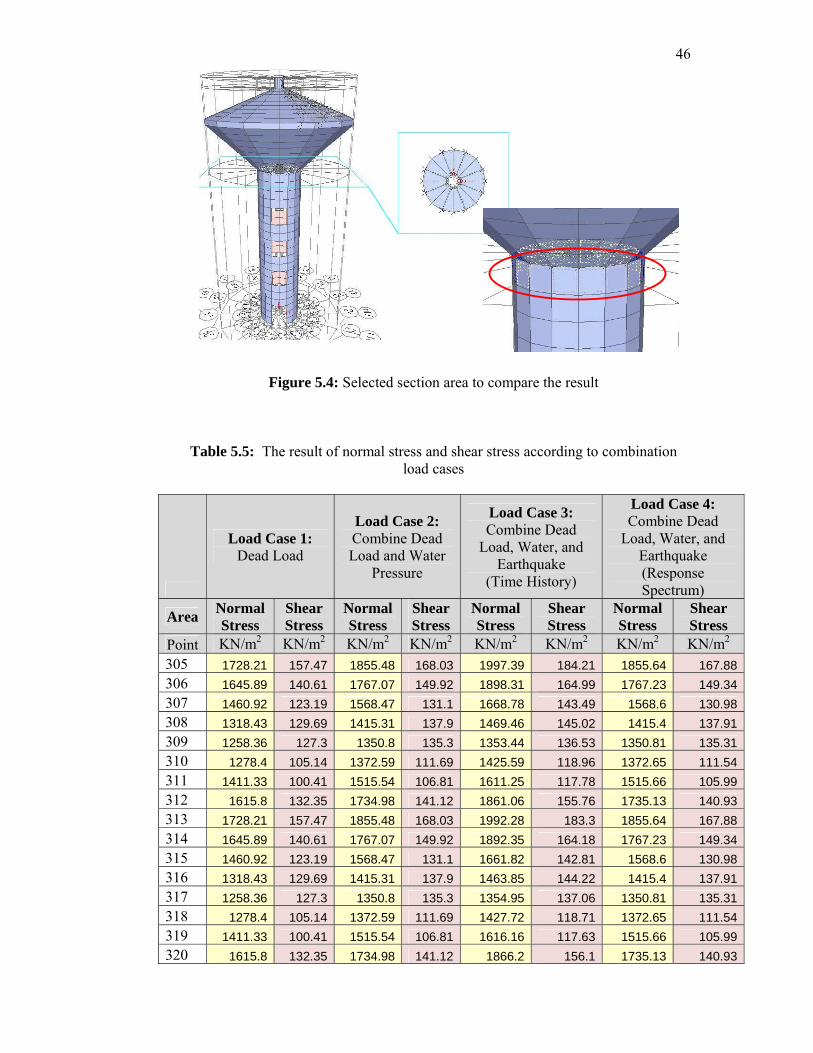
46
Figure 5.4: Selected section area to compare the result
Table 5.5: The result of normal stress and shear stress according to combination load cases
Load Case 1: Dead Load
Load Case 2: Combine Dead Load and Water
Pressure
Load Case 3: Combine Dead
Load, Water, and Earthquake
(Time History)
Load Case 4: Combine Dead
Load, Water, and Earthquake (Response Spectrum)
Area Normal Stress
Shear Stress
Normal Stress
Shear Stress
Normal Stress
Shear Stress
Normal Stress
Shear Stress
Point KN/m2 KN/m2 KN/m2 KN/m2 KN/m2 KN/m2 KN/m2 KN/m2 305 1728.21 157.47 1855.48 168.03 1997.39 184.21 1855.64 167.88306 1645.89 140.61 1767.07 149.92 1898.31 164.99 1767.23 149.34307 1460.92 123.19 1568.47 131.1 1668.78 143.49 1568.6 130.98308 1318.43 129.69 1415.31 137.9 1469.46 145.02 1415.4 137.91309 1258.36 127.3 1350.8 135.3 1353.44 136.53 1350.81 135.31310 1278.4 105.14 1372.59 111.69 1425.59 118.96 1372.65 111.54311 1411.33 100.41 1515.54 106.81 1611.25 117.78 1515.66 105.99312 1615.8 132.35 1734.98 141.12 1861.06 155.76 1735.13 140.93313 1728.21 157.47 1855.48 168.03 1992.28 183.3 1855.64 167.88314 1645.89 140.61 1767.07 149.92 1892.35 164.18 1767.23 149.34315 1460.92 123.19 1568.47 131.1 1661.82 142.81 1568.6 130.98316 1318.43 129.69 1415.31 137.9 1463.85 144.22 1415.4 137.91317 1258.36 127.3 1350.8 135.3 1354.95 137.06 1350.81 135.31318 1278.4 105.14 1372.59 111.69 1427.72 118.71 1372.65 111.54319 1411.33 100.41 1515.54 106.81 1616.16 117.63 1515.66 105.99320 1615.8 132.35 1734.98 141.12 1866.2 156.1 1735.13 140.93
47
Capacity of the result is compared with the material of concrete strength and
the shear strength using the formula below.
Flexural Strength of concrete
Shear Strength of concrete
This result represent the changing in stresses when different loading occur
and limitation with the capacity of strength concrete. Assumption of overall result for
normal stress is direct stress (force per unit area) acting on the positive and negative
1 faces in the 1-axis direction. For shear stress, the direct stress assume as Out-of-
plane shearing stress (force per unit area) acting on the positive and negative 2 faces
in the 3-axis direction.
From Table 5.5 shows the average result for normal stress is still less than the
capacity of flexural strength of concrete, 3100 KN/m2. Similar result for shear stress
which is element still adequate compared to the capacity of concrete.
5.2.2.1 MAXIMUM STRESSES FROM TIME HISTORY ANALYSIS
From analysis result, maximum stress is occurring on the opening of the
structure. Figure below show the maximum stress due to external loading from
highest intensity 0.19g. Figure 5.5 show the maximum of normal stress and Figure
5.6 show the maximum value for the shear stress only from the external loading
(earthquake).
frf = 0.62λ√fcu (N/mm2) = 3.1 N/mm2 = 3100 KN/m2
λ = 1.0 for normal concrete
frs = 0.17λ√fcu (N/mm2) = 0.85 N/mm2 = 850 KN/m2
48
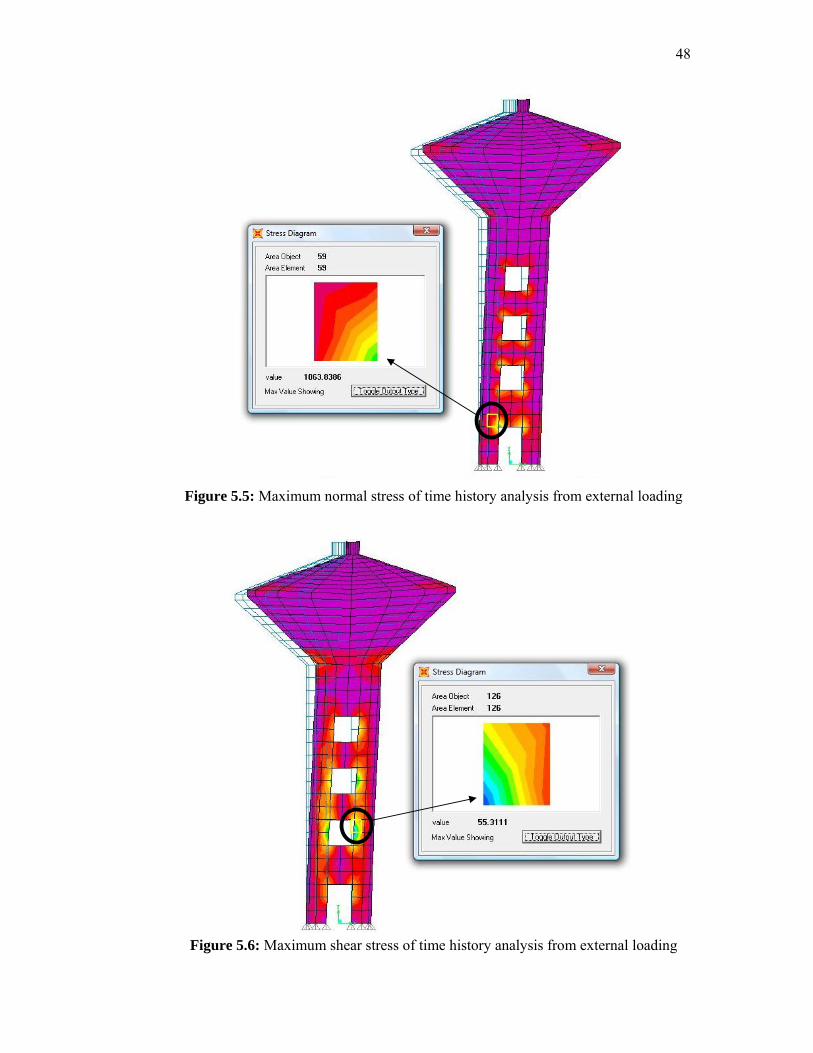
Figure 5.5: Maximum normal stress of time history analysis from external loading
Figure 5.6: Maximum shear stress of time history analysis from external loading
49
From figure above, maximum value as located at area element 59 is 1063.84
KN/m2 and for shear stress, maximum value is 55.31 KN/m2 located at area element
126. As seen in picture, maximum value for normal and shear stress are happened at
the edge of the opening of the structure which is in blue colour represent the highest
stress. Both maximum results compared with the capacity of the concrete strength are
still adequate and the strength is sufficient to resist the external loading.
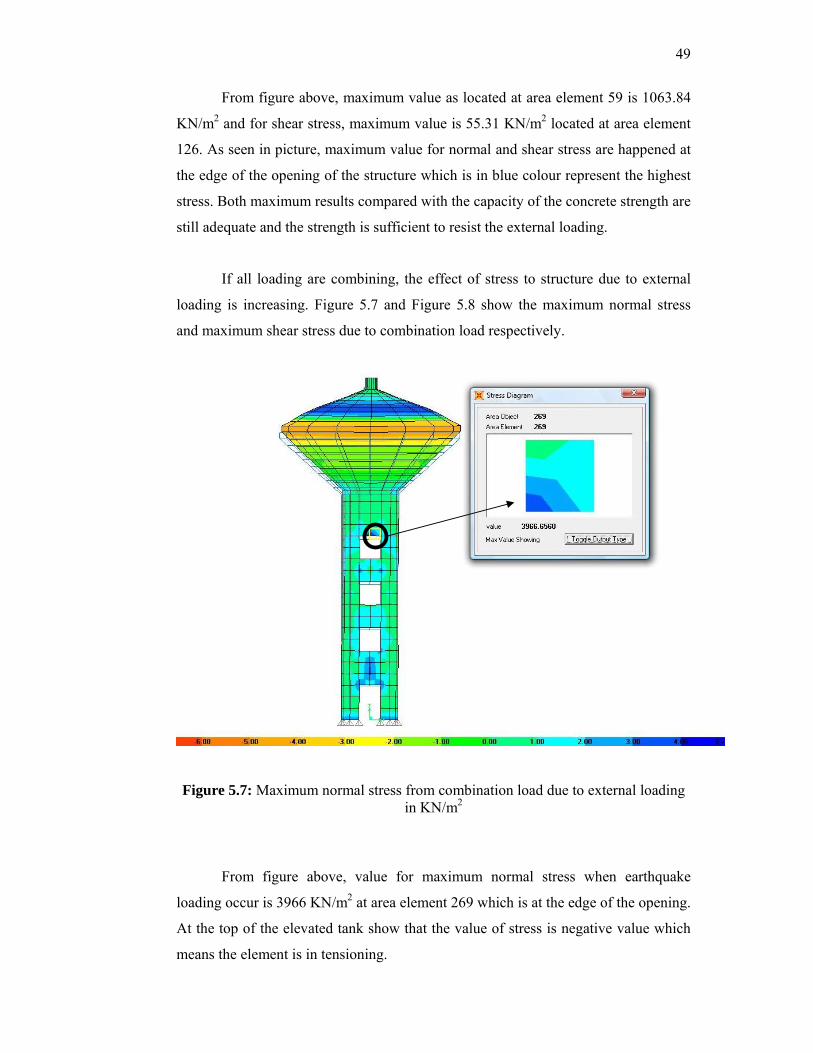
If all loading are combining, the effect of stress to structure due to external
loading is increasing. Figure 5.7 and Figure 5.8 show the maximum normal stress
and maximum shear stress due to combination load respectively.
Figure 5.7: Maximum normal stress from combination load due to external loading in KN/m2
From figure above, value for maximum normal stress when earthquake
loading occur is 3966 KN/m2 at area element 269 which is at the edge of the opening.
At the top of the elevated tank show that the value of stress is negative value which
means the element is in tensioning.
50
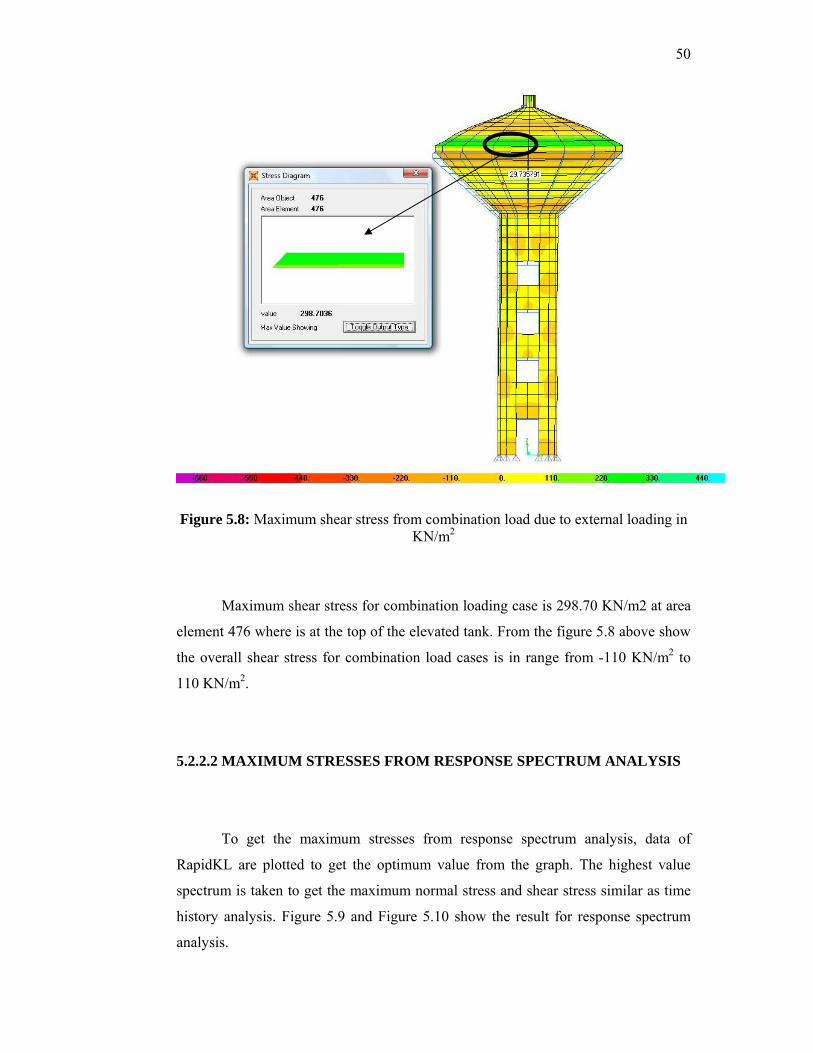
Figure 5.8: Maximum shear stress from combination load due to external loading in KN/m2
Maximum shear stress for combination loading case is 298.70 KN/m2 at area
element 476 where is at the top of the elevated tank. From the figure 5.8 above show
the overall shear stress for combination load cases is in range from -110 KN/m2 to
110 KN/m2.
5.2.2.2 MAXIMUM STRESSES FROM RESPONSE SPECTRUM ANALYSIS
To get the maximum stresses from response spectrum analysis, data of
RapidKL are plotted to get the optimum value from the graph. The highest value
spectrum is taken to get the maximum normal stress and shear stress similar as time
history analysis. Figure 5.9 and Figure 5.10 show the result for response spectrum
analysis.
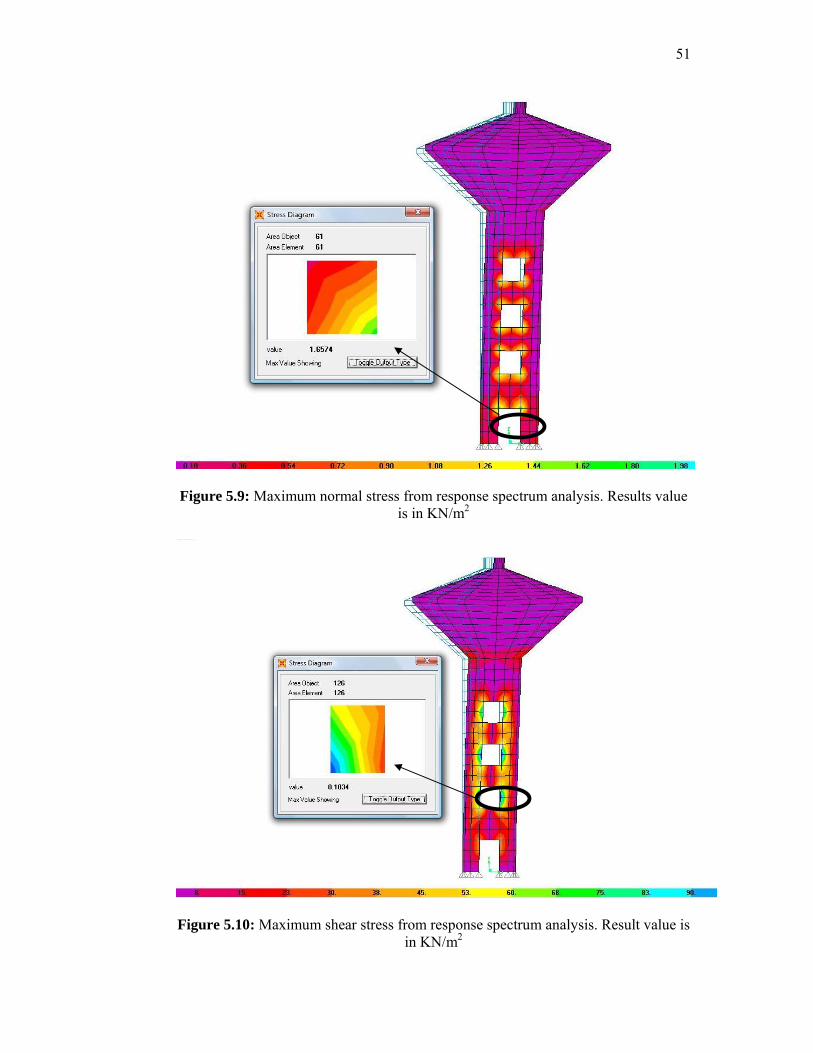
51
Figure 5.9: Maximum normal stress from response spectrum analysis. Results value
is in KN/m2
Figure 5.10: Maximum shear stress from response spectrum analysis. Result value is
in KN/m2
52
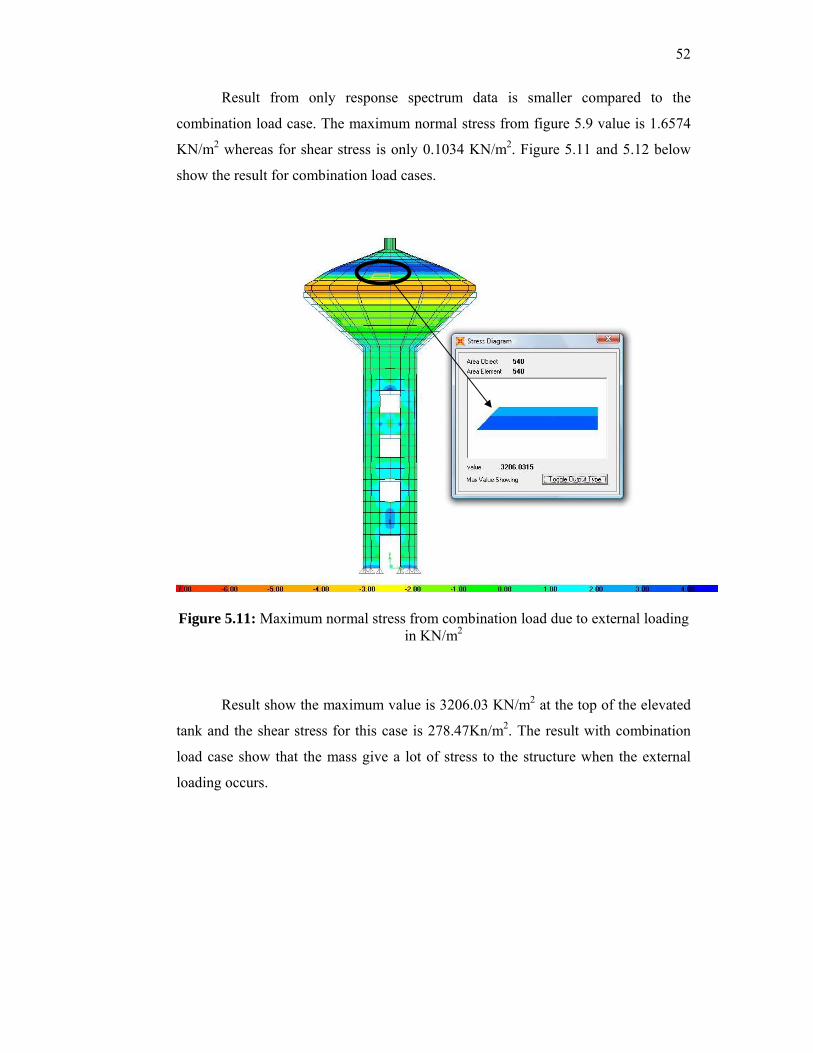
Result from only response spectrum data is smaller compared to the
combination load case. The maximum normal stress from figure 5.9 value is 1.6574
KN/m2 whereas for shear stress is only 0.1034 KN/m2. Figure 5.11 and 5.12 below
show the result for combination load cases.
Figure 5.11: Maximum normal stress from combination load due to external loading
in KN/m2
Result show the maximum value is 3206.03 KN/m2 at the top of the elevated
tank and the shear stress for this case is 278.47Kn/m2. The result with combination
load case show that the mass give a lot of stress to the structure when the external
loading occurs.
53
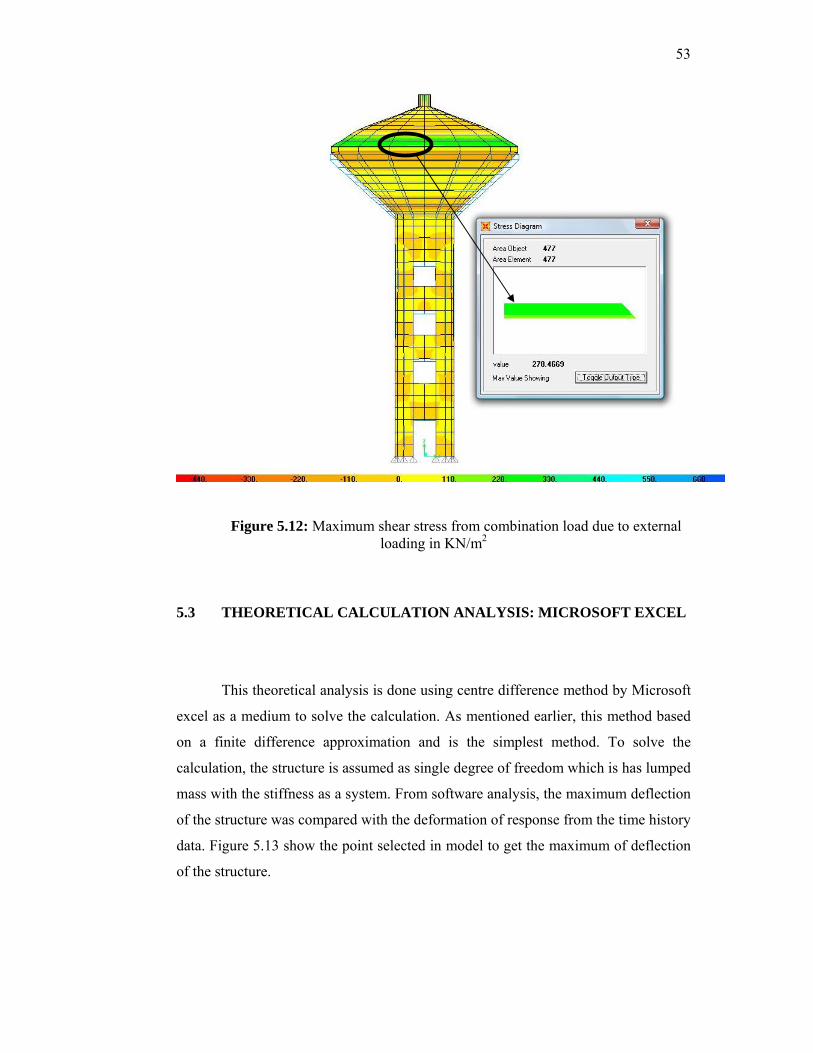
Figure 5.12: Maximum shear stress from combination load due to external loading in KN/m2
5.3 THEORETICAL CALCULATION ANALYSIS: MICROSOFT EXCEL
This theoretical analysis is done using centre difference method by Microsoft
excel as a medium to solve the calculation. As mentioned earlier, this method based
on a finite difference approximation and is the simplest method. To solve the
calculation, the structure is assumed as single degree of freedom which is has lumped
mass with the stiffness as a system. From software analysis, the maximum deflection
of the structure was compared with the deformation of response from the time history
data. Figure 5.13 show the point selected in model to get the maximum of deflection
of the structure.
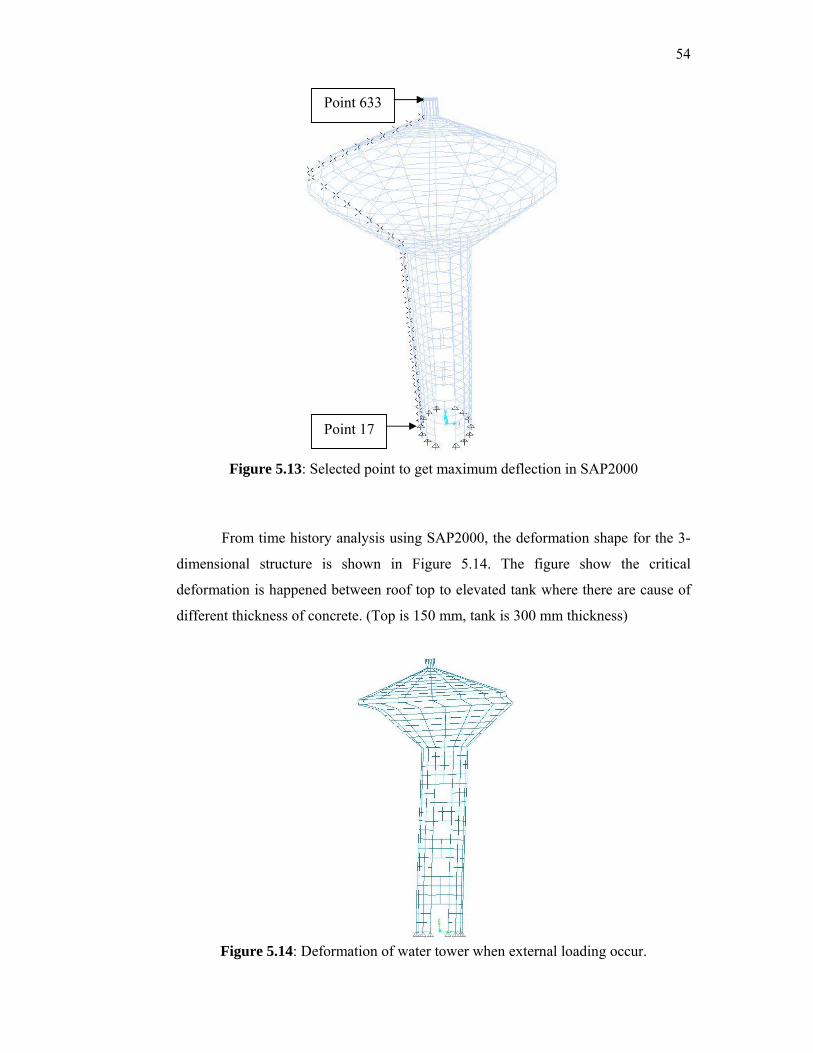
54
Figure 5.13: Selected point to get maximum deflection in SAP2000
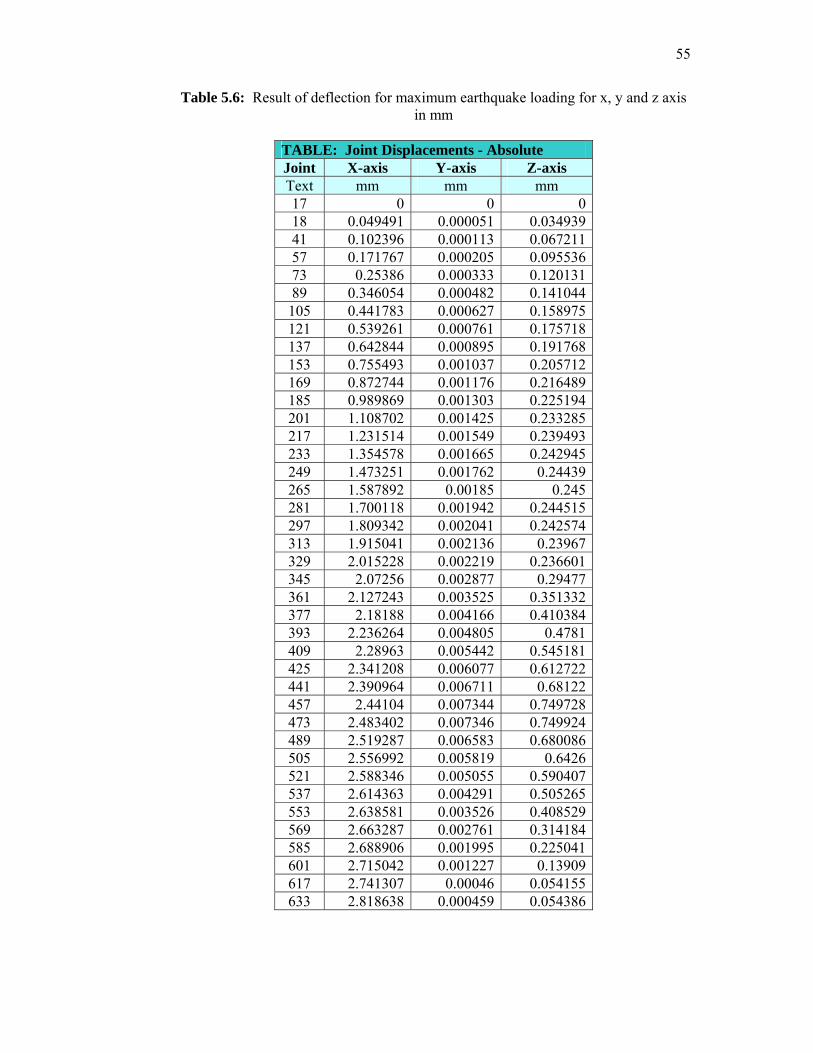
From time history analysis using SAP2000, the deformation shape for the 3-
dimensional structure is shown in Figure 5.14. The figure show the critical
deformation is happened between roof top to elevated tank where there are cause of
different thickness of concrete. (Top is 150 mm, tank is 300 mm thickness)
Figure 5.14: Deformation of water tower when external loading occur.
Point 17
Point 633
55
Table 5.6: Result of deflection for maximum earthquake loading for x, y and z axis in mm
TABLE: Joint Displacements - Absolute Joint X-axis Y-axis Z-axis Text mm mm mm 17 0 0 0 18 0.049491 0.000051 0.034939 41 0.102396 0.000113 0.067211 57 0.171767 0.000205 0.095536 73 0.25386 0.000333 0.120131 89 0.346054 0.000482 0.141044 105 0.441783 0.000627 0.158975 121 0.539261 0.000761 0.175718 137 0.642844 0.000895 0.191768 153 0.755493 0.001037 0.205712 169 0.872744 0.001176 0.216489 185 0.989869 0.001303 0.225194 201 1.108702 0.001425 0.233285 217 1.231514 0.001549 0.239493 233 1.354578 0.001665 0.242945 249 1.473251 0.001762 0.24439 265 1.587892 0.00185 0.245 281 1.700118 0.001942 0.244515 297 1.809342 0.002041 0.242574 313 1.915041 0.002136 0.23967 329 2.015228 0.002219 0.236601 345 2.07256 0.002877 0.29477 361 2.127243 0.003525 0.351332 377 2.18188 0.004166 0.410384 393 2.236264 0.004805 0.4781 409 2.28963 0.005442 0.545181 425 2.341208 0.006077 0.612722 441 2.390964 0.006711 0.68122 457 2.44104 0.007344 0.749728 473 2.483402 0.007346 0.749924 489 2.519287 0.006583 0.680086 505 2.556992 0.005819 0.6426 521 2.588346 0.005055 0.590407 537 2.614363 0.004291 0.505265 553 2.638581 0.003526 0.408529 569 2.663287 0.002761 0.314184 585 2.688906 0.001995 0.225041 601 2.715042 0.001227 0.13909 617 2.741307 0.00046 0.054155 633 2.818638 0.000459 0.054386
56
Table 5.6 show the result of the deflection from the selected point show in
Figure 5.13. From the result, the maximum deflection for the structure is 2.818 mm
to the x-axis at the top of the structure (Point 633). Table 5.7 show the summarize
result of maximum deflection for three axes.
Table 5.7: Summarize result of deflection for three axes.
For comparison, structure is assumed as single degree of freedom system for
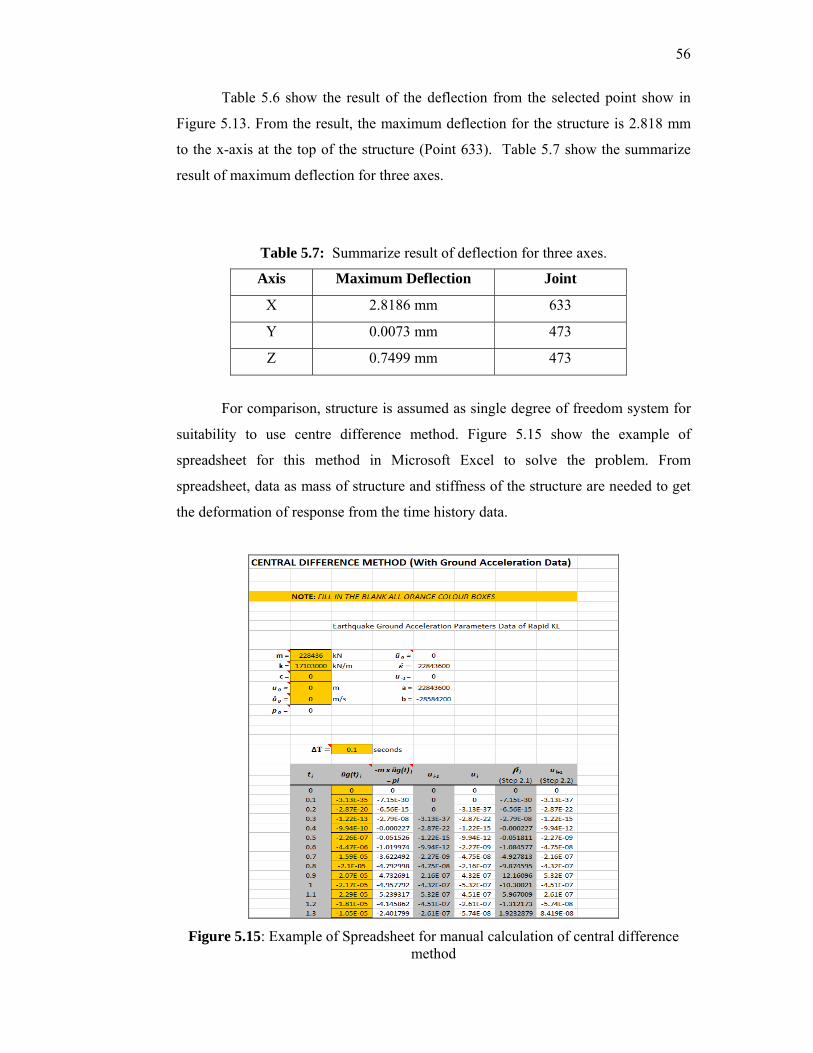
suitability to use centre difference method. Figure 5.15 show the example of
spreadsheet for this method in Microsoft Excel to solve the problem. From
spreadsheet, data as mass of structure and stiffness of the structure are needed to get
the deformation of response from the time history data.
Figure 5.15: Example of Spreadsheet for manual calculation of central difference
method
Axis Maximum Deflection Joint
X 2.8186 mm 633
Y 0.0073 mm 473
Z 0.7499 mm 473
57
Table 5.8: Summarize result of centre different method
Table 5.9: Comparison between SAP2000 with Centre Difference Method (CDM)
From the result above, there is big different in percentage compared both
calculation and software because of the assumption taken to used manual theoretical
calculation. One of the example is the system of the structure which is using software
is more detailed (finite element method) compared to calculation where is using
single degree of freedom system which more simple.
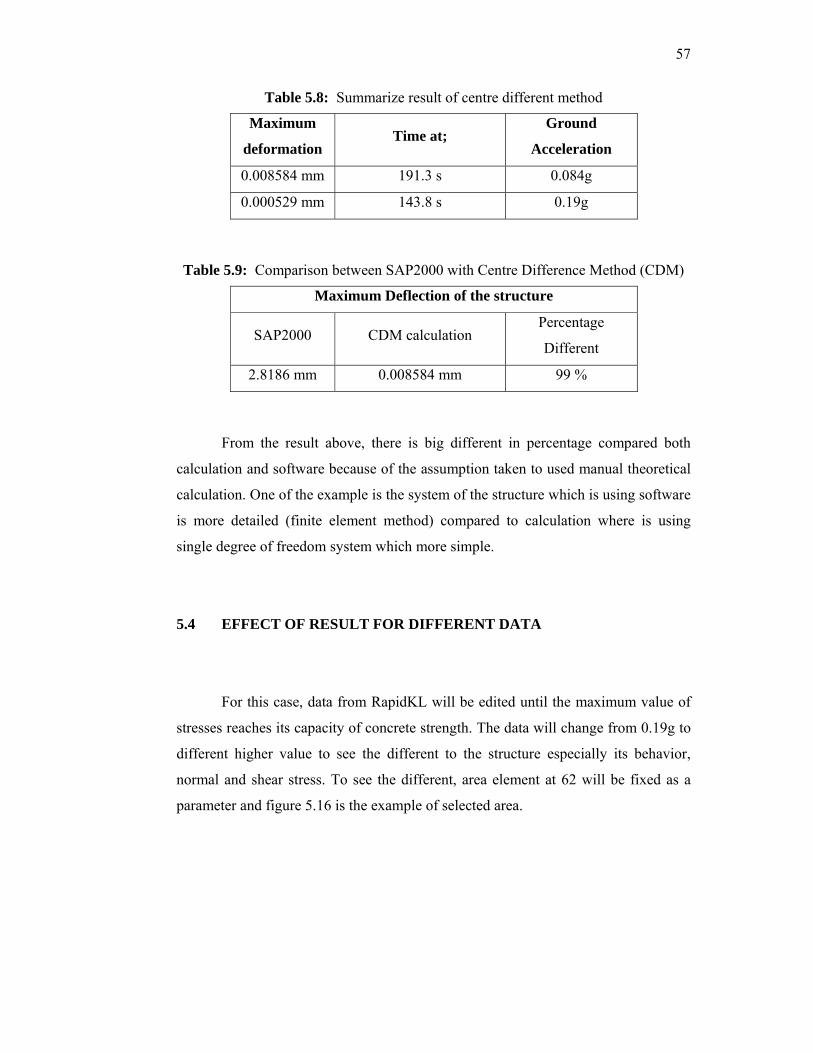
5.4 EFFECT OF RESULT FOR DIFFERENT DATA
For this case, data from RapidKL will be edited until the maximum value of
stresses reaches its capacity of concrete strength. The data will change from 0.19g to
different higher value to see the different to the structure especially its behavior,
normal and shear stress. To see the different, area element at 62 will be fixed as a
parameter and figure 5.16 is the example of selected area.
Maximum
deformation Time at;
Ground
Acceleration
0.008584 mm 191.3 s 0.084g
0.000529 mm 143.8 s 0.19g
Maximum Deflection of the structure
SAP2000 CDM calculation Percentage
Different
2.8186 mm 0.008584 mm 99 %
58
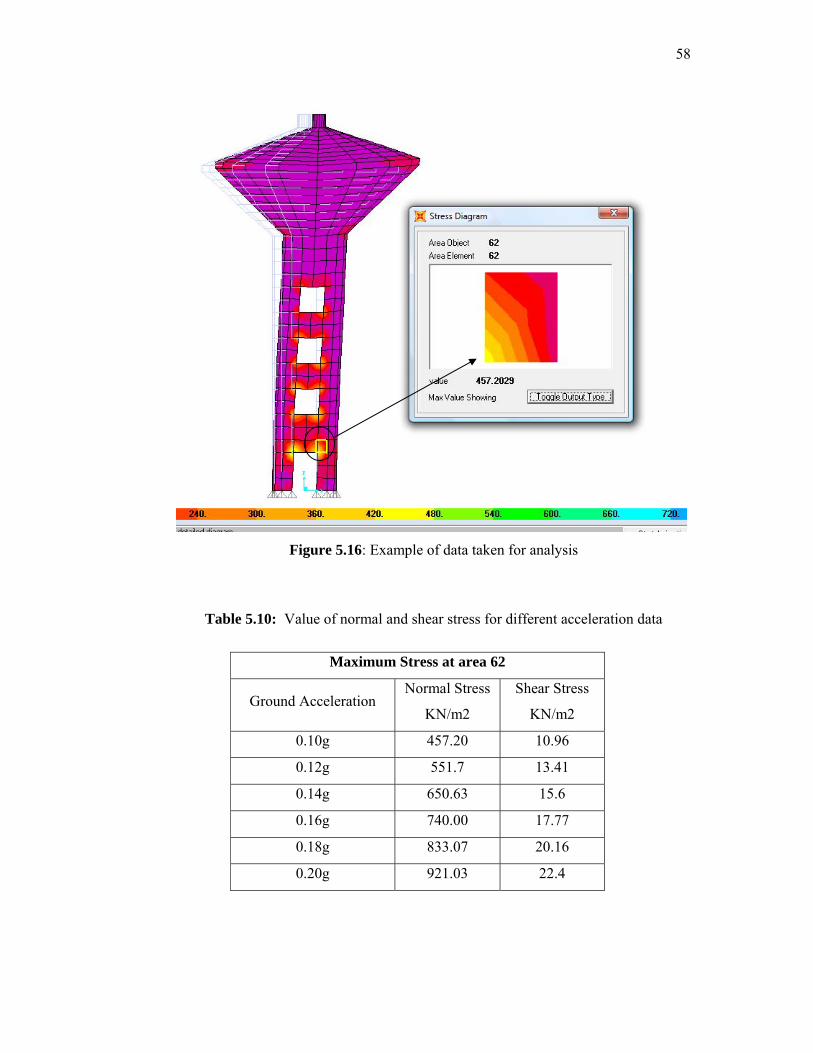
Figure 5.16: Example of data taken for analysis
Table 5.10: Value of normal and shear stress for different acceleration data
Maximum Stress at area 62
Ground Acceleration Normal Stress
KN/m2
Shear Stress
KN/m2
0.10g 457.20 10.96
0.12g 551.7 13.41
0.14g 650.63 15.6
0.16g 740.00 17.77
0.18g 833.07 20.16
0.20g 921.03 22.4
59
Ground Acceleration, üg(t)
10.96 13.41 15.6 17.77 20.16 22.4
457.2551.7
650.63740
833.07921.03
0
100
200
300
400
500
600
700
800
900
1000
0.1g 0.12g 0.14g 0.16g 0.18g 0.2g
StressKN/m2 Normal Stress
Shear Stress
Figure 5.17: Graph of ground acceleration versus stress
From the graph show the stress was increment when the ground acceleration
increases. The graph shows that value is increase uniformly in straight line where
increment of ground acceleration is 0.02g.
5.5 EFFECT OF RESULT WITH MAXIMUM TIME HISTORY DATA
Another result test is by using different time history data but with higher
intensity start with 0.25g until 0.85g. This result can be compare with the capacity
and check whether the structure still can resist the earthquake loading. Figure 5.18
show the example of data taken from area element 62 same with the result from
subchapter 5.4 to see the different. Table 5.11 show the result of normal stress and
shear stress of element when intensity of earthquake increases.
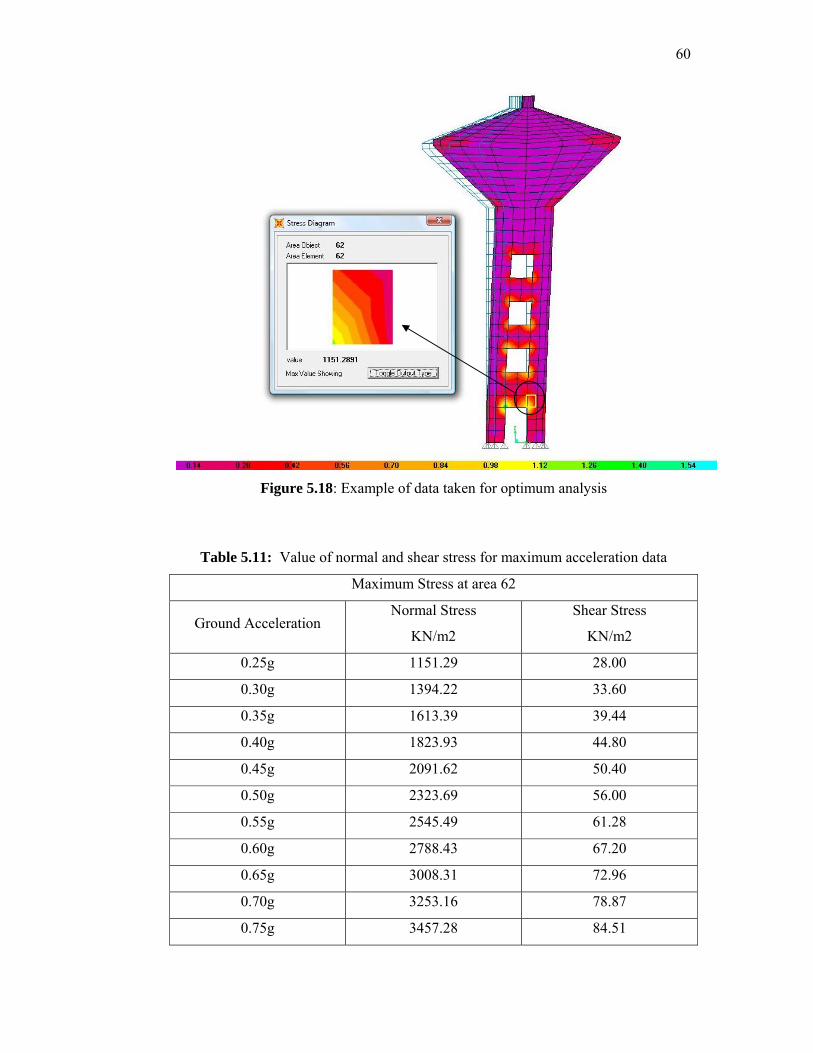
60
Figure 5.18: Example of data taken for optimum analysis
Table 5.11: Value of normal and shear stress for maximum acceleration data
Maximum Stress at area 62
Ground Acceleration Normal Stress
KN/m2
Shear Stress
KN/m2
0.25g 1151.29 28.00
0.30g 1394.22 33.60
0.35g 1613.39 39.44
0.40g 1823.93 44.80
0.45g 2091.62 50.40
0.50g 2323.69 56.00
0.55g 2545.49 61.28
0.60g 2788.43 67.20
0.65g 3008.31 72.96
0.70g 3253.16 78.87
0.75g 3457.28 84.51
61
0.80g 3720.54 90.14
0.85g 3933.94 95.77
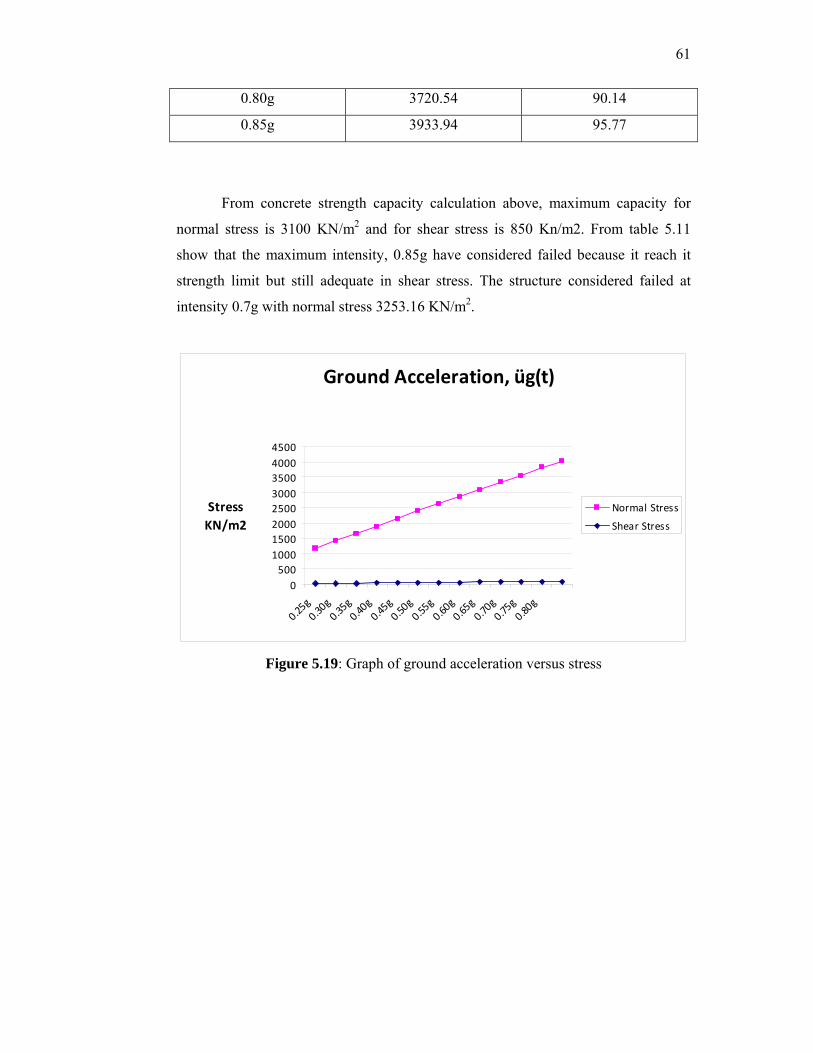
From concrete strength capacity calculation above, maximum capacity for
normal stress is 3100 KN/m2 and for shear stress is 850 Kn/m2. From table 5.11
show that the maximum intensity, 0.85g have considered failed because it reach it
strength limit but still adequate in shear stress. The structure considered failed at
intensity 0.7g with normal stress 3253.16 KN/m2.
Ground Acceleration, üg(t)
0500
10001500200025003000350040004500
0.25g0.30g0.35g0.40g0.45g0.50g0.55g0.60g0.65g0.70g0.75g0.80g
StressKN/m2
Normal Stress
Shear Stress
Figure 5.19: Graph of ground acceleration versus stress
62
CHAPTER 6
CONCLUSION AND RECOMMENDATION
6.1 INTRODUCTION
The simulations of the computer analysis using SAP2000 have give different
value of normal and shear stress related with different value of time history data. The
results are to compare with the mathematical calculation using single degree of
freedom system formulation.
6.2 CONCLUSION
From the result we can conclude that normal stress and shear stress increase
to the structure when additional loading occurs on structure. Compared to the
capacity of material, the structure should used higher strength of concrete to the
structure. Although increasing, earthquake of intensity 0.19g did not give any big
different in-term of stresses.
63
The result for deformation shows that the deflection is different between
theoretical calculation and software analysis. This is because the assumption of
parameter to get the result is different where using software more detailed compare
to calculation which is simpler.
From the result of different data show that the stress were increase when the
value of maximum ground acceleration were increase. Although the increase is
uniformly in straight line, we can conclude that the strength of concrete will achieve
it maximum capacity and the structure will failed. In this study, structure considered
failed in normal stress when the time history data reach at intensity 0.70g. However
in shear stress still adequate compare to the capacity of concrete strength.
6.3 RECOMMENDATION
Recommendations from this study are need to look into different types of
water tower to compare the strength and the behavior. Need to do further research on
the non-linear analysis of structure to more accurate result. Try another types of
method to calculate the theoretical method for differentiate to get smaller the
percentage of the difference between software and manual calculation. Also need to
add the structural design to increase the strength from earthquake excitation such as
damper system, bracing and base isolator and etc.
64
REFERENCES
Anil K. Chopra, “Dynamics of Structures: Theory and Application to Earthquake Engineering”, University of California at Berkeley, Third Edition, 2007 Prof. Jan Bencet, Ph.D.,C.Eng, Technical paper on “Experimental Analysis of Steel Water Tank Tower” University of Zilina, Department of Structural Mechanics, Komenskeho,Zilina, Slovakia.
Prof. Azlan Bin Adnan, Lecture Note “Structural Wind and Earthquake Engineering (MAB1113)”, Jabatan Struktur dan Bahan, Universiti Teknologi Malaysia, 20082009
Mohd Hazim Bin Mohd Rejab, Thesis on “Physical Model for Structure Dynamic in Earthquake Engineering (Transmission Tower)”, Universiti Teknologi Malaysia, May 2006.
Alan Williams Ph.D, S.E.,C.Eng, “Seismic Wind Force: Structural Design Examples”, International Code Council, Third Edition, June 2003
Bouwkanp J.G., Kollegger J.P., Stephen R.M. “Preliminary Experimental Investigation of a Broad Base Liquid Storage Tank”, University of California, Berkeley, California, May 1981
Durgesh C. Rai “Seismic Retrofitting of R/C Shaft Support of Elevated Tanks”, Indian Institute of Technology Kanpur, Kanpur, Nov 2002
Sara Hamm “The Watertower as Décor – Exceeding Generic Concepts in Art Nouveau”, Reseau Art Nouveau Network, 2004 Prof. Azlan Bin Adnan, Nor Azizi Yusoff “Development of Sismic Zonation for Malaysian Seismic Design Procedure”, Structural Earthquake Engineering Research (SEER), Universiti Teknologi Malaysia, 1999 Azlan.A., Aminaton.M, Hendriyawan “The Effect of Sumatra Earthquake to Peninsular Malaysia”, Structural Earthquake Engineering Research (SEER), Universiti Teknologi Malaysia, 2003 Azlan.A., Wei.B.T.C “Effects of Building Vibration to Low Intensity Ground Motion Towards Human Perception”, Structural Earthquake Engineering Research (SEER), Universiti Teknologi Malaysia, 2003
65
Masyhur I.., Donny T. D, Hendriyawan, Drajat H., Bigman M.H., Engkon K. K, Teddy B., Mark D.P. “Proposed Seismic Hazard Maps of Sumatra and Java Islands and Microzonation Study of Jakarta City, Indonesia”, Intitut Teknologi Bandung, 2008 Azlan.A., Yusoff N.A, Siang Y.W., Keang N.K. “Development of a portable Tri-Axial Seismograph”, Structural Earthquake Engineering Research (SEER), Universiti Teknologi Malaysia, 2000 Chiang J.“Design for Seismic Action – A Far Field Effect In Malaysia Experience”, Universiti Tunku Abdul Rahman, Kuala Lumpur, Malaysia, 2008 Robert J.L.“Parks and Plates – The Geology of Our National Parks, Monuments, and Seashores”, W.W.Norton and Co.,New York, 2005 W.S.Gray, G.P.Manning.“Concrete Water Tower, Bunker, Silos, and Other Elevated Structures”, Cement and Concrete Association, Great Britain, 1973 Robert.“Introduction to Earthquake – Part 1”, McGraw Hill - Book, 2002 Lee Keng Kong “Bahaya Seismik di Malaysia”, Perkhidmatan Kajicuaca Malaysia, 1991
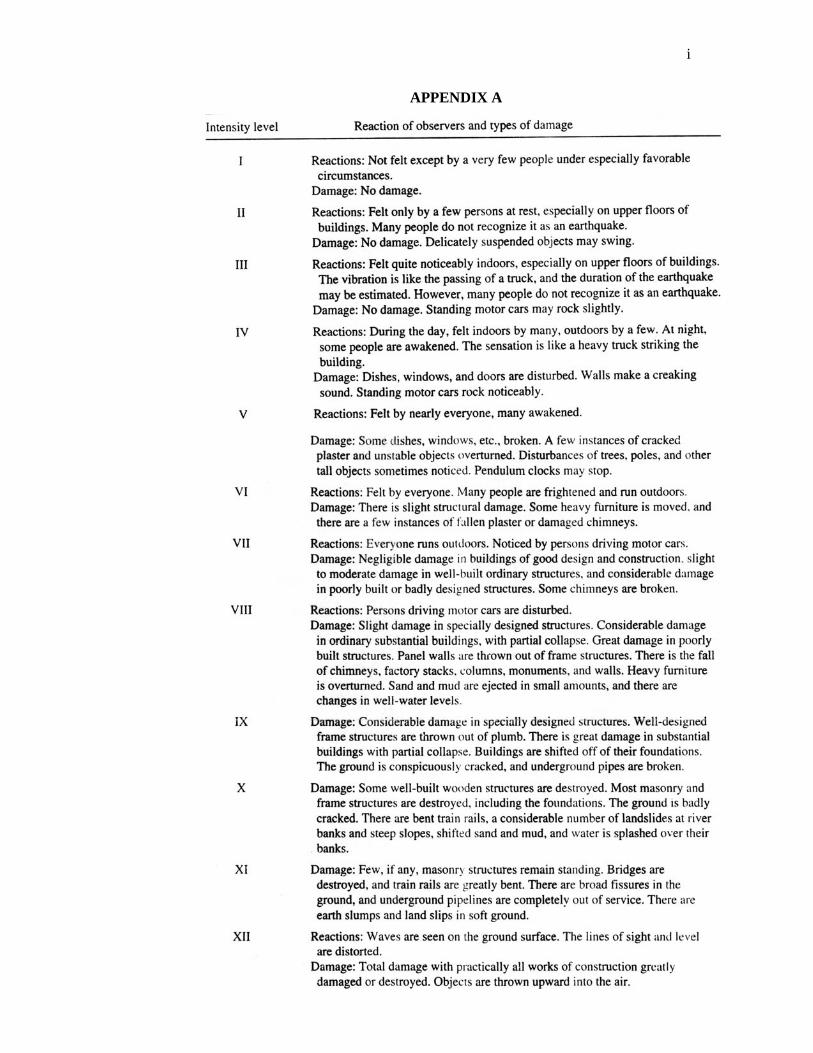
i
APPENDIX A
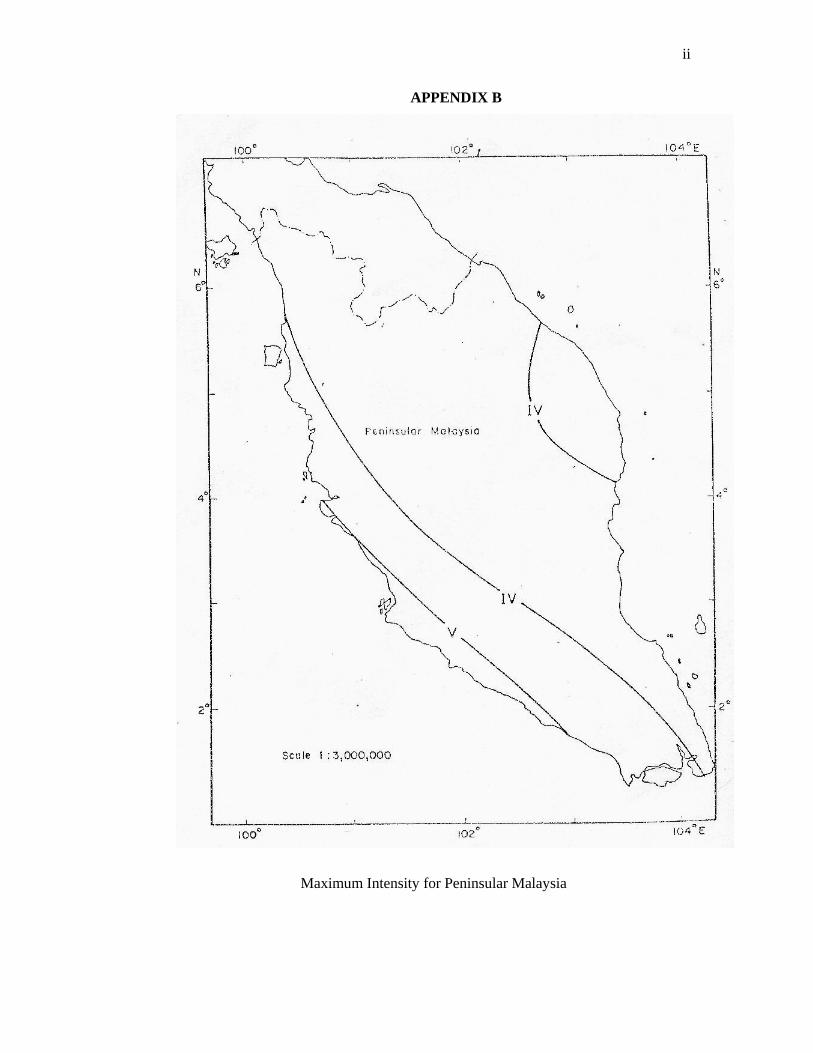
ii
APPENDIX B
Maximum Intensity for Peninsular Malaysia
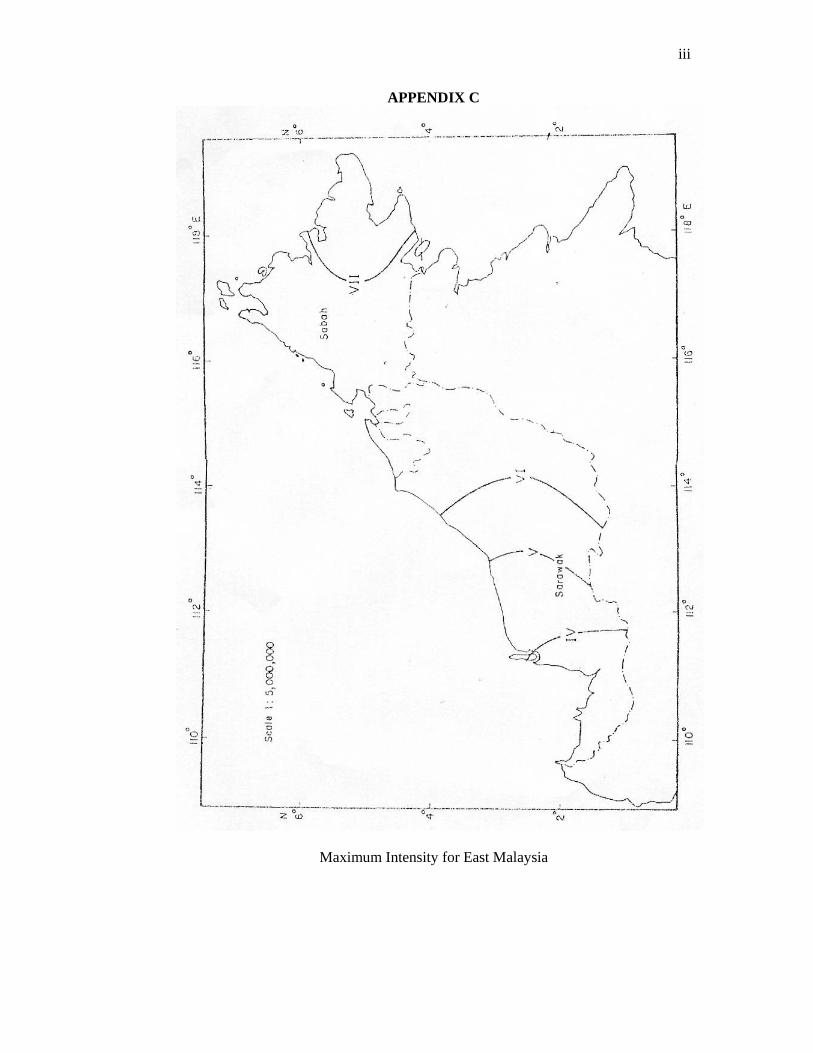
iii
APPENDIX C
Maximum Intensity for East Malaysia
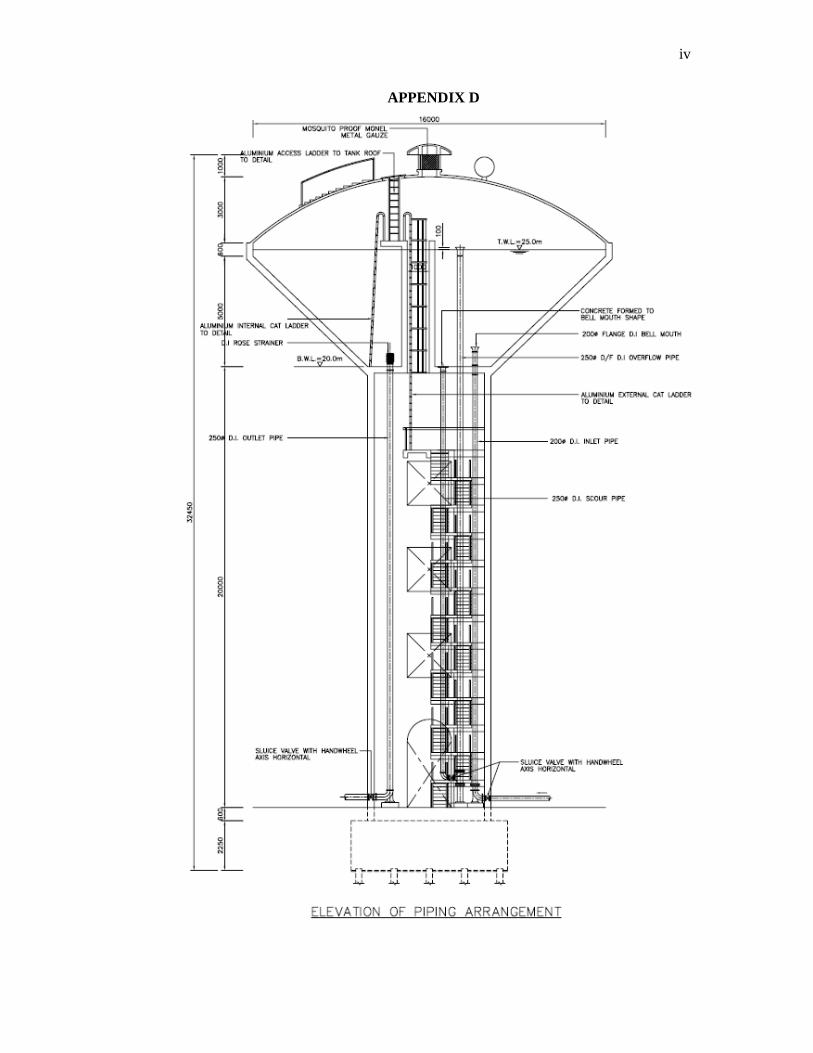
iv
APPENDIX D
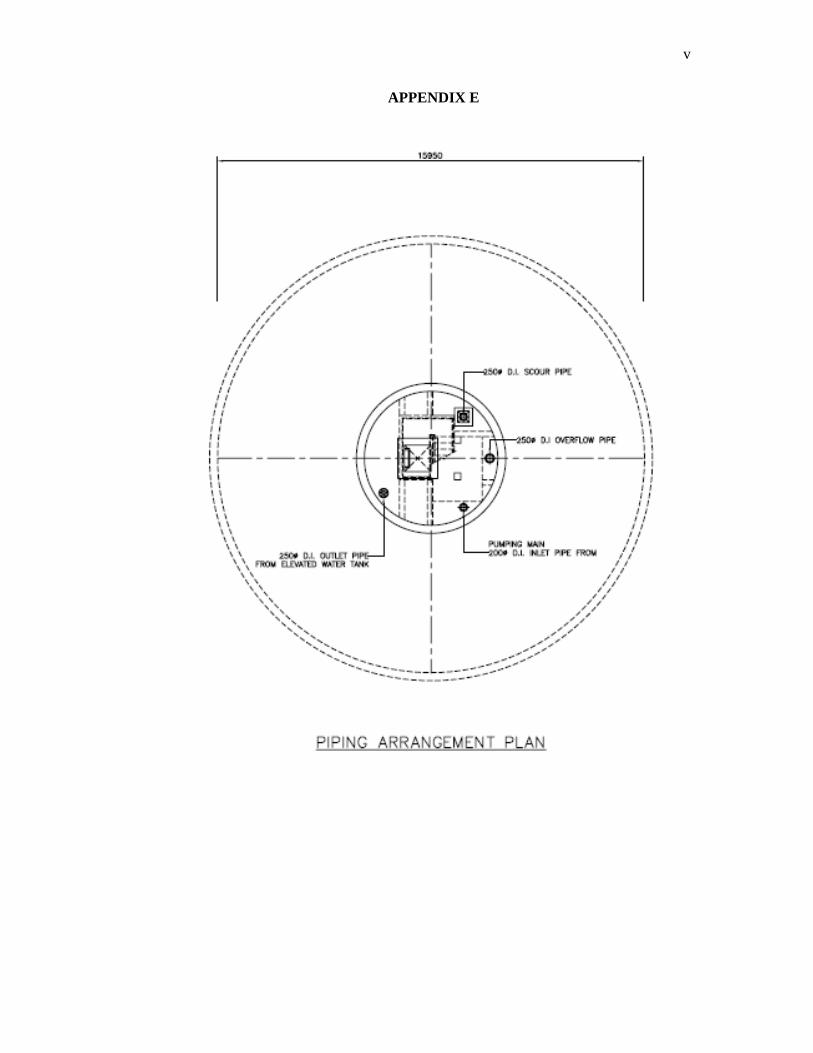
v
APPENDIX E