Embed Size (px)
Citation preview

THE AMERICAN MINERALOGIST. VOL. 42. NOVEMBER_DECEMBER 1957
IONIC DIFFUSION AND THE PROPERTIES OF QUARTZXI. THE DIRECT CURRENT RESISTIVITY
HBNnv E. WBNonw, Horvard Uniaersity, Cambr,idge, Mossachusetts.f
AssrnecrThe direct current resistivity of a number oI Z-cut plates of natural quartz has been
measured and the dependence of the axial resistivity upon tempemture, field intensity,crystallographic orientation and time of passage of current investigated. The history ofinvestigation of this property is summarized and previous results tabulated. The currentflowing in a quartz plate under the influence of an electric field is complex, consisting ofparts having characteristic time dependence and activation energies. The anomalouscharging and discharging currents were investigated, and are considered to be the resultof a reversible interfacial polarization having a relaxation frequency near 0.01-o.001cycle/sec. The early surge current is connected with the migration of impurity ions anddecays as a result of irreversible trapping and electrolytic exclusion of these ions. Duringthe period of dominance of this current, quartz displays semiconductor behavior. Roomtemperature resistivity during this phase of conductionis of the order of 10r3-101e ohm-cm,resistivity at 500'c. is of the order of 105 ohm-cm, and activation energy lies in the range20-25 kcar./mole. After passage of current for over 500 hours, the steady-state mechanismis unmasked, yielding an activation energy of 35-40 kcal./mole, room temperature re-sistivity of the order of 1027 ohm-cm, and resistivity at 500o C. of about 5X10e ohm-cm.Quartz is shown to have a marked voltage coefficient o{ resistivity which varies withtemperature and time of passage of current. This complex interdependence of the factorsaffecting the resistivity of quartz arises out of the common connection with the migrationof impurity ions. Resistivity is a vectorial property but the exact nature of the dependencehas not been completely investigated. Ionic difiusion in the equatoriai direction has beenobserved, and has been demonstrated to play a part in the equatorial conductivity.Existing discrepancies and contradictions in reported values for the resistivity of quartzare shown to have their origin in the neglect of the factor of time of passage of current.when current is passed for a sufficiently long time to exhaust impurity ion connectedmechanisms of conduction, the diflerence between axial and equatorial resistivity andthe difierence between difierent samples of quartz is of the same magnitude as the ex-perimental error.
hqrnopucrroN
Quartz is outstanding among minerals for the constancy of its physi-cal properties. Except in those cases where numerous voids or inclusionsare present, the density, indices of refraction and unit cell dimensions ofclear qlartz, and even of most colored varieties, show a remarkable con-sistency from sample to sample and locality to locality. A Harvardgroup (Frondel and Hurlbut (1953)), studying variations in these proper-ties of quartz, found differences so minute as to require instrumental
* contribution No. 383, Departrnent of Mineralogy and petrography, Harvard uni-versity, Cambridge, Massachusetts.
t Present Address: Department of Mineralogy, The ohio state university, columbus,Ohio.
859
860 HENRY E, WENDEN
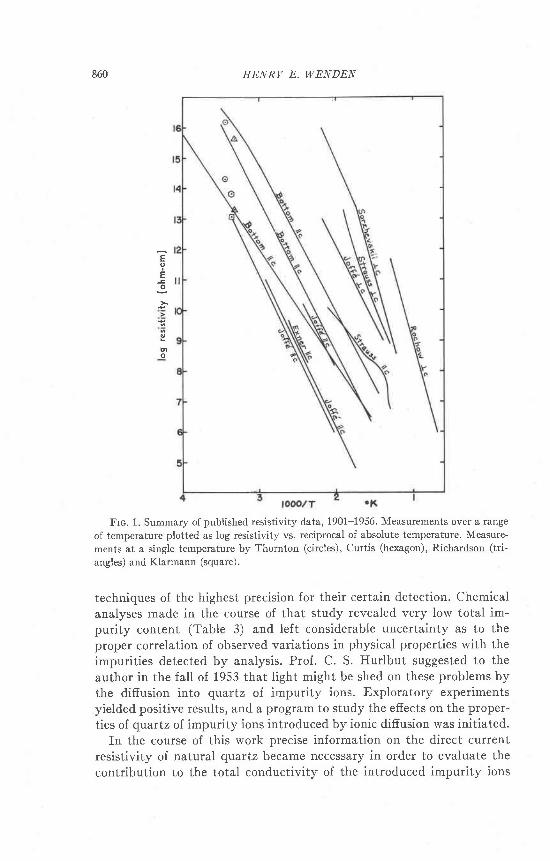
Frc. 1. Summary of published resistivity data, 1901-1956. Measurements over a range
of temperature plotted as log resistivity vs. reciprocal of absolute temperature. Measure-
ments at a single temperature by Thornton (circles), Curtis (hexagon), Richardson (tri-
angles) and Klarmann (square).
techniques of the highest precision for their certain detection. Chemicalanalyses made in the course of that study revealed very low total im-purity content (Table 3) and left considerable uncertainty as to theproper correlation of observed variations in physical properties with theimpurities detected by analysis. Prof. C. S. Hurlbut suggested to theauthor in the fall of 1953 that l ight might be shed on these problems bythe diffusion into quartz of impurity ions. Exploratory experimentsyielded positive results, and a program to study the effects on the proper-
ties of quartz of impurity ions introduced by ionic diffusion was initiated.In the course of this work precise information on the direct current
resistivity of natural qtartz became necessary in order to evaluate thecontribution to the total conductivity of the introduced impurity ions
Eo
Eto
o
DIRECT CURRENT RESISTIVITY OF QAARTZ
undergoing diffusion. The data available in the literature presented apicture of inconsistency and contradiction quite at variance with theremarkable constancy of most of the other properties of qtartz. l-igure 1
summarizes the existing information up to the time of the present inves-tigation. It wil l be noted that the values of axial resistivity* reported bydifierent authors for any given temperature range over two decades.The slopes of the curves l ikewise show a wide range, indicating lack ofagreement as to the energy of activation of the mechanism of conduction.As a result of the variation in slope of the curves, room temperatureresistivit ies obtained by extrapolation (Table 1) show very large dis-
Tesrn 1. Suuu,lrv o.r'Expr.rurrrlr- Mntsoos
861
Author
CurieExnerThorntonCurtisRichardson
Joff6RochowKlarmannSarzhevskiiVerhoogenBottom
King
StraussWenden
Fieldintensity
(volts,/cm)
Electrode
matedal
Resistivity (25" C. )(ohm-cm)
Equat
1886 8919011910191.21915-25192819381938195219521953
1955-56
19561955-57
7-300100-150
t 72 6 . 52 6 526-500
500-1200room
300-500300-500
- 42-416
85-462
200-50025-535
10s 11d
1m 144d0 5-1 0sl0s-20mto 190h
to 10d1 5 m
to 600h
1-20mto 1400h
l-6000270-600
0 09-0 7sf
to 10 ,0002 5
1-2 X tO'28000
350-1750
500
1000(?)to 2000
P INa amalgam
nonemetallic
silvermetal or graphite
Pt foilsilver
P taluminum
Pt
stainless steelP t
3 x totu
I 5 x l o t u
4 . 3 X l o t i1 X 1ore*1 x lo'n*
1 X 1 c ' 2 *
1 X 1013*
* Extrapolated value, given as an order of magnitude.
T e,s.u,
crepancies. The agreement concerning the equatorial resistivity is onlyslightly better.
Differences between axial and equatorial resistivity reported by anyone author are as great as 106, if curves are extrapolated to room temper-ature. l{oreover, if the least value for axial resistivity is compared withthe largest value for equatorial resistivity, both reduced to room temper-ature, the difference is greater than 1015. There is no basis in theory forsuch enormous difierences in axial and equatorial resistivity of pure,ordered quaftz. It is very probable that this efiect is dependent uponimpurit ies, and indeed it was suggested as early as,1887 (Warburg andTegetmeier) that the migration of sodium through quartz in the direc-
x "Axial resistivity" is considered to be the resistivity of a quartz crystal for current
flowing parallel to the c axis.
862 HENRY E, WENDEN
tion of the c axis might account for the large observed difference in axialand equatorial resistivity. This is a reasonable postulate, and indicatesthat the resistivity is extraordinarily sensitive to impurity content, andhence is of peculiar significance in the study of the effect of such ionson the properties of quartz. For this reason, as well as to obtain reliablenumerical values for this property, a series of careful measurements ofthe direct current resistivity were undertaken. This paper is a report onthis phase of the problem.
Hrsronrc.q.r, Noro
The first significant measurements of the direct current resistivity ofqlrartz were made by Jacques Curie as a part of a thesis on the electricalproperties of crystals, and were reported in 1886, 1888 and 1889. At thesame time research on the electrical resistivity oI quaftz was beingcarried out by Warburg and Tegetmeier (1887, 1888). These pioneerefforts were remarkably successful, and most of the important featuresof tlre direct current conductivitiy of qtartz were clearly indicated. Forexample, Curie recognized the dependence of the resistivity on the timeof passage of current, and made a quantitative statement of the current-time relation in exponential form. Likewise, Warburg and Tegetmeierclearly demonstrated the axial transport of charge by sodium ionsthrough quartz plates, and correctly inferred that the greater part ofthe short-term conduction is electrolytic. However, these observations,valid in themselves, did not lead to correct inferences concerning thegeneral mechanism of conduction in quartz, and the subsequent historyof investigation of this property is one of disagreement and inconsistency,arising in the main from neglect by the experimenters of the Iactor of timeof passage of current.
ExpBnrueNrar Nluruops
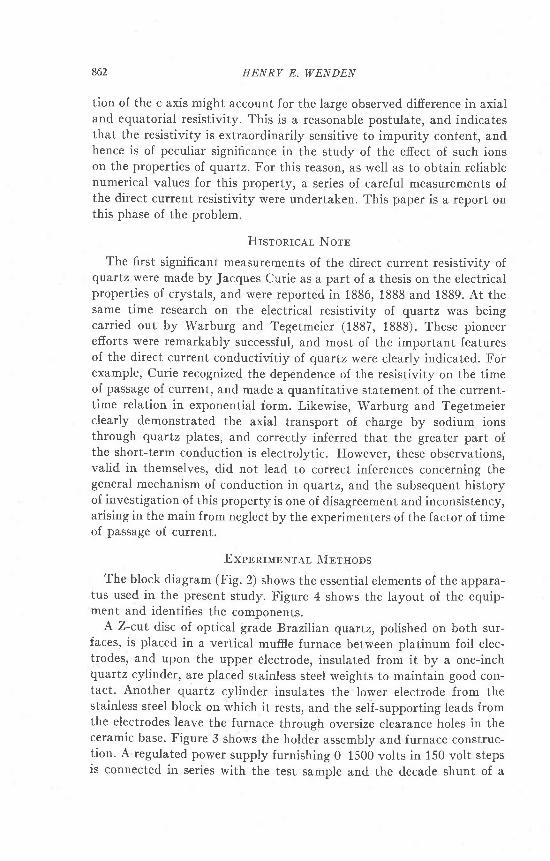
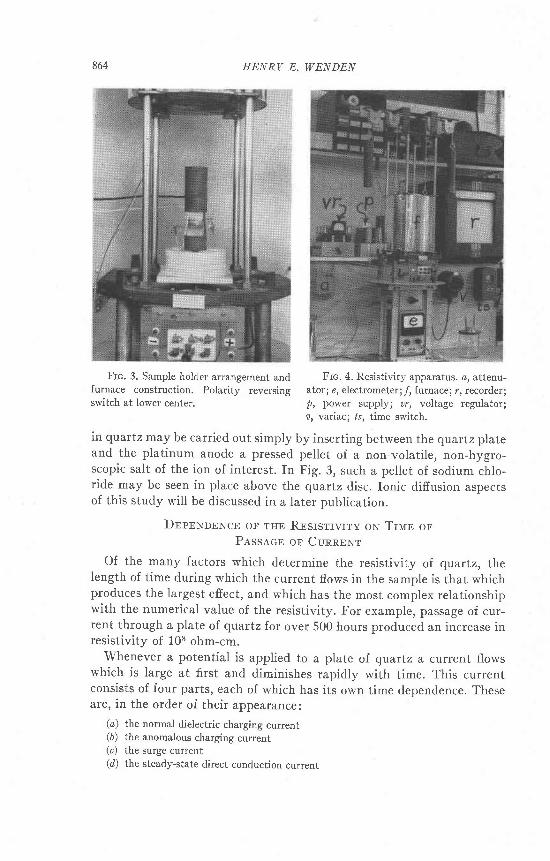
The block diagram (Fig. 2) shows the essential elements of the appara-tus used in the present study. Figure 4 shows the layout of the equip-ment and identifies the components.
A Z-cut disc of optical grade Brazilian quartz, polished on both sur-faces, is placed in a vertical muffie furnace between platinum foil elec-trodes, and upon the upper electrode, insulated from it by a one-inchquartz cylinder, are placed stainless steel weights to maintain good con-tact. Another qtrartz cylinder insulates the lower electrode from thestainless steel block on which it rests, and the seli-supporting leads fromthe electrodes leave the furnace through oversize clearance holes in theceramic base. Figure 3 shows the holder assembly and furnace construc-tion. A regulated power supply furnishing 0-1500 volts in 150 volt stepsis connected in series with the test samole and the decade shunt of a

DIRECT
It.f UAC
CURRENT RESISTIVITY OF QUARTZ 863
SWITCHT ' M E R G
POWE,aS U " ? L Y
VR TUOEVOLTAGE
I
lql DEC.{DE
SHUNTl , r II-J
:wo-Pos,nod€eca69sq
o-looooc
,f-o-snv.
m$b
ELECT(CMErEg-lATreNuAToR
Frc. 2. Block diagram of apparatus for resistivity measurement.
Keithley Model 210 electrometer. A potential is impressed across thesample and a current flows through the shunt. The voltage Across theshunt is read by the electrometer, whose output drives the 0-5 millivoltrange of a two-position Leeds-Northrop N{odel G Speedomax recorderthrough a suitable attenuator. A thermocouple in the stainless steelblock beneath the sample holder actuates the second range of the Speed-omax recorder, which is directly calibrated in degrees C., so that a con-tinuous record of furnace temperature and current flowing in the plateunder test are kept on the same strip chart. A switch permits reversalof polarity of the applied voltage.
The furnace is counterweighted and slides up and down easily onstainless steel rods. The support framework of the furnace is designedto accommodate the electrometer beneath the furnace so that the criticallead from the sample to the high side of the electrometer shurrt may bekept short. Furnace temperature is set by means of a General Radio V5Variac, and line voltage fluctuations are suppressed by use of Raytheonvoltage stabilizers.
The overall precision of the measurements is low, plus or minus 10per cent, but is adequate for the purposes of this investigrltion. Thegeneral accuracy of the instruments was checked at regular inbervals bycomparison of the reading of the Speedomax against two difierent port-able potentiometers, and by calibration of the voltage scales of the elec-trometer against standard cells. No guard electrode was used, 4s Rochow(1938) and others have shown that the error resulting from sutrface con-duction is negligible above about 200' C.
Study of the ionic conductivity of quartz and of the mobility of ions
YARIACrrJU\za/f,tJ-
rdU{za{f,L
864 HENRY E. WENDEN
Frc. 3. Sample holder arrangement and Frc. 4. Resistivity apparatus. o, attenu-furnace construction. Polarity reversing ator; e, electrometer;/, furnace; r, recorderlswitch at lower center. 1, power supply; zr, voltage regulator;
v, vatrac; ls, time switch.
in quartz may be carried out simply by inserting between the quartz plateand the platinum anode a pressed pellet of a non-volatile, non-hygro-scopic salt of the ion of interest. In Fig. 3, such a pellet of sodium chlo-ride may be seen in place above the quaftz disc. Ionic diffusion aspecrsof this study will be discussed in a later publication.
DTpBNnBNcE oF THE Rosrsrrvrry oN TrME or,Pessacn or,CuRREN'I'
Of the many factors which determine the resistivity of quartz, thelength of time during which the current flows in the sample is that whichproduces the largest efiect, and which has the most complex relationshipwith the numerical value of the resistivity. For example, passage of cur-rent through a plate oI qttartz for over 500 hours produced an increase inresistivity of 108 ohm-cm.
Whenever a potential is applied to a plate ol quartz a current flowswhich is large at first and diminishes rapidly with time. This currentconsists of four parts, each of which has its own time dependence. Theseare, in the order of their appearance:
(a) the normal dielectric charging current(b) the anomalous charging current(c) the surge current(d) the steady-state direct conduction current

DIRECT CURRENT RESISTIVITV OF QUARTZ 865
(a) The normal dielectric charging current, or displacement current,appears as an instantaneous "kick" of the galvanometer as the capacitorformed by the platinum electrodes, Ieads and switch gear charges. Thiscurrent is generally interpreted as displacement in an applied electricfield either of electrons in the electronic superstructure of ions, or of cat-ions and anions relative to each other in the structure. The relativeimportance of the two types of displacement depends on the frequency ofthe exciting field (Mott and Gurney (1948)).In direct current measure-ments, where the capacitance of the circuit yields a time constant of afraction of a second, this mechanism is of no practical importance.
(6) The anomalous currents are small currents which make their ap-pearance whenever potential is changed, a charging current if the poten-tial is increased, a discharging current if the potential is decreased. Thesecurrents are of short duration, having a relaxation time of the order ofminutes, and are superposed on the currents resulting from other modesof conduction. Hence, when the currents due to other modes of conduc-tion are very small the anomalous currents form a significant part of thetotal current, and the Law of Superposition, as stated by Curie (1889)and generalized by Jacquerod and Mugeli (1922) holds. This law may bestated: "The total quantity of electricity transported by the adomalouscharging current is equal to that transported by the anomalous dis-charge current." This may be stated:
0chareine = [o'Lal:
Oaiscbareine : I r-wt
Q is the quantity of charge in coulombs, I, and Ia are the charging anddischarging currents in amperes, respectively, I is time in secon{s, and ifit is supposed that the circuit is closed at time 0, charging currpnt flowsuntil time I, upon which the potential is removed or shorted out, anddischarge current then flows until time "o. Essentially complete chargeand discharge, as measured with a practical electrometer, is reached in5-15 minutes.
In an effort to isolate the mechanism of conduction responsible for theanomalous charging and discharging currents some experimehts wereundertaken using manually switched square-wave alternating cgrrent atfrequencies ol l/900,1/300 and 1/60 cycles per second.
At the time these experiments were made current had flowed in thetest plate for a total of 108 hours at elevated temperature, so that fur-ther decrease of current during the short period of the tests was negli-gible. The tests were made at 100o C., a temperature at which the directconduction current was too small to measure on the Keithley electrom-eter.
Polarity was reversed every 15 minutes, 5 minutes and 1 rllinute in

866 HENRY E. IVENDEN
0*l
.EE
Frc. 5. Current-time curves for squarewave alternating current at 100o C. Traceddirectly from the Speedomax strip chart.
lO 5 o.p.O, 1g-t0 5 rc
Frc. 6. Current-time curves for anoma-
lous charging and discharging currents at
100' C. Traced directly from the Speedomax
strip chart.
succession, recording several cycles at each frequency. Figure 5 is a trac-ing of the strip chart record for the 1/900 and I/300 cycle/sec frequen-cies. Each half cycle is entirely symmetrical with the half cycles preced-ing and following. The mode of current decay for each half cycle can beclosely approximated by Curie's formula
: Ar,* where ' l : lo' ' i
at loo" c.n : 1 . 4 \
and p is resistivity in ohm-cm, I is time in seconds, and ,4 and z are con-stants for a given temperature.
I{ence, although there is, strictly speaking, no measurable direct cur-rent flowing, if the time I above is small compared to the relaxation timeof 6-7 minutes observed, there will be an alternating current flow that isappreciable due entirely to the anomalous charging current. In this way,the anomalous phenomenon acts to store and return energy into theexternal circuit just as a capacitor does. The question may arise, is thisnot in fact a capacitative effect? The capacitance of the platinum elec-trodes may be computed from the formula for a parallel plate capacitor
DIRECT CURRENT RESISTIVITY OF QUARTZ 867
as 0.7 p.p.fd. with air dielectric (-k::1) for one inch diameter electrodesspaced 0.25 inch apart. But the capacitance of the system required toyield the charging current curve observed may be found from the formula
,C: -o-" - farads
where I is time in seconds, Eo the initial voltage read on the electrometeracross shunting resistor R, and E, the voltage read at t ime l. This formulais valid for capacitors either charging or discharging through a resistor'in this case the entire capacitance of the system discharging through theshunt in the decade box, 1010 ohms. Solving,
c : ---!!-:^ : 96so ppJd.10ro lo& (5.2/1.5)
This capacitance requires a dielectric constant for quartz of 13786.Whereas this is not an impossible value for dielectric constant, it is larger
by a factor of 3000 than the customary value of 4.6 lor the axial dielectricconstant ol quaftz. Furthermore, if similar measurements are made athigher temperature, the value of K required becomes even greater. How-ever, for alternating currents having higher frequencies, over 0.1 cycle
/sec, the mechanism considered here does not operate, as the rise time of
this current is of the order of a few seconds.
Jofi6 (1923) discards the concept of a change of dielectric constant of
this magnitude as implying viscous processes in crystals for which no
evidence exists. Field (1944), following Maxwell 's theory of layered di-
electrics, suggests that such an increase in dielectric constant results from
the accumulation of charge carriers, either ions or electrons, at domain
interfaces and submicroscopic defects in the Iattice, constituting a rever-
sible polarization which he terms interfacial polarization.Field (194a) points out that if we consider the dielectric constant for
optical frequencies, which is equal to the square of the index of refrac-
tion, as the result of electronic polarization and come down the scale of
frequency, each new type of polarization encountered will produce an
increase in the dielectric constant. Each type of polarization has associ-
ated with it a relaxation time T at which the polarization is within 1/e
of completion, and a relaxation frequency/- connected with the relaxa-
tion time T by the equation
at which frequency the loss factor has a maximum value. Entering this
equation with values of T derived from the experiments described we
find values tor f*in the range 0.01-0.001 cycle for the anomalous cur-
rents.
1t* -
2oT
868 EENRV E, WENDEN
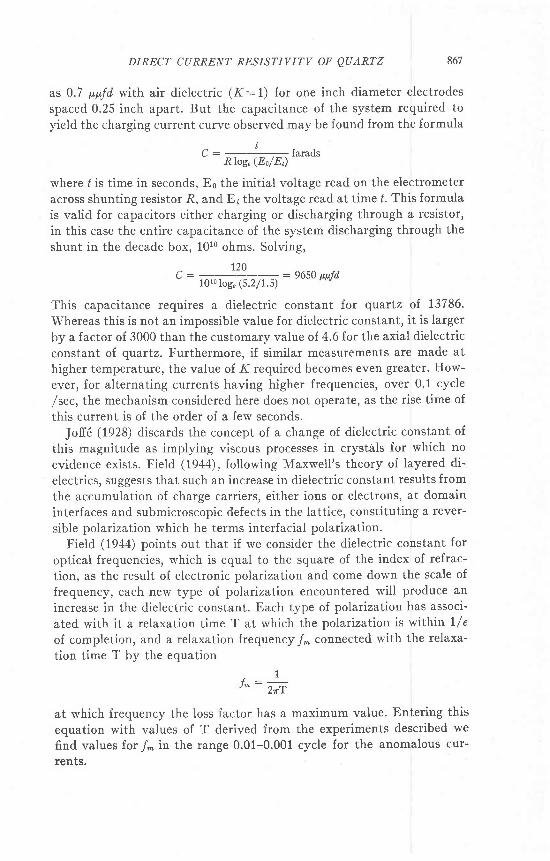
In the case of quartz, the mean dielectric constant for optical frequen-cies is about 2.4. For radio frequencies, the mean dielectric constant isabout 4.6 for all frequencies from power to UHF. Ilence, a relaxationfrequency must lie somewhere in the microwave-infrared region, associ-ated with the excitation of a new type of polarization, probably ionicdisplacement of lattice ions. We have just seen that there is evidence foranother increase in dielectric constant in the 0.01-0.001 cycle/sec region.This increase must reflect the appearance of still another type of polari-zation. Field (1944) and Nlurphy and Morgan (1937) consider this to beinterfacial polarization in the case of various commercial ceramic dielec-tric materials. Figure 7 shows the behavior of the dielectric constant andloss factor of qtartz with frequency.
Intcefadrc(
Iorrlo dl+laccnenfElcrr'trall,ie.
tsThenlrlrt
Freglancg (egelo/sce)
Frc. 7. Dielectric constant and loss factor of quartz over a wide range of frequency.
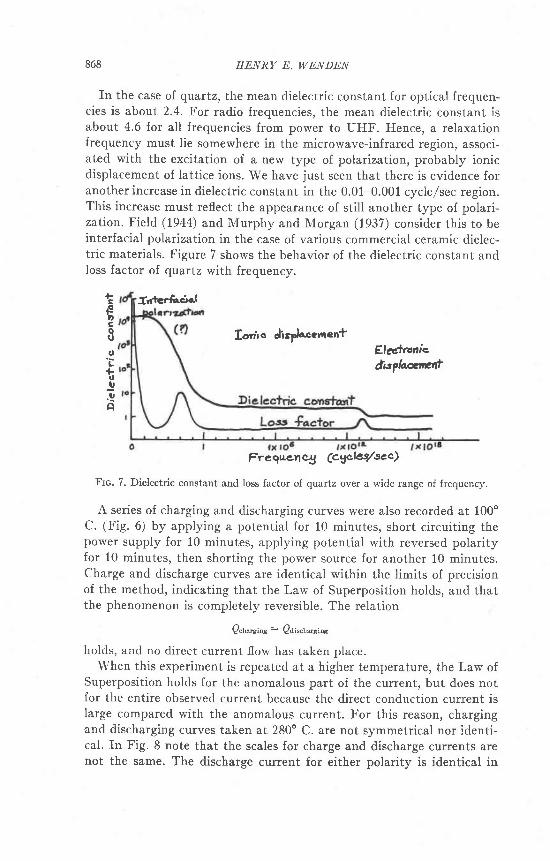
A series of charging and discharging curves were also recorded at 100oC. (Fig. 6) by applying a potential for 10 minutes, short circuiting thepower supply for 10 minutes, applying potential with reversed polarityfor 10 minutes, then shorting the power source for another 10 minutes.Charge and discharge curves are identical within the limits of precisionof the method, indicating that the Law of Superposition holds, and thatthe phenomenon is completely reversible. The relation
Ol."gioe : Odisehoreing
holcls, and no direct current f low has taken place.When this experiment is repeated at a higher temperature, the Law of
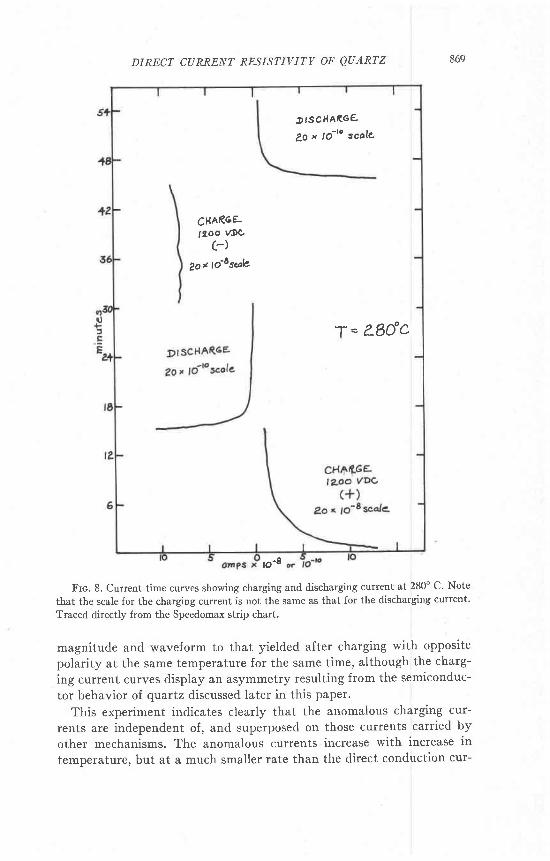
Superposition holds for the anomalous part of the current, but does notfor the entire observed current because the direct conduction current islarge compared with the anomalous current. For this reason, chargingand discharging curves taken at 280' C. are not symmetrical nor identi-cal. In Fig. 8 note that the scales for charge and discharge currents arenot the same. The discharge current for either polarity is identical in
.,-s€o
oU
oL+rJr,.gA
DIRECT CT]RRENT RESISTIVITY OF QUARTZ 869
Frc. 8. Current-time curves showing charging and discharging current at 280" C. Note
that the scale for the charging current is not the same as that for the discha(ging current.
Traced directly from the Speedomax strip chart.
magnitude and waveform to that yielded after charging with opposite
polarity at the same temperature for the same time, although the charg-
ing current curves display an asymmetry resulting from the sqmiconduc-
tor behavior of quartz discussed later in this paper.
This experiment indicates clearly that the anomalous charging cur-
rents are independent of, and superposed on those currents carried by
other mechanisms. The anomalous currents increase with increase in
temperature, but at a much smaller rate than the direct conduction cur-
.DrscHAR6g
2o x !o-'o scale
cHAR6'L,2oo w9
c-)2o* tdascob
T = ?1O"c
p-8
870 HENRY E. WENDEN
rent. When the temperature was increased from 100" C. to 280. C. inthe preceding experiment, the increase in peak value of charging currentwas only about 0.3 per cent of the increase in direct conduction current.Thus, the anomalous currents seem to be present at all temperaturesbut relatively insensitive to temperature changes. They probably con-tribute little to the net conduction. They are not a significant source oferror in measurements of resistivity unless the current is read within afew minutes after application of potential. We may consider that thesecurrents are caused by displacement of non-lattice ionic and possibleelectronic charge carriers, and that the decay of the charging current isthe result of the reversible trapping of charge carriers at domain inter-faces and Iattice imperfections. The discharge current is the result ofequalization of distribution of charges after the removal of the excitingpotential. Sarzhevskii (1952) has shown that free electrons exist in quartzat temperatures below 300" C. and these may play a part in the anoma-lous currents at these temperatures, but the dominant role of cationsseems to be established by Joff6's (t928) observation that the density ofthe space charges which appear in quartz in an electric field is alwaysgreatest near the cathode, regardless of polarity.
(c) The third part of the current is one which constitutes the largestpart of the total current for several hours after application of potential,and which because of its behavior I shall call surge current. Upon appli-cation oI e.m.f . for the first time at any given temperature, current risesrapidly to a maximum, reaching peak value in less than three minutes,and in many cases in less than one second. Thereafter, current decreaseswith passage of time.
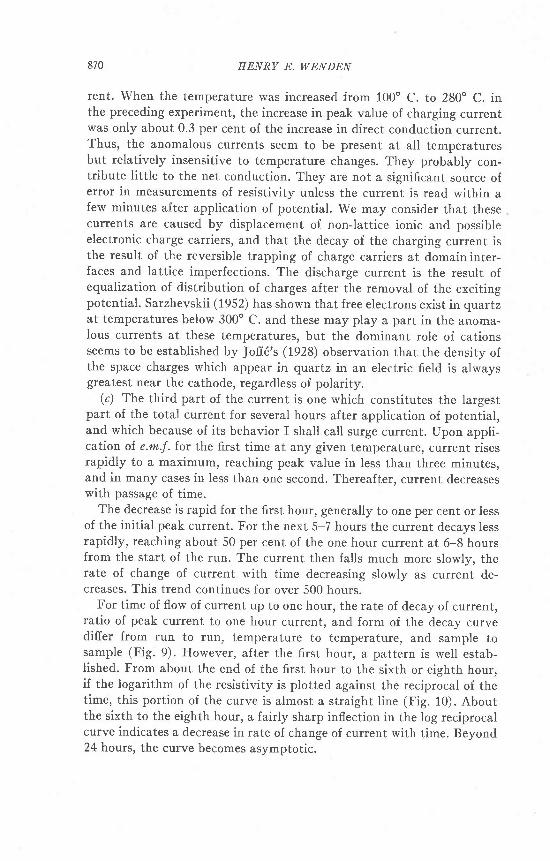
The decrease is rapid for the first hour, generally to one per cent or lessof the initial peak current. For the next 5-7 hours the current decays lessrapidly, reaching about 50 per cent of the one hour current at 6-8 hoursfrom the start of the run. The current then falls much more slowly, therate of change of current with time decreasing slowly as current de-creases. This trend continues for over 500 hours.
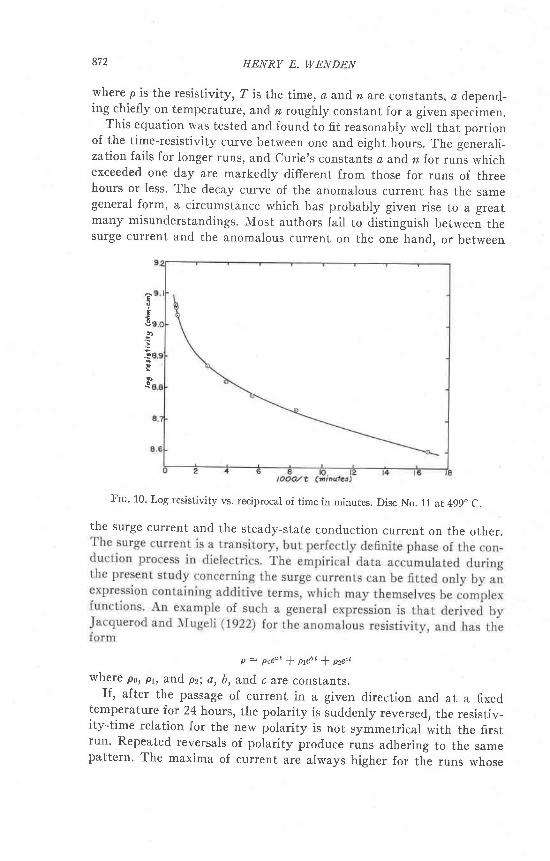
For time of flow of current up to one hour, the rate of decay of current,ratio of peak current to one hour current, and form of the decay curvediffer from run to run, temperature to temperature, and sample tosample (Fig.9). However, after the first hour, a pattern is well estab-lished. From about the end of the first hour to the sixth or eighth hour,if the logarithm of the resistivity is plotted against the reciprocal of thetime, this portion of the curve is almost a straight l ine (Fig. 10). Aboutthe sixth to the eighth hour, a fairly sharp inflection in the log reciprocalcurve indicates a decrease in rate of change of current with time. Beyond24 hours, the curve becomes asymptotic.
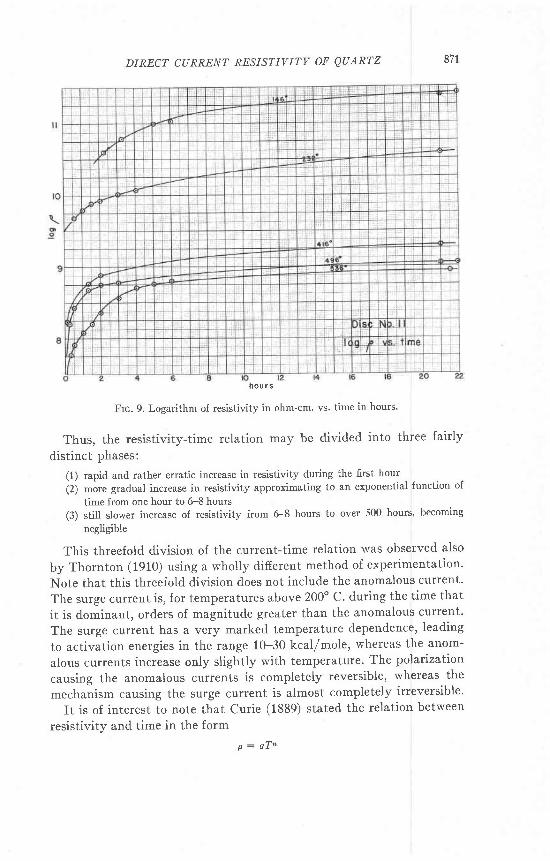
DIRECT CLTRRENT RESISTIVITY OF QUARTZ 871
nou r s
Ftc. 9. Logarithm ol resistivity in ohm-cm' vs. time in hours'
Thus, the resistivity-time relation may be divided into three fairly
distinct phases:
(1) rapid and rather erratic increase in resistivity during the first hour
(2) more gradual increase in resistivity approximating to an exponentiai function oi
time from one hour to 6-8 hours
(3) still slower increase of resistivity from 6-8 hours to over 500 hours, becoming
negligible
This threefold division of the current-time relation was observed also
by Thornton (1910) using a wholly different method of experimentation.
Note that this threefold division does not include the anomalous current'
The surge current is, for temperatures above 200o C. during the time that
it is d.ominant, orders of magnitude greater than the anomalous current.
The surge current has a very marked temperature dependence, Ieading
to activation energies in the range 10-30 kcal/mole, whereas the anom-
alous currents increase only slightly with temperature. The polarization
causing the anomalous currents is completely reversible, whereas the
mechanism causing the surge current is almost completely irreversible.
It is of interest to note that Curie (1889) stated the relation between
resistivity and time in the form
p : o T "
872 EENRY E. IryENDEN
where p is the resistivity, T is the time, a and. n are constants, a depend-ing chiefly on temperature, and n roughly constant for a given specimen.
This equation was tested and found to fit reasonably well that portionof the time-resistivity curve between one and eight hours. The generali-zation fails for longer runs, and curie's constants a and, n for runs whichexceeded one day are markedly difierent from those for runs of threehours or less. The decay curve of the anomalous current has the samegeneral form, a circumstance which has probably given rise to a greatmany misunderstandings. Most authors {ail to distinguish between thesurge current and the anomalous current on the one hand, or between
Frc' 10. Log resistivity vs. reciprocal of time in minutes. Disc No. n at 499" c.
the surge current and the steady-state conduction current on the other.
p : p o € a t * p t e b t l p z e ' t
where p6, pr, and pz., a, b, and c are constants.rf, after the passage of current in a given direction and at a fixed
temperature for 24 hours, the polarity is suddenly reversed, the resistiv-ity-time relation for the new polarity is not symmetricar with the firstrun. Repeated reversals of polarity produce runs adhering to the samepattern. The maxima of current are always higher for the runs whose
t
Et .t,:.31Poo .
DIRECT CURRENT RESISTIVITY OF QUARTZ 873
polarity corresponds with that first selected, and the time of rise to maxi-mum is shorter, whereas for all subsequent runs on the opposite polarity,alternating with those of the first polarity, the maxima are lower and therise times longer. In all cases, after less than four hours, these initialeffects have disappeared and current declines slowly, the absolute valuedepending only on the total time elapsed since the beginning of the firstrun, and not on polarity or sequence of polarity changes. Table 2 gives
current and time values for two temoeratures.
TtrLn 2. Polennv SnNsrrrvn Ellncrs rN Er,nctucal
CoNnucrrou rN Qunnrz
Polarity
3'7 x 10- '3 .1X10-48 ' 3 x 1 0 n2 .0x10 -4
4 1 x 1 0 - 32 ' 8 x 1 0 - n1 . 0 x 1 0 3
2 ' 5 x 1 o - n
Temp(" c.)
24-hour current(amps/
5'o x lo-u3 8x10-u3.2x 10-62 . 5 x 1 0 6
8 '3 x 1o-u7 . 8 x 1 0 - 66. 3 x 10-65 '2 x 10-u
This simply means that quartz, for the short-term surge current, be-haves as a semiconductor, in which the first application of potential de-termines the polarity of the forward, or easy, direction of conduction, sothat the magnitude of the current flowing at any time thereafter dependsnot only on the potential and the temperature, but also on the directionof f low.
Up to the current maximum and for a few hours thereafter the domi-nant mechanism of conduction is one whose activation energy is low andvaries from sample to sample. While this mechanism dominates, thesample may show semiconductor characteristics. After the disappearancein 4-8 hours of polarity sensitive efiects, the conduction is dominated bya mechanism of higher energy of activation which operates progressively,so that current becomes a function only of total time of passage of cur-rent for a given temperature and potential.
This large initial current, the surge current, is almost certainly attrib-utable to the mobilization of non-lattice impurity ions acting as chargecarriers. These may, upon continued maintenance of an electric field,become irreversibll' trapped in lattice defects or migrate to the surfaceof the test sample and there plate out, so as to become unavailable forfurther transfer of charges. At any given temperature, the trapping and
418 123i
I23A

874 EENRY E. WENDEN
exclusion of ionic carriers at the surface of the plate or in lattice defectsduring the initial current surge introduces a polarity-sensitive or semi-conductor behavior apparent in all later runs at that temperature. Thecarriers involved in this mechanism are those impurity ions most favor-ably placed to participate immediately in conduction with a low energyof activation. As these become exhausted by irreversible trapping orremoval, the initial surge current decays, giving way to the more slowlydecreasing current (long-term surge current) carried by interstitial im-purity ions less favorably placed for conduction. These latter ions prob-ably move through the celebrated "tunnels" or "pores" parallel to thec axis, whereas the ions contributing to the early surge current may belocated along domain boundaries, growth lines or other imperfectionsand hence are less firmly bound.
The reality of this process of exclusion and plating out of impurity ionsis attested by the visible deposit of salts found at the cathode surface ofevery plate of natural qvartz that underwent a long resistivity run. AI-though too scanty for analysis, these cathode deposits yield a qualitativetest for sodium, and Verhoogen (1952) describes the collection of detect-able amounts of boron at the cathode after measurement of an Arizonaqtartz crystal. ff such a plate is cleaned and rerun at a later time, theresistivity remains high and surge current efiects are much less markedthan during the first run.
(d) The fourth part of the current is the long-term, steady-state cur-rent which becomes manifest only after the disappearance of the short-term efiects. Decay of the masking impurity ion currents seems to becomplete at 1200 hours, and may in some cases, be complete at 500.
Mott and Gurney (1948) suggest that this current may be due, at thehigher temperatures, to mobilization of all the ions in a crystal, or all theions of one sign. Demonstration of the electrolysis oI quartz is difficult,since the total amount of sil icon that would be Iiberated by a current of10X 10-6 amperes is
rt(7.0r): 6.3 X 10⁻⁶ gms./day
Slightly more than half as much oxygen would be produced. At the ratecomputed more than three months would be required to accumulate 6mg. of silicon at the cathode. The current postulated above is approxi-mately that which would flow through a one-quarter inch plate of quartzat a potential of 1500 volts during a lengthy run. Electrolytic dissociationof the quartz could certainly account for the observed currents withoutvisible deterioration of the plate. It may well be, however, that only oxy-gen ions, or oxygen ions and holes, are mobile.
DIRECT CURRENT RESISTIVITV OF QUARTZ
sarzhevskii (1952) has shown by the absence of the Hall magnetoresis-
tance effect above 300o C. that the conductivity is primarily iqnic above
that temperature. The number of free conduction electrons bblow 300'
C., where a Hall effect was noted, is 10 to 105 electrons/cm3. This small
number indicates that the conductivity ol quattz at all tempqratures is
predominantly ionic. Sarzhevskii's work was done on equatorial plates,
and consequently the conductivity he discusses is chiefly the characteris-
tic, or steady-state, conductivity, since short-term surge current efiects
are much less marked in equatorial plates.The question of the ability of impurity ions to carry the current ob-
served to flow up to the point where the steady-state mechanism be-
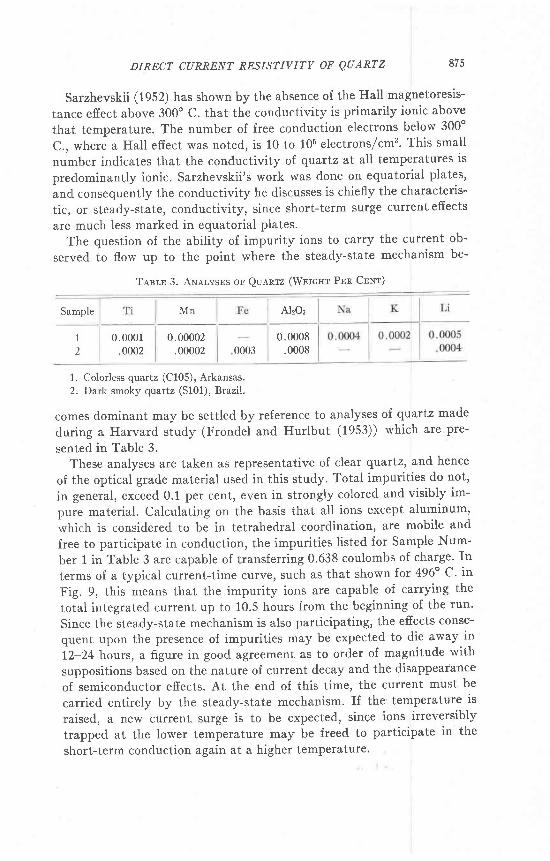
Tanr-r,3. ANs-vsns or Quentz (Wnrcur Prn CnNr)
6 / 5
Sample
0.0001.0002
0.00002.00002
Alzo:
0.0008.0008
Mn
;l 0003
1. Colorless quartz (C105), Arkansas.2. Dark smoky quartz (5101), Brazil.
comes dominant may be settled by reference to analyses of qUartz made
during a Harvard study (Frondel and Hurlbut (1953)) which are pre-
sented in Table 3.These analyses are taken as representative of clear qtattz, and hence
of the optical grade material used in this study. Total impurities do not,
in general, exceed 0.1 per cent, even in strongly colored and visibly im-
pure material. Calculating on the basis that all ions except aluminum,
which is considered to be in tetrahedral coordination, are rnobile and
free to participate in conduction, the impurities listed for Sample Nurn-
ber 1 in Tabte 3 are capable of transferring 0.638 coulombs of charge. In
terms of a typical current-time curve, such as that shown for 496" C. in
Fig. 9, this means that the impurity ions are capable of carrying the
total integrated current up to 10.5 hours from the beginning of the run'
Since the steady-state mechanism is also participating, the effects conse-
quent upon the presence of impurities may be expected to die away in
i2-24 houtr, a figure in good agreement as to order of magiritude with
suppositions based on the nature of current decay and the disappearance
of semiconductor efiects. At the end of this time, the current must be
carried entirely by the steady-state mechanism. If the terriperature is
raised, a new current, surge is to be expected, since ions irreversibly
trapped, at the lower temperature may be freed to participate in the
short-term conduction again at a higher temperature.
876 HENRY E. WENDEN
Even if we assume a figure for the total mobile impurities ten timesgreater than that given by analyses I and 2, the capacity of these im-purity ions to transfer charges could sti l l be exhausted within the dura-tion of the runs made in this study. Since Sarzhevskii 's work seems to in-dicate that this current cannot be electronic, we are forced to the conclu-sion that the long term, steady-state current must arise from electrolysisof the quartz itself.
V.crrerroN on RBsrsrrvrry wrrrr TBupnnnrunB
Perhaps the most fruitful approach to the mechanism of conduction inqraftz is through variation of resistivity with temperature. In thisstudy, the upper l imit of temperature rvas arbitrari ly set at about 540o C.The resistivity of high qrartz was not considered. The lower rimit wasset by the sensitivity of the electrometer at about 25o C.
The chief problem in studying the variation of resistivity with tem-perature is the separation of the effects of temperature from the effectsof elapsed time and applied potential.
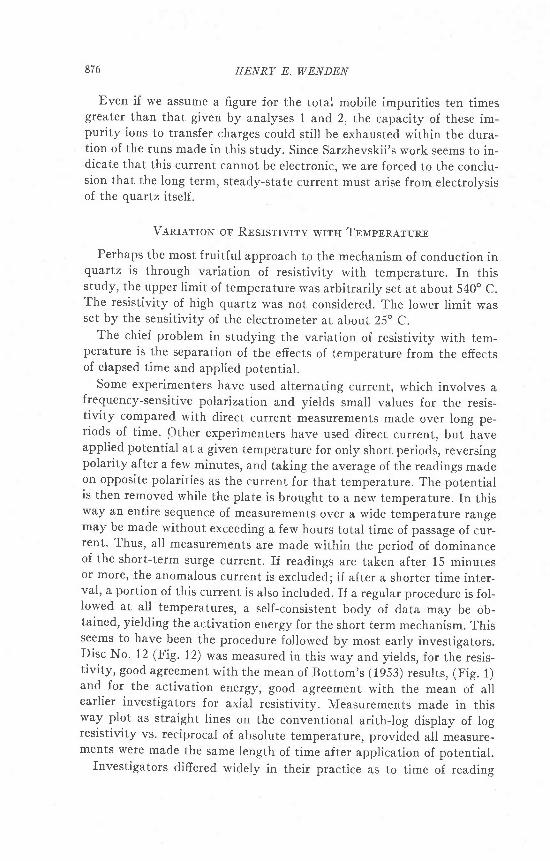
Some experimenters have used alternating current, which involves afrequency-sensitive polarization and yields small varues for the resis-tivity compared with direct current measurements made over long pe-riods of t ime. other experimenters have used direct current, but haveapplied potential at a given temperature for only short periods, reversingpolarity after a few minutes, and taking the average of the readings madeon opposite polarit ies as the current for that temperature. The potentialis then removed while the plate is brought to a new temperature. rn thisway an entire sequence of measurements over a wide temperature rangemay be made without exceeding a few hours total t ime of passage of cur-rent. Thus, all measurements are made within the period of dominanceof the short-term surge current. rf readings are taken after 15 minutesor more, the anomalous current is excluded; if after a shorter t ime inter-val, a portion of this current is also included. rf a regular procedure is fol-lowed at all temperatures, a self-consistent body of data may be ob-tained, yielding the activation energy for the short term mechanism. Thisseems to have been the procedure followed by most early investigators.Disc No. 12 (Fig. 12) was measured in this way and yields, for the resis-tivity, good agreement with the mean of Bottom's (1953) results, (Fig. 1)and for the activation energy, good agreement with the mean of ailearlier investigators for axial resistivity. N{easurements made in thisway plot as straight lines on the conventional arith-log display of logresistivity vs. reciprocal of absolute temperature, provided all measure-ments were made the same length of t ime after application of potential.
Investigators differed widely in their practice as to time of reading
DIRECT CURRENT RESISTIVITY OF QUARTZ 877
current after application of potential. Curie (1889) recommended oneminute, F. Braun suggested 24 hours. Others have attempted to read in-stantaneous peak current at the moment of application of potential.Strauss (1955) read current every minute, reversing polarity every 20minutes, while increasing temperature uniformly. Other invqstigatorsmaintain potential at all times and cycle temperature, reading currentwhenever thermal equilibrium is established. Unless current is first al-lowed to pass through the test plate for a period of hundreds of hours,measurements of this kind result in an inextricable mingling of the effectsof temperature and time. Such measurements plot on the log rpsistivityvs. reciprocal temperature graph as curved rather than straight lines.
The principal reason for the diversity of results and lack of agreementamong these investigators lies in the different methods of dealing withthe factor of time.
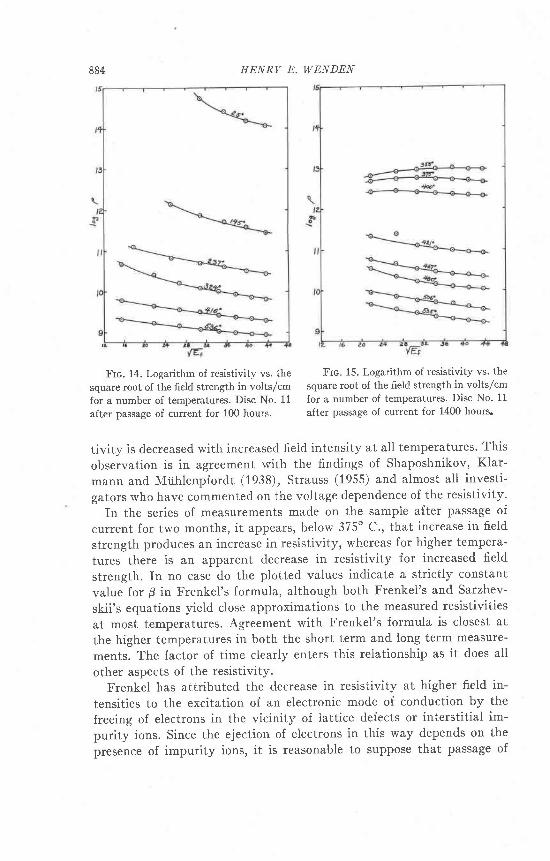
In order to separate the effects of temperature and time it is necessaryto allow current to pass through the plate until further changes of cur-rent with time are negligible. The temperature may then be cycled withpotential continuously applied, and measurements of current madewhenever thermal equilibrium is reached. A total of 70 current rneasure-ments was made on one such plate (Disc No. 11) through which currenthad been passed for over 500 hours.
A plot of these 70 points (Fig. 11) reveals two straight l ine segmentsjoined at an inflection point at about 350o C. This test plate, throughwhich current had been passed with positive polarity for nearly 600hours, was removed from the furnace for about four weeks. It was thenthoroughly cleaned and reassembled in the furnace with clean platinumelectrodes. A new series of measurernents was then made with negativepolarity from 26" C. to 525o C. The values of resistivity obtained were inclose agreement with the earlier values, but were slightly highen. A finalseries of measurements were taken on this plate after the total cumula-tive time reached 1400 hours (Fig. 11). This series is best represented asa straight line without inflections on the log resistivity-reciprocal tem-perature plot.
The overall tendency in this last experiment was to straighteh out theresistivity temperature curve, and increase all values of resistivity. Thisindicates tl'at quartz which has been electrically treated does not regainits initial conductivity by standing for a time comparable with the timeof passage of current, as claimed by Curie (1889). Both high and lowtemperature portions of this curve move toward higher resistivity withtime. The low temperature branch changes somewhat in slope withpassage of time and the inflection appears to migrate to lower tempera-tures, finally disappearing, whereas the high temperature portion movesmore nearly parallel to itself.
878 HENRY E. WENDEN
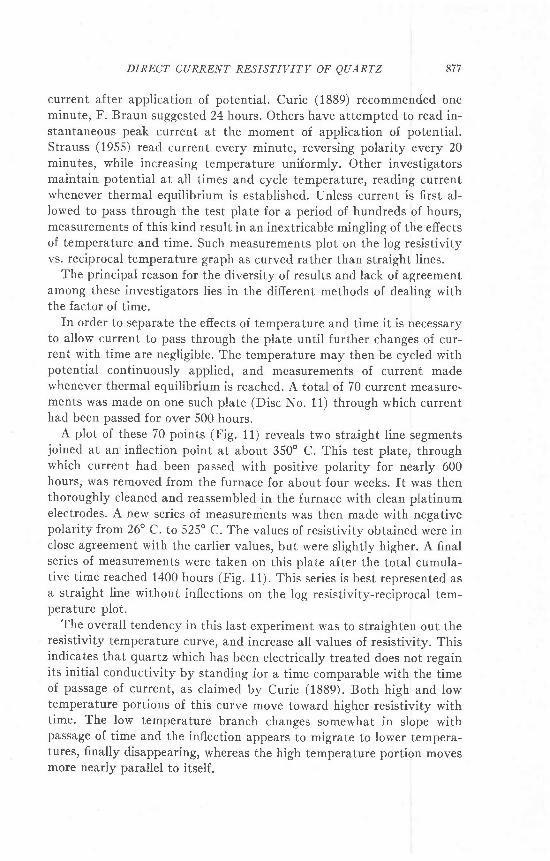
The work of King (1955, 1956) has strikingly confirmed these findings.In King's experiments the factor of time has been effectively separatedfrom that of temperature, following Wenden (1955), by passing currentthrough the plate for a period of weeks before making measurements.Accordingly, his results are directly comparable with those reported here,
Frc. 11. Logarithm of resistivity vs. reciprocal of absolute temperature for Discs 8 and9, 10, and Disc No. 11 after passage of current for 550 hours, and again after passage ofcurrent for 1200 hours. See Table 5a for identification of disc numbers. AII are Z-cut discsof natural quartz.
and afford excellent numerical agreement both as to absolute resistivityand activation energy (Fig. 12 and Table 5). Since King's observationsembody some at temperatures lower than were possible with the Keith-ley electrometer, they extend the results of this study in a most interest-ing way. ft appears that the knee, or inflection point of the two-branchedcurve described above does not disappear with continued passage of cur-rent, but migrates to lower and lower temperatures. I{ence, we may con-ceive of a family of curves resulting from a series of measurements ofresistivity at different times during a very long run like those shown inFig. 13.
Considering separately the two portions of the two-branched curveobtained after three weeks (Disc No. 11, Fig. 11), it is found thateachmay be represented within the limits of error of the method by an expres-sion having the form
DIRECT CURRENT: RESISTIVITY OF QUARTZ
Fto.12. Log resistivity vs. reciprocal temperature. Discs 11, 12 and 13 ate Z-cnt,
Disc No. 6 is inclined 51"40' and Disc No. 15 is X-cut. Discs No. 13 and 15 were run with
NaCl anodes. Discs 11 and 6 passed current for 1400 and 2000 hours, Disc No. 12 for
about 3| hours. King's (1956) curve for natural quartz is included for comparison.
py : lrsu rlnr
If T is given values lying betweel 298o and 623" K., p1 is the resistivityover that range of temperature, t/1 is the activation energy of the domi-nant mechanism of conduction over that range, R is the molar gas con-stant equal approximately to 2.0, and Ar is a constant which fixes theabsolute values of resistivity. Similarly, for the upper branch of the curve
P2 : lrguzlRT
where the symbols have the same meaning as before except that 7 hasvalues between 623" and 809o K., and pz, (Jzand AzapPlY to this tem-perature range.
Calculation of the constants from the measured values of resistivity
vield
879
Temperalwe Range298'423" K.623'-809'K.
U26.O kcal./mole34.0 kcal./mole
A910
1 . 4 7
Calculation of the activation energy from the values of resistivitymeasured after passage of current for over eight weeks yields only one
e

880 HENRY E. WENDEN
value, which afiords a good fit for all observations recorded. The inflec-tion point present in the earlier observations made on this same samplehas migrated to lower temperature, beyond the range of sensitivity of theelectrometer.
Temperature Range279"-808" K.
U39.5 kcal./mole
A
24 .55
The activation energy [/ is notably higher, reflecting an increase inslope for the curve as a whole.
Nlany experimenters have found that similar expressions may be usedto represent the conductivity of ionic crystals (l{ott and Gurney (1948),pp. 36-63; Jost (1952), pp. 179-197). Two-branched curves, the highertemperature branch having the greater activation energy, have beenobserved in NaCl, LiCl, LiF, KBr and most of the other alkali halides,and also in PbIz and other salts of lead, silver and copper. These curvesare represented by Smekal, Lehfeldt and Seith by formulas having theform
d :A& :u lnT*Aze -uz ln r
consisting of additive terms of exponential form, where the symbols ,4,(J, R, etc., have the same meaning as in the discussion immediately pre-ceding, and o is the conductivity.
Interpretation of these terms is varied. Smekal considers the first term(in NaCl) to correspond to conduction by surface particles, whereas thesecond represents electrolytic conduction in the normal lattice. Seith in-terprets the first term in Pbfz as the conductivity of the Pb ions, and thesecond term as the conductivity due to the I ions. Jost suggests the firstterm may represent the influence of interstitial impurity ions, whereasthe second term reflects the "correct conductivity" of the crystal. Mottand Gurney, in commenting on Smekal's results for NaCI, reject Smekal'sinterpretation of the first term as surface conductivity, and remark that(p. 39) : "Clearly the first term gives the conductivity due to a small num-ber of ions in special places, which can be released easily, while the secondterm is that due to a large number; all the ions in the crystal, or all theions of one sign, which can only be released with greater difficulty.,, Mottand Gurney refer to the first term as the "structure-sensitive" part of theconductivity.
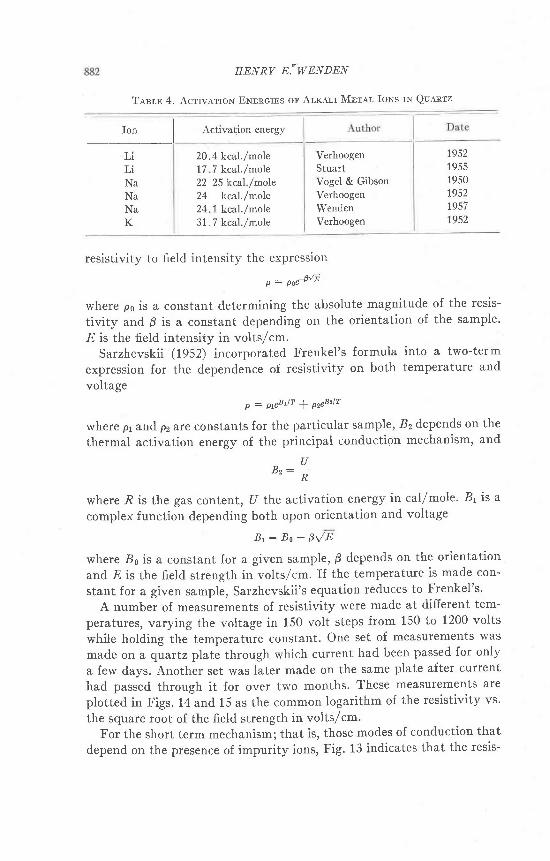
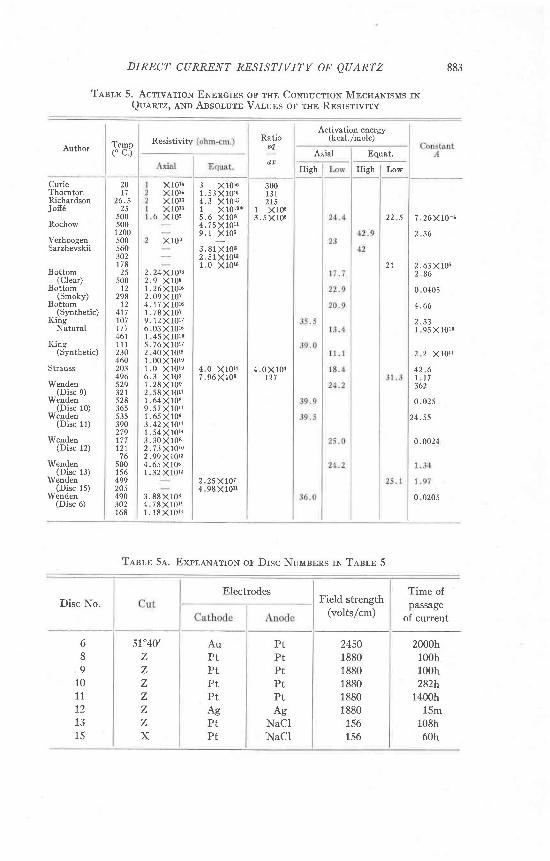
The calculated activation energy for the low temperature mechanismin Disc No. 11 above, and the activation energy for Disc No. 12, whichwas measured so as to obtain the activation energy of the short termmechanism, are both very close to that found for the diffusion of alkalimetal ions in quartz (Tables 4 and 5). Table 5 shows, for purposes ofcomparison, the activation energies for conduction mechanisms in quartz.
DIRECT CURRENT RESISTIVITY OF QUARTZ 881
There is, in the data presented in Tables 4 and 5, a very strong sugges-tion that all investigators prior to Wenden (195S) and King (1955, 1956)have been measuring, not the axial resistivity of quartz, but the mo-bility in quartz of impurity ionsl from the activation energies reported,probably a lka l i meta l ions.
Activation energies and absolute magnitudes both suggest that theequatorial resistivities of earlier workers were more nearly a measure ofthe actual resistivity of pure quartz, b*t the wide spread to be found inthe published results, coupled with experimental evidence from thisstudy (Fig. 12), indicate that ionic difiusion and lattice defects influencethe equatorial resistivity as well. Compare curves for Discs 13 and 15.
VorrecB DrpnNooNcn ol Rpsrsrrvrry
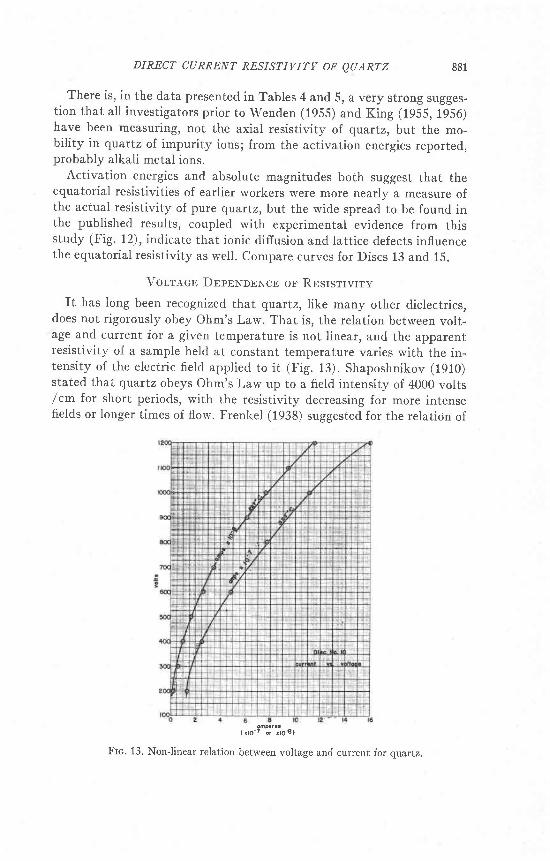
ft has long been recognized that quartz, like many other dielectrics,does not rigorously obey Ohm's Law. That is, the relation between volt-age and current for a given temperature is not linear, and the apparentresistivity of a sample held at constant temperature varies with the in-tensity of the electric f ield applied to it (Fig. 13). Shaposhnikov (1910)stated that quartz obeys Ohm's Law up to a fi.eld intensity of 4000 volts/cm for short periods, with the resistivity decreasing for more intensefields or longer times of flow. Frenkel (193s) suggested for the relation of
t ,'o-9'0"?'"rto-tr
Frc. 13. Nonlinear relation between voltage and current for quartz.
HENRY E.*WENDEN
Tasrr 4. Acnvettox Emnncrns ol An,ltr Mnr.tl IoNs rN QUARTZ
___11 __LiLi
NaNaNaK
Activation energy
20.4 kcal . /mole77 7 kcal./mo\e22-25 kcal./mole24 kcal./mole24.l kcal./mole31 .7 kcal . /mole
VerhoogenStuartVogel & Gibson
VerhoogenWendenVerhoogen
19521 95519501952t9577952
resistivity to field intensity the expression
p : po69JE
where ps is a constant determining the absolute magnitude of the resis-
tivity and B is a constant depending on the orientation of the sample.
E is the f ie ld in tensi ty in vol ts /cm.Sarzhevskii (1952) incorporated Frenkel's formula into a two-term
expression for the dependence of resislivity on both temperature and
voltage
p : p l e B r l r l p z e B r l r
where p1 and p2 are constants for the particular sample, 82 depends on the
thermal activation energy of the principal conduction mechanism, and
where R is the gas content, [/ the activation energy in cal/mole' 81 is a
complex function depending both upon orientation and voltage
B r : B o - B f E
where Bs is a constant for a given sample, B depends on the orientation
and -E is the field strength in volts/cm. If the temperature is made con-
stant for a given sample, sarzhevskii's equation reduces to Frenkel's.
A number of measurements of resistivity were made at difierent tem-
peratures, varying the voltage in 150 volt steps from 150 to 1200 volts
while holding the temperature constant. One set of measurements was
made on a qvaftz plate through which current. had been passed for only
a few days. Another set was later made on the same plate after current
had passed through it for over two months. These measurements are
plotted in Figs. 14 and 15 as the common logarithm of the resistivity vs.
the square root of the field strength in volts/cm.For the short term mechanism; that is, those modes of conduction that
depend on the presence of impurity ions, Fig. 13 indicates that the resis-
U- R
DIRECT CURRENT RESISTIVITY OF QUARTZ
Taet,n 5. Acrrvetrorq Exnncrrs or rnr Coxoucrror MncraNrsus rNQulnrz, ar.ro Assolutn Var-urs ol rrrn Rnsrsrtvrry
883
Ratioeq
&fi
4 0 x10u7 .96X108
2.24X-I0tt2.9 X-t051 .26 X 10162 .09 X 10?4. 17 X 10161 . 7 8 X 1 0 79. 12 X 101?6 03X10161 45 X10M5 .76 X 10 f2 40X10s1 0 0 x 1 0 r 01 . 0 x 1 0 1 06 . 3 X 1 0 61 . 2 8 X 1 0 e2 58X10u1.64X 10e9. 57 X 10u1 .65 X 10 '3 .42 X101r1 .54 X10143 . 3 0 X 1 0 82.73X10r02.99X10124.65 X 106l.32X1Ot2
Tempe c )
20t 7
26.52 5
500500120050056030217825
5001 2
2981 2
4171071774611 1 123046020349652932r528365s35390279177121,16
5001 5 6499205490302168
ResistivityActivation energy
(kcal./mole)Author
Axial Equat.
High High Low
x1014x10r4x10r3x1013
6 X10 '
x 1 0 0
3 . 8 8 X 1 0 84 78X10 i l1 . 1 8 X 1 0 b
3 X 10161 .53 X 10164.3 X10151 1 16re*5 . 6 X 1 0 84. 75 X 10119 . 1 X i 0 5
3 . 8 1 X 1 0 82 5 1 X 1 0 81 0 x1016
2.25X1074 98X10t r
3001 3 1215
1 X1063 . 5 X 1 0 6 2 2 5
2 l
7.26X10⁻⁴
2 3 6
2.63X1052 . 8 6
0 0405
4 . 6 6
t l ?
t 95x to to
X lott
4 . 0 x 1 0 4L27
2 2
4 2 61 t 7362
0 . 0 2 5
2 4 . 5 5
0.0024
0 0205
CurieThorntonRichardsonJoff6
Rochow
VerhoogenSarzhevskii
Bottom(CIear)
Bottom(Smoky)
Bottom(S1ntI etic)
KingNatural
King(Synthetic)
Strauss
Wenden(Disc 9)
Wenden(Disc 10)
Wenden(Disc 11)
Wenden(Disc 12)
Wenden(Disc 13)
Wenden(Disc 15)
Wenden(Disc 6)
T,tsra 5e. Expr,ellerrox or Drsc NuMsnns rN TABLE 5
ElectrodesField strength
(volts/cm)
245018801880188018801880156156
Time ofpasvrge
of current
Disc No.
o
8o
101 1t213I J
51'40',ZZZZZZX
PtPtPtPtPtAg
NaClNaCl
2000h100h100h282h
1400h15m
108h60h
AuP +
PtPtPtAgPtPt
884 IIENRY E. WENDEN
Frc. 14. Logarithm of resistivity vs. the
square root of the field strength in volts/cm
for a number of temperatures. Disc No. 11
after passage of current for 100 hours.
Frc. 15. Logarithm of resistivity vs. the
square root of the field strength in volts/cm
for a number of temperatures. Disc No. 11
after passage of current for 1400 hours.
tivity is decreased with increased heid intensity at all temperatures. This
observation is in agreement with the findings of Shaposhnikov, KIar-
mann and \,I i ihlenpfordt (1938), Strauss (1955) and almost all investi-
gators who have commented on the voltage dependence of the resistivity.
In the series of measurements made on the sample after passage of
current for two months, it appears, below 375" C., that increase in field
strength produces an increase in resistivity, whereas for higher tempera-
tures there is an apparent decrease in resistivity for increased field
strength. In no case do the plotted values indicate a strictly constant
value for B in Frenkel's formula, although both Frenkel's and Sarzhev-
skii's equations yield close approximations to the measured resistivities
at most temperatures. Agreement with Frenkel's formula is closest at
the higher temperatures in both the short term and long term measure-
ments. The factor of time clearly enters this relationship as it does all
other aspects of the resistivity.Frenkel has attributed the decrease in resistivity at higher field in-
tensities to the excitation of an electronic mode of conduction by the
freeing of electrons in the vicinity of lattice defects or interstitial im-
purity ions. Since the ejection of electrons in this way depends on the
presence of impurity ions, it is reasonable to suppose that passage of
DIRECT CURRENT RESISTIVITY OIi QUARTZ 885
current for long periods of t ime, reducing the number of such ions, maywell produce the observed diminution or reversal of the effect of in-creased field strength.
Venrerrow ol Rnsrsrrvrry wrru Cnysrer,rocRApHrc OnrnNrarrox
One of the most frequently repeated statements concerning the resis-tivity of qvartz is that the axial resistivity is thousands of times smallerthan the equatorial resistivity. This statement is, however, true only foraxial resistivit ies that have been measured a short t ime after the applica-tion of potential, and which measure the mobil ity of impurity ions ratherthan the resistivity oI quartz. The facts seem to indicate that when themeasuring potential has been applied for a sufficiently long time the axialresistivity increases to the same order of magnitude as the equatorialresistivity. Figure 12 shows this clearly. Disc No. 12, as explainedabove, was deliberatelv measured in such a way as to obtain the valuesof resistivity and activation energy associated with the short-term ionicsurge current. The axial resistivit ies found for Disc No. 12 are betweenthree and four orders of magnitude smailer than Sarzhevskii's values forequatorial resistivity. On the other hand, Disc No. 11, after passage ofcurrent for eight weeks afforded values of axial resistivity that are almostidentical with Sarzhevskii 's for equatoriai resistivity, and lie near themean of Strauss' and Rochow's values for equatorial resistivity. Thereis as much difference between different investigators' values for equa-torial resistivity as there is between the mean of the nearly identicalaxial resistivities of King and Wenden, and the mean of the variouscurves for equatorial resistivity. The difference between the axial andequatorial resistivity seems to be about of the same magnitude as the ex-perimental error.
There is evidence that ionic diffusion may take place in directionsother than parallel to c, and may well enter into the recorded values forequatorial resistivity. The actual relation between axial and equatorialresistivity wil l only be clarif ied when both quantit ies have been measuredwith a precision higher than that of the present study, and with equallycareful precautions against inclusion of impurity-connected currents.There seems to be at least an indication that the difference between axialand equatorial resistivity is really small, comparable with the birefring-ence and the difierence in other vectorial properties of quartz.
An interesting outgrowth of the present study has been the measure-ment of the resistivit ies of a series of qtartz plates cut at different anglesto the c axis. These slices were prepared by the Cambridge ThermionicCorp. an<l the orientation checked by a combination of optical and *-raymethods. Electrodes of Du Pont Liquid Bright Platinum f6455 were fired

IIENRY E. WENDEN
on and the resistivity measured at 500o C. Twelve such samples weremeasured, the temperature and voltage being held constant and thecurrent noted after twenty-four hours. Table 6 records the results of thisexperiment. Although it is too early to express a firm opinion, there seemsto be a systematic relationship between orientation and resistivity that
Telr,p 6. VanIenoN ol Rrstsrtvrtv wrru Cnvstarr,ocRAPurc Onrrura'troN
Orientation(angle /, c)
Resistivity at 500o C. (ohm-cm.)
24 hrs.
DiscNo.
1
34a4b5678a8b9a9b
0'10'1 5',20"10'30029"50',A n o
51'40',60"70"/ J
80080"
4 hrs. 8 hrs.
6 65X1062 85x1062.78X7062 .60X 1062 . 8 5 x 1 0 6, uurtou6 ' o x t o u1.20x7074.73x7077 72X1072 . 39x 108, . 5 5 x t 0 '
6 . 6 5 X 1 0 62 . 6 3 x 1 0 62.52x1062.26X1062.52x1062.12xt066 . 0 x 1 0 6
3 . 5 2 X 1 0 77 .25x1072 . 1 8 x 1 0 82.37x10⁸
7 . 9 8 x 1 0 63 . 1 5 X 1 0 6, . t , t tou4 .06x 1064 35X106, . t , * touu 'o t tout to"tot5 . 0 9 x 1 0 ?t t t t to t, un*tn,2.92x148
will probably become clearer and more consistent when longer runs aremade and the efiect of impurity ions more clearly delineated.
For short times of passages of current the resistivity is, as Mott and
Gurney say, "structure-sensitive"; that is, the current that is carried
chiefly by impurity ions is greatly influenced as to magnitude and direc-
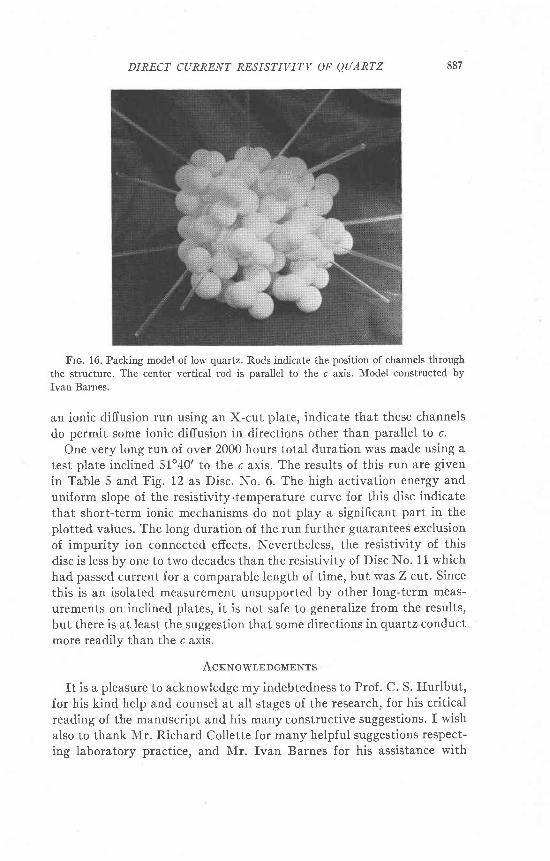
tion by the structure of the quartz. Examination of a carefully con-structed model (Fig. 16) of the low-quartz structure reveals that, in
addition to the often-described "tunnels" or "pores" parallel to the c
axis, there are similar continuous openings through the structure paral-
Iel to the o axes, and in directions inclined about 59" to the c axis, nearlyperpendicular to the sheets of tetrahedra underlying the major rhombo-hedron. These two latter sets of "potes" have an opening area in projec-
tion somewhat smaller than those parallel to c, and in the case of the o
axis tunnels, have about the same center to center spacing. In the case
of the inclined openings, however, the center to center spacing in projec-
tion is about 1.75 A, as contrasted with about 2.5 A for the c axis chan-
nels projected on the base. It is difficult to believe that these openingsare wholly without influence on the short-term, or structure-sensitive,part of the resistivity-time relationship in equatorial and inclined sec-
tions. Experiments now in progress, as well as Disc No. 13, which was
DIRECT CURRENT RESISTIVITY OF OUARTZ
Frc. 16. Packing model of low quartz. Rods indicate the position of channels through
the structure. The center vertical rod is parallel to the , axis. Model constructed by
lvan Bames.
an ionic diffusion run using an X-cut plate, indicate that these channelsdo permit some ionic diffusion in directions other than parallel to c.
One very long run of over 2000 hours total duration was made using atest plate inclined 51o40'to the c axis. The results of this run are givenin Table 5 and Fig. 12 as Disc. No. 6. The high activation energy anduniform slope of the resistivity-temperature curve for this disc indicatethat short-term ionic mechanisms do not play a significant part in theplotted values. The long duration of the run further guaranteeS exclusionof impurity ion connected effects. Nevertheless, the resistivity of thisdisc is Iess by one to two decades than the resistivity of Disc No. 11 whichhad passed current for a comparable length of time, but was Z cut. Sincethis is an isolated measurement unsupported by other long-term meas-urements on inclined plates, it is not safe to generalize from the results,but there is at least the suggestion that some directions in quartz conductmore readily l-han the c axis.
AcrNowrrncMENTS
It is a pleasure to acknowledge my indebtedness to Prof. C. S. Hurlbut,for his kind help and counsel at all stages of the research, for his criticalreading of the manuscript and his many constructive suggestions. I wishalso to thank Nlr. Richard Collette for many helpful suggestions respect-ing laboratory practice, and i\Ir. Ivan Barnes for his assistance with
887
888 HENRY E. WENDEN
some of the calculations. Financial support for a part of the work wasfurnished by the U. S. Army Signal Corps under contract DA 36-039-sc-56689.
RBlBnnllcns
Borrou, Y.E. et atr. (1953), Final Report; Signal Corps Contract DA 36-039-sc-66, Colo.A & M Coil., Ft. Collins, Colo.
Frtr,n, R. F. (1944),Interpretation of current-time curves, General Radio Co., Cambridge,Mass. (Privately dupl. report)
Fnowotr., C., a.vo Hunlnur, C. S. (1953), Final Report: Signal Corps Contract DA36-0390sc-15350, Harvard Univ., Cambridge, Mass.
Grnsox, G., aNl Vocnl, R. C. (1950), Migration of lithium and several multicharged ionsthrough quartz plates in an electric field II, J . Chem. Phys., 18, 109+-7097 .
Ha.nnrs, P. M., exo Wanwc, C. E. (1937), Diffusion of lit-hium ions through quartz inan electric field, Jour. Phys. Chem.,4l,1077.
Jonl6, A. F. (1928), The physics of crystals, McGraw-Hill, New York.
Josr, W. (1952), Diffusion in solids, Iiquids and gases, Academic Press.Krnc, J. C. (1955), Second Interim Report: Signal Corps Contract DA 36-039-sc-64586,
Beli Telephone Labs., Inc., Whippany, N.J.KrNc, J. C. (1956), Fifth Interim Report: Signal Corps Contract DA 36-039-sc-64586,
Bell Telephone Labs., Inc., Wlippany, N. J.Morr, N. F. nxo Gunxrv, R. W. (1948), Electronic processes in ionic crystals, Oxford.Rocnow, E. G. (1938), Electrical conductivity in quartz. Jour. App. Phys.,9,664-469.Sanzurvsrrr, P. E. (1952), Doklad,y Akod. Nauk SSRR, 82, 571-574 (In Russian) Re-
viewed by J. M. Hough in Sci.. Abst.,55, (1952).Sosunw, R. B. (1927), The properties of silica, Chemical Catalog Co., New York. All
references prior to 7927 are reviewed in this work.Stnauss, S. W. el ol. (1956), Fundamental factors controlling electrical resistivity in vitre-
ous ternary lead silicates, J . Res. Nat. Bur. Stand.., 56, 135-742.Sruanr, M. R. (1955), Dielectric constant of quartz as a function of frequency and tempera-
tue, J. App. Phys.,26,1399-7404.Vnnuoocex, J. (1952), Ionic diffusion and electrical conductivity in quartz, Am. Mineral.,
37,637455.Vocrr., R. C., exo Grnson, G. (1950), Migration of sodium ions through quartz plates in
an electric field, -r. Chem. Phys., 18,490-494.WrNuN, H. E. (1954), Second Quarterly Report: Signal Corps Contract DA 36-039-sc-
56689, Harvard Univ., Cambridge, Mass.WnNnnw, H. E. (1954a), Third Quarterly Report: Signal Corps Contract DA 36-039-sc-
56689, Harvard Univ., Cambridge, Mass.WnNonn, H. E. (1955), Interim Report; Signal Corps Contract DA-36-039-sc-56689,
Harvard Univ., Cambridge, Mass.WnnnnN, H. E. (1956), Final Report: Signal Corps Contract DA 36-039-sc-56689, Harvard
Univ., Cambridge, Mass.