Embed Size (px)
Citation preview

1
WO
RL
D T
RA
DE
DE
VE
LO
PM
EN
TS
I
I. Data in real terms show that world gross domestic product (GDP) and
world merchandise exports not only move in tandem, but that export growth exceeds GDP growth. Growth of world GDP is associated with an even higher growth in international trade. Declines also show the same tendency as is shown by Chart I.1 on the volatility of world merchandise trade and GDP from 1960 to 2008.
The income elasticity of manufac-tured exports is higher than that of total merchandise exports. In other words, trade in manufactured goods responds more than merchandise exports to changes in income. From 1960 to 2008, the average elasticity for total merchandise was 1.7, but for manufactured goods it was 2.1.
It is important to bear in mind that merchandise trade fl ows are recorded on a “gross basis” whereas GDP measures the value added during the production of goods and services (i.e. output less intermediate consumption). This means in particular that traded intermediate products are only taken into account in GDP through the additional value produced at each step of the production process. In merchandise trade data, intermediate goods are counted at full value each time they cross the frontier. A higher number of cross-border movements in the case of intermediate manufactured goods may therefore result in a higher growth of merchandise trade compared to GDP. The emergence of international supply chains increases this phenomenon.
Does trade follow the pattern of GDP growth?
Merchandise trade and GDP
IN THIS CHAPTER :
Merchandise trade and GDP
Merchandise trade
Trade and GDP
Regional merchandise trade fl ows
Leading merchandise traders
The crisis and least- developed countries
Trade in commercial services
Foreign affi liates and services trade
The Highlights
I. WORLD TRADE DEVELOPMENTS
1960 1965 1970 1975 1980 1985 1990 1995 2000 2005 2008-10
-5
0
5
10
15
Exports totalGDP
Chart I.1
(Annual percentage change)
World merchandise exports and GDP,1960-2008
1960 1965 1970 1975 1980 1985 1990 1995 2000 2005 20080.0
0.5
1.0
1.5
2.0
2.5
3.0
3.5
Total merchandise tradeTrade in manufactures
Chart I.2Elasticity of world merchandise trade,1960-2008
2
WO
RL
D T
RA
DE
DE
VE
LO
PM
EN
TS
I
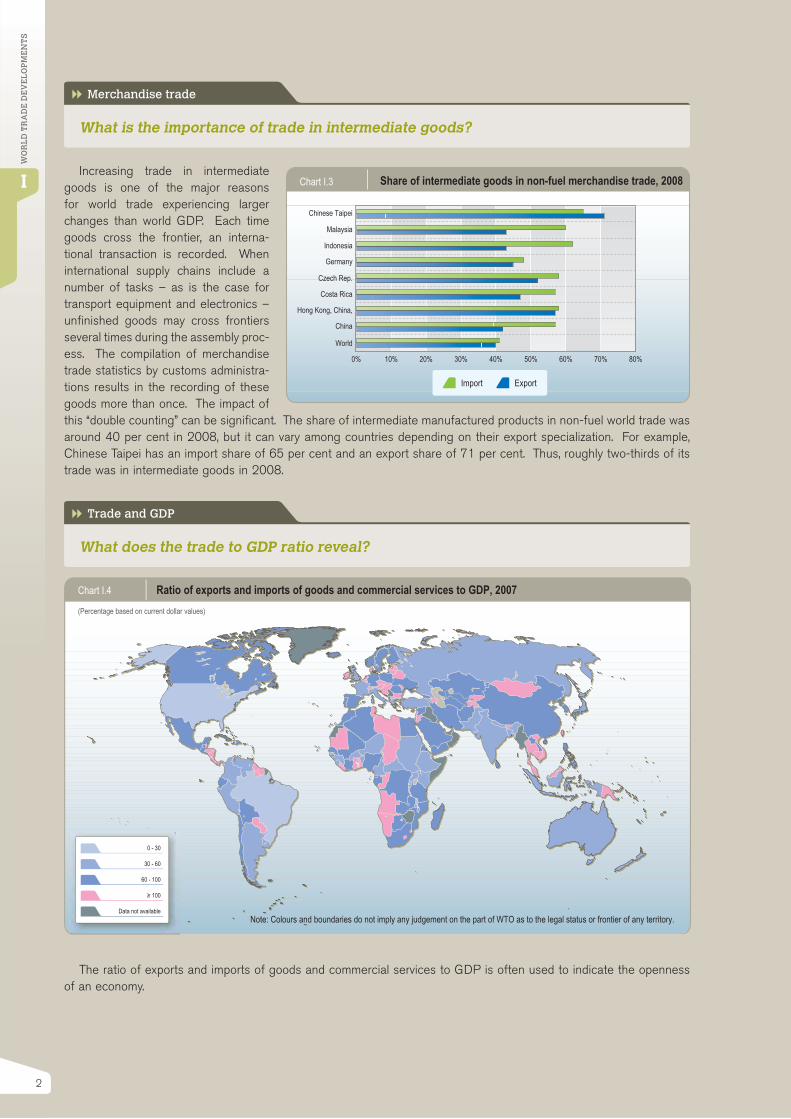
What is the importance of trade in intermediate goods?
Merchandise trade
Increasing trade in intermediate goods is one of the major reasons for world trade experiencing larger changes than world GDP. Each time goods cross the frontier, an interna-tional transaction is recorded. When international supply chains include a number of tasks – as is the case for transport equipment and electronics – unfi nished goods may cross frontiers several times during the assembly proc-ess. The compilation of merchandise trade statistics by customs administra-tions results in the recording of these goods more than once. The impact of this “double counting” can be signifi cant. The share of intermediate manufactured products in non-fuel world trade was around 40 per cent in 2008, but it can vary among countries depending on their export specialization. For example, Chinese Taipei has an import share of 65 per cent and an export share of 71 per cent. Thus, roughly two-thirds of its trade was in intermediate goods in 2008.
What does the trade to GDP ratio reveal?
Trade and GDP
Chart I.4
(Percentage based on current dollar values)
Ratio of exports and imports of goods and commercial services to GDP, 2007
30 - 60
60 - 100
≥ 100
Data not available
0 - 30
Note: Colours and boundaries do not imply any judgement on the part of WTO as to the legal status or frontier of any territory.
The ratio of exports and imports of goods and commercial services to GDP is often used to indicate the openness of an economy.
0% 10% 20% 30% 40% 50% 60% 70% 80%
Chart I.3 Share of intermediate goods in non-fuel merchandise trade, 2008
World
China
Hong Kong, China,
Costa Rica
Czech Rep.
Germany
Indonesia
Malaysia
Chinese Taipei
ExportImport
3
WO
RL
D T
RA
DE
DE
VE
LO
PM
EN
TS
I
However, results should not be interpreted as a trade policy indicator. For example, the United States shows a rela-tively low ratio despite its openness to trade — as refl ected, for example, by its low tariffs. This refl ects the fact that service-oriented and larger economies tend to show a relatively small ratio.
An increase in the value of trade may not be a consequence of trade liberalization. For example, oil price increases lead to an increase of the value of exports of oil exporters that do not fully refl ect an increase in an economy’s GDP. The situation is even more marked for importing countries because the rise in the value of fuel imports may depress domestic economic activity, leading to a higher trade to GDP ratio. Exchange rate fl uctuations also have an impact on making comparisons among countries.
What is the impact of the crisis on trade within regions?
Regional merchandise trade flows
International merchandise trade continued to increase rapidly during the fi rst half of 2008. It was not until September 2008 that the impact of the fi nancial crisis became evident. As a result, the 2008 fi gure for total merchandise trade still shows a positive annual rate of growth of 15 per cent, only slightly lower than the 16 per cent in 2007 but still above the average of 12 per cent observed since 2000.
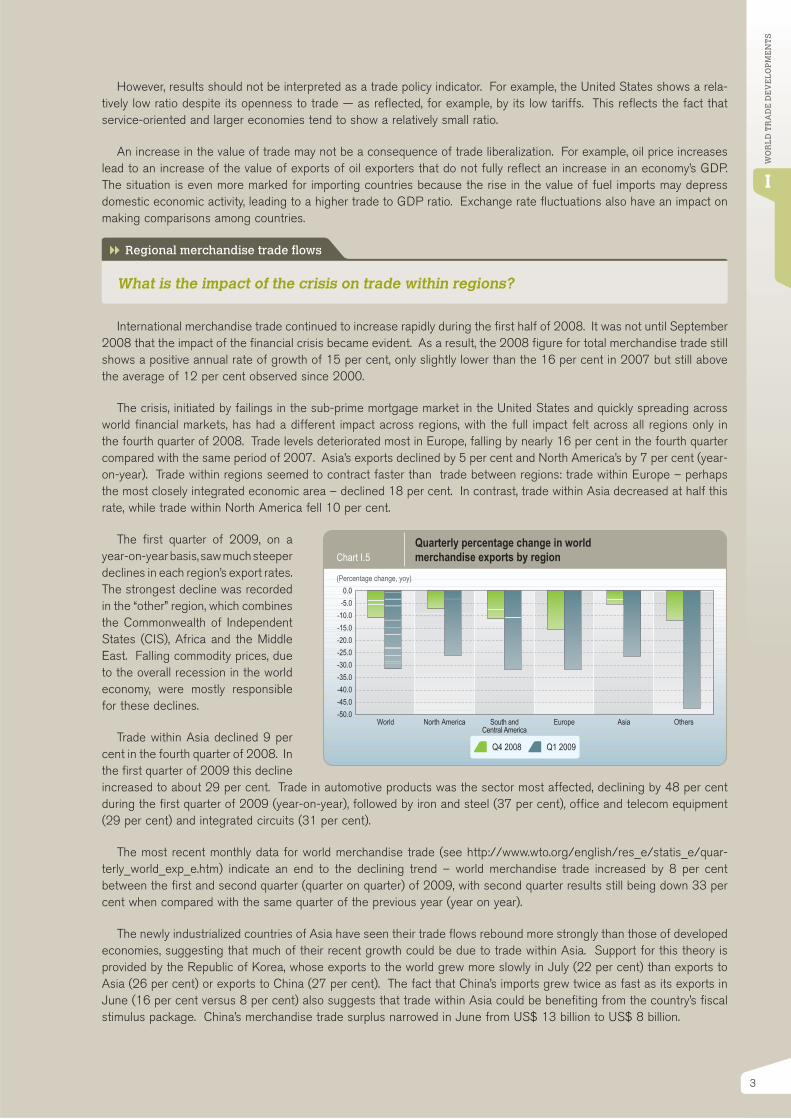
The crisis, initiated by failings in the sub-prime mortgage market in the United States and quickly spreading across world fi nancial markets, has had a different impact across regions, with the full impact felt across all regions only in the fourth quarter of 2008. Trade levels deteriorated most in Europe, falling by nearly 16 per cent in the fourth quarter compared with the same period of 2007. Asia’s exports declined by 5 per cent and North America’s by 7 per cent (year-on-year). Trade within regions seemed to contract faster than trade between regions: trade within Europe – perhaps the most closely integrated economic area – declined 18 per cent. In contrast, trade within Asia decreased at half this rate, while trade within North America fell 10 per cent.
The fi rst quarter of 2009, on a year-on-year basis, saw much steeper declines in each region’s export rates. The strongest decline was recorded in the “other” region, which combines the Commonwealth of Independent States (CIS), Africa and the Middle East. Falling commodity prices, due to the overall recession in the world economy, were mostly responsible for these declines.
Trade within Asia declined 9 per cent in the fourth quarter of 2008. In the fi rst quarter of 2009 this decline increased to about 29 per cent. Trade in automotive products was the sector most affected, declining by 48 per cent during the fi rst quarter of 2009 (year-on-year), followed by iron and steel (37 per cent), offi ce and telecom equipment (29 per cent) and integrated circuits (31 per cent).
The most recent monthly data for world merchandise trade (see http://www.wto.org/english/res_e/statis_e/quar-terly_world_exp_e.htm) indicate an end to the declining trend – world merchandise trade increased by 8 per cent between the fi rst and second quarter (quarter on quarter) of 2009, with second quarter results still being down 33 per cent when compared with the same quarter of the previous year (year on year).
The newly industrialized countries of Asia have seen their trade fl ows rebound more strongly than those of developed economies, suggesting that much of their recent growth could be due to trade within Asia. Support for this theory is provided by the Republic of Korea, whose exports to the world grew more slowly in July (22 per cent) than exports to Asia (26 per cent) or exports to China (27 per cent). The fact that China’s imports grew twice as fast as its exports in June (16 per cent versus 8 per cent) also suggests that trade within Asia could be benefi ting from the country’s fi scal stimulus package. China’s merchandise trade surplus narrowed in June from US$ 13 billion to US$ 8 billion.
-50.0-45.0-40.0-35.0-30.0-25.0-20.0-15.0-10.0
-5.00.0
Chart I.5Quarterly percentage change in world merchandise exports by region
(Percentage change, yoy)
World North America South and Central America
Europe Asia Others
Q1 2009Q4 2008

4
WO
RL
D T
RA
DE
DE
VE
LO
PM
EN
TS
I
What is the impact of the crisis on trade balances?
Leading merchandise traders
Before the global crisis, an increasing number of countries were experiencing trade imbalances. Many analysts iden-tify this trend as one of the reasons for growing global tensions, if not directly one of the causes of the crisis. Since the early 1980s, both Germany and Japan had recorded signifi cant mer-chandise trade surpluses. During the early 1980s, Germany’s trade surplus constantly increased, reaching its peak in 1988 at 5.9 per cent of GDP. After the steep drop in the early 1990s, the trade surplus quickly increased again until 2008 to reach 8 per cent of GDP. Japan’s merchandise trade balance in relation to GDP peaked in 1986 (4.1 per cent). Before the crisis, its export surplus amounted to 2.1 per cent of its GDP. The US defi cit reached 3.6 per cent in 1987, and then fell to 1.4 per cent in 1991. It grew to its peak of 6.8 per cent in 2006 and has declined since then.
Economic downturns, such as in the early 1990s or the latest crisis, tend to redress these trade imbalances. In 2008, Japan’s trade surplus repre-sented 0.4 per cent of GDP, but turned into a trade defi cit during the fi rst quarter of 2009 (-0.02 per cent of GDP). Germany’s export surplus fell to 7 per cent of GDP and the United States defi cit to 6.2 per cent in 2008, further shrink-ing to 3.4 per cent in the fi rst quarter of 2009.
For the BRIC countries (Brazil, Russian Federation, India and China), trade balances as a percentage of GDP were more volatile. This was especially the case where primary commodities, such as copper or grain, and products based on oil or other natural resources comprise a high share of total exports. For example, Russian Federation’s trade surplus was strongly affected by crude oil prices while Brazil’s trade balance has moved between defi cit and surplus several times since the 1980s. Throughout this period, India has faced a structural defi cit in merchandise trade, that has grown especially from 2000 onwards. China’s trade balance turned into a surplus in the mid-1990s, reaching 7.8 per cent of GDP in 2007. Although its trade surplus fell to 6.7 per cent during 2008, and to 4.7 per cent in the fi rst quarter of 2009, the latest monthly fi gures indicate that China is benefi ting noticeably from the initial recovery of world trade.
How has the crisis affected trade in LDCs?
The crisis and least-developed countries (LDCs)
Total exports of goods and commercial services (on Balance-of-Payments terms) from LDCs grew at a high average rate of more than 20 per cent over the 2000-2008 period, thanks to a succession of double-digit annual growth rates since 2003. As a result, the LDCs out-performed the global trends in world trade (12 per cent growth), even though their share in total trade of goods and services remained under one percentage point (0.9 per cent).
1980 1985 1990 1995 2000 2005 2009-10
-5
0
5
10
15
20
25
Chart I.6
(Percentage)
Merchandise trade balance as percentage of GDP,1980-2009FH
United States Germany Japan
1980 1985 1990 1995 2000 2005 2009-10
-5
0
5
10
15
20
25
Chart I.7
(Percentage)
Merchandise trade balance as percentage of GDP,1980-2009FH
BrazilRussian Federation
IndiaChina

5
WO
RL
D T
RA
DE
DE
VE
LO
PM
EN
TS
I
Table I.1
Trends in LDC exports of goods and services, 2000-2008
Values (billion dollars) Annual rate of growth (percentage) 2000 2008e 2001 2002 2003 2004 2005 2006 2007 2008e 2000-2008e
Total goods and commercial services 42.1 176.3 3.9 7.6 15.2 29.7 30.7 23.7 22.8 26.4 19.6
Total goods 35.9 159.4 4.2 7.7 16.3 31.0 33.6 24.6 22.5 27.3 20.5Commercial services 6.1 16.9 2.5 6.9 8.4 21.7 10.1 16.3 25.9 18.7 13.6Other goods 20.4 46.0 6.8 4.1 10.4 14.3 13.4 12.2 14.3 10.7 10.7Fuels and mining 15.6 113.4 0.7 12.8 23.8 50.0 51.2 32.6 27.0 35.6 28.2
Notes: WTO estimates based on Balance of Payments data. e = preliminary estimates.
The sustained increase in export values was principally the result of the surge in commodity prices, particularly for fuels and other minerals, in international markets. Exports of fuels and mining benefi ted from this international trend, growing at an annual average of 28 per cent since the beginning of the decade. Average annual growth in other goods was less impressive (11 per cent since 2000), despite good results in 2008 that were due to a strong increase in exports of food products. Despite year-to-year fl uctuations, LDC exports of commercial services have enjoyed double-digit growth since 2004, averaging an annual 14 per cent over this period.
The recent crisis lowered commodity prices and demand for tourism services, which affected the LDCs during a particularly strong phase of export growth. The recovery of fuel and mineral prices after the fi rst quarter of 2009 has benefi ted commodity exporters, but the effect of the crisis on other LDCs translated into larger external defi cits, com-pounded by their dependence on external fi nancing.
Are exports of commercial services more resilient in times of crisis?
Trade in commercial services
Overall, world exports of commercial services grew by 12 per cent in 2008, compared with 19 per cent in 2007. An analysis of quarterly export data of leading exporting economies (representing 82 per cent of world exports of com-mercial services) shows that in the fi rst two quarters of 2008, world exports of commercial services increased by 20 per cent on average on a year-on-year basis. In the third quarter of 2008, export growth decelerated, and dropped by 6 per cent in the last quarter of the year. Preliminary fi gures for the fi rst quarter of 2009 suggest a more pronounced decline, by 19 per cent.
Data from leading exporters of com-mercial services show that in 2008, export growth slowed down signifi -cantly in several economies. In both the European Union and the United States, which last year together accounted for 60 per cent of world exports of com-mercial services, exports increased respectively by 10 and 11 per cent, considerably less than in 2007. Exports from the BRIC countries continue to grow overall at a steady rate, much higher than the world’s average. How-ever, their individual export performance varies. Despite the ongoing economic recession, in 2008 Russia’s exports of commercial services increased by 30 per cent, more than in 2007. Similarly, exports from Brazil recorded a 27 per cent increase in 2008, in the same range as in the previous year.
For India and China, however, export growth slowed down signifi cantly compared with 2007. China’s exports, which reached US$ 146.4 billion in 2008, rose by 20 per cent, down from 33 per cent in 2007. However, the economy has
Q1 2008 Q2 2008 Q3 2008 Q4 2008 Q1 2009-25.0-20.0-15.0-10.0
-5.00.05.0
10.015.020.025.0
Chart I.8
(Percentage change, yoy)
World exports of commercial servicesQ1 2008 - Q1 2009

6
WO
RL
D T
RA
DE
DE
VE
LO
PM
EN
TS
I
become the third largest exporter of commercial services in the world. Exports from India grew by 17 percentage points in 2008, compared with 23 per cent in 2007.
The crisis principally affected services closely linked to trade in goods, such as transportation, while business services remained relatively untouched. Although some sectors have proved more resilient than merchandise trade during the initial phase of the crisis, trade in business services and travel might be particularly vulnerable to the secondary effects of the global crisis if private investment and household consumption levels continue to be sluggish.
How has services trade changed over the past decade?
Foreign affiliates and services trade
The globalization of business and the fi rms’ increas-ing ownership of different stages of the production process have increased the role of intermediate goods in merchandise trade over the last decade. A simi-lar fragmentation of production has been emerging in the fi eld of services. The United States has recorded an increasing share of trade between multi-nationals and their majority-owned foreign affi liates, growing from 21.5 per cent to more than a quarter of its total trade (27.5 per cent) in 2007 (covering only non-bank affi liates, and excluding transportation services and travel). 1997 1998 1999 2000 2001 2002 2003 2004 2005 2006 2007
050
100150200250300350400450500
Chart I.9Intra-firm trade in US total private services exports, 1997-2007
(Billion dollars)
Intra-firm exportsTotal exports
Value

1. Overview
7
WO
RL
D T
RA
DE
DE
VE
LO
PM
EN
TS
I
Table I.1
(Annual percentage change)
2000-08 2006 2007 2008
World merchandise exports 5.0 8.5 6.0 1.5Agricultural products 4.0 6.0 5.0 2.5Fuels and mining products 3.0 4.0 3.5 0.5Manufactures 6.0 10.5 7.5 2.0
World merchandise production 2.5 4.0 1.5 -0.5Agriculture 2.5 1.5 2.5 3.0Mining 1.5 1.0 0.0 1.0Manufacturing 2.5 5.5 1.5 -1.5
World GDP 3.0 3.5 3.5 1.5
Growth in the volume of world merchandise exports and production, 2000-2008
Note : See the Metadata for the estimation of world aggregates of merchandise exports, production and GDP.
Table I.2
(Annual percentage change)
2000-08 2007 2008 2000-08 2007 2008
5.0 6.0 1.5 World 5.0 6.0 1.5
2.5 5.0 1.5 North America 3.0 2.0 -2.50.0 2.0 -6.0 Canada 3.5 5.0 0.52.0 1.5 -5.0 Mexico 3.0 4.0 0.53.5 6.5 6.0 United States 3.0 1.0 -3.5
5.5 3.5 0.5 South and Central America 8.5 17.5 13.5
3.5 4.0 0.0 Europe 3.0 4.0 -1.53.5 3.5 -0.5 European Union (27) 3.0 3.5 -1.51.0 1.5 0.0 Norway 5.0 9.5 2.03.5 7.0 1.5 Switzerland 2.0 5.0 2.5
7.5 7.5 2.5 Commonwealth of Independent States (CIS) 17.0 20.0 16.5
10.0 11.5 5.5 Asia 8.0 8.0 4.52.5 2.5 5.5 Australia 9.0 11.0 10.0
20.5 19.5 8.5 China 16.0 14.0 4.0-4.0 -20.5 -11.0 Hong Kong, China 3.0 7.0 -2.012.5 13.0 7.5 India 13.5 16.0 14.06.0 9.5 2.0 Japan 2.5 1.5 -2.08.0 8.5 4.5 Six East Asian traders a 5.5 5.0 4.0
Growth in the volume of world merchandise trade by selected region and economy, 2000-2008
a Hong Kong, China; Malaysia; Republic of Korea; Singapore; Separate Customs Territory of Taiwan, Penghu, Kinmen and Matsu (Taipei, Chinese) and Thailand.
Imports Exports

8
WO
RL
D T
RA
DE
DE
VE
LO
PM
EN
TS
I
2. Trade by region
Exports Imports
2000-08 2007 2008 2000-08 2007 2008
Merchandise12 16 15 World 12 15 157 11 11 North America 7 6 86 12 12 United States 7 5 76 8 9 Canada 7 9 7
15 14 21 South and Central America 14 25 3017 17 23 Brazil 15 32 4417 15 -2 Chile 16 23 3112 16 11 Europe 12 16 1212 16 10 European Union (27) 12 16 1212 16 16 Switzerland 10 14 1422 21 35 Commonwealth of Independent States (CIS) 25 35 3221 17 33 Russian Federation 26 36 3121 28 36 Ukraine 25 35 4118 18 28 Africa 17 24 2613 20 16 South Africa 16 12 1218 12 23 Nigeria a 22 35 4118 16 33 Middle East 17 24 2519 11 33 Saudi Arabia a 18 29 2821 24 28 United Arab Emirates a 21 32 2513 16 14 Asia 14 15 2024 26 17 China 22 21 186 10 9 Japan 9 7 23
Commercial services12 20 12 World 12 19 128 14 9 North America 8 9 78 16 10 United States 7 9 86 8 2 Canada 9 14 6
11 18 15 South and Central America 10 21 2016 26 27 Brazil 14 28 2812 30 16 Argentina 4 28 1913 21 11 Europe 12 19 1013 21 11 European Union (27) 12 19 1012 20 16 Switzerland 12 18 1022 27 28 Commonwealth of Independent States (CIS) 22 30 2523 27 30 Russian Federation 21 32 2921 26 27 Ukraine 25 29 37... 23 13 Africa ... 30 1512 24 26 Egypt 11 27 25... 13 -8 South Africa ... 16 214 14 19 Middle East 17 30 196 10 13 Israel 7 20 118 8 ... Saudi Arabia 15 59 ...
14 21 14 Asia 12 18 1410 10 15 Japan 6 11 1322 33 20 China 20 29 22
a Secretariat estimates.
World merchandise trade and trade in commercial services by region and selected economy, 2008
Table I.3
(Annual percentage change)
9
WO
RL
D T
RA
DE
DE
VE
LO
PM
EN
TS
I
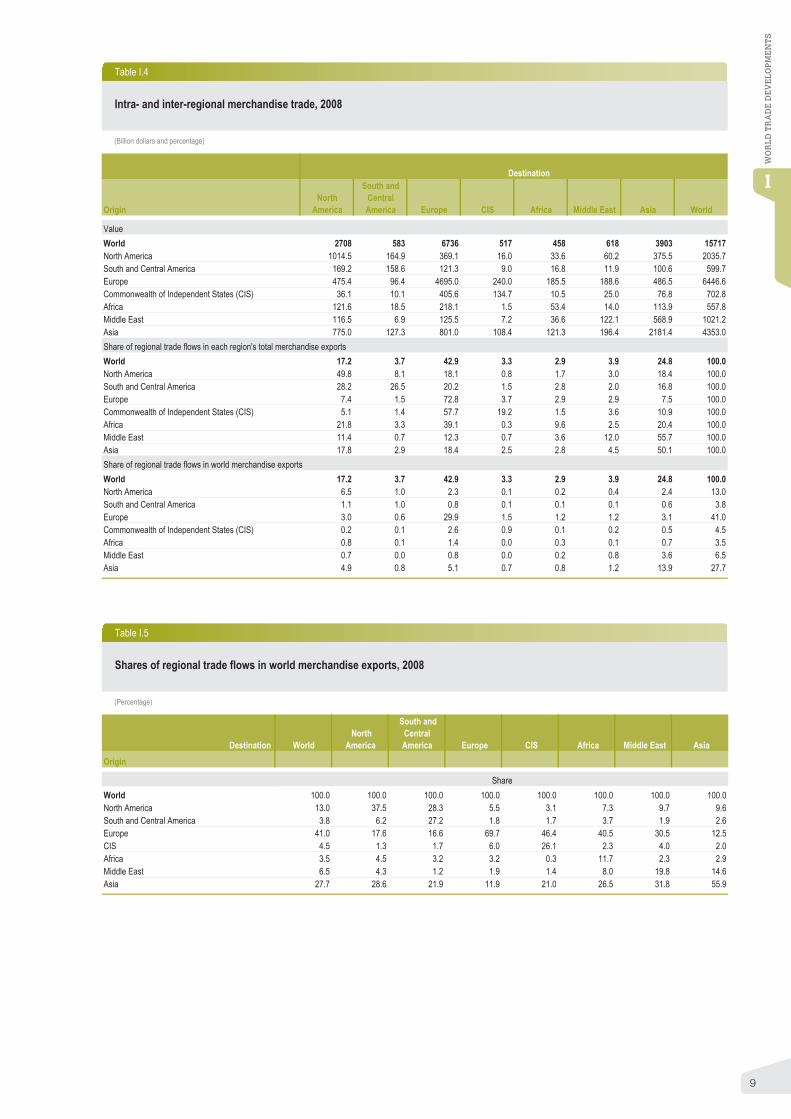
Table I.4
(Billion dollars and percentage)
OriginNorth
America
South and Central America Europe CIS Africa Middle East Asia World
ValueWorld 2708 583 6736 517 458 618 3903 15717North America 1014.5 164.9 369.1 16.0 33.6 60.2 375.5 2035.7South and Central America 169.2 158.6 121.3 9.0 16.8 11.9 100.6 599.7Europe 475.4 96.4 4695.0 240.0 185.5 188.6 486.5 6446.6Commonwealth of Independent States (CIS) 36.1 10.1 405.6 134.7 10.5 25.0 76.8 702.8Africa 121.6 18.5 218.1 1.5 53.4 14.0 113.9 557.8Middle East 116.5 6.9 125.5 7.2 36.6 122.1 568.9 1021.2Asia 775.0 127.3 801.0 108.4 121.3 196.4 2181.4 4353.0Share of regional trade flows in each region's total merchandise exportsWorld 17.2 3.7 42.9 3.3 2.9 3.9 24.8 100.0North America 49.8 8.1 18.1 0.8 1.7 3.0 18.4 100.0South and Central America 28.2 26.5 20.2 1.5 2.8 2.0 16.8 100.0Europe 7.4 1.5 72.8 3.7 2.9 2.9 7.5 100.0Commonwealth of Independent States (CIS) 5.1 1.4 57.7 19.2 1.5 3.6 10.9 100.0Africa 21.8 3.3 39.1 0.3 9.6 2.5 20.4 100.0Middle East 11.4 0.7 12.3 0.7 3.6 12.0 55.7 100.0Asia 17.8 2.9 18.4 2.5 2.8 4.5 50.1 100.0Share of regional trade flows in world merchandise exportsWorld 17.2 3.7 42.9 3.3 2.9 3.9 24.8 100.0North America 6.5 1.0 2.3 0.1 0.2 0.4 2.4 13.0South and Central America 1.1 1.0 0.8 0.1 0.1 0.1 0.6 3.8Europe 3.0 0.6 29.9 1.5 1.2 1.2 3.1 41.0Commonwealth of Independent States (CIS) 0.2 0.1 2.6 0.9 0.1 0.2 0.5 4.5Africa 0.8 0.1 1.4 0.0 0.3 0.1 0.7 3.5Middle East 0.7 0.0 0.8 0.0 0.2 0.8 3.6 6.5Asia 4.9 0.8 5.1 0.7 0.8 1.2 13.9 27.7
Intra- and inter-regional merchandise trade, 2008
Destination
Table I.5
(Percentage)
Destination World North
America
South and Central America Europe CIS Africa Middle East Asia
Origin
World 100.0 100.0 100.0 100.0 100.0 100.0 100.0 100.0North America 13.0 37.5 28.3 5.5 3.1 7.3 9.7 9.6South and Central America 3.8 6.2 27.2 1.8 1.7 3.7 1.9 2.6Europe 41.0 17.6 16.6 69.7 46.4 40.5 30.5 12.5CIS 4.5 1.3 1.7 6.0 26.1 2.3 4.0 2.0Africa 3.5 4.5 3.2 3.2 0.3 11.7 2.3 2.9Middle East 6.5 4.3 1.2 1.9 1.4 8.0 19.8 14.6Asia 27.7 28.6 21.9 11.9 21.0 26.5 31.8 55.9
Shares of regional trade flows in world merchandise exports, 2008
Share

10
WO
RL
D T
RA
DE
DE
VE
LO
PM
EN
TS
I
Table I.6
1948 1953 1963 1973 1983 1993 2003 2008
Value
World 59 84 157 579 1838 3676 7377 15717 Share
World 100.0 100.0 100.0 100.0 100.0 100.0 100.0 100.0North America 28.1 24.8 19.9 17.3 16.8 18.0 15.8 13.0
United States 21.7 18.8 14.9 12.3 11.2 12.6 9.8 8.2Canada 5.5 5.2 4.3 4.6 4.2 4.0 3.7 2.9Mexico 0.9 0.7 0.6 0.4 1.4 1.4 2.2 1.9
South and Central America 11.3 9.7 6.4 4.3 4.4 3.0 3.0 3.8Brazil 2.0 1.8 0.9 1.1 1.2 1.0 1.0 1.3Argentina 2.8 1.3 0.9 0.6 0.4 0.4 0.4 0.4
Europe 35.1 39.4 47.8 50.9 43.5 45.4 45.9 41.0Germany a 1.4 5.3 9.3 11.6 9.2 10.3 10.2 9.3France 3.4 4.8 5.2 6.3 5.2 6.0 5.3 3.9Italy 11.3 9.0 7.8 5.1 4.0 4.6 4.1 3.4United Kingdom 1.8 1.8 3.2 3.8 5.0 4.9 4.1 2.9
Commonwealth of Independent States (CIS) b - - - - - - 2.6 4.5Africa 7.3 6.5 5.7 4.8 4.5 2.5 2.4 3.5
South Africa c 2.0 1.6 1.5 1.0 1.0 0.7 0.5 0.5Middle East 2.0 2.7 3.2 4.1 6.8 3.5 4.1 6.5Asia 14.0 13.4 12.5 14.9 19.1 26.1 26.2 27.7
China 0.9 1.2 1.3 1.0 1.2 2.5 5.9 9.1Japan 0.4 1.5 3.5 6.4 8.0 9.9 6.4 5.0India 2.2 1.3 1.0 0.5 0.5 0.6 0.8 1.1Australia and New Zealand 3.7 3.2 2.4 2.1 1.4 1.4 1.2 1.4Six East Asian traders 3.4 3.0 2.4 3.4 5.8 9.7 9.6 9.0
Memorandum item: EU d - - 27.5 38.6 31.3 37.4 42.4 37.5USSR, former 2.2 3.5 4.6 3.7 5.0 - - -GATT/WTO Members e 62.8 69.6 75.0 84.1 77.0 89.4 94.3 93.4
Note: Between 1973 and 1983 and between 1993 and 2003 export shares were significantly influenced by oil price developments.
World merchandise exports by region and selected economy, 1948, 1953, 1963, 1973, 1983, 1993, 2003 and 2008
b Figures are significantly affected by i) changes in the country composition of the region and major adjustment in trade conversion factors between 1983 and 1993; and ii) including the mutual trade flows of the Baltic States and the CIS between 1993 and 2003.c Beginning with 1998, figures refer to South Africa only and no longer to the Southern African Customs Union.
e Membership as of the year stated.
a Figures refer to the Fed. Rep. of Germany from 1948 through 1983.
(Billion dollars and percentage)
d Figures refer to the EEC(6) in 1963, EC(9) in 1973, EC(10) in 1983, EU(12) in 1993, EU(25) in 2003 and EU(27) in 2008.

11
WO
RL
D T
RA
DE
DE
VE
LO
PM
EN
TS
I
Table I.7
1948 1953 1963 1973 1983 1993 2003 2008
Value World 62 85 164 595 1882 3787 7692 16127
Share
World 100.0 100.0 100.0 100.0 100.0 100.0 100.0 100.0North America 18.5 20.5 16.1 17.2 18.5 21.4 22.5 18.1
United States 13.0 13.9 11.4 12.3 14.3 15.9 16.9 13.5Canada 4.4 5.5 3.9 4.2 3.4 3.7 3.2 2.6Mexico 1.0 0.9 0.8 0.6 0.7 1.8 2.3 2.0
South and Central America 10.4 8.3 6.0 4.4 3.8 3.3 2.5 3.7Brazil 1.8 1.6 0.9 1.2 0.9 0.7 0.7 1.1Argentina 2.5 0.9 0.6 0.4 0.2 0.4 0.2 0.4
Europe 45.3 43.7 52.0 53.3 44.2 44.6 45.0 42.3Germany a 2.2 4.5 8.0 9.2 8.1 9.0 7.9 7.5France 13.4 11.0 8.5 6.5 5.6 5.7 5.2 4.4United Kingdom 5.5 4.9 5.3 6.3 5.3 5.5 5.2 3.9Italy 2.5 2.8 4.6 4.7 4.2 3.9 3.9 3.4
Commonwealth of Independent States (CIS) b - - - - - - 1.7 3.1Africa 8.1 7.0 5.2 3.9 4.6 2.6 2.1 2.9
South Africa c 2.5 1.5 1.1 0.9 0.8 0.5 0.5 0.6Middle East 1.8 2.1 2.3 2.7 6.2 3.3 2.7 3.6Asia 13.9 15.1 14.1 14.9 18.5 23.6 23.5 26.4
China 0.6 1.6 0.9 0.9 1.1 2.7 5.4 7.0Japan 1.1 2.8 4.1 6.5 6.7 6.4 5.0 4.7India 2.3 1.4 1.5 0.5 0.7 0.6 0.9 1.8Australia and New Zealand 2.9 2.3 2.2 1.6 1.4 1.5 1.4 1.5Six East Asian traders 3.5 3.7 3.1 3.7 6.1 10.3 8.6 8.9
Memorandum item: EU d - - 29.0 39.2 31.4 36.1 41.8 38.8USSR, former 1.9 3.3 4.3 3.5 4.3 - - -GATT/WTO Members e 52.9 66.0 74.2 89.1 79.8 89.5 96.1 95.8
Note: Between 1973 and 1983 and between 1993 and 2003 export shares were significantly influenced by oil price developments.
World merchandise imports by region and selected economy, 1948, 1953, 1963, 1973, 1983, 1993, 2003 and 2008
b Figures are significantly affected by i) changes in the country composition of the region and major adjustment in trade conversion factors between 1983 and 1993; and ii) including the mutual trade flows of the Baltic States and the CIS between 1993 and 2003.c Beginning with 1998, figures refer to South Africa only and no longer to the Southern African Customs Union.
e Membership as of the year stated.
a Figures refer to the Fed. Rep. of Germany from 1948 through 1983.
(Billion dollars and percentage)
d Figures refer to the EEC(6) in 1963, EC(9) in 1973, EC(10) in 1983, EU(12) in 1993, EU(25) in 2003 and EU(27) in 2008.

12
WO
RL
D T
RA
DE
DE
VE
LO
PM
EN
TS
I
3. Leading traders
Rank Exporters Value Share
Annual percentage
change Rank Importers Value Share
Annual percentage
change
1 Germany 1461.9 9.1 11 1 United States 2169.5 13.2 72 China 1428.3 8.9 17 2 Germany 1203.8 7.3 143 United States 1287.4 8.0 12 3 China 1132.5 6.9 184 Japan 782.0 4.9 9 4 Japan 762.6 4.6 235 Netherlands 633.0 3.9 15 5 France 705.6 4.3 146 France 605.4 3.8 10 6 United Kingdom 632.0 3.8 17 Italy 538.0 3.3 8 7 Netherlands 573.2 3.5 168 Belgium 475.6 3.0 10 8 Italy 554.9 3.4 89 Russian Federation 471.6 2.9 33 9 Belgium 469.5 2.9 14
10 United Kingdom 458.6 2.9 4 10 Korea, Republic of 435.3 2.7 2211 Canada 456.5 2.8 9 11 Canada 418.3 2.5 712 Korea, Republic of 422.0 2.6 14 12 Spain 401.4 2.4 313 Hong Kong, China 370.2 2.3 6 13 Hong Kong, China 393.0 2.4 6
domestic exports 17.0 0.1 -6 retained imports 97.6 0.6 4 re-exports 353.3 2.2 714 Singapore 338.2 2.1 13 14 Mexico a 323.2 2.0 9
domestic exports 175.7 1.1 13 re-exports 162.5 1.0 1315 Saudi Arabia 313.4 2.0 33 15 Singapore 319.78 1.947 22
retained imports 157.306 0.958 3116 Mexico 291.7 1.8 7 16 India 293.4 1.8 3517 Spain 268.3 1.7 6 17 Russian Federation a 291.9 1.8 3118 Taipei, Chinese 255.6 1.6 4 18 Taipei, Chinese 240.4 1.5 1019 United Arab Emirates b 231.6 1.4 28 19 Poland 204.3 1.2 2320 Switzerland 200.3 1.2 16 20 Turkey 202.0 1.2 1921 Malaysia 199.5 1.2 13 21 Australia 200.3 1.2 2122 Brazil 197.9 1.2 23 22 Austria 183.4 1.1 1323 Australia 187.3 1.2 32 23 Switzerland 183.2 1.1 1424 Sweden 183.4 1.1 9 24 Brazil 182.4 1.1 4425 Austria 181.0 1.1 11 25 Thailand 178.7 1.1 2826 Thailand 177.8 1.1 17 26 Sweden 167.2 1.0 1027 India 177.5 1.1 21 27 United Arab Emirates b 165.6 1.0 2528 Norway 172.5 1.1 27 28 Malaysia 156.9 1.0 729 Poland 168.0 1.0 20 29 Czech Republic a 141.5 0.9 2030 Czech Republic 146.3 0.9 19 30 Indonesia 126.2 0.8 3631 Indonesia 139.3 0.9 18 31 Saudi Arabia 115.1 0.7 2832 Turkey 132.0 0.8 23 32 Denmark 110.8 0.7 1233 Ireland 124.1 0.8 2 33 Hungary 107.9 0.7 1334 Denmark 116.8 0.7 14 34 South Africa b 99.5 0.6 1235 Iran, Islamic Rep. of 113.4 0.7 28 35 Finland 91.8 0.6 1236 Hungary 107.7 0.7 13 36 Portugal 90.0 0.5 1537 Finland 96.5 0.6 7 37 Norway 89.3 0.5 1138 Bolivarian Rep. of Venezuela 93.5 0.6 35 38 Ukraine 85.5 0.5 4139 Kuwait 87.1 0.5 39 39 Ireland 83.2 0.5 -140 South Africa 80.8 0.5 16 40 Romania 82.7 0.5 1841 Nigeria 80.8 0.5 23 41 Viet Nam 80.4 0.5 2842 Algeria 79.3 0.5 32 42 Greece 79.0 0.5 443 Kazakhstan 71.2 0.4 49 43 Slovak Republic a 73.4 0.4 2244 Slovak Republic 71.0 0.4 22 44 Israel 67.7 0.4 1545 Argentina 70.0 0.4 26 45 Chile 61.9 0.4 3146 Angola b 67.1 0.4 51 46 Philippines 60.3 0.4 447 Ukraine 67.0 0.4 36 47 Argentina 57.4 0.4 2848 Chile 66.5 0.4 -2 48 Iran, Islamic Rep. of 57.4 0.4 2849 Qatar b 63.8 0.4 52 49 Bolivarian Rep. of Venezuela a, b 49.6 0.3 850 Libyan Arab Jamahiriya b 63.1 0.4 34 50 Egypt 47.5 0.3 28
Total of above c 14871.8 92.5 - Total of above c 15002.2 91.4 - World c 16070.0 100.0 15 World c 16422.0 100.0 15
a Imports are valued f.o.b. b Secretariat estimates. c Includes significant re-exports or imports for re-export. Note: For annual data 1998-2008, see Appendix Tables A6 and A7.
Table I.8
Leading exporters and importers in world merchandise trade, 2008
(Billion dollars and percentage)
13
WO
RL
D T
RA
DE
DE
VE
LO
PM
EN
TS
IRank Exporters Value Share
Annual percentage
change Rank Importers Value Share
Annual percentage
change
1 Extra-EU (27) exports 1924.9 15.9 13 1 Extra-EU (27) imports 2282.2 18.3 162 China 1428.3 11.8 17 2 United States 2169.5 17.4 73 United States 1287.4 10.6 12 3 China 1132.5 9.1 184 Japan 782.0 6.5 9 4 Japan 762.6 6.1 235 Russian Federation 471.6 3.9 33 5 Korea, Republic of 435.3 3.5 226 Canada 456.5 3.8 9 6 Canada 418.3 3.4 77 Korea, Republic of 422.0 3.5 14 7 Hong Kong, China 393.0 3.2 6
retained imports 97.6 0.8 48 Hong Kong, China 370.2 3.1 6 8 Mexico a 323.2 2.6 9
domestic exports 17.0 0.1 -6 re-exports 353.3 2.9 79 Singapore 338.2 2.8 13 9 Singapore 319.8 2.6 22
domestic exports 175.7 1.5 13 retained imports 157.3 1.3 31 re-exports 162.5 1.3 1310 Saudi Arabia 313.4 2.6 33 10 India 293.4 2.4 3511 Mexico 291.7 2.4 7 11 Russian Federation a 291.9 2.3 3112 Taipei, Chinese 255.6 2.1 4 12 Taipei, Chinese 240.4 1.9 1013 United Arab Emirates b 231.6 1.9 28 13 Turkey 202.0 1.6 1914 Switzerland 200.3 1.7 16 14 Australia 200.3 1.6 2115 Malaysia 199.5 1.6 13 15 Switzerland 183.2 1.5 1416 Brazil 197.9 1.6 23 16 Brazil 182.4 1.5 4417 Australia 187.3 1.5 32 17 Thailand 178.7 1.4 2818 Thailand 177.8 1.5 17 18 United Arab Emirates b 165.6 1.3 2519 India 177.5 1.5 21 19 Malaysia 156.9 1.3 720 Norway 172.5 1.4 27 20 Indonesia 126.2 1.0 3621 Indonesia 139.3 1.2 18 21 Saudi Arabia 115.1 0.9 2822 Turkey 132.0 1.1 23 22 South Africa b 99.5 0.8 1223 Iran, Islamic Rep. of 113.4 0.9 28 23 Norway 89.3 0.7 1124 Bolivarian Rep. of Venezuela 93.5 0.8 35 24 Ukraine 85.5 0.7 4125 Kuwait 87.1 0.7 39 25 Viet Nam 80.4 0.6 2826 South Africa 80.8 0.7 16 26 Israel 67.7 0.5 1527 Nigeria 80.8 0.7 23 27 Chile 61.9 0.5 3128 Algeria 79.3 0.7 32 28 Philippines 60.3 0.5 429 Kazakhstan 71.2 0.6 49 29 Argentina 57.4 0.5 2830 Argentina 70.0 0.6 26 30 Iran, Islamic Rep. of 57.4 0.5 2831 Angola b 67.1 0.6 51 31 Bolivarian Rep. of Venezuela a, b 49.6 0.4 832 Ukraine 67.0 0.6 36 32 Egypt 47.5 0.4 2833 Chile 66.5 0.5 -2 33 Pakistan 42.3 0.3 3034 Qatar b 63.8 0.5 52 34 Morocco 41.8 0.3 3035 Libyan Arab Jamahiriya b 63.1 0.5 34 35 Nigeria b 41.7 0.3 4136 Viet Nam 62.9 0.5 30 36 Colombia 39.7 0.3 2137 Israel 60.8 0.5 12 37 Belarus 39.5 0.3 3838 Iraq b 59.7 0.5 51 38 Algeria 39.5 0.3 4339 Philippines 49.0 0.4 -3 39 Kazakhstan 37.9 0.3 1640 Oman 37.7 0.3 53 40 New Zealand 34.4 0.3 1141 Colombia 37.6 0.3 25 41 Iraq b 31.2 0.3 4542 Belarus 32.9 0.3 36 42 Croatia 30.7 0.2 1943 Peru 31.5 0.3 13 43 Peru 30.0 0.2 4644 Azerbaijan 30.6 0.3 44 44 Qatar b 26.9 0.2 2245 New Zealand 30.6 0.3 14 45 Kuwait 24.9 0.2 2246 Egypt 24.0 0.2 25 46 Tunisia 24.6 0.2 2947 Pakistan 20.3 0.2 14 47 Bangladesh 23.8 0.2 2848 Morocco 20.1 0.2 31 48 Serbia 23.0 0.2 2449 Tunisia 19.3 0.2 27 49 Oman b 23.0 0.2 4350 Ecuador 18.5 0.2 29 50 Angola a, b 21.1 0.2 54 Total of above c 11697.0 96.7 - Total of above c 11904.8 95.6 -
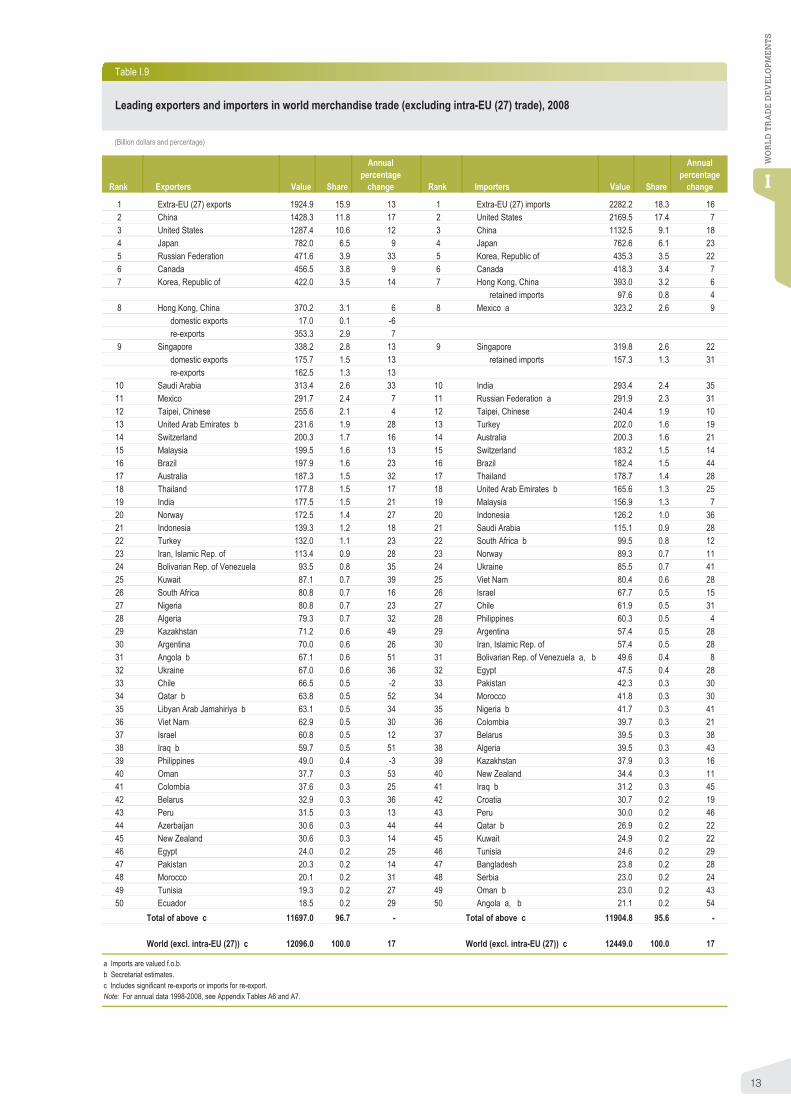
World (excl. intra-EU (27)) c 12096.0 100.0 17 World (excl. intra-EU (27)) c 12449.0 100.0 17
a Imports are valued f.o.b. b Secretariat estimates. c Includes significant re-exports or imports for re-export. Note: For annual data 1998-2008, see Appendix Tables A6 and A7.
Table I.9
Leading exporters and importers in world merchandise trade (excluding intra-EU (27) trade), 2008
(Billion dollars and percentage)

14
WO
RL
D T
RA
DE
DE
VE
LO
PM
EN
TS
I Rank Exporters Value Share
Annual percentage
change Rank Importers Value Share
Annual percentage
change
1 United States 521.4 13.8 10 1 United States 367.9 10.5 82 United Kingdom 283.0 7.5 1 2 Germany 283.0 8.1 113 Germany 241.6 6.4 11 3 United Kingdom 196.2 5.6 04 France 160.5 4.2 11 4 Japan 167.4 4.8 135 China 146.4 3.9 20 5 China 158.0 4.5 226 Japan 146.4 3.9 15 6 France 139.4 4.0 87 Spain 142.6 3.8 12 7 Italy 131.7 3.8 118 Italy 121.9 3.2 10 8 Ireland 106.2 3.0 129 India 102.6 2.7 17 9 Spain 104.3 3.0 9
10 Netherlands 101.6 2.7 8 10 Korea, Republic of 91.8 2.6 1211 Ireland 99.2 2.6 12 11 Netherlands 90.8 2.6 812 Hong Kong, China 92.3 2.4 9 12 Canada 86.6 2.5 613 Belgium 86.1 2.3 16 13 India 83.6 2.4 1814 Singapore 82.9 2.2 3 14 Belgium 81.9 2.3 1715 Switzerland 75.2 2.0 16 15 Singapore 78.9 2.3 616 Korea, Republic of 74.1 2.0 20 16 Russian Federation 74.6 2.1 2917 Denmark 72.0 1.9 17 17 Denmark 62.3 1.8 1618 Sweden 71.6 1.9 13 18 Sweden 54.3 1.6 1319 Luxembourg 68.9 1.8 5 19 Thailand 46.3 1.3 2120 Canada 64.8 1.7 2 20 Hong Kong, China 45.8 1.3 821 Austria 61.7 1.6 12 21 Australia 45.5 1.3 1822 Russian Federation 50.7 1.3 30 22 Brazil 44.4 1.3 2823 Greece 50.4 1.3 17 23 Norway 43.9 1.3 1324 Australia 45.6 1.2 15 24 United Arab Emirates 42.8 1.2 2825 Norway 45.6 1.2 13 25 Austria 42.6 1.2 926 Poland 35.3 0.9 23 26 Luxembourg 40.7 1.2 727 Turkey 34.5 0.9 22 27 Switzerland 36.6 1.0 1028 Taipei, Chinese 33.6 0.9 8 28 Saudi Arabia a 34.6 1.0 ...29 Thailand 33.4 0.9 11 29 Taipei, Chinese 33.6 1.0 -230 Malaysia 29.3 0.8 4 30 Poland 29.9 0.9 2631 Brazil 28.8 0.8 27 31 Malaysia 29.1 0.8 532 Portugal 26.1 0.7 13 32 Indonesia a 27.9 0.8 ...33 Egypt 24.7 0.7 26 33 Mexico 24.7 0.7 634 Finland 24.2 0.6 5 34 Greece 24.4 0.7 2335 Israel 23.8 0.6 13 35 Finland 23.1 0.7 536 Czech Republic 22.2 0.6 29 36 Israel 19.6 0.6 1137 Hungary 20.0 0.5 18 37 Hungary 18.5 0.5 2038 Lebanon 18.9 0.5 46 38 Czech Republic 17.3 0.5 2139 Mexico 18.5 0.5 5 39 South Africa 16.5 0.5 240 Macao, China 18.1 0.5 25 40 Portugal 16.5 0.5 17
Total of above 3400.0 90.0 - Total of above 3065.0 87.8 -World 3780.0 100.0 12 World 3490.0 100.0 12
Leading exporters and importers in world trade in commercial services, 2008
Note : Figures for a number of countries and territories have been estimated by the Secretariat. Annual percentage changes and rankings are affected by continuity breaks in the series for a large number of economies, and by limitations in cross-country comparability. See the Metadata. For annual data 1998-2008, see Appendix Tables A8 and A9.
a Secretariat estimate.
Table I.10
(Billion dollars and percentage)

15
WO
RL
D T
RA
DE
DE
VE
LO
PM
EN
TS
IRank Exporters Value Share
Annual percentage
change Rank Importers Value Share
Annual percentage
change
1 Extra-EU (27) exports 743.2 26.9 11 1 Extra-EU (27) imports 620.7 23.9 132 United States 521.4 18.8 10 2 United States 367.9 14.2 83 China 146.4 5.3 20 3 Japan 167.4 6.4 134 Japan 146.4 5.3 15 4 China 158.0 6.1 225 India 102.6 3.7 17 5 Korea, Republic of 91.8 3.5 126 Hong Kong, China 92.3 3.3 9 6 Canada 86.6 3.3 67 Singapore 82.9 3.0 3 7 India 83.6 3.2 188 Switzerland 75.2 2.7 16 8 Singapore 78.9 3.0 69 Korea, Republic of 74.1 2.7 20 9 Russian Federation 74.6 2.9 29
10 Canada 64.8 2.3 2 10 Thailand 46.3 1.8 2111 Russian Federation 50.7 1.8 30 11 Hong Kong, China 45.8 1.8 812 Australia 45.6 1.6 15 12 Australia 45.5 1.8 1813 Norway 45.6 1.6 13 13 Brazil 44.4 1.7 2814 Turkey 34.5 1.2 22 14 Norway 43.9 1.7 1315 Taipei, Chinese 33.6 1.2 8 15 United Arab Emirates 42.8 1.6 2816 Thailand 33.4 1.2 11 16 Switzerland 36.6 1.4 1017 Malaysia 29.3 1.1 4 17 Saudi Arabia a 34.6 1.3 ...18 Brazil 28.8 1.0 27 18 Taipei, Chinese 33.6 1.3 -219 Egypt 24.7 0.9 26 19 Malaysia 29.1 1.1 520 Israel 23.8 0.9 13 20 Indonesia a 27.9 1.1 ...21 Lebanon 18.9 0.7 46 21 Mexico 24.7 1.0 622 Mexico 18.5 0.7 5 22 Israel 19.6 0.8 1123 Macao, China 18.1 0.7 25 23 South Africa 16.5 0.6 224 Ukraine 17.3 0.6 27 24 Egypt 16.3 0.6 2525 Croatia 15.2 0.5 21 25 Turkey 16.2 0.6 1526 Indonesia a 14.7 0.5 ... 26 Nigeria a 15.7 0.6 ...27 Morocco 12.4 0.4 8 27 Ukraine 15.1 0.6 3728 South Africa 12.2 0.4 -8 28 Lebanon 13.4 0.5 3429 Argentina 11.9 0.4 16 29 Angola a 13.0 0.5 ...30 Chile 10.6 0.4 20 30 Argentina 12.6 0.5 1931 Kuwait 10.3 0.4 13 31 Kuwait 12.1 0.5 1632 Philippines 10.2 0.4 4 32 Iran, Islamic Rep. of 12.0 0.5 1333 Cuba 9.1 0.3 6 33 Chile 11.1 0.4 1534 United Arab Emirates 9.0 0.3 21 34 Kazakhstan 10.8 0.4 -535 New Zealand 8.8 0.3 -3 35 New Zealand 9.5 0.4 636 Saudi Arabia a 8.8 0.3 ... 36 Pakistan 9.0 0.3 737 Iran, Islamic Rep. of 6.8 0.2 10 37 Viet Nam 8.6 0.3 2438 Nigeria a 6.6 0.2 ... 38 Philippines 8.5 0.3 1639 Viet Nam 6.3 0.2 4 39 Qatar a 7.9 0.3 ...40 Panama 5.8 0.2 19 40 Bolivarian Rep. of Venezuela 7.8 0.3 8
Total of above 2630.0 95.1 - Total of above 2420.0 93.2 -World (excl. intra-EU (27)) 2765.0 100.0 13 World (excl. intra-EU (27)) 2595.0 100.0 13
Leading exporters and importers in world trade in commercial services (excluding intra-EU (27) trade), 2008
Note: Figures for a number of countries and territories have been estimated by the Secretariat . Annual percentage changes and rankings are affected by continuity breaks in the series for a large number of economies, and by limitations in cross-country comparability. See the Metadata. For annual data 1998-2008, see Appendix Tables A8 and A9.
a Secretariat estimate.
Table I.11
(Billion dollars and percentage)

16
WO
RL
D T
RA
DE
DE
VE
LO
PM
EN
TS
I
4. Bilateral trade of leading traders
Table I.12
(Billion dollars and percentage)
Destination Value Origin Value
2008 2000 2008 2007 2008 2008 2000 2008 2007 2008
Region Region World 456.5 100.0 100.0 8 9 World 418.3 100.0 100.0 9 7North America 360.6 87.7 79.0 5 7 North America 239.9 67.7 57.4 8 4Europe 39.8 5.1 8.7 31 4 Asia 80.9 14.5 19.3 12 7Asia 37.5 5.3 8.2 13 19 Europe 61.7 12.4 14.8 7 12South and Central America 8.1 1.0 1.8 23 31 South and Central America 13.2 1.8 3.2 11 1Middle East 4.4 0.4 1.0 32 41 Africa 12.9 0.8 3.1 14 49Africa 4.0 0.4 0.9 39 29 Middle East 6.1 0.7 1.5 3 40CIS 2.0 0.1 0.4 37 38 CIS 3.6 0.2 0.9 -1 85
Economy Economy United States 353.3 87.3 77.4 5 6 United States 219.1 64.4 52.4 7 4European Union (27) 34.0 4.7 7.5 26 5 European Union (27) 52.2 10.6 12.5 7 10Japan 10.5 2.2 2.3 4 22 China 41.2 3.2 9.8 18 12China 9.8 0.9 2.1 29 10 Mexico 17.3 3.4 4.1 14 5Mexico 5.5 0.5 1.2 20 19 Japan 14.8 4.7 3.5 7 0
Above 5 413.1 95.6 90.5 - - Above 5 344.4 86.2 82.3 - -Korea, Republic of 3.6 0.5 0.8 -3 29 Algeria 7.3 0.3 1.7 8 53Norway 2.7 0.2 0.6 106 -23 Norway 5.9 1.2 1.4 4 17Brazil 2.4 0.3 0.5 21 73 Korea, Republic of 5.7 1.4 1.4 -1 13India 2.3 0.1 0.5 13 36 Taipei, Chinese 3.7 1.4 0.9 6 3Australia 2.0 0.3 0.4 0 24 Canada 3.5 ... 0.8 17 1Hong Kong, China 1.7 0.3 0.4 2 16 Malaysia 2.8 0.7 0.7 5 1Taipei, Chinese 1.5 0.3 0.3 17 2 Switzerland 2.6 0.4 0.6 13 24Russian Federation 1.4 0.0 0.3 39 32 Angola 2.6 0.0 0.6 109 133Indonesia 1.4 0.2 0.3 31 48 Brazil 2.6 0.4 0.6 4 -19United Arab Emirates 1.3 0.1 0.3 51 29 Thailand 2.3 0.5 0.6 8 9Switzerland 1.2 0.1 0.3 44 -11 Peru 2.3 0.1 0.6 8 16Turkey 1.2 0.1 0.3 30 86 Saudi Arabia 2.2 0.3 0.5 15 26Saudi Arabia 1.0 0.1 0.2 33 50 Iraq 2.1 0.2 0.5 -4 50South Africa 0.9 0.1 0.2 27 19 India 2.1 0.3 0.5 9 12Bolivarian Rep. of Venezuela 0.8 0.2 0.2 3 18 Russian Federation 2.0 0.2 0.5 -10 40Algeria 0.8 0.1 0.2 110 76 Chile 1.7 0.2 0.4 -4 7Malaysia 0.8 0.1 0.2 20 43 Australia 1.6 0.4 0.4 18 -7Singapore 0.8 0.1 0.2 31 -9 Bolivarian Rep. of Venezuela 1.3 0.4 0.3 30 -8Cuba 0.7 0.1 0.2 16 38 Singapore 1.2 0.4 0.3 60 -16Chile 0.7 0.1 0.1 69 -4 Israel 1.1 0.2 0.3 17 28Thailand 0.7 0.1 0.1 16 22 Azerbaijan 1.1 0.0 0.3 369 439Colombia 0.7 0.1 0.1 37 8 Indonesia 1.0 0.2 0.2 11 9Iran, Islamic Rep. of 0.6 0.2 0.1 -6 152 Viet Nam 0.9 0.1 0.2 23 27Egypt 0.6 0.0 0.1 -13 84 Nigeria 0.9 0.1 0.2 -58 221Gibraltar 0.6 0.0 0.1 32 1297 Cuba 0.8 0.1 0.2 78 -15Israel 0.6 0.1 0.1 1 38 South Africa 0.8 0.1 0.2 41 -21Philippines 0.5 0.1 0.1 21 23 Philippines 0.8 0.4 0.2 -18 8Pakistan 0.5 0.0 0.1 20 23 Turkey 0.7 0.1 0.2 -5 26New Zealand 0.4 0.0 0.1 11 14 Bangladesh 0.6 0.0 0.1 6 21Sri Lanka 0.4 0.0 0.1 3 61 Colombia 0.6 0.1 0.1 -22 37Peru 0.4 0.1 0.1 22 16 Argentina 0.6 0.1 0.1 -12 37Viet Nam 0.3 0.0 0.1 45 11 Suriname 0.6 0.0 0.1 97 52Morocco 0.3 0.1 0.1 53 27 New Zealand 0.5 0.1 0.1 10 -5Bangladesh 0.3 0.0 0.1 137 -21 Hong Kong, China 0.4 0.4 0.1 10 -12Trinidad and Tobago 0.3 0.0 0.1 19 23 Costa Rica 0.4 0.1 0.1 0 3
Above 40 449.2 99.7 98.4 - - Above 40 411.6 97.0 98.4 - -
b In 2008, Canada reported imports from Canada accounting for nearly 1 percent of its total merchandise imports. a Imports are valued f.o.b.
Merchandise trade of Canada by origin and destination, 2008
Annual percentage
change
Annual percentage
change Share Share
Exports Imports a

17
WO
RL
D T
RA
DE
DE
VE
LO
PM
EN
TS
I
Table I.13
(Billion dollars and percentage)
Destination Value Origin Value
2008 2000 2008 2007 2008 2008 2000 2008 2007 2008
Region Region World 1287.4 100.0 100.0 12 12 World 2169.5 100.0 100.0 5 7North America 413.2 37.0 32.1 6 7 Asia 762.4 37.8 35.1 5 1Asia 329.4 27.6 25.6 11 8 North America 559.0 29.4 25.8 5 5Europe 311.1 23.6 24.2 16 14 Europe 409.6 20.3 18.9 6 4South and Central America 135.0 7.5 10.5 21 28 South and Central America 167.4 6.2 7.7 1 18Middle East 55.0 2.4 4.3 21 22 Africa 117.3 2.3 5.4 14 23Africa 28.8 1.4 2.2 28 20 Middle East 115.3 3.2 5.3 8 44CIS 13.8 0.4 1.1 49 32 CIS 38.5 0.8 1.8 5 45
Economy Economy European Union (27) 271.8 21.6 21.1 15 11 European Union (27) 377.9 18.7 17.4 7 4Canada 260.9 22.6 20.3 8 5 China 356.6 8.5 16.4 11 5Mexico 151.2 14.3 11.7 2 11 Canada 339.1 18.5 15.6 3 7China 69.7 2.1 5.4 17 11 Mexico 218.6 10.9 10.1 6 3Japan 65.1 8.4 5.1 5 7 Japan 143.6 12.0 6.6 -2 -4
Above 5 818.8 68.9 63.6 - - Above 5 1435.8 68.6 66.2 - -Korea, Republic of 34.8 3.6 2.7 7 0 Saudi Arabia 57.0 1.2 2.6 12 53Brazil 32.3 2.0 2.5 28 34 Bolivarian Rep. of Venezuela 52.6 1.6 2.4 7 28Singapore 28.8 2.3 2.2 6 10 Korea, Republic of 49.8 3.3 2.3 4 1Taipei, Chinese 25.3 3.1 2.0 14 -4 Nigeria 39.2 0.9 1.8 17 16Australia 22.4 1.6 1.7 8 17 Taipei, Chinese 37.7 3.4 1.7 0 -5Switzerland 22.0 1.3 1.7 18 29 Brazil 32.1 1.2 1.5 -3 18Hong Kong, China 21.6 1.9 1.7 13 8 Malaysia 31.6 2.1 1.5 -10 -6India 17.7 0.5 1.4 55 18 Russian Federation 27.9 0.6 1.3 -2 38United Arab Emirates 15.7 0.3 1.2 -3 36 India 27.0 0.9 1.2 9 7Israel 14.5 1.0 1.1 19 11 Thailand 24.6 1.4 1.1 0 3Malaysia 13.0 1.4 1.0 -7 11 Iraq 23.1 0.5 1.1 -3 94Bolivarian Rep. of Venezuela 12.6 0.7 1.0 13 24 Israel 22.6 1.0 1.0 9 7Saudi Arabia 12.5 0.8 1.0 33 20 Algeria 20.0 0.2 0.9 15 9Chile 12.1 0.4 0.9 22 46 Angola 19.5 0.3 0.9 6 51Colombia 11.4 0.5 0.9 28 34 Switzerland 18.2 0.8 0.8 3 20Turkey 10.4 0.5 0.8 15 59 Indonesia 16.7 0.9 0.8 6 10Russian Federation 9.3 0.3 0.7 55 28 Singapore 16.2 1.6 0.7 3 -14Thailand 9.1 0.9 0.7 4 7 Viet Nam 13.9 0.1 0.6 23 21Philippines 8.3 1.1 0.6 1 8 Colombia 13.8 0.6 0.6 2 38Argentina 7.5 0.6 0.6 23 29 Australia 10.9 0.5 0.5 5 22Dominican Republic 6.6 0.6 0.5 14 8 South Africa 10.1 0.3 0.5 20 9South Africa 6.5 0.4 0.5 24 18 Ecuador 9.5 0.2 0.4 -14 46Peru 6.2 0.2 0.5 41 50 Trinidad and Tobago 9.5 0.2 0.4 6 1Egypt 6.0 0.4 0.5 30 13 Philippines 9.1 1.1 0.4 -3 -7Indonesia 5.9 0.3 0.5 38 40 Chile 9.0 0.3 0.4 -5 -8Costa Rica 5.7 0.3 0.4 11 24 Norway 7.6 0.5 0.4 3 0Panama 4.9 0.2 0.4 38 32 Kuwait 7.4 0.2 0.3 3 72Honduras 4.8 0.3 0.4 21 9 Hong Kong, China 6.7 1.0 0.3 -12 -8Guatemala 4.7 0.2 0.4 16 16 Argentina 6.2 0.3 0.3 13 28Nigeria 4.1 0.1 0.3 25 47 Peru 6.1 0.2 0.3 -11 12Ecuador 3.4 0.1 0.3 8 18 Congo 5.2 0.0 0.2 0 63Norway 3.4 0.2 0.3 27 11 Turkey 5.0 0.3 0.2 -15 1Qatar 3.1 0.0 0.2 108 11 Azerbaijan 4.5 0.0 0.2 162 131Netherlands Antilles 3.0 0.1 0.2 40 42 Libyan Arab Jamahiriya 4.4 ... 0.2 35 23Viet Nam 2.8 0.0 0.2 73 47 Honduras 4.2 0.3 0.2 5 3
Above 40 1231.3 97.1 95.6 - - Above 40 2094.8 96.5 96.6 - -
Annual percentage
change
Merchandise trade of the United States by origin and destination, 2008
Annual percentage
change Share Share
Exports Imports

18
WO
RL
D T
RA
DE
DE
VE
LO
PM
EN
TS
I
Table I.14
(Billion dollars and percentage)
Destination Value Origin Value
2008 2000 2008 2007 2008 2008 2000 2008 2007 2008
Region Region World 5898.4 100.0 100.0 16 10 World 6255.8 100.0 100.0 16 12Europe 4313.5 73.5 73.1 16 9 Europe 4298.9 69.2 68.7 16 10Asia 440.5 7.5 7.5 17 11 Asia 784.5 12.0 12.5 19 9North America 434.7 10.3 7.4 7 4 CIS 329.5 2.7 5.3 12 31CIS 218.3 1.3 3.7 33 25 North America 323.7 8.3 5.2 15 9Africa 171.8 2.4 2.9 22 24 Africa 214.2 2.9 3.4 12 30Middle East 156.1 2.2 2.6 17 18 South and Central America 128.6 1.7 2.1 17 17South and Central America 89.0 1.7 1.5 21 20 Middle East 111.0 1.9 1.8 7 19
Economy Economy European Union (27) 3973.5 68.0 67.4 16 9 European Union (27) 3973.5 64.5 63.5 16 9United States 362.7 8.9 6.1 6 2 China 363.7 2.7 5.8 30 15Russian Federation 153.2 0.8 2.6 34 27 United States 268.3 7.3 4.3 13 8Switzerland 143.7 2.7 2.4 15 13 Russian Federation 254.0 2.2 4.1 11 28China 113.7 1.0 1.9 23 17 Norway 135.3 1.7 2.2 6 29
Above 5 4746.7 81.4 80.5 - - Above 5 4994.7 78.4 79.8 - -Turkey 79.8 1.2 1.4 15 11 Switzerland 117.8 2.2 1.9 17 12Norway 64.3 1.0 1.1 24 8 Japan 109.9 3.3 1.8 11 2Japan 60.4 1.7 1.0 6 3 Turkey 67.5 0.7 1.1 23 5United Arab Emirates 46.6 0.5 0.8 16 27 Korea, Republic of 57.9 1.0 0.9 11 2India 45.6 0.5 0.8 32 15 Brazil 52.1 0.7 0.8 31 16Canada 38.4 0.8 0.7 6 8 Libyan Arab Jamahiriya 50.3 0.5 0.8 15 34Korea, Republic of 37.7 0.6 0.6 18 11 India 43.2 0.5 0.7 28 19Brazil 37.6 0.6 0.6 30 32 Algeria 41.7 0.6 0.7 -7 48Australia 37.0 0.6 0.6 17 19 Taipei, Chinese 35.4 1.0 0.6 6 -1Ukraine 37.0 0.2 0.6 34 21 Canada 35.0 0.7 0.6 29 10Singapore 32.3 0.6 0.5 14 15 South Africa 32.3 0.5 0.5 23 14Mexico 32.0 0.5 0.5 20 13 Saudi Arabia 31.1 0.6 0.5 -14 23Saudi Arabia 31.3 0.5 0.5 25 14 Malaysia 25.8 0.7 0.4 11 4Hong Kong, China 31.0 0.8 0.5 6 8 Kazakhstan 25.6 0.1 0.4 5 39South Africa 28.9 0.4 0.5 12 5 Thailand 25.2 0.5 0.4 23 11Algeria 22.5 0.2 0.4 23 46 Singapore 23.8 0.6 0.4 4 -6Morocco 21.2 0.3 0.4 29 25 Nigeria 22.6 0.2 0.4 3 62Croatia 21.1 0.2 0.4 17 16 Ukraine 21.1 0.2 0.3 37 24Israel 20.7 0.6 0.4 12 6 Iran, Islamic Rep. of 21.1 0.3 0.3 5 11Egypt 18.7 0.3 0.3 25 31 Mexico 20.2 0.3 0.3 25 22Taipei, Chinese 17.1 0.6 0.3 10 -6 Indonesia 19.9 0.4 0.3 14 13Malaysia 17.0 0.3 0.3 21 9 Hong Kong, China 16.9 0.4 0.3 -2 12Iran, Islamic Rep. of 16.7 0.2 0.3 -2 21 Chile 16.6 0.2 0.3 10 -4Nigeria 16.5 0.2 0.3 32 42 Australia 16.5 0.3 0.3 15 2Tunisia 14.6 0.3 0.2 19 12 Israel 16.5 0.4 0.3 24 6Serbia 13.3 ... 0.2 51 21 Azerbaijan 15.5 0.0 0.2 47 54Thailand 12.5 0.3 0.2 18 15 Argentina 15.5 0.2 0.2 26 32Qatar 9.7 0.1 0.2 34 13 Tunisia 14.0 0.2 0.2 29 13Belarus 9.4 0.1 0.2 20 41 Iraq 13.4 0.2 0.2 48 44Argentina 8.9 0.2 0.2 34 9 Viet Nam 12.6 0.2 0.2 25 17Indonesia 8.8 0.2 0.1 19 18 Morocco 12.3 0.2 0.2 22 11Libyan Arab Jamahiriya 8.4 0.1 0.1 23 48 Egypt 11.9 0.1 0.2 0 23Kazakhstan 8.3 0.1 0.1 32 1 Angola 11.4 0.1 0.2 111 99Angola 7.8 0.0 0.1 44 41 Bolivarian Rep. of Venezuela 9.3 0.1 0.1 -3 25Chile 7.5 0.1 0.1 22 15 Belarus 8.9 0.0 0.1 7 49
Above 40 5667.5 96.2 96.1 - - Above 40 6065.5 96.5 97.0 - -
a The figures are affected by the "INTRASTAT" system of recording trade between EU member States. Intra-EU (27) imports are underrecorded. To compensate for this under-recording, intra-EU (27) exports have been used to obtain total (World) imports.
Exports Imports
Merchandise trade of the European Union (27) by origin and destination, 2008
Annual percentage
change
Annual percentage
change Share Share

19
WO
RL
D T
RA
DE
DE
VE
LO
PM
EN
TS
I
Table I.15
(Billion dollars and percentage)
Destination Value Origin Value
2008 2000 2008 2007 2008 2008 2000 2008 2007 2008
Region Region World 782.0 100.0 100.0 10 9 World 762.6 100.0 100.0 7 23Asia 406.2 43.3 51.9 12 13 Asia 361.1 46.4 47.4 7 19North America 158.1 32.7 20.2 0 -4 Middle East 166.7 13.0 21.9 5 46Europe 119.3 17.8 15.3 12 6 North America 94.3 22.0 12.4 5 12Middle East 34.0 2.0 4.4 37 30 Europe 79.6 13.9 10.4 9 10CIS 19.3 0.2 2.5 51 54 South and Central America 22.2 2.2 2.9 21 13South and Central America 19.2 1.7 2.5 25 28 Africa 21.4 1.3 2.8 14 40Africa 12.5 0.9 1.6 22 19 CIS 14.8 1.3 1.9 57 28
Economy Economy China 146.2 8.9 18.7 16 13 China 143.3 14.5 18.8 8 12United States 137.4 30.0 17.6 -1 -4 United States 77.7 19.1 10.2 4 9European Union (27) 110.2 16.8 14.1 12 5 European Union (27) 70.3 12.6 9.2 9 8Korea, Republic of 59.5 6.4 7.6 8 9 Saudi Arabia 51.1 3.7 6.7 -5 45Taipei, Chinese 46.1 7.5 5.9 2 3 Australia 47.5 3.9 6.2 12 52
Above 5 499.4 69.6 63.9 - - Above 5 389.9 53.8 51.1 - -Hong Kong, China a 40.3 - - 7 4 United Arab Emirates 47.1 3.9 6.2 2 45Thailand 29.4 2.8 3.8 12 15 Indonesia 32.6 4.3 4.3 10 23Singapore 26.6 4.3 3.4 13 22 Korea, Republic of 29.5 5.4 3.9 0 8Australia 17.3 1.8 2.2 14 22 Qatar 26.6 1.5 3.5 14 57Russian Federation 16.5 0.1 2.1 53 53 Malaysia 23.2 3.8 3.0 12 33Malaysia 16.4 2.9 2.1 14 9 Taipei, Chinese 21.8 4.7 2.9 -2 10Indonesia 12.6 1.6 1.6 23 39 Thailand 20.8 2.8 2.7 9 13Panama 10.9 1.3 1.4 7 26 Iran, Islamic Rep. of 18.3 1.4 2.4 14 45United Arab Emirates 10.8 0.5 1.4 33 35 Kuwait 15.3 1.3 2.0 9 54Canada 10.8 1.6 1.4 6 2 Russian Federation 13.3 1.2 1.7 59 26Philippines 10.0 2.1 1.3 5 5 Canada 12.8 2.3 1.7 4 28Mexico 9.9 1.1 1.3 11 -3 Viet Nam 9.1 0.7 1.2 16 49India 7.9 0.5 1.0 39 28 South Africa 9.0 0.8 1.2 17 16Saudi Arabia 7.9 0.6 1.0 45 17 Brazil 8.7 0.8 1.1 18 45Viet Nam 7.8 0.4 1.0 37 38 Philippines 8.4 1.9 1.1 10 -3Brazil 5.9 0.5 0.8 31 48 Chile 7.9 0.7 1.0 12 -3South Africa 4.6 0.4 0.6 14 1 Singapore 7.9 1.7 1.0 -6 12Switzerland 4.3 0.4 0.6 25 44 Switzerland 6.4 0.9 0.8 2 23Oman 3.9 0.2 0.5 46 56 Oman 5.6 0.5 0.7 34 56Turkey 3.1 0.3 0.4 15 13 India 5.2 0.7 0.7 3 26Chile 2.7 0.1 0.4 45 74 Brunei Darussalam 4.5 0.4 0.6 7 81New Zealand 2.5 0.3 0.3 19 1 Sudan 4.3 0.1 0.6 -11 59Israel 2.2 0.3 0.3 58 15 Mexico 3.8 0.6 0.5 12 21Kuwait 2.1 0.1 0.3 40 26 New Zealand 2.9 0.6 0.4 6 8Ukraine 2.0 0.0 0.3 61 87 Peru 2.1 0.1 0.3 69 -5Qatar 2.0 0.1 0.3 26 9 Norway 2.1 0.3 0.3 37 24Iran, Islamic Rep. of 1.9 0.1 0.2 14 42 Nigeria 1.8 0.1 0.2 -18 168Egypt 1.9 0.2 0.2 13 44 Egypt 1.6 0.0 0.2 111 91Bahamas 1.8 0.1 0.2 2 45 Hong Kong, China 1.6 0.4 0.2 -5 7Pakistan 1.5 0.1 0.2 -11 -7 Iraq 1.5 0.2 0.2 12 49Norway 1.3 0.2 0.2 -31 18 Equatorial Guinea 1.1 0.0 0.1 82 94Colombia 1.1 0.1 0.1 29 -15 Algeria 1.0 0.0 0.1 200 160Algeria 1.1 0.0 0.1 96 24 Israel 0.9 0.2 0.1 8 2Argentina 1.0 0.2 0.1 27 18 Papua New Guinea 0.9 0.1 0.1 27 8Peru 1.0 0.1 0.1 44 79 Kazakhstan 0.8 0.0 0.1 20 111
Above 40 a 782.5 - - - - Above 40 750.3 98.5 98.4 - -
a Includes significant shipments recorded as exports to Hong Kong, China with China as final destination.
Merchandise trade of Japan by origin and destination, 2008
Annual percentage
change
Annual percentage
change Share Share
Exports Imports

20
WO
RL
D T
RA
DE
DE
VE
LO
PM
EN
TS
I
Table I.16
(Million dollars and percentage)
Value Share Value Share
2007 2007 2004-07 2006 2007 2007 2007 2004-07 2006 2007
European Union (27) World 1586629 100.0 14 13 21 World 1371589 100.0 12 10 19European Union (27) 918349 57.9 14 13 20 European Union (27) 823565 60.0 12 10 19United States 186557 11.8 10 11 14 United States 168917 12.3 9 5 14Switzerland 83728 5.3 14 8 26 Switzerland 58615 4.3 13 4 26Japan 26376 1.7 5 -4 14 Japan 18427 1.3 13 11 14Russian Federation 25930 1.6 32 20 43 China 18386 1.3 27 28 26
Above 5 1240938 78.2 - - - Above 5 1087911 79.3 - - -Norway 25875 1.6 16 13 27 Russian Federation 16020 1.2 18 11 19China 24001 1.5 30 9 45 Norway 15977 1.2 11 11 22Canada 15768 1.0 16 18 23 Turkey 15897 1.2 9 -4 21Singapore 15491 1.0 19 24 19 Canada 12762 0.9 15 16 24Australia 14617 0.9 19 10 28 Hong Kong, China 10919 0.8 20 18 34India 12754 0.8 42 38 45 Singapore 9548 0.7 16 10 29Hong Kong, China 11218 0.7 9 -15 28 India 9333 0.7 23 15 32Korea, Republic of 9804 0.6 13 16 16 Australia 8378 0.6 10 4 14Turkey 8813 0.6 23 25 21 Egypt 7590 0.6 13 -1 23Brazil 8693 0.5 24 15 33 Croatia 6599 0.5 16 9 12
Above 15 1387972 87.5 - - - Above 15 1200934 87.6 - - -United States
World 472680 100.0 13 13 16 World 341673 100.0 10 12 9European Union (27) 176509 37.3 ... ... ... European Union (27) 133350 39.0 ... ... ...Canada 42238 8.9 13 14 15 Canada 24617 7.2 6 8 4Japan 39615 8.4 4 -1 -2 Japan 24509 7.2 7 7 3Mexico 23397 4.9 10 6 10 Bermuda 16554 4.8 3 20 2Switzerland 15459 3.3 14 13 22 Mexico 15627 4.6 5 4 6
Above 5 297218 62.9 - - - Above 5 214658 62.8 - - -China 13964 3.0 23 27 24 Switzerland 14949 4.4 20 19 11Korea, Republic of 12518 2.6 11 17 4 India 9616 2.8 50 52 26Australia 10287 2.2 15 14 22 China 8770 2.6 14 16 14Brazil 9683 2.0 26 29 31 Taipei, Chinese 7171 2.1 8 5 4India 9208 1.9 28 32 37 Hong Kong, China 6887 2.0 13 14 12Singapore 7114 1.5 9 40 -11 Korea, Republic of 6563 1.9 6 6 2Bermuda 6956 1.5 16 26 10 Australia 5958 1.7 15 5 22Taipei, Chinese 6869 1.5 8 17 -7 Brazil 4028 1.2 28 58 21Hong Kong, China 5704 1.2 18 18 18 Singapore 3921 1.1 12 0 6Bolivarian Rep. of Venezuela 3823 0.8 17 17 26 Israel 3082 0.9 13 7 21
Above 15 383344 81.1 - - - Above 15 285603 83.6 - - -Japan
World 127060 100.0 12 13 10 World 148685 100.0 7 9 11United States 33478 26.3 ... ... 7 United States 42658 28.7 ... ... 3European Union (27) 32940 25.9 ... ... ... European Union (27) 32671 22.0 ... ... ...Singapore 9943 7.8 ... ... 16 China 8071 5.4 ... ... 15Taipei, Chinese 9001 7.1 ... ... 19 Singapore 7953 5.3 ... ... 21China 8155 6.4 ... ... 8 Korea, Republic of 7142 4.8 ... ... 9
Above 5 93517 73.6 - - - Above 5 98494 66.2 - - -Korea, Republic of 7412 5.8 ... ... 33 Hong Kong, China 5881 4.0 ... ... 10Thailand 4217 3.3 ... ... 14 Taipei, Chinese 4148 2.8 ... ... 14Canada 2092 1.6 ... ... -3 Australia 3711 2.5 ... ... 17Switzerland 1723 1.4 ... ... 18 Switzerland 2897 1.9 ... ... 30Australia 1648 1.3 ... ... 2 Thailand 2780 1.9 ... ... 5Indonesia 1581 1.2 ... ... -14 United Arab Emirates 1917 1.3 ... ... 40Philippines 1368 1.1 ... ... 39 Philippines 1730 1.2 ... ... 6Saudi Arabia 1215 1.0 ... ... 44 Canada 1640 1.1 ... ... 11India 1170 0.9 ... ... 55 Indonesia 1622 1.1 ... ... 8United Arab Emirates 1019 0.8 ... ... -32 Malaysia 1318 0.9 ... ... 20
Above 15 116960 92.1 - - - Above 15 126138 84.8 - - -
Trade in commercial services of selected economies by origin and destination, 2007
Annual percentage change
Annual percentage change
Exports Imports

21
WO
RL
D T
RA
DE
DE
VE
LO
PM
EN
TS
I
Table I.16 (continued)
(Million dollars and percentage)
Value Share Value Share
2007 2007 2004-07 2006 2007 2007 2007 2004-07 2006 2007
Hong Kong, China a World 84643 100.0 15 14 16 World 42450 100.0 11 9 15China 20698 24.5 11 7 17 China 11271 26.6 10 8 14United States 17829 21.1 17 19 16 European Union (27) 7236 17.0 ... ... ...European Union (27) 15530 18.3 ... ... ... United States 6236 14.7 11 8 14Japan 5762 6.8 13 15 12 Japan 3498 8.2 9 7 12Taipei, Chinese 4640 5.5 5 3 -1 Singapore 2367 5.6 26 36 21
Above 5 64459 76.2 - - - Above 5 30608 72.1 - - -Singapore 2498 3.0 18 16 25 Australia 2219 5.2 5 2 6Korea, Republic of 2247 2.7 18 30 17 Taipei, Chinese 1653 3.9 10 7 13Australia 2128 2.5 27 28 10 Canada 1182 2.8 7 3 19Canada 1386 1.6 15 12 22 Thailand 1001 2.4 2 5 1Switzerland 1055 1.2 20 14 47 Korea, Republic of 743 1.8 -2 -14 8Malaysia 1038 1.2 15 12 23 Malaysia 662 1.6 17 16 22Thailand 802 0.9 12 6 3 Macao, China 597 1.4 10 8 19India 692 0.8 10 15 12 India 570 1.3 31 23 33Indonesia 662 0.8 27 26 24 United Arab Emirates 413 1.0 27 31 10Philippines 624 0.7 21 -9 31 Philippines 404 1.0 7 2 13
Above 15 77591 91.7 - - - Above 15 40052 94.4 - - -Singapore b, c
World 80490 100.0 20 20 26 World 74687 100.0 15 17 16United States 10044 12.5 22 27 23 United States 13191 17.7 11 6 18European Union (27) 9987 12.4 ... ... ... European Union (27) 10988 14.7 ... ... ...Japan 6456 8.0 14 16 17 Japan 3722 5.0 8 42 -9China 4318 5.4 24 15 52 Hong Kong, China 2323 3.1 23 31 26Hong Kong, China 3560 4.4 20 11 28 China 2092 2.8 17 13 41
Above 5 34367 42.7 - - - Above 5 32317 43.3 - - -Australia 3324 4.1 18 17 15 Australia 1641 2.2 18 22 34Korea, Republic of 2704 3.4 16 5 26 India 1248 1.7 26 28 27Indonesia 2647 3.3 12 24 9 Switzerland 1206 1.6 17 7 35Malaysia 2609 3.2 14 10 29 Malaysia 1021 1.4 14 12 25India 2458 3.1 25 23 36 Korea, Republic of 1020 1.4 15 10 20Switzerland 2188 2.7 18 12 44 Indonesia 841 1.1 4 0 15Thailand 1908 2.4 13 7 17 Thailand 765 1.0 12 1 17Taipei, Chinese 1616 2.0 15 15 15 Taipei, Chinese 713 1.0 21 8 37United Arab Emirates 1233 1.5 20 26 33 Norway 517 0.7 16 -18 34Viet Nam 974 1.2 39 15 95 United Arab Emirates 343 0.5 17 15 32
Above 15 56028 69.6 - - - Above 15 41631 55.7 - - -Canada d
World 59014 100.0 ... 8 ... World 71919 100.0 ... 11 ...United States 31867 54.0 ... 3 ... United States 41176 57.3 ... 7 ...European Union (27) e 10842 18.4 ... ... ... European Union (27) e 12037 16.7 ... ... ...Bermuda 1576 2.7 ... 24 ... Japan 2490 3.5 ... 25 ...Japan 1324 2.2 ... 4 ... Hong Kong, China 1562 2.2 ... 8 ...Switzerland 1064 1.8 ... 81 ... Bermuda 1311 1.8 ... 7 ...
Above 5 46674 79.1 - - - Above 5 58575 81.4 - - -Hong Kong, China 1047 1.8 ... 36 ... Switzerland 1297 1.8 ... 36 ...China 986 1.7 ... 18 ... Mexico 1060 1.5 ... 5 ...Barbados 741 1.3 ... -19 ... Barbados 1035 1.4 ... 8 ...Australia 667 1.1 ... 7 ... China 1009 1.4 ... 47 ...Korea, Republic of 636 1.1 ... 16 ... Singapore 934 1.3 ... 23 ...Mexico 562 1.0 ... 3 ... Australia 575 0.8 ... 27 ...Taipei, Chinese 373 0.6 ... 8 ... Russian Federation 371 0.5 ... 11 ...Singapore 366 0.6 ... 29 ... Korea, Republic of 358 0.5 ... 33 ...Brazil 321 0.5 ... 29 ... Norway 357 0.5 ... 6 ...India 320 0.5 ... 20 ... India 355 0.5 ... 35 ...
Above 15 52694 89.3 - - - Above 15 65926 91.7 - - -
Trade in commercial services of selected economies by origin and destination, 2007
Annual percentage change
Annual percentage change
Exports Imports
22
WO
RL
D T
RA
DE
DE
VE
LO
PM
EN
TS
I
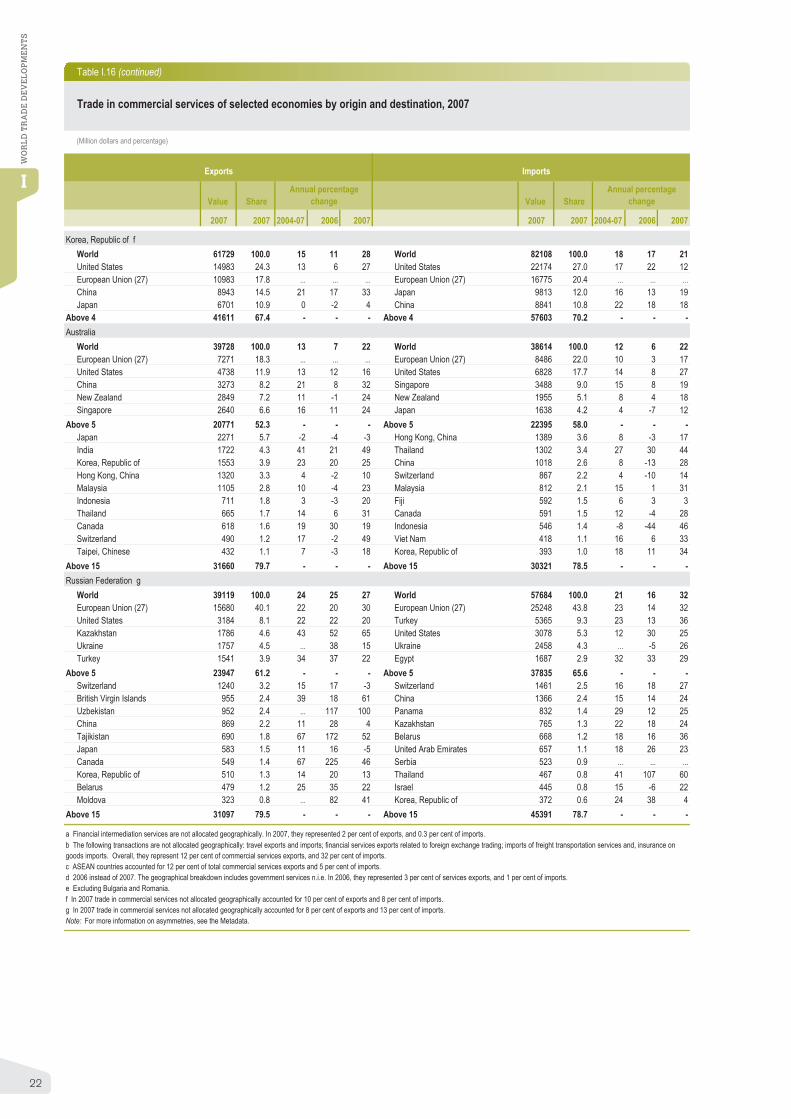
Table I.16 (continued)
(Million dollars and percentage)
Value Share Value Share
2007 2007 2004-07 2006 2007 2007 2007 2004-07 2006 2007
Korea, Republic of f World 61729 100.0 15 11 28 World 82108 100.0 18 17 21United States 14983 24.3 13 6 27 United States 22174 27.0 17 22 12European Union (27) 10983 17.8 ... ... ... European Union (27) 16775 20.4 ... ... ...China 8943 14.5 21 17 33 Japan 9813 12.0 16 13 19Japan 6701 10.9 0 -2 4 China 8841 10.8 22 18 18
Above 4 41611 67.4 - - - Above 4 57603 70.2 - - -Australia
World 39728 100.0 13 7 22 World 38614 100.0 12 6 22European Union (27) 7271 18.3 ... ... ... European Union (27) 8486 22.0 10 3 17United States 4738 11.9 13 12 16 United States 6828 17.7 14 8 27China 3273 8.2 21 8 32 Singapore 3488 9.0 15 8 19New Zealand 2849 7.2 11 -1 24 New Zealand 1955 5.1 8 4 18Singapore 2640 6.6 16 11 24 Japan 1638 4.2 4 -7 12
Above 5 20771 52.3 - - - Above 5 22395 58.0 - - -Japan 2271 5.7 -2 -4 -3 Hong Kong, China 1389 3.6 8 -3 17India 1722 4.3 41 21 49 Thailand 1302 3.4 27 30 44Korea, Republic of 1553 3.9 23 20 25 China 1018 2.6 8 -13 28Hong Kong, China 1320 3.3 4 -2 10 Switzerland 867 2.2 4 -10 14Malaysia 1105 2.8 10 -4 23 Malaysia 812 2.1 15 1 31Indonesia 711 1.8 3 -3 20 Fiji 592 1.5 6 3 3Thailand 665 1.7 14 6 31 Canada 591 1.5 12 -4 28Canada 618 1.6 19 30 19 Indonesia 546 1.4 -8 -44 46Switzerland 490 1.2 17 -2 49 Viet Nam 418 1.1 16 6 33Taipei, Chinese 432 1.1 7 -3 18 Korea, Republic of 393 1.0 18 11 34
Above 15 31660 79.7 - - - Above 15 30321 78.5 - - -Russian Federation g
World 39119 100.0 24 25 27 World 57684 100.0 21 16 32European Union (27) 15680 40.1 22 20 30 European Union (27) 25248 43.8 23 14 32United States 3184 8.1 22 22 20 Turkey 5365 9.3 23 13 36Kazakhstan 1786 4.6 43 52 65 United States 3078 5.3 12 30 25Ukraine 1757 4.5 ... 38 15 Ukraine 2458 4.3 ... -5 26Turkey 1541 3.9 34 37 22 Egypt 1687 2.9 32 33 29
Above 5 23947 61.2 - - - Above 5 37835 65.6 - - -Switzerland 1240 3.2 15 17 -3 Switzerland 1461 2.5 16 18 27British Virgin Islands 955 2.4 39 18 61 China 1366 2.4 15 14 24Uzbekistan 952 2.4 ... 117 100 Panama 832 1.4 29 12 25China 869 2.2 11 28 4 Kazakhstan 765 1.3 22 18 24Tajikistan 690 1.8 67 172 52 Belarus 668 1.2 18 16 36Japan 583 1.5 11 16 -5 United Arab Emirates 657 1.1 18 26 23Canada 549 1.4 67 225 46 Serbia 523 0.9 ... ... ...Korea, Republic of 510 1.3 14 20 13 Thailand 467 0.8 41 107 60Belarus 479 1.2 25 35 22 Israel 445 0.8 15 -6 22Moldova 323 0.8 ... 82 41 Korea, Republic of 372 0.6 24 38 4
Above 15 31097 79.5 - - - Above 15 45391 78.7 - - -
e Excluding Bulgaria and Romania. f In 2007 trade in commercial services not allocated geographically accounted for 10 per cent of exports and 8 per cent of imports.g In 2007 trade in commercial services not allocated geographically accounted for 8 per cent of exports and 13 per cent of imports.Note: For more information on asymmetries, see the Metadata.
a Financial intermediation services are not allocated geographically. In 2007, they represented 2 per cent of exports, and 0.3 per cent of imports.b The following transactions are not allocated geographically: travel exports and imports; financial services exports related to foreign exchange trading; imports of freight transportation services and, insurance on goods imports. Overall, they represent 12 per cent of commercial services exports, and 32 per cent of imports.c ASEAN countries accounted for 12 per cent of total commercial services exports and 5 per cent of imports.d 2006 instead of 2007. The geographical breakdown includes government services n.i.e. In 2006, they represented 3 per cent of services exports, and 1 per cent of imports.
Trade in commercial services of selected economies by origin and destination, 2007
Annual percentage change
Annual percentage change
Exports Imports

23
WO
RL
D T
RA
DE
DE
VE
LO
PM
EN
TS
I
5. Regional Trade Agreements
Table I.17
(Billion dollars and percentage)
Destination Value Value Value
2008 2000 2008 2007 2008 2008 2000 2008 2007 2008 2008 2000 2008 2007 2008
Exports Canada
Agricultural products 54 12.6 11.9 10 11 30 9.2 8.4 4 4 24 36.4 24.8 21 21Fuels and mining products 161 17.5 35.3 16 30 137 18.0 38.0 12 32 24 13.7 25.3 43 21Manufactures 214 63.5 46.9 4 -5 173 65.8 48.1 2 -7 41 47.2 42.5 18 6Total exports 456 100.0 100.0 8 9 360 100.0 100.0 5 7 96 100.0 100.0 24 15
MexicoAgricultural products 18 5.5 6.2 7 16 14 4.9 5.8 4 11 4 10.9 8.0 25 36Fuels and mining products 58 11.0 20.0 12 16 47 9.5 19.5 9 19 12 24.4 22.6 23 7Manufactures 213 83.3 72.9 8 4 179 85.6 74.2 5 1 34 63.1 67.2 28 23Total exports 292 100.0 100.0 9 7 241 100.0 100.0 6 5 51 100.0 100.0 28 21
United StatesAgricultural products 140 9.1 10.9 23 23 40 6.6 9.6 15 19 100 10.6 11.5 26 25Fuels and mining products 126 3.6 9.8 20 49 42 4.6 10.2 15 41 84 3.0 9.6 22 54Manufactures 963 83.0 74.8 10 7 318 85.4 77.0 4 3 645 81.6 73.7 13 10Total exports 1287 100.0 100.0 12 12 412 100.0 100.0 6 7 875 100.0 100.0 15 15
NAFTAAgricultural products 212 9.4 10.4 18 19 84 7.2 8.3 9 12 128 12.2 12.6 25 24Fuels and mining products 346 7.7 17.0 17 34 226 10.4 22.3 12 31 120 4.3 11.8 27 40Manufactures 1390 78.6 68.3 8 5 669 78.5 66.1 3 0 720 78.8 70.5 14 10Total exports 2036 100.0 100.0 11 11 1013 100.0 100.0 5 7 1022 100.0 100.0 17 15
ImportsCanada
Agricultural products 31 6.4 7.4 14 10 20 6.3 8.2 16 11 11 6.5 6.4 12 9Fuels and mining products 65 7.7 15.5 10 33 26 4.3 10.7 15 36 39 15.0 22.1 8 30Manufactures 308 83.6 73.7 7 2 186 87.5 77.6 6 -1 122 75.4 68.4 10 8Total imports 418 100.0 100.0 9 7 240 100.0 100.0 8 4 178 100.0 100.0 10 12
MexicoAgricultural products 27 6.1 8.4 19 18 22 6.8 13.0 19 21 5 4.2 3.4 19 7Fuels and mining products 40 4.9 12.4 23 37 25 5.0 14.6 17 44 15 4.7 10.0 33 29Manufactures 251 83.4 77.6 2 11 121 86.6 71.8 1 5 129 74.6 83.9 2 18Total imports 323 100.0 100.0 10 9 169 100.0 100.0 7 9 154 100.0 100.0 14 10
United StatesAgricultural products 116 5.5 5.3 6 6 41 7.6 7.4 5 4 75 4.6 4.6 6 7Fuels and mining products 558 13.3 25.7 8 30 179 14.8 32.0 6 30 379 12.7 23.5 8 30Manufactures 1417 76.9 65.3 4 1 309 71.2 55.4 4 -5 1107 79.3 68.7 5 2Total imports 2169 100.0 100.0 5 7 559 100.0 100.0 5 5 1611 100.0 100.0 6 8
NAFTAAgricultural products 174 5.7 6.0 9 8 83 7.1 8.5 10 10 92 4.7 4.7 8 7Fuels and mining products 663 11.6 22.8 9 31 229 10.2 23.7 8 32 434 12.5 22.3 9 30Manufactures 1976 78.6 67.9 5 2 617 78.3 63.7 4 -2 1359 78.7 69.9 5 4Total imports 2911 100.0 100.0 6 8 968 100.0 100.0 6 5 1943 100.0 100.0 7 9
NAFTA Other origin/destinationAnnual
percentage change
Merchandise trade of NAFTA countries by major product group and by origin/destination, 2008
Annual percentage
change Share Share Share
Annual percentage
change
World

24
WO
RL
D T
RA
DE
DE
VE
LO
PM
EN
TS
I
Table I.18
(Billion dollars and percentage)
Destination Value Value Value
2008 2000 2008 2007 2008 2008 2000 2008 2007 2008 2008 2000 2008 2007 2008
Exports Argentina
Agricultural products 37.5 45.4 53.6 35 30 3.7 28.4 23.2 29 24 33.8 53.4 62.7 36 31Fuels and mining products 8.8 20.6 12.6 -9 8 2.4 22.9 15.0 16 8 6.4 19.5 11.9 -16 7Manufactures 21.6 32.4 30.8 17 25 10.0 48.7 61.8 27 39 11.6 24.7 21.5 11 15Total exports 70.0 100.0 100.0 20 26 16.1 100.0 100.0 25 29 53.9 100.0 100.0 18 24
BrazilAgricultural products 61.4 28.1 31.0 22 27 1.1 10.5 5.3 26 21 60.2 30.9 34.2 22 27Fuels and mining products 44.0 11.8 22.2 22 37 2.5 5.7 11.3 25 34 41.6 12.8 23.6 21 37Manufactures 86.4 57.5 43.7 9 15 18.1 83.7 83.4 21 27 68.3 53.2 38.8 7 13Total exports 197.9 100.0 100.0 17 23 21.7 100.0 100.0 24 25 176.2 100.0 100.0 16 23
ParaguayAgricultural products 4.0 80.2 90.5 50 69 1.9 83.2 88.6 54 67 2.1 75.0 92.1 47 71Fuels and mining products 0.0 0.5 0.7 14 25 0.0 0.5 1.1 23 44 0.0 0.3 0.3 0 -13Manufactures 0.3 19.3 7.8 26 -9 0.2 16.5 10.3 34 -9 0.1 24.4 5.6 15 -9Total exports 4.4 100.0 100.0 46 59 2.1 100.0 100.0 50 53 2.3 100.0 100.0 43 65
UruguayAgricultural products 4.1 55.7 69.3 12 44 0.6 41.2 37.7 28 37 3.5 67.3 81.0 9 45Fuels and mining products 0.2 2.0 3.6 30 -4 0.1 4.1 5.6 373 -13 0.1 0.3 2.9 -20 4Manufactures 1.5 41.4 25.9 15 15 0.9 54.6 56.7 22 29 0.6 30.8 14.6 7 0Total exports 5.9 100.0 100.0 13 32 1.6 100.0 100.0 32 28 4.3 100.0 100.0 7 33
MERCOSURAgricultural products 107.0 34.7 38.5 27 30 7.4 23.0 17.7 33 33 99.7 37.9 42.1 26 30Fuels and mining products 53.1 14.1 19.1 14 31 5.0 13.6 12.0 22 19 48.1 14.3 20.3 13 32Manufactures 109.9 48.8 39.5 11 17 29.2 63.3 70.3 23 30 80.6 45.0 34.1 8 13Total exports 278.3 100.0 100.0 18 24 41.6 100.0 100.0 26 28 236.8 100.0 100.0 16 24
ImportsArgentina
Agricultural products 3.2 6.5 5.6 59 46 2.1 9.2 10.5 86 61 1.1 5.5 3.0 31 23Fuels and mining products 6.3 6.2 10.9 41 51 2.0 9.3 10.0 36 21 4.2 5.0 11.4 44 72Manufactures 46.3 87.1 80.7 29 22 16.2 81.5 79.5 22 23 30.2 89.4 81.3 32 21Total imports 57.4 100.0 100.0 31 28 20.3 100.0 100.0 27 26 37.1 100.0 100.0 33 30
BrazilAgricultural products 10.2 8.5 5.6 32 34 4.6 34.1 28.6 33 27 5.6 4.3 3.4 32 40Fuels and mining products 44.0 17.9 24.1 30 49 2.3 20.0 14.2 22 12 41.7 17.6 25.1 30 52Manufactures 128.2 73.4 70.3 20 58 9.2 46.0 57.2 28 39 119.1 78.0 71.5 20 60Total imports 182.4 100.0 100.0 32 44 16.0 100.0 100.0 29 30 166.4 100.0 100.0 32 46
ParaguayAgricultural products 0.7 17.8 7.1 36 33 0.6 25.7 13.4 56 31 0.1 9.3 2.5 -11 41Fuels and mining products 1.7 14.3 16.2 27 65 0.8 20.9 18.4 104 15 0.9 7.2 14.7 -31 175Manufactures 7.8 67.9 76.6 20 39 2.9 53.2 68.2 58 41 4.9 83.5 82.7 6 38Total imports 10.2 100.0 100.0 22 42 4.3 100.0 100.0 66 34 5.9 100.0 100.0 1 48
UruguayAgricultural products 0.9 14.1 10.1 21 40 0.6 21.7 15.7 20 44 0.3 8.2 5.7 25 34Fuels and mining products 2.7 16.4 30.6 -5 108 1.2 10.6 29.3 19 107 1.6 20.9 31.6 -17 110Manufactures 5.3 69.4 59.3 27 46 2.2 67.7 54.9 16 37 3.1 70.8 62.7 36 53Total imports 8.9 100.0 100.0 17 59 3.9 100.0 100.0 17 53 5.0 100.0 100.0 17 63
MERCOSURAgricultural products 15.1 8.4 5.8 37 37 7.9 22.7 17.7 43 37 7.2 4.8 3.3 30 37Fuels and mining products 54.6 14.5 21.1 29 52 6.2 15.0 14.0 34 26 48.4 14.3 22.6 28 56Manufactures 187.6 77.0 72.5 23 46 30.4 62.3 68.2 26 30 157.2 80.7 73.3 22 50Total imports 259.0 100.0 100.0 31 41 44.5 100.0 100.0 30 30 214.4 100.0 100.0 31 43
MERCOSUR Other origin/destinationAnnual
percentage change
Merchandise trade of MERCOSUR countries by major product group and by origin/destination, 2008
Annual percentage
change Share Share Share
Annual percentage
change
World

25
WO
RL
D T
RA
DE
DE
VE
LO
PM
EN
TS
I
Table I.19
(Billion dollars and percentage)
Destination Value Value Value
2008 2000 2008 2007 2008 2008 2000 2008 2007 2008 2008 2000 2008 2007 2008
Exports Bolivia
Agricultural products 1.1 35.4 17.1 19 26 0.4 86.1 72.9 23 23 0.7 21.8 12.3 17 28Fuels and mining products 4.5 34.2 70.4 16 50 0.1 3.5 16.6 -38 5 4.5 42.4 75.1 19 52Manufactures 0.6 25.1 9.0 6 31 0.1 10.0 10.7 0 25 0.5 29.1 8.9 7 32Total exports 6.4 100.0 100.0 15 45 0.5 100.0 100.0 2 19 5.9 100.0 100.0 17 47
ColombiaAgricultural products 6.7 23.6 17.8 19 14 0.2 10.5 10.1 13 2 6.4 24.5 18.3 19 15Fuels and mining products 18.0 44.1 48.0 16 56 0.2 18.4 9.3 -19 9 17.8 46.0 50.7 17 57Manufactures 11.9 32.3 31.5 35 1 2.0 71.2 80.6 12 17 9.9 29.5 28.1 40 -2Total exports 37.6 100.0 100.0 23 25 2.5 100.0 100.0 8 14 35.2 100.0 100.0 24 26
EcuadorAgricultural products 5.2 39.5 28.3 8 23 0.3 22.9 10.7 -12 11 5.0 41.6 31.0 9 24Fuels and mining products 11.8 49.8 63.7 10 40 1.5 42.6 59.8 47 11 10.3 50.7 64.3 5 46Manufactures 1.4 8.4 7.6 -3 30 0.7 34.5 29.5 -2 33 0.7 5.1 4.2 -3 28Total exports 18.5 100.0 100.0 13 29 2.5 100.0 100.0 22 16 16.0 100.0 100.0 11 32
PeruAgricultural products 5.3 27.2 16.7 10 26 0.2 19.6 15.4 -2 46 5.0 27.6 16.8 10 25Fuels and mining products 16.2 37.7 51.5 22 1 0.5 30.9 28.9 15 1 15.8 38.1 52.7 22 1Manufactures 4.1 16.5 13.0 21 22 0.9 49.6 55.7 30 44 3.2 14.9 10.8 20 18Total exports 31.5 100.0 100.0 17 13 1.6 100.0 100.0 19 28 30.0 100.0 100.0 17 12
Andean CommunityAgricultural products 18.3 28.1 19.4 13 21 1.1 25.1 16.1 5 18 17.2 28.3 19.7 14 21Fuels and mining products 50.6 43.0 53.8 17 30 2.3 25.2 32.1 23 8 48.4 44.5 55.5 17 31Manufactures 17.9 23.2 19.1 28 8 3.6 49.7 51.8 12 26 14.3 21.0 16.4 32 4Total exports 94.1 100.0 100.0 18 23 7.0 100.0 100.0 15 18 87.1 100.0 100.0 19 23
ImportsBolivia
Agricultural products 0.5 15.1 10.0 34 25 0.1 14.1 10.5 5 18 0.4 15.2 10.0 39 26Fuels and mining products 0.6 5.5 12.6 3 106 0.0 4.2 5.5 8 115 0.6 5.6 13.4 3 105Manufactures 3.8 78.6 76.8 24 40 0.4 81.7 84.0 23 66 3.4 78.4 76.0 24 38Total imports 5.0 100.0 100.0 23 44 0.5 100.0 100.0 19 61 4.5 100.0 100.0 23 43
ColombiaAgricultural products 4.5 14.9 11.4 28 31 0.6 47.9 22.4 2 34 4.0 12.6 10.7 33 30Fuels and mining products 2.8 4.5 7.1 25 44 0.3 10.3 12.8 15 -7 2.5 4.1 6.7 28 55Manufactures 31.8 80.1 80.2 25 18 1.6 41.8 64.8 28 11 30.2 82.8 81.2 25 18Total imports 39.7 100.0 100.0 26 21 2.5 100.0 100.0 20 12 37.1 100.0 100.0 26 21
EcuadorAgricultural products 1.8 11.4 9.7 31 40 0.4 13.7 15.2 28 40 1.5 10.9 8.9 32 40Fuels and mining products 3.7 9.2 19.8 11 23 0.2 3.5 7.4 -23 -48 3.5 10.2 21.6 17 32Manufactures 13.2 70.8 70.5 9 44 1.8 81.9 77.4 9 29 11.4 68.8 69.5 8 47Total imports 18.7 100.0 100.0 15 34 2.3 100.0 100.0 4 17 16.4 100.0 100.0 17 37
PeruAgricultural products 3.4 13.5 11.4 37 39 0.4 11.0 12.2 20 32 3.0 13.8 11.3 40 40Fuels and mining products 5.8 16.2 19.5 28 46 2.0 52.4 60.6 25 25 3.8 12.0 14.4 30 60Manufactures 20.7 70.3 69.0 35 48 0.9 36.6 27.2 19 20 19.8 74.2 74.2 36 50Total imports 30.0 100.0 100.0 34 46 3.3 100.0 100.0 23 25 26.7 100.0 100.0 36 50
Andean CommunityAgricultural products 10.3 14.0 11.0 32 35 1.4 24.6 15.9 13 34 8.9 12.9 10.5 35 35Fuels and mining products 13.0 8.8 13.9 20 40 2.5 22.6 29.2 13 10 10.5 7.4 12.4 23 50Manufactures 69.5 75.6 74.5 24 32 4.8 52.6 54.9 18 23 64.7 77.9 76.5 25 32Total imports 93.3 100.0 100.0 25 32 8.7 100.0 100.0 16 20 84.7 100.0 100.0 27 33
Andean Community Other origin/destinationAnnual
percentage change
Merchandise trade of Andean Community countries by major product group and by origin/destination, 2008
Annual percentage
change Share Share Share
Annual percentage
change
World
26
WO
RL
D T
RA
DE
DE
VE
LO
PM
EN
TS
I
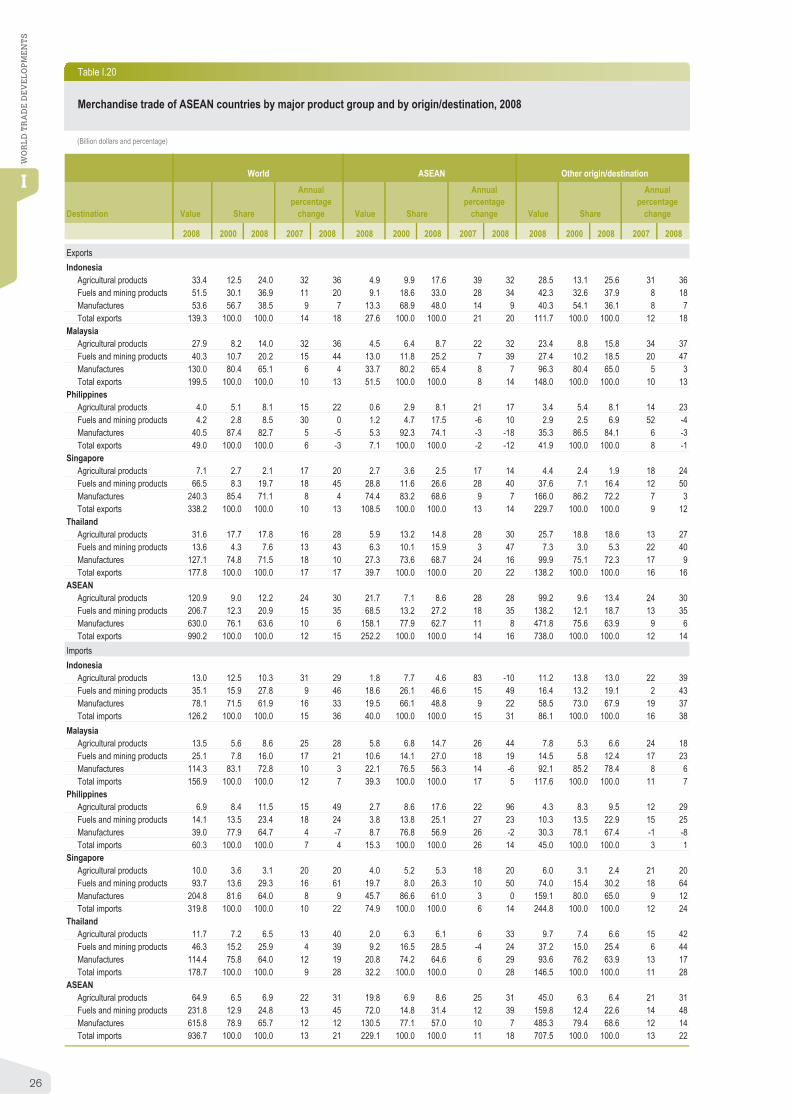
Table I.20
(Billion dollars and percentage)
Destination Value Value Value
2008 2000 2008 2007 2008 2008 2000 2008 2007 2008 2008 2000 2008 2007 2008
Exports Indonesia
Agricultural products 33.4 12.5 24.0 32 36 4.9 9.9 17.6 39 32 28.5 13.1 25.6 31 36Fuels and mining products 51.5 30.1 36.9 11 20 9.1 18.6 33.0 28 34 42.3 32.6 37.9 8 18Manufactures 53.6 56.7 38.5 9 7 13.3 68.9 48.0 14 9 40.3 54.1 36.1 8 7Total exports 139.3 100.0 100.0 14 18 27.6 100.0 100.0 21 20 111.7 100.0 100.0 12 18
MalaysiaAgricultural products 27.9 8.2 14.0 32 36 4.5 6.4 8.7 22 32 23.4 8.8 15.8 34 37Fuels and mining products 40.3 10.7 20.2 15 44 13.0 11.8 25.2 7 39 27.4 10.2 18.5 20 47Manufactures 130.0 80.4 65.1 6 4 33.7 80.2 65.4 8 7 96.3 80.4 65.0 5 3Total exports 199.5 100.0 100.0 10 13 51.5 100.0 100.0 8 14 148.0 100.0 100.0 10 13
PhilippinesAgricultural products 4.0 5.1 8.1 15 22 0.6 2.9 8.1 21 17 3.4 5.4 8.1 14 23Fuels and mining products 4.2 2.8 8.5 30 0 1.2 4.7 17.5 -6 10 2.9 2.5 6.9 52 -4Manufactures 40.5 87.4 82.7 5 -5 5.3 92.3 74.1 -3 -18 35.3 86.5 84.1 6 -3Total exports 49.0 100.0 100.0 6 -3 7.1 100.0 100.0 -2 -12 41.9 100.0 100.0 8 -1
SingaporeAgricultural products 7.1 2.7 2.1 17 20 2.7 3.6 2.5 17 14 4.4 2.4 1.9 18 24Fuels and mining products 66.5 8.3 19.7 18 45 28.8 11.6 26.6 28 40 37.6 7.1 16.4 12 50Manufactures 240.3 85.4 71.1 8 4 74.4 83.2 68.6 9 7 166.0 86.2 72.2 7 3Total exports 338.2 100.0 100.0 10 13 108.5 100.0 100.0 13 14 229.7 100.0 100.0 9 12
ThailandAgricultural products 31.6 17.7 17.8 16 28 5.9 13.2 14.8 28 30 25.7 18.8 18.6 13 27Fuels and mining products 13.6 4.3 7.6 13 43 6.3 10.1 15.9 3 47 7.3 3.0 5.3 22 40Manufactures 127.1 74.8 71.5 18 10 27.3 73.6 68.7 24 16 99.9 75.1 72.3 17 9Total exports 177.8 100.0 100.0 17 17 39.7 100.0 100.0 20 22 138.2 100.0 100.0 16 16
ASEANAgricultural products 120.9 9.0 12.2 24 30 21.7 7.1 8.6 28 28 99.2 9.6 13.4 24 30Fuels and mining products 206.7 12.3 20.9 15 35 68.5 13.2 27.2 18 35 138.2 12.1 18.7 13 35Manufactures 630.0 76.1 63.6 10 6 158.1 77.9 62.7 11 8 471.8 75.6 63.9 9 6Total exports 990.2 100.0 100.0 12 15 252.2 100.0 100.0 14 16 738.0 100.0 100.0 12 14
ImportsIndonesia
Agricultural products 13.0 12.5 10.3 31 29 1.8 7.7 4.6 83 -10 11.2 13.8 13.0 22 39Fuels and mining products 35.1 15.9 27.8 9 46 18.6 26.1 46.6 15 49 16.4 13.2 19.1 2 43Manufactures 78.1 71.5 61.9 16 33 19.5 66.1 48.8 9 22 58.5 73.0 67.9 19 37Total imports 126.2 100.0 100.0 15 36 40.0 100.0 100.0 15 31 86.1 100.0 100.0 16 38
MalaysiaAgricultural products 13.5 5.6 8.6 25 28 5.8 6.8 14.7 26 44 7.8 5.3 6.6 24 18Fuels and mining products 25.1 7.8 16.0 17 21 10.6 14.1 27.0 18 19 14.5 5.8 12.4 17 23Manufactures 114.3 83.1 72.8 10 3 22.1 76.5 56.3 14 -6 92.1 85.2 78.4 8 6Total imports 156.9 100.0 100.0 12 7 39.3 100.0 100.0 17 5 117.6 100.0 100.0 11 7
PhilippinesAgricultural products 6.9 8.4 11.5 15 49 2.7 8.6 17.6 22 96 4.3 8.3 9.5 12 29Fuels and mining products 14.1 13.5 23.4 18 24 3.8 13.8 25.1 27 23 10.3 13.5 22.9 15 25Manufactures 39.0 77.9 64.7 4 -7 8.7 76.8 56.9 26 -2 30.3 78.1 67.4 -1 -8Total imports 60.3 100.0 100.0 7 4 15.3 100.0 100.0 26 14 45.0 100.0 100.0 3 1
SingaporeAgricultural products 10.0 3.6 3.1 20 20 4.0 5.2 5.3 18 20 6.0 3.1 2.4 21 20Fuels and mining products 93.7 13.6 29.3 16 61 19.7 8.0 26.3 10 50 74.0 15.4 30.2 18 64Manufactures 204.8 81.6 64.0 8 9 45.7 86.6 61.0 3 0 159.1 80.0 65.0 9 12Total imports 319.8 100.0 100.0 10 22 74.9 100.0 100.0 6 14 244.8 100.0 100.0 12 24
ThailandAgricultural products 11.7 7.2 6.5 13 40 2.0 6.3 6.1 6 33 9.7 7.4 6.6 15 42Fuels and mining products 46.3 15.2 25.9 4 39 9.2 16.5 28.5 -4 24 37.2 15.0 25.4 6 44Manufactures 114.4 75.8 64.0 12 19 20.8 74.2 64.6 6 29 93.6 76.2 63.9 13 17Total imports 178.7 100.0 100.0 9 28 32.2 100.0 100.0 0 28 146.5 100.0 100.0 11 28
ASEANAgricultural products 64.9 6.5 6.9 22 31 19.8 6.9 8.6 25 31 45.0 6.3 6.4 21 31Fuels and mining products 231.8 12.9 24.8 13 45 72.0 14.8 31.4 12 39 159.8 12.4 22.6 14 48Manufactures 615.8 78.9 65.7 12 12 130.5 77.1 57.0 10 7 485.3 79.4 68.6 12 14Total imports 936.7 100.0 100.0 13 21 229.1 100.0 100.0 11 18 707.5 100.0 100.0 13 22
ASEAN Other origin/destinationAnnual
percentage change
Merchandise trade of ASEAN countries by major product group and by origin/destination, 2008
Annual percentage
change Share Share Share
Annual percentage
change
World

27
WO
RL
D T
RA
DE
DE
VE
LO
PM
EN
TS
I
6. Least-developed countries
Table I.21
(Million dollars and percentage)
2007 2000 2007 2000 2007 2000 2007
LDCs 422700 24 33 21 30 4 3Afghanistan 9658 ... ... ... ... ... ...Angola 61403 90 73 87 72 3 1Bangladesh 68415 14 19 14 18 1 1Benin 5428 23 24 17 19 6 5Bhutan 1096 30 52 26 47 4 5Burkina Faso 6767 9 10 8 9 1 1Burundi 974 7 6 7 5 0 1Cambodia 8350 49 67 37 49 11 18Central African Republic 1712 18 13 17 11 1 2Chad 7085 15 53 13 52 2 1Comoros 449 24 14 6 3 19 10Congo, Dem. Rep. of 8953 22 ... 21 ... 2 ...Djibouti 830 18 18 6 7 13 11Equatorial Guinea 9923 100 50 100 49 1 0Eritrea 1375 14 ... 6 ... 9 ...Ethiopia 19395 11 13 6 7 5 6Gambia 644 45 36 30 18 15 18Guinea 4564 22 27 21 26 1 1Guinea-Bissau 357 31 27 29 24 2 3Haiti 6715 13 10 9 8 4 2Kiribati 78 27 ... 13 ... 14 ...Lao People's Dem. Rep. 4108 28 37 20 29 9 7Lesotho 1600 29 55 25 50 4 4Liberia 735 ... 48 ... 27 ... 22Madagascar 7382 29 26 21 15 8 11Malawi 3563 25 ... 23 ... 2 ...Maldives 1055 72 81 17 22 55 59Mali 6863 26 28 23 23 4 5Mauritania 2644 36 ... 33 ... 3 ...Mozambique 7790 16 36 9 31 8 5Myanmar 19618 24 ... 19 ... 5 ...Nepal 10315 22 12 14 9 7 3Niger 4170 18 18 16 16 2 2Rwanda 3339 6 9 4 6 2 4Samoa 525 ... 29 ... 3 ... 26Sao Tome and Principe 145 ... 8 ... 5 ... 3Senegal 11165 27 25 20 15 7 10Sierra Leone 1664 8 20 2 18 6 3Solomon Islands 388 38 58 23 41 15 17Somalia ... ... ... ... ... ... ...Sudan 46228 15 20 15 19 0 1Tanzania 16181 14 24 7 14 6 10Timor Leste 395 ... ... ... ... ... ...Togo 2499 31 35 27 27 3 8Tuvalu ... ... ... ... ... ... ...Uganda 11771 11 21 7 17 3 4Vanuatu 452 59 47 11 7 48 39Yemen 22523 42 34 40 31 2 3Zambia 11363 27 43 23 40 4 2
Memorandum item:World 54583800 25 32 20 25 5 6
Note: Trade in goods is derived from balance of payments statistics and does not correspond to the merchandise trade statistics given elsewhere in this report. Data are estimated for most countries. See the Metadata.
Ratio of exports of goods and commercial services to GDP of the least-developed countries, 2007
Commercial services
Value Ratio to GDP
Goods and commercial servicesGDP Goods
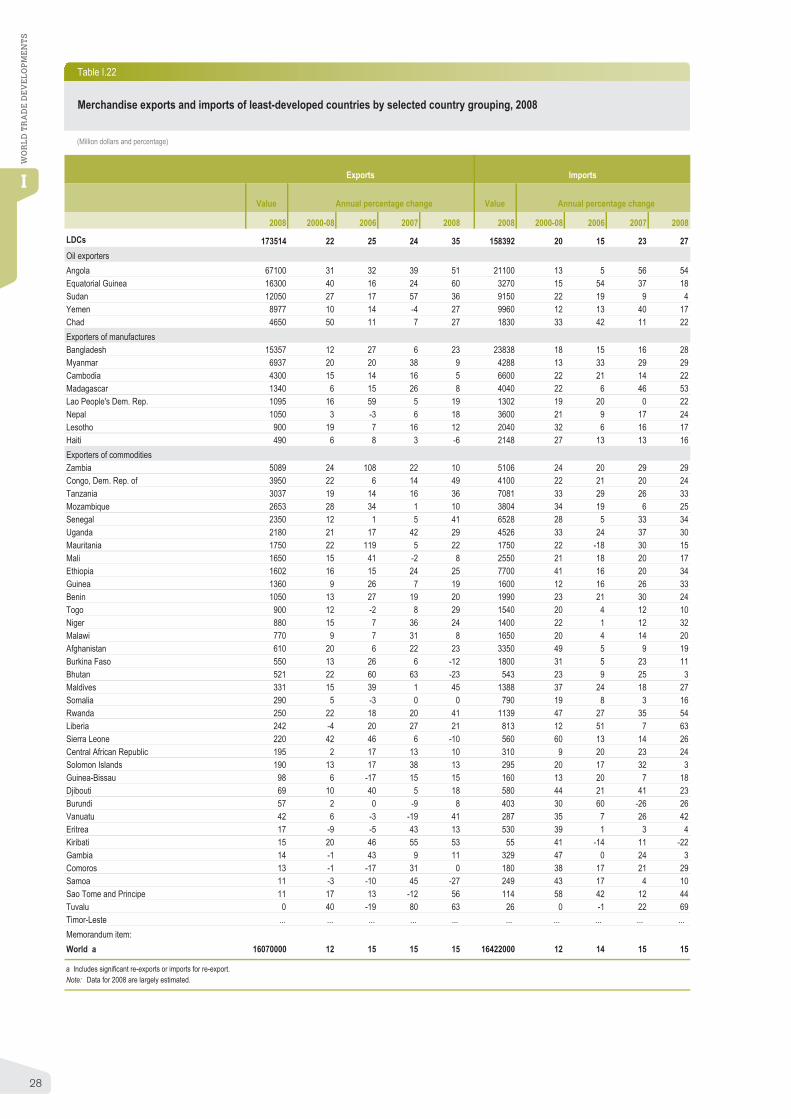
28
WO
RL
D T
RA
DE
DE
VE
LO
PM
EN
TS
I
Table I.22
Value Value
2008 2000-08 2006 2007 2008 2008 2000-08 2006 2007 2008
LDCs 173514 22 25 24 35 158392 20 15 23 27Oil exporters Angola 67100 31 32 39 51 21100 13 5 56 54Equatorial Guinea 16300 40 16 24 60 3270 15 54 37 18Sudan 12050 27 17 57 36 9150 22 19 9 4Yemen 8977 10 14 -4 27 9960 12 13 40 17Chad 4650 50 11 7 27 1830 33 42 11 22Exporters of manufactures Bangladesh 15357 12 27 6 23 23838 18 15 16 28Myanmar 6937 20 20 38 9 4288 13 33 29 29Cambodia 4300 15 14 16 5 6600 22 21 14 22Madagascar 1340 6 15 26 8 4040 22 6 46 53Lao People's Dem. Rep. 1095 16 59 5 19 1302 19 20 0 22Nepal 1050 3 -3 6 18 3600 21 9 17 24Lesotho 900 19 7 16 12 2040 32 6 16 17Haiti 490 6 8 3 -6 2148 27 13 13 16Exporters of commodities Zambia 5089 24 108 22 10 5106 24 20 29 29Congo, Dem. Rep. of 3950 22 6 14 49 4100 22 21 20 24Tanzania 3037 19 14 16 36 7081 33 29 26 33Mozambique 2653 28 34 1 10 3804 34 19 6 25Senegal 2350 12 1 5 41 6528 28 5 33 34Uganda 2180 21 17 42 29 4526 33 24 37 30Mauritania 1750 22 119 5 22 1750 22 -18 30 15Mali 1650 15 41 -2 8 2550 21 18 20 17Ethiopia 1602 16 15 24 25 7700 41 16 20 34Guinea 1360 9 26 7 19 1600 12 16 26 33Benin 1050 13 27 19 20 1990 23 21 30 24Togo 900 12 -2 8 29 1540 20 4 12 10Niger 880 15 7 36 24 1400 22 1 12 32Malawi 770 9 7 31 8 1650 20 4 14 20Afghanistan 610 20 6 22 23 3350 49 5 9 19Burkina Faso 550 13 26 6 -12 1800 31 5 23 11Bhutan 521 22 60 63 -23 543 23 9 25 3Maldives 331 15 39 1 45 1388 37 24 18 27Somalia 290 5 -3 0 0 790 19 8 3 16Rwanda 250 22 18 20 41 1139 47 27 35 54Liberia 242 -4 20 27 21 813 12 51 7 63Sierra Leone 220 42 46 6 -10 560 60 13 14 26Central African Republic 195 2 17 13 10 310 9 20 23 24Solomon Islands 190 13 17 38 13 295 20 17 32 3Guinea-Bissau 98 6 -17 15 15 160 13 20 7 18Djibouti 69 10 40 5 18 580 44 21 41 23Burundi 57 2 0 -9 8 403 30 60 -26 26Vanuatu 42 6 -3 -19 41 287 35 7 26 42Eritrea 17 -9 -5 43 13 530 39 1 3 4Kiribati 15 20 46 55 53 55 41 -14 11 -22Gambia 14 -1 43 9 11 329 47 0 24 3Comoros 13 -1 -17 31 0 180 38 17 21 29Samoa 11 -3 -10 45 -27 249 43 17 4 10Sao Tome and Principe 11 17 13 -12 56 114 58 42 12 44Tuvalu 0 40 -19 80 63 26 0 -1 22 69Timor-Leste ... ... ... ... ... ... ... ... ... ...Memorandum item: World a 16070000 12 15 15 15 16422000 12 14 15 15
a Includes significant re-exports or imports for re-export. Note: Data for 2008 are largely estimated.
Annual percentage change Annual percentage change
Merchandise exports and imports of least-developed countries by selected country grouping, 2008
(Million dollars and percentage)
Exports Imports

29
WO
RL
D T
RA
DE
DE
VE
LO
PM
EN
TS
I
Table I.23
(Million dollars and percentage)
Value Value Value
2008 2007 2008 2008 2007 2008 2008 2007 2008
A. Agricultural products Total LDCs 4616 23 3 Total LDCs 6192 8 17 Total LDCs 806 -5 13
Uganda 527 25 23 Myanmar 2120 7 25 Liberia 167 -9 22Ethiopia 481 27 29 Tanzania 392 -3 57 Bangladesh 163 -14 -10Tanzania 418 28 -9 Bangladesh 303 12 22 Ethiopia 140 31 64Madagascar 396 2 27 Solomon Islands 295 45 10 Malawi 65 -6 35Senegal 320 32 -20 Mozambique 257 35 35 Madagascar 42 14 -13Bangladesh 318 10 3 Benin 248 4 40 Tanzania 37 45 15Malawi 273 41 -3 Burkina Faso 243 11 -14 Sudan 33 19 31Togo 256 29 45 Vanuatu 221 12 1 Haiti 30 6 16Mozambique 228 49 -15 Afghanistan 186 61 27 Uganda 20 -6 12Congo, Dem. Rep. of 205 27 7 Lao People's Dem. Rep. 172 -4 20 Togo 16 181 126Sudan 159 47 -1 Nepal 150 37 13 Rwanda 11 13 39Others (39) 1055 14 -6 Others (39) 1604 -2 4 Others (39) 82 -26 -16
B. Fuels and mining products Total LDCs 20557 46 89 Total LDCs 59777 15 53 Total LDCs 29594 8 58
Angola 11150 82 170 Angola 25691 17 59 Angola 22125 11 58Equatorial Guinea 5701 37 106 Sudan 11995 48 61 Equatorial Guinea 3460 -5 88Mozambique 1041 15 -36 Yemen 7434 -7 39 Chad 3446 12 55Mauritania 797 17 27 Equatorial Guinea 5038 -5 47 Guinea 211 34 30Guinea 595 39 19 Myanmar 3238 1 48 Congo, Dem. Rep. of 116 1062 152Congo, Dem. Rep. of 507 79 22 Congo, Dem. Rep. of 1699 27 254 Sierra Leone 52 69 -14Zambia 337 17 -15 Mauritania 1039 42 84 Mauritania 47 -100 ...Senegal 93 3 145 Zambia 991 16 -1 Zambia 46 66 5Others (42) 338 46 -13 Others (42) 2653 32 16 Others (42) 92 -46 -72
C. Manufactures Total LDCs 11359 -2 6 Total LDCs 2991 22 20 Total LDCs 9224 12 3
Bangladesh 7696 5 16 Bangladesh 746 -4 22 Bangladesh 4562 6 13Cambodia 1063 11 15 Nepal 464 58 38 Cambodia 2822 14 1Madagascar 387 17 -3 Myanmar 367 36 10 Haiti 455 1 -9Congo, Dem. Rep. of 322 -9 -11 Vanuatu 298 -87 26186 Lesotho 396 6 -14Lesotho 248 114 47 Cambodia 204 8 -5 Madagascar 319 21 -3Liberia 235 -58 -46 Senegal 173 106 42 Equatorial Guinea 203 134 -9Myanmar 229 -16 -9 Angola 126 -60 97 Congo, Dem. Rep. of 150 105 -4Angola 188 -26 -35 Bhutan 124 39 -23 Nepal 104 -8 -5Lao People's Dem. Rep. 170 -7 7 Liberia 91 185 -72 Lao People's Dem. Rep. 45 31 141Equatorial Guinea 159 27 -14 Lao People's Dem. Rep. 69 66 80 Angola 35 11 -38Nepal 118 3 6 Samoa 69 25 -25 Afghanistan 22 -32 137Sierra Leone 80 7 -33 Tanzania 43 45 22 Tanzania 19 6 23Ethiopia 72 13 1 Zambia 35 81 4 Malawi 14 9 -35Others (37) 406 2 -37 Others (37) 181 -15 38 Others (37) 79 110 -59
a Australia, China, Hong Kong, China; India, Indonesia, Japan, Malaysia, New Zealand, Pakistan, Philippines, Singapore, Taipei Chinese and Thailand.
Annual percentage
change
Annual percentage
change
Annual percentage
change
Imports of ag icultural products, fuels and manufactures of the European Union (27), Asia and North America from least-developed countries, 2008
European Union (27) Asia a North America
r
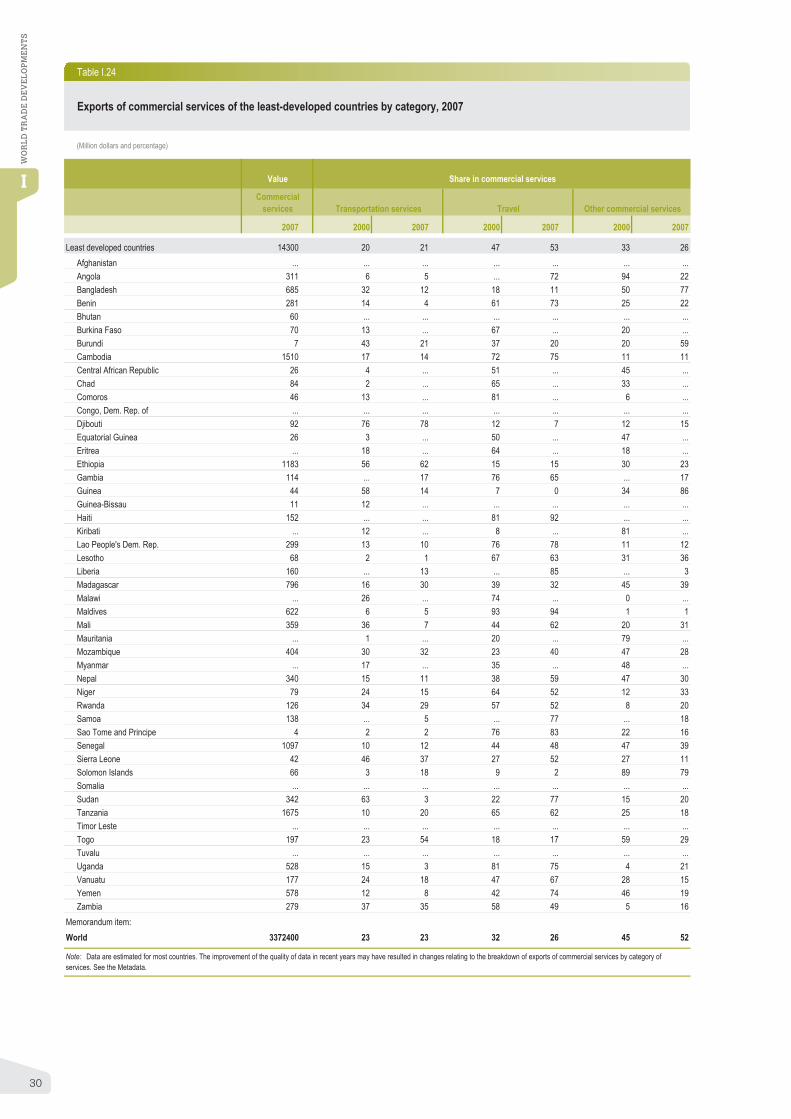
30
WO
RL
D T
RA
DE
DE
VE
LO
PM
EN
TS
I
Table I.24
(Million dollars and percentage)
2007 2000 2007 2000 2007 2000 2007
Least developed countries 14300 20 21 47 53 33 26Afghanistan ... ... ... ... ... ... ...Angola 311 6 5 ... 72 94 22Bangladesh 685 32 12 18 11 50 77Benin 281 14 4 61 73 25 22Bhutan 60 ... ... ... ... ... ...Burkina Faso 70 13 ... 67 ... 20 ...Burundi 7 43 21 37 20 20 59Cambodia 1510 17 14 72 75 11 11Central African Republic 26 4 ... 51 ... 45 ...Chad 84 2 ... 65 ... 33 ...Comoros 46 13 ... 81 ... 6 ...Congo, Dem. Rep. of ... ... ... ... ... ... ...Djibouti 92 76 78 12 7 12 15Equatorial Guinea 26 3 ... 50 ... 47 ...Eritrea ... 18 ... 64 ... 18 ...Ethiopia 1183 56 62 15 15 30 23Gambia 114 ... 17 76 65 ... 17Guinea 44 58 14 7 0 34 86Guinea-Bissau 11 12 ... ... ... ... ...Haiti 152 ... ... 81 92 ... ...Kiribati ... 12 ... 8 ... 81 ...Lao People's Dem. Rep. 299 13 10 76 78 11 12Lesotho 68 2 1 67 63 31 36Liberia 160 ... 13 ... 85 ... 3Madagascar 796 16 30 39 32 45 39Malawi ... 26 ... 74 ... 0 ...Maldives 622 6 5 93 94 1 1Mali 359 36 7 44 62 20 31Mauritania ... 1 ... 20 ... 79 ...Mozambique 404 30 32 23 40 47 28Myanmar ... 17 ... 35 ... 48 ...Nepal 340 15 11 38 59 47 30Niger 79 24 15 64 52 12 33Rwanda 126 34 29 57 52 8 20Samoa 138 ... 5 ... 77 ... 18Sao Tome and Principe 4 2 2 76 83 22 16Senegal 1097 10 12 44 48 47 39Sierra Leone 42 46 37 27 52 27 11Solomon Islands 66 3 18 9 2 89 79Somalia ... ... ... ... ... ... ...Sudan 342 63 3 22 77 15 20Tanzania 1675 10 20 65 62 25 18Timor Leste ... ... ... ... ... ... ...Togo 197 23 54 18 17 59 29Tuvalu ... ... ... ... ... ... ...Uganda 528 15 3 81 75 4 21Vanuatu 177 24 18 47 67 28 15Yemen 578 12 8 42 74 46 19Zambia 279 37 35 58 49 5 16
Memorandum item:World 3372400 23 23 32 26 45 52
Note: Data are estimated for most countries. The improvement of the quality of data in recent years may have resulted in changes relating to the breakdown of exports of commercial services by category of services. See the Metadata.
Exports of commercial services of the least-developed countries by category, 2007
Other commercial services
Value Share in commercial services
Commercial services Transportation services Travel

31
WO
RL
D T
RA
DE
DE
VE
LO
PM
EN
TS
I
7. Foreign affi liates trade in services
(Billion dollars and percentage)
Value Annual percentage change
2003 2004 2005 2006 2000-03 2004 2005 2006
Australia a, b 24.6 ... ... ... ... ... ... ...Austria b ... ... ... 29.6 ... ... ... ...Belgium b, c 31.7 41.8 47.8 ... 31 32 14 ...Canada d 70.6 74.8 81.8 98.0 -6 6 9 20Czech Republic e 0.3 0.4 1.0 1.3 -3 58 139 28Finland f ... 13.0 12.4 18.7 ... ... -4 51France b, c, g 145.6 ... ... ... -12 ... ... ...Germany ... ... 400.1 429.7 ... ... ... 7Greece ... ... 3.5 ... ... ... ... ...Hungary f ... 0.4 ... ... ... ... ... ...Israel f ... 2.6 2.9 ... ... ... 14 ...Italy ... ... 115.3 125.3 ... ... ... 9Japan 40.3 44.5 53.5 57.3 ... 10 20 7Latvia b, h ... ... ... 0.2 ... ... ... ...Portugal b 5.6 7.1 9.9 12.8 2 27 40 29Slovak Republic f ... ... 0.0 0.0 ... ... ... 17United States 521.8 583.5 668.7 761.5 6 12 15 14
Excluding wholesale and retail trade and repair activities. Economies shown in italics exclude most or a large part of financial intermediation activities.a Refers to fiscal year 2002-03 (July-June). Community, social and personal (except health), hotels and restaurants and communications services are not covered.b Only includes affiliates directly owned.c Classified under services according to actvity of parent company.d Branches are excluded.e Only the first level of indirect ownership is coveredf Community, social and personal services are not covered.g Refers to 2002 value and annual percentage change for 2000-02.h Only covers extra-EU (27) affiliates.
Table I.25
Sales by foreign affiliates of resident companies - affiliates located abroad primarily engaged in services activities (outward FATS), 2003-2006
Note: Given the recent development of this statistical framework, comparability and coverage of data may not always be complete. See the Metadata.
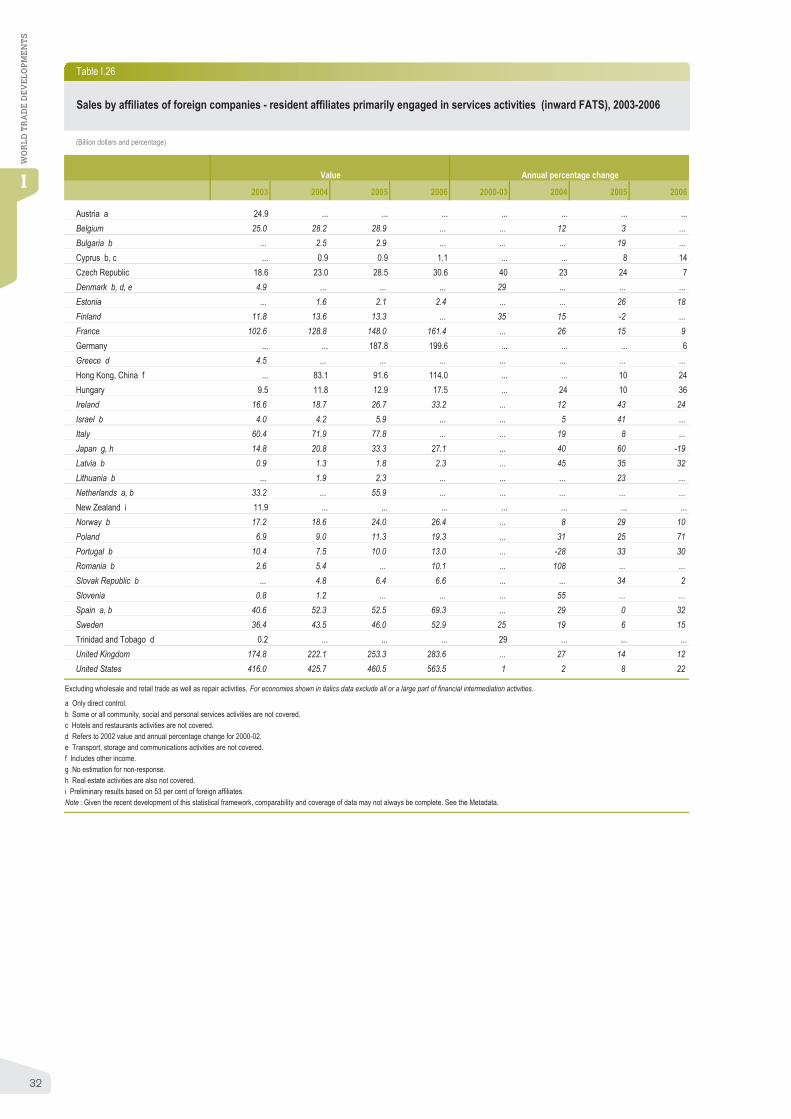
32
WO
RL
D T
RA
DE
DE
VE
LO
PM
EN
TS
I
(Billion dollars and percentage)
Value Annual percentage change
2003 2004 2005 2006 2000-03 2004 2005 2006
Austria a 24.9 ... ... ... ... ... ... ...Belgium 25.0 28.2 28.9 ... ... 12 3 ...Bulgaria b ... 2.5 2.9 ... ... ... 19 ...Cyprus b, c ... 0.9 0.9 1.1 ... ... 8 14Czech Republic 18.6 23.0 28.5 30.6 40 23 24 7Denmark b, d, e 4.9 ... ... ... 29 ... ... ...Estonia ... 1.6 2.1 2.4 ... ... 26 18Finland 11.8 13.6 13.3 ... 35 15 -2 ...France 102.6 128.8 148.0 161.4 ... 26 15 9Germany ... ... 187.8 199.6 ... ... ... 6Greece d 4.5 ... ... ... ... ... ... ...Hong Kong, China f ... 83.1 91.6 114.0 ... ... 10 24Hungary 9.5 11.8 12.9 17.5 ... 24 10 36Ireland 16.6 18.7 26.7 33.2 ... 12 43 24Israel b 4.0 4.2 5.9 ... ... 5 41 ...Italy 60.4 71.9 77.8 ... ... 19 8 ...Japan g, h 14.8 20.8 33.3 27.1 ... 40 60 -19Latvia b 0.9 1.3 1.8 2.3 ... 45 35 32Lithuania b ... 1.9 2.3 ... ... ... 23 ...Netherlands a, b 33.2 ... 55.9 ... ... ... ... ...New Zealand i 11.9 ... ... ... ... ... ... ...Norway b 17.2 18.6 24.0 26.4 ... 8 29 10Poland 6.9 9.0 11.3 19.3 ... 31 25 71Portugal b 10.4 7.5 10.0 13.0 ... -28 33 30Romania b 2.6 5.4 ... 10.1 ... 108 ... ...Slovak Republic b ... 4.8 6.4 6.6 ... ... 34 2Slovenia 0.8 1.2 ... ... ... 55 ... ...Spain a, b 40.6 52.3 52.5 69.3 ... 29 0 32Sweden 36.4 43.5 46.0 52.9 25 19 6 15Trinidad and Tobago d 0.2 ... ... ... 29 ... ... ...United Kingdom 174.8 222.1 253.3 283.6 ... 27 14 12United States 416.0 425.7 460.5 563.5 1 2 8 22
a Only direct control.b Some or all community, social and personal services activities are not covered.c Hotels and restaurants activities are not covered.d Refers to 2002 value and annual percentage change for 2000-02.e Transport, storage and communications activities are not covered.f Includes other income.g No estimation for non-response.h Real estate activities are also not covered. i Preliminary results based on 53 per cent of foreign affiliates.Note : Given the recent development of this statistical framework, comparability and coverage of data may not always be complete. See the Metadata.
Excluding wholesale and retail trade as well as repair activities. For economies shown in italics data exclude all or a large part of financial intermediation activities.
Table I.26
Sales by affiliates of foreign companies - resident affiliates primarily engaged in services activities (inward FATS), 2003-2006