Embed Size (px)
Citation preview


ii
I would like to dedicate my thesis to
My parents
who taught me the value of knowledge
and my brother and sisters

iii
ACKNOWLEDGMENT
To my family for their support and understanding while I was busy
and spending long hours during my course of study.
My sincere thanks also go to Dr. Lahouari Ghouti, my advisor, for his most
valuable insights, generous and patient help on my work. His intellectual
guidance is priceless, not to mention his policy of having an open door for
discussions and giving endless encouragement. I am also grateful to my
thesis committee members, Dr. Sami Elferik and Dr. Wasfi G. Al-Khatib, for
their valuable suggestions and comments.

iv
TABLE OF CONTENTS
Page
TABLE OF CONTENTS ................................................................................................................ iv
LIST OF TABLES ............................................................................................................................... vii
LIST OF FIGURES ............................................................................................................................ viii
THESIS ABSTRACT ....................................................................................................................... x
انشسانت يهخص ...................................................................................................................................... xi
CHAPTER 1 ........................................................................................................................................ 1
1. INTRODUCTION ........................................................................................................................ 1
1.1 Biometrics ......................................................................................................................... 3
1.1.1 Properties of biometric traits ................................................................................... 6
1.2 Fingerprint as a Biometric ................................................................................................ 7
1.3 Thesis Motivation ........................................................................................................... 10
1.4 Problem Statement ........................................................................................................ 11
1.5 Outline of the Thesis ....................................................................................................... 12
CHAPTER 2 ...................................................................................................................................... 14
2. OVERVIEW OF FINGERPRINT-BASED BIOMETRIC SYSTEMS ................................................... 14
2.1 Fingerprint Acquisition ................................................................................................... 14
2.2 System Functionalities .................................................................................................... 17
2.3 Fingerprint Representation and Feature Extraction....................................................... 19
2.4 Fingerprint Preprocessing............................................................................................... 21
2.4.1 Fingerprint Segmentation ....................................................................................... 21

v
2.4.2 Fingerprint Enhancement ....................................................................................... 23
2.4.3 Fingerprint Binarization/Skeletonization................................................................ 24
2.5 Performance Measures .................................................................................................. 25
2.6 Benchmark Databases .................................................................................................... 29
CHAPTER 3 ...................................................................................................................................... 32
3. RELATED WORK ...................................................................................................................... 32
3.1 Fingerprint Verification Methods ................................................................................... 32
3.1.1 Minutiae based Approach ...................................................................................... 33
3.1.2 Correlation based Approach ................................................................................... 34
3.1.3 Ridge Features (Texture) based Approach ............................................................. 34
3.1.4 Transform-Based based Approach ......................................................................... 37
CHAPTER 4 ...................................................................................................................................... 39
4. MATHEMATICAL BACKGROUND ............................................................................................. 39
4.1 Scale Invariant Feature Transform SIFT .......................................................................... 39
4.2 Discrete Wavelets ........................................................................................................... 43
4.3 Directional Wavelets and Filters ..................................................................................... 46
4.4 Filter Banks ..................................................................................................................... 47
5.5 Directional Filter Bank .................................................................................................... 50
4.6 Curvelets ......................................................................................................................... 54
4.7 Invariants ........................................................................................................................ 55
4.7.1 Categories of Invariants .......................................................................................... 56
4.8 Moments ........................................................................................................................ 57
4.9 Moment Invariants to Translation, Rotation and Scaling ............................................... 60
4.10 Affine Moment Invariants .............................................................................................. 61
4.10.1 Dependencies Among the AMIs ............................................................................. 63

vi
CHAPTER 5 ...................................................................................................................................... 65
5. PROPOSED FINGERPRINT MATCHING ALGORITHM ............................................................... 65
5.1 Directional Filtering and Feature Extraction .................................................................. 65
5.2 Image Normalization ...................................................................................................... 67
5.3 Reference Point and Region of Interest ......................................................................... 68
4.3.1 Determination of Reference point ......................................................................... 68
4.3.2 Determination of ROI and Partition........................................................................ 69
5.4 Invariant Moment Feature Vector Generation .............................................................. 71
5.5 Fingerprint Matching ...................................................................................................... 72
CHAPTER 6 ...................................................................................................................................... 74
6. EXPERIMENTAL RESULTS ........................................................................................................ 74
CHAPTER 7 ...................................................................................................................................... 81
7. CONCLUSION .......................................................................................................................... 81
7.1 Overview ......................................................................................................................... 81
7.2 Summary of Contributions ............................................................................................. 82
7.3 Future Work .................................................................................................................... 83
8. REFERENCES ............................................................................................................................ 84
Vita .................................................................................................................................................. 89

vii
LIST OF TABLES
Table 1.1: Comparison of commonly used biometric traits. High, Medium, and Low are denoted
by H, M, and L, respectively [5]....................................................................................................... 7
Table 2.1: FVC2002 Fingerprint Database [12]. ........................................................................... 30
Table 4.1: Hu moments & Rotation Invariants. ............................................................................. 59
Table 6.1: Number of Tests. .......................................................................................................... 74
Table 6.2: Statistical characteristics of genuine and imposter distributions (DB1_A). ................. 76
Table 6.3: Testing results. .............................................................................................................. 77
Table 6.4: Time & memory comparison. ....................................................................................... 80

viii
LIST OF FIGURES
Figure 1.1: Annual Biometric Industry Revenues (in US $ millions). ............................................ 3
Figure 1.2: Expected growth in revenues of biometrics industry (in US $ millions) [4]. ............... 4
Figure 1.3: Examples of biometrics traits: a) ear, b) face, c) facial thermogram, d) hand
thermogram) hand vein, f) hand geometry, g) fingerprint, h) iris, i) retina, j) signature, and k)
voice [5]. ........................................................................................................................................... 5
Figure 1.4: Revenue by biometric technology as estimated by the International Biometric Group
[3]. .................................................................................................................................................... 6
Figure 1.5: Fingerprint Classes........................................................................................................ 8
Figure 1.6: An illustration of minutiae points ................................................................................. 9
Figure 2.1: Fingerprint scanners/readers ....................................................................................... 15
Figure 2.2: FTIR-based fingerprint sensor operation [5] .............................................................. 16
Figure 2.3: Fingerprint system functionalities. .............................................................................. 18
Figure 2.4: Ridge ending and ridge bifurcation. ............................................................................ 19
Figure 2.5: Core and delta. ............................................................................................................ 20
Figure 2.6: (a) original image (b) image with segmentation. ........................................................ 22
Figure 2.7: (a) original image (b) enhanced image using FFT. ..................................................... 24
Figure 2.8: (a) gray-scale image (b) binarized image (c) skeleton image obtained after a thinning
of the image in (b) [5]. .................................................................................................................... 25
Figure 2.9: ROC curve is a plot of the true positive rate against the false positive rate for the
different possible thresholds. .......................................................................................................... 27
Figure 2.10: FAR and FRR for a given threshold (t), displayed over the genuine and impostor
score distributions. .......................................................................................................................... 28
Figure 2.11: FVC2002 fingerprint database example [12]. ........................................................... 30
Figure 3.1: Texture Based matching Using a Filter-Bank of Gabor filters [15]. ........................... 35
Figure 3.2: DFB illustration, Frequency partition map of (a) the input and (b) the eight sub-band
outputs. (c) Example of fingerprint image. (d) Decomposed sub-band outputs of (c) using eight-
band DFB........................................................................................................................................ 36
Figure 4.1: Scale space construction for SIFT operation [6]. ........................................................ 42
Figure 4.2: Difference between cosine wave and wavelet. ........................................................... 43
Figure 4.3: Wavelet Decomposed Fingerprint. ............................................................................. 44
Figure 4.4: Coherence images: (a) Approximate image, (b, c) Horizontal, Vertical details. ........ 45
Figure 4.5: Reference point (X), and region of interest divided into 80 sectors imposed on the
fingerprint. ...................................................................................................................................... 48
Figure 4.6: Directional filter bank frequency partitioning [39]. .................................................... 48
Figure 4.7: Directional image [25]. ............................................................................................... 50
Figure 4.8: First phase of an eight-band DFB. .............................................................................. 51
Figure 4.9: Second phase of an eight-band DFB. .......................................................................... 52
Figure 4.10: Third phase of an eight-band DFB. ........................................................................... 53
Figure 4.11: Wavelet vs. Curvelet [42]. ........................................................................................ 54

ix
Figure 4.12: Rotated fingerprint example...................................................................................... 59
Figure 5.1: blocks in (a) Original image, (b) Sub-band output. .................................................... 66
Figure 5.2: The reference point one on the convex ridge. ............................................................. 68
Figure 5.3: Region of interest (ROI) for feature extraction. A sample fingerprint (a) whose ROI is
established within the image and (b) whose ROI exceeds the image bound. ................................. 70
Figure 6.1: Genuine and imposter distributions for the proposed method (DB1_A). ................... 75
Figure 6.2: ROC curves comparing the recognition rate performance of the proposed method
with the other 2 methods on database FVC2002 DB1_A. .............................................................. 78
Figure 6.3: ROC curves on database FVC2002 DB2_A. .............................................................. 78
Figure 6.4: ROC curves on database FVC2002 DB3_A. .............................................................. 79
Figure 6.5: ROC curves on database FVC2002 DB4_A. .............................................................. 79

x
THESIS ABSTRACT
Name: Waleed Mohammad Alzahrani
Title: Fingerprint Matching using Moments and Moment Invariants
Major Field: Information and Computer Science
Date of Degree: November 2010
Fingerprints represent the most common biometric trait in use today in various
applications ranging from person identification to access control. The search for better
performance in matching and recognition has been the focus of ongoing research efforts
in this fast evolving field. Advanced matching algorithms using state-of-the-art image
processing techniques have emerged in the recent literature. This thesis constitutes the
outcome of similar efforts. Unlike minutia-based techniques, in this thesis, we propose a
fingerprint matching technique that combines directional features with moment
invariants. The main attribute of the proposed scheme is its ability to bypass the need for
translation and rotation alignments usually carried out through computationally-
demanding registration techniques. The performance of the proposed fingerprint matching
algorithm is evaluated using benchmark fingerprint databases FVC2002. Reported results
clearly indicate the superiority of the proposed scheme.

xi
ملخص الرسالة
نيذ ب يحذ ب خيشالله انكاي انضشاي :الاســـــــــــــــم
يطابمت بصاث انيذ باسخخذاو انعضو انشلي نهصس انزابج انعضييت :عنوان الرسالة
عهو انحاسب الآني :التخصـــــــص
ـ1431ر انمعذة :تاريخ التخـرج
انخطبيماث، يزم انخعشف عهى يت يخخهف في انيو انحييت انخعشف اسخخذايا في أظت الأكزش انست حعخبش انبصاث
ياصال انبحذ ع أداء أفضم في انخحمك انخعشف يحم الاخاو انج . انشخص أظت انخحكى في انعبس
في خلال انعمذ انصشو ظشث خاسصيياث يخمذيت باسخخذاو . نجد انبحذ انجاسيت في زا انجال سشيع انخطس
انخمياث انعخذة عهى ماط انخعشف يارهت نك بعكس جد خائج حشكم انشسانت أحذد حمياث يعانجت انصس، ز
(minutia)، انست. انساث انخجت انزابج انعضييت بي حجع نهبصاث يطابمت حميت انشسانت مخشح ز ففي
عذو حاجخا نعهياث انحاراة نهذسا انضبظ انخي عادة يا حخطهب حساباث ي نهخاسصييت انمخشحت انشئيسيت
حى حمييى أداء خاسصييت يطابمت انبصاث انمخشحت . عانيت انخعميذ بسبب احخياجا إنى حمياث انخسجيم انخصيشيت
أظشث انذساست حييضا يهحظا في كفاءة انخعشف يماست . FVC2002 باسخخذاو لاعذ بيااث بصاث الأصابع
.بانطشق انخمهيذيت

1
CHAPTER 1
1. INTRODUCTION
In an increasingly digital world, personal identity is becoming a significant
issue in enabling secured access to physical and digital assets and resources.
Existing security measures can be classified into knowledge-based and
token-based approaches. While the former rely on passwords, the access
cards are used in the latter approaches to control access to physical and
virtual (mainly digital) facilities.
Both approaches are known to suffer from several limitations. Forgetting the
passwords and losing access cards is very common. Access cards (smart or
passive) can be stolen, forged, lost or spoofed. Also, passwords are
vulnerable to dictionary and brute force attacks. Biometric systems using
fingerprint, face and voice recognition avoid such limitations and offer
means for reliable personal authentication that can address these problems.
Moreover, due to their cost-effectiveness, biometric systems are gaining
wide acceptance in many day-to-day civilian, government, and military

2
applications. In fact, several countries are resorting to biometric-based
solutions to control access to their borders. It is worth noting also that using
biometric-based identification, an individual cannot simply disassociate
himself/herself, for example, from an online banking transaction by claiming
that his password or card was stolen. This property is referred to as non-
repudiation [1].
Building on their successful use in forensic applications by law enforcement
agencies to solve crime investigations, fingerprints have found their way to
the digital world, thanks to efficient storage; compression and transmission
of their digitized representations.
Although face, iris and other biometric traits have proven to be effective
features for biometric identification, fingerprints continue to be an attractive
means for person identification and verification due to the availability of
cheap scanning devices based on different technologies, efficient feature
extraction mechanisms in several domains and spaces (spatial and transform)
and fast matching procedures. Unlike what is commonly believed and
despite active research in fingerprint recognition and matching over several
years, the search for reliable, yet efficient and fast, fingerprint recognition
schemes is still an open problem.

3
1.1 Biometrics
Biometric recognition, or biometrics, refers to the science of automatic
identification of a person based on his/her anatomical (e.g., fingerprint, iris,
…, etc.) or behavioral (e.g., signature) characteristics. This field has been a
research focus in both academia and industry. Figure 1.1 shows the annual
biometric industry revenues from 2005 to 2010 [2]. Figure 1.1 clearly
reflects the trend in adopting biometric-based person identification and
verification solutions.
Figure 1.1: Annual Biometric Industry Revenues (in US $ millions).
Biometrics industry is forecasted to grow rapidly in the upcoming years as
shown in Figure 1.2 [3]. It is expected that such steady growth will not be
1,538
2,175
3,010
3,848
4,704
5,749
-
1,000
2,000
3,000
4,000
5,000
6,000
2005 2006 2007 2008 2009 2010

4
significantly impacted by the 2008 global economic meltdown. Also, the
biometrics industry is expected to remain on track to experience significant
growth through 2017 and beyond reaching nearly US $ 11 Billion in annual
revenues by 2017 [4].
Figure 1.2: Expected growth in revenues of biometrics industry (in US $ millions) [4].
A number of biometric traits have been developed and are used to
authenticate a person’s identity. The key idea resides in using special
characteristics of a person for identification purposes. Such special
characteristics include face, iris, fingerprint, signature, etc. Figure 1.3 gives
an illustration of different biometric features currently in use for various
applications and purposes.
2,584 3,570
4,676 5,970
7,339 8,566
9,680 10,175 10,882
-
2,000
4,000
6,000
8,000
10,000
12,000
2009 2010 2011 2012 2013 2014 2015 2016 2017
Biometric Industry Revenues 2009-2017

5
Figure 1.3: Examples of biometrics traits: a) ear, b) face, c) facial thermogram, d) hand
thermogram) hand vein, f) hand geometry, g) fingerprint, h) iris, i) retina, j) signature, and
k) voice [5].
Various biometric traits are being used for real-time recognition. The
most popular traits are being face, iris and fingerprint. In some applications,
more than one biometric trait is used to attain higher security and to handle
failure to enroll situations for some users. Such systems are called
multimodal biometric systems [1]. However, in this thesis, only fingerprint-
based systems are considered. Several reasons are behind such a choice. The
maturity of fingerprint-based systems represents the major reason behind the
choice made in this thesis. Additionally, fingerprint-based systems continue
to be the leading biometric technology in terms of market share as shown in
Figure 1.4.

6
Figure 1.4: Revenue by biometric technology as estimated by the International Biometric
Group [3].
1.1.1 Properties of biometric traits
For a human characteristic to be used for biometrics, it should have
posses desirable properties [1]:
Universality: each person should have the characteristic.
Uniqueness: how well the biometric separates an individual from
another.
Permanence: measures how well a biometric resists aging and other
types of changes over time.
Collectability: ease of acquisition for measurement.
Performance: accuracy, speed, and robustness of technology used.
Acceptability: degree of approval of a technology.
Circumvention: ease of use of a substitute.

7
The biometric identifiers described above are compared in Table 1.1.
Note that fingerprint has a nice balance among all the desirable properties.
Also, keep in mind that fingerprints are very distinctive and they are
permanent; even if they temporarily change slightly due to cuts and bruises
on the skin, the fingerprint reappears after the finger heals.
Biometric identifier
Univ
ersa
lity
Dis
tinct
iven
ess
Per
man
ence
Coll
ecta
bil
ity
Per
form
ance
Acc
epta
bil
ity
Cir
cum
ven
tion
Face H L M H L H H
Fingerprint M H H M H M M
Hand geometry M M M H M M M
Hand/finger vein M M M M M M L
Iris H H H M H L L
Signature L L L H L H H
Voice M L L M L H H
Table 1.1: Comparison of commonly used biometric traits. High, Medium, and Low are denoted
by H, M, and L, respectively [5].
1.2 Fingerprint as a Biometric
A fingerprint is believed to be unique to each person (and each finger).
Fingerprints of even identical twins are different. Fingerprints are one of the
most mature biometric technologies and are considered legitimate proofs of
evidence in courts of law all over the world. Fingerprints are, therefore, used

8
in forensic divisions worldwide for criminal investigations. More recently,
an increasing number of civilian and commercial applications are either
using or actively considering using fingerprint-based identification because
of a better understanding of fingerprints as well as demonstrated matching
performance than any other existing biometric technology.
Figure 1.5: Fingerprint Classes
The most popular method for fingerprint representation is based on local
landmarks called minutiae points. This scheme evolved from an intuitive
system design tailored by the needs of forensic experts who visually classify
the fingerprint into one of six categories [5]: arch, tented arch, right loop, left
loop, whorl, and twin loop. The fingerprints images shown in Figure 1.5
illustrate those six categories. Minutiae-based systems first locate the
minutiae points in fingerprint image where the fingerprint ridges

9
terminate/bifurcate or form an enclosure or island (lake) shape, and then
match minutiae relative placements in a given finger and stored template as
shown in Figure 1.6.
It is estimated that one can extract between 25 and 80 minutiae [6] from a
good quality fingerprint. The number of minutia points extracted depends
upon two factors: sensor resolution and finger placement on the sensor. It is
well known that it is difficult to automatically and reliably extract minutiae
points from a poor quality fingerprint due to very dry fingers or from fingers
mutilated by scars as a result of accidents, injuries, or profession-related
work (e.g., electrician, mason, and musician). Also, it was been observed
that a fraction of the population fingers have a relatively small number of
minutiae points which makes fingerprint-based identification more
vulnerable to failures for such individuals.
Figure 1.6: An illustration of minutiae points

10
1.3 Thesis Motivation
Most of the existing automatic fingerprint verification and classification
systems use features that are motivated by the representations used by the
forensic experts. Forensic experts have used the locations of singularities in
the fingerprints (e.g., core & delta) to visually classify fingerprints for
indexing purposes. Due to the increasing need for reliable individual
automatic authorization and authentication systems, various biometric
identification and verification systems have been developed, gaining a wide
acceptance in law enforcement and civilian life applications such as access
control. However, the performance of these systems is still far from the state-
of-the-art theoretical bounds. This makes open room for new fingerprint
matching algorithms/approaches. Existing fingerprint matching algorithms
enjoy advantages and suffer from limitations.
One of these drawbacks is the limited information content of the minutiae
representation. Therefore, non-minutiae based representations of fingerprints
should be explored. In this thesis, a novel non-minutiae representation for
fingerprints is proposed. The proposed representation is based on translation,
rotation and scaling (TRS) invariants and affine moment invariants (AMIs)
applied on the directional features of a fingerprint image. The objective of
this work is to explore and investigate different approaches to advance and

11
improve the study of fingerprint biometrics, and boost the performance of
existing fingerprint identification and verification systems.
1.4 Problem Statement
Fingerprint verification is the process of comparing test and enrolled skin
ridge impressions from fingers to determine if the impressions are from the
same finger. The nature of the fingerprint ridge skin proved that no two
fingerprints are ever exactly alike. Most fingerprint matching algorithms are
based on finding associations between two fingerprints, by detecting and
comparing particular fingerprint features called minutia points. Although
minutia-based algorithms usually provide good performance, they have
problems matching fingerprints when only few minutiae points are
successfully extracted. Texture- and transform-based matching methods have
advantages dealing with such images as they utilize features which are not
based solely on minutia templates. However, it should be noted that one
main advantage of minutia-based approaches is that they are faster.
In this study, we introduce a new fingerprint matching algorithm based on
TRS invariants and AMIs applied on the directional features of a fingerprint

12
image. The directional features are extracted by utilizing the directional filter
bank (DFB) transform.
1.5 Outline of the Thesis
The rest of the thesis is organized as follows.
Chapter 2 provides an overview of various fingerprint representations,
definitions and notations. Furthermore, it gives a general view of image
segmentation, enhancement, and feature extraction techniques of fingerprint
images along with a description of the main functionalities of fingerprint
recognition systems. A discussion on wavelets, scale invariant feature
operators, filter banks and directional filter banks will follow. The chapter
concludes with an explanation of moments and moment invariants along
with their categories, focusing on moment invariant to translation, rotation
and scaling (TRS) and affine moment invariants (AMIs)
Related work in the area of fingerprint matching algorithms is presented
in Chapter 3. Minutia-, correlation-, ridge-, and transform-based approaches
are discussed therein in details. Chapter 4 gives a detailed description of the
proposed fingerprint matching method. The technique of directional filter
banks (DFBs) for extracting fingerprint directional components is explained.

13
Identifying the reference (core) point and establishing a region of interest
(ROI) is illustrated. The proposed approach for applying moment invariant
analysis, feature vector extraction and matching is detailed.
In Chapter 5, the experimental results are reported and discussed along
with a detailed performance analysis. A performance comparison with the
current state-of-the-art methods is carried out.
Finally, Chapter 6 gives a summary of the thesis work along with the
contributions made in this thesis. The chapter concludes with an outline of
some proposed research directions where the work described in this thesis
can be further investigated.

14
CHAPTER 2
2. OVERVIEW OF FINGERPRINT-
BASED BIOMETRIC SYSTEMS
2.1 Fingerprint Acquisition
There are two main modes of capturing a fingerprint. Traditionally,
fingerprints were acquired by transferring the inked impression onto the
paper. This process is termed as off-line acquisition. Existing authentication
systems are based on live-scan devices that capture the fingerprint image
using real-time sensors. There are different types of fingerprint readers in the
market. Figure 2.1 shows examples of fingerprint scanners/readers based on
different technologies. The basic idea behind each capture approach is to
measure the physical differences between ridges and valleys. Generally
speaking, existing scanners use sensors that employ one of the following
three sensing schemes: optical, ultrasound, and solid-state sensors [5].

15
Figure 2.1: Fingerprint scanners/readers
Optical fingerprint imaging involves capturing a digital image of the
print using a visible light. This type of sensor is, in essence, a specialized
digital camera. This is the oldest and most widely used technology [1]. The
top layer of the sensor, where the finger is placed, is known as the touch
surface. Beneath this layer is a light-emitting device which illuminates the
surface of the finger. The light reflected from the finger passes through to a
charged coupled device (CCD) which captures a visual image of the
fingerprint. These sensors are fairly inexpensive and can provide resolutions
up to 500 dpi. Most optical sensors are based on FTIR (Frustrated Total
Internal Reflection) technique to acquire the image [5].
16
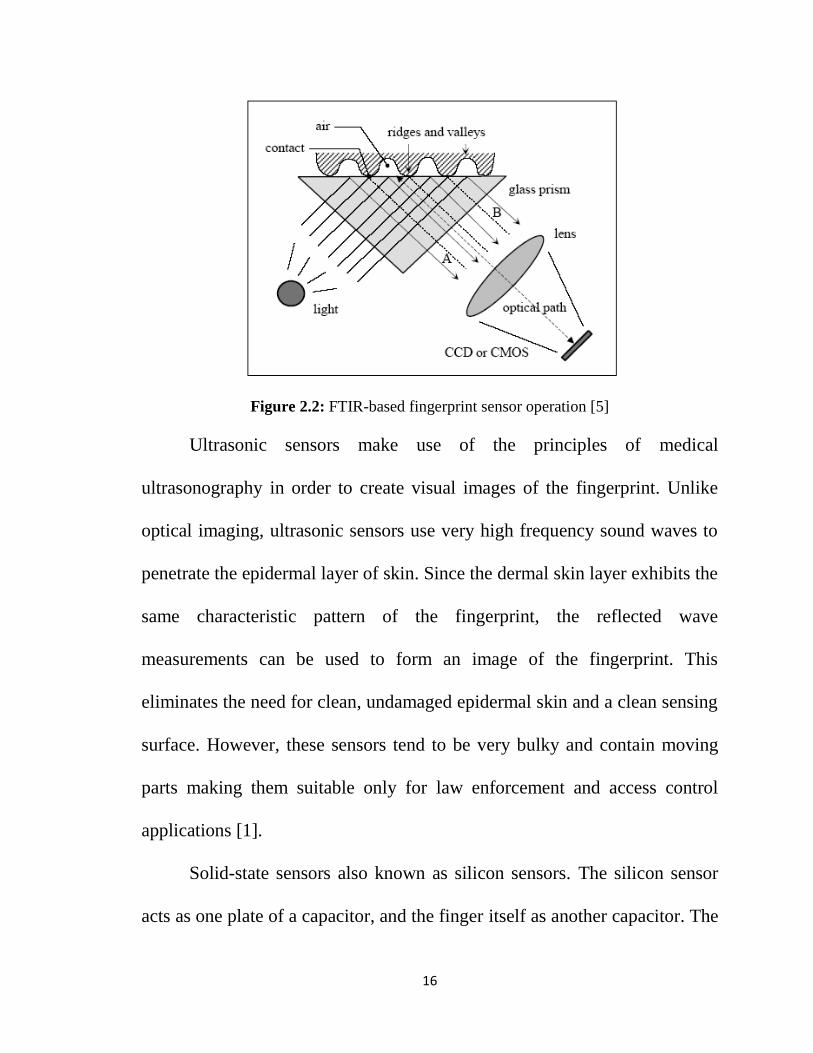
Figure 2.2: FTIR-based fingerprint sensor operation [5]
Ultrasonic sensors make use of the principles of medical
ultrasonography in order to create visual images of the fingerprint. Unlike
optical imaging, ultrasonic sensors use very high frequency sound waves to
penetrate the epidermal layer of skin. Since the dermal skin layer exhibits the
same characteristic pattern of the fingerprint, the reflected wave
measurements can be used to form an image of the fingerprint. This
eliminates the need for clean, undamaged epidermal skin and a clean sensing
surface. However, these sensors tend to be very bulky and contain moving
parts making them suitable only for law enforcement and access control
applications [1].
Solid-state sensors also known as silicon sensors. The silicon sensor
acts as one plate of a capacitor, and the finger itself as another capacitor. The

17
capacitance between the sensing plate and the finger depends inversely as the
distance between them. Since the ridges are closer, they correspond to
increased capacitance and the valleys corresponds to smaller capacitance.
This variation is converted into an 8-bit gray scale digital image. Most of the
electronic devices featuring fingerprint authentication use this form of solid
state sensors due to its compactness.
2.2 System Functionalities
Figure 2.3 shows the functionalities of a fingerprint-based biometric system:
1. Enrollment: is the process of registering a new person to the system.
These steps can be summarized as follows: Scanning, feature
extraction, and storing template in the database.
2. Verification: is the process of validating a person identity by
matching his biometric trait with a template stored in the database.
The steps are as follows: Scanning, feature extraction, matching, and
decision making.
3. Identification: is the process of searching all templates
corresponding to users in the database for a match (one-to-many

18
comparisons). The steps have the sequence: Scanning, feature
extraction, comparing with all templates, and decision making.
User Interface
Quality
AssessmentEnrollment Feature
Extractor
Extracted
Template
Biographic Information
Database
Image
User Interface
Quality
AssessmentVerification Feature
Extractor
Claimed Identity
Database
Image
User Interface
Quality
AssessmentIdentification Feature
Extractor
Database
Image
TemplateInput
Feature
Set
Decision Rule
Decision Module
Matching Module
Template Update
Template
Input
Feature
Set
Matching Module
Template
Template
Decision Rule
Decision Module
Genuine/
Impostor
Identity/
Reject
Figure 2.3: Fingerprint system functionalities.

19
2.3 Fingerprint Representation and Feature
Extraction
There are two fingerprint representations, namely, local and global. The local
representations in fingerprints are based on the entire image, finger ridges,
pores on the ridges, or salient features derived from the ridges [7].
Representations are based mainly on ridge endings or bifurcations
communally known as minutiae as shown in Figure 2.4.
Figure 2.4: Ridge ending and ridge bifurcation.
Ridge endings and bifurcation are the most common due to their:
1. Ability to capture much of the individual information.
2. Storage efficiency.
3. Robustness to various sources of fingerprint degradation.

20
Typically, minutiae-based representations rely on locations and the
directions of ridges at the minutiae location, i.e., described by its position
(x,y) and its orientation θ [8].
Global representations include information about locations of critical points,
namely, core(s) and delta(s), in a fingerprint to help classify a fingerprint
into one of six classes arch, tented arch, right loop, left loop, whorl, and twin
loop. The various fingerprint classes are illustrated in Figure 1.5.
To define core and delta, let us consider the Loop pattern as in Figure 2.5. A
Loop is defined by having at least one ridge that enters the print and recurves
back exiting the print on the same side. The top of the innermost recurving
ridge is defined as the core.
Figure 2.5: Core and delta.

21
The other side of a Loop contains ridges that enter the print and meet the
recurving ridges. Some of these rise above, and some fall below the loop.
The point where they diverge that is closest to the recurving ridges is the
delta, (there is often a small island at this point).
However, extracting such features is not simply done through finding the
ridge endings and ridge bifurcations. This process is heavily affected by the
quality of the fingerprint image. In order to get reliable features, the
extraction generally consists of the following steps [9]:
1. Orientation Estimation (which represents the directionality of
ridges).
2. Segmentation.
3. Ridge detection.
4. Minutiae Detection.
5. Post-processing.
2.4 Fingerprint Preprocessing
2.4.1 Fingerprint Segmentation
Before extracting the features of a fingerprint, it is important to separate the
fingerprint regions (presence of ridges) from the background. This limits the
region to be processed and therefore reduces the processing time, storage
22
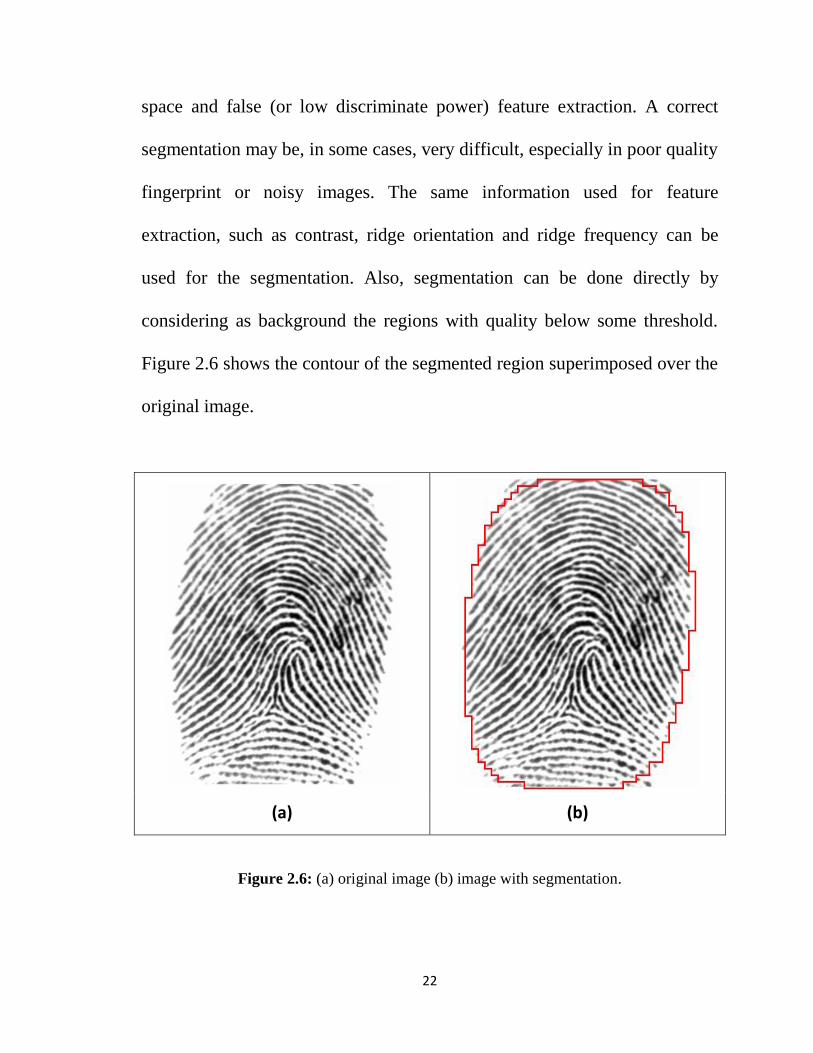
space and false (or low discriminate power) feature extraction. A correct
segmentation may be, in some cases, very difficult, especially in poor quality
fingerprint or noisy images. The same information used for feature
extraction, such as contrast, ridge orientation and ridge frequency can be
used for the segmentation. Also, segmentation can be done directly by
considering as background the regions with quality below some threshold.
Figure 2.6 shows the contour of the segmented region superimposed over the
original image.
(a) (b)
Figure 2.6: (a) original image (b) image with segmentation.

23
2.4.2 Fingerprint Enhancement
Enhancement step aims to improve the clarity of ridge structure or increase
the consistence of the ridge orientation. In noisy regions, it is difficult to
define a common orientation of the ridges. The enhancement may be useful
for several cases like connecting broken ridges which is generally produced
by dry fingerprint or cuts/bruises. Also, it is useful for eliminating noise
between the ridges and improving the ridge contrast. There are two widely
used techniques of enhancing fingerprint images [10]:
Normalization: A simple method to improve the image quality by
eliminating noise and correcting the deformations of the image
intensity. The idea of normalization consists of changing the intensity
of each pixel so that mean and variance of the whole image are
changed to some predefined values.
Fast Fourier Transformation (FFT): The Fourier transformation is
widely used in digital signal and image processing. In particular, for
detecting high or low frequencies. As the ridges have a structure of
repeated and parallel lines, it is possible to determine the frequency
and the ridge orientation using the FFT transform. Considering this
characteristic, an image is divided into blocks of small sizes (e.g.,
32x32). On each block, the FFT transform is applied and then

24
multiplied by its power spectrum raised to some value k (for instance
2), then the inverse FFT is applied on the resulting image. Figure 2.7
shows a fingerprint image and an enhanced image as a result of using
FFT transform, which demonstrate the improvement in ridges contrast
and connecting broken ridges.
(a) (b)
Figure 2.7: (a) original image (b) enhanced image using FFT.
2.4.3 Fingerprint Binarization/Skeletonization
The binarization process requires the fingerprint gray-scale image to be
converted into a binary image. The simplest approach uses a global

25
threshold, th, and works by setting the pixels whose level is lower than th to
0 and the remaining pixels to 1. Then, the binary image is submitted to a
thinning stage which allows for the ridge line thickness to be reduced to one
pixel, resulting in a skeleton image. This process is illustrated in Figure 2.8.
Figure 2.8: (a) gray-scale image (b) binarized image (c) skeleton image obtained after a thinning
of the image in (b) [5].
2.5 Performance Measures
The performance of biometric systems is quantified by their accuracy. From
the user’s point of view, an error of accuracy occurs when the system fails to
authenticate the identity of a registered person or when the system

26
erroneously authenticates an intruder. The following performance metrics are
used in the evaluation of biometric systems:
False Accept Rate or False Match Rate (FAR or FMR): The
probability that the system incorrectly matches the input pattern to a
non-matching template in the database. It measures the percent of
invalid inputs which are incorrectly accepted.
False Reject Rate or False Non-Match Rate (FRR or FNMR): The
probability that the system fails to detect a match between the input
pattern and a matching template in the database. It measures the
percent of valid inputs which are incorrectly rejected.
Receiver Operating Characteristic (ROC): The ROC curve is a
visual characterization of the trade-off between the FAR and the FRR
or the different possible thresholds. In general, the matching algorithm
performs a decision based on a threshold which determines how close
to a template the input needs to be for it to be considered a match. If
the threshold is reduced, there will be less false non-matches but more
false accepts. Correspondingly, a higher threshold will reduce the
FAR but increases the FRR. A common variation is the Detection
Error Trade-off (DET), which is obtained using normal deviate scales

27
on both axes. This more linear graph illuminates the differences for
higher performances (rarer errors) [11].
Figure 2.9: ROC curve is a plot of the true positive rate against the false positive rate for the
different possible thresholds.
Equal Error Rate or Crossover Error Rate (EER or CER): The
rate at which both FAR and FRR errors are equal. The value of the
EER can be easily obtained from the ROC curve. The EER is a quick
way to compare the accuracy of systems with different ROC curves. In
general, the system with the lowest EER is most accurate. The EER
value is obtained from the ROC plot by taking the point where the

28
FAR and FRR have the same value (FAR=FRR) as Figure 2.10 shows.
The lower the EER, the more accurate the system is considered to be.
Figure 2.10: FAR and FRR for a given threshold (t), displayed over the genuine and impostor
score distributions.
Failure to Enroll Rate (FTE or FER): The rate at which attempts to
create a template from an input are unsuccessful. This is most
commonly caused by low quality inputs.
Failure to Capture Rate (FTC): Within automated systems, the
probability that the system fails to detect a biometric input when
presented correctly.
Template Capacity: The maximum number of sets of data which can
be stored in the system.

29
2.6 Benchmark Databases
Due to the huge attention and research interest in the field of
biometrics in general and fingerprint matching and classification in
particular, various fingerprint databases have been constructed. It allows
researchers to evaluate their proposed work against a benchmark, using the
same conditions. Several databases are available for academic and research
purposes.
The US National Institute of Standards and Technology (NIST)
established a continuously updated fingerprint database to facilitate
benchmarking for researchers in the law enforcement field. The NIST
database consists of 2000 8-bit gray scale fingerprint images.
The International Fingerprint Verification Competition (FVC) uses a
different set of fingerprint databases. There are 4 databases consisting of
fingerprint images having different sizes and qualities. Figure 2.11 shows the
typical images from the FVC databases.

30
Figure 2.11: FVC2002 fingerprint database example [12].
Each database has 110 fingers and 8 impressions (samples) per finger (880 in
total). Database fingers from 101 to 110 (set B) are available to the FVC
participants before competition to allow parameter tuning before the
submission of the algorithms. The benchmark is then constituted by fingers
numbered from 1 to 100 (set A). Table 5.1 shows the basic components of
the FVC2002 database.
Sensor Type Image Size Set A Set B Resolution
DB1 Optical Sensor 388x374 (142 Kpixels) 100x8 10x8 500 dpi
DB2 Optical Sensor 296x560 (162 Kpixels) 100x8 10x8 569 dpi
DB3 Capacitive Sensor 300x300 (88 Kpixels) 100x8 10x8 500 dpi
DB4 SFinGe v2.51 288x384 (108 Kpixels) 100x8 10x8 about 500 dpi
Table 2.1: FVC2002 Fingerprint Database [12].

31
In this thesis, the FVC2002 database will be used for benchmarking
purposes.

32
CHAPTER 3
3. RELATED WORK
3.1 Fingerprint Verification Methods
Fingerprint matching techniques can be cast into four broad classes, namely,
minutiae, correlation, Ridge features (texture) and Transform based
techniques. However, considering the types of information used, a method
can be broadly categorized as minutiae based or texture based. While the
minutiae based fingerprint verification systems have shown high accuracy
[8, 11], they ignore the rich information in ridge patterns which can be useful
to improve the matching accuracy.
Texture based systems utilize the whole fingerprint image and local features
along minutiae points [13, 14]. This method is desirable because the global
features will be more sensitive to non-linear and non-repeatable deformation
of fingerprint images. When the local texture is collected based on the
minutiae points, the texture based fingerprint representation will be

33
inadequate and matching performance will depend on the reliability of
extracted minutiae points. Capturing the rich discriminatory texture
information in the fingerprints is not a straight forward task, especially when
such textures are not critically dependent on finding minutiae points [13] or
core points [15].
3.1.1 Minutiae based Approach
As mentioned previously, minutiae points are defined as the discontinuities
of the ridges of the fingerprint. Minutiae points are extracted after any image
preprocessing (enhancement, segmentation etc.) to the fingerprint.
One of the proposed methods in the literature performs a minutiae
verification and classification through a feedback path for the feature
extraction [1]. Feng et al. [16] propose a technique for fingerprint feature
extraction called complex minutiae vector (CMV). The technique consists of
a ridge rotation angle associated with a minutia and four ridge counts
between the minutia and the four corresponding adjacent points. In addition,
a definition of minutia polygon that describes not only the minutia type and
orientation but also the minutia shape, which has a higher ability to tolerate
distortion [17].

34
3.1.2 Correlation based Approach
In [19], Duda and Hart investigate a technique, which relies on the
correlation matching, uses correlation scores from the intensities of
corresponding pixels of template and input fingerprint. Other researchers
have proposed several improvements to the correlation method [20-22].
3.1.3 Ridge Features (Texture) based Approach
In [23], Marana and Jain present a texture-based fingerprint matching
technique using fingerprint ridge features. Ross et al. [24] proposed a method
to estimate the nonlinear distortion in fingerprint pairs based on ridge curve
correspondences.
Filter banks and directional filter banks have attracted the attention of several
researchers. Jain et al. [15] use a filter-based algorithm using bank of Gabor
filters. Gabor filters are used to capture local and global derails of a
fingerprint into a fixed FingerCode. Then, performs the fingerprint matching
using the Euclidean distance between the two corresponding FingerCodes.

35
Figure 3.1: Texture Based matching Using a Filter-Bank of Gabor filters [15].
While, in [25], Oh et al. suggest a fingerprint enhancement (minimizing the
effect of noise) algorithm based on a directional filter bank (DFB) by
decomposing fingerprint image into directional sub-band images in the
analysis stage, processes the sub-band images in the processing stage, and
reconstructs them as the enhanced image in the synthesis stage. Park et al.

36
[26] proposed another approach based on DFB filtering. They decompose
fingerprint image into eight directional sub-band outputs. Figure 3.2
illustrate the frequency decomposition of the input and output, along with an
output example of a filtered image. Then, extract directional energy
distributions for each block from the decomposed sub-bands. To reduce
noise effect and improve efficiency, only dominant directional energy
components are kept as elements of the input feature vector. Additional input
feature vectors in which various rotations are considered are extracted, and
these input feature vectors are compared with the enrolled template feature
vector.
Figure 3.2: DFB illustration, Frequency partition map of (a) the input and (b) the eight
sub-band outputs. (c) Example of fingerprint image. (d) Decomposed sub-band outputs of
(c) using eight-band DFB.

37
3.1.4 Transform-Based based Approach
Transform based techniques have been used extensively in the literature.
Park and Pankanti [6] proposed a fingerprint representation and matching
scheme using Scale Invariant Feature Transformation (SIFT) (see Section
4.1 for details). It extract SIFT characteristic feature points in scale space
and perform matching based on the texture information around the feature
points using the SIFT operator and Euclidean distance to perform matching.
In [28] Iannizzotto and La Rosa investigate combining SIFT with neural
networks.
Also, a classification algorithm utilizing wavelet transform is investigated by
Mokji and colleagues [29]. Fingerprint signatures are extracted by using the
wavelet transform. Then, fingerprints are classified into six categories: 1) left
loop, 2) right loop, 3) whorl, 4) arch 5) tented arch and 6) twin loop. After
fingerprint image classification, a directional computation is used to present
a directional image for the fingerprint image. The directional image is
constructed using directional details resulting from the application of the
wavelet transform. From the directional image, a line, named alteration
track, is extracted in order to classify the fingerprint using few rules. Lee and
Chung [30] utilized gradient of Gaussian to do the classification after

38
extracting the features using wavelet. Antonini et al. [31] devised and tested
an image coding technique, based on the wavelet transform.
Moreover, Mokji and others, used a second stage discrete wavelet transform
to obtain the fingerprint signature to be used by the fingerprint classification
algorithm [32]. Patil and others [34], proposed a combined fingerprint
verification approach based on wavelet transform and the local dominant
orientation. Daubechies wavelet is utilized to decompose the fingerprint
image, and local dominant orientation is computed using the coherence.

39
CHAPTER 4
4. MATHEMATICAL BACKGROUND
4.1 Scale Invariant Feature Transform SIFT
Scale Invariant Feature Transformation (SIFT) [14] is an algorithm in
computer vision to detect and describe local features in images. The
algorithm was published by David Lowe in 1999. It was originally
developed for general purpose object recognition. For any object in an
image, there are many features which are interesting points on the object,
that can be extracted to provide a feature description of the object. This
description extracted from a training image can then be used to identify the
object when attempting to locate the object in a test image containing many
other objects [35]. It is important that the set of features extracted from the
training image is robust to changes in image scale, noise, illumination and
local geometric distortion, for performing reliable recognition. SIFT detects
stable feature points in an image and performs matching based on the

40
descriptor representing each feature point. SIFT feature descriptor is
invariant to scale, orientation, affine distortion and partially invariant to
illumination changes [36]. A brief description of the SIFT operator to
fingerprints is provided below.
Stage1: Scale Space Construction
This is the stage where the interest points are detected. A scale space is
constructed when image is convolved with Gaussian filters at different
scales, and then the Difference of Gaussian (DOG) in each octave of
successive Gaussian-blurred images are taken by applying a variable scale
Gaussian operator on an input image. The set of Gaussian-smoothed images
and DOG images are called an octave. A set of such octaves is constructed
by down sampling the original image in succession. A typical number of
scales and octaves for SIFT operation is 5 and 6, respectively. Figure 5
shows 4 successive octaves with 5 scales and the corresponding difference
images.
Stage2: Local Extrema
Once DoG images have been obtained, keypoints are identified as local
minima/maxima of the DoG images across scales. This is done by comparing
each pixel in the DoG images to its eight neighbors at the same scale and

41
nine corresponding neighboring pixels in each of the neighboring scales. If
the pixel value is the maximum or minimum among all compared pixels, it is
selected as a candidate keypoint.
Stage3: Stable Local Extrema and Orientation assignment
Keypoints detected using Scale-space extrema detection are too many, some
of which are unstable. The next step is to perform a detailed fit to the nearby
data for accurate location, scale, and ratio of principal curvatures. For More
detailed description of this process can be found in the original paper by
Lowe [36]. If an extremum is decided as unstable, it is removed because it
cannot be reliably detected again with small variation of viewpoint or
lighting changes. After that, each keypoint is assigned one or more
orientations based on local image gradient directions.
Stage: Assigning Descriptor
After extracting keypoint locations at particular scales and assigned
orientations to them, a 16x16 window [30] is used to generate a histogram of
gradient orientation around each local extremum and rotate all gradient with
respect to the major orientation of the local extremum. This ensures
invariance to image location, scale and rotation.
- Example Figure

42
Matching is performed by comparing each local extrema based on the
associated descriptors. Figure 4.1 illustrates the steps of scale space
construction for SIFT operator.
Figure 4.1: Scale space construction for SIFT operation [6].

43
4.2 Discrete Wavelets
A wavelet is a waveform of limited duration that has an average value of
zero. Unlike sinusoids that theoretically extend from minus to plus infinity,
wavelets have a beginning and an end, as shown in Figure 4. 2.
Figure 4.2: Difference between cosine wave and wavelet.
Mathematically speaking, Wavelets are defined by the wavelet function ψ(t)
(i.e. the mother wavelet) and scaling function φ(t) (also called father
wavelet) in the time domain. The wavelet function is in effect a band-pass
filter and scaling it for each level halves its bandwidth. This creates the
problem that in order to cover the entire spectrum, an infinite number of
levels would be required. The scaling function filters the lowest level of the
transform and ensures all the spectrum is covered [37].
Wavelets are a useful technique that can be applied to many tasks in signal
processing. First, we need to Locate core point and crop fingerprint image

44
around core point. Then, a modified version of Daubechies' wavelet can be
applied to a fingerprint image to get the directional characteristics as shown
in Figure 4. 3.
Since directional information obtained from wavelets does not represent all
directions, we cannot use them directly. To overcome this issue and
construct a feature vector that capture more detailed directional information
a gradient of Gaussian and coherence is applied to the wavelet [27].
Figure 4.3: Wavelet Decomposed Fingerprint.
Gradient Gmn , and corresponding angle θmn at the position (m, n) are defined
as:
𝐺𝑚𝑛 = 𝑀 × 𝐺𝑚𝑛𝑥 + 𝐺𝑚𝑛
𝑦 (1)
𝜃𝑚𝑛 = 𝑡𝑎𝑛−1 𝐺𝑚𝑛
𝑦
𝐺𝑚𝑛𝑥 (2)
45
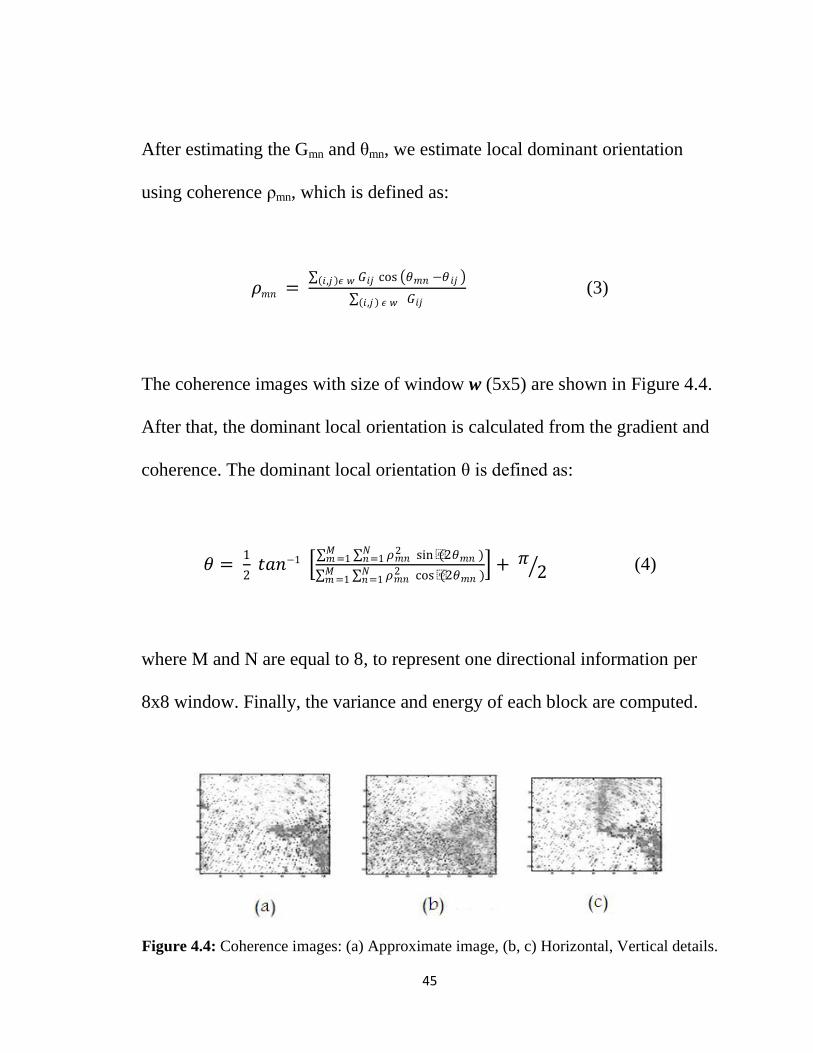
After estimating the Gmn and θmn, we estimate local dominant orientation
using coherence ρmn, which is defined as:
𝜌𝑚𝑛 = 𝐺𝑖𝑗 𝑖,𝑗 𝜖 𝑤 cos 𝜃𝑚𝑛 −𝜃𝑖𝑗
𝐺𝑖𝑗 𝑖,𝑗 𝜖 𝑤 (3)
The coherence images with size of window w (5x5) are shown in Figure 4.4.
After that, the dominant local orientation is calculated from the gradient and
coherence. The dominant local orientation θ is defined as:
𝜃 = 1
2 𝑡𝑎𝑛−1
𝜌𝑚𝑛2 sin (2𝜃𝑚𝑛 )𝑁
𝑛=1𝑀𝑚 =1
𝜌𝑚𝑛2𝑁
𝑛=1𝑀𝑚 =1 cos (2𝜃𝑚𝑛 )
+ 𝜋 2 (4)
where M and N are equal to 8, to represent one directional information per
8x8 window. Finally, the variance and energy of each block are computed.
Figure 4.4: Coherence images: (a) Approximate image, (b, c) Horizontal, Vertical details.

46
4.3 Directional Wavelets and Filters
Wavelet transform to an image results in four domains contain directional
image that are horizontal, vertical and diagonal. Wavelet transform comes
with many types [38] (Haar, Shannon, Meyer, Daubechies, and Coifmann
wavelets) and can be done in multilevel decomposition. The wavelet
transform is identical to a hierarchical sub band system where the sub- bands
are logarithmically spaced in frequency and represent octaveband
decomposition [31]. Wavelets provide rich techniques that can be applied to
many tasks in signal processing, and therefore have numerous potential
applications [30].
There are three steps to construct the directional image [29]. First, we need
to transform the original image using wavelet transform. Secondly, the
output from the wavelet transform is used to construct the directional image.
Finally, the directional image is smoothed to get better directional image.
So, wavelets are defined by a mathematical expression and are drawn as
continuous and infinite, which are called “crude wavelets”. However, to use
them with our digital signal, they must first be converted to wavelet filters
having a finite number of discrete points. That is, we evaluate wavelet
equation at the points of time that interest us in order to create filter values at

47
those times [38]. Conversely, some wavelets start as filters with as little as 2
points and built up by interpolating and extrapolating more points to get an
estimation of a continuous wavelet.
4.4 Filter Banks
The main concern when we want to obtain a representation for fingerprints is
to be invariant to scale, translation and rotation. Scale invariance is not a big
issue since this can be handled by scaling the fingerprint per dpi. The
rotation and translation has another story since it does not follow the
assumption that the fingerprints are vertically oriented, which most of the
feature extraction implementation do assume [15]. Most fingerprint
databases may have fingerprints that are oriented by up to ±45º away from
the assumed vertical orientation.
The problem with rotation could be handled, to some degree, with cyclic
rotation of the feature values, while the translation is addressed by
establishing a one reference point location during the feature extraction and
using a bank of Gabor filters on the region of interest around the reference
point, as shown in Figure 4.5. This will show enhancement of the ridge
structures using both one local ridge direction and local frequency
information as inputs for filtering.

48
Figure 4.5: Reference point (X), and region of interest divided into 80 sectors imposed
on the fingerprint.
A directional filter bank (DFB) analyzes an input image into directional sub-
band images and synthesizes them to the perfectly reconstructed image. The
DFB decomposes a fingerprint image into many directional sub-band images
and reconstruct the enhanced output image by synthesizing the filtered
outputs, which are blocks with the greatest energy among the sub band
images. DFB realizes a division of 2-D spectrum into 2n wedge-shaped slices
as shown in Figure 4.6, using an n-levels iterated tree structured filter banks.
Figure 4.6: Directional filter bank frequency partitioning [39].

49
The energy for each sub-band image is used to estimate the direction of each
block in the original image. The directional energy of block (I, J) including
the pixel (i, j) from the kth
sub-band image is defined as:
𝐸𝑘 I , J = 𝑓𝑘 𝐼 , 𝐽 ; 𝑖, 𝑗 𝑛𝑘𝑗=0
𝑚𝑘𝑖=0 (5)
The direction of each block for a directional image is generated based on the
direction corresponding to the sub-band with maximum energy among all
bands at each block. The direction of a block in a fingerprint is calculated by
using gradient-based methods, in which a gradient operator or eight one-
dimensional masks in eight directions are used [39].
Because the gradient operator uses a derivative operation, the results are
sensitive to noise. This is can be avoided by taking the direction
corresponding to the largest information content in a block so the result will
be more robust to noise. So, the direction of a block is defined by:
(6)

50
To insure that an injured ridge does not affect the ridge direction, a process
of directional averaging [40] could be done and its block direction should be
defined as 𝑑 𝐼 , 𝐽 . The resulting directional image overlapping with the
original image is shown in Figure 4.7.
Figure 4.7: Directional image [25].
5.5 Directional Filter Bank
In order to make this thesis practically self contained, we provide a brief
description of the DFB architecture employed in this work. The description
is sufficient to provide insight into how the DFB works but without the
details of implementation. The original concept of the DFB was introduced
by Bamberger and Smith [40] and later refined by Park et al. [44]. The

51
interested reader is referred to those two papers for additional detail. The
DFB divides the two-dimensional (2-D) spectrum of an image into wedge-
like directional sub-bands, as shown in Figure 4.8 (a). Eight directional sub-
band outputs can be obtained using the DFB, as shown in Figure 4.8 (b).
Figures 3.2(c,d) shows an example of the directional sub-band images
decomposed by the eight-band DFB, where each directional component is
captured in its own sub-band image. The DFB basically consists of lowpass
filters (𝑯𝟎), quincunx down samplers (𝑸), diamond conversion matrices (𝑹),
modulators (𝑒−𝑗𝜔 1 𝜋 ), and postsampling matrices (𝑩), as shown in Figure
4.1. The modulator varies the spectrum of the image so that the modulated
image can be divided into two directional sub-band images by a lowpass
filter with a diamond-shaped pass-band. Meanwhile, the quincunx down
sampler simultaneously down samples the image and rotates it by 45
degrees.
Figure 4.8: First phase of an eight-band DFB.
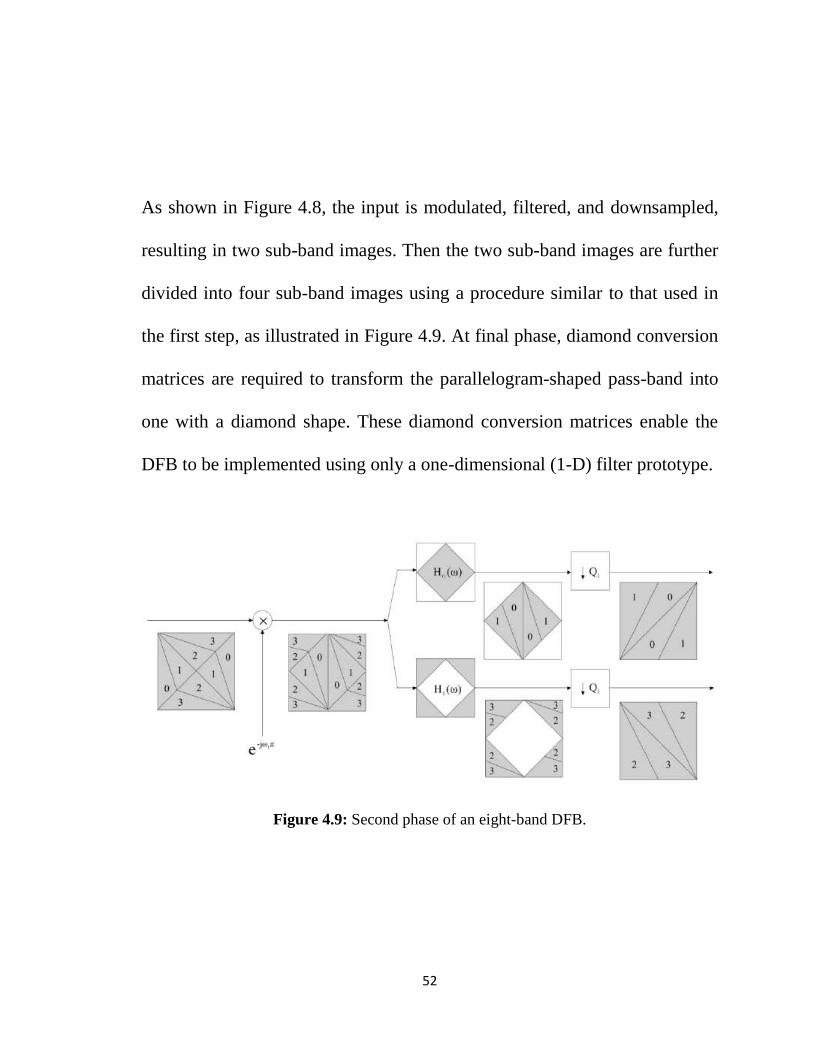
52
As shown in Figure 4.8, the input is modulated, filtered, and downsampled,
resulting in two sub-band images. Then the two sub-band images are further
divided into four sub-band images using a procedure similar to that used in
the first step, as illustrated in Figure 4.9. At final phase, diamond conversion
matrices are required to transform the parallelogram-shaped pass-band into
one with a diamond shape. These diamond conversion matrices enable the
DFB to be implemented using only a one-dimensional (1-D) filter prototype.
Figure 4.9: Second phase of an eight-band DFB.

53
Postsampling matrices are then appended to the end of the filter bank to
remove the phenomenon of frequency scrambling, resulting from the
frequency shift due to the modulator and nondiagonality of the overall down
sampling matrix. Filter bank stages can be implemented in a separable
polyphase form to achieve highly efficient realizations. Then, an eight
directional sub-band outputs are generated as in Figure 4.10.
Figure 4.10: Third phase of an eight-band DFB.
In this thesis, we propose the use of the DFB structure, defined in [40],
where the design of the lowpass filters is achieved through a linear phase IIR
filter. As a result of the downsampling, the eight-band decompositions are
rectangular. The analysis stage is based on a third-order decomposition of
NxN images leading to eight sub-bands where the first half of the sub-bands

54
has a size of N/4 x N/2, while the other half has a size of N/2 x N/4,
respectively.
4.6 Curvelets
The curvelet transform is obtained by filtering and then applying windowed
ridgelet transform on each bandpass image. This is done by Sub-band
decomposition of the object into a sequences of sub-bands. After that, each
sub-band is windowed into blocks of appropriate size, depending on its
center frequency. Finally, ridgelet transform will be applied on windowed
blocks [41]. Therefore, curvelet, as shown in Figure 4.11, basis functions can
be viewed as a local grouping of wavelet basis functions into linear
structures so that they can capture the smooth discontinuity curve more
efficiently [42].
Figure 4.11: Wavelet vs. Curvelet [42].

55
4.7 Invariants
Recognizing patterns in images has three main approaches: brute force,
image normalization and invariant features. The brute force require the use
of all possible representation of images which include their rotated, scaled,
blurred and deformed versions [43]. This method will have a very high time
complexity which is not applicable.
The normalization approach transforms the image into a standard position
which requires the solving of difficult inverse problems that are ill-posed or
ill-conditioned.
The invariants approach uses a set of measurable quantities that are
insensitive to particular deformation. Those invariants features have enough
discriminating power to distinguish patterns into different classes.
Mathematically speaking, selected features have the property called
invariance which can be expressed as:
𝐼 𝑓 = 𝐼(𝐷 𝑓 ) (7)
That is invariant I is a function that does not change its value under
degradation operator D.

56
4.7.1 Categories of Invariants
Invariants have different categories based on different points of view. There
four ways to categorize invariants:
Based on the type of invariance, namely, translation, rotation, scaling,
affine, projective, and elastic geometric invariants.
Radiometric invariants exist with respect to linear contrast stretching,
nonlinear intensity transformers, and convolution.
Categorization based on the mathematical tools used like:
o Simple shape descriptor – like compactness, convexity,
elongation, etc.
o Transform coefficient features – like Fourier, wavelet, and
Hadamard descriptors.
o Point set invariants – which uses positions of dominant points.
o Differential invariants – which uses derivatives of the object
boundary.
o Moment invariants – which uses special functions of image
moments.
Categorization based on the part of the object needed to calculate the
invariant:

57
o Global invariants – which is calculated from the whole image.
o Local invariants – which is calculated from dominant points.
o Semilocal invariants – which uses properties from both global
and local invariants.
4.8 Moments
Moments are scalar quantities used to characterize a function and to capture
its significant features, which is used in statistics for describing the shape of
a probability density function [43]. Mathematically speaking, moments are
“projections” of a function onto a polynomial basis.
Broadly speaking, Moments are categorized according to the polynomial
basis used into geometric & complex moments, and orthogonal moments. In
image processing filed, a moment is a certain particular weighted average of
the image pixels intensities, or a function of such moments, usually chosen
to have some attractive property or interpretation. Image moments are useful
to describe objects after segmentation. Simple properties of the image which
are found via image moments include area, intensity, centroid, and
information about its orientation.
The geometric moments of 2-D continuous function f(x,y), with a standard
power basis kpq (x, y) = xp y
q is defined by:

58
𝑀𝑝𝑞 = 𝑥𝑝𝑦𝑞 𝑓(𝑥, 𝑦) 𝑑𝑥 𝑑𝑦∞
−∞
∞
−∞ (8)
for p, q = 0,1,2,…,n
Adapting the above equation to scalar (grayscale) image with pixel
intensities I(x,y), raw image moments Mij are calculated by:
𝑀𝑖𝑗 = 𝑥 𝑖𝑦𝑗 𝐼(𝑥, 𝑦)𝑦𝑥 (9)
Complex moments are based on the polynomial basis kpq (x, y) = (x + iy)p (x-
iy)q is defined by:
𝑐𝑝𝑞 = (𝑥 + 𝑖𝑦)𝑝 (𝑥 − 𝑖𝑦)𝑞 𝑓(𝑥, 𝑦) 𝑑𝑥 𝑑𝑦∞
−∞
∞
−∞ (10)
Orthogonal (OG) moments are preferred in the literature because they are
fast and stable numerical implementation [43]. Another reason why OG
moments are used is due to better image construction. A 2D polynomial
orthogonal on a rectangle is constructed as products of 1D OG polynomials
pk(x). The OG moments will have the form:
𝑣𝑝𝑞 = 𝑛𝑝𝑛𝑞 𝑝𝑝 𝑥 𝑝𝑞 𝑦 𝑓(𝑥, 𝑦) 𝑑𝑥 𝑑𝑦
Ω (11)
Where np, nq are some normalized factors and Ω is the area of orthogonality.
The image 𝑓(𝑥, 𝑦) should be scaled such that its support is contained in Ω.

59
As an illustration we took an image and rotated 5º, and 10º, respectively as
shown in Figure 4.12.
Original Image Rotated 5º Rotated 10º
Figure 4.12: Rotated fingerprint example.
The Hu moments and Rotation invariants are presented in Table 4.1.
1st Hu Moments Rotation Invariant
Original Image
Φ1 = 0.3561 Φ5 = 0.0000 6.7343
18.6358
25.7912
24.8585
51.6173
Φ2 = 0.0007 Φ6 = -0.0000
Φ3 = 0.0002 Φ7 = -0.0000
Φ4 = 0.0009
Rotated 5º
Φ1 = 0.3563 Φ5 = 0.0000 6.7345
18.6301
25.7919
24.8507
51.3166
Φ2 = 0.0007 Φ6 = -0.0000
Φ3 = 0.0002 Φ7 = -0.0000
Φ4 = 0.0009
Rotated 10º
Φ1 = 0.3561 Φ5 = 0.0000 6.7344
18.6332
25.7937
24.8590
51.3158
Φ2 = 0.0007 Φ6 = -0.0000
Φ3 = 0.0002 Φ7 = -0.0000
Φ4 = 0.0009
Table 4.1: Hu moments & Rotation Invariants.

60
4.9 Moment Invariants to Translation, Rotation
and Scaling
Moment features can provide the properties of invariance to scale, position,
and rotation [43]. This section gives a brief description of the moment
analysis.
For a 2-D continuous function 𝑓(𝑥, 𝑦), the moment of order (p + q) is
defined as:
𝑚𝑝𝑞 = 𝑥𝑝𝑦𝑞𝑓(𝑥, 𝑦) 𝑑𝑥 𝑑𝑦∞
−∞
∞
−∞ (12)
for p, q = 0, 1, 2,…
The central moments are defined as:
𝜇𝑝𝑞 = (𝑥 − 𝑥𝑐)𝑝(𝑦 − 𝑦𝑐)𝑞𝑓(𝑥, 𝑦) 𝑑𝑥 𝑑𝑦∞
−∞
∞
−∞ (13)
Where,
𝑥𝑐 = 𝑚10
𝑚00 and 𝑦𝑐 =
𝑚01
𝑚00 (14)
If 𝑓(𝑥, 𝑦) is a digital image, then (13) becomes:
𝜇𝑝𝑞 = (𝑥 − 𝑥𝑐)𝑝(𝑦 − 𝑦𝑐)𝑞𝑓(𝑥, 𝑦)𝑦𝑥 (15)
Invariance is obtained by proper normalization of each moment. In principle,
any moment can be used as a normalizing factor provided that it is nonzero
for all images in the experiment. Since low-order moments are more stable to

61
noise and easier to calculate, we normalize most often by a proper power of
𝜇00 as follows:
𝑣𝑝𝑞 = 𝜇𝑝𝑞
𝜇00𝑤 (16)
Where,
𝑤 = 𝑝+𝑞
2+ 1 (17)
The moment 𝑣𝑝𝑞 is called normalized central geometric moment. Note that
the moment that was used for scaling normalization can no longer be used
for recognition because the value of the corresponding normalized moment
is always one.
4.10 Affine Moment Invariants
Affine moment invariants (AMIs) play a very important role in moment-
based pattern recognition applications. They are invariant with respect to
affine transform of the spatial coordinates. Affine transformation is a general
linear transform of spatial coordinates of the image, which can approximate
the projective transform [43].
The theory of AMIs is closely connected to the theory of algebraic invariants
and the Fundamental theorem describes this connection. The algebraic
invariant is a polynomial of coefficients of a binary form, whose value

62
remains the same after an affine transform of the coordinates. In the theory
of algebraic invariants, only the transforms without translation are
considered.
Let us consider an image 𝑓 and two arbitrary points (𝑥1, 𝑦1), (𝑥2, 𝑦2) from
its support. Let us denote the “cross-product” of these points as 𝐶12:
𝐶 12 = 𝑥1𝑦2 − 𝑥2𝑦1 (18)
After an affine transform, it holds that:
𝐶12 = 𝐽 · 𝐶12 (19)
Which means that 𝐶12 is a relative affine invariant. We consider various
numbers of points and we integrate their cross-products on the support of 𝑓.
These integrals can be expressed in terms of moments and, after proper
normalization, they yield affine invariants.
Mathematically, having 𝑟 points (𝑟 ≥ 2) we define functional 𝐼 depending
on 𝑟 and on non-negative integers 𝑛𝑘𝑗 as:
𝐼 𝑓 = 𝐶𝑘𝑗
𝑛𝑘𝑗𝑟𝑘 ,𝑗=1 .
∞
−∞
∞
−∞ 𝑓(𝑥𝑖 , 𝑦𝑖) 𝑑𝑥𝑖𝑑𝑦𝑖
𝑟𝑖=1 (20)
Note that it is meaningful to consider only 𝑗 > 𝑘, because 𝐶𝑘𝑗 = −𝐶𝑗𝑘 and
𝐶𝑘𝑘 = 0. After an affine transform, 𝐼(𝑓) becomes:
𝐼(𝑓)′ = 𝐽𝑤 𝐽 𝑟 · 𝐼(𝑓) (21)

63
where 𝑤 = 𝑛𝑘𝑗𝑘 ,𝑗 is called the weight of the invariant and 𝑟 is called the
degree of the invariant. If 𝐼(𝑓) is normalized by µ00𝑤+𝑟 , we obtain a desirable
absolute affine invariant:
𝐼(𝑓)
µ00𝑤+𝑟
′=
𝐼(𝑓)
µ00𝑤+𝑟 (22)
The maximum order of moments of which the invariant is composed is
called the order of the invariant. The order is always less than or equal to the
weight.
An important note here is that we can generate as many invariants as we
wish but only a few of them are independent. Since dependent invariants are
useless in practice, in a sense that it does not increase the discrimination
power of the recognition system at all while increasing the dimensionality of
the problem. This leads to growth of the complexity and even to
misclassifications.
4.10.1 Dependencies Among the AMIs
There might be various kinds of dependency in the set of all AMIs. They can
be categorized into five groups [43]:

64
1. Zero invariants: Some AMIs may be identically zero regardless of
the image from which they are calculated.
2. Products: Some invariants may be products of other invariants.
3. Linear combinations: Some invariants may be linear combinations of
other invariants.
4. Identical invariants
5. Polynomial dependencies: if there exists a finite sum of products of
invariants (including their integer powers) that equals zero, the
invariants involved are polynomially dependent.
The invariants having the dependencies 1 to 4 are called reducible invariants.
After eliminating all of them, we obtain a set of so-called irreducible
invariants. However, irreducibility does not mean independence. Since the
discussion about detect reducible and polynomially dependent invariants is
beyond the scope of this work, interested reader is referred to more detailed
discussion in [43]. The authors list all independent AMIs up to the weight 12
(80 independent invariants out of 1589 irreducible invariants), which we are
going to use in our work.
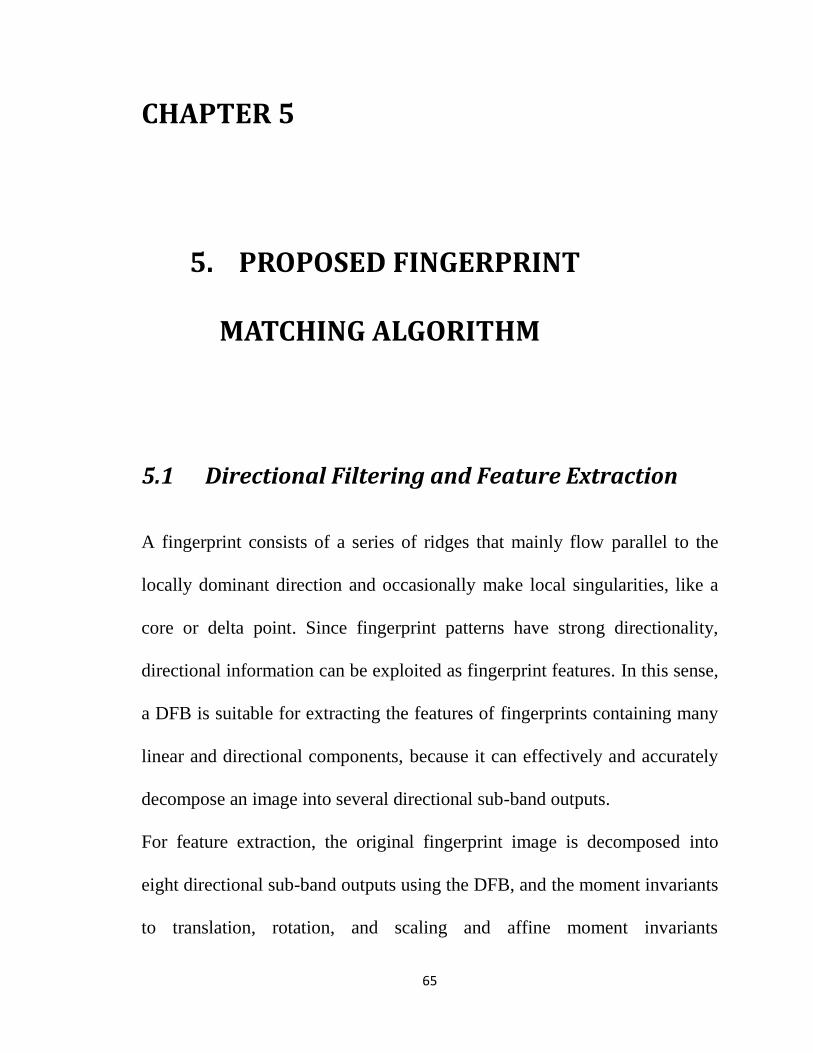
65
CHAPTER 5
5. PROPOSED FINGERPRINT
MATCHING ALGORITHM
5.1 Directional Filtering and Feature Extraction
A fingerprint consists of a series of ridges that mainly flow parallel to the
locally dominant direction and occasionally make local singularities, like a
core or delta point. Since fingerprint patterns have strong directionality,
directional information can be exploited as fingerprint features. In this sense,
a DFB is suitable for extracting the features of fingerprints containing many
linear and directional components, because it can effectively and accurately
decompose an image into several directional sub-band outputs.
For feature extraction, the original fingerprint image is decomposed into
eight directional sub-band outputs using the DFB, and the moment invariants
to translation, rotation, and scaling and affine moment invariants

66
(independent and irreducible) of each block can be obtained from the
decomposed sub-band outputs. Let 𝑓𝜃(𝑥, 𝑦) denote the coefficient at position
(x, y) of sub-band 𝜃 corresponding to a region of interest (ROI) image block
𝐵. Where 𝜃 ∈ 0, 1, 2, … , 7 for the sub-bands.
For an N x N image, the first half of the eight sub-band outputs is N/4 x N/2
in size, while the other half is N/2 x N/4, as explained in Section 4.5.
Therefore, the sub-bands corresponding to an m x n block have size m/4 x
n/2 for directions 0 to 3, and size m/2 x n/4 for directions 4 to 7, as
illustrated in Figure 5.1.
Figure 5.1: blocks in (a) Original image, (b) Sub-band output.
The proposed scheme of feature extraction first locates a reference point and
establishes an ROI around the detected reference point. The established ROI
is then decomposed into eight directional sub-band outputs using a DFB.
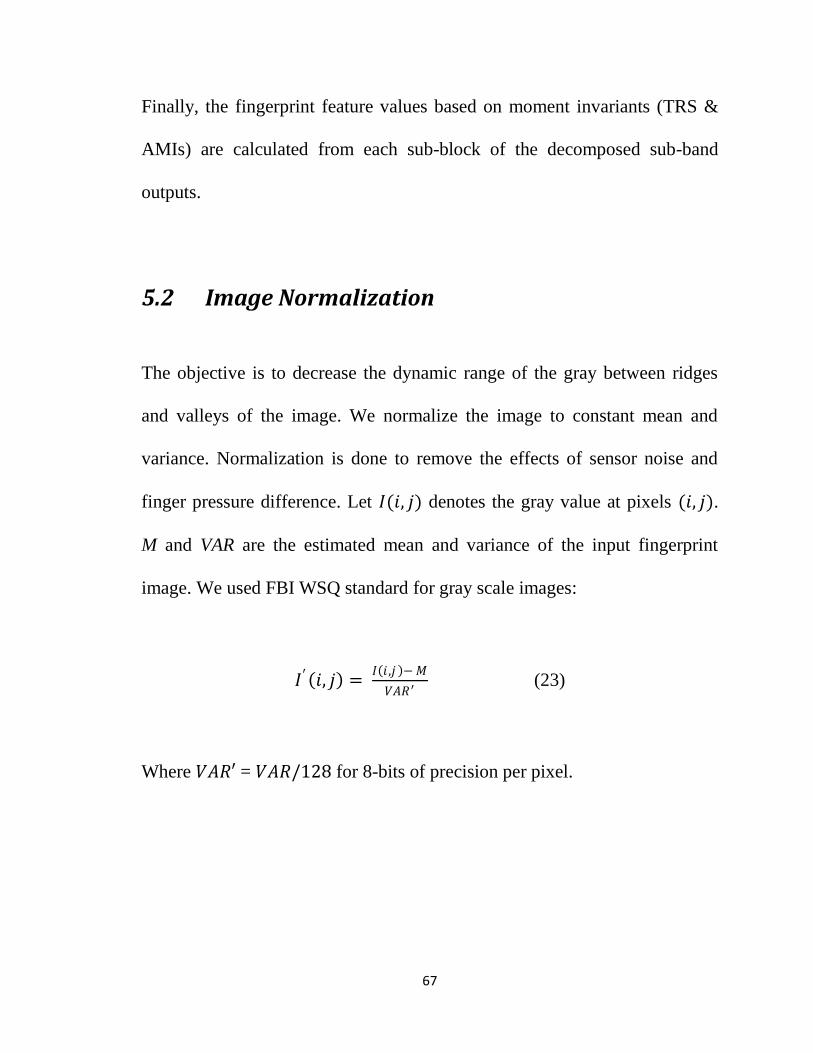
67
Finally, the fingerprint feature values based on moment invariants (TRS &
AMIs) are calculated from each sub-block of the decomposed sub-band
outputs.
5.2 Image Normalization
The objective is to decrease the dynamic range of the gray between ridges
and valleys of the image. We normalize the image to constant mean and
variance. Normalization is done to remove the effects of sensor noise and
finger pressure difference. Let 𝐼(𝑖, 𝑗) denotes the gray value at pixels (𝑖, 𝑗).
M and VAR are the estimated mean and variance of the input fingerprint
image. We used FBI WSQ standard for gray scale images:
𝐼′ 𝑖, 𝑗 = 𝐼 𝑖 ,𝑗 − 𝑀
𝑉𝐴𝑅′ (23)
Where 𝑉𝐴𝑅′ = 𝑉𝐴𝑅/128 for 8-bits of precision per pixel.

68
5.3 Reference Point and Region of Interest
4.3.1 Determination of Reference point
The reference (core) (Figure 5.2) point is defined as “the point of the
maximum curvature on the convex ridge [45],” which is usually located in
the central area of fingerprint. A summary of reference point location
algorithm is presented below [15].
Figure 5.2: The reference point one on the convex ridge.
1. Estimate the orientation field 𝑂 using a window size of 𝑤𝑥𝑤.
2. Smooth the orientation field in a local neighborhood. Let the
smoothed orientation field be represented as 𝑂′. In order to perform
smoothing (low-pass) filtering, the orientation image need to be
converted into a continuous vector field, which is defined as:

69
Φ𝑥 𝑖, 𝑗 = 𝑊 𝑢, 𝑣 . Φ𝑥 𝑖 − 𝑢𝑤, 𝑗 − 𝑣𝑤 𝑤Φ /2 𝑣=−𝑤Φ /2
𝑤Φ /2𝑢=−𝑤Φ /2 (24)
Φ𝑥 𝑖, 𝑗 = 𝑊 𝑢, 𝑣 . Φ𝑦 𝑖 − 𝑢𝑤, 𝑗 − 𝑣𝑤 𝑤Φ /2 𝑣=−𝑤Φ /2
𝑤Φ /2𝑢=−𝑤Φ /2 (25)
Where 𝑊 is a two-dimensional low-pass filter with unit integral and
𝑤Φ 𝑥 𝑤Φ specifies the size of the filter.
3. Compute 𝜀, an image containing only the sine component of 𝑂′.
4. Initialize A, a label image used to indicate the reference point.
5. For each pixel (i ,j) integrate pixel intensities (sine component of the
orientation field).
6. Find the maximum value and assign its coordinate as the reference
point.
4.3.2 Determination of ROI and Partition
After determining the coordinates of the reference point we crop the
fingerprint image into an ROI. In order to speed up the overall process, we
use only a predefined square area (ROI) with size N x N around the
reference point at the center for feature extraction instead of using the entire
fingerprint. In our experiment, we set N to 192. The center of the cropped

70
image centers the position of the reference point. Figure 5.3 demonstrates the
ROI centered on the determined reference point of two input fingerprints,
respectively.
(a) (b)
Figure 5.3: Region of interest (ROI) for feature extraction. A sample fingerprint (a)
whose ROI is established within the image and (b) whose ROI exceeds the image bound.
In case that the detected reference point is located at the corner of the image
as shown in Figure 5.3 (b), establishing the ROI of a fingerprint exceeds the
bound of an image. In such a case, the proposed method sets up the ROI by

71
inserting zeros in the outside area of the image. The ROI area with zero
value is excluded when fingerprint features are calculated and matching is
performed.
5.4 Invariant Moment Feature Vector Generation
At this stage, we apply the invariant moment analysis introduced in Section
4.9 and 4.10 on each one of the eight sub-band respectively. The extracted
ROI as shown in Figure 5.3 is decomposed into eight directional sub-band
outputs by an eight-band DFB. For each sub-band, divide it into sub-blocks
and a set of 35 independent AMIs and 21 TRS moment invariants of the 5th
order is computed for each sub-block. As a result 56 set of invariant
moments for each of the 8 sub-blocks are extracted as features to represent a
fingerprint.
The procedure for feature extraction can be summarized as follows:
1. Normalize the image.
2. Identify the core point and extract the ROI.
3. Apply the eight-band DFB to the ROI with dimension 𝑁 𝑥 𝑁. The
output is a set of eight subbands as illustrated in Figure 3.2 (d).

72
4. Further divide each sub-band output into sub-blocks that will serve as
the region of support for the feature vector calculations. If we envision
a sub-block of size n x n (where N is a multiple of n) then the sizes of
the corresponding sub-blocks with the sub-bands are 𝑛/4 𝑥 𝑛/2 for
sub-bands 0 to 3 and 𝑛/2 𝑥 𝑛/4 for sub-bands 4 to 7.
5. Calculate the 56 set of invariant moments from each “smaller block”
to form the feature vector, as introduced in sections 4.9 and 4.10.
6. Finally, combine the features calculated from each sub-block 𝐼𝜃𝑘 into
one vector 𝑉𝑓 = 𝐼01 , 𝐼02 , … , 𝐼𝜃𝑘 , where 𝜃 𝜖 0, 1, 2, 3, 4, 5, 6, 7 and
𝑘 𝜖 0, 1, 2, … , 56 .
5.5 Fingerprint Matching
Generally speaking, other methods require that before the input print and
template print are compared with each other, they should be translationally
and rotationally aligned with each other. Rotational alignment is achieved by
generating cyclical input feature vectors and matching input feature vectors
with template feature vectors. In our proposed method, the translational
alignment is not of concern because by applying invariant analysis to the
extracted ROI by the reference point detection process. Since the proposed

73
feature extraction process is based on moments that are invariant to
translation, rotation and scaling, the proposed method is robust to angular
deviations without rotation and translation compensation.
Fingerprint matching is performed based on finding the absolute distance
between the input feature vectors and the template feature vector enrolled in
the database. Let:
𝑉𝑓1 = 𝑎1 , 𝑎2, … , 𝑎𝑛 and 𝑉𝑓2 = 𝑏1 , 𝑏2 , … , 𝑏𝑛 [26]
Denote the feature vectors of the two fingerprints to be matched, the
difference vector 𝑉𝑑 of the two fingerprint feature vectors is calculated
as in (27).
𝑉𝑑 = 𝑎1−𝑏1
max (𝑎1 ,𝑏1),
𝑎2−𝑏2
max (𝑎2 ,𝑏2)……
𝑎𝑛−𝑏𝑛
max (𝑎𝑛 ,𝑏𝑛 ) (27)
We define the absolute distance of the two matching vectors as in (28).
𝑅𝑚 = 𝑎𝑖−𝑏𝑖
max (𝑎𝑖 ,𝑏𝑖)
𝑛𝑖=1 (28)

74
CHAPTER 6
6. EXPERIMENTAL RESULTS
We used moment analysis to extract invariant features from
partitioned DFB sub-images in an ROI.
In order to measure the objective performance, we run the matching
algorithm on images from FVC2002 fingerprint database set, which contains
four distinct databases: DB1_A, DB2_A, DB3_A and DB4_A. Each
database consists of 800 images (100 distinct fingers, 8 impressions each). In
order to obtain the performance characteristic such as EER (Equal Error
Rate) we perform a total of 2,800 genuine comparisons (each instance of a
finger is compared with the rest of the instances resulting in (8x7)/2 tests per
finger) and 39,600 impostor comparisons (the first instance of each finger is
compared against the first instance of all other fingers resulting in a total of
(100x99)/2 tests for each impression).
Number of Genuine Tests Number of Impostor Tests
2,800 39,600
Table 6.1: Number of Tests.

75
First, the genuine and imposter distributions were obtained for the proposed
method, then the verification performance was assessed based on the
characteristics of the distributions. The genuine distribution indicates the
distribution of the distances between all possible intra-class image pairs in
the database, while the imposter distribution represents the distribution of the
distances between all possible inter-class image pairs in the database. The
more the genuine and imposter distributions are separated and the smaller the
standard deviation for each distribution, the more advantageous for a
personal verification method. Figure 6.1 shows the genuine and imposter
distributions for the proposed method along with their characteristics in
Table 6.2.
Figure 6.1: Genuine and imposter distributions for the proposed method (DB1_A).
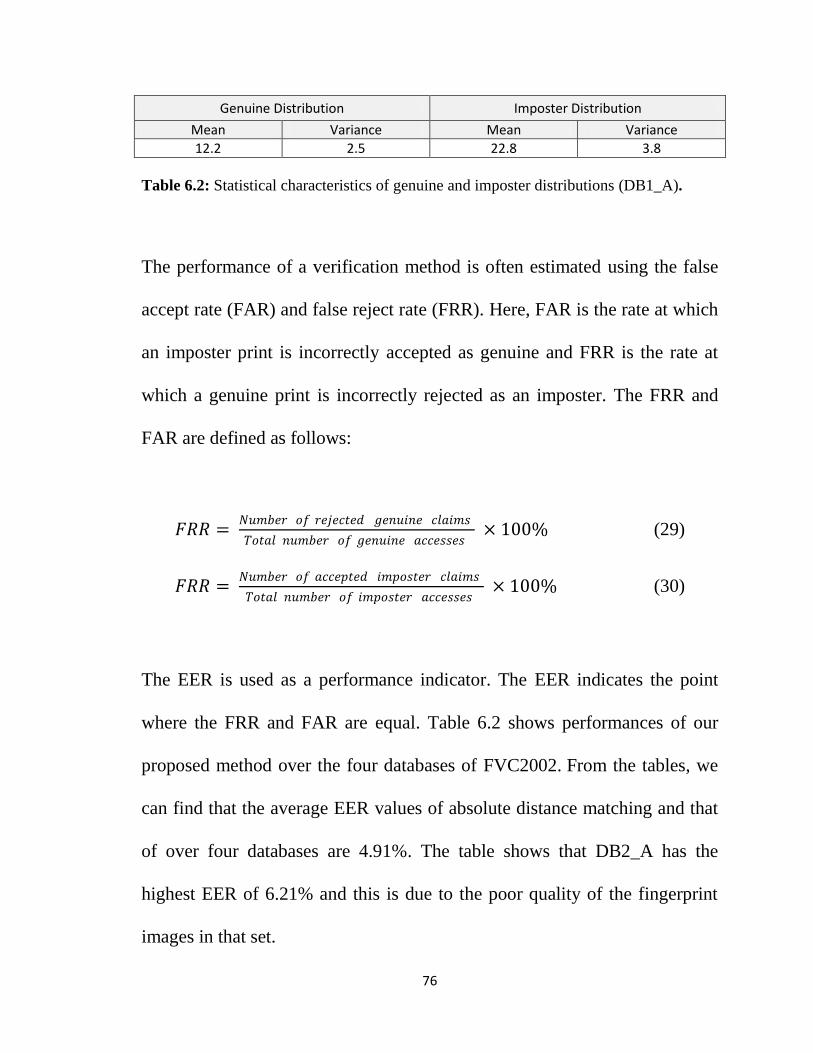
76
Genuine Distribution Imposter Distribution
Mean Variance Mean Variance
12.2 2.5 22.8 3.8
Table 6.2: Statistical characteristics of genuine and imposter distributions (DB1_A).
The performance of a verification method is often estimated using the false
accept rate (FAR) and false reject rate (FRR). Here, FAR is the rate at which
an imposter print is incorrectly accepted as genuine and FRR is the rate at
which a genuine print is incorrectly rejected as an imposter. The FRR and
FAR are defined as follows:
𝐹𝑅𝑅 = 𝑁𝑢𝑚𝑏𝑒𝑟 𝑜𝑓 𝑟𝑒𝑗𝑒𝑐𝑡𝑒𝑑 𝑔𝑒𝑛𝑢𝑖𝑛𝑒 𝑐𝑙𝑎𝑖𝑚𝑠
𝑇𝑜𝑡𝑎𝑙 𝑛𝑢𝑚𝑏𝑒𝑟 𝑜𝑓 𝑔𝑒𝑛𝑢𝑖𝑛𝑒 𝑎𝑐𝑐𝑒𝑠𝑠𝑒𝑠 × 100% (29)
𝐹𝑅𝑅 = 𝑁𝑢𝑚𝑏𝑒𝑟 𝑜𝑓 𝑎𝑐𝑐𝑒𝑝𝑡𝑒𝑑 𝑖𝑚𝑝𝑜𝑠𝑡𝑒𝑟 𝑐𝑙𝑎𝑖𝑚𝑠
𝑇𝑜𝑡𝑎𝑙 𝑛𝑢𝑚𝑏𝑒𝑟 𝑜𝑓 𝑖𝑚𝑝𝑜𝑠𝑡𝑒𝑟 𝑎𝑐𝑐𝑒𝑠𝑠𝑒𝑠 × 100% (30)
The EER is used as a performance indicator. The EER indicates the point
where the FRR and FAR are equal. Table 6.2 shows performances of our
proposed method over the four databases of FVC2002. From the tables, we
can find that the average EER values of absolute distance matching and that
of over four databases are 4.91%. The table shows that DB2_A has the
highest EER of 6.21% and this is due to the poor quality of the fingerprint
images in that set.
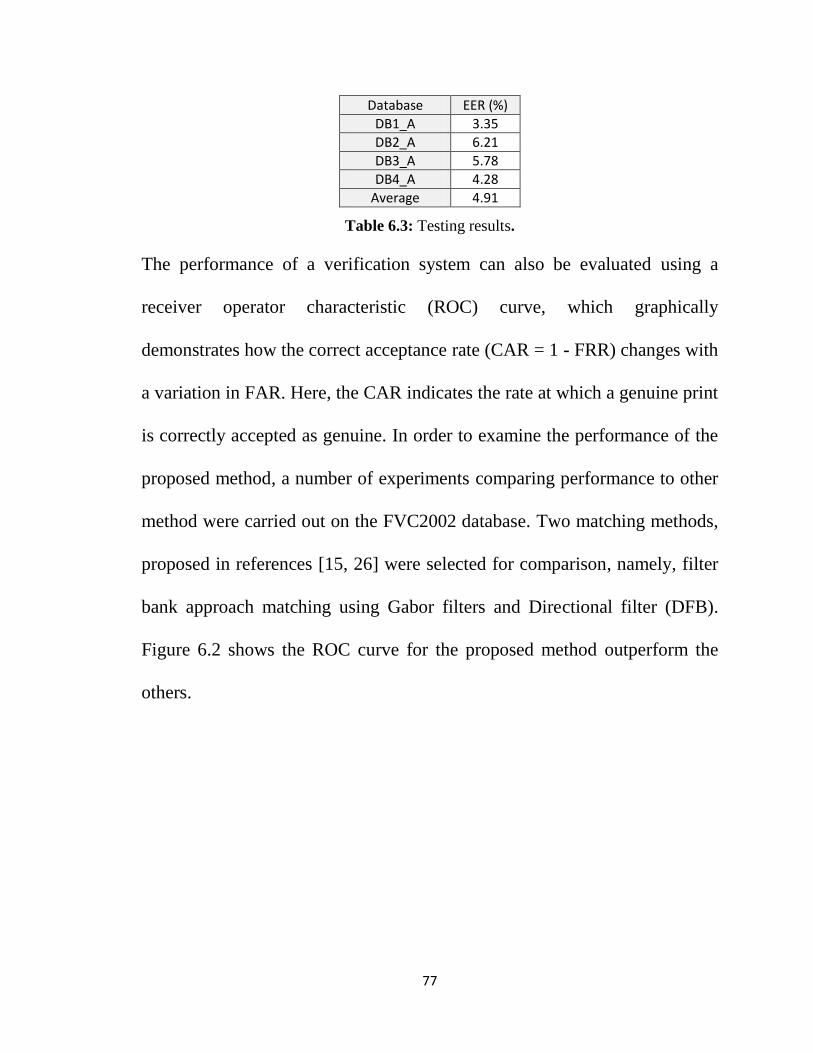
77
Database EER (%)
DB1_A 3.35
DB2_A 6.21
DB3_A 5.78
DB4_A 4.28
Average 4.91
Table 6.3: Testing results.
The performance of a verification system can also be evaluated using a
receiver operator characteristic (ROC) curve, which graphically
demonstrates how the correct acceptance rate (CAR = 1 - FRR) changes with
a variation in FAR. Here, the CAR indicates the rate at which a genuine print
is correctly accepted as genuine. In order to examine the performance of the
proposed method, a number of experiments comparing performance to other
method were carried out on the FVC2002 database. Two matching methods,
proposed in references [15, 26] were selected for comparison, namely, filter
bank approach matching using Gabor filters and Directional filter (DFB).
Figure 6.2 shows the ROC curve for the proposed method outperform the
others.

78
Figure 6.2: ROC curves comparing the recognition rate performance of the proposed
method with the other 2 methods on database FVC2002 DB1_A.
Figure 6.3: ROC curves on database FVC2002 DB2_A.
As shown previously that DB2_A has the highest EER, Figure 6.3 shows
how the ROC curves gives mixed results due to the poor quality of the
fingerprint images in that set. Figures 6.4 and 6.5 confirms that the proposed

79
method gives better performance on FVC2002 DB3_A and DB4_A, as the
results presented from the first database set. It is noted that DFB method
outperformed the Gabor Filter method only on DB3_A, as illustrated in
Figure 6.4.
Figure 6.4: ROC curves on database FVC2002 DB3_A.
Figure 6.5: ROC curves on database FVC2002 DB4_A.
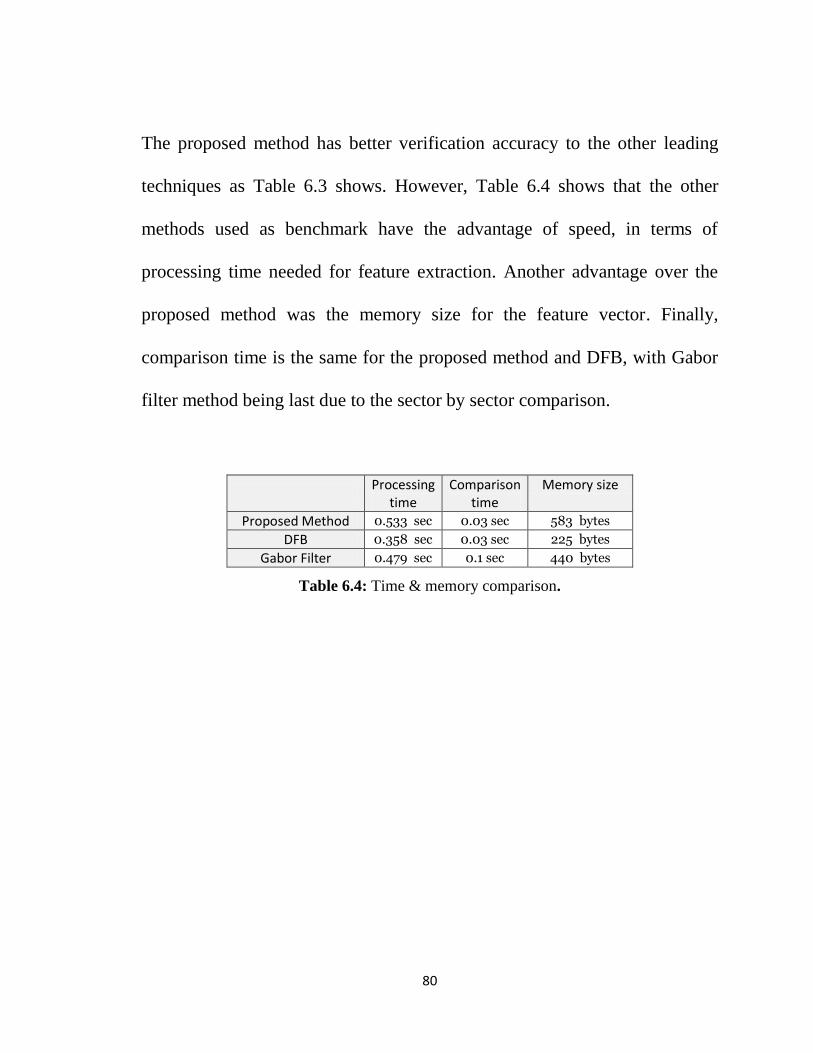
80
The proposed method has better verification accuracy to the other leading
techniques as Table 6.3 shows. However, Table 6.4 shows that the other
methods used as benchmark have the advantage of speed, in terms of
processing time needed for feature extraction. Another advantage over the
proposed method was the memory size for the feature vector. Finally,
comparison time is the same for the proposed method and DFB, with Gabor
filter method being last due to the sector by sector comparison.
Processing
time Comparison
time Memory size
Proposed Method 0.533 sec 0.03 sec 583 bytes
DFB 0.358 sec 0.03 sec 225 bytes
Gabor Filter 0.479 sec 0.1 sec 440 bytes
Table 6.4: Time & memory comparison.

81
CHAPTER 7
7. CONCLUSION
7.1 Overview
This work presented a fingerprint matching algorithm that combines
AMIs and TRS invariants based on moments analysis that does not have to
detect minutiae. First, a preprocessing by normalizing the fingerprint image
using WSQ standard definition is done.
The reference point can be reliably and accurately determined with the
analysis of orientation field. Then uses the area within a certain range around
the detected reference point as a ROI for feature extraction.
The method uses a DFB to obtain directional components of the
image. Using the invariant moment analysis on sub-bands of the filtered
images, the extracted features have bound the effects of noise and non-linear
distortions, while utilizing the invariant ability to the translation, rotation,
scaling and affine transformations of features to handle various input

82
conditions. The new feature vector capture more global information on
fingerprint ridges pattern.
Matching the fingerprints is implemented by absolute distance which
has a faster matching speed than other methods. This is because of the nature
of the AMIs and TRS invariants used that eliminate the translational and
rotational alignment to be done.
Experimental results using FVC2002 fingerprint database demonstrate that
the proposed method has better verification accuracy to the other leading
techniques, along with robustness to image rotation and translation. We
present the comparative results in Table 6.2. The improvement in the ROC
curves presented in the experimental results section.
7.2 Summary of Contributions
The proposed method has better verification accuracy to the other leading
techniques, along with robustness to image rotation and translation. However
the other methods used as benchmark have the advantage of speed, in terms
of processing time needed for feature extraction. Another advantage over the
proposed method was the memory size for the feature vector.

83
7.3 Future Work
A number of opportunities exist to extend this work. First, an
investigation to other moments family like Zernike, Orthogonal Fourier–
Mellin, Legendre, and Chebyshev moments, examining their potential to be
used to construct a feature vector and the discriminate power they can
achieve. Second, exploring the use of other transform like curvelets and
contourlet. Finally, considering the use of a hybrid-classifier to seek
improving the accuracy of matching.

84
8. REFERENCES
[1] A. K. Jain, P. Flynn, and A. A. Ross. Handbook of Biometrics. Springer,
2009.
[2] International Biometric Group. Biometric statistics in focus. Elsevier
Ltd., 2006.
[3] International Biometric Group. Biometrics Market and Industry Report.
Elsevier Ltd., 2009.
[4] Acuity Market Intelligence. The Future of Biometrics 2009.
[5] D. Maltoni, D. Maio, A. K. Jain, and S. Prabhakar. Handbook of
Fingerprint Recognition. Springer, 2009.
[6] U. Park, S. Pankanti, and A. K. Jainban, “Fingerprint Verification Using
SIFT Features,” SPIE Defense and Security Symposium, Orlando, Florida,
2008.
[7] S. Yang, and I. M. Verbauwhede, “A secure fingerprint matching
technique,” Proceedings of the 2003 ACM SIGMM workshop on Biometrics
methods and applications, Berkley, California, November 08, 2003.
[8] A. K. Jain, L. Hong, and S. Pankanti, “Biometric identification,” Comm.
ACM, pp. 91–98, 2000.
[9] X. Jiang, and W. Yau, “Fingerprint minutiae matching based on the local
and global structures,” Proceedings 15th International Conference on Pattern
Recognition. (ICPR-2000). IEEE Comput. Soc. Part, vol. 2, pp. 1038-41, Los
Alamitos, CA, USA, 2000.
[10] L. Hong, Y. Wan, and A. Jain, “A Fingerprint Image Enhancement
Algorithm and Performance Evaluation,” IEEE Trans. on Pattern Analysis
and Machine Intelligence, vol. 20, no. 8, pp. 777-789, 1998.

85
[11] N. K. Ratha, J. H. Connell, and R. M. Bolle, "An Analysis of Minutiae
Matching Strength," Lecture Notes in Computer Science, vol. 2091, pp. 223-
228, 2001.
[12] FVC2002, http://bias.csr.unibo.it/fvc2002/
[13] S. Chikkerur, S. Pankanti, A. Jea, N. Ratha, and R. Bolle, “Fingerprint
Representation Using Localized Texture Features,” International Conference
on Pattern Recognition, pp. 521-524, 2006.
[14] D. Lowe, “Distinctive image features from scale-invariant key points,”
International Journal of Computer Vision, vol. 60, no. 2, pp. 91-110, 2004.
[15] A. K. Jain, S. Prabhakar, L. Hong, and S. Pankanti, “Filterbank-based
Fingerprint Matching,” IEEE Trans. on Image Processing, vol. 9, no. 5, pp.
846-859, 2000.
[16] X. Feng, Tong, X. Long, J. Huang, and X. Li. “Fingerprint minutiae
matching based on complex minutiae vector,” In Proceedings of
International Conference on Machine Learning and Cybernetics, vol. 6, pp.
3731, 2004.
[17] X. Liang, and Asano, “Fingerprint matching using minutia polygons,”
In 18th International Conference on Pattern Recognition (ICPR), vol. 1, pp.
1046-1049, 2006.
[18] A. Ross, A. Jain, and J. Reisman, “A Hybrid Fingerprint Matcher,”
International Conference on Pattern Recognition (ICPR), Quebec City,
August 11-15, 2002.
[19] R. O. Duda and P. E. Hart, “Generalizing the Hough transform to detect
arbitrary shapes,” Pattern Recognition vol.3, no. 2, pp.110-122, 1981.
[20] K. Fielding, J. Homer, and C. Makekau, “Optical fingerprint
identification by binary joint transform correlation,” Optical Engineering,
vol. 30, no. 12, 1992.
[21] F. T. Gamble, L. M. Frye, and D. R. Grieser, “Real-time fingerprint
verification system,” Applied Optics, vol. 31, no. 5, pp. 652-655, 1992.

86
[22] V. Govindaraju, Z. Shi, and J. Schneider, “Feature extraction using a
chain-coded contour representation,” Proc. Int. Conf. on Audio- and Video-
Based Biometric Person Authentication.
[23] A. N. Marana and A. K. Jain, “Ridge-based fingerprint matching using
hough transform,” In 18th Brazilian Symposium on Computer Graphics and
Image Processing (SIBGRAPI05), pp. 112-119, 2005.
[24] A. Ross, S. C. Dass, and A. K. Jain, “Fingerprint warping using ridge
curve correspondences,” Pattern Analysis and Machine Intelligence, IEEE
Trans. pp. 19-30, 2006.
[25] S. K. Oh, J. J. Lee, C. H. Park, B. S. Kim, and K. H. Park, “New
Fingerprint Image Enhancement Using Directional Filter Bank,” Journal of
WSCG, vol. 11, no. 1, 2003.
[26] C. H. Park, J. J. Lee, and M. J. Smith, “Directional Filter Bank-Based
Fingerprint Feature Extraction and Matching,” IEEE Transactions on
Circuits and Systems for Video Technology, vol. 14, no. 1, pp. 74-85, 2004.
[27] O. A. Zuniga and R. M. Haradick, “Integrated Directional Derivative
Gradient Operators,” IEEE Trans. Systems, Man, and Cybernetics, SMC-17,
pp. 508-517, 1987.
[28] G. Iannizzotto and F. La Rosa, “A SIFT-Based Fingerprint Verification
System Using Cellular Neural Networks,” Pattern Recognition Techniques,
Technology and Applications. pp. 626, 2008.
[29] M. M. Mokji, S. A. S. Abu Bakar, and Z. Ibrahim, “Fingerprint
Classification Based on Directional Image Constructed Using Wavelet
Transform Domains,” International Conference on Robotics Vision,
Information, and Signal Processing (ROVISP 2003), Penang, Malaysia, pp.
22-24, January 2003.
[30] W. K. Lee and J. H. Chung, “Automatic real-time identification of
fingerprint images using wavelets and gradient of Gaussian,” 40th Midwest
Symposium on Circuits and Systems, Vol. 2, pp. 917-920, 1997.

87
[31] M. Antonini, M. Barlaud, and P. Mathieu, “Image Coding using
Wavelet Transform,” IEEE Trans. on Image Processing, vol. 2, no. 2, pp.
205-220, 1992.
[32] M. M. Mokji, S. A. S. Abu Bakar, and Z. Ibrahim, “Fingerprint
Classification Using Signature Obtain From Second Stage Discrete Wavelet
Transform,” Malaysian Science and Technology Congress on Information
and Communication Technology, Penamg, Malaysia, November 2001.
[33] Jea, T. Minutiae-based partial fingerprint recognition. Ph.D. thesis, State
University of New York at Buffalo, 2005.
[34] B. D. Patil, J. V. Kulkarni, and R. S. Holambe, “Fingerprint
Verification Using Wavelet and Local Dominant Orientation,” Visual
Information Engineering, 2006. VIE 2006. IET International Conference, pp.
79-82, 2006.
[35] D. Lowe, "Method and apparatus for identifying scale invariant
features in an image and use of same for locating an object in an image,"
U.S. Patent 6,711,293.
[36] D. Lowe, "Object recognition from local scale-invariant features,"
Proceedings of the International Conference on Computer Vision, pp. 1150–
1157, 1999.
[37] R. M. Rao, and A. S. Bopardikar. Wavelet Transforms: Introduction to
Theory & Applications. Prentice Hall, 1998.
[38] J. C. Goswami. Fundamentals of Wavelets: Theory, Algorithms, and
Applications. Wiley-Interscience, 1999.
[39] M. N. Do and M. Vetterli, “Pyramidal directional filter banks and
curvelets,” IEEE International Conference on Image Processing (ICIP),
Thessaloniki, Greece, October 2001.
[40] R. H. Bamberger and M. J. T. Smith, “A filter bank for the directional
decomposition of images: Theory and design,” IEEE Trans. Signal
Processing, vol. 40, pp. 882–893, Apr. 1992.

88
[41] M. N. Do and M. Vetterli, “The contourlet transform: an efficient
directional multiresolution image representation,” IEEE Trans. Image on
Processing, vol. 14, no. 12, pp. 2091-2106, December 2005.
[42] M. N. Do and M. Vetterli. Contourlets, Beyond Wavelets. G. V.
Welland ed., Academic Press, 2003.
[43] J. Flusser, T. Suk, and B. Zitova. Moments and Moment Invariants in
Pattern Recognition. Jon Wiley & Sons, 2009.
[44] S. Park, M. J. T. Smith, and R. M. Mersereau, “A new directional filter
bank for image analysis and classification,” in Proc. Int. Conf. Acoustics,
Speech, and Signal Processing, vol. 3, 1999, pp. 1417–1420.
[45] M. Liu, X. D. Jiang, and A. Kot, “Fingerprint reference-point
detection,” EURASIP Journal on Applied Signal Processing, vol. 2005, no.
4, pp. 498-509, 2005.
[46] S. Pankati and M. M. Yeung, “Verification Watermark on Fingerprint
Recognition and Retrieval,” SPIE, Security and Watermarking of
Multimedia Contents, vol. 3657, pp. 66-78, April 1999.

89
Vita
Personal
Information
Date of Birth: 1981
Place of Birth: KSA
Nationality: Saudi
Email: mailto:[email protected]
Mobile #: +966-504817818
Present Address: Menna Street, Mazroayiah District,
P.O.BOX 35122, ZIP 31488, Dammam, Saudi Arabia.
Permanent Address: Menna Street, Mazroayiah District,
P.O.BOX 35122, ZIP 31488, Dammam, Saudi Arabia.
Languages:
1. Arabic (native language)
2. English
Education
1999 -2004: King Fahd University of Petroleum & Minerals,
Dhahran, Bachelor of Science in Software Engineering.
2005-2006: New York Institute of Technology, Master of
Business Administration.
2007-2010: King Fahd University of Petroleum &Minerals,
Dhahran, Master of Science in Computer Science.
Work
2005- March 2010: Analyst, Saudi Electricity Company.
Interests
Image processing and pattern recognition
Biometric systems
Software architecture
ERP systems