Embed Size (px)
Citation preview

I would like to present FUJIFILM Holdings’ financial results for the fiscal year ended March 2019.
1

Let me explain the main points for the fiscal year ended March 2019.
I h fi l i i l l i d b 70% d h i fi lIn the fiscal year, operating income largely increased by 70% compared to the previous fiscal year, reaching a record-high.
Major contributions to the record-high figure came from a large increase of operating income in the healthcare business including the medical systems and bio CDMO and in the electronic materials business, and good progress with improvements of profitability and structural reforms in the document business.
In the fourth quarter (3 months), we decided, in the bio CDMO business, to acquire the manufacturing subsidiary of Biogen Inc., a U.S.- based large biopharmaceutical company.The share buyback of up to ¥100.0 billion has been completed.
2

Let’s move on to detailed performance information for the fiscal year ended March 2019.
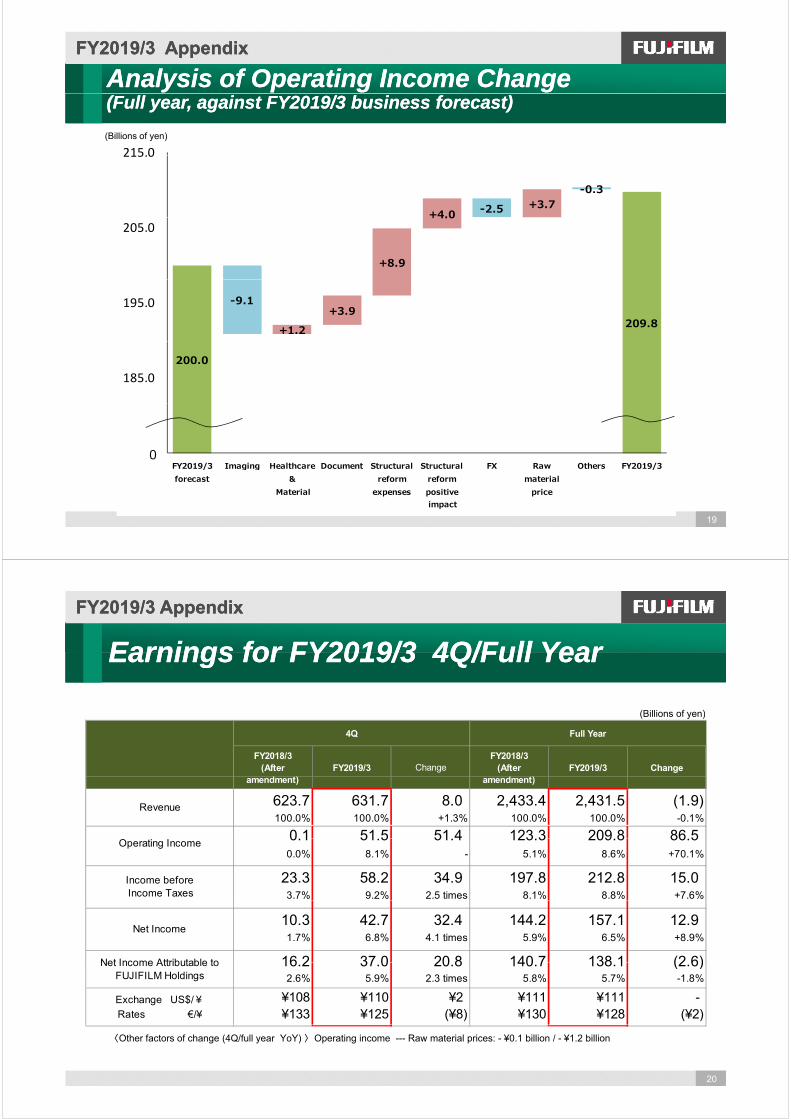
C lid d l d ¥2 431 5 billi h l l h i fi lConsolidated revenue totaled ¥2,431.5 billion, at the same level as the previous fiscal year.Though sales decreased in the document business due to a reduction in low-profit, low-end printer business, sales increased in the medical systems, bio CDMO, regenerative medicine and electronic materials business.
Operating income increased to ¥209.8 billion, up 70.1% from the previous fiscal year, due to improvements of profitability in each business and a positive impact from structural reformsimprovements of profitability in each business, and a positive impact from structural reforms in the document business.
Despite a profit gained from a stock valuation of about ¥20 billion booked in the previous fiscal year at the time of consolidating Wako Pure Chemical Industries, Ltd., income before income taxes came to ¥212.8 billion, up 7.6% from the previous fiscal year, and net income came to ¥157.1 billion.
Operating income, income before income taxes and net income achieved a record high.
Net income attributable to FUJIFILM Holdings totaled ¥138.1 billion, down 1.8% from the previous fiscal year.
3

Let’s move on to segment specific information.
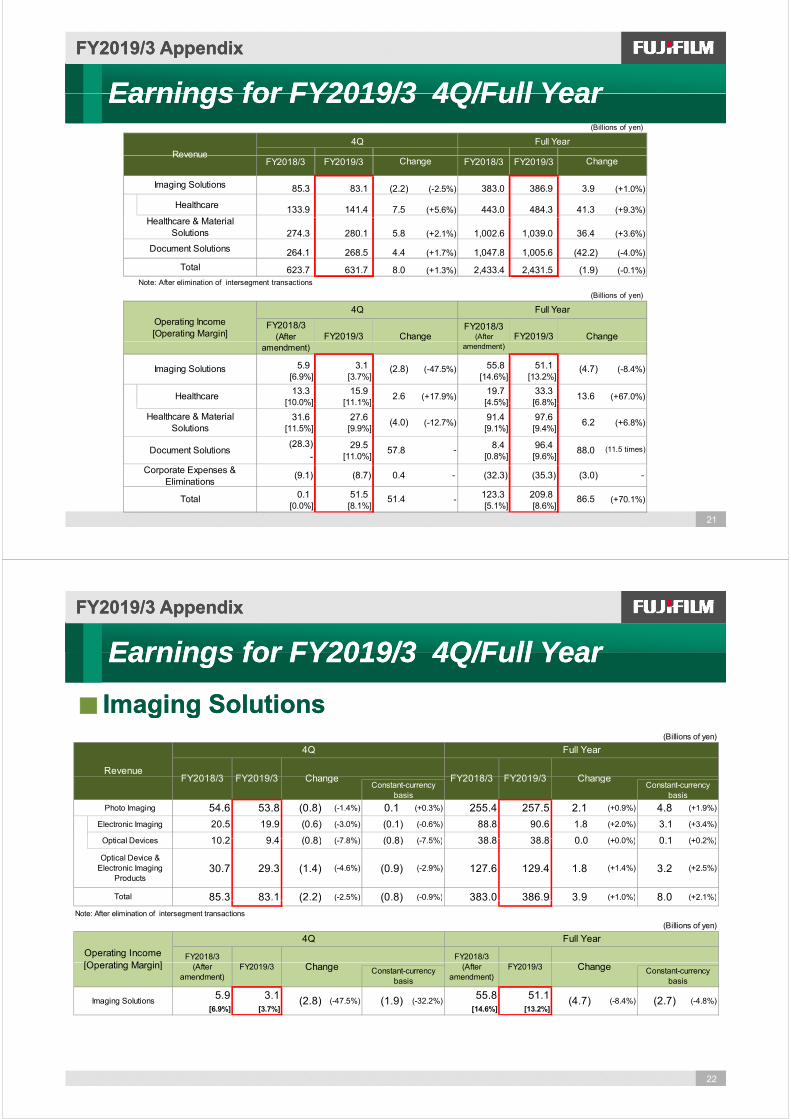
The Imaging Solutions segment recorded revenue of ¥386.9 billion, up 1.0% year-on-year.Operating income totaled ¥51.1 billion, down 8.4% from the previous fiscal year due to such factors as upfront investments in advertising, promotion and R&D.
The Healthcare & Material Solutions segment recorded revenue of ¥1,039.0 billion, up 3.6% year-on-year.Operating income totaled ¥97.6 billion, up 6.8% from the previous fiscal year due to increased profit in accordance with the revenue growth.
Within the Healthcare & Material Solutions segment, the healthcare business recorded revenue of ¥484.3 billion, up 9.3% year-on-year.O ti i t t l d ¥33 3 billi 67%Operating income totaled ¥33.3 billion, up 67% year-on-year.
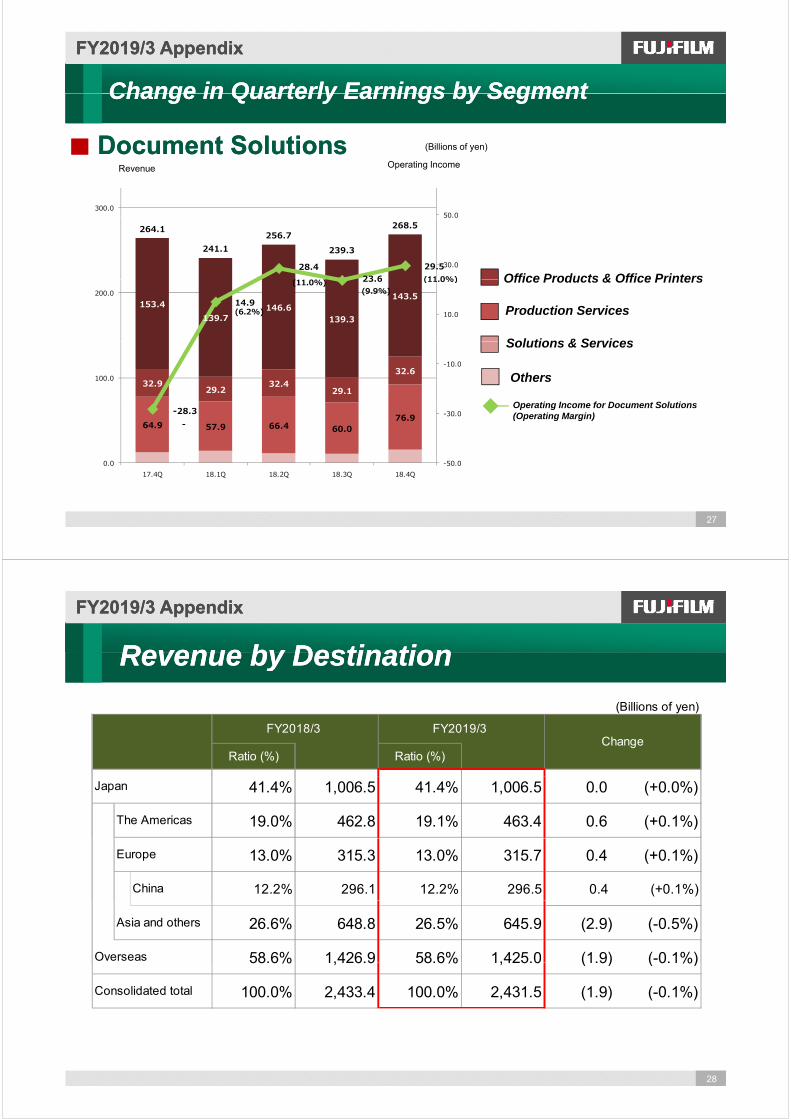
The Document Solutions segment recorded revenue of ¥1,005.6 billion, down 4.0% year-on-year, due to such factors as a reduction in low-profit, low-end printer business.Operating income totaled ¥96.4 billion, 11.5 times the level of the previous fiscal year.
4
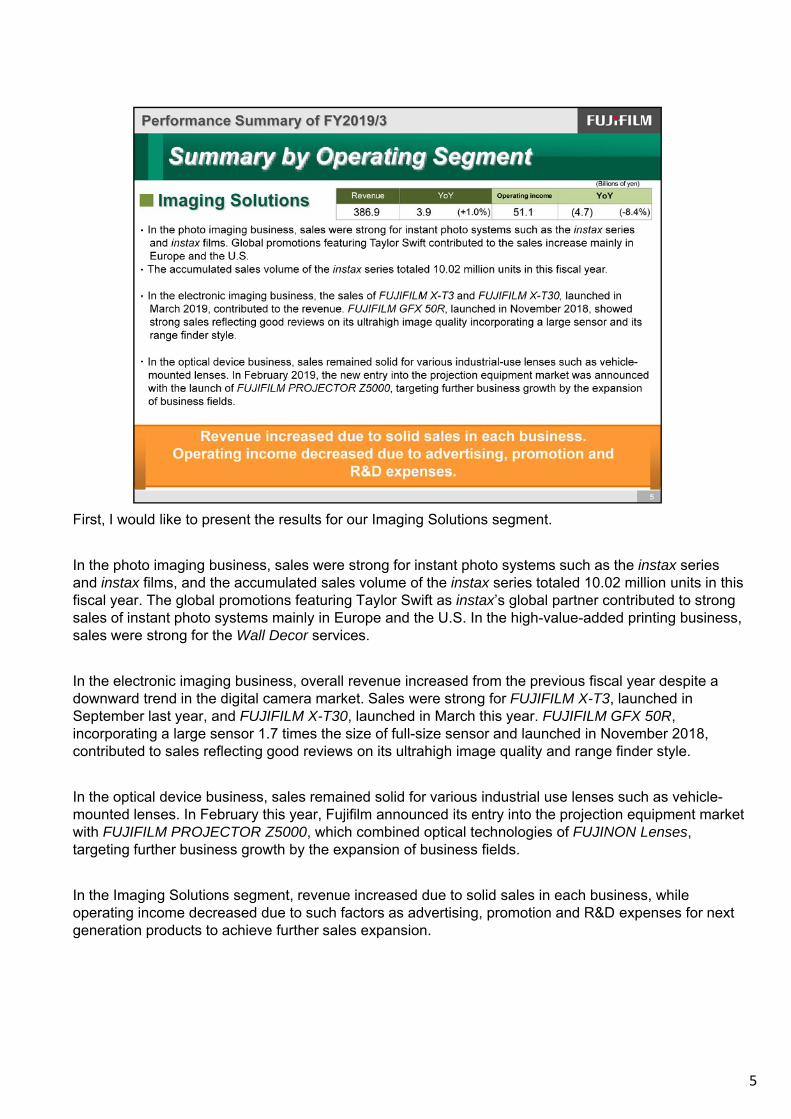
First, I would like to present the results for our Imaging Solutions segment.
In the photo imaging business, sales were strong for instant photo systems such as the instax series and instax films, and the accumulated sales volume of the instax series totaled 10.02 million units in this fiscal year. The global promotions featuring Taylor Swift as instax’s global partner contributed to strong sales of instant photo systems mainly in Europe and the U.S. In the high-value-added printing business, sales were strong for the Wall Decor services.
In the electronic imaging business, overall revenue increased from the previous fiscal year despite a downward trend in the digital camera market. Sales were strong for FUJIFILM X-T3, launched in September last year, and FUJIFILM X-T30, launched in March this year. FUJIFILM GFX 50R, incorporating a large sensor 1.7 times the size of full-size sensor and launched in November 2018, contributed to sales reflecting good reviews on its ultrahigh image quality and range finder style.
In the optical device business, sales remained solid for various industrial use lenses such as vehicle-mounted lenses. In February this year, Fujifilm announced its entry into the projection equipment market
i h FUJIFILM PROJECTOR Z5000 hi h bi d i l h l i f FUJINON Lwith FUJIFILM PROJECTOR Z5000, which combined optical technologies of FUJINON Lenses, targeting further business growth by the expansion of business fields.
In the Imaging Solutions segment, revenue increased due to solid sales in each business, while operating income decreased due to such factors as advertising, promotion and R&D expenses for next generation products to achieve further sales expansion.
5

Next is our Healthcare & Material Solutions segment.
In the healthcare business field, the medical systems business enjoyed brisk sales in all business fields such as X-ray imaging diagnostics and endoscopes.
In the bio CDMO business, the contract process development and manufacturing business of bio-pharmaceuticals progressed favorably. Expansion of facilities, which has been conducted i l ib d h l isince last year contributed to the sales increase.
In the regenerative medicine business, sales increased due to the consolidation of FUJIFILMIrvine Scientific, a leading company in cell culture media, in June 2018.
As for the highly functional materials business field, in the display materials business, sales of the products related to OLED and touch-panels were solid, in addition to TAC products.
In the electronic materials business, sales were favorable mainly for advanced products of peripheral materials related to photolithography.
In the graphic systems business, sales decreased due to a decline in total demand for graphic arts film and CTP plates. In March 2019, Fujifilm launched Jet Press750S, an inkjet digital press. Fujifilm continues to develop and provide innovative products to the rapidly digitalized commercial printing market for business expansiondigitalized commercial printing market for business expansion.
In the Healthcare & Material Solutions segment, revenue increased due to strong sales in the medical systems, bio CDMO, regenerative medicine and electronic materials business. Operating income increased primarily by improvements of profitability in each business.
6
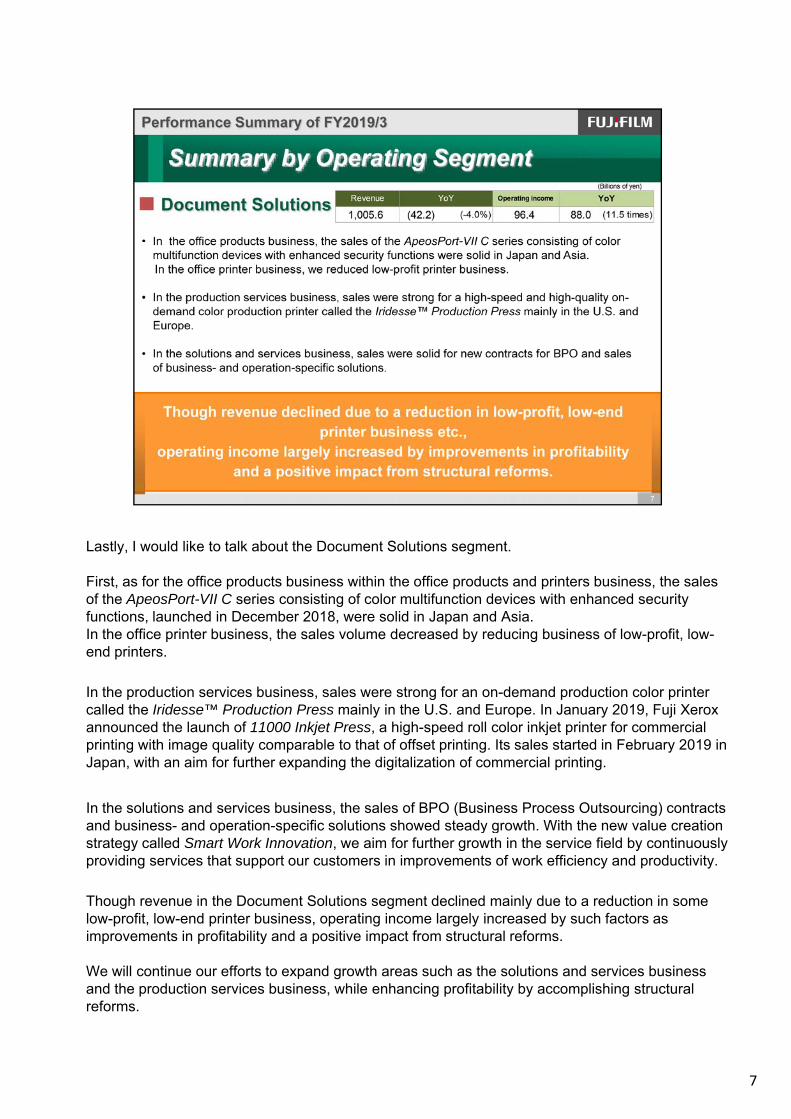
Lastly, I would like to talk about the Document Solutions segment.
First, as for the office products business within the office products and printers business, the sales of the ApeosPort-VII C series consisting of color multifunction devices with enhanced security functions, launched in December 2018, were solid in Japan and Asia.In the office printer business, the sales volume decreased by reducing business of low-profit, low-end printers.
In the production services business sales were strong for an on-demand production color printerIn the production services business, sales were strong for an on-demand production color printer called the Iridesse™ Production Press mainly in the U.S. and Europe. In January 2019, Fuji Xerox announced the launch of 11000 Inkjet Press, a high-speed roll color inkjet printer for commercial printing with image quality comparable to that of offset printing. Its sales started in February 2019 in Japan, with an aim for further expanding the digitalization of commercial printing.
In the solutions and services business, the sales of BPO (Business Process Outsourcing) contracts and business- and operation-specific solutions showed steady growth With the new value creationand business- and operation-specific solutions showed steady growth. With the new value creation strategy called Smart Work Innovation, we aim for further growth in the service field by continuously providing services that support our customers in improvements of work efficiency and productivity.
Though revenue in the Document Solutions segment declined mainly due to a reduction in some low-profit, low-end printer business, operating income largely increased by such factors as improvements in profitability and a positive impact from structural reforms.
7
We will continue our efforts to expand growth areas such as the solutions and services business and the production services business, while enhancing profitability by accomplishing structural reforms.
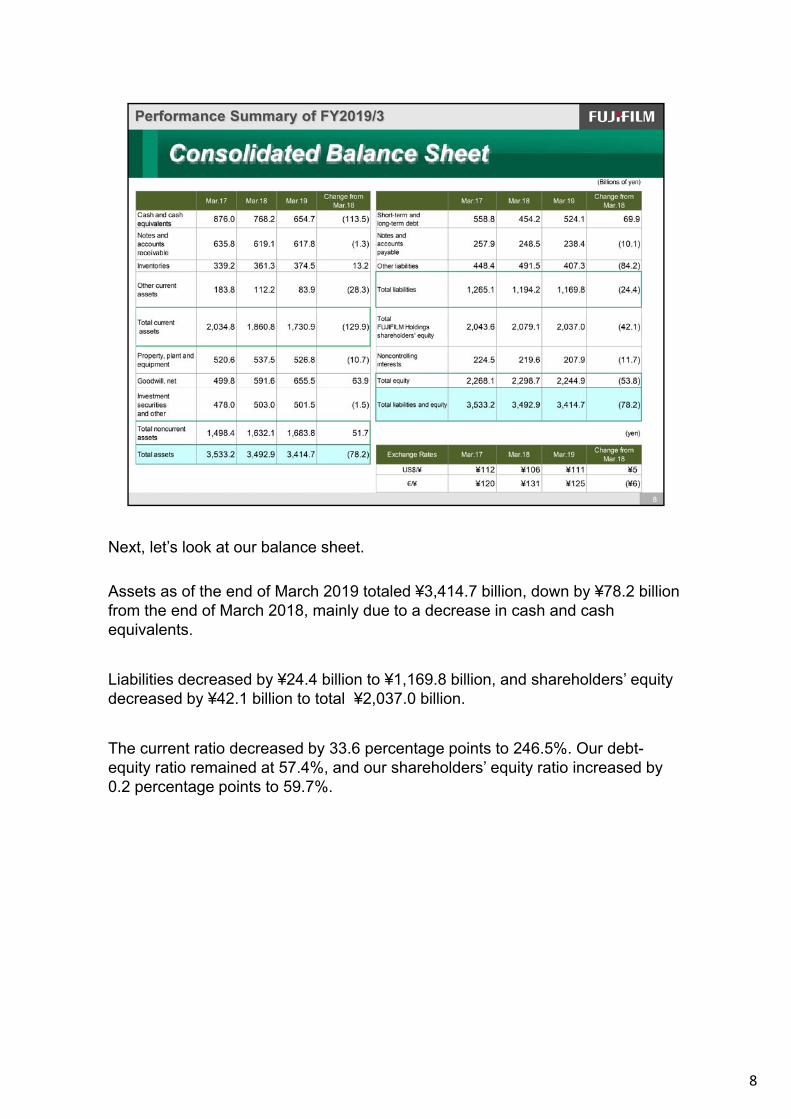
Next, let’s look at our balance sheet.
Assets as of the end of March 2019 totaled ¥3,414.7 billion, down by ¥78.2 billion from the end of March 2018, mainly due to a decrease in cash and cash equivalents.
Liabilities decreased by ¥24.4 billion to ¥1,169.8 billion, and shareholders’ equity d d b ¥42 1 billi l ¥2 037 0 billidecreased by ¥42.1 billion to total ¥2,037.0 billion.
The current ratio decreased by 33.6 percentage points to 246.5%. Our debt-equity ratio remained at 57.4%, and our shareholders’ equity ratio increased by 0.2 percentage points to 59.7%.
8

Next, with regard to our cash-flow, net cash provided by operating activities totaled ¥249.3 billion.
Net cash used in investing activities amounted to ¥208.6 billion, mainly due to the acquisition of Irvine Scientific Sales Company and IS JAPAN.
As a result, free cash flow without acquisitions of businesses and others was ¥149.4 billion.
9
Let me talk about our initiatives for structural reforms of Fuji Xerox, a consolidated subsidiary.
10
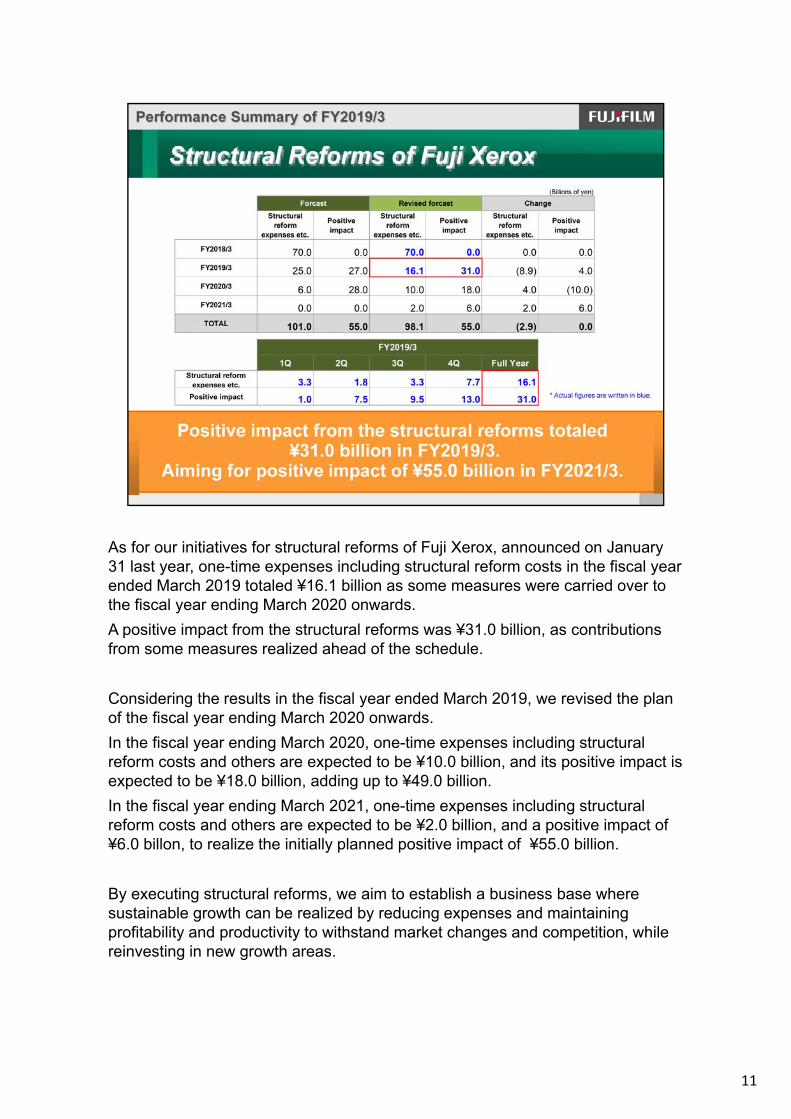
As for our initiatives for structural reforms of Fuji Xerox, announced on January 31 last year, one-time expenses including structural reform costs in the fiscal year ended March 2019 totaled ¥16.1 billion as some measures were carried over to the fiscal year ending March 2020 onwards.
A positive impact from the structural reforms was ¥31.0 billion, as contributions from some measures realized ahead of the schedule.
C id i h l i h fi l d d M h 2019 i d h lConsidering the results in the fiscal year ended March 2019, we revised the plan of the fiscal year ending March 2020 onwards.
In the fiscal year ending March 2020, one-time expenses including structural reform costs and others are expected to be ¥10.0 billion, and its positive impact is expected to be ¥18.0 billion, adding up to ¥49.0 billion.
In the fiscal year ending March 2021, one-time expenses including structural reform costs and others are expected to be ¥2 0 billion and a positive impact ofreform costs and others are expected to be ¥2.0 billion, and a positive impact of ¥6.0 billon, to realize the initially planned positive impact of ¥55.0 billion.
By executing structural reforms, we aim to establish a business base where sustainable growth can be realized by reducing expenses and maintaining profitability and productivity to withstand market changes and competition, while reinvesting in new growth areas.
11

12

Let me explain the main points of the forecast for the fiscal year ending March 2020.
In the fiscal year ending March 2020, we are planning to increase revenue and largely increase the operating profit to reach a record high operating income.We revised the operating income target, adding ¥10.0 billion.In healthcare, we revised the figure of the medium-term management plan from ¥40.0 billion to ¥44.0 billion.In document, we are planning to achieve the operating margin target of 10% a year ahead of the schedule from the fiscal year ending March 2021ahead of the schedule from the fiscal year ending March 2021.
Regarding ROE, we revised the figure of the medium-term management plan from 7.3% to 7.5%.
As for shareholder returns, we are planning annual dividend of ¥95/share and ¥50.0 billion of share buyback, as already announced.
13
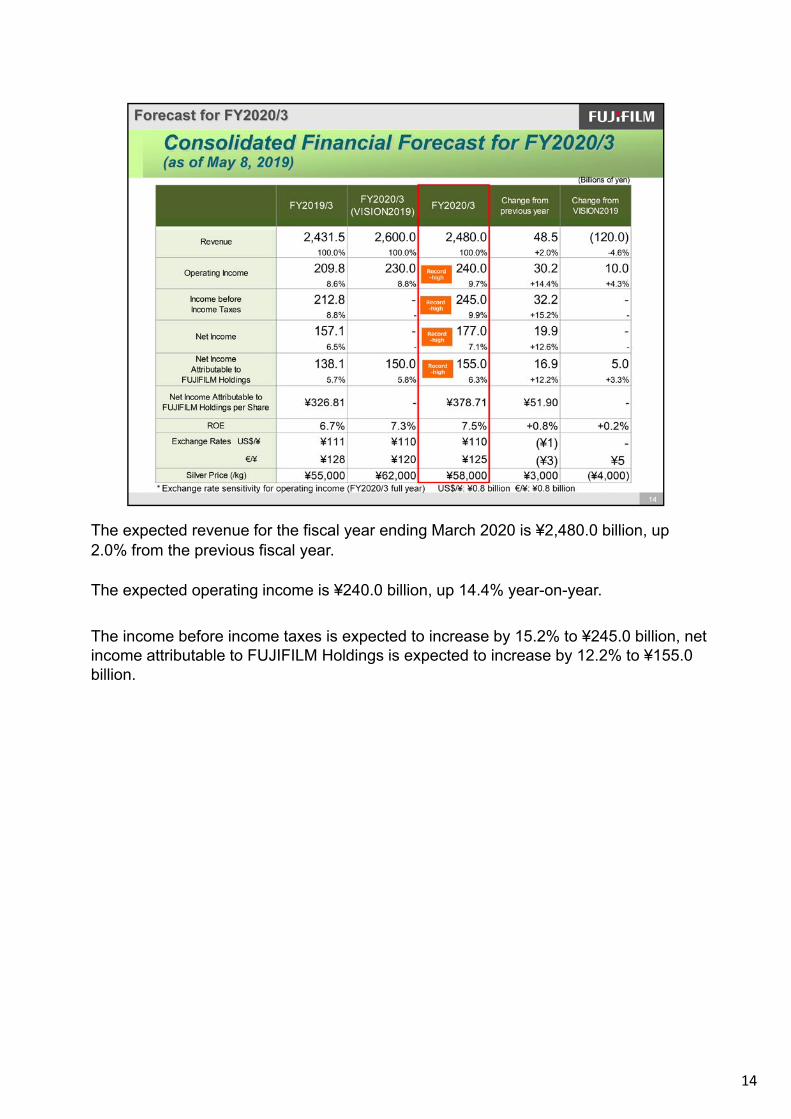
The expected revenue for the fiscal year ending March 2020 is ¥2,480.0 billion, up 2.0% from the previous fiscal year. y
The expected operating income is ¥240.0 billion, up 14.4% year-on-year.
The income before income taxes is expected to increase by 15.2% to ¥245.0 billion, net income attributable to FUJIFILM Holdings is expected to increase by 12.2% to ¥155.0 billion.
14
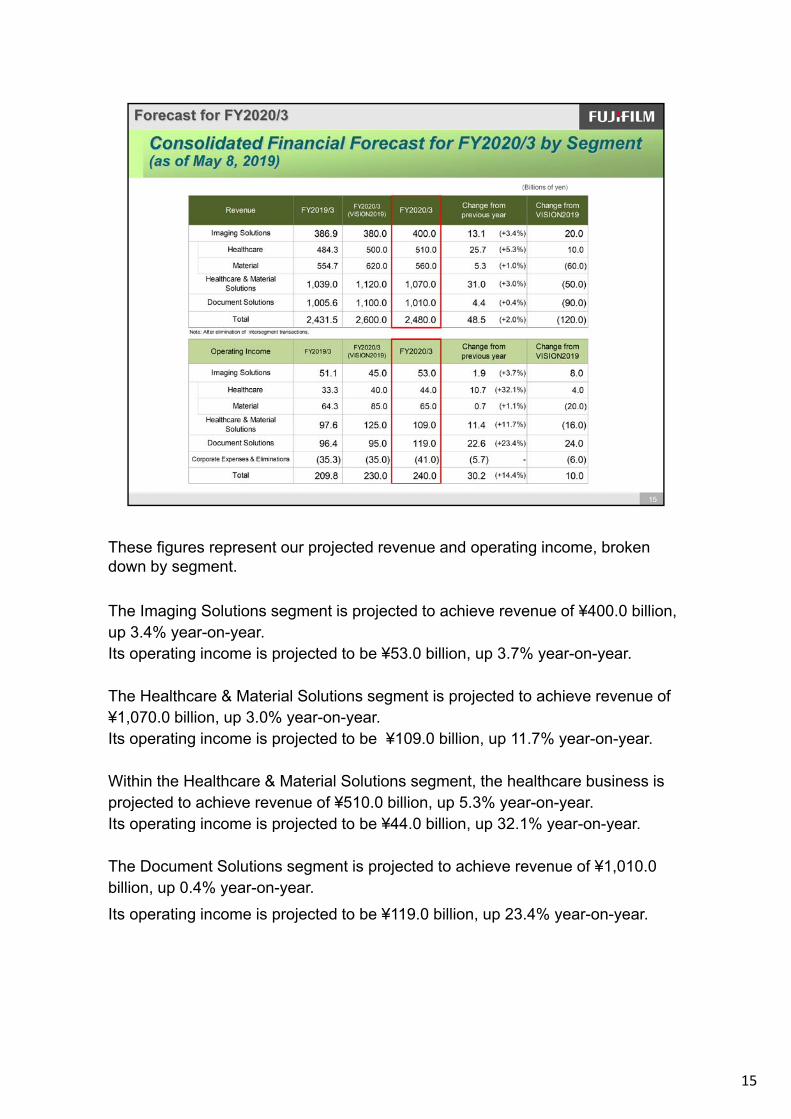
These figures represent our projected revenue and operating income, broken down by segment.
The Imaging Solutions segment is projected to achieve revenue of ¥400.0 billion, up 3.4% year-on-year.Its operating income is projected to be ¥53.0 billion, up 3.7% year-on-year.
Th H lth & M t i l S l ti t i j t d t hi fThe Healthcare & Material Solutions segment is projected to achieve revenue of ¥1,070.0 billion, up 3.0% year-on-year.Its operating income is projected to be ¥109.0 billion, up 11.7% year-on-year.
Within the Healthcare & Material Solutions segment, the healthcare business is projected to achieve revenue of ¥510.0 billion, up 5.3% year-on-year.Its operating income is projected to be ¥44 0 billion up 32 1% year-on-yearIts operating income is projected to be ¥44.0 billion, up 32.1% year on year.
The Document Solutions segment is projected to achieve revenue of ¥1,010.0 billion, up 0.4% year-on-year.
Its operating income is projected to be ¥119.0 billion, up 23.4% year-on-year.
15
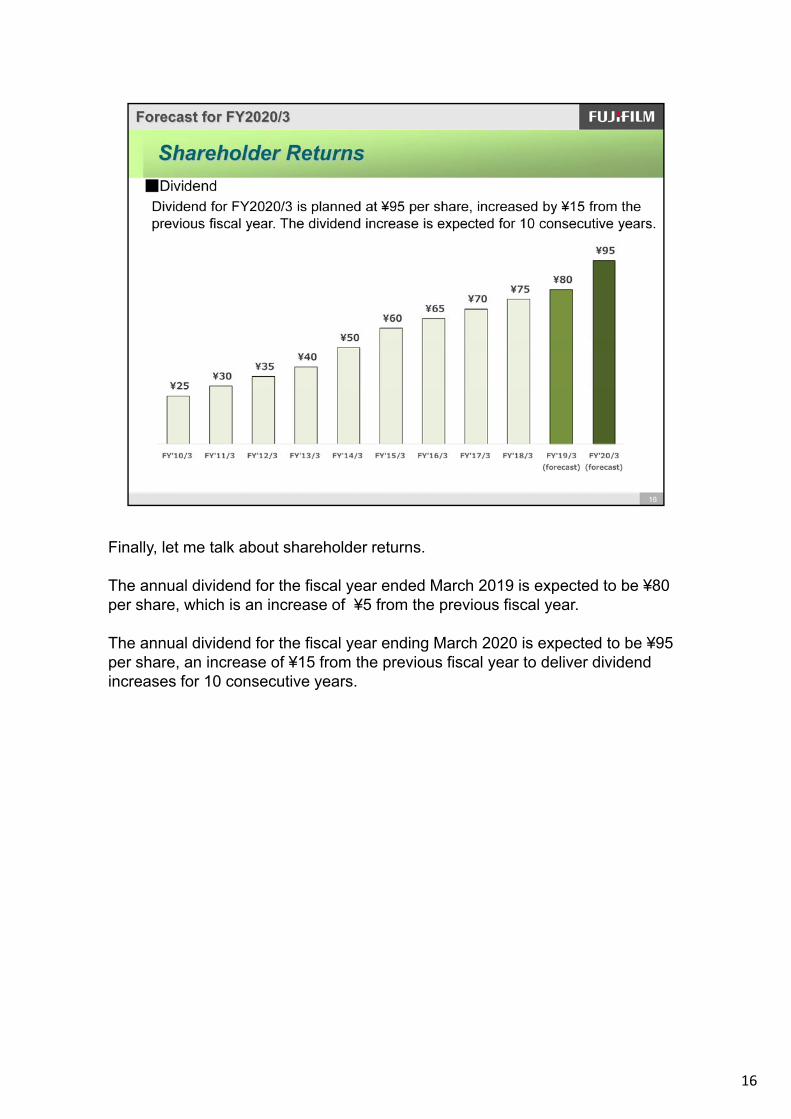
Finally, let me talk about shareholder returns.
The annual dividend for the fiscal year ended March 2019 is expected to be ¥80 per share, which is an increase of ¥5 from the previous fiscal year.
The annual dividend for the fiscal year ending March 2020 is expected to be ¥95 per share, an increase of ¥15 from the previous fiscal year to deliver dividend increases for 10 consecutive years.
16

Earnings for FY2019/3
AppendixAppendix
17
FY2019/3 AppendixFY2019/3 Appendix
Analysis of Operating Income ChangeAnalysis of Operating Income Change(Full year, against FY2018/3) (Full year, against FY2018/3)
(Billions of yen)
200.0
+67.0175.0
209.8+31.0
-16.1
-8.5-1.2
150.0
-3.1+9.9
+7.5
125.0
123.3
100.0FY2018/3
After Imaging Healthcare
&Document Structural
reformStructural
reformFX Raw
material FY2018/3One-time
FY2019/30
amendment Material positiveimpact
expenses price expenses and others
18
FY2019/3 AppendixFY2019/3 Appendix
Analysis of Operating Income ChangeAnalysis of Operating Income Change
215.0
(Full year, against FY2019/3 business forecast) (Full year, against FY2019/3 business forecast)
(Billions of yen)
+4.0 -2.5 +3.7-0.3
215.0
+8.9
+4.0205.0
209.8
-9.1
+1.2+3.9195.0
200.0185.0
175.0FY2019/3 Imaging Healthcare Document Structural Structural FX Raw Others FY2019/3
0FY2019/3 forecast
Imaging Healthcare &
Material
Document Structural reform
expenses
Structural reformpositiveimpact
FX Rawmaterial
price
Others FY2019/3
19
FY2019/3 AppendixFY2019/3 Appendix
Earnings forEarnings for FY2019/3 4Q/Full YearFY2019/3 4Q/Full YearEarnings for Earnings for FY2019/3 4Q/Full YearFY2019/3 4Q/Full Year
(Billions of yen)(Billions of yen)
FY2018/3(After
d t)FY2019/3 Change
FY2018/3(After
d t)FY2019/3 Change
4Q Full Year
amendment) amendment)
623.7 631.7 8.0 2,433.4 2,431.5 (1.9)100.0% 100.0% +1.3% 100.0% 100.0% -0.1%
0 1 51 5 51 4 123 3 209 8 86 5
Revenue
0.1 51.5 51.4 123.3 209.8 86.50.0% 8.1% - 5.1% 8.6% +70.1%
23.3 58.2 34.9 197.8 212.8 15.03.7% 9.2% 2.5 times 8.1% 8.8% +7.6%
Income before Income Taxes
Operating Income
10.3 42.7 32.4 144.2 157.1 12.91.7% 6.8% 4.1 times 5.9% 6.5% +8.9%
16 2 37 0 20 8 140 7 138 1 (2 6)Net Income Attributable to
Net Income
16.2 37.0 20.8 140.7 138.1 (2.6)2.6% 5.9% 2.3 times 5.8% 5.7% -1.8%
¥108 ¥110 ¥2 ¥111 ¥111 - ¥133 ¥125 (¥8) ¥130 ¥128 (¥2)
Exchange US$/¥Rates €/¥
Net Income Attributable toFUJIFILM Holdings
20
〈Other factors of change (4Q/full year YoY) 〉 Operating income --- Raw material prices: - ¥0.1 billion / - ¥1.2 billion
FY2019/3 AppendixFY2019/3 Appendix
Earnings forEarnings for FY2019/3 4Q/Full YearFY2019/3 4Q/Full YearEarnings for Earnings for FY2019/3 4Q/Full YearFY2019/3 4Q/Full Year(Billions of yen)
Revenue4Q Full Year
FY2018/3 FY2019/3 FY2018/3 FY2019/3
85.3 83.1 (2.2) (-2.5%) 383.0 386.9 3.9 (+1.0%)
Healthcare 133.9 141.4 7.5 (+5.6%) 443.0 484.3 41.3 (+9.3%)
Revenue
Imaging Solutions
Change Change
274.3 280.1 5.8 (+2.1%) 1,002.6 1,039.0 36.4 (+3.6%)
264.1 268.5 4.4 (+1.7%) 1,047.8 1,005.6 (42.2) (-4.0%)
623.7 631.7 8.0 (+1.3%) 2,433.4 2,431.5 (1.9) (-0.1%)
Document Solutions
Total
Healthcare & MaterialSolutions
(Billions of yen)
FY2018/3(After FY2019/3
FY2018/3(After FY2019/3
4Q
Note: After elimination of intersegment transactions
Operating Income[Operating Margin] ChangeChange
Full Year
amendment) amendment)
5.9 3.1 55.8 51.1[6.9%] [3.7%] [14.6%] [13.2%]
13.3 15.9 19.7 33.3[10 0%] [11 1%] [4 5%] [6 8%]
Healthcare
Imaging Solutions (-47.5%)
13.6(+17.9%) (+67.0%)
(-8.4%)(2.8) (4.7)
2.6[10.0%] [11.1%] [4.5%] [6.8%]
31.6 27.6 91.4 97.6[11.5%] [9.9%] [9.1%] [9.4%]
(28.3) 29.5 8.4 96.4- [11.0%] [0.8%] [9.6%]
(4.0)
Document Solutions 57.8
Healthcare & MaterialSolutions
(+6.8%)(-12.7%) 6.2
88.0- (11.5 times)
21
(9.1) (8.7) 0.4 - (32.3) (35.3) (3.0) -
0.1 51.5 123.3 209.8[0.0%] [8.1%] [5.1%] [8.6%]
51.4 -
Corporate Expenses &Eliminations
Total 86.5 (+70.1%)
FY2019/3 AppendixFY2019/3 Appendix
Earnings forEarnings for FY2019/3 4Q/Full YearFY2019/3 4Q/Full Year
Imaging SolutionsImaging Solutions
Earnings for Earnings for FY2019/3 4Q/Full YearFY2019/3 4Q/Full Year
g gg g(Billions of yen)
RevenueFY2018/3 FY2019/3
Full Year4Q
FY2019/3 ChangeChange FY2018/3
Photo Imaging 54.6 53.8 (0.8) (-1.4%) 0.1 (+0.3%) 255.4 257.5 2.1 (+0.9%) 4.8 (+1.9%)
Electronic Imaging 20.5 19.9 (0.6) (-3.0%) (0.1) (-0.6%) 88.8 90.6 1.8 (+2.0%) 3.1 (+3.4%)
O ti l D i 10 2 9 4 (0 8) ( 7 8%) (0 8) ( 7 5%) 38 8 38 8 0 0 (+0 0%) 0 1 (+0 2%)
FY2018/3 FY2019/3Constant-currency
basis
FY2019/3 ChangeConstant-currency
basis
Change FY2018/3
Optical Devices 10.2 9.4 (0.8) (-7.8%) (0.8) (-7.5%) 38.8 38.8 0.0 (+0.0%) 0.1 (+0.2%)
Optical Device &Electronic Imaging
Products30.7 29.3 (1.4) (-4.6%) (0.9) (-2.9%) 127.6 129.4 1.8 (+1.4%) 3.2 (+2.5%)
85.3 83.1 (2.2) (-2.5%) (0.8) (-0.9%) 383.0 386.9 3.9 (+1.0%) 8.0 (+2.1%)Total 85 3 83 ( ) ( ) (0 8) ( ) 383 0 386 9 3 9 ( ) 8 0 ( )
Note: After elimination of intersegment transactions
(Billions of yen)
FY2018/3Operating Income[O ti M i ]
FY2018/3
Full Year4Q
5.9 3.1 55.8 51.1[6.9%] [3.7%] [14.6%] [13.2%]
Constant-currencybasis
(Afteramendment)
FY2019/3
(2.7) (-4.8%)(4.7) (-8.4%)Imaging Solutions
[Operating Margin] (Afteramendment)
FY2019/3 Change Constant-currencybasis
(1.9) (-32.2%)
Change
(-47.5%)(2.8)
22

Change in Quarterly Earnings byChange in Quarterly Earnings by SegmentSegment
FY2019/3 AppendixFY2019/3 Appendix
Change in Quarterly Earnings by Change in Quarterly Earnings by Segment Segment
Imaging SolutionsImaging Solutions (Billions of yen)
127.9 40.0125.0
Imaging SolutionsImaging Solutions (Billions of yen)
Revenue Operating Income
85 387.9 88.0
30.0100.0
Photo Imaging
90.8
85.387.9 88.0
83.126.4
20.0
75.0(20.6%)
g g
ElectronicImaging Optical Device &
Electronic Imaging 54.6 55.8 57.1
53.8
12.2 9 4
20.0
50.0
Operating Income for Imaging Solutions(O ti M i )
Optical Devices
Products
20.5 22.8 21.326.6
19.95.9
9.4
3 1
10.0
25.0
(6.9%)
(13.9%)(10.7%)
(Operating Margin)
10.2 9.3 9.6 10.5 9.43.1
0.00.0
17.4Q 18.1Q 18.2Q 18.3Q 18.4Q
(3.7%)
23
FY2019/3 AppendixFY2019/3 Appendix
Earnings forEarnings for FY2019/3 4Q/Full YearFY2019/3 4Q/Full Year
Healthcare & Material SolutionsHealthcare & Material Solutions
Earnings for Earnings for FY2019/3 4Q/Full YearFY2019/3 4Q/Full Year
(Billions of yen)
133 9 141 4 7 5 ( 5 6%) 9 5 ( 7 1%) 443 0 484 3 41 3 ( 9 3%) 45 7 ( 10 3%)
Full Year
RevenueFY2018/3 Change
H lth
4Q
ChangeConstant-currency basis Constant-currency basis
FY2019/3FY2019/3 FY2018/3
133.9 141.4 7.5 (+5.6%) 9.5 (+7.1%) 443.0 484.3 41.3 (+9.3%) 45.7 (+10.3%)
Display Materials 21.3 21.2 (0.1) (-0.2%) (0.1) (-0.2%) 94.4 98.2 3.8 (+4.1%) 3.8 (+4.1%)
Industrial ProductsElectronic Materials
Fine Chemical44.6 45.4 0.8 (+1.8%) 0.7 (+1.5%) 173.0 179.8 6.8 (+3.9%) 7.0 (+4.0%)
Highly FunctionalM t i l 65.9 66.6 0.7 (+1.1%) 0.6 (+1.0%) 267.4 278.0 10.6 (+4.0%) 10.8 (+4.0%)
Healthcare
Materials 65.9 66.6 0.7 ( 1.1%) 0.6 ( 1.0%) 267.4 278.0 10.6 ( 4.0%) 10.8 ( 4.0%)
10.0 11.6 1.6 (+15.3%) 1.5 (+14.5%) 40.4 38.8 (1.6) (-4.0%) (1.5) (-3.8%)
64.2 60.3 (3.9) (-6.1%) (3.3) (-5.3%) 250.9 236.7 (14.2) (-5.6%) (12.6) (-5.0%)
0.3 0.2 (0.1) 0.0 0.9 1.2 0.3 0.3
274.3 280.1 5.8 (+2.1%) 8.3 (+3.0%) 1,002.6 1,039.0 36.4 (+3.6%) 42.7 (+4.3%)
Recording Media
Others
Total
Graphic Systems/Inkjet
Note: After elimination of intersegment transactions
(Billions of yen)
Full YearOperating Income[Operating Margin]
FY2018/3(After
d t) Constant-currency basisFY2019/3 Change Change
4Q
Constant-currency basis
FY2018/3(After
d t)FY2019/3
13.3 15.9 19.7 33.3[10.0%] [11.1%] [4.5%] [6.8%]
31.6 27.6 91.4 97.6[11.5%] [9.9%] [9.1%] [9.4%]
Healthcare & MaterialSolutions (4.0)
2.6
amendment)
Healthcare
Constant currency basis
(-12.7%)
(+17.9%) 3.6 (+25.4%)
(3.4) (-10.8%)
(+67.0%)
Constant currency basis
15.6 (+77.1%)
amendment)
13.6
6.2 (+6.8%) 8.3 (+9.1%)
24

Change in Quarterly Earnings byChange in Quarterly Earnings by SegmentSegment
FY2019/3 AppendixFY2019/3 Appendix
Healthcare & Material SolutionsHealthcare & Material Solutions
Change in Quarterly Earnings by Change in Quarterly Earnings by Segment Segment
(Billions of yen)
Revenue Operating Income
274.3263 1
280.140.0300.0
Display Materials
Healthcare
133.9
235.9
263.1 259.9
31.6 32.5
2 630.0
250.0
(11.5%) (12.5%)
Recording Media
Industrial ProductsElectronic MaterialsFine Chemical
101.8
121.6 119.5141.4 27.6
20 0150 0
200.0(9.9%)
Graphic SystemsInkjet
Recording Media
Oth44.6
43.6 44.1 46.7 45.4
21.323.0 27.7 26.3 21.2
18.1 19.420.0
100.0
150.0
(7.7%) (7.4%)
Operating Income for Healthcare & Material
Others
64.2 57.9 60.7 57.8 60.3
10.09.3 8.7 9.2 11.6
10.0
50.0
25
Solutions(Operating Margin)0.00.0
17.4Q 18.1Q 18.2Q 18.3Q 18.4Q
FY2019/3 AppendixFY2019/3 Appendix
Earnings forEarnings for FY2019/3 4Q/Full YearFY2019/3 4Q/Full Year
Document SolutionsDocument Solutions
Earnings for Earnings for FY2019/3 4Q/Full YearFY2019/3 4Q/Full Year
(Billions of yen)
Full Year4Q
Change FY2018/3 FY2019/3 ChangeFY2018/3 FY2019/3Revenue
Office Printers 39.3 32.3 (7.0) (-17.9%) (6.6) (-16.8%) 151.3 126.5 (24.8) (-16.4%) (23.5) (-15.5%)
153.4 143.5 (9.9) (-6.5%) (7.8) (-5.1%) 610.0 569.1 (40.9) (-6.7%) (36.1) (-5.9%)
Constant-currency basisChangeConstant-currency basis
FY2018/3 FY2019/3 ChangeFY2018/3 FY2019/3
Office Products & Printers
32.9 32.6 (0.3) (-0.9%) 0.3 (+0.9%) 131.0 123.3 (7.7) (-5.9%) (6.4) (-4.9%)
64.9 76.9 12.0 (+18.5%) 13.3 (+20.6%) 256.2 261.2 5.0 (+1.9%) 7.9 (+3.1%)
12.9 15.5 2.6 3.0 50.6 52.0 1.4 2.3
Production Services
Solutions & Services
Others
264.1 268.5 4.4 (+1.7%) 8.8 (+3.3%) 1,047.8 1,005.6 (42.2) (-4.0%) (32.3) (-3.1%)
Note: After elimination of intersegment transactions
(Billions of yen)
Full YearOperating Income FY2018/3
4Q
FY2018/3
Total
-28.3 29.5 8.4 96.4- [11.0%] [0.8%] [9.6%]
Operating Income[Operating Margin]
Document Solutions 60.7 --57.8
FY2018/3(After
amendment)FY2019/3 Change
Constant-currency basis
92.4 (12.0 times)88.0 (11.5 times)
Constant-currency basisChange
FY2018/3(After
amendment)FY2019/3
26
Change in Quarterly Earnings byChange in Quarterly Earnings by SegmentSegment
FY2019/3 AppendixFY2019/3 Appendix
Document SolutionsDocument Solutions (Billions of yen)
Change in Quarterly Earnings by Change in Quarterly Earnings by Segment Segment
Revenue Operating Income
50.0300.0
Office Products & Office Printers
264.1
241.1256.7
239.3
268.5
28.423 6
29.530.0
50.0
( ) (11 0%) Office Products & Office Printers
Production Services
Solutions & Services
153.4139.7
146.6139.3
143.514.9
23.6
10.0
200.0
(6.2%)
(11.0%)(9.9%)
(11.0%)
Solutions & Services
Operating Income for Doc ment Sol tions
Others32.929.2 32.4
29.1
32.6-10.0
100.0
Operating Income for Document Solutions(Operating Margin)
64.9 57.9 66.4 60.076.9
-28.3
-50.0
-30.0
0.0
-
27
50.00.017.4Q 18.1Q 18.2Q 18.3Q 18.4Q
RevenueRevenue by Destinationby Destination
FY2019/3 AppendixFY2019/3 Appendix
(Billions of yen)
Revenue Revenue by Destinationby Destination
Ratio (%) Ratio (%)
FY2019/3 Change
FY2018/3
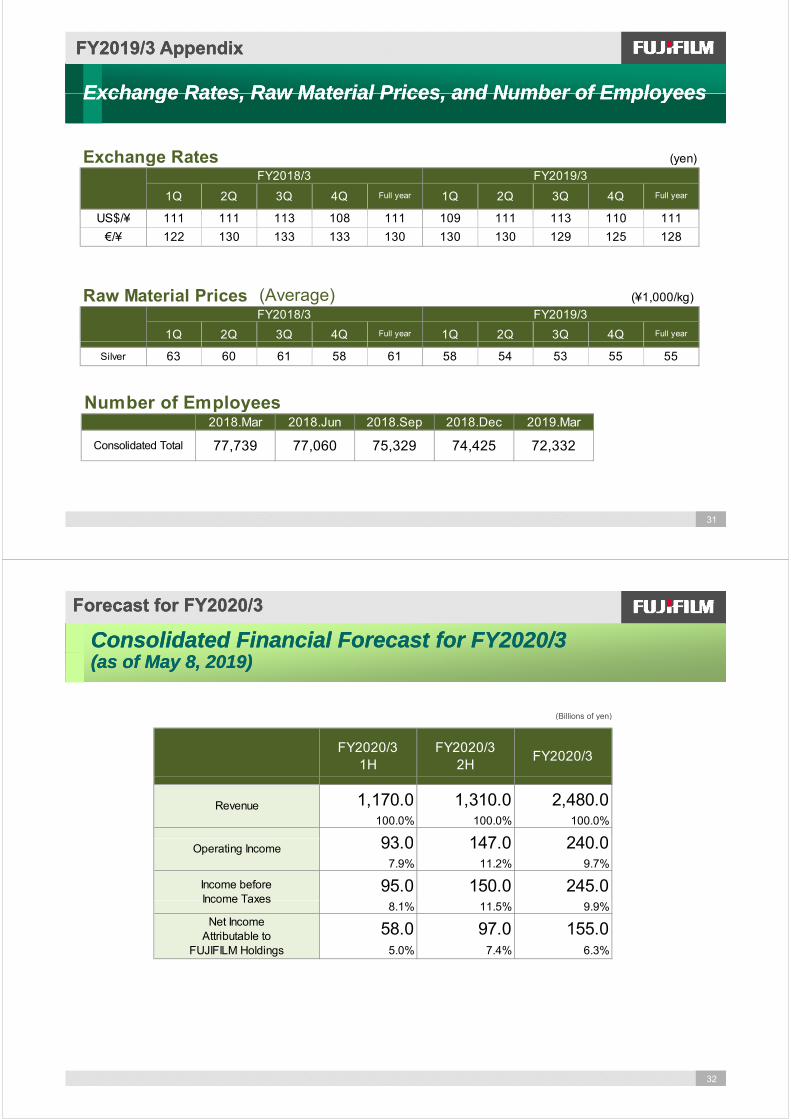
41.4% 1,006.5 41.4% 1,006.5 0.0 (+0.0%)
19.0% 462.8 19.1% 463.4 0.6 (+0.1%)
Japan
The Americas
13.0% 315.3 13.0% 315.7 0.4 (+0.1%)
China 12.2% 296.1 12.2% 296.5 0.4 (+0.1%)
Europe
Asia and others 26.6% 648.8 26.5% 645.9 (2.9) (-0.5%)
Overseas 58.6% 1,426.9 58.6% 1,425.0 (1.9) (-0.1%)58.6% 1,426.9 58.6% 1,425.0 (1.9) ( 0.1%)
100.0% 2,433.4 100.0% 2,431.5 (1.9) (-0.1%)Consolidated total
28

CapitalCapital ExpenditureExpenditure Depreciation & AmortizationDepreciation & Amortization
FY2019/3 AppendixFY2019/3 Appendix
71.875.4
Capital Capital Expenditure, Expenditure, Depreciation & AmortizationDepreciation & AmortizationCapital Expenditure (Full Year)
(Billions of yen)
40.1 50 5
10.39.4
10.667.5 (Billions of yen)
4Q
FY2017/3
FY2018/3
FY2019/3
FY2017/3
FY2018/3
FY2019/3
FY2020/3(forecast)
Imaging 2 9 3 2 3 9 10 3 9 4 10 6
Full year
20.013.8 11.7
42.750.5 Imaging 2.9 3.2 3.9 10.3 9.4 10.6
Healthcare & Material 15.4 15.4 20.5 40.1 42.7 50.5Document 5.1 1.9 3.8 20.0 13.8 11.7Corporate 0.5 0.7 0.7 1.4 1.6 2.6
127.6 129.9
FY2017/3
FY2018/3
FY2019/3
Depreciation & Amortization (Full Year)
Capex * 23.9 21.2 28.9 71.8 67.5 75.4 90.0Imaging 2.3 3.5 3.5 11.1 13.3 14.1Healthcare & Material 11.4 14.7 17.5 49.1 57.5 63.1Document 13.9 13.8 12.4 55.3 54.7 50.1
49.1 57.5 63.1
11.113.3 14.1117.6
3 9 3 8 55 3 5 50Corporate 0.5 0.3 0.9 2.1 2.1 2.6
28.1 32.3 34.3 117.6 127.6 129.9 128.0
15 2 17 1 20 0 58 9 66 5 70 9Depreciation *
Depreciation& Amortization
55.3 54.7 50.1
*Note : Figures do not include amounts for rental equipmenthandled by the Document Solutions segment and others.Imaging
Healthcare & Material
15.2 17.1 20.0 58.9 66.5 70.9 Depreciation
FY2017/3
FY2018/3
FY2019/3
29
DocumentCorporate
Healthcare & Material
R&D Expenses SG&A ExpensesR&D Expenses SG&A Expenses
FY2019/3 AppendixFY2019/3 Appendix
R&D Expenses, SG&A ExpensesR&D Expenses, SG&A Expenses
(Billions of yen)
FY2020/3
4Q Full YearR&D Expenses (Full Year)
167.9FY2018/3 FY2019/3 FY2018/3 FY2019/3
FY2020/3(forecast)
Imaging 2.6 2.7 9.0 9.9
Healthcare & Material 18.9 18.9 70.0 69.870.0
9.0 9.9
167.9 156.1
Document 21.4 12.0 63.5 51.2
Corporate 7.0 6.7 25.4 25.2
R&D Expenses 49.9 40.3 167.9 156.1 155.063 5
69.8
R&D Expenses 49.9 40.3 167.9 156.1 155.0
8.0% 6.4% 6.9% 6.4% 6.3%
191.1 151.3 677.8 631.6
<ratio to revenue>
SG&A Expenses25.4 25.2
63.5 51.2
30.7% 24.0% 27.8% 26.0% <ratio to revenue>
ImagingHealthcare & Material
FY2018/3 FY2019/3
30
DocumentCorporate
ExchangeExchange RatesRates Raw Material Prices and Number of EmployeesRaw Material Prices and Number of Employees
FY2019/3 AppendixFY2019/3 Appendix
Exchange Exchange Rates, Rates, Raw Material Prices, and Number of EmployeesRaw Material Prices, and Number of Employees
Exchange Rates ( )Exchange Rates (yen)
1Q 2Q 3Q 4Q Full year 1Q 2Q 3Q 4Q Full year
US$/¥ 111 111 113 108 111 109 111 113 110 111
FY2019/3FY2018/3
US$/¥ 111 111 113 108 111 109 111 113 110 111
€/¥ 122 130 133 133 130 130 130 129 125 128
Raw Material Prices (Average) (¥1,000/kg)
1Q 2Q 3Q 4Q Full year 1Q 2Q 3Q 4Q Full year
FY2019/3FY2018/3
Silver 63 60 61 58 61 58 54 53 55 55
Number of EmployeesNumber of Employees2018.Mar 2018.Jun 2018.Sep 2018.Dec 2019.Mar
77,739 77,060 75,329 74,425 72,332Consolidated Total
31
Forecast for Forecast for FY2020/3FY2020/3
Consolidated Financial Forecast for Consolidated Financial Forecast for FY2020/3FY2020/3(as of (as of May 8, 2019)May 8, 2019)
(Billions of yen)(Billions of yen)
FY2020/32H
FY2020/3FY2020/3
1H
1,170.0 1,310.0 2,480.0100.0% 100.0% 100.0%
93 0 147 0 240 0
Revenue
93.0 147.0 240.07.9% 11.2% 9.7%
95.0 150.0 245.0
Operating Income
Income beforeIncome Taxes
8.1% 11.5% 9.9%
58.0 97.0 155.05.0% 7.4% 6.3%
Income Taxes
Net IncomeAttributable to
FUJIFILM Holdings
32
FY2019/3 AppendixFY2019/3 Appendix
Amendment to FY2018/3 Financial Results (Operating Income) Amendment to FY2018/3 Financial Results (Operating Income) Accompanying the Change in Accounting MethodAccompanying the Change in Accounting Method
(Billions of yen)
FY 2018/3 (Before amendment)
1Q 2Q 3Q 4QFullYear
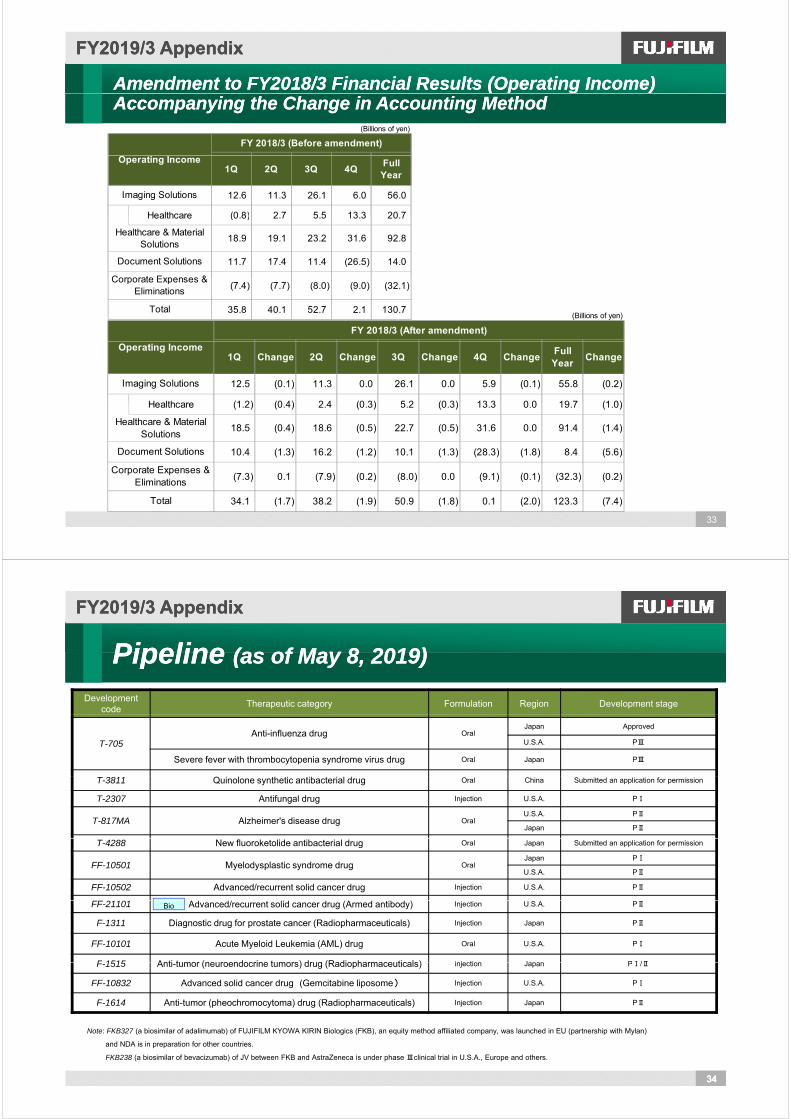
12.6 11.3 26.1 6.0 56.0
Healthcare (0 8) 2 7 5 5 13 3 20 7
Imaging Solutions
Operating Income
Healthcare (0.8) 2.7 5.5 13.3 20.7
18.9 19.1 23.2 31.6 92.8
11.7 17.4 11.4 (26.5) 14.0
Corporate Expenses &
Healthcare & MaterialSolutions
Document Solutions
(Billions of yen)
FY 2018/3 (After amendment)
(7.4) (7.7) (8.0) (9.0) (32.1)
35.8 40.1 52.7 2.1 130.7
Corporate Expenses &Eliminations
Total
1Q Change 2Q Change 3Q Change 4Q ChangeFullYear
Change
12.5 (0.1) 11.3 0.0 26.1 0.0 5.9 (0.1) 55.8 (0.2)
Healthcare (1 2) (0 4) 2 4 (0 3) 5 2 (0 3) 13 3 0 0 19 7 (1 0)
Imaging Solutions
Operating Income
Healthcare (1.2) (0.4) 2.4 (0.3) 5.2 (0.3) 13.3 0.0 19.7 (1.0)
18.5 (0.4) 18.6 (0.5) 22.7 (0.5) 31.6 0.0 91.4 (1.4)
10.4 (1.3) 16.2 (1.2) 10.1 (1.3) (28.3) (1.8) 8.4 (5.6)
Healthcare & MaterialSolutions
Document Solutions
33
(7.3) 0.1 (7.9) (0.2) (8.0) 0.0 (9.1) (0.1) (32.3) (0.2)
34.1 (1.7) 38.2 (1.9) 50.9 (1.8) 0.1 (2.0) 123.3 (7.4)
Corporate Expenses &Eliminations
Total
PipelinePipeline (as of May 8 2019)(as of May 8 2019)
FY2019/3 AppendixFY2019/3 Appendix
Development code
Therapeutic category Formulation Region Development stage
Pipeline Pipeline (as of May 8, 2019)(as of May 8, 2019)
T-705Anti-influenza drug Oral
Japan Approved
U.S.A. PⅢ
Severe fever with thrombocytopenia syndrome virus drug Oral Japan PⅢ
3811 QT-3811 Quinolone synthetic antibacterial drug Oral China Submitted an application for permission
T-2307 Antifungal drug Injection U.S.A. PⅠ
T-817MA Alzheimer's disease drug OralU.S.A. PⅡ
Japan PⅡ
T-4288 New fluoroketolide antibacterial drug Oral Japan Submitted an application for permission
FF-10501 Myelodysplastic syndrome drug OralJapan PⅠ
U.S.A. PⅡ
FF-10502 Advanced/recurrent solid cancer drug Injection U.S.A. PⅡ
FF 21101FF-21101 Advanced/recurrent solid cancer drug (Armed antibody) Injection U.S.A. PⅡ
F-1311 Diagnostic drug for prostate cancer (Radiopharmaceuticals) Injection Japan PⅡ
FF-10101 Acute Myeloid Leukemia (AML) drug Oral U.S.A. PⅠ
F 1515 Anti tumor (neuroendocrine tumors) drug (Radiopharmaceuticals) injection Japan PⅠ/Ⅱ
Bio
F-1515 Anti-tumor (neuroendocrine tumors) drug (Radiopharmaceuticals) injection Japan PⅠ/Ⅱ
FF-10832 Advanced solid cancer drug (Gemcitabine liposome) Injection U.S.A. PⅠ
F-1614 Anti-tumor (pheochromocytoma) drug (Radiopharmaceuticals) Injection Japan PⅡ
34343434
Note: FKB327 (a biosimilar of adalimumab) of FUJIFILM KYOWA KIRIN Biologics (FKB), an equity method affiliated company, was launched in EU (partnership with Mylan)
and NDA is in preparation for other countries.
FKB238 (a biosimilar of bevacizumab) of JV between FKB and AstraZeneca is under phase Ⅲclinical trial in U.S.A., Europe and others.

AppendixAppendix
FY2019/3 AppendixFY2019/3 Appendix
AppendixAppendix
FUJIFILM HoldingsFUJIFILM Holdings -- Investor RelationsInvestor RelationsFUJIFILM Holdings FUJIFILM Holdings Investor RelationsInvestor Relationshttp://www.fujifilmholdings.com/en/investors/index.html
FUJIFILM HoldingsFUJIFILM Holdings IntegratedIntegrated ReportReport 20182018
IR Events MaterialsIR Events Materials
FUJIFILM Holdings FUJIFILM Holdings Integrated Integrated Report Report 20182018http://www.fujifilmholdings.com/en/investors/ir_library/integrated_reports/index.html
IR Events MaterialsIR Events Materialshttp://www.fujifilmholdings.com/en/investors/ir_events/business_presentations/index.html
・ Business presentation materials- Mar. 2018 Business Presentation for Imaging Solutions Business
What Kind of Company is Fujifilm?What Kind of Company is Fujifilm?
- Jan. 2019 Business Presentation for Pharmaceuticals/Bio CDMO/Regenerative Medicine Business- Feb. 2019 ESG Briefing
35
What Kind of Company is Fujifilm?What Kind of Company is Fujifilm?http://www.fujifilmholdings.com/en/investors/guidance/index.html
Global Branding Campaign: NEVER STOPGlobal Branding Campaign: NEVER STOPGlobal Branding Campaign: NEVER STOPGlobal Branding Campaign: NEVER STOPhttps://brand.fujifilm.com/neverstop/en/
At F jifil ti l i ti tiAt Fujifilm, we are continuously innovating — creatingnew technologies, products and services that inspire
and excite people everywhere.Our goal is to empower the potential and expand
the horizons of tomorrow’s businesses and lifestyles.
Corporate Communication Office, Corporate Planning Div.
http://www.fujifilmholdings.com/en/index.html