Embed Size (px)
Citation preview
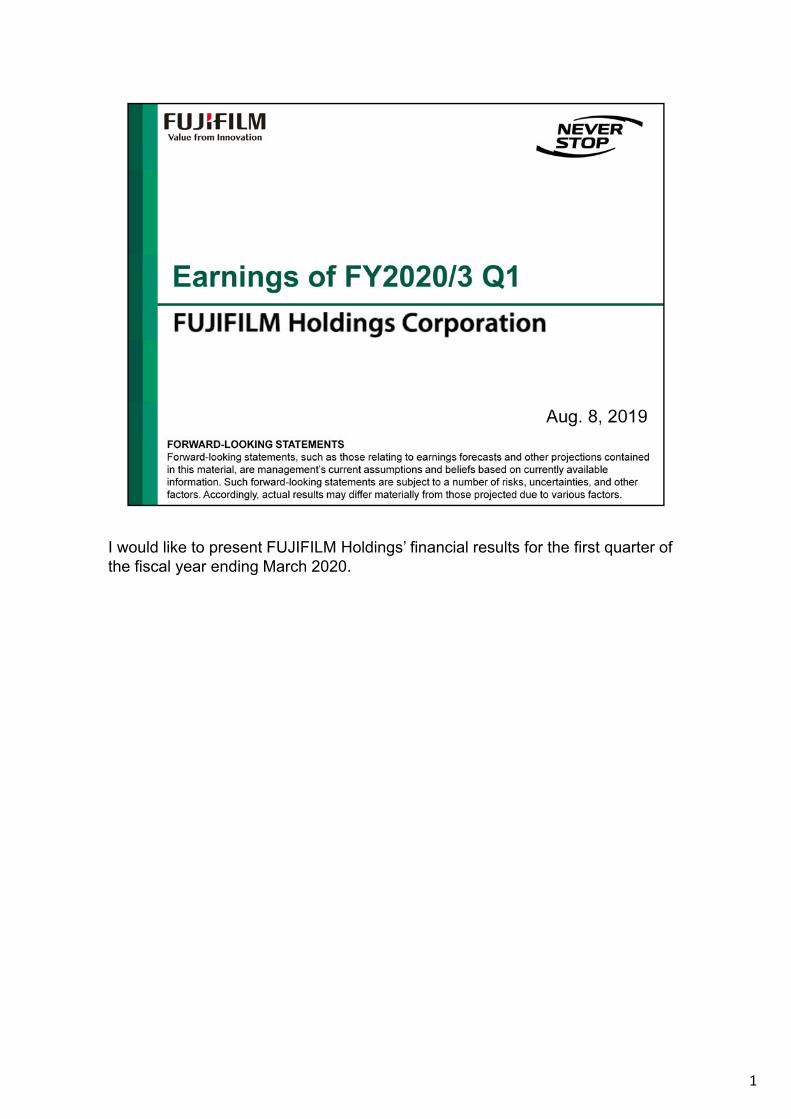
I would like to present FUJIFILM Holdings’ financial results for the first quarter of the fiscal year ending March 2020.
1
Let me explain the main points for the first quarter of the fiscal year ending March 2020.
I h fi f h fi l di M h 2020 i i i dIn the first quarter of the fiscal year ending March 2020, operating income increased year-on-year, increased by 9.9% on a constant-currency basis.The performance is in line with the plan.
Though the total revenue decreased due to a decline in the imaging business and export to the U.S. and Europe in the document business, the healthcare business expanded driven by the medical systems, bio CDMO and regenerative medicine business.Th i i i d i h l h d i h d b i i hThe operating income increased in healthcare and in the document business with improvements of profitability and positive impacts from structural reforms, though it decreased in the Imaging Solutions and Materials.
Our Board of Directors, at its meeting today, decided to conduct a buyback of the Company’s shares of ¥50.0 billion. In accordance with the medium-term management plan, we will conduct the share buyback of ¥200.0 billion in three years.
f f fIn addition, the acquisition of a manufacturing subsidiary of Biogen Inc., a large biopharmaceutical company was completed on August 1st.
2
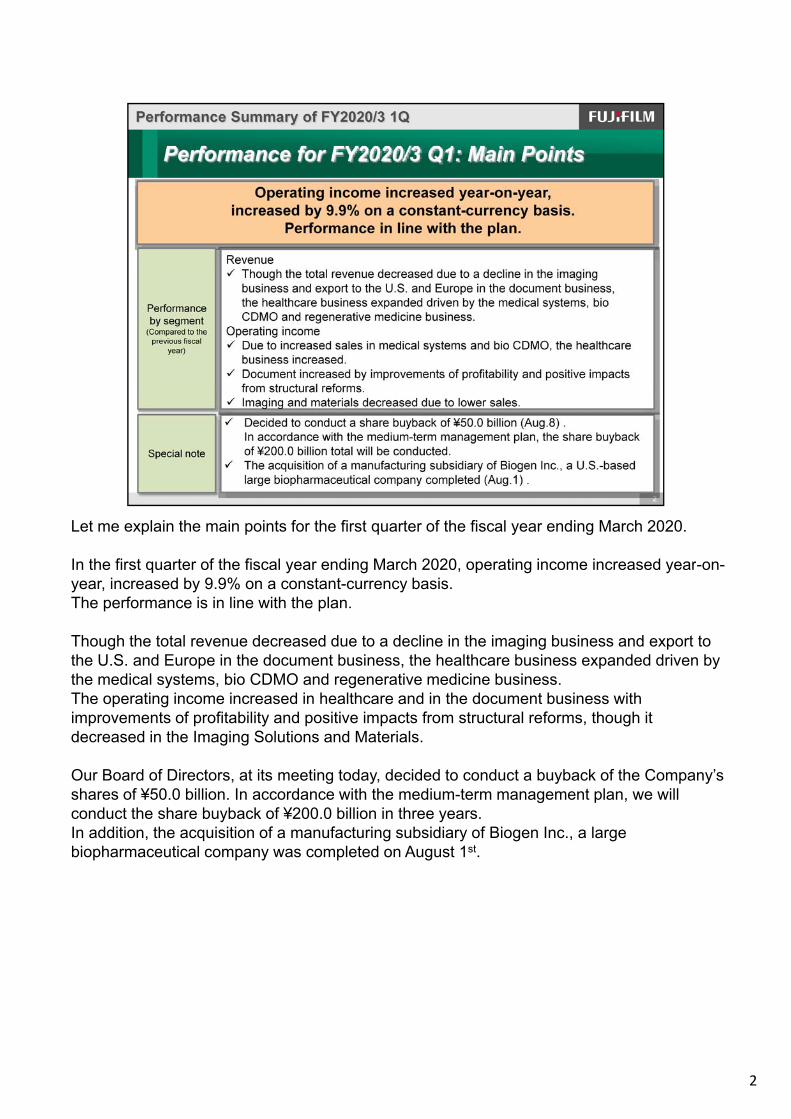
Let’s move on to detailed performance information for the first quarter of the fiscal year ending March 2020.
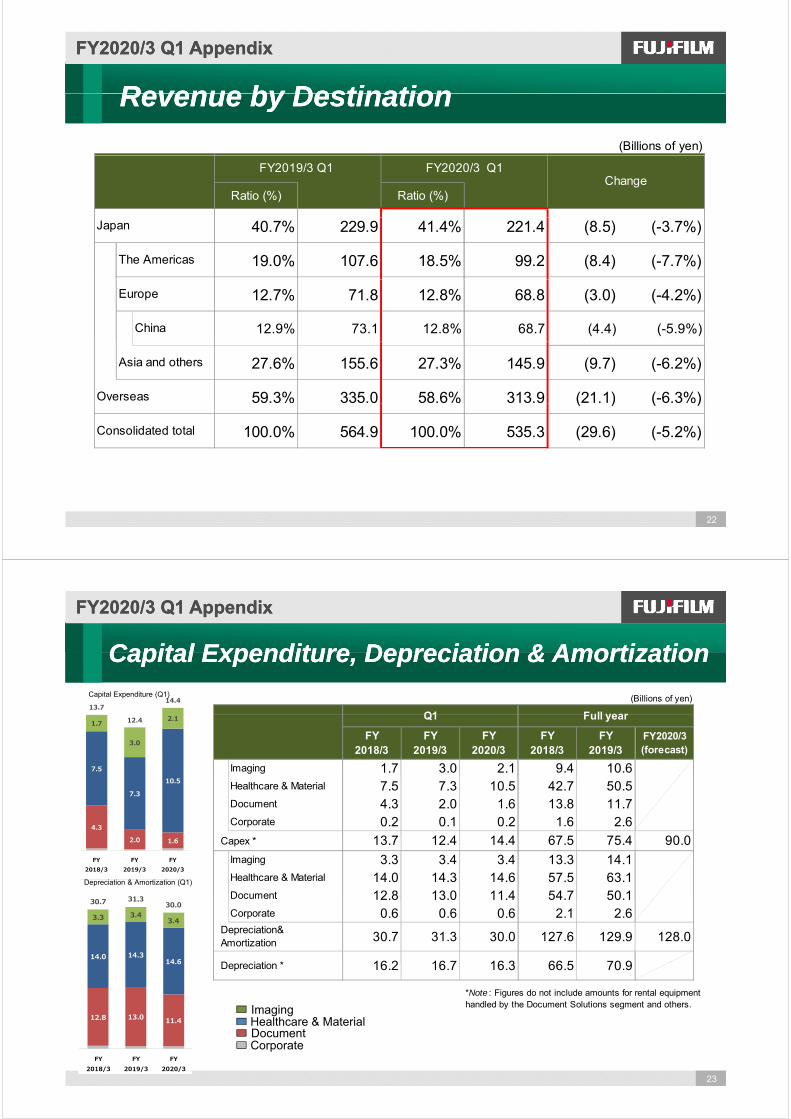
Consolidated revenue totaled ¥535.3 billion, down 5.2% from the previous fiscal year.
Operating income secured the increase year-on-year to ¥37.1 billion, increased by 9.9% on a constant-currency basis.
Income before income taxes came to ¥26.4 billion, down 42.4% from the previous fiscal year because the non-operating profit was lower by approximately ¥20.0 billion year-on-year due to losses on equity securities foreign exchange and othersto losses on equity securities, foreign exchange and others.
Net income attributable to FUJIFILM Holdings totaled ¥14.7 billion, down 48.2% from the previous fiscal year.
3
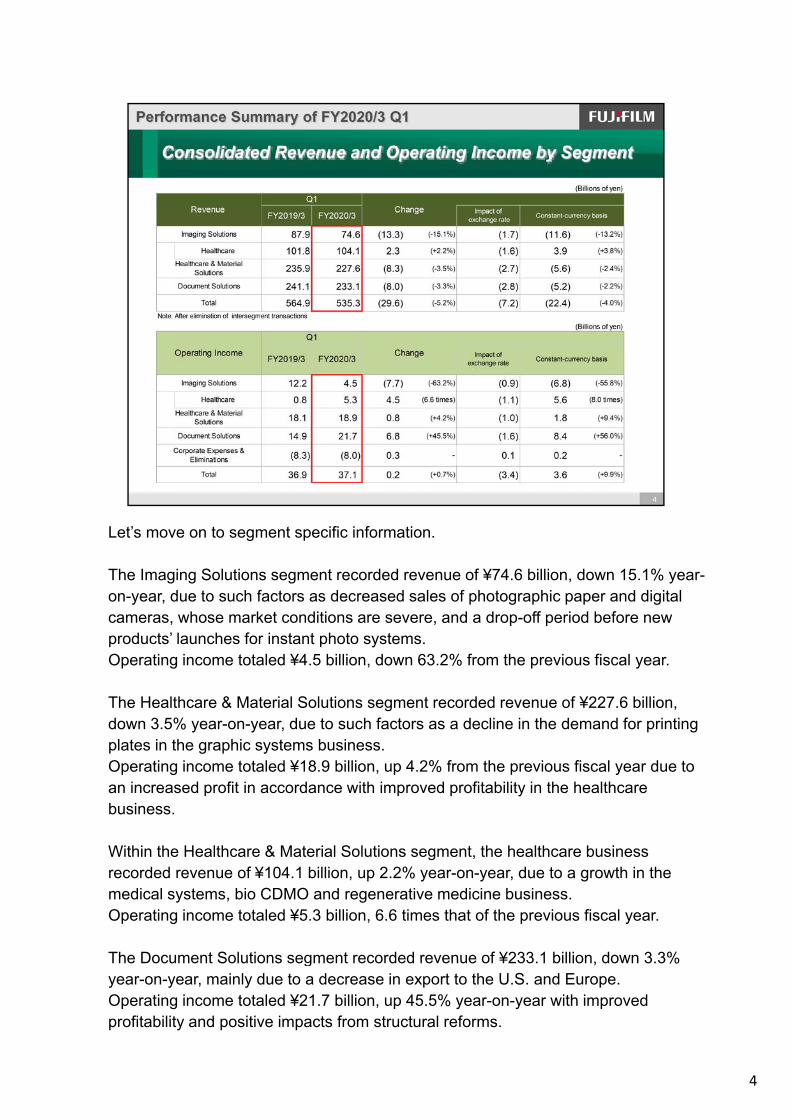
Let’s move on to segment specific information.
The Imaging Solutions segment recorded revenue of ¥74.6 billion, down 15.1% year-on-year, due to such factors as decreased sales of photographic paper and digital cameras, whose market conditions are severe, and a drop-off period before new products’ launches for instant photo systems.Operating income totaled ¥4.5 billion, down 63.2% from the previous fiscal year.
The Healthcare & Material Solutions segment recorded revenue of ¥227.6 billion, down 3.5% year-on-year, due to such factors as a decline in the demand for printing plates in the graphic systems business.Operating income totaled ¥18.9 billion, up 4.2% from the previous fiscal year due to an increased profit in accordance with improved profitability in the healthcare business.
Within the Healthcare & Material Solutions segment, the healthcare business recorded revenue of ¥104.1 billion, up 2.2% year-on-year, due to a growth in the medical systems, bio CDMO and regenerative medicine business.Operating income totaled ¥5.3 billion, 6.6 times that of the previous fiscal year.
The Document Solutions segment recorded revenue of ¥233 1 billion down 3 3%
4
The Document Solutions segment recorded revenue of ¥233.1 billion, down 3.3% year-on-year, mainly due to a decrease in export to the U.S. and Europe. Operating income totaled ¥21.7 billion, up 45.5% year-on-year with improved profitability and positive impacts from structural reforms.
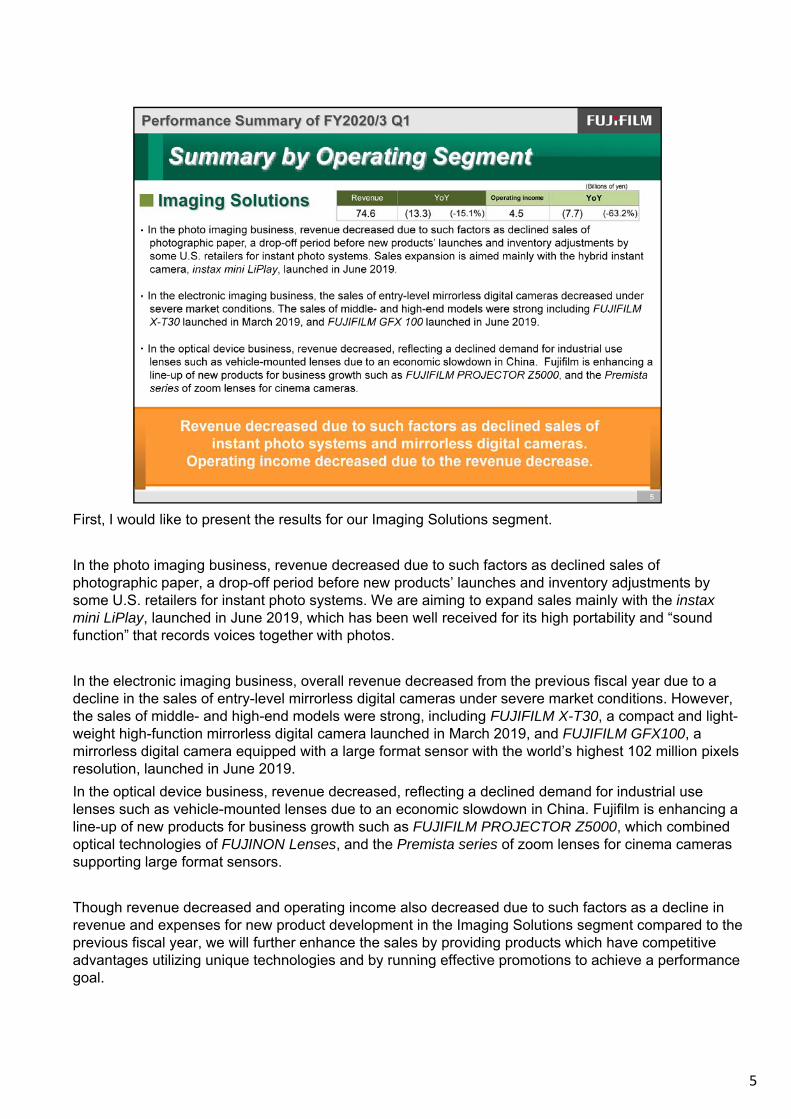
First, I would like to present the results for our Imaging Solutions segment.
In the photo imaging business, revenue decreased due to such factors as declined sales of photographic paper, a drop-off period before new products’ launches and inventory adjustments by some U.S. retailers for instant photo systems. We are aiming to expand sales mainly with the instaxmini LiPlay, launched in June 2019, which has been well received for its high portability and “sound function” that records voices together with photos.
In the electronic imaging business, overall revenue decreased from the previous fiscal year due to a decline in the sales of entry-level mirrorless digital cameras under severe market conditions. However, the sales of middle- and high-end models were strong, including FUJIFILM X-T30, a compact and light-weight high-function mirrorless digital camera launched in March 2019, and FUJIFILM GFX100, a mirrorless digital camera equipped with a large format sensor with the world’s highest 102 million pixels resolution, launched in June 2019.
In the optical device business, revenue decreased, reflecting a declined demand for industrial use lenses such as vehicle-mounted lenses due to an economic slowdown in China. Fujifilm is enhancing a line up of new products for business growth such as FUJIFILM PROJECTOR Z5000 which combinedline-up of new products for business growth such as FUJIFILM PROJECTOR Z5000, which combined optical technologies of FUJINON Lenses, and the Premista series of zoom lenses for cinema cameras supporting large format sensors.
Though revenue decreased and operating income also decreased due to such factors as a decline in revenue and expenses for new product development in the Imaging Solutions segment compared to the previous fiscal year, we will further enhance the sales by providing products which have competitive advantages utilizing unique technologies and by running effective promotions to achieve a performance
5
advantages utilizing unique technologies and by running effective promotions to achieve a performance goal.
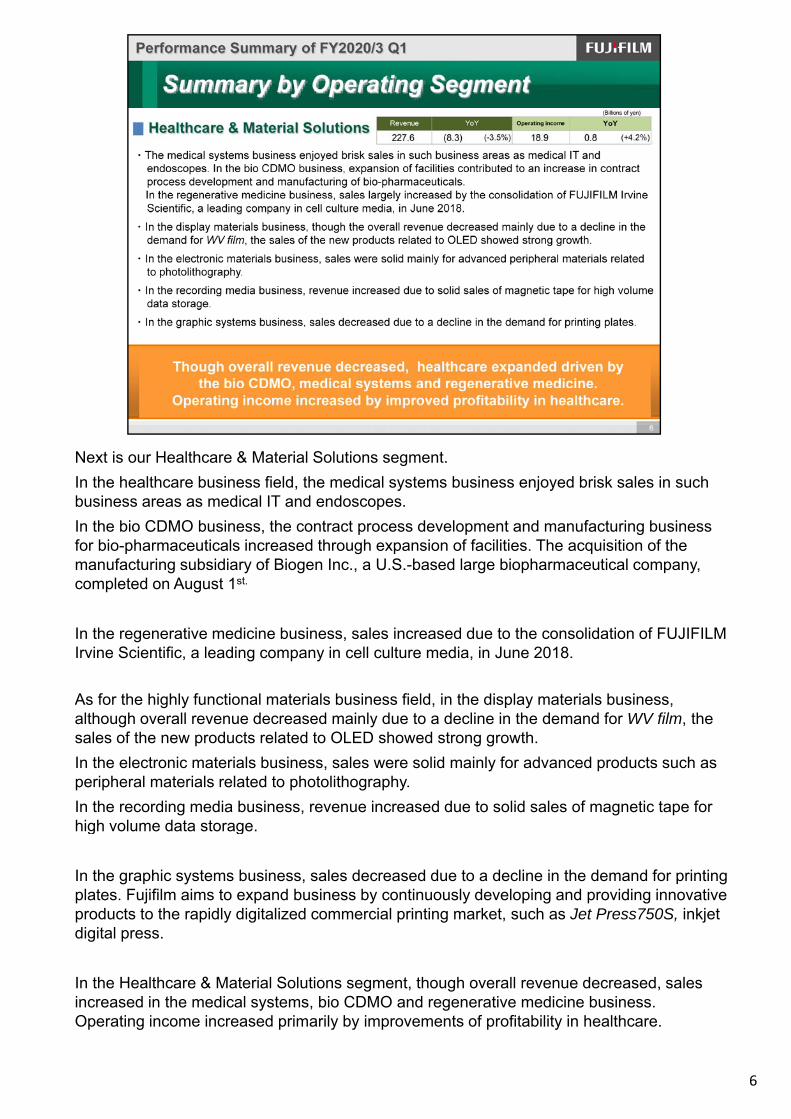
Next is our Healthcare & Material Solutions segment.
In the healthcare business field, the medical systems business enjoyed brisk sales in such business areas as medical IT and endoscopes.
In the bio CDMO business, the contract process development and manufacturing business for bio-pharmaceuticals increased through expansion of facilities. The acquisition of the
f i b idi f Bi I U S b d l bi h i lmanufacturing subsidiary of Biogen Inc., a U.S.-based large biopharmaceutical company, completed on August 1st.
In the regenerative medicine business, sales increased due to the consolidation of FUJIFILMIrvine Scientific, a leading company in cell culture media, in June 2018.
As for the highly functional materials business field, in the display materials business, although overall revenue decreased mainly due to a decline in the demand for WV film, the sales of the new products related to OLED showed strong growth.
In the electronic materials business, sales were solid mainly for advanced products such as peripheral materials related to photolithography.
In the recording media business, revenue increased due to solid sales of magnetic tape for high volume data storagehigh volume data storage.
In the graphic systems business, sales decreased due to a decline in the demand for printing plates. Fujifilm aims to expand business by continuously developing and providing innovative products to the rapidly digitalized commercial printing market, such as Jet Press750S, inkjet digital press.
6
In the Healthcare & Material Solutions segment, though overall revenue decreased, sales increased in the medical systems, bio CDMO and regenerative medicine business. Operating income increased primarily by improvements of profitability in healthcare.

Lastly, I would like to talk about the Document Solutions segment.
First, as for the office products business within the office products and printers business, although the sales decreased in export to the U.S. and Europe, the sales of color multifunction devices for small offices and with enhanced security functions were solid in Japan and Asia.
In the production services business, sales remained strong for an on-demand production color printer called the Iridesse™ Production Press in each region. Together with the 11000 Inkjet Press, a high-speed roll color inkjet printer for commercial printing with image quality comparable to that ofa high-speed roll color inkjet printer for commercial printing with image quality comparable to that of offset printing launched in February 2019 in Japan, we aim to further expand the digitalization of commercial printing.
In the solutions and services business, overall revenue proceeded favorable due to such factors as acquisition of a large BPO (Business Process Outsourcing) contract in Australia and expanded sales of one-stop services that support the design, introduction, maintenance and management of IT environments in offices in Japan Fuji Xerox aims for further growth in the service field byIT environments in offices in Japan. Fuji Xerox aims for further growth in the service field by continuously providing services that support customers in improvements of work efficiency and productivity.
Though revenue in the Document Solutions segment declined due to such factors as a decline in export to the U.S. and Europe, operating income increased by such factors as improvements in profitability and positive impacts from structural reforms.
7
We will continue our efforts to expand growth areas such as the solutions and services business and the production services business, while enhancing profitability by accomplishing structural reforms.
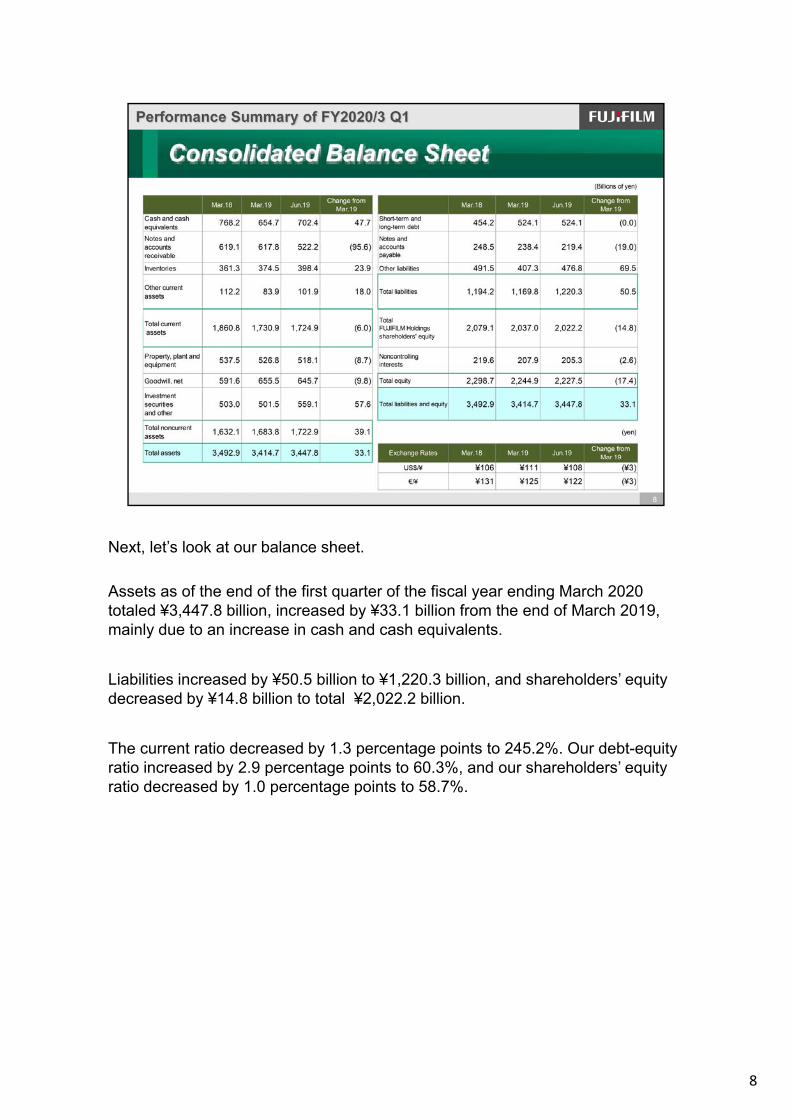
Next, let’s look at our balance sheet.
Assets as of the end of the first quarter of the fiscal year ending March 2020 totaled ¥3,447.8 billion, increased by ¥33.1 billion from the end of March 2019, mainly due to an increase in cash and cash equivalents.
Liabilities increased by ¥50.5 billion to ¥1,220.3 billion, and shareholders’ equity d d b ¥14 8 billi l ¥2 022 2 billidecreased by ¥14.8 billion to total ¥2,022.2 billion.
The current ratio decreased by 1.3 percentage points to 245.2%. Our debt-equity ratio increased by 2.9 percentage points to 60.3%, and our shareholders’ equity ratio decreased by 1.0 percentage points to 58.7%.
8

Next, with regards to our cash-flow, net cash provided by operating activities totaled ¥108.4 billion, due to a decrease in notes and accounts receivable and other factors.
Net cash used in investing activities amounted to ¥29.1 billion, mainly due to such factors as acquisition of property.
As a result, free cash flow without acquisitions of businesses and others was ¥82 6 billi i d b ¥17 4 billi¥82.6 billion, increased by ¥17.4 billion year-on-year.
9

Let me talk about our initiatives for structural reforms of Fuji Xerox, a consolidated subsidiary.
10

One-time expenses including structural reform costs in the first quarter of the fiscal year ending March 2020 totaled ¥4.1 billion, while a positive impact from the structural reforms was ¥8.3 billion, proceeding as planned.
By executing the structural reforms without fail, we aim to establish a business base where sustainable growth can be realized by reducing costs and maintaining profitability and productivity to withstand market changes and competition while reinvesting in new growth areascompetition, while reinvesting in new growth areas.
11

12

Our consolidated financial forecast for the fiscal year ending March 2020 has not changed from the figures and exchange rate assumptions announced on May 8, 2019.g g g y
In the first quarter, the operating income proceeded as planned. However, the economic conditions and exchange rate trends have been uncertain.Watching these trends closely, in the following quarters we will continue to advance our growth strategy, while promoting further expansion of sales and improvement in profitability in order to achieve our consolidated financial forecast.
Our Board of Directors, at its meeting today, decided to conduct a buyback of the Company’s shares of ¥50.0 billion.The annual dividend for the fiscal year ending March 2020 is expected to be 95 yen per share, an increase of 15 yen from the previous fiscal year.
13
Earnings for FY2020/3 Q1
AppendixAppendix
14
FY2020/3 Q1 AppendixFY2020/3 Q1 Appendix
Analysis of Operating Income ChangeAnalysis of Operating Income Change(Against FY2019/3 Q1) (Against FY2019/3 Q1)
(Billions of yen)
-0.8
-3.4+0.3
40.0
-6.9
+8.3+1.1
35.0
36.9 37.1
+0.7+0.9
30.0
25.0
20.0FY2019/3 Imaging Healthcare Document Structural Differece of FX Raw Others FY2020/3
0
15
FY2019/3Actual
Imaging Healthcare&
Material
Document Structural reform
positiveimpact inDocument
Differece of structural
reformexpenses inDocument
FX Rawmaterial
price
Others FY2020/3Actual

FY2020/3 Q1 AppendixFY2020/3 Q1 Appendix
Earnings forEarnings for FY2020/3 Q1FY2020/3 Q1
Imaging SolutionsImaging Solutions
Earnings for Earnings for FY2020/3 Q1FY2020/3 Q1
(Billions of yen)g gg g ( y )
Q1
ChangeRevenue
FY2019/3 FY2020/3
Photo Imaging 55.8 46.9 (8.9) (-16.0%) (8.0) (-14.4%)
Electronic Imaging 22.8 19.6 (3.2) (-13.9%) (2.5) (-10.8%)
Constant-currencybasis
ChangeFY2019/3 FY2020/3
Optical Devices 9.3 8.1 (1.2) (-12.8%) (1.1) (-12.0%)
Optical Device &Electronic Imaging
Products32.1 27.7 (4.4) (-13.6%) (3.6) (-11.1%)
87.9 74.6 (13.3) (-15.1%) (11.6) (-13.2%)
Note: After elimination of intersegment transactions
Total
Q1
Change Constant-currencybasis
Operating Income[Operating Margin] FY2019/3 FY2020/3
16
12.2 4.5[13.9%] [6.0%]
basis
(6.8) (-55.8%)(-63.2%)(7.7)Imaging Solutions
Change in Quarterly Earnings byChange in Quarterly Earnings by SegmentSegment
FY2020/3 Q1 AppendixFY2020/3 Q1 Appendix
Change in Quarterly Earnings by Change in Quarterly Earnings by Segment Segment
Imaging SolutionsImaging Solutions (Billions of yen)Imaging SolutionsImaging Solutions (Billions of yen)
Revenue Operating Income
127.9 40.0125.0
Photo Imaging87 9 88 0 26.430.0100.0
g g
ElectronicImaging Optical Device &
Electronic Imaging 55 8
90.8
87.9 88.083.1
74.6
26.4
20.0
75.0
(20.6%)
Operating Income for Imaging Solutions(O ti M i )
Optical Devices
Products55.857.1
53.8
46.912.2
50.0
(13 9%) (Operating Margin)
10 5
22.8 21.326.6
19.9 19.6
9.4
3.14.5
10.0
25.0
(13.9%)
(10.7%)
(6.0%)
17
9.3 9.6 10.5 9.4 8.10.00.0
18.Q1 18.Q2 18.Q3 18.Q4 19.Q1
(3.7%)

FY2020/3 Q1 AppendixFY2020/3 Q1 Appendix
Earnings forEarnings for FY2020/3 Q1FY2020/3 Q1
Healthcare & Material SolutionsHealthcare & Material Solutions
Earnings for Earnings for FY2020/3 Q1FY2020/3 Q1
(Billions of yen)
101 8 104 1 2 3 (+2 2%) 3 9 (+3 8%)
RevenueFY2019/3
Healthcare
Q1
Change Constant-currency basisFY2020/3
101.8 104.1 2.3 (+2.2%) 3.9 (+3.8%)
Display Materials 23.0 20.8 (2.2) (-9.5%) (2.2) (-9.5%)
Industrial ProductsElectronic Materials
Fine Chemical43.6 41.2 (2.4) (-5.2%) (2.2) (-4.7%)
Healthcare
Highly FunctionalMaterials 66.6 62.0 (4.6) (-6.7%) (4.4) (-6.4%)
9.3 9.7 0.4 (+3.3%) 0.4 (+3.3%)
57.9 51.5 (6.4) (-11.0%) (5.5) (-9.5%)
Recording Media
Graphic Systems/Inkjet
0.3 0.3 0.0 0.0
235.9 227.6 (8.3) (-3.5%) (5.6) (-2.4%)
Note: After elimination of intersegment transactions
Others
Total
0.8 5.3 4 5
Operating Income[Operating Margin] FY2019/3
Healthcare
Constant-currency basis
(6 6 times) 5 6 (8 0 times)
FY2020/3 Change
Q1
18
[0.8%] [5.1%]
18.1 18.9[7.7%] [8.3%]
Healthcare & MaterialSolutions 0.8
4.5Healthcare
(+4.2%)
(6.6 times) 5.6 (8.0 times)
1.8 (+9.4%)
Change in Quarterly Earnings byChange in Quarterly Earnings by SegmentSegment
FY2020/3 Q1 AppendixFY2020/3 Q1 Appendix
Healthcare & Material SolutionsHealthcare & Material Solutions
Change in Quarterly Earnings by Change in Quarterly Earnings by Segment Segment
263.1 259 9
280.140.0300.0
(Billions of yen)Revenue
Operating Income
141 4
235.9
263.1 259.9
227.632.530.0
250.0
(12.5%)Display Materials
Healthcare
101.8 121.6 119.5141.4
104.1
19.4
27.6
18 9 20.0150.0
200.0(9.9%)
Recording Media
Industrial ProductsElectronic MaterialsFine Chemical
43.6 44.1 46.7 45.441 2
23.0 27.7 26.3 21.2
20.8
18.118.9
100.0
(7.7%)(7.4%)
(8.3%)Graphic SystemsInkjet
Recording Media
Oth
57.9 60.7 57.8 60.3 51.5
9.3 8.7 9.2 11.69.7
41.210.0
50.0Operating Income for Healthcare & Material
Others
0.00.018.Q1 18.Q2 18.Q3 18.Q4 19.Q1
19
Solutions(Operating Margin)

FY2020/3 Q1 AppendixFY2020/3 Q1 Appendix
Earnings forEarnings for FY2020/3 Q1FY2020/3 Q1
Document SolutionsDocument Solutions
Earnings for Earnings for FY2020/3 Q1FY2020/3 Q1
(Billions of yen)
Q1
Change Constant-currency basisFY2019/3 FY2020/3Revenue
Office Printers 30.1 28.8 (1.3) (-4.3%) (1.4) (-4.6%)
139.7 133.7 (6.0) (-4.3%) (4.8) (-3.4%)Office Products & Printers
29.2 27.3 (1.9) (-6.5%) (1.5) (-5.1%)
57.9 62.5 4.6 (+8.1%) 5.6 (+9.7%)
14 3 9 6 (4 7) (4 5)
Production Services
Solutions & Services
Others 14.3 9.6 (4.7) (4.5)
241.1 233.1 (8.0) (-3.3%) (5.2) (-2.2%)
Note: After elimination of intersegment transactions
Total
Others
Operating Income[Operating Margin] FY2019/3 FY2020/3 Change
Q1
Constant-currency basis
20
14.9 21.7[6.2%] [9.3%]
Document Solutions 8.4 (+56.0%)(+45.5%)6.8
Change in Quarterly Earnings byChange in Quarterly Earnings by SegmentSegment
FY2020/3 Q1 AppendixFY2020/3 Q1 Appendix
Document SolutionsDocument Solutions (Billions of yen)
Change in Quarterly Earnings by Change in Quarterly Earnings by Segment Segment
Revenue Operating Income
300.0
Office Products & Office Printers
241.1256.7
239.3
268.5
233.1
50 0
70.0
Office Products & Office Printers
Production Services
Solutions & Services
139.7146.6
139.3
143.5
133.728.4
23 6
29.5 30.0
50.0
200.0
(11 0%) Solutions & Services
Operating Income for Doc ment Sol tions
Others
29.232.4
29.1
32.6
27.3
14.9
23.621.7
10.0100.0
(6.2%)
(11.0%)(9.9%)
(11.0%)
(9.3%)
Operating Income for Document Solutions(Operating Margin)
57.9 66.4 60.076.9
62.5-10.0
21
-30.00.018.Q1 18.Q2 18.Q3 18.Q4 19.Q1
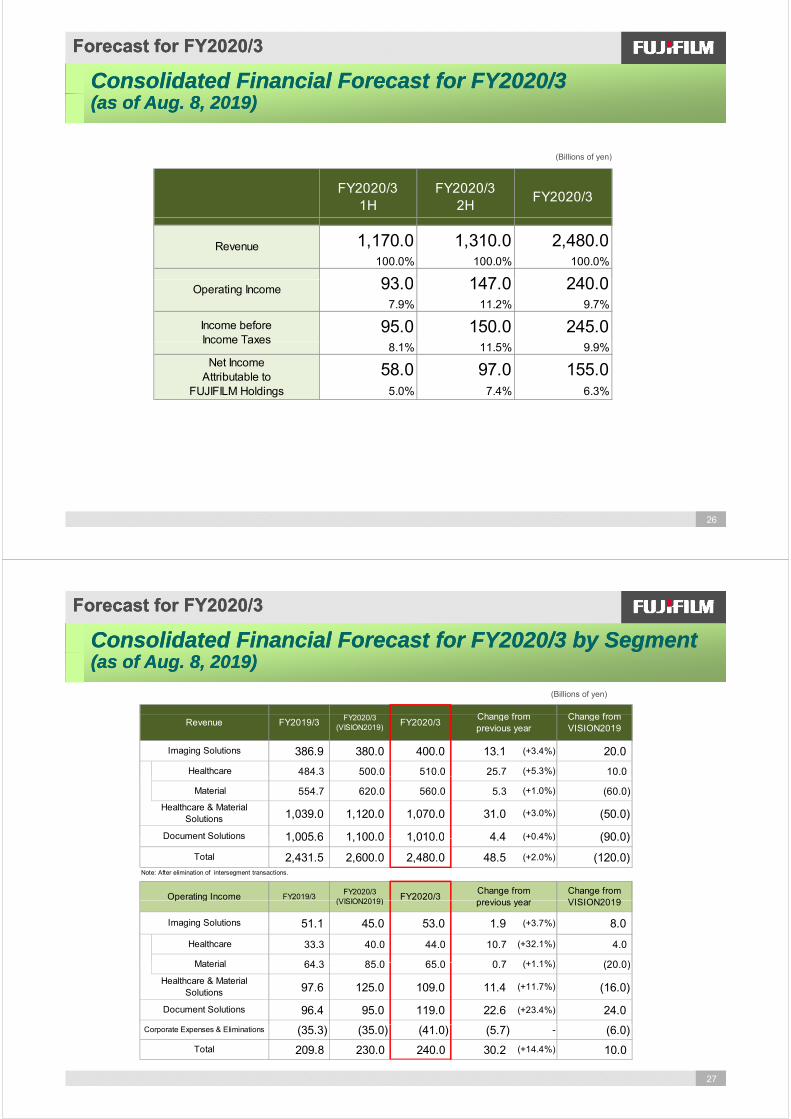
RevenueRevenue by Destinationby Destination
FY2020/3 Q1 AppendixFY2020/3 Q1 Appendix
Revenue Revenue by Destinationby Destination
(Billions of yen)
Ratio (%) Ratio (%)
FY2020/3 Q1Change
FY2019/3 Q1
40.7% 229.9 41.4% 221.4 (8.5) (-3.7%)
19.0% 107.6 18.5% 99.2 (8.4) (-7.7%)
Japan
The Americas
12.7% 71.8 12.8% 68.8 (3.0) (-4.2%)
China 12.9% 73.1 12.8% 68.7 (4.4) (-5.9%)
Europe
Asia and others 27.6% 155.6 27.3% 145.9 (9.7) (-6.2%)
Overseas 59.3% 335.0 58.6% 313.9 (21.1) (-6.3%)( ) ( )
100.0% 564.9 100.0% 535.3 (29.6) (-5.2%)Consolidated total
22
CapitalCapital ExpenditureExpenditure Depreciation & AmortizationDepreciation & Amortization
FY2020/3 Q1 AppendixFY2020/3 Q1 Appendix
13.714.4
Capital Capital Expenditure, Expenditure, Depreciation & AmortizationDepreciation & AmortizationCapital Expenditure (Q1) (Billions of yen)
Q1 Full year
7.5
1.7
3.0
2.112.4 Q1
FY2018/3
FY2019/3
FY2020/3
FY2018/3
FY2019/3
FY2020/3(forecast)
Imaging 1.7 3.0 2.1 9.4 10.6
Full year
4.3
2 0 1 6
7.3
10.5Healthcare & Material 7.5 7.3 10.5 42.7 50.5Document 4.3 2.0 1.6 13.8 11.7Corporate 0.2 0.1 0.2 1.6 2.6
C * 13 7 12 4 14 4 67 5 75 4 90 02.0 1.6
FY2018/3
FY2019/3
FY2020/3
Depreciation & Amortization (Q1)
30 7 31.3
Capex * 13.7 12.4 14.4 67.5 75.4 90.0Imaging 3.3 3.4 3.4 13.3 14.1Healthcare & Material 14.0 14.3 14.6 57.5 63.1Document 12.8 13.0 11.4 54.7 50.1
14.0 14.314 6
3.3 3.43.4
30.7 31.330.0
Corporate 0.6 0.6 0.6 2.1 2.6
30.7 31.3 30.0 127.6 129.9 128.0
16 2 16 7 16 3 66 5 70 9D i ti *
Depreciation& Amortization
*Note : Figures do not include amounts for rental equipmenthandled by the Document Solutions segment and others.Imaging
Healthcare & Material12.8 13.0 11.4
14.6 16.2 16.7 16.3 66.5 70.9 Depreciation *
23
DocumentCorporate
Healthcare & Material
FY2018/3
FY2019/3
FY2020/3

R&D Expenses SG&A ExpensesR&D Expenses SG&A Expenses
FY2020/3 Q1 AppendixFY2020/3 Q1 Appendix
R&D Expenses, SG&A ExpensesR&D Expenses, SG&A Expenses
R&D Expenses (Q1)
40.1 39 0
(Billions of yen)
FY2019/3 FY2020/3 FY2019/3FY2020/3
Q1 Full Year
17.8 17 2
2.5 2.7 39.0 FY2019/3 FY2020/3 FY2019/3
(forecast)
Imaging 2.5 2.7 9.9
Healthcare & Material 17.8 17.2 69.8
13 8 13 0
17.8 17.2 Document 13.8 13.0 51.2
Corporate 6.0 6.1 25.2
R&D Expenses 40 1 39 0 156 1 155 0
6.0 6.1
13.8 13.0 R&D Expenses 40.1 39.0 156.1 155.0
7.1% 7.3% 6.4% 6.3%
158.7 152.3 631.6
<ratio to revenue>
SG&A Expenses
ImagingHealthcare & Material
FY2019/3 FY2020/3158.7 152.3 631.6
28.1% 28.4% 26.0% <ratio to revenue>
SG&A Expenses
24
DocumentCorporate
ExchangeExchange RatesRates Raw Material Prices and Number of EmployeesRaw Material Prices and Number of Employees
FY2020/3 Q1 AppendixFY2020/3 Q1 Appendix
Exchange Exchange Rates, Rates, Raw Material Prices, and Number of EmployeesRaw Material Prices, and Number of Employees
Exchange Rates (yen)Exchange Rates (yen)
Q1 Q2 Q3 Q4 Full year Q1Full year(forecast)
FY2020/3FY2019/3
US$/¥ 109 111 113 110 111 110 110
€/¥ 130 130 129 125 128 123 125
Raw Material Prices (Average) (¥1,000/kg)
FY2020/3FY2019/3
Q1 Q2 Q3 Q4 Full year Q1Full year(forecast)
Silver 58 54 53 55 55 53 58
Number of Employees2018.Jun 2018.Sep 2018.Dec 2019.Mar 2019.Jun
77 060 75 329 74 425 72 332 72 358C lid t d T t l
25
77,060 75,329 74,425 72,332 72,358Consolidated Total
Forecast for Forecast for FY2020/3FY2020/3
Consolidated Financial Forecast for Consolidated Financial Forecast for FY2020/3FY2020/3(as of (as of Aug. 8, 2019)Aug. 8, 2019)
(Billions of yen)(Billions of yen)
FY2020/32H
FY2020/3FY2020/3
1H
1,170.0 1,310.0 2,480.0100.0% 100.0% 100.0%
93 0 147 0 240 0
Revenue
93.0 147.0 240.07.9% 11.2% 9.7%
95.0 150.0 245.0
Operating Income
Income beforeIncome Taxes
8.1% 11.5% 9.9%
58.0 97.0 155.05.0% 7.4% 6.3%
Income Taxes
Net IncomeAttributable to
FUJIFILM Holdings
26
Forecast for Forecast for FY2020/3FY2020/3
Consolidated Financial Forecast for Consolidated Financial Forecast for FY2020/3 FY2020/3 by by Segment Segment (as of (as of Aug. 8, 2019)Aug. 8, 2019)
(Billions of yen)
Change fromFY2020/3 Change from
386.9 380.0 400.0 13.1 (+3.4%) 20.0
Healthcare 484.3 500.0 510.0 25.7 (+5.3%) 10.0
Change fromVISION2019
FY2020/3(VISION2019)
Change fromprevious year
Imaging Solutions
Revenue FY2019/3 FY2020/3
Material 554.7 620.0 560.0 5.3 (+1.0%) (60.0)
1,039.0 1,120.0 1,070.0 31.0 (+3.0%) (50.0)
1 005 6 1 100 0 1 010 0 4 4 (+0.4%) (90 0)
Healthcare & MaterialSolutions
Document Solutions 1,005.6 1,100.0 1,010.0 4.4 ( 0.4%) (90.0)
2,431.5 2,600.0 2,480.0 48.5 (+2.0%) (120.0)Note: After elimination of intersegment transactions.
Change fromVISION2019
FY2020/3(VISION2019)
Change fromprevious year
Document Solutions
Total
Operating Income FY2019/3 FY2020/3
51.1 45.0 53.0 1.9 (+3.7%) 8.0
Healthcare 33.3 40.0 44.0 10.7 (+32.1%) 4.0
Material 64 3 85 0 65 0 0 7 (+1 1%) (20 0)
VISION2019(VISION2019) previous year
Imaging Solutions
p g
Material 64.3 85.0 65.0 0.7 (+1.1%) (20.0)
97.6 125.0 109.0 11.4 (+11.7%) (16.0)
96.4 95.0 119.0 22.6 (+23.4%) 24.0
Healthcare & MaterialSolutions
Document Solutions
27
(35.3) (35.0) (41.0) (5.7) - (6.0)
209.8 230.0 240.0 30.2 (+14.4%) 10.0
Corporate Expenses & Eliminations
Total

Shareholder ReturnsShareholder Returns
Forecast for FY2020/3Forecast for FY2020/3
■DividendDividend for FY2020/3 is planned at ¥95 per share increased by ¥15 from the
Shareholder ReturnsShareholder Returns
¥95
Dividend for FY2020/3 is planned at ¥95 per share, increased by ¥15 from the previous fiscal year. The dividend increase is expected for 10 consecutive years.
¥65¥70
¥75 ¥80
¥40
¥50
¥60 ¥65
¥25 ¥30
¥35 ¥40
FY'10/3 FY'11/3 FY'12/3 FY'13/3 FY'14/3 FY'15/3 FY'16/3 FY'17/3 FY'18/3 FY'19/3 FY'20/3(forecast)
28
PipelinePipeline (as of Aug 8 2019)(as of Aug 8 2019)
FY2020/3 Q1 AppendixFY2020/3 Q1 Appendix
Development code
Therapeutic category Formulation Region Development stage
Pipeline Pipeline (as of Aug. 8, 2019)(as of Aug. 8, 2019)
T-705Anti-influenza drug Oral
Japan Approved
U.S.A. PⅢ
Severe fever with thrombocytopenia syndrome virus drug Oral Japan PⅢ
T 3811 Quinolone synthetic antibacterial drug Oral China Appro edT-3811 Quinolone synthetic antibacterial drug Oral China Approved
T-2307 Antifungal drug Injection U.S.A. PⅠ
T-817MAAlzheimer's disease drug
Oral
U.S.A. PⅡ
Japan PⅡ
F ti l ft t k ( ti th ff t f h bilit ti ) J PⅡFunctional recovery after stroke (promoting the effect of rehabilitation) Japan PⅡ
T-4288 New fluoroketolide antibacterial drug Oral Japan Submitted an application for permission
FF-10501 Myelodysplastic syndrome drug OralJapan PⅠ
U.S.A. PⅡ
FF 10502 Advanced/recurrent solid cancer drug Injection U S A PⅡFF-10502 Advanced/recurrent solid cancer drug Injection U.S.A. PⅡ
FF-21101 Advanced/recurrent solid cancer drug (armed antibody) Injection U.S.A. PⅡ
F-1311 Diagnostic drug for prostate cancer (radiopharmaceuticals) Injection Japan PⅡ
FF-10101 Acute Myeloid Leukemia (AML) drug Oral U.S.A. PⅠ
Bio
y ( ) g
F-1515 Anti-tumor (neuroendocrine tumors) drug (radiopharmaceuticals) Injection Japan PⅠ/Ⅱ
FF-10832 Advanced solid cancer drug (gemcitabine liposome) Injection U.S.A. PⅠ
F-1614 Anti-tumor (pheochromocytoma) drug (radiopharmaceuticals) Injection Japan PⅡ
29292929

AppendixAppendix
FY2020/3 Q1 AppendixFY2020/3 Q1 Appendix
AppendixAppendix
FUJIFILM HoldingsFUJIFILM Holdings -- Investor RelationsInvestor RelationsFUJIFILM Holdings FUJIFILM Holdings Investor RelationsInvestor Relationshttp://www.fujifilmholdings.com/en/investors/index.html
FUJIFILM HoldingsFUJIFILM Holdings IntegratedIntegrated ReportReport 20182018
IR Events MaterialsIR Events Materials
FUJIFILM Holdings FUJIFILM Holdings Integrated Integrated Report Report 20182018http://www.fujifilmholdings.com/en/investors/ir_library/integrated_reports/index.html
IR Events MaterialsIR Events Materialshttp://www.fujifilmholdings.com/en/investors/ir_events/business_presentations/index.html
・ Business presentation materials- Mar. 2018 Business Presentation for Imaging Solutions Business
What Kind of Company is Fujifilm?What Kind of Company is Fujifilm?
- Jan. 2019 Business Presentation for Pharmaceuticals/Bio CDMO/Regenerative Medicine Business- Feb. 2019 ESG Briefing
30
What Kind of Company is Fujifilm?What Kind of Company is Fujifilm?http://www.fujifilmholdings.com/en/investors/guidance/index.html
Global Branding Campaign: NEVER STOPGlobal Branding Campaign: NEVER STOPGlobal Branding Campaign: NEVER STOPGlobal Branding Campaign: NEVER STOPhttps://brand.fujifilm.com/neverstop/en/
At F jifil ti l i ti tiAt Fujifilm, we are continuously innovating — creatingnew technologies, products and services that inspire
and excite people everywhere.Our goal is to empower the potential and expand
the horizons of tomorrow’s businesses and lifestyles.
Corporate Communication Office, Corporate Planning Div.
http://www.fujifilmholdings.com/en/index.html


![Investigation Report - Home | FUJIFILM HoldingsTentative English translation for information purpose only] Investigation Report (Summary) June 10, 2017 FUJIFILM Holdings Corporation](https://img.pdfslide.net/doc/110x75/5abec3917f8b9a7e418d5956/investigation-report-home-fujifilm-tentative-english-translation-for-information.jpg)