Embed Size (px)
Citation preview

ACKNOWLEDGEMENTS
I would like to thank my advisor, Kristen Billiar for guiding and supporting me over the years. You have set an example of excellence as a researcher, mentor, instructor, and role model. I would like to thank my thesis committee members for all of their guidance through this process; your discussion, ideas, and feedback have been absolutely invaluable. I'd like to thank my fellow graduate students, research technicians, collaborators, and the multitude of undergraduates who contributed to this research. I am very grateful to all of you. I would like to thank my undergraduate research advisors, Dr. Surya Mallapragada and Dr. Richard Seagrave for their constant enthusiasm and encouragement. I would especially like to thank my amazing family for the love, support, and constant encouragement I have gotten over the years. In particular, I would like to thank my parents, my brother, and my aunt Cathy. You are the salt of the earth, and I undoubtedly could not have done this without you. I would also like to thank my ‘greater Worcester family’: Christian Grove, Chiara Silvestri, William Johnson, Vladimir Floroff, Sudeepta Shanbhag, Becca Munro, Abe Shultz, Nick Perry, Kae Collins, Maria Pappas, Victoria Leeds, Nicole Belanger, Cha Cha Connor, Paul Sheprow, Caramia Phillips, Paolo Piselli, Billy Roberts, Angelina Bernadini, Zoe Reidinger, Anna O’Connor, Celine Nader, Nate Marini, and Sara Duran. Your love, laughter and music have kept me smiling and inspired. You are and always will be my family. Finally, I would like to thank and dedicate this thesis to my grandfather, Dr. Silvio Balestrini. It was you who originally generated my love for science with visits to your laboratory and lessons on chemistry and physics. Although it has been years since you have passed, I still take your lessons with me, every day.
i
TABLE OF CONTENTS
Page number Chapter 1: Overview 1 1.1 Introduction 1 1.2 Objectives and Specific Aims 2 1.3 References 6 Chapter 2: Background 8 2.1 Introduction 8
2.1.1 Function and composition of connective tissues 8 2.1.2 Mechanoregulation in planar soft connective tissues 9
2.2 Adult healing in soft connective tissue: growth, repair and disease 11 2.2.1 Phases of wound healing 11 2.2.2 The formation of the provisional matrix and the role of fibrin 11 2.2.3 The formation of granulation tissue 12 2.2.4 Tissue remodeling, wound retraction, scar formation and the 13
myofibroblast 2.2.5 Connective tissue pathology 15 2.2.6 Impact of mechanical loading during wound healing in vivo 16 2.2.7 The production of non-physiological stretch levels and fibrotic 17
tissue propagation 2.2.8 Cyclic stretch regulates fibroblast behavior in 2D systems 18
2.3 Current 3D in vitro models of wound healing 20 2.3.1 3D in vitro systems for use in mechanobiology 20 2.3.2 3D models for use in tissue engineering and regenerative 21
medicine 2.4 Mechanoregulation of fibroblasts in three dimensional models 22
2.4.1 Mechanobiology in 3D systems 22 2.4.2 Determining optimal loading conditions for the creation of 24
tissue equivalents for use in load bearing applications 2.4.3 Creating accurate models of planar tissue with non-uniform 25
strain distribution 2.5 Conclusions 25 2.6 References 26 Chapter 3: Equibiaxial cyclic stretch stimulates fibroblasts to rapidly 35 remodel fibrin 3.1 Introduction 37 3.2 Materials and methods
3.2.1 Fabrication of fibrin gels 37 3.2.2 Application of stretch 37 3.2.3 Validation of strain field 38 3.2.4 Mechanical characterization 38 3.2.5 Histological analysis 39 3.2.6 Transmission electron microscopy 39
ii
3.2.7 Matrix alignment analysis 40 3.2.8 Density, cell number and viability, and collagen content 40
determination 40 3.2.9 Inhibition of crosslinking 40 3.2.10 Statistical analysis 41
3.3 Results 41 3.3.1 Cyclic stretch increases tissue compaction and matrix density 42 3.3.2 Cyclic stretch increases tissue strength relative to static controls 43 3.3.3 Cyclic stretch regulates cell morphology 43 3.3.4 Collagen crosslinking impacts tissue compaction, UTS, and 44
extensibility 3.4 Discussion 44
3.4.1 Cyclic stretch increases cell-mediated and passive compaction 44 3.4.2 Stretch does not modify cell number or viability 45 3.4.3 Cyclic stretch induces cell-mediated strengthening of fibrin gels 46 3.4.4 Conclusions 46 3.4.5 Acknowledgements 46 3.4.6 References 47
Chapter 4: Magnitude and duration of stretch modulate fibroblast 50 remodeling 4.1 Introduction 50 4.2 Materials and methods 52
4.2.1 Fabrication of fibrin gels 52 4.2.2 Application of stretch 52 4.2.3 Determination of cell number and total collagen content 53 4.2.4 Determination of physical properties 54 4.2.5 Low-force biaxial mechanical characterization 54 4.2.6 Retraction assay 56 4.2.7 Histological analysis 57 4.2.8 Statistical and regression analysis 57
4.3 Results 58 4.3.1 Effect of stretch on compaction 58 4.3.2 Effect of stretch on mechanical properties 59 4.3.3 Effect of stretch on cell number and collagen density 60 4.3.4 Effect of stretch on matrix retraction 62 4.3.5 Effect of intermittent stretch on the matrix stiffness 63
4.4 Discussion 64 4.4.1 Cyclic stretch increases tissue strength in fibrin gels 64 4.4.2 UTS increases exponentially as a function of stretch magnitude 65 4.4.3 Tissue compaction is both a passive and an active response to 65
stretch 4.4.4 Stretch-induced increases in failure tension are contingent on a rest 66
period 4.4.5 Matrix stiffness increases with intermittent stretch magnitude 67 4.4.6 Tissue retraction is dependent on stretch magnitude 68
iii
4.4.7 Conclusions and summary 68 4.5 Acknowledgments 68 4.6 References 69 Chapter 5: Applying controlled non-uniform deformation for in vitro 73 studies of cell mechanobiology 5.1 Introduction 73 5.2 Materials and methods 75
5.2.1 Experimental Approach 75 5.2.2 Fabrication of the rigid inclusion model system 76 5.2.3 Ring inserts to limit strain 76 5.2.4 Strain field verification 77 5.2.5 Strain field verification for 3D model systems 78 5.2.6 Statistical analysis and modeling 79 5.2.7 Demonstration of cell orientation to non-homogeneous strain 80
field created by rigid inclusion in 2D and 3D 5.3 Results 82
5.3.1 Effect of the subimage size on the resolution of strain 83 distribution
5.3.2 Effect of the rigid inclusion on strain distribution in 2D 85 5.3.3 Results of regression analysis and modeling 87 5.3.4 Effect of ring inserts on global strain distribution 90 5.3.5 Effect of the rigid inclusion on strain distribution in 3D 91 5.3.6 Effect of non-homogeneous strain field created by rigid inclusion 92
on cell orientation in 2D 5.3.7 Effect of non-homogeneous strain field created by rigid inclusion 94
on fiber orientation in 3D 5.4 Discussion 96
5.4.1 Gradients of strain can be ‘tuned’ by altering applied strain or the 96 inclusion size
5.4.2 Benefit of a 2D gradient system 97 5.4.3 Isolating anisotropy, gradient and magnitude effects 98 5.4.4 Optimization of effective resolution 100 5.4.5 Our findings of symmetric strain gradients support the predictions 101
of Moore and colleagues 5.4.6 Restrictions to utilizing the proposed system 102 5.4.7 Conclusions and summary 102 5.4.8 Acknowledgements 103 5.4.9 References 103
Chapter 6: Conclusions and future work 106 6.1 Overview 106 6.2 Isolating the effects of mechanical loading on cell-mediated matrix 106
remodeling during fibroplasia 6.2.1 Minimizing fiber alignment to isolate stretch effects 106
iv
6.2.2 Establishing the relationship between stretch magnitude and 107 duration and matrix remodeling
6.2.3 Determining passive and active stretch effects 109 6.3 Developing relevant mechanobiological models of wound healing 110
in planar connective tissues 6.3.1 Fibrin gels as models of early wound healing 110 6.3.2 Modeling the complex mechanical environment of connective 113
tissue 6.4 Mechanical conditioning for use in regenerative medicine 115 6.5 Future work 115 6.6 Final Conclusions 119 6.7 References 120 Appendices i Appendix A: i Appendix B: iv Appendix C: vii Appendix D: ix Appendix E: xx
v
TABLE OF FIGURES
Page number Figure 2.1 Connective tissue underlying the epithelium 8 Figure 2.2. Internal and external force transmission in the dermis 10 Figure 2.3. The three phases of wound healing in connective tissues 11 Figure 2.4. The provisional matrix during fibroplasia and remodeling as 13 seen in pulmonary wound healing Figure 2.5. Regeneration versus pathological healing, the outcomes of 15 wound repair Figure 2.6. Methods of mechanical stimulation 19 Figure 2.7. Photo depicting Apligraf, a dermal tissue equivalent 22 Figure 3.1. Schematic of the method of stretching the fibroblast-populated 37 fibrin gels Figure 3.2. Brightfield images of hematoxylin and eosin stained 41 sections of fibrin gels Figure 3.3. TEM images of fibroblasts and extracellular matrix in static 43 and stretched fibrin gels Figure 4.1. Schematics representing a fibrin gel with foam anchor attached 55 prior to after loading onto the biaxial device Figure 4.2. Representative brightfield images of hematoxylin and eosin 58 stained sections of fibrin gels Figure 4.3. Tissue thickness, UTS, collagen density, extensibility, 59 failure tension, stiffness, active retraction, passive retraction and cell number of CS (24 hr/day), and IS (6 hr/day) fibrin gels cycled at 2, 4, 8, and 16% stretch Figure 4.4. Representative fibroblast-populated fibrin gel at 40 seconds 63 and 7 minutes post release from its substrate Figure 4.5. Representative engineering stress-strain plot of equibiaxial 63 loading along orthogonal ‘1’ and ‘2’ directions Figure 5.1 Schematics of the of the rigid inclusion system with a ring insert 83 Figure 5.2 Representative radial stretch ratio, λr versus radius for a 10mm 84 inclusion system cycled to ‘6%’ applied strain Figure 5.3 Effect of increasing inclusion size and applied strain on the 86 deformation of the membrane. Figure 5.4 Strain gradients for ‘6%’ applied strain for different inclusion 86 sizes (5mm, 10mm, and 15mm) and for b) 10mm inclusion at ‘2%’, ‘4%’, and ‘6%’ applied strain Figure 5.5 Radial and circumferential stretch ratio data 89 Figure 5.6 Stretch anisotropy for ‘6%’ applied strain as a function of radial 89 distance from center for each inclusion size Figure 5.7 Comparison of ‘6%’ applied strain data for radial and 90 circumferential directions from this study and scaled data from Mori et al., 2005 Figure 5.8 Relationship between the height of the Delrin inserts and the 91
vi
resulting applied strain for a mechanically loaded silicone membrane. Figure 5.9 Effect of deformation of the 5mm inclusion system with and without a 92 fibroblast-populated fibrin gel Figure 5.10 Representative images of human dermal fibroblasts cultured on 93 membranes with 5mm diameter inclusions for two days at 0.2Hz at ‘2%’ applied strain Figure 5.11 Representative confocal and histological H&E images of human 95 dermal fibroblasts cultured in fibrin gels with 5mm diameter inclusions for eight days at 0.2Hz at ‘6%’ applied strain Figure 5.12 Representative thickness of fibrin gels taken from histological H&E 97 images of human dermal fibroblasts cultured in fibrin gels
vii
TABLE OF TABLES
Page number
Table 2.1. Mechanobiological responses of cells to various applications 23 of mechanical conditioning Table 3.1. Physical and biochemical properties of fibroblast-populated 42 fibrin gels statically cultured or cyclically stretched for 8 days of culture
Table 3.2. Effect of BAPN on the mechanical and biochemical properties 44 of statically-cultured and cyclically-stretched fibroblast-populated fibrin gels Table. 4.1. Regression analysis for normalized remodeling metrics as a 60 function of stretch magnitude (M), the length per day of stretch (CS vs. IS), and an interaction term (I) Table. 4.2. Raw mechanical, biochemical, and physiological data for 61 continuously stretched gels cycled at 0, 2, 4, 8, and 16% stretch magnitudes for 8 days at 0.2 Hz. Table 4.3. Raw mechanical, biochemical, and physiological data for 61 intermittently stretched gels cycled at 0, 2, 4, 8, and 16% stretch magnitudes for 8 days at 0.2 Hz. Table 5.1. Optimal parameter values for stretch ratio vs. radius curves 87 and interpolated parameters for '2%' and '4%' curves based on optimal parameters for '6%' curves.
viii
ABSTRACT Mechanical loads play a pivotal role in the growth, maintenance, remodeling, and disease onset in connective tissues. Harnessing the relationship between mechanical signals and how cells remodel their surrounding extracellular matrix would provide new insights into the fundamental processes of wound healing and fibrosis and also assist in the creation of custom-tailored tissue equivalents for use in regenerative medicine. In 3D tissue models, uniaxial cyclic stretch has been shown to stimulate the synthesis and crosslinking of collagen while increasing the matrix density, fiber alignment, stiffness, and tensile strength in the direction of principal stretch. Unfortunately, the profound fiber realignment in these systems render it difficult to differentiate between passive effects and cell-mediated remodeling. Further, these previous studies generally focus on a single level of stretch magnitude and duration, and they also investigate matrix remodeling under homogeneous strain conditions. Therefore, these studies are not sufficient to establish key information regarding stretch-dependent remodeling for use in tissue engineering and also do not simulate the complex mechanical environment of connective tissue. We first developed a novel in vitro model system using equibiaxial stretch on fibrin gels (early models of wound healing) that enabled the isolation of mechanical effects on cell-mediated matrix remodeling. Using this system we demonstrated that in the absence of in-plane alignment, stretch stimulates fibroblasts to produce a stronger tissue by synthesizing collagen and condensing their surrounding matrix. We then developed dose-response curves for multiple aspects of tissue remodeling as a function of stretch magnitude and duration (intermittent versus continuous stretch). Our results indicate that both the magnitude of stretch and the duration per day are important factors in mechanically induced cell activity, as evidenced by dose-dependent responses of several remodeling metrics (UTS, matrix stiffness, collagen content, cell number) in response to these two parameters. In addition, we found that cellularity, collagen content, and resistance to tension increased when the tissues were mechanically loaded intermittently as opposed to continuously. Finally, we developed a novel model system that produces a non-homogeneous strain distribution, allowing for the simultaneous study of strain gradients, strain anisotropy, and strain magnitude in planar and three-dimensional culture conditions. Establishing a system that produces complex strain distributions provides a more accurate model of the mechanical conditions found in connective tissue, and also allows for the investigation of cellular adaptations to a changing mechanical environment.
ix
CHAPTER 1
A brief overview of this thesis work 1.1. Introduction Virtually all connective tissues are exposed to complex biaxial mechanical loads in vivo,
and these loads play a pivotal role in the development, maintenance and remodeling, and
pathogenesis of these tissues [1]. During wound healing, mechanical cues modulate
fibroblast synthetic and contractile capacity and are responsible for, in part, driving the
wound healing response toward a positive or negative outcome (e.g., wound closure vs.
excessive contracture) [2]. Other classic examples of mechanical regulation of tissue
include bone growth and remodeling due to loading, arterial wall thickening due to
hypertension, or wound contracture due to fibroblast tractional forces [3].
Clinicians and researchers have long sought to understand the relationship between
mechanical loading and cell response, in order to assist in the creation of wound healing
therapies (e.g., splint usage in dermal healing) [4], determine what role tissue mechanics
plays in disease onset and persistence (e.g., fibrotic tissue propagation)[3], and to enable
the manipulation of cell behavior to build custom tailored tissue equivalents [5]. The
overall research goal of this thesis is to better understand cell-mediated matrix
remodeling in planar tissues subjected to complex biaxial loading, and, in particular, the
role mechanical of loads during the process of wound healing.
1
Chapter 1 - Overview
1.2. Objectives and specific aims
Objective I: Establish a model system to isolate mechanical effects of stretch on cell-
mediated matrix remodeling.
To investigate how mechanical cues guide cell activity in a controlled mechano-chemical
environment, in vitro 3D tissue models such as cell-populated collagen and fibrin gels
have been utilized extensively [5-23]. In these systems, uniaxial cyclic stretch has been
shown to stimulate the synthesis and crosslinking of collagen while increasing the matrix
density, fiber alignment, stiffness, and tensile strength in the direction of stretch.
Although these studies provide valuable information of stretch-induced matrix
remodeling in uniaxially loaded tissue (e.g., tendons), it remains unclear if the changes in
tissue architecture are primarily cell-mediated, or if they are predominantly derived from
fiber alignment. Further, these studies do not simulate the mechanical conditions during
growth, healing, or pathology in planar tissue (e.g, skin, heart valves, lung tissue, etc.).
The first aim of this thesis work is to develop a model system to isolate mechanical
effects on cell-mediated matrix remodeling and to determine if stretch stimulates
dermal fibroblasts to reorganize and remodel their surrounding matrix into a
stronger tissue without the addition of in-plane tissue alignment.
In Chapter 3, I discuss the development of a novel method to isolate the impact of
mechanical stretch on the mechanical, morphological, and biochemical properties of
fibroblast-populated fibrin gels in in vitro models of early wound healing. Equibiaxial
stretch is used instead of uniaxial stretch in order to limit the confounding effects of fibril
alignment on the mechanics of the matrix, thus enabling the investigation of more subtle
remodeling mechanisms. We applied continuous cyclic equibiaxial stretch (16% stretch
at 0.2 Hz) to fibroblast-populated fibrin gels to in vitro wound models for eight days.
Compaction, density, tensile strength, and collagen content were quantified as functional
measures of tissue remodeling. Evaluation of the stretched samples revealed that they
2
Chapter 1 - Overview
were approximately ten times stronger, eight-fold more collagen-dense, and eight times
thinner than statically cultured samples. These changes were not accompanied by
differences in cell number or viability. These findings increase our understanding of how
mechanical forces guide the healing response in connective tissue. Further, the methods
employed in this study may also prove to be valuable tools for investigating stretch-
induced remodeling of other planar connective tissues and for creating mechanically-
robust engineered tissues.
Objective 2: Establish dose-response curves of matrix remodeling in terms of stretch
magnitude and duration.
Quantitatively establishing the relationships between mechanical simulation and
extracellular matrix remodeling would be an important step towards the rational design of
manual therapies for wound healing and also for the use of mechanical conditioning as a
means to custom tailor tissue analogs with specific requirements such as strength,
stiffness, and contractility. Although much has been learned about the mechanisms of
strain-dependent remodeling in 3D models of connective tissue, the appropriate
combinations of strain levels, ranges, and durations utilized in previous experiments are
not sufficient to characterize the complex relationships between parameters of
mechanical conditioning (magnitude, duration, etc.) and metrics of matrix remodeling
(strength, stiffness, alignment, etc.).
The second aim of this thesis is to establish dose-response relationships between
stretch parameters (2, 4, 8, and 16% magnitude and either 6 or 24 hour durations
per day) and functional matrix remodeling metrics (compaction, strength,
extensibility, collagen content, contraction and cellularity).
In Chapter 4, I present the development of these dose-response curves and determine the
significance of each stretch parameter. Cyclic equibiaxial stretch of 2 to 16 % was
applied to fibroblast-populated fibrin gels for either 6 or 24 hours per day for 8 days.
Trends in matrix remodeling metrics as a function of stretch magnitude and duration were
3
Chapter 1 - Overview
analyzed using regression analysis. The compaction and ultimate tensile strength of the
tissues increased in a dose-dependent manner with increasing stretch magnitude, yet
remained unaffected by the duration in which they were cycled (6 versus 24 hours/day).
Within the range of magnitudes tested within this study, collagen density increased
exponentially as a function of both the magnitude and duration of stretch. Interestingly,
samples that were stretched for the reduced duration per day had the highest levels of
collagen accumulation. Cell number and failure tension were also dependent on both the
magnitude and duration of stretch, although stretch-induced increases in these metrics
were only present in the samples loaded for 6 hours/day. Our results indicate that both
the magnitude and the duration per day of stretch are critical parameters in modulating
fibroblast remodeling of the extracellular matrix, yet these two stretch parameters
regulate different aspects of this remodeling. These findings move us one step closer to
fully characterizing culture conditions for tissue equivalents, developing improved wound
healing treatments, and understanding tissue responses to changes in mechanical
environments during growth, repair, and disease states.
Objective 3: Determine how regional increases in local strain result in heightened
remodeling and lead to global changes in tissue architecture.
Cells within connective tissues routinely experience a wide range of non-uniform
mechanical loads that are required for normal health and homeostasis. These strains are
often anisotropic, inhomogeneous, and have local gradients of strain magnitude [24, 25].
These non-uniformities in strain direction and magnitude are especially pronounced near
local areas of increased stiffness (in tissues undergoing clinical intervention with the
addition of stents, prosthetics, etc.) or during disease onset such as the formation of stiff
fibrotic foci [26, 27]. Strain anisotropy and magnitude are known to be important
regulators of cellular activity (e.g.., collagen production, cell proliferation, cellular
retraction capacity); however, previous studies have been limited to either extremely
anisotropic or equibiaxial strain conditions, and have therefore ignored more subtle
responses to alternative biaxial states of strain found in vivo. In addition, understanding
tissue responses and cellular adaptations to changing mechanical conditions will assist in
4
Chapter 1 - Overview
minimizing adverse effects of clinical intervention and also help understand the
propagation of self-sustaining fibrosis.
The third aim of this thesis work is to develop a model system with an
inhomogeneous strain distribution as seen in connective tissue, and to also
determine if stiff inclusions alter the distribution of strain magnitudes in tissues,
ultimately leading to changes in global tissue architecture.
In Chapter 5, we present the development of an experimental system to produce complex
strain patterns for the study of strain magnitude, anisotropy, and gradient effects on cells
and cell-populated tissue in culture. An equibiaxial cell stretching system was modified
by affixing glass coverslips of various sizes (5, 10, or 15mm diameter) to the center of
35mm diameter flexible-bottomed culture wells. Ring inserts were utilized to limit
applied strain to different levels in each individual well, thus enabling parallel
experiments at different strain levels. The addition of the glass coverslip creates strong
circumferential and radial strain gradients, with a continuous range of stretch anisotropy
ranging from strip biaxial to equibiaxial stretch. Dermal fibroblasts seeded within our 2D
system (5mm inclusions and cycled to ‘2%’ applied strain for 2 days) demonstrated the
characteristic orientation perpendicular to the direction of principal strain. Similarly,
dermal fibroblasts seeded within a 3D system (5mm inclusions and cycled to ‘6%’
applied strain for 8 days) also oriented themselves perpendicular to the direction of
principle strain, and compacted their matrix in accordance with strain magnitude resulting
in differential thickness across the tissue. This study verifies how inhomogeneous strain
fields can be produced in a tunable and simply constructed system, and demonstrates the
potential utility for studying gradients with a continuous spectrum of strain magnitudes
and anisotropies.
This thesis describes an investigation of how the complex non-uniform mechanical loads
seen in planar connective tissue regulates cell-mediated matrix remodeling and changes
in tissue architecture. Harnessing the relationship between stretch and cell behavior will
5
Chapter 1 - Overview
assist in creating tissue-engineered constructs with custom tailored properties and provide
new insights into the fundamental processes of wound healing, hyperplasia, and fibrosis.
1.3. References [1] Lundon, K., 2006, "Effect of mechanical loading on soft connective tissues,"
Functional soft tissue examination and treatment by manual methods, W. Hammer, ed., Jones and Bartlett, Sudbury, MA, pp. 13-120.
[2] Silver, F. H., Siperko, L. M., and Seehra, G. P., 2003, "Mechanobiology of force transduction in dermal tissue," Skin Res Technol, 9(1), pp. 3-23.
[3] Mori, D., David, G., Humphrey, J. D., and Moore, J. E., Jr., 2005, "Stress distribution in a circular membrane with a central fixation," J Biomech Eng, 127(3), pp. 549-553.
[4] Sanders, J. E., Goldstein, B. S., and Leotta, D. F., 1995, "Skin response to mechanical stress: adaptation rather than breakdown--a review of the literature," J Rehabil Res Dev, 32(3), pp. 214-226.
[5] Isenberg, B. C., and Tranquillo, R. T., 2003, "Long-term cyclic distention enhances the mechanical properties of collagen-based media-equivalents," Annals of Biomedical Engineering, 31(8), pp. 937-949.
[6] Butcher, J. T., Barrett, B. C., and Nerem, R. M., 2006, "Equibiaxial strain stimulates fibroblastic phenotype shift in smooth muscle cells in an engineered tissue model of the aortic wall," Biomaterials, 27(30), pp. 5252-5258. Epub 2006 Jun 5227.
[7] Carver, W., Nagpal, M. L., Nachtigal, M., Borg, T. K., and Terracio, L., 1991, "Collagen expression in mechanically stimulated cardiac fibroblasts," Circ Res, 69(1), pp. 116-122.
[8] Cummings, C. L., Gawlitta, D., Nerem, R. M., and Stegemann, J. P., 2004, "Properties of engineered vascular constructs made from collagen, fibrin, and collagen-fibrin mixtures," Biomaterials, 25(17), pp. 3699-3706.
[9] Dartsch, P. C., Hammerle, H., and Betz, E., 1986, "Orientation of cultured arterial smooth muscle cells growing on cyclically stretched substrates," Acta Anat (Basel), 125(2), pp. 108-113.
[10] Girton, T. S., Barocas, V. H., and Tranquillo, R. T., 2002, "Confined compression of a tissue-equivalent: collagen fibril and cell alignment in response to anisotropic strain," J Biomech Eng, 124(5), pp. 568-575.
[11] Husse, B., Briest, W., Homagk, L., Isenberg, G., and Gekle, M., 2007, "Cyclical mechanical stretch modulates expression of collagen I and collagen III by PKC and tyrosine kinase in cardiac fibroblasts," Am J Physiol Regul Integr Comp Physiol, 293(5), pp. R1898-1907.
[12] Kanda, K., and Matsuda, T., 1994, "Mechanical stress-induced orientation and ultrastructural change of smooth muscle cells cultured in three-dimensional collagen lattices," Cell Transplant, 3(6), pp. 481-492.
6
Chapter 1 - Overview
[13] Kim, B. S., Nikolovski, J., Bonadio, J., and Mooney, D. J., 1999, "Cyclic mechanical strain regulates the development of engineered smooth muscle tissue," Nat Biotechnol, 17(10), pp. 979-983.
[14] Kratz, C., Tollback, A., and Kratz, G., 2001, "Effects of continuous stretching on cell proliferation and collagen synthesis in human burn scars," Scand J Plast Reconstr Surg Hand Surg, 35(1), pp. 57-63.
[15] Langelier, E., Rancourt, D., Bouchard, S., Lord, C., Stevens, P. P., Germain, L., and Auger, F. A., 1999, "Cyclic traction machine for long-term culture of fibroblast-populated collagen gels," Ann Biomed Eng, 27(1), pp. 67-72.
[16] Prajapati, R. T., Eastwood, M., and Brown, R. A., 2000, "Duration and orientation of mechanical loads determine fibroblast cyto-mechanical activation: monitored by protease release," Wound Repair and Regeneration, 8(3), pp. 238-246.
[17] Seliktar, D., Nerem, R. M., and Galis, Z. S., 2003, "Mechanical strain-stimulated remodeling of tissue-engineered blood vessel constructs," Tissue Eng, 9(4), pp. 657-666.
[18] Syedain, Z. H., Weinberg, J. S., and Tranquillo, R. T., 2008, "Cyclic distension of fibrin-based tissue constructs: evidence of adaptation during growth of engineered connective tissue," Proc Natl Acad Sci U S A, 105(18), pp. 6537-6542.
[19] Tower, T. T., Neidert, M. R., and Tranquillo, R. T., 2002, "Fiber alignment imaging during mechanical testing of soft tissues," Ann Biomed Eng, 30(10), pp. 1221-1233.
[20] Tranquillo, R. T., 2002, "The tissue-engineered small-diameter artery," Ann N Y Acad Sci, 961, pp. 251-254.
[21] Wille, J. J., Elson, E. L., and Okamoto, R. J., 2006, "Cellular and matrix mechanics of bioartificial tissues during continuous cyclic stretch," Ann Biomed Eng, 34(11), pp. 1678-1690.
[22] Yao, L., Swartz, D. D., Gugino, S. F., Russell, J. A., and Andreadis, S. T., 2005, "Fibrin-based tissue-engineered blood vessels: differential effects of biomaterial and culture parameters on mechanical strength and vascular reactivity," Tissue Eng, 11(7-8), pp. 991-1003.
[23] Ye, Q., Zund, G., Benedikt, P., Jockenhoevel, S., Hoerstrup, S. P., Sakyama, S., Hubbell, J. A., and Turina, M., 2000, "Fibrin gel as a three dimensional matrix in cardiovascular tissue engineering," Eur J Cardiothorac Surg, 17(5), pp. 587-591.
[24] Hashima, A. R., Young, A. A., McCulloch, A. D., and Waldman, L. K., 1993, "Nonhomogeneous analysis of epicardial strain distributions during acute myocardial ischemia in the dog," J Biomech, 26(1), pp. 19-35.
[25] Oomens, C. W., van Ratingen, M. R., Janssen, J. D., Kok, J. J., and Hendriks, M. A., 1993, "A numerical-experimental method for a mechanical characterization of biological materials," J Biomech, 26(4-5), pp. 617-621.
[26] Giannone, G., and Sheetz, M. P., 2006, "Substrate rigidity and force define form through tyrosine phosphatase and kinase pathways," Trends Cell Biol, 16(4), pp. 213-223.
[27] Ingber, D. E., 1997, "Tensegrity: the architectural basis of cellular mechanotransduction," Annu Rev Physiol, 59, pp. 575-599.
7
CHAPTER 2
Background and Significance 2.1. Introduction 2.1.1. Function and composition of connective tissues Soft connective tissues provide the structural framework, elasticity, and durability to
withstand internal and external forces imparted on the body. Soft connective tissue
proper includes dense connective tissues (e.g., the dermis) and also loose interstitial
connective tissues that separate and connect muscles and surround all organs, nerves, and
blood vessels [6, 7]. These tissues create a stroma that is distinct from, but inextricably
related to, the functioning parenchyma of the viscera.
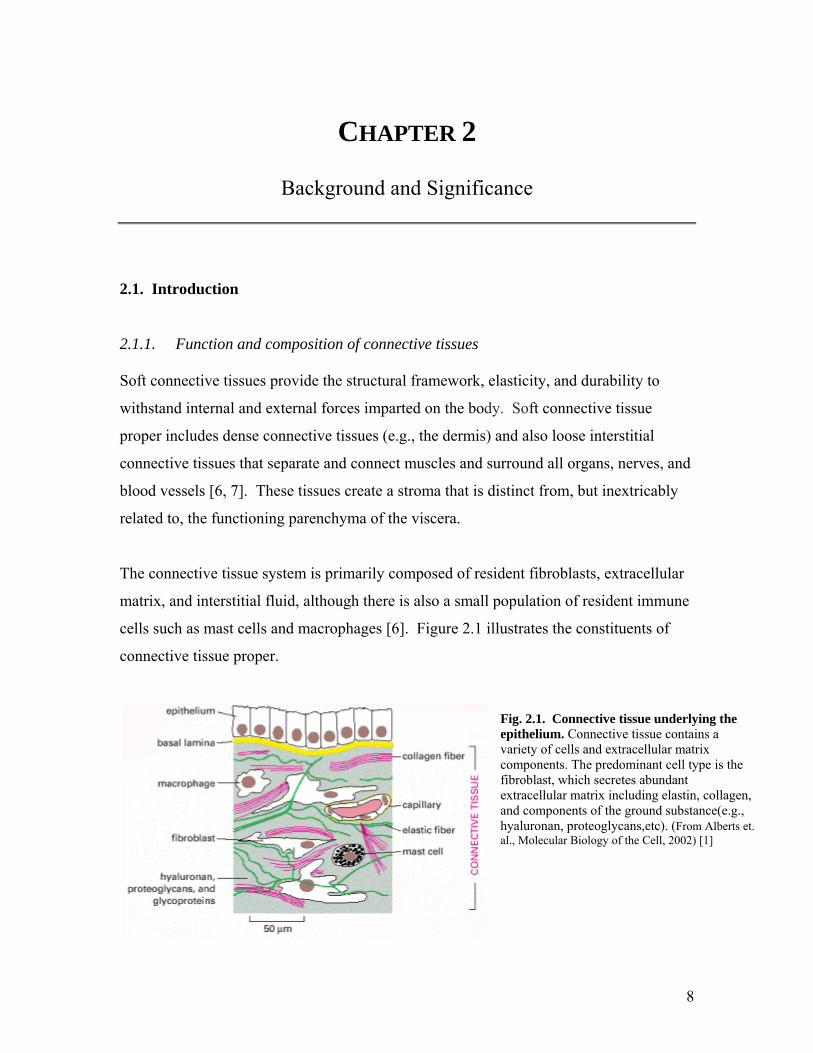
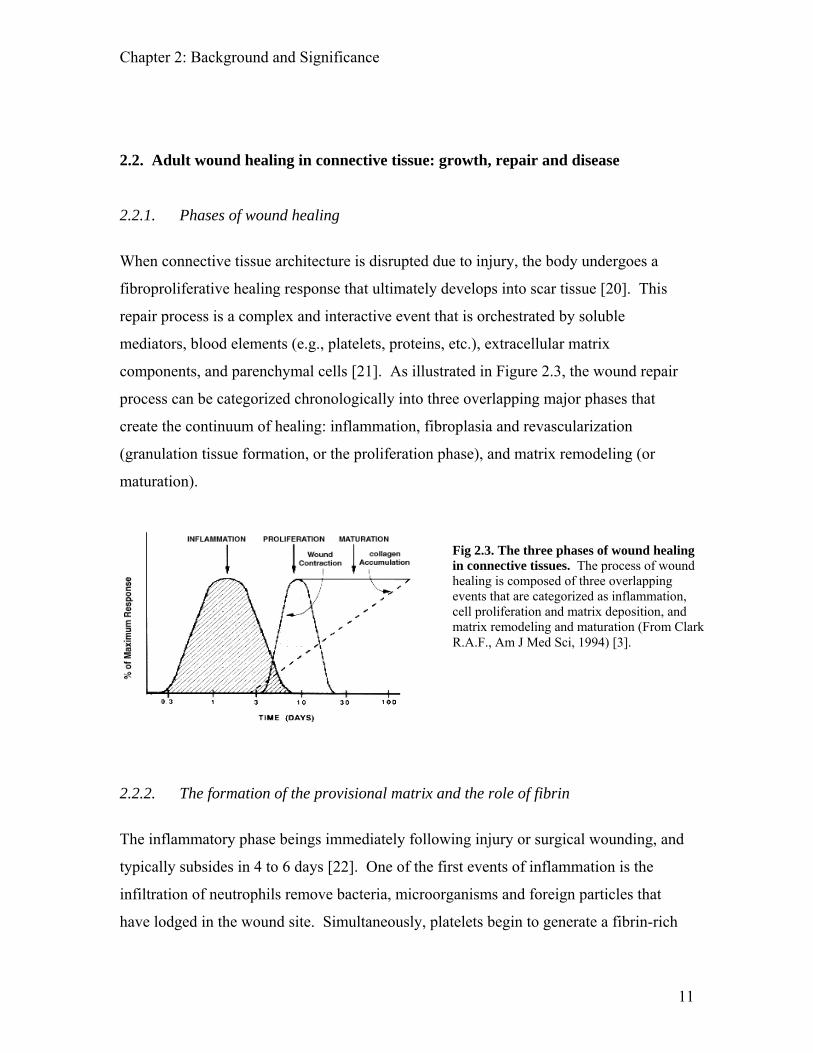
The connective tissue system is primarily composed of resident fibroblasts, extracellular
matrix, and interstitial fluid, although there is also a small population of resident immune
cells such as mast cells and macrophages [6]. Figure 2.1 illustrates the constituents of
connective tissue proper.
Fig. 2.1. Connective tissue underlying the epithelium. Connective tissue contains a variety of cells and extracellular matrix components. The predominant cell type is the fibroblast, which secretes abundant extracellular matrix including elastin, collagen, and components of the ground substance(e.g., hyaluronan, proteoglycans,etc). (From Alberts et. al., Molecular Biology of the Cell, 2002) [1]
8
Chapter 2: Background and Significance
Fibroblasts are the characteristic cell type of differentiated connective tissue, and the
predominant cell type in these tissues. The principal functions of these cells are the
synthesis, secretion and modulation of fibrous and non-fibrous connective tissue proteins
that constitute the extracellular matrix (ECM), a highly organized arrangement of
proteoglycans, collageneous proteins, loose reticular fibers, and elastin [9, 10]. It is
through the molecules that compose the ECM that the essential physical attributes and
biological properties of connective tissues are produced [6]. Collageneous proteins,
primarily collagen type I, form the largest part of the non-aqueous extracellular matrix
and have a very high tensile strength and stiffness that provides the necessary tissue
scaffolding and a reinforcing meshwork for cells. It is the composition and architecture
of collagenous fibers (e.g., content, crosslinks, and orientation) that primarily contribute
to the tensile strength, load-bearing capacity and creep resistance of these tissues [11].
2.1.2. Mechanoregulation in planar soft connective tissues
Soft connective tissues define the shape of the body, and cells within these load bearing
tissues are continuously subjected to a range of internal and external mechanical forces
including gravity, movement, breathing, and heart beat [12, 13]. Soft connective tissues
that are planar in nature (e.g., fascia, dermis, loose connective tissue) are generally loaded
multiaxially [14]; the distribution of these loads is often anisotropic (different magnitudes
along different directions), heterogeneous, and have local gradients of strain magnitude
[15, 16]. Connective tissues must therefore be able to withstand a diverse range of
mechanical forces and respond robustly and reversibly to the deformations caused by
these forces.
The internal and external forces imparted on these tissues are generated passively by
components in the matrix, and actively by cells to create a tension across the tissue. For
example, the mechanical state of the dermis is such that internal forces create a passive
tension across collagen fibers, and are directed along Langer’s lines (lines of tension
across the dermis) [17]. The active component of tension is produced via fibroblast
9

Chapter 2: Background and Significance
cytoskeletal tension and contraction of collagen fibers in the extracellular matrix [18].
External forces applied to connective tissues also change the mechanical state of the
tissue through several mechanisms including fibroblast-fibroblast interactions in the
dermis, fibroblast-ECM interactions, and ECM-ECM interactions [12]. The mechanical
state of the dermis is illustrated in Figure 2.2.
Fig. 2.2. Internal and external force transmission in the dermis. Tension in the dermis arises from deformation of collagen fibrils that are oriented virtually parallel to Langer’s lines. Internal forces in the dermis are composed of passive tension distributed across collagen fiber networks, and active cellular tension that is produced by fibroblasts. (From Silver et al., Skin Res Technol, 2003) [2]
These deformations also act as mechanical cues that are essential for the physical
maintenance and management of these tissues. In addition, mechanical loads also play a
particularly important role in dictating the outcomes of wound healing and tissue repair
[11]. It has been long known that mechanical tension generated during wound healing
regulates fibroblast tractional forces and are responsible for, in part, driving the wound
healing response towards either a positive or pathological outcome (e.g., wound closure
vs. excessive contracture) [19]. These cues regulate cellular remodeling activity that
ultimately guides the overall architecture of the tissue. In the case of dermal wound
healing, the formation of scar tissue is characterized by the alignment of these collagen
fibers in the direction of principal strain. This difference is distinct from the “basket
woven” structure that enable tissues to withstand loads in multiple orientations in native
dermis; the alignment of collagen fibrins seen in scar tissue reduces the capacity of these
tissue to withstand the multiaxial loads seen in vivo [2].
10
Chapter 2: Background and Significance
2.2. Adult wound healing in connective tissue: growth, repair and disease
2.2.1. Phases of wound healing
When connective tissue architecture is disrupted due to injury, the body undergoes a
fibroproliferative healing response that ultimately develops into scar tissue [20]. This
repair process is a complex and interactive event that is orchestrated by soluble
mediators, blood elements (e.g., platelets, proteins, etc.), extracellular matrix
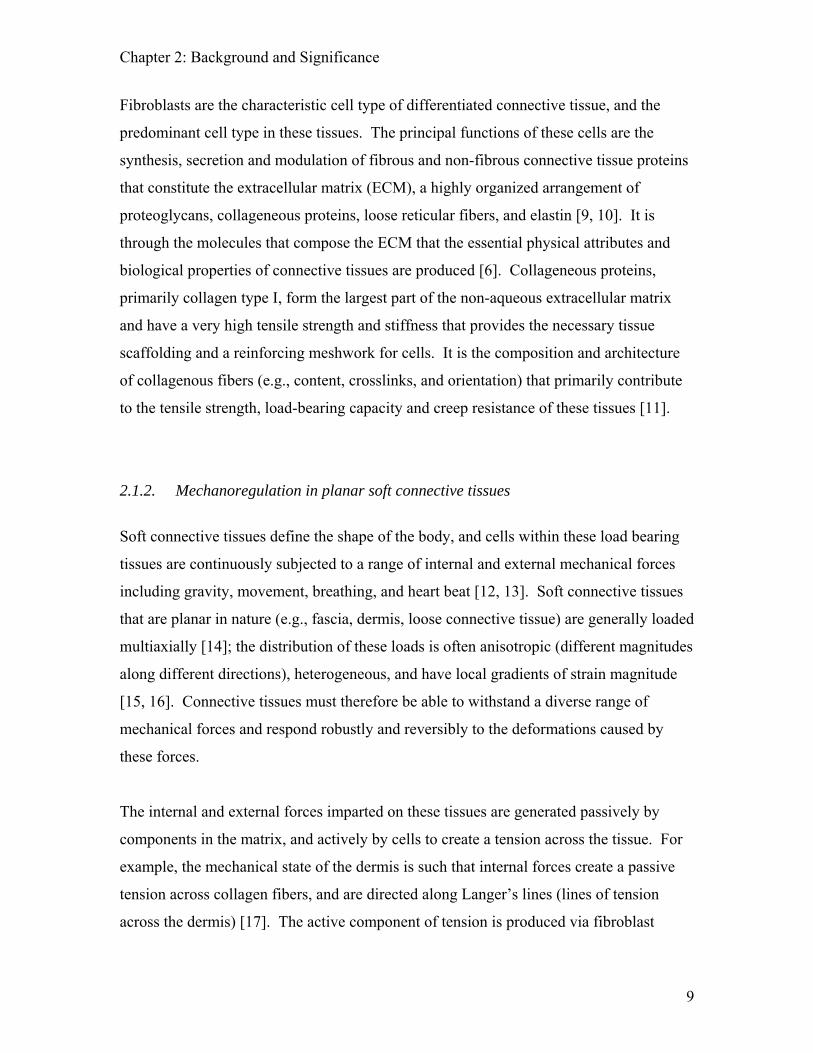
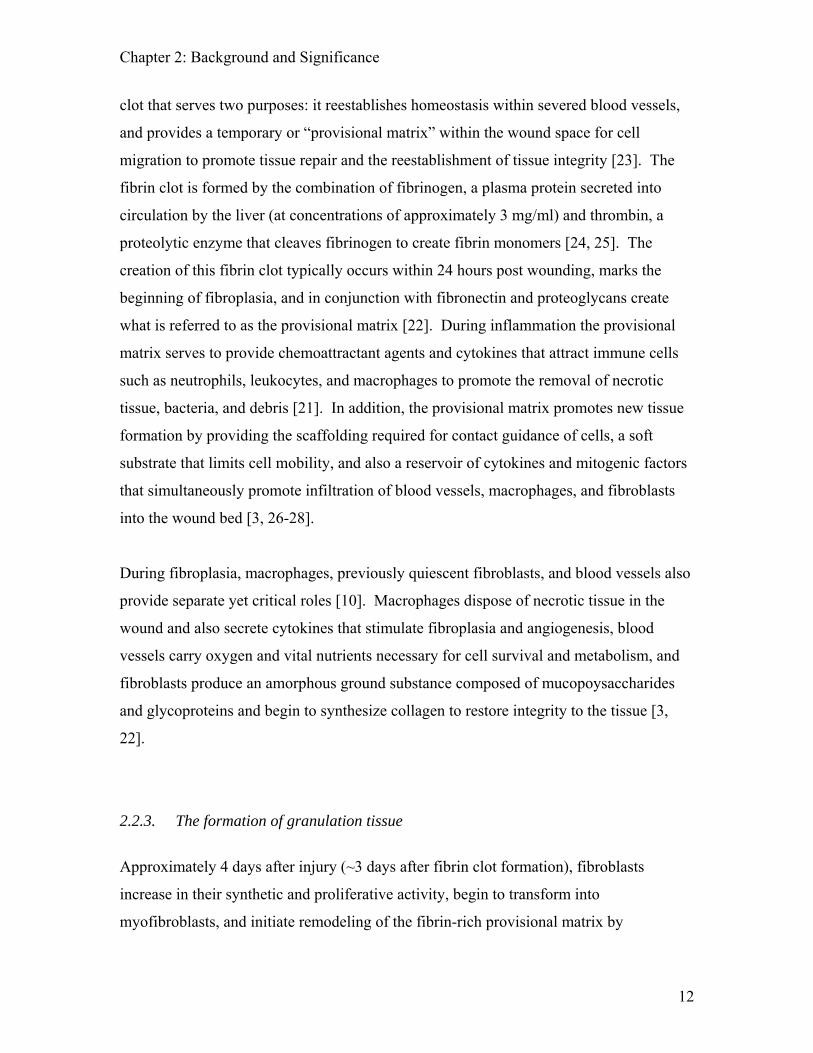
components, and parenchymal cells [21]. As illustrated in Figure 2.3, the wound repair
process can be categorized chronologically into three overlapping major phases that
create the continuum of healing: inflammation, fibroplasia and revascularization
(granulation tissue formation, or the proliferation phase), and matrix remodeling (or
maturation).
Fig 2.3. The three phases of wound healing in connective tissues. The process of wound healing is composed of three overlapping events that are categorized as inflammation, cell proliferation and matrix deposition, and matrix remodeling and maturation (From Clark R.A.F., Am J Med Sci, 1994) [3].
2.2.2. The formation of the provisional matrix and the role of fibrin
The inflammatory phase beings immediately following injury or surgical wounding, and
typically subsides in 4 to 6 days [22]. One of the first events of inflammation is the
infiltration of neutrophils remove bacteria, microorganisms and foreign particles that
have lodged in the wound site. Simultaneously, platelets begin to generate a fibrin-rich
11
Chapter 2: Background and Significance
clot that serves two purposes: it reestablishes homeostasis within severed blood vessels,
and provides a temporary or “provisional matrix” within the wound space for cell
migration to promote tissue repair and the reestablishment of tissue integrity [23]. The
fibrin clot is formed by the combination of fibrinogen, a plasma protein secreted into
circulation by the liver (at concentrations of approximately 3 mg/ml) and thrombin, a
proteolytic enzyme that cleaves fibrinogen to create fibrin monomers [24, 25]. The
creation of this fibrin clot typically occurs within 24 hours post wounding, marks the
beginning of fibroplasia, and in conjunction with fibronectin and proteoglycans create
what is referred to as the provisional matrix [22]. During inflammation the provisional
matrix serves to provide chemoattractant agents and cytokines that attract immune cells
such as neutrophils, leukocytes, and macrophages to promote the removal of necrotic
tissue, bacteria, and debris [21]. In addition, the provisional matrix promotes new tissue
formation by providing the scaffolding required for contact guidance of cells, a soft
substrate that limits cell mobility, and also a reservoir of cytokines and mitogenic factors
that simultaneously promote infiltration of blood vessels, macrophages, and fibroblasts
into the wound bed [3, 26-28].
During fibroplasia, macrophages, previously quiescent fibroblasts, and blood vessels also
provide separate yet critical roles [10]. Macrophages dispose of necrotic tissue in the
wound and also secrete cytokines that stimulate fibroplasia and angiogenesis, blood
vessels carry oxygen and vital nutrients necessary for cell survival and metabolism, and
fibroblasts produce an amorphous ground substance composed of mucopoysaccharides
and glycoproteins and begin to synthesize collagen to restore integrity to the tissue [3,
22].
2.2.3. The formation of granulation tissue
Approximately 4 days after injury (~3 days after fibrin clot formation), fibroblasts
increase in their synthetic and proliferative activity, begin to transform into
myofibroblasts, and initiate remodeling of the fibrin-rich provisional matrix by
12
Chapter 2: Background and Significance
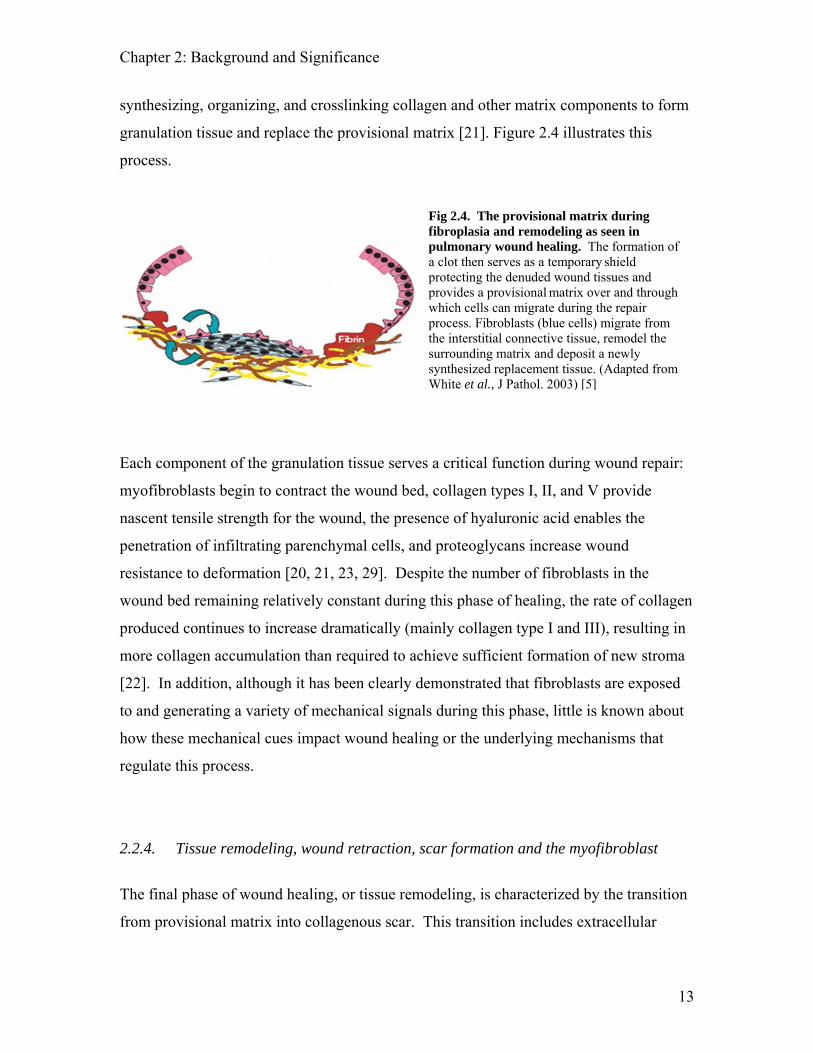
synthesizing, organizing, and crosslinking collagen and other matrix components to form
granulation tissue and replace the provisional matrix [21]. Figure 2.4 illustrates this
process.
Fig 2.4. The provisional matrix during fibroplasia and remodeling as seen in pulmonary wound healing. The formation of a clot then serves as a temporary shield protecting the denuded wound tissues and provides a provisional matrix over and through which cells can migrate during the repair
process. Fibroblasts (blue cells) migrate from the interstitial connective tissue, remodel the surrounding matrix and deposit a newly synthesized replacement tissue. (Adapted from White et al., J Pathol. 2003) [5]
Each component of the granulation tissue serves a critical function during wound repair:
myofibroblasts begin to contract the wound bed, collagen types I, II, and V provide
nascent tensile strength for the wound, the presence of hyaluronic acid enables the
penetration of infiltrating parenchymal cells, and proteoglycans increase wound
resistance to deformation [20, 21, 23, 29]. Despite the number of fibroblasts in the
wound bed remaining relatively constant during this phase of healing, the rate of collagen
produced continues to increase dramatically (mainly collagen type I and III), resulting in
more collagen accumulation than required to achieve sufficient formation of new stroma
[22]. In addition, although it has been clearly demonstrated that fibroblasts are exposed
to and generating a variety of mechanical signals during this phase, little is known about
how these mechanical cues impact wound healing or the underlying mechanisms that
regulate this process.
2.2.4. Tissue remodeling, wound retraction, scar formation and the myofibroblast
The final phase of wound healing, or tissue remodeling, is characterized by the transition
from provisional matrix into collagenous scar. This transition includes extracellular
13
Chapter 2: Background and Significance
matrix remodeling, wound contraction, cell maturation, and cell apoptosis [21]. In
response to mechanical and biochemical cues, the collagen fibers increase in size and
number, align in the direction of tension, and are arranged into bundles [21]. The
remodeling process results in a dramatic compaction of the matrix by resident cells
(fibroblasts and myofibroblasts) and in an increase in the tensile strength and stiffness of
the scar [20, 30]. During this time, fibrillar collagen has accumulated relatively rapidly
and has been remodeling coordinately with myofibroblast-driven contraction. Despite
this increase in collagen content, fully mature scar tissue is at maximum only 70% as
strong as the native tissue it replaces [21].
Fibroblasts undergo several phenotypic shifts during granulation tissue formation and
remodeling that continually modify their interactive relationship with the extracellular
matrix. During the first phase of healing fibroblasts assume a migratory phenotype, and
after 2-3 weeks, a proportion of these fibroblasts modulate into myofibroblasts, a
profibrotic and contractile phenotype. Wound contraction is primarily thought to be
ascribed to myofibroblasts, the most numerous cells in mature granulation tissue.
Myofibroblasts are known to align within the wound along the lines of contraction.
Interestingly, although fibroblast generated contractile forces are at equal levels in all
wounds during this phase, the shape of the wound will dictate the resultant speed of
contraction: linear wounds contract rapidly, rectangular wounds contract at a moderate
pace, and circular wounds contract slowly [23].
The fibroblast-to-myofibroblast conversion is triggered by growth factors such as TGF-β
and mechanical cues related to the forces resisting contraction [31, 32]. Myofibroblasts
produce abundant collagen types I and III and impart tractional forces on the surrounding
tissue to reduce the size of the wound bed [33, 34]. The myofibroblast phenotype is
characterized by the presence of stress fibers, bundles of F-actin thought to be the force
generating element involved in wound contraction and retractile phenomena found in
fibrotic disease, the expression the cytoskeletal marker α-SMA , and the initiation of
novel cell-cell (gap junctions) and cell-matrix linkages (the fibronexus) not seen in
quiescent fibroblasts in vivo [34-41]. The fibronexus (supermature focal adhesion) uses
14
Chapter 2: Background and Significance
transmembrane integrins to link intracellular actin with extracellular fibronectin domains.
Functionally this provides a mechanotransduction system capable to transmitting the
force that is generated by stress fibers in myofibroblasts to the surrounding extracellular
matrix [42].
2.2.5. Connective tissue pathology
Myofibroblasts are essential for appropriate wound healing, but in excess are associated
with a variety of connective tissue diseases. When normal wound healing repair
mechanisms become deregulated, fibrosis or wound contracture can develop.
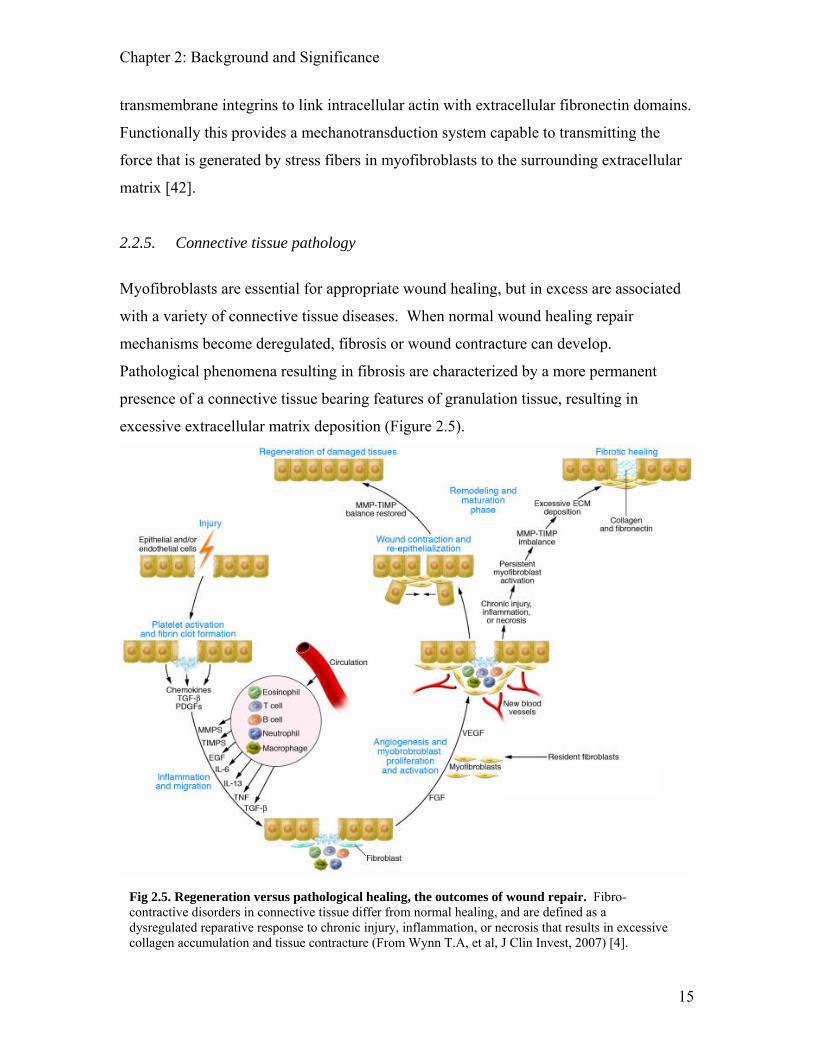
Pathological phenomena resulting in fibrosis are characterized by a more permanent
presence of a connective tissue bearing features of granulation tissue, resulting in
excessive extracellular matrix deposition (Figure 2.5).
Fig 2.5. Regeneration versus pathological healing, the outcomes of wound repair. Fibro-contractive disorders in connective tissue differ from normal healing, and are defined as a dysregulated reparative response to chronic injury, inflammation, or necrosis that results in excessive collagen accumulation and tissue contracture (From Wynn T.A, et al, J Clin Invest, 2007) [4].
15

Chapter 2: Background and Significance
Fibrocontractive disorders in connective tissue are defined as a dysregulated reparative
response to injury that results in excessive collagen accumulation and tissue contracture
[4]. Fibrosis is defined as excessive collagen accumulation, developing from the
imbalance of collagen deposition and catabolism. Contracture is the overcompensation
of wound closure, associated with an increase in tissue stiffness, reduced range of motion,
undesirable aesthetics, patient discomfort, and in some cases severe deformity [23].
These disorders can impact virtually every organ system and therefore present some of
the most taxing clinical problems in medicine [43, 44]. Examples include tissue
retraction, burn contracture, hypertrophic scarring, keloid formation, liver cirrhosis,
kidney and pulmonary fibrosis, chronic asthma, heart disease, scleroderma,
fibromastoses, atherosclerosis, and fibrosing alveolitis [45-47]. These diseases can be
inherited or acquired, and come from a variety of sources including reactions to surgical
materials, mechanical or thermal trauma, abnormal mechanical loading conditions,
chemical or electrical burns, autoimmune diseases or inflammatory disorders, sepsis,
degenerative and congenital disease, or heritable disorders such as Dupuytren’s disease
[6, 11]. Abnormal loading conditions in connective tissue could result from material
property mismatch (e.g., the addition of a stiff inclusion such as a prosthetic or fibrotic
foci formation in soft tissue) [48], trauma [49], aging [50], or degradative diseases such
as emphysema [51, 52]. Regardless of etiology, the end result of these diseases is loss of
tissue function. It is our hope that a better under standing of fibroblast mechanobiology
will lead to therapies to mitigate mechanically-induced fibrosis.
2.2.6. Impact of mechanical loading during wound healing in vivo
Clinicians and researchers have long recognized that applying external forces during
connective tissue wound healing can enable the manipulation of healing rates and can
alter the appearance, mechanical and biochemical properties of scar tissue [23]. Some
examples of external loading (i.e., mechanical conditioning) include serial casting, VAC
16
Chapter 2: Background and Significance
pressure usage, massage, dynamic splints, deep tissue massage, serial casting, z-plasty,
range of motion exercises, ambulation, and stretching techniques.
Several animal studies have also shown that mechanically loading healing wounds
produces a thinner, stronger, more compliant scar with a reduced incidence of contracture
[53-56]. In these studies that utilized uniaxial stretch, a marked increase in fiber
alignment in the predominant direction of stretch is observed [57], paralleling a striking
increase in the stiffness [58] and tensile strength of the tissue [59-61]. For tissues such as
tendons, fiber alignment induced by uniaxial stretch is a potentially beneficial and
desirable result [62]. In planar tissues however, a highly aligned matrix is undesirable as
it reduces the capacity of tissue to withstand multiaxially loading present in connective
tissues, and could result in an even greater reduction in range of motion for the patient.
Alternatively, biaxial stretching more closely models mechanical environment of planar
tissues and appears to result in a more uniform angular distribution of collagen fibers in
vivo [54, 62, 63].
2.2.7. The production of non-physiological stretch levels and fibrotic tissue
propagation
Abnormal mechanical loading conditions (e.g., hypertension) can alter cellular function
and change the structure and composition of the ECM, eventually leading to organ
pathologies such as fibrosis or contracture [11]. Clinically undesirable results have been
attributed to the application of stretch including hypertrophic scarring, edema, and scar
lengthening and widening [64, 65]. It has been hypothesized that the outcome of wound
repair could be related to the method of mechanical loading such as the amount (i.e,
magnitude), length of time (i.e., duration), and direction that the stretch stimulus is
applied [11, 61]. Clearly, establishing optimal loading regimens that promote the desired
aspects of healing without stimulating detrimental side effects would be beneficial in skin
and other connective tissues.
17
Chapter 2: Background and Significance
Clinical interventions such as the inclusion of a catheter, a tissue biopsy, or the insertion
of a rigid device also can dramatically alter the local environment of the tissue by
producing non-physiological stress conditions across the wound bed [66]. As the
mechanical environment of the connective tissue is dramatically altered during clinical
intervention and disease states, the resulting changes in strain levels could play a critical
role in disease progression. Even minimally invasive technologies such as stent
deployment can produce large strain gradients upon global stretching of connective
tissue. These large deformations could potentially lead to fibrotic remodeling
surrounding the stiff inclusion, pathological alterations in tissue composition and
architecture, and ultimately promote a progressive and self-sustaining fibrotic process as
seen during intimal hyperplasia and idiopathic pulmonary fibrosis [48].
2.2.8. Cyclic stretch regulates fibroblast behavior in 2D systems
To investigate how these mechanical signals found in vivo regulate cell behavior in a
simple and controlled environment, cells are often plated on an elastic membrane that is
deformed as homogenously as possible. In vitro stretching devices can generally be
grouped into three classes: uniaxial [67-78], strip biaxial [79], or equibiaxial [72, 80, 81].
These devices are typically motor driven systems that apply stretch in either in one
direction (uniaxial), held tight in one axis while deformed in the transverse axis (strip
biaxial stretch, termed ‘pure uniaxial stretch), or stretched equally in all directions in the
x-y plane (equibiaxial). Examples for each of these loading systems are included in
Figure 2.6.
18

Chapter 2: Background and Significance
a)
b) c)
Fig. 2.6. Methods of mechanical stimulation. A) Strip biaxial: unidirected stretch with one axis held stationary [79] (From Lee, E. J.et al., Ann Biomed Eng, 2007), b) Uniaxial: one axis deformed while the alternative axis stretches inward due to Poisson effect (From Clark, C. B.Rev of Scie Instr, 2001)[70], and c) Equibiaxial: substrate is stretched uniformly (isotropically) in all directions [82] (From Balestrini et al., J Biomech, 2006).
These studies have demonstrated the profound impact of uniaxial stretch on cellular
function including changes in ion transport [11], release of secondary messengers[11],
cell shape [83], reorientation of fibroblasts and smooth muscles [84], increases in
proliferation rates [85-87], alteration of migratory behavior [88], and changes in the
expression and synthesis of a variety of contractile and regulatory proteins [86, 87, 89]
including growth factor production [77, 85]. In addition, there is evidence to suggest that
stretch-dependent cell behavior is dependent on the magnitude [68, 77, 80, 83, 84, 90,
91], duration [76, 84, 92], and frequency [68, 81, 93] of the mechanical conditioning.
19
Chapter 2: Background and Significance
Several cell types including fibroblasts and smooth muscle cells have been shown to
align to the direction of minimum strain in 2D systems. In a uniaxially stretched system,
the principal strains are along the stretch and perpendicular directions due to tensile and
compressive forces; cell orientation in 2D is slightly off axis due to negative transverse
strain produced by the Poisson effect [72, 88]. In strip biaxial systems minimum
principal strain is perpendicular to the direction of pure uniaxial stretch [94], and cells
orient themselves perpendicular to the direction of stretch. As there is no principal strain
direction in a true equibiaxial stretch system, cells do not have any preferred orientation.
Although the aboveformentioned research has provided much insight into the mechano-
regulation of individual cells, these systems can not accurately mimic the governing
biochemical and mechanical cues occurring between fibroblasts and their environment
during cell-mediated extracellular matrix remodeling [95]. The mechanical environment
of the connective tissue is composed not only of individual cell contributions but also
contributions between cells and their surrounding extracellular matrix [95] and from the
growth factor milieu in which they are bathed [96]. The relationship between fibroblasts
and the extracellular matrix is a complex interaction involving feedback control between
fibroblasts, cytokines, fibrinolysis enzymes, and the extracellular matrix; the fibroblasts
are the primary effector cell responsible for the creation of the extracellular matrix, and
the extracellular matrix itself regulates fibroblastic function, including fibroblast ability
to synthesize, deposit, and remodel the extracellular matrix. Therefore, only a three-
dimensional model can provide this complex and interactive relationship in vitro.
2.3. Current 3D in vitro models of wound healing
2.3.1. 3D in vitro systems for use in mechanobiology
To investigate cell-mediated remodeling and wound contraction in a controlled mechano-
chemical environment, in vitro three-dimensional wound healing models such as cell-
populated collagen and fibrin gels have been utilized extensively [25, 30, 97-100]. Type
20
Chapter 2: Background and Significance
I collagen gels, typically purified rat tail collagen, are commonly used in many standard
in vitro 3D models such as fibroblast contraction and migration [97, 101], angiogenesis
invasion [102, 103], vasculargenesis [104], and macrophage migration [105, 106].
Collagen gels are also a commonly used model of granulation tissue formation, and as
collagen type I is the most abundant fibrous protein of interstitial tissue (e.g., dermis,
pulmonary tissue, etc.) it is often utilized as a model of disease persistence within these
tissues [107, 108]. The external and intrinsic tensile forces acting on and exerted by
wound fibroblasts before, during, and after wound contraction have been studied in
collagen gel model systems [96]. For example, potential signals that regulate wound
contraction are analyzed by releasing mechanically stressed anchored gels from their
substrate attachments to simulate the loss of resistance after a wound has closed [96, 108,
109].
As fibrin is the primary component in healing wounds during fibroplasia and is also
involved in inflammation cascades, angiogenesis, and the abnormal growth of tissue
(neoplasia), these matrices are most often utilized to model the early stages of wound
healing and disease onset. Fibrin gels are typically composed of fibrinogen (2-4 mg/ml),
thrombin, and a cellular solution [25, 110]. Studies utilizing these model systems include
the investigation of cell migration, angiogenesis and gel contraction [24-26, 111-115].
2.3.2. 3D models for use in tissue engineering and regenerative medicine
Cellularized collagen and fibrin gels are “living biomaterials” that not only provide a
means for researching fundamental relationships in matrix mechanics and wound healing,
but also potentially provide viable tissue analogs for regenerative medicine [116]. In
order to completely restore functionality in diseased tissue, it is necessary to utilize tissue
analogs that either intrinsically retain or can be manipulated to have comparable strength,
density and ECM composition to native tissue.
Currently, collagen gels are the most commonly used biopolymers in tissue engineering;
however, these tissue analogs lack sufficient mechanical integrity and composition for
21
Chapter 2: Background and Significance
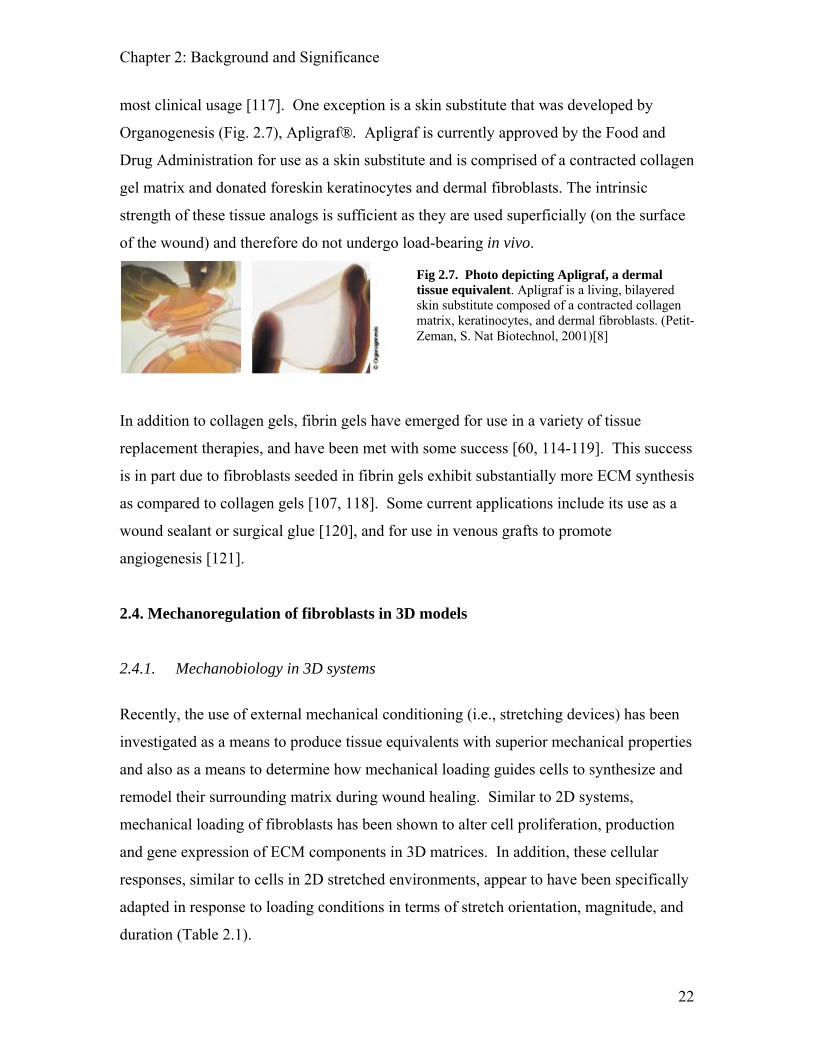
most clinical usage [117]. One exception is a skin substitute that was developed by
Organogenesis (Fig. 2.7), Apligraf®. Apligraf is currently approved by the Food and
Drug Administration for use as a skin substitute and is comprised of a contracted collagen
gel matrix and donated foreskin keratinocytes and dermal fibroblasts. The intrinsic
strength of these tissue analogs is sufficient as they are used superficially (on the surface
of the wound) and therefore do not undergo load-bearing in vivo.
Fig 2.7. Photo depicting Apligraf, a dermal tissue equivalent. Apligraf is a living, bilayered skin substitute composed of a contracted collagen matrix, keratinocytes, and dermal fibroblasts. (Petit-Zeman, S. Nat Biotechnol, 2001)[8]
In addition to collagen gels, fibrin gels have emerged for use in a variety of tissue
replacement therapies, and have been met with some success [60, 114-119]. This success
is in part due to fibroblasts seeded in fibrin gels exhibit substantially more ECM synthesis
as compared to collagen gels [107, 118]. Some current applications include its use as a
wound sealant or surgical glue [120], and for use in venous grafts to promote
angiogenesis [121].
2.4. Mechanoregulation of fibroblasts in 3D models
2.4.1. Mechanobiology in 3D systems
Recently, the use of external mechanical conditioning (i.e., stretching devices) has been
investigated as a means to produce tissue equivalents with superior mechanical properties
and also as a means to determine how mechanical loading guides cells to synthesize and
remodel their surrounding matrix during wound healing. Similar to 2D systems,
mechanical loading of fibroblasts has been shown to alter cell proliferation, production
and gene expression of ECM components in 3D matrices. In addition, these cellular
responses, similar to cells in 2D stretched environments, appear to have been specifically
adapted in response to loading conditions in terms of stretch orientation, magnitude, and
duration (Table 2.1).
22
Chapter 2: Background and Significance
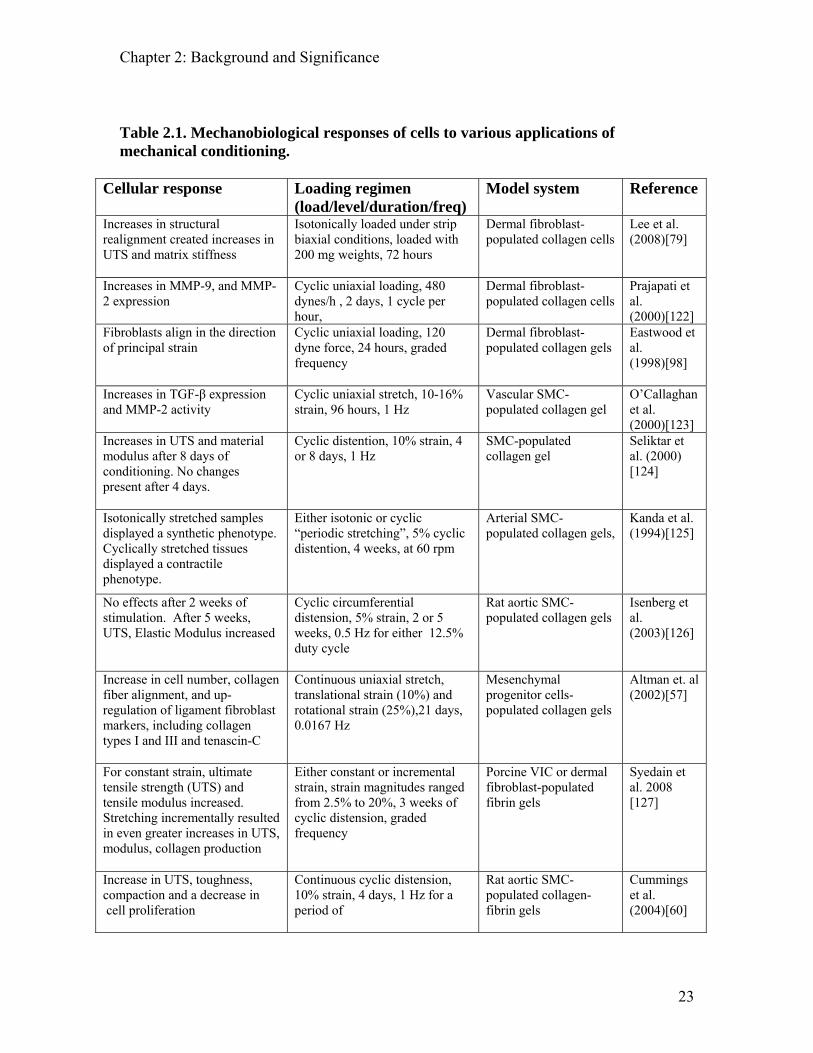
Table 2.1. Mechanobiological responses of cells to various applications of mechanical conditioning.
Cellular response Loading regimen (load/level/duration/freq)
Model system Reference
Increases in structural realignment created increases in UTS and matrix stiffness
Isotonically loaded under strip biaxial conditions, loaded with 200 mg weights, 72 hours
Dermal fibroblast-populated collagen cells
Lee et al. (2008)[79]
Increases in MMP-9, and MMP-2 expression
Cyclic uniaxial loading, 480 dynes/h , 2 days, 1 cycle per hour,
Dermal fibroblast-populated collagen cells
Prajapati et al. (2000)[122]
Fibroblasts align in the direction of principal strain
Cyclic uniaxial loading, 120 dyne force, 24 hours, graded frequency
Dermal fibroblast-populated collagen gels
Eastwood et al. (1998)[98]
Increases in TGF-β expression and MMP-2 activity
Cyclic uniaxial stretch, 10-16% strain, 96 hours, 1 Hz
Vascular SMC-populated collagen gel
O’Callaghan et al. (2000)[123]
Increases in UTS and material modulus after 8 days of conditioning. No changes present after 4 days.
Cyclic distention, 10% strain, 4 or 8 days, 1 Hz
SMC-populated collagen gel
Seliktar et al. (2000) [124]
Isotonically stretched samples displayed a synthetic phenotype. Cyclically stretched tissues displayed a contractile phenotype.
Either isotonic or cyclic “periodic stretching”, 5% cyclic distention, 4 weeks, at 60 rpm
Arterial SMC-populated collagen gels,
Kanda et al. (1994)[125]
No effects after 2 weeks of stimulation. After 5 weeks, UTS, Elastic Modulus increased
Cyclic circumferential distension, 5% strain, 2 or 5 weeks, 0.5 Hz for either 12.5% duty cycle
Rat aortic SMC-populated collagen gels
Isenberg et al. (2003)[126]
Increase in cell number, collagen fiber alignment, and up-regulation of ligament fibroblast markers, including collagen types I and III and tenascin-C
Continuous uniaxial stretch, translational strain (10%) and rotational strain (25%),21 days, 0.0167 Hz
Mesenchymal progenitor cells-populated collagen gels
Altman et. al (2002)[57]
For constant strain, ultimate tensile strength (UTS) and tensile modulus increased. Stretching incrementally resulted in even greater increases in UTS, modulus, collagen production
Either constant or incremental strain, strain magnitudes ranged from 2.5% to 20%, 3 weeks of cyclic distension, graded frequency
Porcine VIC or dermal fibroblast-populated fibrin gels
Syedain et al. 2008 [127]
Increase in UTS, toughness, compaction and a decrease in cell proliferation
Continuous cyclic distension, 10% strain, 4 days, 1 Hz for a period of
Rat aortic SMC-populated collagen-fibrin gels
Cummings et al. (2004)[60]
23

Chapter 2: Background and Significance
The bulk of studies dedicated to investigating mechanical conditioning of tissue has been
performed utilizing uniaxial cyclic stretching systems. Uniaxial stretch has been
demonstrated to stimulate the synthesis and crosslinking of collagen while increasing the
matrix density, fiber alignment, stiffness, and tensile strength in the direction of stretch
[60, 124, 126, 128-130].
Although these results are promising for constructing mechanically competent tissue
equivalents, it is understood that a substantial portion of the observed increase in
mechanical properties is simply due to fiber alignment. It is therefore unclear if changes
in tissue composition and mechanical properties are actually due to cell-mediated matrix
remodeling or if they are simply artifact of passive fiber alignment. Therefore, in order
to begin to understand how mechanical cues govern cell behavior during states of wound
healing and repair, it is important to isolate the effect of mechanical stimulation on cell
activity. In addition, although uniaxial-stretch induced fiber alignment may be highly
beneficial for tissues that are uniaxially loaded or distended such as tendons and blood
vessels, these systems do not accurately model the fiber architecture of planar connective
tissues. One approach to isolating the impact of mechanical loading on cell matrix
remodeling would be to utilize equibiaxial stretch. Equibiaxial stretch systems produce
isotropic strain across the area of interest, and therefore would minimize or eliminate
tissue alignment and simultaneously provide a multiaxially loaded model of planar tissue.
2.4.2. Determining optimal loading conditions for the creation of tissue equivalents for
load bearing applicatoins
Although there is a plethora of information that indicates that stretch is a powerful
regulator of matrix remodeling [69, 119, 131], the bulk of previous research has
narrowly focused on a single level of stretch when investigating stretch-dependent cell
activity. Therefore, the combinations of strain magnitudes, ranges, and durations
investigated thus far are not sufficient to characterize the complex relationships between
mechanical conditioning parameters (magnitude, duration, etc.) and remodeling
parameters (strength, stiffness, alignment, etc.). In addition, applying a single and
24
Chapter 2: Background and Significance
continuous level of strain does not assist in understanding tissue responses to changes in
mechanical environments during growth, repair, and disease states. Quantitative dose-
response curves between stretch parameters and alterations in matrix properties would
assist in the development and rational design of therapies and would also aide in the
understanding and prevention of scarring.
2.4.3. Creating accurate models of planar tissue with non-uniform strain distribution
Strain anisotropy has also been shown to be an important regulator in cell activity [72,
90, 132]. For example, there is substantial evidence to indicate differences in cell
proliferation, shape, orientation, and synthetic activity between fibroblasts stretched
biaxially and uniaxially [67, 94, 133]. In addition to strain orientation, there is evidence
demonstrating that cell synthetic and proliferative activities in two dimensional studies
are regulated by strain magnitude [68, 87, 90, 134]. Despite this knowledge, there is very
little information regarding how cells will respond to gradients of strain as seen in vivo.
Therefore, there is a need to develop a culture system that produces non-uniform strain
patterns for studying the effects of strain magnitude, anisotropy, and gradients on cells
culture.
2.5. Conclusions
Accurate mechanobiological models of planar tissue healing are desired to gain further
insight into the effects of mechanical factors on scarring and the pathophysiology of
diseases such as contracture, hypertrophic scarring, and keloid formation. Furthermore,
these models offer a secondary role as tissue equivalent for use in regenerative medicine.
Understanding tissue responses and cellular adaptations to changing mechanical stresses
in planar tissue will allow for the manipulation of cell behavior within three-dimensional
matrices for custom tailoring of tissue equivalents, assist in minimizing adverse effects of
clinical intervention, and help understand the process of self-sustaining fibrosis (e.g.,
idiopathic pulmonary fibrosis, hypertrophic scarring).
25
Chapter 2: Background and Significance
2.6. References [1] Alberts, B., Johnson, A., Lewis, J., Raff, M., Roberts, K., and Walter, P., 2002,
Molecular Biology of the Cell, Garland Science, New York. [2] Silver, F. H., Siperko, L. M., and Seehra, G. P., 2003, "Mechanobiology of force
transduction in dermal tissue," Skin Res Technol, 9(1), pp. 3-23. [3] Clark, R. A., 1993, "Regulation of fibroplasia in cutaneous wound repair," Am J
Med Sci, 306(1), pp. 42-48. [4] Wynn, T. A., 2007, "Common and unique mechanisms regulate fibrosis in various
fibroproliferative diseases," J Clin Invest, 117(3), pp. 524-529. [5] White, E. S., Lazar, M. H., and Thannickal, V. J., 2003, "Pathogenetic
mechanisms in usual interstitial pneumonia/idiopathic pulmonary fibrosis," J Pathol, 201(3), pp. 343-354.
[6] Gardner, D. L., 1992, "Biology of connective tissue disease," Pathological basis of connective tissue diseases, D. L. Gardner, ed., Lea and Febiger, Philidelphia, PA, pp. 13-120.
[7] Tortora, G. J., and Grabowski, S. R., 2003, "The tissue level of organization," Principles of anatomy and physiology, B. Roesch, ed., John Wiley and Sons, New York, pp. 118-136.
[8] Petit-Zeman, S., 2001, "Regenerative medicine," Nat Biotechnol, 19(3), pp. 201-206.
[9] Goodpaster, T., Legesse-Miller, A., Hameed, M. R., Aisner, S. C., Randolph-Habecker, J., and Coller, H. A., 2008, "An immunohistochemical method for identifying fibroblasts in formalin-fixed, paraffin-embedded tissue," J Histochem Cytochem, 56(4), pp. 347-358.
[10] McClain, S. A., Simon, M., Jones, E., Nandi, A., Gailit, J. O., Tonnesen, M. G., Newman, D., and Clark, R. A., 1996, "Mesenchymal cell activation is the rate-limiting step of granulation tissue induction," Am J Pathol, 149(4), pp. 1257-1270.
[11] Lundon, K., 2006, "Effect of mechanical loading on soft connective tissues," Functional soft tissue examination and treatment by manual methods, W. Hammer, ed., Jones and Bartlett, Sudbury, MA, pp. 13-120.
[12] Silver, F. H., and Siperko, L. M., 2003, "Mechanosensing and mechanochemical transduction: how is mechanical energy sensed and converted into chemical energy in an extracellular matrix?," Crit Rev Biomed Eng, 31(4), pp. 255-331.
[13] Wang, J. H., and Thampatty, B. P., 2006, "An introductory review of cell mechanobiology," Biomech Model Mechanobiol, 5(1), pp. 1-16.
[14] Gilbert, J. A., Weinhold, P. S., Banes, A. J., Link, G. W., and Jones, G. L., 1994, "Strain profiles for circular cell culture plates containing flexible surfaces employed to mechanically deform cells in vitro," J Biomech, 27(9), pp. 1169-1177.
[15] Hashima, A. R., Young, A. A., McCulloch, A. D., and Waldman, L. K., 1993, "Nonhomogeneous analysis of epicardial strain distributions during acute myocardial ischemia in the dog," J Biomech, 26(1), pp. 19-35.
26
Chapter 2: Background and Significance
[16] Oomens, C. W., van Ratingen, M. R., Janssen, J. D., Kok, J. J., and Hendriks, M. A., 1993, "A numerical-experimental method for a mechanical characterization of biological materials," J Biomech, 26(4-5), pp. 617-621.
[17] Chiquet, M., Renedo, A. S., Huber, F., and Fluck, M., 2003, "How do fibroblasts translate mechanical signals into changes in extracellular matrix production?," Matrix Biol, 22(1), pp. 73-80.
[18] Grinnell, F., 2000, "Fibroblast-collagen-matrix contraction: growth-factor signalling and mechanical loading," Trends in Cell Biology, 10(9), pp. 362-365.
[19] Gabbiani, G., 2003, "The myofibroblast in wound healing and fibrocontractive diseases," J Pathol, 200(4), pp. 500-503.
[20] Linares, H. A., 1996, "From wound to scar," Burns, 22(5), pp. 339-352. [21] Clark, R. A. F., 1996, The molecular and cellular biology of wound repair,
Plenum Press, New York. [22] Wilkins, R. B., and Kulwin, D. R., 1979, "Wendell L. Hughes Lecture. Wound
healing," Ophthalmology, 86(4), pp. 507-510. [23] Hardy, M. A., 1989, "The biology of scar formation," Physical Therapy, 69(12),
pp. 1014-1024. [24] Brown, L. F., Lanir, N., McDonagh, J., Tognazzi, K., Dvorak, A. M., and Dvorak,
H. F., 1993, "Fibroblast migration in fibrin gel matrices," Am J Pathol, 142(1), pp. 273-283.
[25] Tuan, T. L., Song, A., Chang, S., Younai, S., and Nimni, M. E., 1996, "In vitro fibroplasia: matrix contraction, cell growth, and collagen production of fibroblasts cultured in fibrin gels," Exp Cell Res, 223(1), pp. 127-134.
[26] Dvorak, H. F., Harvey, V. S., Estrella, P., Brown, L. F., McDonagh, J., and Dvorak, A. M., 1987, "Fibrin containing gels induce angiogenesis. Implications for tumor stroma generation and wound healing," Lab Invest, 57(6), pp. 673-686.
[27] Gailit, J., Clarke, C., Newman, D., Tonnesen, M. G., Mosesson, M. W., and Clark, R. A., 1997, "Human fibroblasts bind directly to fibrinogen at RGD sites through integrin alpha(v)beta3," Exp Cell Res, 232(1), pp. 118-126.
[28] Stirk, C. M., Reid, A., Melvin, W. T., and Thompson, W. D., 2000, "Locating the active site for angiogenesis and cell proliferation due to fibrin fragment E with a phage epitope display library," Gen Pharmacol, 35(5), pp. 261-267.
[29] Roche, W. R., 1990, "Myofibroblasts," J Pathol, 161(4), pp. 281-282. [30] Tomasek, J. J., Haaksma, C. J., Eddy, R. J., and Vaughan, M. B., 1992,
"Fibroblast contraction occurs on release of tension in attached collagen lattices: dependency on an organized actin cytoskeleton and serum," Anatomical Record, 232(3), pp. 359-368.
[31] Desmouliere, A., Geinoz, A., Gabbiani, F., and Gabbiani, G., 1993, "Transforming growth factor-beta 1 induces alpha-smooth muscle actin expression in granulation tissue myofibroblasts and in quiescent and growing cultured fibroblasts," J Cell Biol, 122(1), pp. 103-111.
[32] Grinnell, F., 1994, "Fibroblasts, myofibroblasts, and wound contraction," J Cell Biol, 124(4), pp. 401-404.
[33] Gabbiani, G., Chaponnier, C., and Huttner, I., 1978, "Cytoplasmic filaments and gap junctions in epithelial cells and myofibroblasts during wound healing," J Cell Biol, 76(3), pp. 561-568.
27
Chapter 2: Background and Significance
[34] Welch, M. P., Odland, G. F., and Clark, R. A., 1990, "Temporal relationships of F-actin bundle formation, collagen and fibronectin matrix assembly, and fibronectin receptor expression to wound contraction," J Cell Biol, 110(1), pp. 133-145.
[35] Darby, I., Skalli, O., and Gabbiani, G., 1990, "Alpha-smooth muscle actin is transiently expressed by myofibroblasts during experimental wound healing," Lab Invest, 63(1), pp. 21-29.
[36] Hinz, B., and Gabbiani, G., 2003, "Cell-matrix and cell-cell contacts of myofibroblasts: role in connective tissue remodeling," Thromb Haemost, 90(6), pp. 993-1002.
[37] Hinz, B., and Gabbiani, G., 2003, "Mechanisms of force generation and transmission by myofibroblasts," Curr Opin Biotechnol, 14(5), pp. 538-546.
[38] Hinz, B., Mastrangelo, D., Iselin, C. E., Chaponnier, C., and Gabbiani, G., 2001, "Mechanical tension controls granulation tissue contractile activity and myofibroblast differentiation," Am J Pathol, 159(3), pp. 1009-1020.
[39] Skalli, O., Pelte, M. F., Peclet, M. C., Gabbiani, G., Gugliotta, P., Bussolati, G., Ravazzola, M., and Orci, L., 1989, "Alpha-smooth muscle actin, a differentiation marker of smooth muscle cells, is present in microfilamentous bundles of pericytes," J Histochem Cytochem, 37(3), pp. 315-321.
[40] Skalli, O., Ropraz, P., Trzeciak, A., Benzonana, G., Gillessen, D., and Gabbiani, G., 1986, "A monoclonal antibody against alpha-smooth muscle actin: a new probe for smooth muscle differentiation," J Cell Biol, 103(6 Pt 2), pp. 2787-2796.
[41] Skalli, O., Schurch, W., Seemayer, T., Lagace, R., Montandon, D., Pittet, B., and Gabbiani, G., 1989, "Myofibroblasts from diverse pathologic settings are heterogeneous in their content of actin isoforms and intermediate filament proteins," Lab Invest, 60(2), pp. 275-285.
[42] Desmouliere, A., and Gabbiani, G., 1996, "The role of the myofibroblast in wound healing and fibrocontractive diseases," The molecular and cellular biology of wound repair, R. A. F. Clark, ed., Plenum Press, New York, pp. 391-423.
[43] Desmouliere, A., 1995, "Factors influencing myofibroblast differentiation during wound healing and fibrosis," Cell Biol Int, 19(5), pp. 471-476.
[44] Society, A. T., 2002, "American Thoracic Society/European Respiratory Society International Multidisciplinary Consensus Classification of the Idiopathic Interstitial Pneumonias. This joint statement of the American Thoracic Society (ATS), and the European Respiratory Society (ERS) was adopted by the ATS board of directors, June 2001 and by the ERS Executive Committee, June 2001," Am J Respir Crit Care Med, 165(2), pp. 277-304.
[45] Adler, K. B., Low, R. B., Leslie, K. O., Mitchell, J., and Evans, J. N., 1989, "Contractile cells in normal and fibrotic lung," Lab Invest, 60(4), pp. 473-485.
[46] Appleton, I., Tomlinson, A., Chander, C. L., and Willoughby, D. A., 1992, "Effect of endothelin-1 on croton oil-induced granulation tissue in the rat. A pharmacologic and immunohistochemical study," Lab Invest, 67(6), pp. 703-710.
[47] Thiemermann, C., and Corder, R., 1992, "Is endothelin-1 the regulator of myofibroblast contraction during wound healing?," Lab Invest, 67(6), pp. 677-679.
28
Chapter 2: Background and Significance
[48] Mori, D., David, G., Humphrey, J. D., and Moore, J. E., Jr., 2005, "Stress distribution in a circular membrane with a central fixation," J Biomech Eng, 127(3), pp. 549-553.
[49] Sanders, J. E., Goldstein, B. S., and Leotta, D. F., 1995, "Skin response to mechanical stress: adaptation rather than breakdown--a review of the literature," J Rehabil Res Dev, 32(3), pp. 214-226.
[50] Sugihara, T., Martin, C. J., and Hildebrandt, J., 1971, "Length-tension properties of alveolar wall in man," J Appl Physiol, 30(6), pp. 874-878.
[51] Gefen, A., Elad, D., and Shiner, R. J., 1999, "Analysis of stress distribution in the alveolar septa of normal and simulated emphysematic lungs," J Biomech, 32(9), pp. 891-897.
[52] Maksym, G. N., and Bates, J. H., 1997, "A distributed nonlinear model of lung tissue elasticity," J Appl Physiol, 82(1), pp. 32-41.
[53] Brunius, U., Zederfeldt, B., and Ahren, C., 1967, "Healing of skin incisions closed by non-suture technique. A tensiometric and histologic study in the rat," Acta Chir Scand, 133(7), pp. 509-516.
[54] Langrana, N. A., Alexander, H., Strauchler, I., Mehta, A., and Ricci, J., 1983, "Effect of mechanical load in wound healing," Annals of Plastic Surgery, 10(3), pp. 200-208.
[55] Sussman, M. D., 1966, "Effect of increased tissue traction upon tensile strength of cutaneous incisions in rats," Proceedings of the Society for Experimental Biology and Medicine, 123(1), pp. 38-41.
[56] Thorngate, S., and Ferguson, D. J., 1958, "Effect of tension on healing of aponeurotic wounds," Surgery, 44(4), pp. 619-624.
[57] Altman, G. H., Horan, R. L., Martin, I., Farhadi, J., Stark, P. R., Volloch, V., Richmond, J. C., Vunjak-Novakovic, G., and Kaplan, D. L., 2002, "Cell differentiation by mechanical stress," FASEB J, 16(2), pp. 270-272. Epub 2001 Dec 2028.
[58] Calve, S., Syed, F. N., Dennis, R. G., Grosh, K., Garikipati, K., and Arruda, E. M., 2005, "Mechanical Characterization of Growth in Fibrin-Based Tendon Constructs," Summer Bioengineering Conference, ASME, Vail, Colorado.
[59] Grenier, G., Remy-Zolghadri, M., Larouche, D., Gauvin, R., Baker, K., Bergeron, F., Dupuis, D., Langelier, E., Rancourt, D., Auger, F. A., and Germain, L., 2005, "Tissue reorganization in response to mechanical load increases functionality," Tissue Eng, 11(1-2), pp. 90-100.
[60] Cummings, C. L., Gawlitta, D., Nerem, R. M., and Stegemann, J. P., 2004, "Properties of engineered vascular constructs made from collagen, fibrin, and collagen-fibrin mixtures," Biomaterials, 25(17), pp. 3699-3706.
[61] Seliktar, D., Black, R. A., Vito, R. P., and Nerem, R. M., 2000, "Dynamic mechanical conditioning of collagen-gel blood vessel constructs induces remodeling in vitro," Ann Biomed Eng, 28(4), pp. 351-362.
[62] Timmenga, E. J., Schoorl, R., and Klopper, P. J., 1990, "Biomechanical and histomorphological changes in expanded rabbit skin," Br J Plast Surg, 43(1), pp. 101-106.
29
Chapter 2: Background and Significance
[63] Timmenga, E. J., and Das, P. K., 1992, "Histomorphological observations on dermal repair in expanded rabbit skin: a preliminary report," Br J Plast Surg, 45(7), pp. 503-507.
[64] Arem, A. J., and Madden, J. W., 1976, "Effects of stress on healing wounds: I. Intermittent noncyclical tension," Journal of Surgical Research, 20(2), pp. 93-102.
[65] Sommerlad, B. C., and Creasey, J. M., 1978, "The stretched scar: a clinical and histological study," British Journal of Plastic Surgery, 31(1), pp. 34-45.
[66] Junker, J. P., Kratz, C., Tollback, A., and Kratz, G., 2008 "Mechanical tension stimulates the transdifferentiation of fibroblasts into myofibroblasts in human burn scars," Burns, pp. 0305-4179.
[67] Berry, C. C., Cacou, C., Lee, D. A., Bader, D. L., and Shelton, J. C., 2003, "Dermal fibroblasts respond to mechanical conditioning in a strain profile dependent manner," Biorheology, 40(1-3), pp. 337-345.
[68] Boccafoschi, F., Bosetti, M., Gatti, S., and Cannas, M., 2007, "Dynamic fibroblast cultures: response to mechanical stretching," Cell Adh Migr, 1(3), pp. 124-128.
[69] Boerboom, R. A., Rubbens, M. P., Driessen, N. J., Bouten, C. V., and Baaijens, F. P., 2008, "Effect of strain magnitude on the tissue properties of engineered cardiovascular constructs," Ann Biomed Eng, 36(2), pp. 244-253.
[70] Clark, C. B., Burkholder, T. J., and Frangos, J. A., 2001, "Uniaxial strain system to investigate strain rate regulation in vitro," Rev of Scie Instr, 72(5), pp. 2415-2422.
[71] Kaunas, R., Nguyen, P., Usami, S., and Chien, S., 2005, "Cooperative effects of Rho and mechanical stretch on stress fiber organization," Proc Natl Acad Sci U S A, 102(44), pp. 15895-15900.
[72] Mudera, V. C., Pleass, R., Eastwood, M., Tarnuzzer, R., Schultz, G., Khaw, P., McGrouther, D. A., and Brown, R. A., 2000, "Molecular responses of human dermal fibroblasts to dual cues: contact guidance and mechanical load," Cell Motil Cytoskeleton, 45(1), pp. 1-9.
[73] Prajapati, R. T., Eastwood, M., and Brown, R. A., 2000, "Duration and orientation of mechanical loads determine fibroblast cyto-mechanical activation: monitored by protease release," Wound Repair and Regeneration, 8(3), pp. 238-246.
[74] Tower, T. T., Neidert, M. R., and Tranquillo, R. T., 2002, "Fiber alignment imaging during mechanical testing of soft tissues," Ann Biomed Eng, 30(10), pp. 1221-1233.
[75] Wakatsuki, T., Kolodney, M. S., Zahalak, G. I., and Elson, E. L., 2000, "Cell mechanics studied by a reconstituted model tissue," Biophys J, 79(5), pp. 2353-2368.
[76] Wang, J. G., Miyazu, M., Matsushita, E., Sokabe, M., and Naruse, K., 2001, "Uniaxial cyclic stretch induces focal adhesion kinase (FAK) tyrosine phosphorylation followed by mitogen-activated protein kinase (MAPK) activation," Biochem Biophys Res Commun, 288(2), pp. 356-361.
[77] Yang, G., Crawford, R. C., and Wang, J. H., 2004, "Proliferation and collagen production of human patellar tendon fibroblasts in response to cyclic uniaxial stretching in serum-free conditions," J Biomech, 37(10), pp. 1543-1550.
30
Chapter 2: Background and Significance
[78] Yost, M. J., Simpson, D., Wrona, K., Ridley, S., Ploehn, H. J., Borg, T. K., and Terracio, L., 2000, "Design and construction of a uniaxial cell stretcher," Am J Physiol Heart Circ Physiol, 279(6), pp. H3124-3130.
[79] Lee, E. J., Holmes, J. W., and Costa, K. D., 2008, "Remodeling of engineered tissue anisotropy in response to altered loading conditions," Ann Biomed Eng, 36(8), pp. 1322-1334.
[80] Lee, A. A., Delhaas, T., McCulloch, A. D., and Villarreal, F. J., 1999, "Differential responses of adult cardiac fibroblasts to in vitro biaxial strain patterns," J Mol Cell Cardiol, 31(10), pp. 1833-1843.
[81] Nishimura, K., Blume, P., Ohgi, S., and Sumpio, B. E., 2007, "Effect of different frequencies of tensile strain on human dermal fibroblast proliferation and survival," Wound Repair Regen, 15(5), pp. 646-656.
[82] Balestrini, J. L., and Billiar, K. L., 2006, "Equibiaxial cyclic stretch stimulates fibroblasts to rapidly remodel fibrin," J Biomech, 39(16), pp. 2983-2990.
[83] Arold, S. P., Wong, J. Y., and Suki, B., 2007, "Design of a new stretching apparatus and the effects of cyclic strain and substratum on mouse lung epithelial-12 cells," Ann Biomed Eng, 35(7), pp. 1156-1164.
[84] Loesberg, W. A., Walboomers, X. F., van Loon, J. J., and Jansen, J. A., 2005, "The effect of combined cyclic mechanical stretching and microgrooved surface topography on the behavior of fibroblasts," J Biomed Mater Res A, 75(3), pp. 723-732.
[85] Bishop, J. E., Mitchell, J. J., Absher, P. M., Baldor, L., Geller, H. A., Woodcock-Mitchell, J., Hamblin, M. J., Vacek, P., and Low, R. B., 1993, "Cyclic mechanical deformation stimulates human lung fibroblast proliferation and autocrine growth factor activity," Am J Respir Cell Mol Biol, 9(2), pp. 126-133.
[86] Breen, E. C., Fu, Z., and Normand, H., 1999, "Calcyclin gene expression is increased by mechanical strain in fibroblasts and lung," Am J Respir Cell Mol Biol, 21(6), pp. 746-752.
[87] Wang, J. H., Yang, G., and Li, Z., 2005, "Controlling cell responses to cyclic mechanical stretching," Ann Biomed Eng, 33(3), pp. 337-342.
[88] Raeber, G. P., Lutolf, M. P., and Hubbell, J. A., 2008, "Part II: Fibroblasts preferentially migrate in the direction of principal strain," Biomech Model Mechanobiol, 7(3), pp. 215-225.
[89] Katsumi, A., Naoe, T., Matsushita, T., Kaibuchi, K., and Schwartz, M. A., 2005, "Integrin activation and matrix binding mediate cellular responses to mechanical stretch," J Biol Chem, 280(17), pp. 16546-16549..
[90] Dartsch, P. C., Hammerle, H., and Betz, E., 1986, "Orientation of cultured arterial smooth muscle cells growing on cyclically stretched substrates," Acta Anat (Basel), 125(2), pp. 108-113.
[91] Husse, B., Briest, W., Homagk, L., Isenberg, G., and Gekle, M., 2007, "Cyclical mechanical stretch modulates expression of collagen I and collagen III by PKC and tyrosine kinase in cardiac fibroblasts," Am J Physiol Regul Integr Comp Physiol, 293(5), pp. R1898-1907.
[92] Kratz, C., Tollback, A., and Kratz, G., 2001, "Effects of continuous stretching on cell proliferation and collagen synthesis in human burn scars," Scand J Plast Reconstr Surg Hand Surg, 35(1), pp. 57-63.
31
Chapter 2: Background and Significance
[93] Winston, F. K., Macarak, E. J., Gorfien, S. F., and Thibault, L. E., 1989, "A system to reproduce and quantify the biomechanical environment of the cell," J Appl Physiol, 67(1), pp. 397-405.
[94] Wang, J. H., Goldschmidt-Clermont, P., Moldovan, N., and Yin, F. C., 2000, "Leukotrienes and tyrosine phosphorylation mediate stretching-induced actin cytoskeletal remodeling in endothelial cells," Cell Motil Cytoskeleton, 46(2), pp. 137-145.
[95] Grinnell, F., 2003, "Fibroblast biology in three-dimensional collagen matrices," Trends Cell Biol, 13(5), pp. 264-269.
[96] Martin, P., 1997, "Wound healing--aiming for perfect skin regeneration," Science, 276(5309), pp. 75-81.
[97] Bell, E., Ivarsson, B., and Merrill, C., 1979, "Production of a tissue-like structure by contraction of collagen lattices by human fibroblasts of different proliferative potential in vitro," Proc Natl Acad Sci U S A, 76(3), pp. 1274-1278.
[98] Eastwood, M., McGrouther, D. A., and Brown, R. A., 1998, "Fibroblast responses to mechanical forces," Proc Inst Mech Eng [H], 212(2), pp. 85-92.
[99] Tranquillo, R. T., and Murray, J. D., 1993, "Mechanistic model of wound contraction," J Surg Res, 55(2), pp. 233-247.
[100] Zhu, Y. K., Umino, T., Liu, X. D., Wang, H. J., Romberger, D., Spurzem, J. R., and Rennard, S. I., 2001, "Contraction of fibroblast-containaing collagen gels:initial collagen concentration regulates the degree of contraction and cell survival.," In Vitro Cell. Dev. Biol.- Animal, 37, pp. 10-16.
[101] Brown, R. A., Prajapati, R., McGrouther, D. A., Yannas, I. V., and Eastwood, M., 1998, "Tensional homeostasis in dermal fibroblasts: mechanical responses to mechanical loading in three-dimensional substrates," J Cell Physiol, 175(3), pp. 323-332.
[102] Montesano, R., and Orci, L., 1985, "Tumor-promoting phorbol esters induce angiogenesis in vitro," Cell, 42(2), pp. 469-477.
[103] Yang, S., Graham, J., Kahn, J. W., Schwartz, E. A., and Gerritsen, M. E., 1999, "Functional roles for PECAM-1 (CD31) and VE-cadherin (CD144) in tube assembly and lumen formation in three-dimensional collagen gels," Am J Pathol, 155(3), pp. 887-895.
[104] Ng, C. P., Helm, C. L., and Swartz, M. A., 2004, "Interstitial flow differentially stimulates blood and lymphatic endothelial cell morphogenesis in vitro," Microvasc Res, 68(3), pp. 258-264.
[105] Brown, A. F., 1982, "Neutrophil granulocytes: adhesion and locomotion on collagen substrata and in collagen matrices," J Cell Sci, 58, pp. 455-467.
[106] Entschladen, F., Niggemann, B., Zanker, K. S., and Friedl, P., 1997, "Differential requirement of protein tyrosine kinases and protein kinase C in the regulation of T cell locomotion in three-dimensional collagen matrices," J Immunol, 159(7), pp. 3203-3210.
[107] Clark, R. A., Nielsen, L. D., Welch, M. P., and McPherson, J. M., 1995, "Collagen matrices attenuate the collagen-synthetic response of cultured fibroblasts to TGF-beta," J Cell Sci, 108(Pt 3), pp. 1251-1261.
32

Chapter 2: Background and Significance
[108] Montesano, R., and Orci, L., 1988, "Transforming growth factor beta stimulates collagen-matrix contraction by fibroblasts: implications for wound healing," Proc Natl Acad Sci U S A, 85(13), pp. 4894-4897.
[109] He, Y., and Grinnell, F., 1994, "Stress relaxation of fibroblasts activates a cyclic AMP signaling pathway," J Cell Biol, 126(2), pp. 457-464.
[110] Gillery, P., Bellon, G., Coustry, F., and Borel, J. P., 1989, "Cultures of fibroblasts in fibrin lattices: models for the study of metabolic activities of the cells in physiological conditions," J Cell Physiol, 140(3), pp. 483-490.
[111] Grassl, E. D., Oegema, T. R., and Tranquillo, R. T., 2003, "A fibrin-based arterial media equivalent," J Biomed Mater Res A, 66(3), pp. 550-561.
[112] Long, J. L., and Tranquillo, R. T., 2003, "Elastic fiber production in cardiovascular tissue-equivalents," Matrix Biol, 22(4), pp. 339-350.
[113] Robinson, P. S., and Tranquillo, R. T., 2005, "Effect of fibrin concentration on cell-induced remodeling and resulting mechancial properties of fibrin gel," ASME Summer Bioengineering Conference, ASME, Vail , Colorado.
[114] Swartz, D. D., Russell, J. A., and Andreadis, S. T., 2005, "Engineering of fibrin-based functional and implantable small-diameter blood vessels," Am J Physiol Heart Circ Physiol, 288(3), pp. H1451-1460.
[115] Ye, Q., Zund, G., Benedikt, P., Jockenhoevel, S., Hoerstrup, S. P., Sakyama, S., Hubbell, J. A., and Turina, M., 2000, "Fibrin gel as a three dimensional matrix in cardiovascular tissue engineering," Eur J Cardiothorac Surg, 17(5), pp. 587-591.
[116] Yao, L., Swartz, D. D., Gugino, S. F., Russell, J. A., and Andreadis, S. T., 2005, "Fibrin-based tissue-engineered blood vessels: differential effects of biomaterial and culture parameters on mechanical strength and vascular reactivity," Tissue Eng, 11(7-8), pp. 991-1003.
[117] Grassl, E. D., Oegema, T. R., and Tranquillo, R. T., 2002, "Fibrin as an alternative biopolymer to type-I collagen for the fabrication of a media equivalent," J Biomed Mater Res, 60(4), pp. 607-612.
[118] Neidert, M. R., Lee, E. S., Oegema, T. R., and Tranquillo, R. T., 2002, "Enhanced fibrin remodeling in vitro with TGF-beta1, insulin and plasmin for improved tissue-equivalents," Biomaterials, 23(17), pp. 3717-3731.
[119] Boublik, J., Park, H., Radisic, M., Tognana, E., Chen, F., Pei, M., Vunjak-Novakovic, G., and Freed, L. E., 2005, "Mechanical properties and remodeling of hybrid cardiac constructs made from heart cells, fibrin, and biodegradable, elastomeric knitted fabric," Tissue Eng, 11(7-8), pp. 1122-1132.
[120] Arkudas, A., Tjiawi, J., Bleiziffer, O., Grabinger, L., Polykandriotis, E., Beier, J. P., Sturzl, M., Horch, R. E., and Kneser, U., 2007, "Fibrin gel-immobilized VEGF and bFGF efficiently stimulate angiogenesis in the AV loop model," Mol Med, 13(9-10), pp. 480-487.
[121] Polykandriotis, E., Tjiawi, J., Euler, S., Arkudas, A., Hess, A., Brune, K., Greil, P., Lametschwandtner, A., Horch, R. E., and Kneser, U., 2008, "The venous graft as an effector of early angiogenesis in a fibrin matrix," Microvasc Res, 75(1), pp. 25-33.
[122] Prajapati, R. T., Chavally-Mis, B., Herbage, D., Eastwood, M., and Brown, R. A., 2000, "Mechanical loading regulates protease production by fibroblasts in three-
33
Chapter 2: Background and Significance
dimensional collagen substrates," Wound Repair and Regeneration, 8(3), pp. 226-237.
[123] O'Callaghan, C. J., and Williams, B., 2000, "Mechanical strain-induced extracellular matrix production by human vascular smooth muscle cells: role of TGF-beta(1)," Hypertension, 36(3), pp. 319-324.
[124] Seliktar, D., Black, R. A., Vito, R. P., and Nerem, R. M., 2000, "Dynamic mechanical conditioning of collagen-gel blood vessel constructs induces remodeling in vitro," Annals of Biomedical Engineering, 28(4), pp. 351-362.
[125] Kanda, K., and Matsuda, T., 1994, "Mechanical stress-induced orientation and ultrastructural change of smooth muscle cells cultured in three-dimensional collagen lattices," Cell Transplant, 3(6), pp. 481-492.
[126] Isenberg, B. C., and Tranquillo, R. T., 2003, "Long-term cyclic distention enhances the mechanical properties of collagen-based media-equivalents," Annals of Biomedical Engineering, 31(8), pp. 937-949.
[127] Syedain, Z. H., Weinberg, J. S., and Tranquillo, R. T., 2008, "Cyclic distension of fibrin-based tissue constructs: evidence of adaptation during growth of engineered connective tissue," Proc Natl Acad Sci U S A, 105(18), pp. 6537-6542. Epub 2008 Apr 6524.
[128] Altman, G. H., Horan, R. L., Martin, I., Farhadi, J., Stark, P. R., Volloch, V., Richmond, J. C., Vunjak-Novakovic, G., and Kaplan, D. L., 2002, "Cell differentiation by mechanical stress," FASEB J, 16(2).
[129] Grenier, G., Remy-Zolghadri, M., Larouche, D., Gauvin, R., Baker, K., Bergeron, F., Dupuis, D., Langelier, E., Rancourt, D., Auger, F. A., and Germain, L., 2005, "Tissue reorganization in response to mechanical load increases functionality," Tissue Engineering, 11(1-2), pp. 90-100.
[130] Yang, G., Crawford, R. C., and Wang, J. H., 2004, "Proliferation and collagen production of human patellar tendon fibroblasts in response to cyclic uniaxial stretching in serum-free conditions," Journal of Biomechanics, 37(10), pp. 1543-1550.
[131] Isenberg, B. C., and Tranquillo, R. T., 2003, "Long-term cyclic distention enhances the mechanical properties of collagen-based media-equivalents," Ann Biomed Eng, 31(8), pp. 937-949.
[132] Kulik, T. J., and Alvarado, S. P., 1993, "Effect of stretch on growth and collagen synthesis in cultured rat and lamb pulmonary arterial smooth muscle cells," J Cell Physiol, 157(3), pp. 615-624.
[133] Shelton, J. C., Bader, D. L., and Lee, D. A., 2003, "Mechanical conditioning influences the metabolic response of cell-seeded constructs," Cells Tissues Organs, 175(3), pp. 140-150.
[134] Balestrini, J. L., and Billiar, K. L., 2009, "Magnitude and duration of stretch modulate fibroblast remodeling," J Biomech Eng, 131(5), p. 051005.
34
CHAPTER 3
Equibiaxial cyclic stretch stimulates fibroblasts to rapidly remodel fibrin
(Balestrini, J. L., and Billiar, K. L., 2006, J Biomech, 39(16), pp. 2983-2990, reprinted with permission)
3.1. Introduction
During adult dermal healing, fibroblasts remodel the fibrin-rich provisional matrix by
synthesizing, organizing, and crosslinking collagen and other matrix components to form a scar.
In response to mechanical and biochemical cues, the collagen fibers increase in size and number,
align in the direction of tension, and are arranged into bundles [1]. The remodeling process
results in a dramatic compaction of the matrix and an increase in the tensile strength and stiffness
of the scar [2, 3], yet the scar remains weaker than the native dermis that it replaces [1].
Heightened tissue stiffness combined with contracture often leads to reduced range of motion,
undesirable aesthetics, patient discomfort, and in some cases severe deformity [4].
Clinicians have long recognized that the mechanical state of a wound during healing
dramatically alters the structure and properties of the resulting scar. Dynamic splints, serial
casting, z-plasty, massage, ambulation, range of motion exercises, and stretching techniques are
commonly utilized to alter the appearance and properties of scars[4]. Furthermore, numerous
animal studies have shown that stretching healing wounds results in a reduction in contracture
and thickness and an increase in compliance and tensile strength of the scar [5-8]. Conversely,
clinically undesirable results have also been attributed to the application of stretch including
hypertrophic scarring, edema, and scar lengthening and widening [9, 10]. The observation that
both positive and negative outcomes can result from altering the mechanical environment during
healing is a troubling clinical dilemma [9]. Designing a treatment regimen that would result in
superior mechanical properties without detrimental side effects requires a more thorough
understanding of mechanobiology and the mechanisms underlying wound remodeling.
35
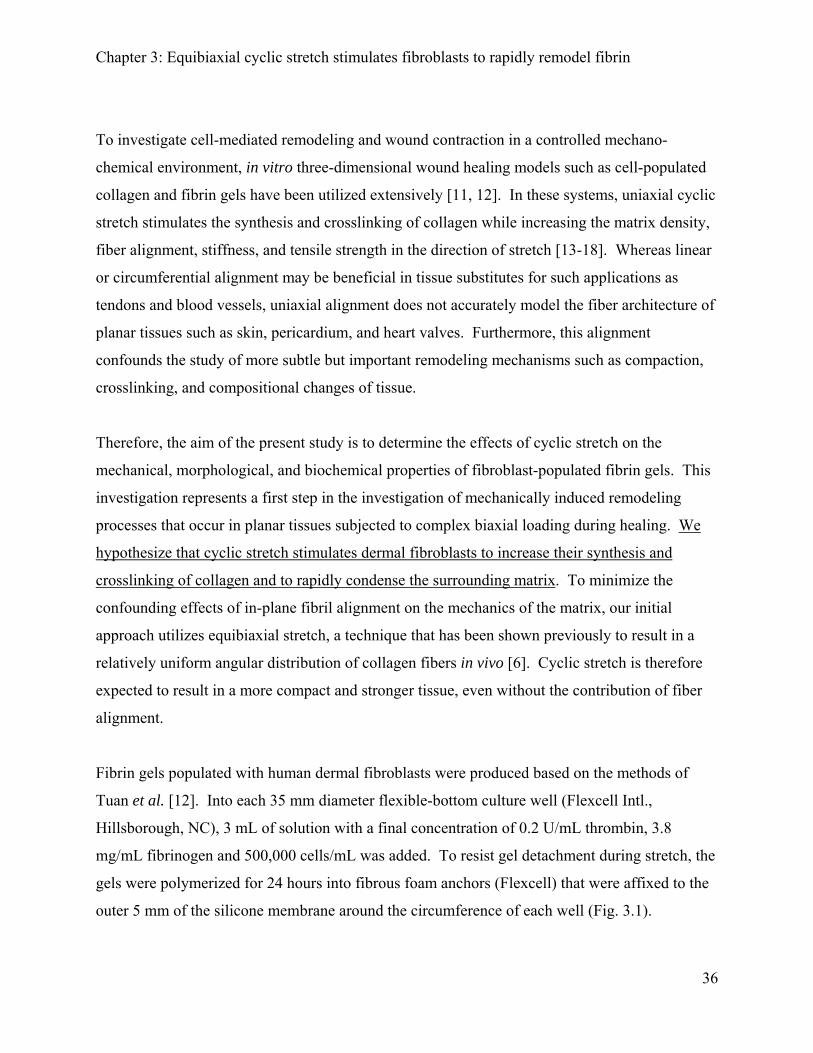
Chapter 3: Equibiaxial cyclic stretch stimulates fibroblasts to rapidly remodel fibrin
To investigate cell-mediated remodeling and wound contraction in a controlled mechano-
chemical environment, in vitro three-dimensional wound healing models such as cell-populated
collagen and fibrin gels have been utilized extensively [11, 12]. In these systems, uniaxial cyclic
stretch stimulates the synthesis and crosslinking of collagen while increasing the matrix density,
fiber alignment, stiffness, and tensile strength in the direction of stretch [13-18]. Whereas linear
or circumferential alignment may be beneficial in tissue substitutes for such applications as
tendons and blood vessels, uniaxial alignment does not accurately model the fiber architecture of
planar tissues such as skin, pericardium, and heart valves. Furthermore, this alignment
confounds the study of more subtle but important remodeling mechanisms such as compaction,
crosslinking, and compositional changes of tissue.
Therefore, the aim of the present study is to determine the effects of cyclic stretch on the
mechanical, morphological, and biochemical properties of fibroblast-populated fibrin gels. This
investigation represents a first step in the investigation of mechanically induced remodeling
processes that occur in planar tissues subjected to complex biaxial loading during healing. We
hypothesize that cyclic stretch stimulates dermal fibroblasts to increase their synthesis and
crosslinking of collagen and to rapidly condense the surrounding matrix. To minimize the
confounding effects of in-plane fibril alignment on the mechanics of the matrix, our initial
approach utilizes equibiaxial stretch, a technique that has been shown previously to result in a
relatively uniform angular distribution of collagen fibers in vivo [6]. Cyclic stretch is therefore
expected to result in a more compact and stronger tissue, even without the contribution of fiber
alignment.
Fibrin gels populated with human dermal fibroblasts were produced based on the methods of
Tuan et al. [12]. Into each 35 mm diameter flexible-bottom culture well (Flexcell Intl.,
Hillsborough, NC), 3 mL of solution with a final concentration of 0.2 U/mL thrombin, 3.8
mg/mL fibrinogen and 500,000 cells/mL was added. To resist gel detachment during stretch, the
gels were polymerized for 24 hours into fibrous foam anchors (Flexcell) that were affixed to the
outer 5 mm of the silicone membrane around the circumference of each well (Fig. 3.1).
36
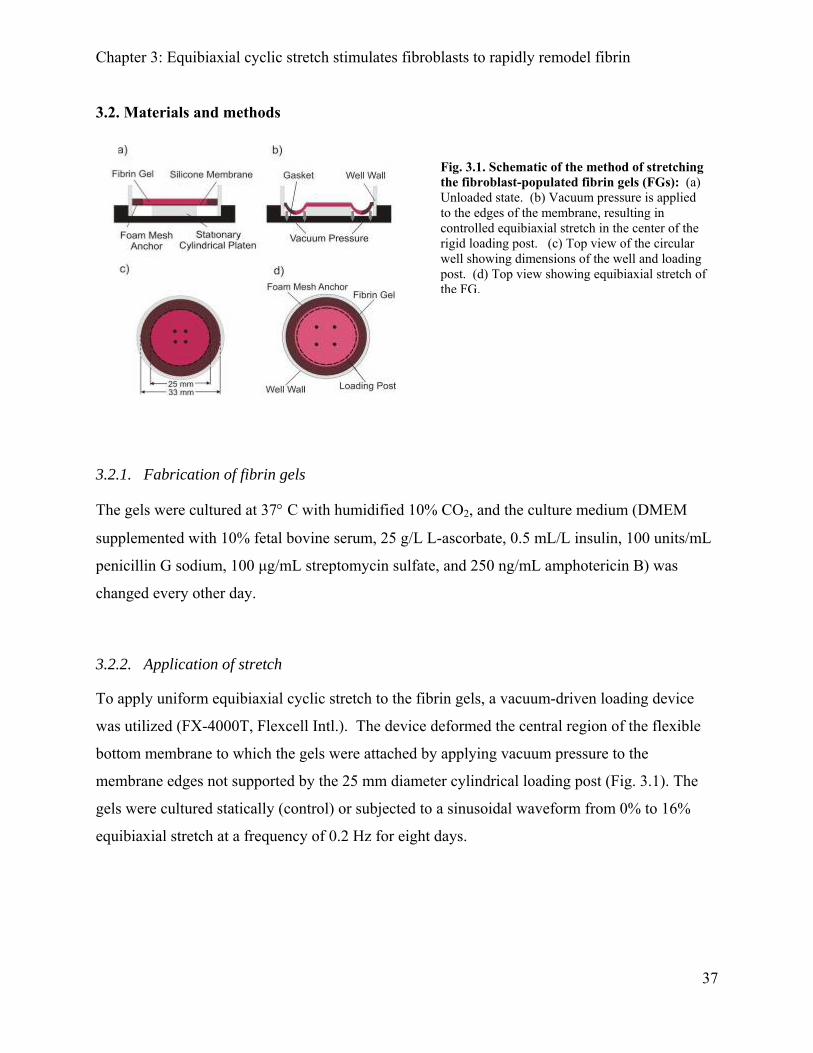
Chapter 3: Equibiaxial cyclic stretch stimulates fibroblasts to rapidly remodel fibrin
3.2. Materials and methods
Fig. 3.1. Schematic of the method of stretching the fibroblast-populated fibrin gels (FGs): (a) Unloaded state. (b) Vacuum pressure is applied to the edges of the membrane, resulting in controlled equibiaxial stretch in the center of the rigid loading post. (c) Top view of the circular well showing dimensions of the well and loading post. (d) Top view showing equibiaxial stretch of the FG.
3.2.1. Fabrication of fibrin gels
The gels were cultured at 37° C with humidified 10% CO2, and the culture medium (DMEM
supplemented with 10% fetal bovine serum, 25 g/L L-ascorbate, 0.5 mL/L insulin, 100 units/mL
penicillin G sodium, 100 μg/mL streptomycin sulfate, and 250 ng/mL amphotericin B) was
changed every other day.
3.2.2. Application of stretch
To apply uniform equibiaxial cyclic stretch to the fibrin gels, a vacuum-driven loading device
was utilized (FX-4000T, Flexcell Intl.). The device deformed the central region of the flexible
bottom membrane to which the gels were attached by applying vacuum pressure to the
membrane edges not supported by the 25 mm diameter cylindrical loading post (Fig. 3.1). The
gels were cultured statically (control) or subjected to a sinusoidal waveform from 0% to 16%
equibiaxial stretch at a frequency of 0.2 Hz for eight days.
37
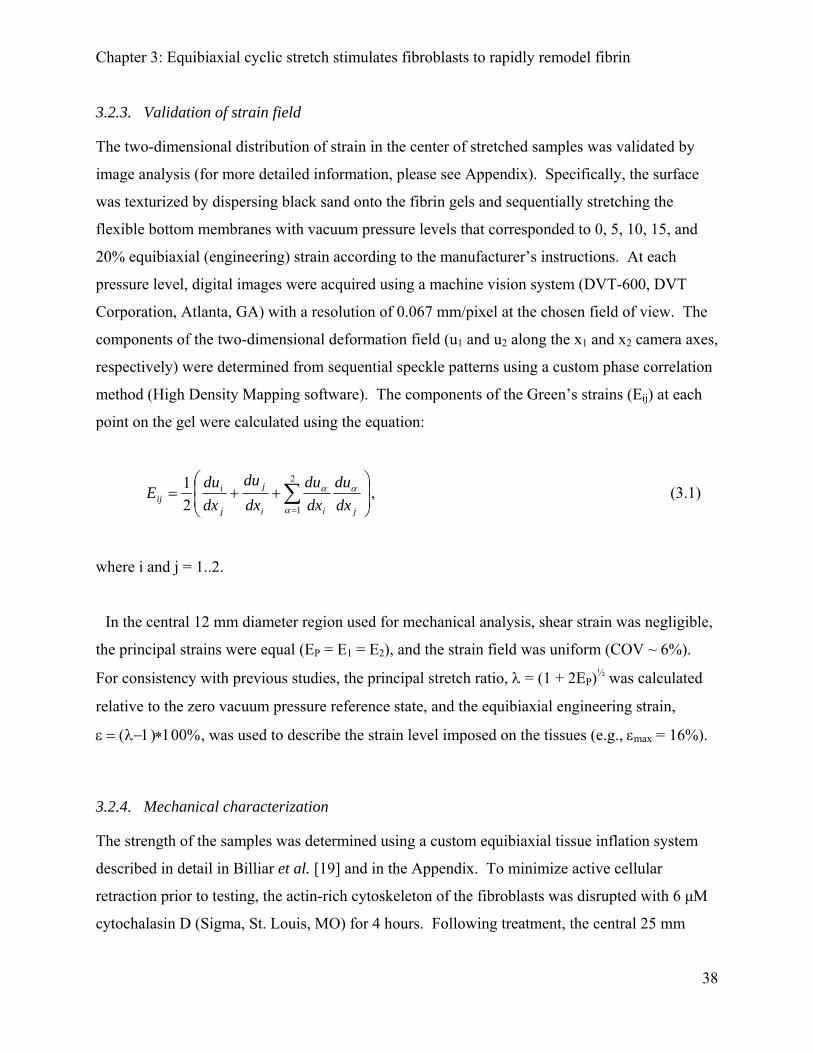
Chapter 3: Equibiaxial cyclic stretch stimulates fibroblasts to rapidly remodel fibrin
3.2.3. Validation of strain field
The two-dimensional distribution of strain in the center of stretched samples was validated by
image analysis (for more detailed information, please see Appendix). Specifically, the surface
was texturized by dispersing black sand onto the fibrin gels and sequentially stretching the
flexible bottom membranes with vacuum pressure levels that corresponded to 0, 5, 10, 15, and
20% equibiaxial (engineering) strain according to the manufacturer’s instructions. At each
pressure level, digital images were acquired using a machine vision system (DVT-600, DVT
Corporation, Atlanta, GA) with a resolution of 0.067 mm/pixel at the chosen field of view. The
components of the two-dimensional deformation field (u1 and u2 along the x1 and x2 camera axes,
respectively) were determined from sequential speckle patterns using a custom phase correlation
method (High Density Mapping software). The components of the Green’s strains (Eij) at each
point on the gel were calculated using the equation:
⎟⎟⎠
⎞⎜⎜⎝
⎛++= ∑
=
2
121
α
αα
jii
j
j
iij dx
dudxdu
dxdu
dxdu
E , (3.1)
where i and j = 1..2.
In the central 12 mm diameter region used for mechanical analysis, shear strain was negligible,
the principal strains were equal (EP = E1 = E2), and the strain field was uniform (COV ~ 6%).
For consistency with previous studies, the principal stretch ratio, λ = (1 + 2EP)½ was calculated
relative to the zero vacuum pressure reference state, and the equibiaxial engineering strain,
ε = (λ−1)∗100%, was used to describe the strain level imposed on the tissues (e.g., εmax = 16%).
3.2.4. Mechanical characterization
The strength of the samples was determined using a custom equibiaxial tissue inflation system
described in detail in Billiar et al. [19] and in the Appendix. To minimize active cellular
retraction prior to testing, the actin-rich cytoskeleton of the fibroblasts was disrupted with 6 μM
cytochalasin D (Sigma, St. Louis, MO) for 4 hours. Following treatment, the central 25 mm
38
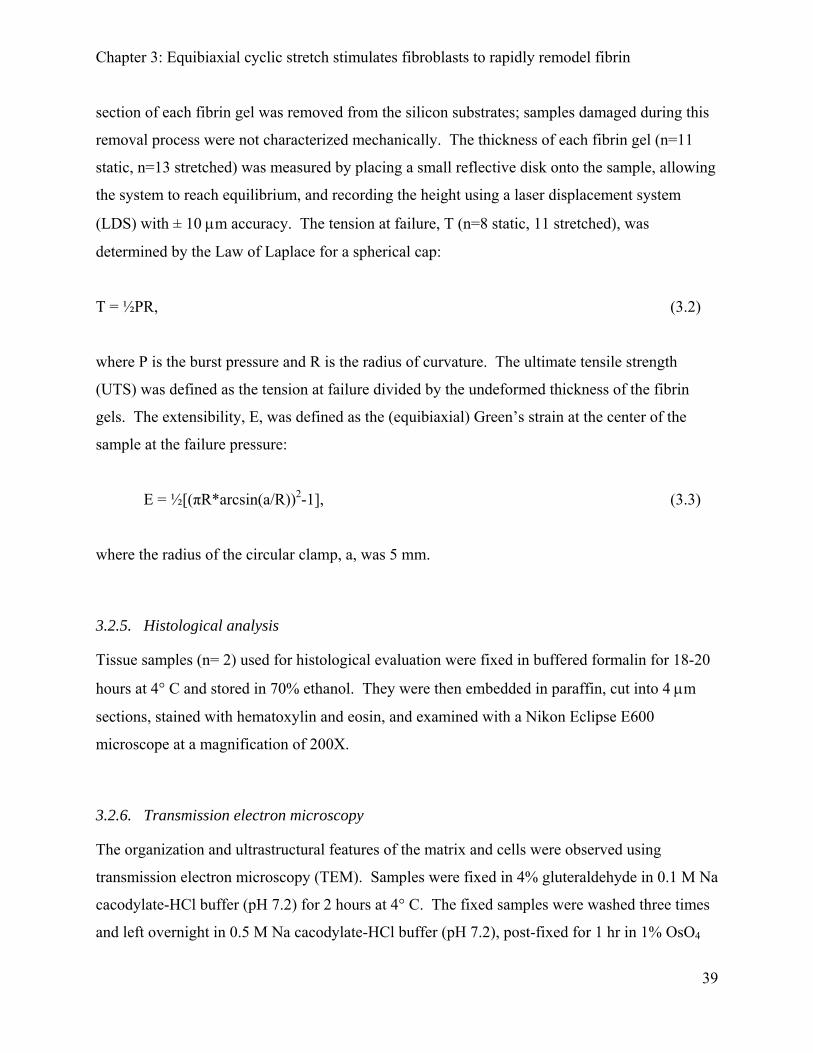
Chapter 3: Equibiaxial cyclic stretch stimulates fibroblasts to rapidly remodel fibrin
section of each fibrin gel was removed from the silicon substrates; samples damaged during this
removal process were not characterized mechanically. The thickness of each fibrin gel (n=11
static, n=13 stretched) was measured by placing a small reflective disk onto the sample, allowing
the system to reach equilibrium, and recording the height using a laser displacement system
(LDS) with ± 10 μm accuracy. The tension at failure, T (n=8 static, 11 stretched), was
determined by the Law of Laplace for a spherical cap:
T = ½PR, (3.2)
where P is the burst pressure and R is the radius of curvature. The ultimate tensile strength
(UTS) was defined as the tension at failure divided by the undeformed thickness of the fibrin
gels. The extensibility, E, was defined as the (equibiaxial) Green’s strain at the center of the
sample at the failure pressure:
E = ½[(πR*arcsin(a/R))2-1], (3.3)
where the radius of the circular clamp, a, was 5 mm.
3.2.5. Histological analysis
Tissue samples (n= 2) used for histological evaluation were fixed in buffered formalin for 18-20
hours at 4° C and stored in 70% ethanol. They were then embedded in paraffin, cut into 4 μm
sections, stained with hematoxylin and eosin, and examined with a Nikon Eclipse E600
microscope at a magnification of 200X.
3.2.6. Transmission electron microscopy
The organization and ultrastructural features of the matrix and cells were observed using
transmission electron microscopy (TEM). Samples were fixed in 4% gluteraldehyde in 0.1 M Na
cacodylate-HCl buffer (pH 7.2) for 2 hours at 4° C. The fixed samples were washed three times
and left overnight in 0.5 M Na cacodylate-HCl buffer (pH 7.2), post-fixed for 1 hr in 1% OsO4
39
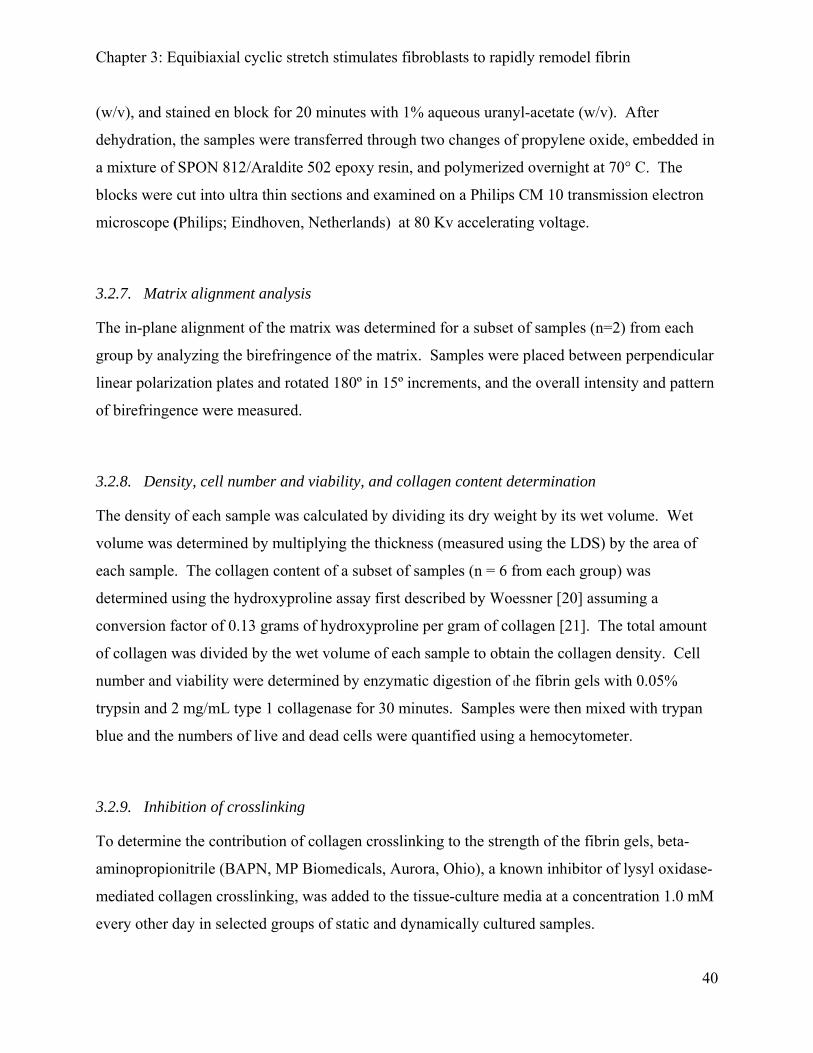
Chapter 3: Equibiaxial cyclic stretch stimulates fibroblasts to rapidly remodel fibrin
(w/v), and stained en block for 20 minutes with 1% aqueous uranyl-acetate (w/v). After
dehydration, the samples were transferred through two changes of propylene oxide, embedded in
a mixture of SPON 812/Araldite 502 epoxy resin, and polymerized overnight at 70° C. The
blocks were cut into ultra thin sections and examined on a Philips CM 10 transmission electron
microscope (Philips; Eindhoven, Netherlands) at 80 Kv accelerating voltage.
3.2.7. Matrix alignment analysis
The in-plane alignment of the matrix was determined for a subset of samples (n=2) from each
group by analyzing the birefringence of the matrix. Samples were placed between perpendicular
linear polarization plates and rotated 180º in 15º increments, and the overall intensity and pattern
of birefringence were measured.
3.2.8. Density, cell number and viability, and collagen content determination
The density of each sample was calculated by dividing its dry weight by its wet volume. Wet
volume was determined by multiplying the thickness (measured using the LDS) by the area of
each sample. The collagen content of a subset of samples (n = 6 from each group) was
determined using the hydroxyproline assay first described by Woessner [20] assuming a
conversion factor of 0.13 grams of hydroxyproline per gram of collagen [21]. The total amount
of collagen was divided by the wet volume of each sample to obtain the collagen density. Cell
number and viability were determined by enzymatic digestion of the fibrin gels with 0.05%
trypsin and 2 mg/mL type 1 collagenase for 30 minutes. Samples were then mixed with trypan
blue and the numbers of live and dead cells were quantified using a hemocytometer.
3.2.9. Inhibition of crosslinking
To determine the contribution of collagen crosslinking to the strength of the fibrin gels, beta-
aminopropionitrile (BAPN, MP Biomedicals, Aurora, Ohio), a known inhibitor of lysyl oxidase-
mediated collagen crosslinking, was added to the tissue-culture media at a concentration 1.0 mM
every other day in selected groups of static and dynamically cultured samples.
40
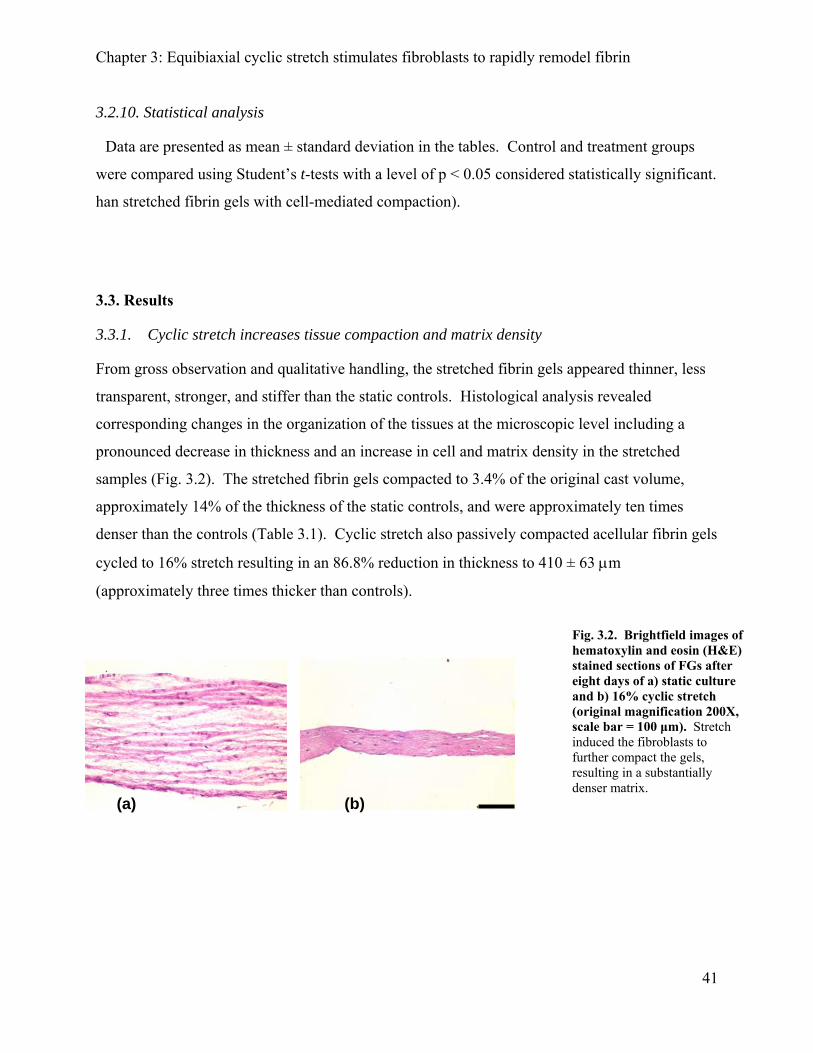
Chapter 3: Equibiaxial cyclic stretch stimulates fibroblasts to rapidly remodel fibrin
3.2.10. Statistical analysis
Data are presented as mean ± standard deviation in the tables. Control and treatment groups
were compared using Student’s t-tests with a level of p < 0.05 considered statistically significant.
han stretched fibrin gels with cell-mediated compaction).
3.3. Results
3.3.1. Cyclic stretch increases tissue compaction and matrix density
From gross observation and qualitative handling, the stretched fibrin gels appeared thinner, less
transparent, stronger, and stiffer than the static controls. Histological analysis revealed
corresponding changes in the organization of the tissues at the microscopic level including a
pronounced decrease in thickness and an increase in cell and matrix density in the stretched
samples (Fig. 3.2). The stretched fibrin gels compacted to 3.4% of the original cast volume,
approximately 14% of the thickness of the static controls, and were approximately ten times
denser than the controls (Table 3.1). Cyclic stretch also passively compacted acellular fibrin gels
cycled to 16% stretch resulting in an 86.8% reduction in thickness to 410 ± 63 μm
(approximately three times thicker than controls).
Fig. 3.2. Brightfield images of hematoxylin and eosin (H&E) stained sections of FGs after eight days of a) static culture and b) 16% cyclic stretch (original magnification 200X, scale bar = 100 μm). Stretch induced the fibroblasts to further compact the gels, resulting in a substantially denser matrix.
(a) (b)
41
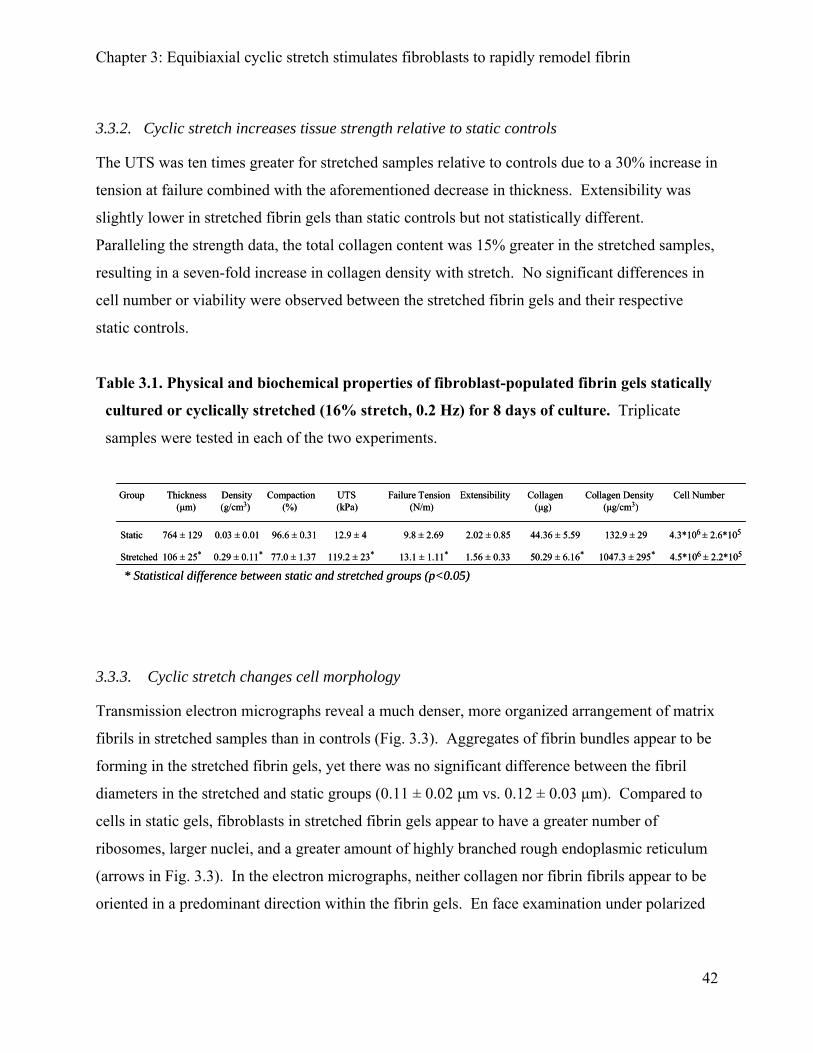
Chapter 3: Equibiaxial cyclic stretch stimulates fibroblasts to rapidly remodel fibrin
3.3.2. Cyclic stretch increases tissue strength relative to static controls
The UTS was ten times greater for stretched samples relative to controls due to a 30% increase in
tension at failure combined with the aforementioned decrease in thickness. Extensibility was
slightly lower in stretched fibrin gels than static controls but not statistically different.
Paralleling the strength data, the total collagen content was 15% greater in the stretched samples,
resulting in a seven-fold increase in collagen density with stretch. No significant differences in
cell number or viability were observed between the stretched fibrin gels and their respective
static controls.
Table 3.1. Physical and biochemical properties of fibroblast-populated fibrin gels statically
cultured or cyclically stretched (16% stretch, 0.2 Hz) for 8 days of culture. Triplicate
samples were tested in each of the two experiments.
Group Thickness Density Compaction UTS Failure Tension Extensibility Collagen Collagen Density Cell Number (μm) (g/cm3) (%) (kPa) (N/m) (μg) (μg/cm3)
Static 764 ± 129 0.03 ± 0.01 96.6 ± 0.31 12.9 ± 4 9.8 ± 2.69 2.02 ± 0.85 44.36 ± 5.59 132.9 ± 29 4.3*106 ± 2.6*105
Stretched 106 ± 25* 0.29 ± 0.11* 77.0 ± 1.37 119.2 ± 23* 13.1 ± 1.11* 1.56 ± 0.33 50.29 ± 6.16* 1047.3 ± 295* 4.5*106 ± 2.2*105
* Statistical difference between static and stretched groups (p<0.05)
3.3.3. Cyclic stretch changes cell morphology
Transmission electron micrographs reveal a much denser, more organized arrangement of matrix
fibrils in stretched samples than in controls (Fig. 3.3). Aggregates of fibrin bundles appear to be
forming in the stretched fibrin gels, yet there was no significant difference between the fibril
diameters in the stretched and static groups (0.11 ± 0.02 μm vs. 0.12 ± 0.03 μm). Compared to
cells in static gels, fibroblasts in stretched fibrin gels appear to have a greater number of
ribosomes, larger nuclei, and a greater amount of highly branched rough endoplasmic reticulum
(arrows in Fig. 3.3). In the electron micrographs, neither collagen nor fibrin fibrils appear to be
oriented in a predominant direction within the fibrin gels. En face examination under polarized
42
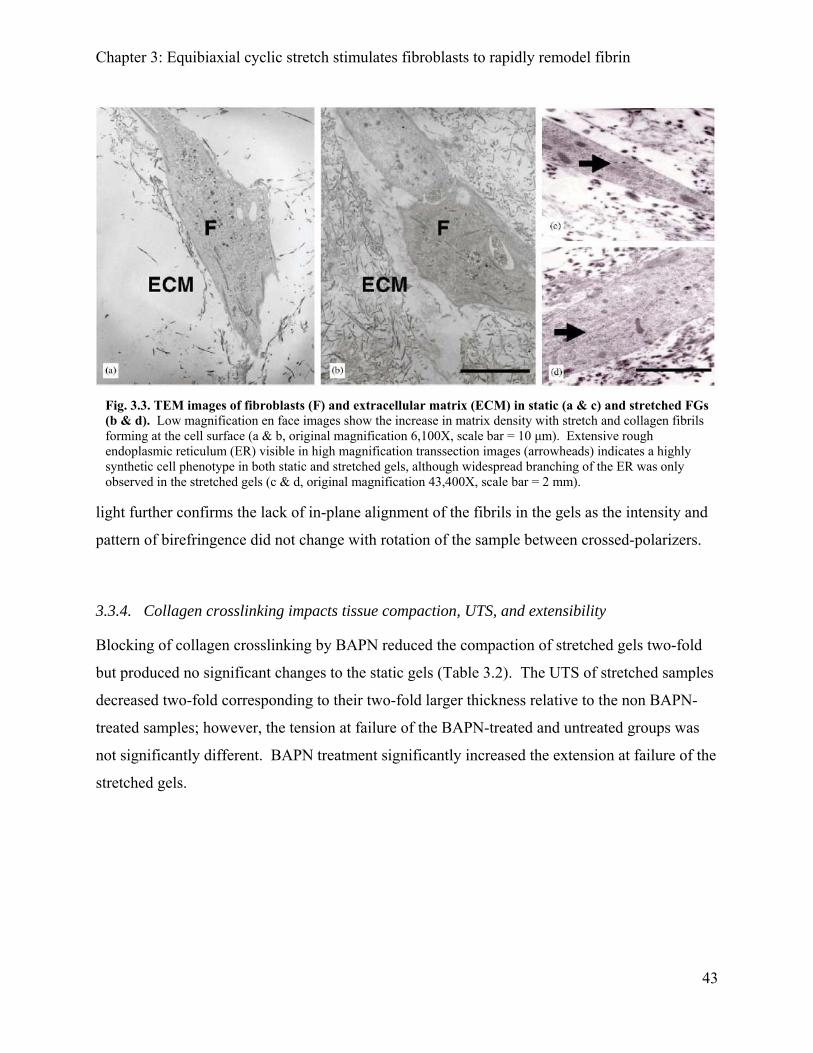
Chapter 3: Equibiaxial cyclic stretch stimulates fibroblasts to rapidly remodel fibrin
Fig. 3.3. TEM images of fibroblasts (F) and extracellular matrix (ECM) in static (a & c) and stretched FGs (b & d). Low magnification en face images show the increase in matrix density with stretch and collagen fibrils forming at the cell surface (a & b, original magnification 6,100X, scale bar = 10 μm). Extensive rough endoplasmic reticulum (ER) visible in high magnification transsection images (arrowheads) indicates a highly synthetic cell phenotype in both static and stretched gels, although widespread branching of the ER was only observed in the stretched gels (c & d, original magnification 43,400X, scale bar = 2 mm).
light further confirms the lack of in-plane alignment of the fibrils in the gels as the intensity and
pattern of birefringence did not change with rotation of the sample between crossed-polarizers.
3.3.4. Collagen crosslinking impacts tissue compaction, UTS, and extensibility
Blocking of collagen crosslinking by BAPN reduced the compaction of stretched gels two-fold
but produced no significant changes to the static gels (Table 3.2). The UTS of stretched samples
decreased two-fold corresponding to their two-fold larger thickness relative to the non BAPN-
treated samples; however, the tension at failure of the BAPN-treated and untreated groups was
not significantly different. BAPN treatment significantly increased the extension at failure of the
stretched gels.
43
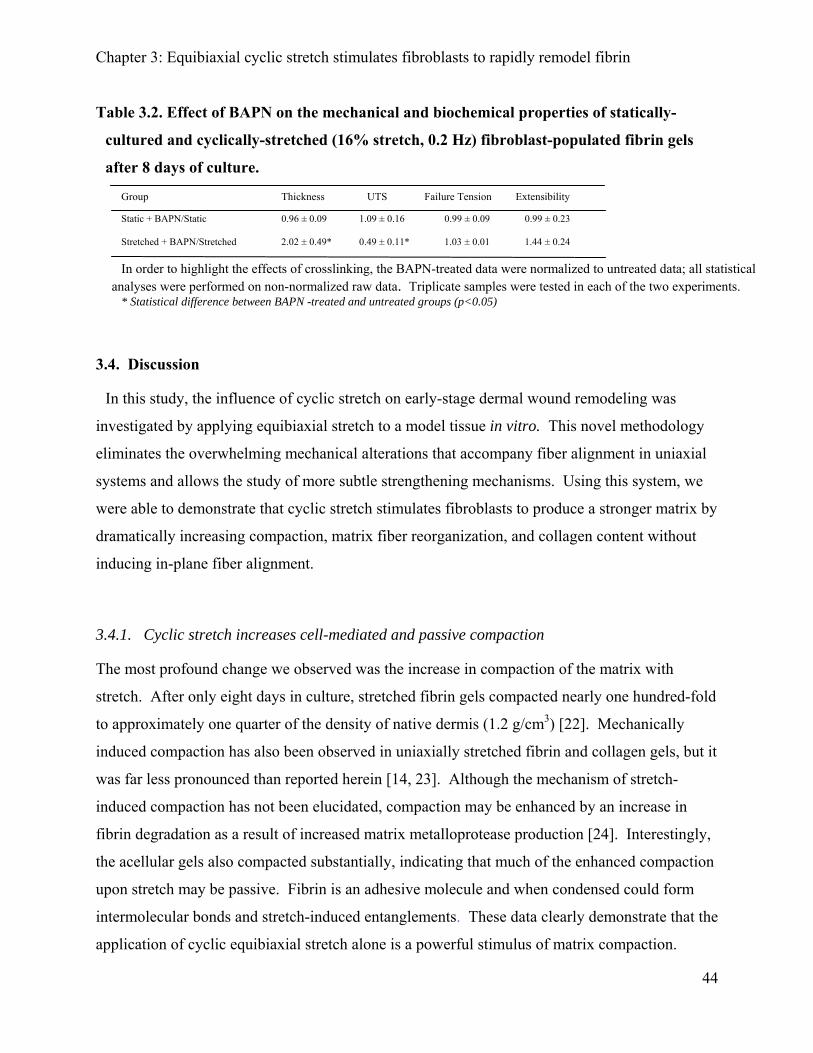
Chapter 3: Equibiaxial cyclic stretch stimulates fibroblasts to rapidly remodel fibrin
Table 3.2. Effect of BAPN on the mechanical and biochemical properties of statically-
cultured and cyclically-stretched (16% stretch, 0.2 Hz) fibroblast-populated fibrin gels
after 8 days of culture.
Group Thickness UTS Failure Tension Extensibility
Static + BAPN/Static 0.96 ± 0.09 1.09 ± 0.16 0.99 ± 0.09 0.99 ± 0.23
Stretched + BAPN/Stretched 2.02 ± 0.49* 0.49 ± 0.11* 1.03 ± 0.01 1.44 ± 0.24
In order to highlight the effects of crosslinking, the BAPN-treated data were normalized to untreated data; all statistical analyses were performed on non-normalized raw data. Triplicate samples were tested in each of the two experiments.
* Statistical difference between BAPN -treated and untreated groups (p<0.05)
3.4. Discussion
In this study, the influence of cyclic stretch on early-stage dermal wound remodeling was
investigated by applying equibiaxial stretch to a model tissue in vitro. This novel methodology
eliminates the overwhelming mechanical alterations that accompany fiber alignment in uniaxial
systems and allows the study of more subtle strengthening mechanisms. Using this system, we
were able to demonstrate that cyclic stretch stimulates fibroblasts to produce a stronger matrix by
dramatically increasing compaction, matrix fiber reorganization, and collagen content without
inducing in-plane fiber alignment.
3.4.1. Cyclic stretch increases cell-mediated and passive compaction
The most profound change we observed was the increase in compaction of the matrix with
stretch. After only eight days in culture, stretched fibrin gels compacted nearly one hundred-fold
to approximately one quarter of the density of native dermis (1.2 g/cm3) [22]. Mechanically
induced compaction has also been observed in uniaxially stretched fibrin and collagen gels, but it
was far less pronounced than reported herein [14, 23]. Although the mechanism of stretch-
induced compaction has not been elucidated, compaction may be enhanced by an increase in
fibrin degradation as a result of increased matrix metalloprotease production [24]. Interestingly,
the acellular gels also compacted substantially, indicating that much of the enhanced compaction
upon stretch may be passive. Fibrin is an adhesive molecule and when condensed could form
intermolecular bonds and stretch-induced entanglements. These data clearly demonstrate that the
application of cyclic equibiaxial stretch alone is a powerful stimulus of matrix compaction.
44
Chapter 3: Equibiaxial cyclic stretch stimulates fibroblasts to rapidly remodel fibrin
3.4.2. Stretch does not modify cell number or viability
No significant differences in cell number or viability were observed between the stretched and
static groups indicating that stretch increases the remodeling activity of the cells rather than their
mitogenic activity. However, we cannot say with certitude that stretch did not alter cell
proliferation in our study, as a change in cell proliferation in our system may have been balanced
with a concomitant change in apoptosis.
3.4.3. Cyclic stretch induces cell-mediated strengthening of fibrin gels
Investigators that have applied uniaxial stretch to collagen and fibrin gels have observed
substantial increases in tensile strength similar to those observed in our study [14, 23, 25].
Increased compaction (and thus decreased thickness), fibril alignment, enhanced entanglement of
the fibrils, intermolecular cell-fibril and fibril-fibril bonding, and bundling of the fibrils are all
hypothesized to contribute substantially to the increase in tensile strength of the model tissues
exposed to mechanical stimulation [1, 14, 17, 23].
To account for the apparent increase in strength simply due to dividing by the smaller thickness
of highly compacted samples, we also calculated failure tension (force/width). Our analysis
indicates that while the majority of the ten-fold increase in UTS is due to a decrease in thickness,
the stretched samples are still able to withstand significantly higher tension than statically
cultured samples. As verified by histological and polarized light examination as well as TEM,
there is no measurable in-plane alignment in the equibiaxially stretched fibrin gels, thus
alignment does not appear to be the mechanism of strengthening. Furthermore, the average
fibrin fibril diameter was similar to values found previously in polymerized gels [26] and was
not altered by stretch. Thus, more subtle strengthening mechanisms such as collagen synthesis
and crosslinking appear to contribute significantly to the increased strength of the mechanically
stretched gels.
45
Chapter 3: Equibiaxial cyclic stretch stimulates fibroblasts to rapidly remodel fibrin
The total amount of collagen in the gels was low (<1% of the dry weight of the matrix) as
expected for the short experimental duration in our study. The small level of collagen
accumulation may also be due to attenuation of fibroblast collagen production by fibrin [27] and
increased levels of collagenase production induced by stretch [13, 24, 28]. Nevertheless, the
increase in collagen with stretch was statistically significant, highly correlated with matrix
strength, and inversely correlated to matrix extensibility, indicating that collagen plays a role in
the matrix mechanics. This finding is predicted by a simple composite model of a stiff network
of collagen within a compliant fibrin matrix, and confirms that even a very small volume fraction
of collagen has the potential to impact tissue stiffness profoundly. For example, a volume
fraction of only 1% collagen (stiffness~25 kPa based on acellular collagen gels [29]) would
increase the stiffness of a 3.4 mg/mL fibrin-only matrix from 750 Pa [30] to almost 1000 Pa.
Collagen crosslinking may also increase with stretch due to direct cellular stimulation or
indirectly due to increased proximity of the cells and fibrils to each other with stretch-induced
compaction [23]. Indeed, when lysl oxidase-mediated collagen crosslinking was blocked with
BAPN, the UTS of the stretched gels decreased two-fold. However, this drop in strength appears
to be due to less pronounced compaction rather than a decrease in failure tension. The
extensibility was also significantly increased with BAPN treatment in stretched groups.
Interestingly, these crosslink-dependent changes did not occur in statically cultured fibrin gels.
3.4.4. Conclusions
The application of cyclic biaxial stretch is a promising approach for improving the quality of
wound healing as well as for engineering functional tissue equivalents for the repair or
replacement of diseased tissues. The goal now is to determine the optimal percentage, rate,
duration, and/or direction of stretch that would produce superior mechanical and biochemical
properties for each particular application.
46
Chapter 3: Equibiaxial cyclic stretch stimulates fibroblasts to rapidly remodel fibrin
3.4.5. Acknowledgements
The authors would like to thank Dr. Glenn Gaudette at the University of Massachusetts
Medical School for the generous use of his extended phase image correlation software and Greg
Hendricks for his electron microscopy expertise. We would also like to Danielle Dufour,
Vanessa Lopez, Maria Mavromatis, and Jacquelyn Youssef for their technical assistance. This
work was supported by Whitaker Research Grant 02-073 to KLB.
3.5. References
[1] Clark, R. A. F., 1996, The molecular and cellular biology of wound repair, Plenum Press, New York.
[2] Linares, H. A., 1996, "From wound to scar," Burns, 22(5), pp. 339-352. [3] Tomasek, J. J., Haaksma, C. J., Eddy, R. J., and Vaughan, M. B., 1992, "Fibroblast
contraction occurs on release of tension in attached collagen lattices: dependency on an organized actin cytoskeleton and serum," Anatomical Record, 232(3), pp. 359-368.
[4] Hardy, M. A., 1989, "The biology of scar formation," Physical Therapy, 69(12), pp. 1014-1024.
[5] Brunius, U., Zederfeldt, B., and Ahren, C., 1967, "Healing of skin incisions closed by non-suture technique. A tensiometric and histologic study in the rat," Acta Chir Scand, 133(7), pp. 509-516.
[6] Langrana, N. A., Alexander, H., Strauchler, I., Mehta, A., and Ricci, J., 1983, "Effect of mechanical load in wound healing," Annals of Plastic Surgery, 10(3), pp. 200-208.
[7] Sussman, M. D., 1966, "Effect of increased tissue traction upon tensile strength of cutaneous incisions in rats," Proceedings of the Society for Experimental Biology and Medicine, 123(1), pp. 38-41.
[8] Thorngate, S., and Ferguson, D. J., 1958, "Effect of tension on healing of aponeurotic wounds," Surgery, 44(4), pp. 619-624.
[9] Arem, A. J., and Madden, J. W., 1976, "Effects of stress on healing wounds: I. Intermittent noncyclical tension," Journal of Surgical Research, 20(2), pp. 93-102.
[10] Sommerlad, B. C., and Creasey, J. M., 1978, "The stretched scar: a clinical and histological study," British Journal of Plastic Surgery, 31(1), pp. 34-45.
[11] Grinnell, F., 2000, "Fibroblast-collagen-matrix contraction: growth-factor signalling and mechanical loading," Trends in Cell Biology, 10(9), pp. 362-365.
[12] Tuan, T. L., Song, A., Chang, S., Younai, S., and Nimni, M. E., 1996, "In vitro fibroplasia: matrix contraction, cell growth, and collagen production of fibroblasts cultured in fibrin gels," Experimental Cell Research, 223(1), pp. 127-134.
[13] Altman, G. H., Horan, R. L., Martin, I., Farhadi, J., Stark, P. R., Volloch, V., Richmond, J. C., Vunjak-Novakovic, G., and Kaplan, D. L., 2002, "Cell differentiation by mechanical stress," FASEB J, 16(2).
[14] Cummings, C. L., Gawlitta, D., Nerem, R. M., and Stegemann, J. P., 2004, "Properties of engineered vascular constructs made from collagen, fibrin, and collagen-fibrin mixtures," Biomaterials, 25(17), pp. 3699-3706.
47
Chapter 3: Equibiaxial cyclic stretch stimulates fibroblasts to rapidly remodel fibrin
[15] Grenier, G., Remy-Zolghadri, M., Larouche, D., Gauvin, R., Baker, K., Bergeron, F., Dupuis, D., Langelier, E., Rancourt, D., Auger, F. A., and Germain, L., 2005, "Tissue reorganization in response to mechanical load increases functionality," Tissue Engineering, 11(1-2), pp. 90-100.
[16] Isenberg, B. C., and Tranquillo, R. T., 2003, "Long-term cyclic distention enhances the mechanical properties of collagen-based media-equivalents," Annals of Biomedical Engineering, 31(8), pp. 937-949.
[17] Seliktar, D., Black, R. A., Vito, R. P., and Nerem, R. M., 2000, "Dynamic mechanical conditioning of collagen-gel blood vessel constructs induces remodeling in vitro," Annals of Biomedical Engineering, 28(4), pp. 351-362.
[18] Yang, G., Crawford, R. C., and Wang, J. H., 2004, "Proliferation and collagen production of human patellar tendon fibroblasts in response to cyclic uniaxial stretching in serum-free conditions," Journal of Biomechanics, 37(10), pp. 1543-1550.
[19] Billiar, K. L., Throm, A. M., and Frey, M. T., 2005, "Biaxial failure properties of planar living tissue equivalents," Journal of Biomedical Materials Research A, 73A(2), pp. 182-191.
[20] Woessner, J. F., Jr., 1961, "The determination of hydroxyproline in tissue and protein samples containing small proportions of this imino acid," Archives of Biochemistry and Biophysics, 93, pp. 440-447.
[21] Eastoe, J. E., 1955, "The amino acid composition of mamallian collagen and gelatin," Biochemical Journal, 61(4), pp. 589-600.
[22] Torvi, D. A., and Dale, J. D., 1994, "A finite element model of skin subjected to a flash fire," Journal of Biomechanical Engineering, 116(3), pp. 250-255.
[23] Seliktar, D., Nerem, R. M., and Galis, Z. S., 2001, "The role of matrix metalloproteinase-2 in the remodeling of cell-seeded vascular constructs subjected to cyclic strain," Annals of Biomedical Engineering, 29(11), pp. 923-934.
[24] Seliktar, D., Nerem, R. M., and Galis, Z. S., 2003, "Mechanical strain-stimulated remodeling of tissue-engineered blood vessel constructs," Tissue Engineering, 9(4), pp. 657-666.
[25] Neidert, M. R., Wille, J. J., and Tranquillo, R. T., 2002, "Development and characterization of improved tissue engineered valve-equivalents using chemical and mechanical signaling," Proceedings of the Second Joint EMBS/BMES Conference, IEEE, Houston, TX, pp. 858-859.
[26] Ferri, F., Greco, M., Giuseppe, A., Spirito, M., and Rocco, M., 2002, "Structure of fibrin gels studied by elastic light scattering technicques: Dependence of fractal dimension, gel crossover length, fiber diameter, and fiber density on monomer concentration," Physica Review E, 66, pp. 011913-011911,-011913-011913.
[27] Clark, R. A., Nielsen, L. D., Welch, M. P., and McPherson, J. M., 1995, "Collagen matrices attenuate the collagen-synthetic response of cultured fibroblasts to TGF-beta," Journal of Cell Science, 108(Pt 3), pp. 1251-1261.
[28] Prajapati, R. T., Chavally-Mis, B., Herbage, D., Eastwood, M., and Brown, R. A., 2000, "Mechanical loading regulates protease production by fibroblasts in three-dimensional collagen substrates," Wound Repair Regen, 8(3), pp. 226-237.
[29] Roeder, B., Kokini, K., Sturgis, J., Robinson, P. J., and Voytik-Harbin, S., 2002, "Tensile mechanical properties of three-dimensional type 1 collagen extracellular matrices with varied microstructure," Journal of Biomechanical Engineering, 124.
48

Chapter 3: Equibiaxial cyclic stretch stimulates fibroblasts to rapidly remodel fibrin
[30] Carr, M. E., and Carr, S. L., 1995, "Fibrin structure and concentration alter clot elastic modulus but do not alter platelet mediated force development," Blood coagulation and fibrinolysis, 6, pp. 79-86.
49

CHAPTER 4
Magnitude and duration of stretch modulate fibroblast remodeling of fibrin gels
(Balestrini, J. L. and Billiar, K. L. 2009.. J Biomech Eng 131, 051005, reprinted with permission)
4.1. Introduction
Cells within skin and other connective tissues are continuously subjected to a range of
mechanical forces from external loading and cell-generated tension. These mechanical cues
guide fibroblast-mediated tissue remodeling and ultimately regulate the structure of a stable and
well-structured extracellular matrix (ECM) optimized to resist these loads [1]. When the ECM is
disrupted due to injury, the loads applied to the cells are substantially altered which, in turn,
leads to an increase in cell-generated forces and remodeling of the tissue architecture. The
increase in cell-generated tension results in alignment of the collagen-rich ECM along these lines
of tension, creating scar tissue with lower strength, compliance, and capacity to withstand
multiaxial loads as compared to normal tissue. In addition, this increase in cell-generated force
creates the potential for contracture and deformity [2].
Stretching wounds during healing (e.g., range of motion exercises, splinting, vacuum pressure) is
used routinely by clinicians to attain improved tissue properties and manipulate healing rates and
may aid in obtaining a stable bond between the skin and percutaneous devices [2-4]. In
experimental models, the use of mechanical stimulation during wound healing has been shown to
increase collagen production and decrease contracture of granulation tissue [5]. Alternatively,
increased loading of the dermis is also associated with negative effects such as excessive
collagen production and contracture, common processes found in many fibrocontractive diseases
[6-8]. Clearly, determining loading regimens that promote the desired aspects of healing without
stimulating detrimental side effects would be of obvious benefit.
50
CChhaapptteerr 44:: MMaaggnniittuuddee aanndd dduurraattiioonn ooff ssttrreettcchh mmoodduullaattee ffiibbrroobbllaasstt rreemmooddeelliinngg ooff ffiibbrriinn ggeellss
Similar to observations in vivo, researchers have demonstrated that mechanical conditioning
tissue models in vitro results in stronger, stiffer tissue as compared to statically cultured controls
[8-15]. The most common three-dimensional (3D) tissue models utilized for mechanobiological
studies are cell-populated collagen and fibrin gels [16]. Collagen gels have been extensively
utilized as tissue models to investigate the interplay between tissue mechanics, cell-matrix
interactions, and mechanobiology in a controlled in vitro manner as they allow for precise
control over culture conditions, specimen composition, and boundary conditions [14, 17-19].
These connective tissue analogs form the dermal component of clinically-available tissue
engineered skin replacements, yet they lack sufficient mechanical integrity and durability for
clinical usage in load-bearing applications [20]. Fibrin gels were initially developed to model
the early stages of connective tissue healing (fibroplasia) for mechanobiological studies, recently
these constructs have emerged for use as tissue engineering scaffolds. Fibrin gels are initially
very weak but, unlike collagen gels, do not inhibit ECM production and achieve tissue-like
strength following sufficient synthesis and assembly of collagen [9, 20-25]. These systems
therefore have a strong potential for use as tissue replacements in wound healing therapy and
regenerative medicine and for restoring functionality to damaged or diseased tissue [21, 24, 26].
Although much has been learned about the mechanisms of strain-dependent remodeling by
utilizing collagen and fibrin gels [10, 25, 27], the combinations of strain levels, ranges, and
durations utilized thus far are not sufficient to characterize the complex relationships between
mechanical loading parameters (magnitude, duration, etc.) and remodeling parameters (strength,
stiffness, alignment, etc.). Quantitative dose-response curves would aid in the rational design of
therapies and would assist in the understanding and prevention of scarring.
The goal of this investigation is to quantitatively study the relationship between stretch
magnitude and duration on the changes in matrix mechanics and composition in a 3D planar
model of wound healing. The present work follows a previous study where we observed that
cyclic equibiaxial stretch at 16% for 24 hours per day dramatically increases the collagen content
and tissue strength of fibroblast-populated fibrin gels [13]. In this study, these tissue models are
cycled as little as 2% and as much as 16% equibiaxially for 6 or 24 hours per day. We
hypothesize that the extent of matrix remodeling increases proportionally with the magnitude of
stretch and the number of hours of stretch per day. This work will extend our knowledge of how
51
CChhaapptteerr 44:: MMaaggnniittuuddee aanndd dduurraattiioonn ooff ssttrreettcchh mmoodduullaattee ffiibbrroobbllaasstt rreemmooddeelliinngg ooff ffiibbrriinn ggeellss
mechanical cues can be used to manipulate key properties of healing wounds and also contribute
valuable information for the creation of custom tailored tissue equivalents based on cell-
populated fibrin gels.
4.2. Materials and Methods
4.2.1. Fabrication of fibrin gels
Fibroblast-populated fibrin gels were produced as previously described [13]. Briefly, bovine
fibrinogen and thrombin (Sigma, St. Louis, MO) were combined with passage 7-9 human
foreskin fibroblasts (American Type Culture Collection, Manassas, VA) in Dulbecco’s Modified
Eagle Medium (DMEM, Mediatech, Herndon, VA) supplemented with 10% bovine calf serum,
(BCS, HyClone, Logan, UT), 100 units/mL penicillin G sodium, 100 μg/mL streptomycin
sulfate, and 250 ng/mL amphotericin B (Gibco, Grand Island, NY). The final concentrations of
the constituents were 0.2 U/mL thrombin, 3.8 mg/mL fibrinogen (Sigma, St. Louis, MO), and
500,000 cells/mL. The fibrin and cell solution (3 mL) was poured into six 35 mm diameter
untreated flexible-bottom culture wells with circular fibrous foam anchors (Flexcell Intl.,
Hillsborough, NC) and allowed to polymerize for 24 hours prior to mechanical stimulation. The
gels were cultured at 37° C with humidified 10% CO2. DMEM supplemented with 10% fetal
bovine serum (FBS, Hyclone), 25 g/L L-ascorbate (Wako, Richmond, VA), 0.5 mL/L insulin
(Sigma), 100 units/mL penicillin G sodium, 100 μg/mL streptomycin sulfate, and 250 ng/mL
amphotericin B (Gibco) was changed every other day.
4.2.2. Application of stretch
A vacuum-driven loading device (FX-4000T, Flexcell Intl.) was utilized to apply uniform
equibiaxial cyclic stretch to the fibrin gels as previously described [13]. The gels were cultured
statically (control), or subjected to either continuous stretch (24 hr/day) or intermittent stretch (6
hr/day) with a sinusoidal waveform at 2, 4, 8 or 16% equibiaxial stretch at a frequency of 0.2 Hz
for eight days. One limitation of the standard Flexcell system is that only one magnitude of
stretch can be attained at any given time. Therefore, in the continuously stretched group there is
52
CChhaapptteerr 44:: MMaaggnniittuuddee aanndd dduurraattiioonn ooff ssttrreettcchh mmoodduullaattee ffiibbrroobbllaasstt rreemmooddeelliinngg ooff ffiibbrriinn ggeellss
an individual set of parallel controls for each treatment group (i.e., each stretch magnitude); data
from samples in the continuously stretched groups were normalized with respect to the parallel
statically-cultured controls. At the conclusion of each experiment, samples were processed for
biochemical, histological, or mechanical testing as described below.
To apply intermittent stretch, gels were cyclically stretched for 6 hours per day. The 6-well
plates were then removed from the stretch device and cultured statically for the remaining 18
hours of each day for eight days. The same stretch magnitudes and frequency were used for the
intermittently stretched fibrin gels as the continuously stretched gels. At the conclusion of each
experiment, the gels were characterized identically to the continuously stretched gels (see
below). In addition, sub-failure biaxial testing was performed on a subset of the samples from
this group as described in the “Low force biaxial mechanical characterization” section. Since
each of the four groups is cultured only six hours each day, all four magnitudes were performed
in parallel with one statically-cultured control group.
4.2.3. Determination of cell number and total collagen content
Cell number was determined by liberating the cells from the inner 25 mm diameter area of the
fibrin gels by treating the gels with 0.05% trypsin (Gibco) and 2 mg/mL type 1 collagenase
(Sigma) for 30 min at 37°C. Samples (refer to Tables 2 and 3 for sample sizes) were stained
with trypan blue and the cell number was quantified using a hemocytometer. Collagen content
was quantified by the hydroxyproline assay [28]. The amount of collagen was estimated using a
conversion of 0.13 grams of hydroxyproline per gram of collagen [29], and the accuracy of each
assay was verified with a 1 mg/mL collagen standard (Sircol, Biocolor, Westbury, NY).
Collagen density was quantified as the dry weight of collagen per volume of each gel, as
determined by multiplying measured thickness (described below) by the area of inner 25 mm
diameter section removed from the anchors for analysis.
53

CChhaapptteerr 44:: MMaaggnniittuuddee aanndd dduurraattiioonn ooff ssttrreettcchh mmoodduullaattee ffiibbrroobbllaasstt rreemmooddeelliinngg ooff ffiibbrriinn ggeellss
4.2.4. Determination of physical properties
The thickness, ultimate tensile strength (UTS), failure tension, and extensibility of the samples
were calculated as described in detail previously [13] and outlined briefly below. To eliminate
active tissue retraction prior to testing, the actin-rich cytoskeletons of the fibroblasts were
depolymerized by treating the all of the samples with 6 μM cytochalasin D (Sigma) for four
hours. Following cytochalasin D treatment, the central 25 mm section of each fibrin gel was cut
from the anchors and carefully lifted from the flexible bottom membranes.
To perform a compaction assay, a standard method to measure the capacity of fibroblasts to
remodel ECM components [30], sample thickness was quantified by placing a small reflective
disk (1.3g, 13 mm diameter) onto the centermost region of the sample and allowing the tissue to
reach equilibrium. The height was recorded using a laser displacement system, or LDS (± 10
μm, LK-081, Keyence, Woodcliff Lake, NJ). Using a custom equibiaxial tissue inflation system
[31], the tissue sample was circularly clamped and the centermost 5 mm section was inflated
with isotonic room temperature saline until burst. The displacement was measured in the center
of the sample by the LDS, and pressure during inflation was measured by a pressure transducer
(± 0.13 kPa). The radius of curvature at failure, R, was determined from the sample height
assuming a spherical cap geometry (validated in Billiar et al. [31]). The tension at failure, T,
was then determined using the Law of Laplace, T = ½PR, where P is the burst pressure. The
UTS was defined as the tension at failure divided by the undeformed thickness of the fibrin gel
(as measured by the LDS). The extensibility was defined as the (equibiaxial) Green’s strain at
the center of the sample at the failure pressure as defined in [32]. The sample numbers for each
treatment group are given in Tables 2 and 3.
4.2.5. Low-force biaxial mechanical characterization
To investigate the effects of stretch magnitude on matrix stiffness, the Young’s modulus of a
subset of the intermittently stretched fibrin gels was determined using planar biaxial testing.
Samples were removed from their silicone substrates and the thickness was measured with the
LDS (as described above). To ensure the stiffness measurements would not be affected by the
foam anchor, the anchor was cut radially into 20 equal sections from the fibrin-foam anchor
54

CChhaapptteerr 44:: MMaaggnniittuuddee aanndd dduurraattiioonn ooff ssttrreettcchh mmoodduullaattee ffiibbrroobbllaasstt rreemmooddeelliinngg ooff ffiibbrriinn ggeellss
interface to the outer edge of the anchor. To attach the sample to the device, sixteen stainless
steel hooks (four on each “side” of the sample) were attached to the fibrous foam anchor sections
surrounding each sample; the four “corner” segments were not utilized as indicated by blank
spaces around the edge of the sample in Figure 1. The sample was placed in a temperature-
controlled, isotonic saline-filled bath (maintained at 37° C), and the hooks were attached with
nylon suture to a dual pulley system which distributes equal force to each of the four hooks on
each side of the sample. Each pulley system was attached to an actuator by a 7.6 cm plexiglass
arm extending out of the bath either directly or via a torque transducer (0.15 N-m, Futek) which
was used to measure force with ± 4 mN accuracy. Small styrofoam floats were placed at the
base of each hook to maintain buoyancy of the sample.
Fig 4.1. Schematics representing A) fibrin gel with foam anchor attached prior to and B) after loading onto the biaxial device. The dotted lines represent areas to be sectioned, and the holes represent areas the hooks will be placed. The four arrows in the x and y axis represent force at each of the tethering points. Note that the force is distributed equally at each loading point.
The actuators were drawn apart until the sample was restored to the original outer dimensions,
and four small marker chips were affixed on the central region of the sample to form a 7 mm
square region. Digital images were acquired using an analog video camera (XC-ST50, Sony)
and an image acquisition board (PCI-1405, National Instruments, Austin, TX), and a custom
video marker-tracking algorithm was used to track the markers. A sub-region was automatically
positioned on each marker, and displacements were calculated using Labview (National
Instruments). Each specimen was preconditioned with ten cycles to 10% equibiaxial engineering
strain quasistatically at a strain rate of 0.01 s-1. Engineering stress was calculated by dividing the
force by the cross-sectional area of the tissue. The cross-sectional area of the tissue was
measured by multiplying the sample width (the distance between the hooks, or 25 mm) by the
tissue thickness. The Young’s modulus for each sample was determined by fitting data from the
final equibiaxial protocol to the equation for a homogeneous linear elastic solid using MATLAB
55
CChhaapptteerr 44:: MMaaggnniittuuddee aanndd dduurraattiioonn ooff ssttrreettcchh mmoodduullaattee ffiibbrroobbllaasstt rreemmooddeelliinngg ooff ffiibbrriinn ggeellss
(Mathworks, Inc., Natick, MA) software. The structural stiffness was calculated by multiplying
the Young’s modulus by the thickness of the sample.
4.2.6. Retraction assay
After the total culture period of 9 days, a subset of fibrin gels from each group was gently
released from their wells and placed in a 35 mm Petri dish filled with warm culture media. The
tissues are permitted to freely and rapidly retract within the petri dish, allowing for measurement
of both the passive prestrain of the matrix (due to fibroblast pretension), and the active
recontractile capacity of the cells (Figure 4). Digital images were acquired at 0, 1, 2, 3, 4, 5, 10,
15, 20, 25, and 30 minutes following release using a Flour-S MultiImager system (Biorad,
Hercules, CA) and analyzed for gel area, A, as a function of time post-release. Total percent
retraction (RT = (1-A/A0) * 100%) was calculated at each time point. In order to determine the
active retraction, RA, passive retraction, Ro, and time constant of retraction, τ, the total retraction
as a function of time, t, was fit to the equation:
o
t
AT ReRR +−=−
)1( τ . (4.1)
The optimal parameter values (RA, Ro, τ) were determined using MATLAB (Mathworks, INC.)
by minimization of least squares error.
To ensure that our calculated value of the intercept, R0, represents an accurate measurement of
the passive component of the total retraction, a separate subset of samples was treated with 6 μM
cytochalasin D (for four hours), allowed to retract, and the resulting percent retraction compared
to the calculated value of R0 (data not shown). As passive retraction is not a common
engineering metric for remodeling, we also calculate the residual strain, or effective prestrain, in
the matrix using the following equation:
i
ifpre d
dd ) -(=ε (4.2)
56
CChhaapptteerr 44:: MMaaggnniittuuddee aanndd dduurraattiioonn ooff ssttrreettcchh mmoodduullaattee ffiibbrroobbllaasstt rreemmooddeelliinngg ooff ffiibbrriinn ggeellss
where the initial diameter (di) is defined as the dimension following release of prestress
(calculated from the fit parameter R0 above), and the final diameter (df = 25 mm) is defined as
the diameter of the sample when attached to the anchor (with residual stress).
4.2.7. Histological analysis
Representative samples from each group were fixed in buffered formalin while still attached to
the anchors for 18-20 hours at 4° C and stored in 70% ethanol for histological evaluation. The
samples were then removed from their anchors and silicone membranes, embedded in paraffin,
cut into 4 μm sections, and then stained with hematoxylin and eosin (H&E). Micrographs were
taken with a Nikon Eclipse E600 camera at a magnification of 200X.
4.2.8. Statistical and regression analysis
Data are presented as mean ± standard deviation. For each treatment group, all remodeling
metrics were normalized to the respective statically cultured control groups. To determine trends
in remodeling metrics, the normalized data were first analyzed using a two-way ANOVA
(SigmaStat, Systat Inc., San Jose, CA) to isolate factors with statistically significant effects and
power. The factors analyzed in the ANOVA were stretch magnitude (M), duration of stretch per
day (set to 0 for 24 hr/day and 1 for 6 hr/day), and the interaction term (I) between these factors
(defined as the magnitude factor times the duration factor). If factors were found to have
sufficient statistical significance (p < 0.05) and power (≥ 0.8) in the ANOVA, they were further
analyzed for trends using regression analysis (SAS Institute Inc., Cary, NC). The coefficient of
determination (R2) and the root mean squared error (RMS) were used to assess the goodness of
fit to the models.
57
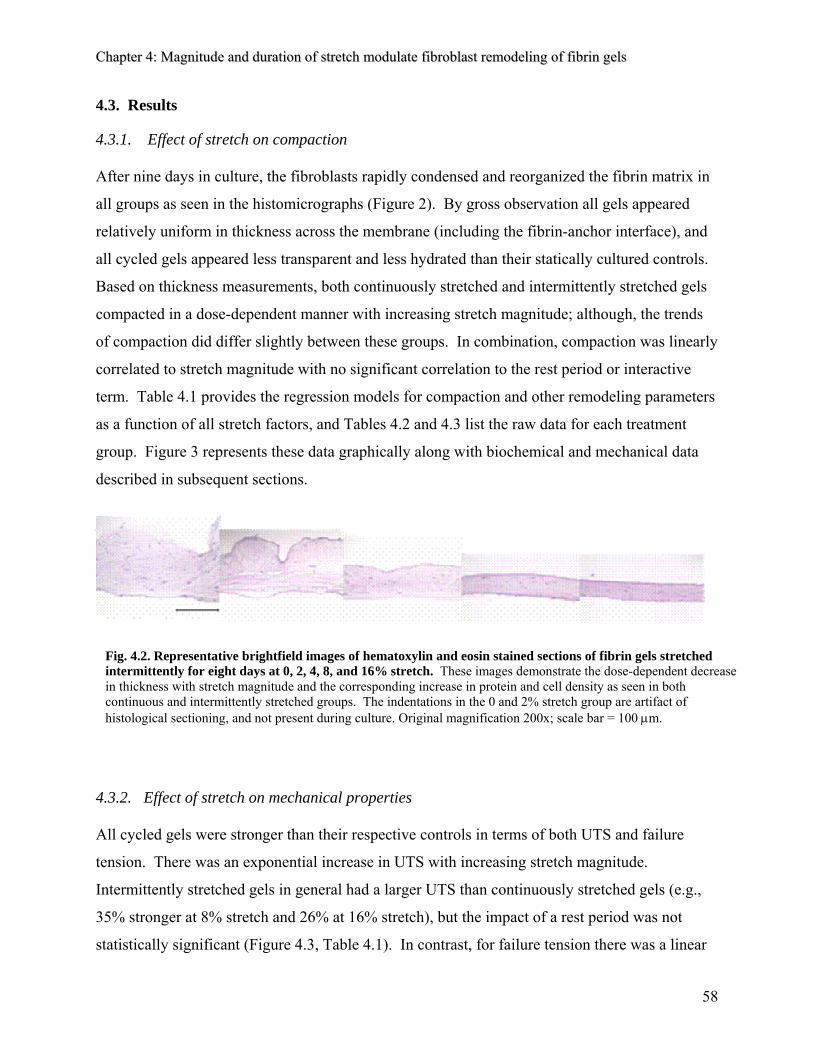
CChhaapptteerr 44:: MMaaggnniittuuddee aanndd dduurraattiioonn ooff ssttrreettcchh mmoodduullaattee ffiibbrroobbllaasstt rreemmooddeelliinngg ooff ffiibbrriinn ggeellss
4.3. Results
4.3.1. Effect of stretch on compaction
After nine days in culture, the fibroblasts rapidly condensed and reorganized the fibrin matrix in
all groups as seen in the histomicrographs (Figure 2). By gross observation all gels appeared
relatively uniform in thickness across the membrane (including the fibrin-anchor interface), and
all cycled gels appeared less transparent and less hydrated than their statically cultured controls.
Based on thickness measurements, both continuously stretched and intermittently stretched gels
compacted in a dose-dependent manner with increasing stretch magnitude; although, the trends
of compaction did differ slightly between these groups. In combination, compaction was linearly
correlated to stretch magnitude with no significant correlation to the rest period or interactive
term. Table 4.1 provides the regression models for compaction and other remodeling parameters
as a function of all stretch factors, and Tables 4.2 and 4.3 list the raw data for each treatment
group. Figure 3 represents these data graphically along with biochemical and mechanical data
described in subsequent sections.
Fig. 4.2. Representative brightfield images of hematoxylin and eosin stained sections of fibrin gels stretched intermittently for eight days at 0, 2, 4, 8, and 16% stretch. These images demonstrate the dose-dependent decrease in thickness with stretch magnitude and the corresponding increase in protein and cell density as seen in both continuous and intermittently stretched groups. The indentations in the 0 and 2% stretch group are artifact of histological sectioning, and not present during culture. Original magnification 200x; scale bar = 100 μm.
4.3.2. Effect of stretch on mechanical properties
All cycled gels were stronger than their respective controls in terms of both UTS and failure
tension. There was an exponential increase in UTS with increasing stretch magnitude.
Intermittently stretched gels in general had a larger UTS than continuously stretched gels (e.g.,
35% stronger at 8% stretch and 26% at 16% stretch), but the impact of a rest period was not
statistically significant (Figure 4.3, Table 4.1). In contrast, for failure tension there was a linear
58

CChhaapptteerr 44:: MMaaggnniittuuddee aanndd dduurraattiioonn ooff ssttrreettcchh mmoodduullaattee ffiibbrroobbllaasstt rreemmooddeelliinngg ooff ffiibbrriinn ggeellss
dependence on both stretch magnitude the interaction between stretch magnitude and the rest
period (Table 4.1). Specifically, the failure tension increased with increasing stretch magnitude
in the intermittently stretched gels (Figure 4.1, Table 4.3) whereas the failure tension increased
uniformly at all stretch magnitudes in gels cycled continuously (13-17% greater tension at failure
relative to respective controls; Table 4.2). The extensibility increased with increasing stretch
magnitude in the intermittent stretch group; no trend in extensibility with magnitude was
observed in the continuously stretched group.
Fig. 4.3. A) Tissue thickness, B) UTS, C) collagen density, D) extensibility, E) failure tension, F) stiffness, G) active retraction, H) passive retraction and I) cell number of CS (24 hr/day), and IS (6 hr/day) fibrin gels cycled at 2, 4, 8, and 16% stretch for 8 days at 0.2 Hz, and normalized to statically cultured controls from each experiment. Note that UTS, stiffness, and collagen density are, by definition, directly dependent upon the thickness, whereas the other parameters are independent of the degree of compaction. For clarity, statistical models are provided i bl 1
59
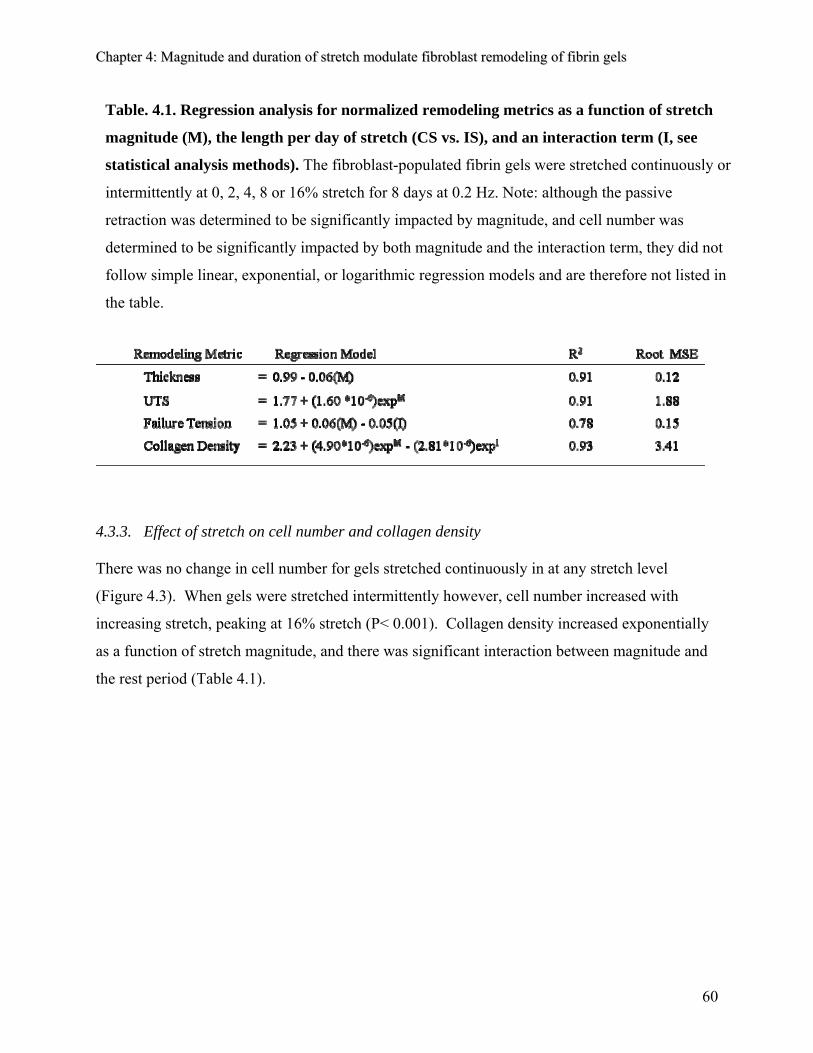
CChhaapptteerr 44:: MMaaggnniittuuddee aanndd dduurraattiioonn ooff ssttrreettcchh mmoodduullaattee ffiibbrroobbllaasstt rreemmooddeelliinngg ooff ffiibbrriinn ggeellss
Table. 4.1. Regression analysis for normalized remodeling metrics as a function of stretch
magnitude (M), the length per day of stretch (CS vs. IS), and an interaction term (I, see
statistical analysis methods). The fibroblast-populated fibrin gels were stretched continuously or
intermittently at 0, 2, 4, 8 or 16% stretch for 8 days at 0.2 Hz. Note: although the passive
retraction was determined to be significantly impacted by magnitude, and cell number was
determined to be significantly impacted by both magnitude and the interaction term, they did not
follow simple linear, exponential, or logarithmic regression models and are therefore not listed in
the table.
4.3.3. Effect of stretch on cell number and collagen density
There was no change in cell number for gels stretched continuously in at any stretch level
(Figure 4.3). When gels were stretched intermittently however, cell number increased with
increasing stretch, peaking at 16% stretch (P< 0.001). Collagen density increased exponentially
as a function of stretch magnitude, and there was significant interaction between magnitude and
the rest period (Table 4.1).
60
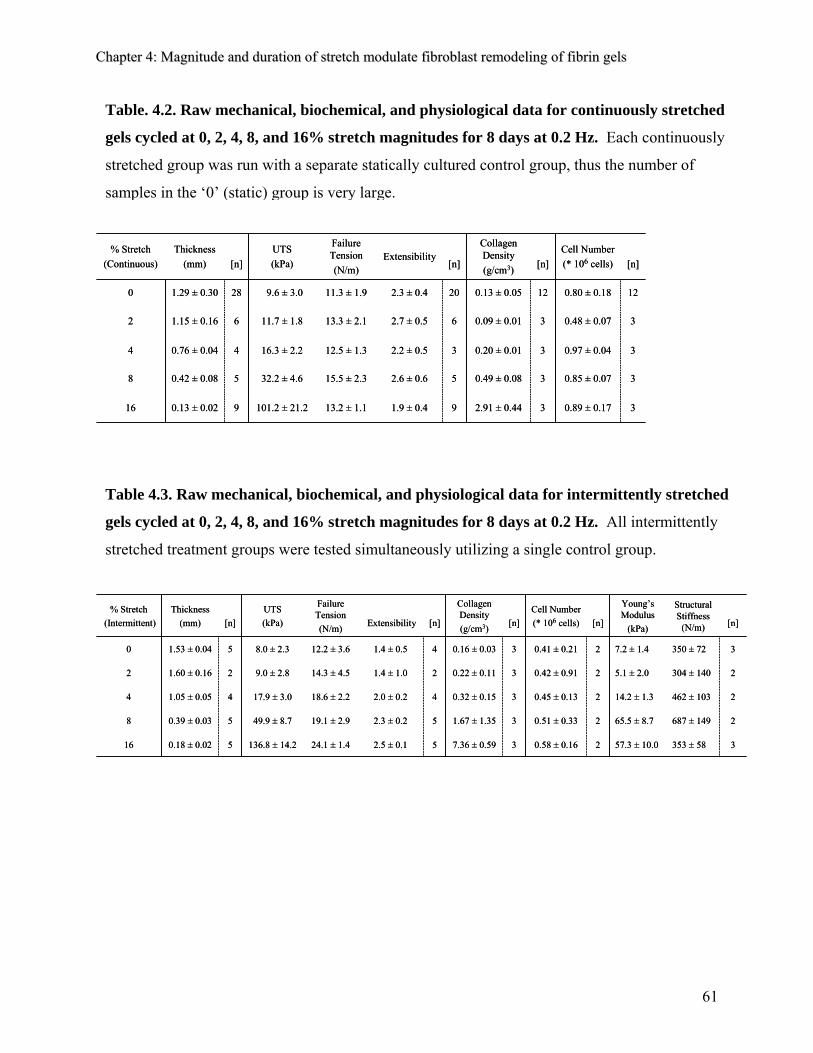
CChhaapptteerr 44:: MMaaggnniittuuddee aanndd dduurraattiioonn ooff ssttrreettcchh mmoodduullaattee ffiibbrroobbllaasstt rreemmooddeelliinngg ooff ffiibbrriinn ggeellss
Table. 4.2. Raw mechanical, biochemical, and physiological data for continuously stretched
gels cycled at 0, 2, 4, 8, and 16% stretch magnitudes for 8 days at 0.2 Hz. Each continuously
stretched group was run with a separate statically cultured control group, thus the number of
samples in the ‘0’ (static) group is very large.
3
3
3
3
12
[n]
3
3
3
3
12
[n]
2.91 ± 0.44
0.49 ± 0.08
0.20 ± 0.01
0.09 ± 0.01
0.13 ± 0.05
Collagen Density (g/cm3)
Thickness(mm)
0.13 ± 0.02
0.42 ± 0.08
0.76 ± 0.04
1.15 ± 0.16
1.29 ± 0.30 0.80 ± 0.18202.3 ± 0.4 11.3 ± 1.9 9.6 ± 3.0280
0.48 ± 0.0762.7 ± 0.5 13.3 ± 2.1 11.7 ± 1.862
0.97 ± 0.0432.2 ± 0.512.5 ± 1.316.3 ± 2.2 44
0.85 ± 0.0752.6 ± 0.615.5 ± 2.3 32.2 ± 4.658
0.89 ± 0.1791.9 ± 0.4 13.2 ± 1.1 101.2 ± 21.2916
Cell Number(* 106 cells)[n]
ExtensibilityFailure Tension (N/m)
UTS(kPa)[n]
% Stretch(Continuous)
3
3
3
3
12
[n]
3
3
3
3
12
[n]
2.91 ± 0.44
0.49 ± 0.08
0.20 ± 0.01
0.09 ± 0.01
0.13 ± 0.05
Collagen Density (g/cm3)
Thickness(mm)
0.13 ± 0.02
0.42 ± 0.08
0.76 ± 0.04
1.15 ± 0.16
1.29 ± 0.30 0.80 ± 0.18202.3 ± 0.4 11.3 ± 1.9 9.6 ± 3.0280
0.48 ± 0.0762.7 ± 0.5 13.3 ± 2.1 11.7 ± 1.862
0.97 ± 0.0432.2 ± 0.512.5 ± 1.316.3 ± 2.2 44
0.85 ± 0.0752.6 ± 0.615.5 ± 2.3 32.2 ± 4.658
0.89 ± 0.1791.9 ± 0.4 13.2 ± 1.1 101.2 ± 21.2916
Cell Number(* 106 cells)[n]
ExtensibilityFailure Tension (N/m)
UTS(kPa)[n]
% Stretch(Continuous)
Table 4.3. Raw mechanical, biochemical, and physiological data for intermittently stretched
gels cycled at 0, 2, 4, 8, and 16% stretch magnitudes for 8 days at 0.2 Hz. All intermittently
stretched treatment groups were tested simultaneously utilizing a single control group.
3
2
2
2
3
[n]
2
2
2
2
2
[n]
0.58 ± 0.16
0.51 ± 0.33
0.45 ± 0.13
0.42 ± 0.91
0.41 ± 0.21
Cell Number(* 106 cells)
5
5
4
2
4
[n]
136.8 ± 14.2
49.9 ± 8.7
17.9 ± 3.0
9.0 ± 2.8
8.0 ± 2.3
UTS(kPa)
353 ± 58
687 ± 149
462 ± 103
304 ± 140
350 ± 72
Structural Stiffness
(N/m)
57.3 ± 10.0
65.5 ± 8.7
14.2 ± 1.3
5.1 ± 2.0
7.2 ± 1.4
Young’s Modulus
(kPa)
30.16 ± 0.031.4 ± 0.5 12.2 ± 3.6 51.53 ± 0.04 0
30.22 ± 0.111.4 ± 1.014.3 ± 4.5 21.60 ± 0.16 2
30.32 ± 0.152.0 ± 0.218.6 ± 2.2 41.05 ± 0.05 4
31.67 ± 1.352.3 ± 0.2 19.1 ± 2.9 50.39 ± 0.03 8
37.36 ± 0.592.5 ± 0.1 24.1 ± 1.450.18 ± 0.02 16
[n]
Collagen Density (g/cm3)Extensibility
Failure Tension (N/m)[n]
Thickness(mm)
% Stretch(Intermittent)
3
2
2
2
3
[n]
2
2
2
2
2
[n]
0.58 ± 0.16
0.51 ± 0.33
0.45 ± 0.13
0.42 ± 0.91
0.41 ± 0.21
Cell Number(* 106 cells)
5
5
4
2
4
[n]
136.8 ± 14.2
49.9 ± 8.7
17.9 ± 3.0
9.0 ± 2.8
8.0 ± 2.3
UTS(kPa)
353 ± 58
687 ± 149
462 ± 103
304 ± 140
350 ± 72
Structural Stiffness
(N/m)
57.3 ± 10.0
65.5 ± 8.7
14.2 ± 1.3
5.1 ± 2.0
7.2 ± 1.4
Young’s Modulus
(kPa)
30.16 ± 0.031.4 ± 0.5 12.2 ± 3.6 51.53 ± 0.04 0
30.22 ± 0.111.4 ± 1.014.3 ± 4.5 21.60 ± 0.16 2
30.32 ± 0.152.0 ± 0.218.6 ± 2.2 41.05 ± 0.05 4
31.67 ± 1.352.3 ± 0.2 19.1 ± 2.9 50.39 ± 0.03 8
37.36 ± 0.592.5 ± 0.1 24.1 ± 1.450.18 ± 0.02 16
[n]
Collagen Density (g/cm3)Extensibility
Failure Tension (N/m)[n]
Thickness(mm)
% Stretch(Intermittent)
61

CChhaapptteerr 44:: MMaaggnniittuuddee aanndd dduurraattiioonn ooff ssttrreettcchh mmoodduullaattee ffiibbrroobbllaasstt rreemmooddeelliinngg ooff ffiibbrriinn ggeellss
4.3.4. Effect of stretch on matrix retraction
After release, all fibrin gels rapidly retracted due to a combination of prestress in the matrix and
active cellular contraction, decreasing in projected area by approximately 60% or more within 10
minutes (e.g., see Figure 4.4). Overall trends in retraction for gels cycled at 0, 2, 4, 8, and 16%
strain were very similar between gels cycled continuously (n =16, 2, 3, 3, and 7, respectively)
and intermittently (n =3, 3, 3, 3, and 2, respectively). Although stretch magnitude was
determined to be a statistically significant parameter governing passive retraction (Ro) per the
ANOVA, the data does not follow a simple trend (linear, exponential, or logarithmic). Further,
despite a consistent decrease in active cell-mediated matrix retraction (RA) in the 2% stretched
gels for both groups, there was no statistical dependence of this remodeling metric on the stretch
magnitude or duration. The effective prestrain (εr) values for the groups cycled continuously to
0, 2, 4, 8, and 16% were 42±17, 17±5, 29±1, 30±1, and 25±11 %, respectively, and the
intermittently cycled groups were, 10±2, 13±4, 9±3, 8±3, and 4±1 %, respectively.
The time constants of retraction for the groups cycled continuously to 0, 2, 4, 8, and 16% were
8±3, 5±3, 8±1, 7±2, and 7±4 minutes, respectively. The time constants of retraction for the
intermittently cycled groups to 0, 2, 4, 8, and 16% were 10±2, 13±4, 9±3, 8±3, and 4±2 minutes,
respectively. There was no correlation between stretch magnitude and the rate at which the
matrices retracted, and there was no significant effect of the duration (6 vs. 24 hrs/day) on the
rate of retraction.
62
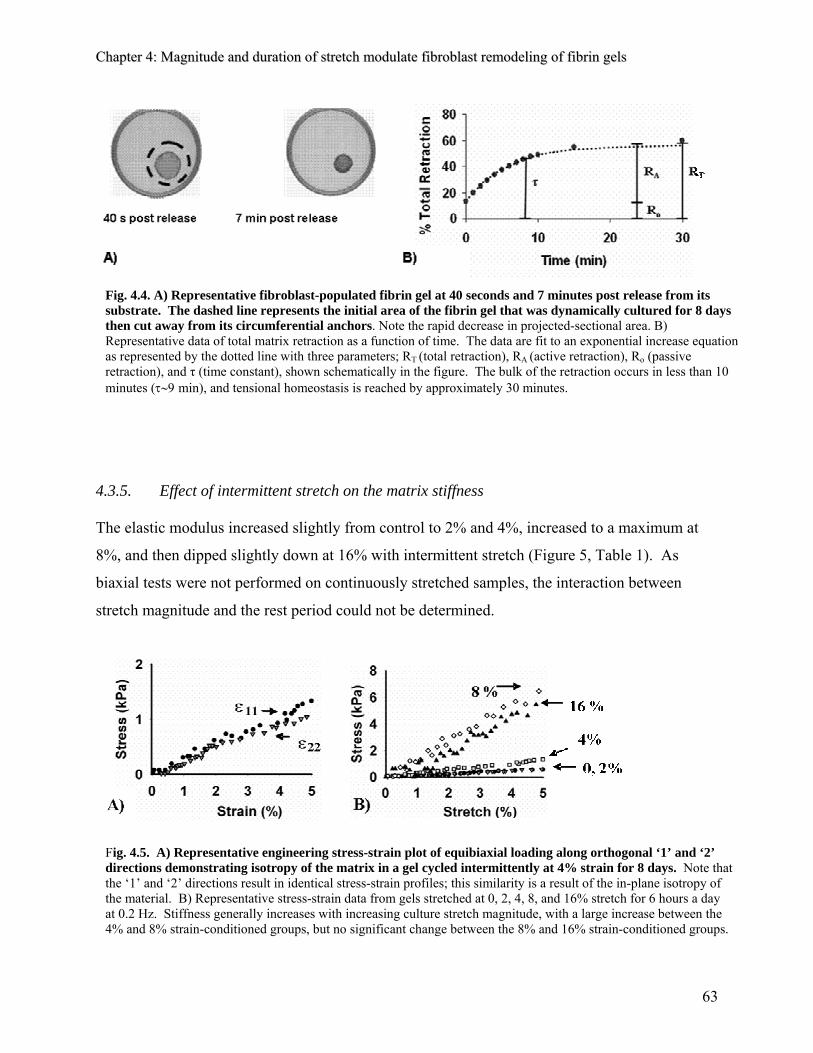
CChhaapptteerr 44:: MMaaggnniittuuddee aanndd dduurraattiioonn ooff ssttrreettcchh mmoodduullaattee ffiibbrroobbllaasstt rreemmooddeelliinngg ooff ffiibbrriinn ggeellss
Fig. 4.4. A) Representative fibroblast-populated fibrin gel at 40 seconds and 7 minutes post release from its substrate. The dashed line represents the initial area of the fibrin gel that was dynamically cultured for 8 days then cut away from its circumferential anchors. Note the rapid decrease in projected-sectional area. B) Representative data of total matrix retraction as a function of time. The data are fit to an exponential increase equation as represented by the dotted line with three parameters; RT (total retraction), RA (active retraction), Ro (passive retraction), and τ (time constant), shown schematically in the figure. The bulk of the retraction occurs in less than 10 minutes (τ∼9 min), and tensional homeostasis is reached by approximately 30 minutes.
4.3.5. Effect of intermittent stretch on the matrix stiffness
The elastic modulus increased slightly from control to 2% and 4%, increased to a maximum at
8%, and then dipped slightly down at 16% with intermittent stretch (Figure 5, Table 1). As
biaxial tests were not performed on continuously stretched samples, the interaction between
stretch magnitude and the rest period could not be determined.
Fig. 4.5. A) Representative engineering stress-strain plot of equibiaxial loading along orthogonal ‘1’ and ‘2’ directions demonstrating isotropy of the matrix in a gel cycled intermittently at 4% strain for 8 days. Note that the ‘1’ and ‘2’ directions result in identical stress-strain profiles; this similarity is a result of the in-plane isotropy of the material. B) Representative stress-strain data from gels stretched at 0, 2, 4, 8, and 16% stretch for 6 hours a day at 0.2 Hz. Stiffness generally increases with increasing culture stretch magnitude, with a large increase between the 4% and 8% strain-conditioned groups, but no significant change between the 8% and 16% strain-conditioned groups.
63

CChhaapptteerr 44:: MMaaggnniittuuddee aanndd dduurraattiioonn ooff ssttrreettcchh mmoodduullaattee ffiibbrroobbllaasstt rreemmooddeelliinngg ooff ffiibbrriinn ggeellss
4
E
remodeling is an important step towards rational design of manual therapies for wound healing
nd harnessing stretch as a means to custom tailor tissue analogs with specific requirements (e.g.,
strength, stiffness, contractility). In this study, using multiple levels of equibiaxial stretch, we
trength, stiffness, and the accumulation of collagen increased with
tly or
the findings of others that cyclically
stretching cell-populated biopolymer gels results in significant increases in mechanical properties
, 8, 10-13, 19, 21, 23, 25, 27, 33-35]. We found that fibrin gels cycled continuously at 8%
strain show comparable increases in UTS as collagen gels (~ 3 fold increase in gels stretched
eases than reported in collagen-
.4. Discussion
stablishing quantitative relationships between mechanical simulation and extracellular matrix
a
determined that tissue s
increasing stretch magnitude. Further, we discovered that while compaction and compaction-
related remodeling (e.g., UTS) were highly dependent on stretch magnitude, stretch-induced
increases in structural properties (e.g., failure tension) were contingent upon a rest period. These
results demonstrate that the magnitude and the duration per day of stretch are both critical
parameters in matrix remodeling and suggest that these two factors can be used independen
in concert to manipulate different aspects of remodeling.
4.4.1. Cyclic stretch increases tissue strength in fibrin gels
The data from this study confirm our previous results and
[1
uniaxially at 10% strain for 8 days) [12] and even greater incr
fibrin gels (~ 1.3 fold in gels stretched uniaxially at 10% strain for 8 days) [9]. Despite these
large increases in tissue strength, the UTS of the fibrin gels (~ 30 kPa) is still substantially lower
than those reported for collagen or collagen-fibrin gels (~ 60 kPa). As these gels are
predominately composed of fibrin after only nine days in culture [13], and fibrin is generally
weaker than collagen [9], this outcome is to be expected. Alternatively, the gels in this study
may have lower UTS values than previously reported due to minimal in-plane alignment
compared to gels cultured while being uniaxially stretched and tested uniaxially [13].
64
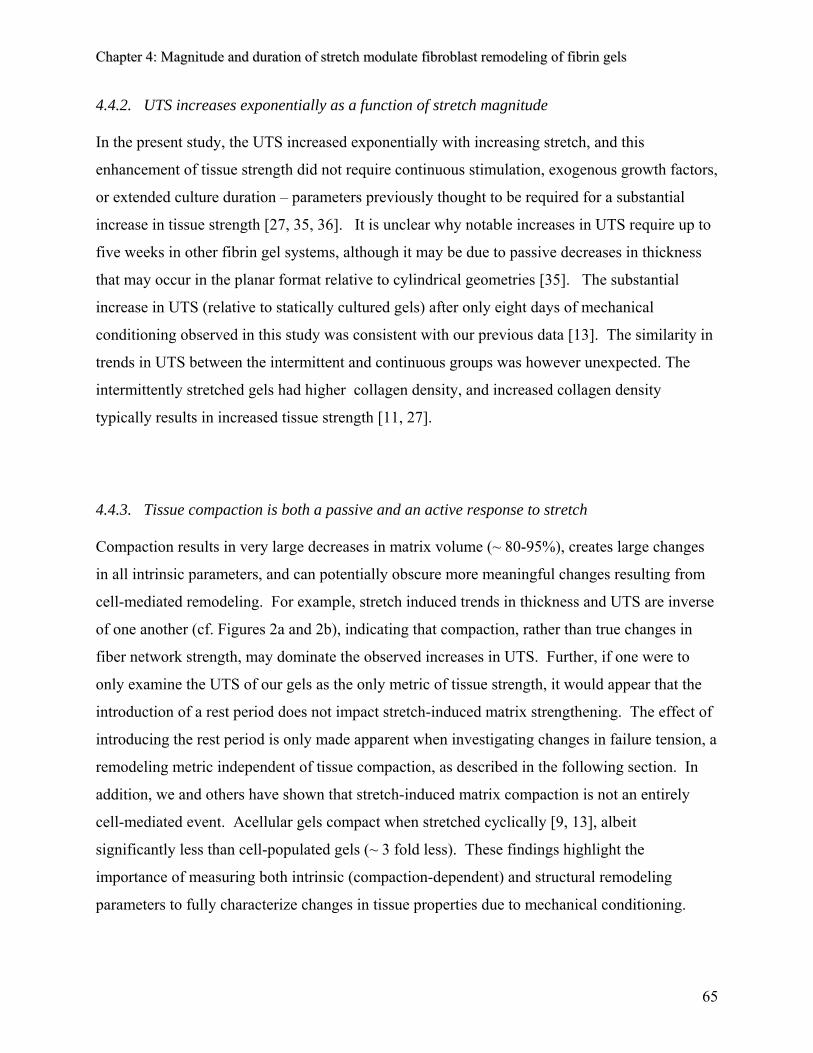
CChhaapptteerr 44:: MMaaggnniittuuddee aanndd dduurraattiioonn ooff ssttrreettcchh mmoodduullaattee ffiibbrroobbllaasstt rreemmooddeelliinngg ooff ffiibbrriinn ggeellss
4.4.2. UTS increases exponentially as a function of stretch magnitude
In the present study, the UTS increased exponentially with increasing stretch, and this
enhancement of tissue strength did not require continuous stimulation, exogenous growth factors,
r extended culture duration – parameters previously thought to be required for a substantial
increase in tissue strength [27, 35, 36]. It is unclear why notable increases in UTS require up to
ntial
in
anges
meaningful changes resulting from
ell-mediated remodeling. For example, stretch induced trends in thickness and UTS are inverse
of one another (cf. Figures 2a and 2b), indicating that compaction, rather than true changes in
if one were to
o
five weeks in other fibrin gel systems, although it may be due to passive decreases in thickness
that may occur in the planar format relative to cylindrical geometries [35]. The substa
increase in UTS (relative to statically cultured gels) after only eight days of mechanical
conditioning observed in this study was consistent with our previous data [13]. The similarity
trends in UTS between the intermittent and continuous groups was however unexpected. The
intermittently stretched gels had higher collagen density, and increased collagen density
typically results in increased tissue strength [11, 27].
4.4.3. Tissue compaction is both a passive and an active response to stretch
Compaction results in very large decreases in matrix volume (~ 80-95%), creates large ch
in all intrinsic parameters, and can potentially obscure more
c
fiber network strength, may dominate the observed increases in UTS. Further,
only examine the UTS of our gels as the only metric of tissue strength, it would appear that the
introduction of a rest period does not impact stretch-induced matrix strengthening. The effect of
introducing the rest period is only made apparent when investigating changes in failure tension, a
remodeling metric independent of tissue compaction, as described in the following section. In
addition, we and others have shown that stretch-induced matrix compaction is not an entirely
cell-mediated event. Acellular gels compact when stretched cyclically [9, 13], albeit
significantly less than cell-populated gels (~ 3 fold less). These findings highlight the
importance of measuring both intrinsic (compaction-dependent) and structural remodeling
parameters to fully characterize changes in tissue properties due to mechanical conditioning.
65
CChhaapptteerr 44:: MMaaggnniittuuddee aanndd dduurraattiioonn ooff ssttrreettcchh mmoodduullaattee ffiibbrroobbllaasstt rreemmooddeelliinngg ooff ffiibbrriinn ggeellss
4.4.4. Stretch-induced increases in failure tension are contingent on a rest period
To investigate cell-mediated changes in tissue strength without the confounding effects of
changes in tissue thickness due to compaction, researchers have attempted to minimize or
liminate matrix compaction during cyclic loading by allowing cells to fully compact gels prior
act the
matrix prior to experimentation; rather, we investigated the changes in failure tension (the ability
x
tch
nt manner, continuously stretched gels had only a slight increase in tissue
strength. In fact, stretching gels continuously resulted in little enhancement in strength at higher
y
ous studies that indicate that increases
in cell number do not significantly improve tissue compaction, strength, or stiffness in fibrin gels
ssible
e
to mechanical conditioning [8, 10, 11, 35]. In this study, we elected not to precomp
of tissue to withstand tensile forces per unit length) in addition to measuring intrinsic matri
strength (UTS).
Trends in failure tension provided evidence that was not apparent in the trends of UTS: the
introduction of a rest period during mechanical conditioning results in a stronger tissue construct.
While intermittently stretched gels increased their tension prior to failure with increasing stre
in a dose-depende
stretch magnitudes despite increases in collagen density.
It is unclear why stretching gels intermittently rather than continuously results in an increase in
failure tension. Although it would appear that the increase in cell number in the intermittentl
stretched gels could be the primary contributor to this increase in failure tension, the increase in
cell number is slight. Further, there is evidence from previ
cultured for a similar duration [24, 37]. It does appear that intermittently stretching gels results
in an increase in the total amount of collagen produced per cell, not just an increase in the
number of cells; a dramatic increase in collagen density could give rise to superior mechanical
properties. It is also possible that by introducing a “rest period” during stimulation, one could
alter the capacity of the cells to reorganize and remodel the surrounding collagen (e.g., enhanced
crosslinking of the tissue). Although we previously reported that collagen crosslinking does not
contribute significantly to the failure tension of continuously cycled fibrin gels [13], it is po
that allotting an 18 hour rest period each day may allow time for enhanced crosslinking of
collagen in these systems.
66
CChhaapptteerr 44:: MMaaggnniittuuddee aanndd dduurraattiioonn ooff ssttrreettcchh mmoodduullaattee ffiibbrroobbllaasstt rreemmooddeelliinngg ooff ffiibbrriinn ggeellss
Prior studies suggest that incorporating a rest period during mechanical loading regulates cells to
utilize completely separate cell signaling pathways than when loaded continuously [38]. In
addition, it is possible that intermittent stretch may simply be a method to disrupt the adaptation
response of cells to a continuous stimulus, thus increasing the effectiveness of the stretch
stimulus. This phenomenon has been shown to occur with incrementally increasing stretch
magnitude on fibrin gels and results in higher UTS than continuous cycling at a given magnitude
and
nective
tissue equivalents in vivo. In the present study, the Young’s modulus increased non-
monotonically with increasing intermittent stretch with a peak at 8% strain. This non-monotonic
study utilizing continuous
uniaxial stretch of valvular interstitial cell-populated fibrin gels [35], where it was determined
re
kPa)
dy were slightly less stiff than previously reported for
uniaxially cycled collagen/fibrin composite gels (10% strain) cultured under similar conditions
of stretch [35]. Although the mechanism remains unclear, these studies indicate that cells
reorganize their matrix differently when the level of mechanical stimulation is varied.
4.4.5. Matrix stiffness increases with intermittent stretch magnitude
In addition to matrix strength, matrix stiffness is also an important measure of remodeling,
sufficient stiffness is an important parameter in determining the feasibility of using con
increase in stiffness with stretch magnitude is consistent with a recent
that the Young’s modulus was slightly less at the higher levels (15%) of strain than seen in
intermediate levels of strain (10%).
To the best of our knowledge, these are the first measurements of stiffness of a fibrin gel via
biaxial characterization. For comparison, collagen gels with similar cell and protein
concentrations cycled at uniaxial 10% strain for 8 days and tested utilizing uniaxial pull to failu
were approximately the same stiffness as the fibrin gels cycled at 8% in this study (58 vs 66
[12]. The fibrin gels tested in this stu
(191-242 kPa) [9].
There are several limitations to the biaxial characterization measurements. During the biaxial
testing, the fibrin gels ripped at the anchors at large bulk strains (above 10%) due to the low
shear strength of the gels. Additionally, the ‘effective’ elastic modulus was estimated from a
67
CChhaapptteerr 44:: MMaaggnniittuuddee aanndd dduurraattiioonn ooff ssttrreettcchh mmoodduullaattee ffiibbrroobbllaasstt rreemmooddeelliinngg ooff ffiibbrriinn ggeellss
single equibiaxial protocol following preconditioning assuming a Poisson’s ratio of 0.25. This
value was determined in preliminary experiments that utilized four different non-equibiaxial
stretch protocols (ε :ε =2:1, 1:2, and 1:1; data not shown). These protocols were run to allow
e
ly
rrounding matrix, we
utilized a retraction assay described previously [17]. Retraction, confusingly termed ‘stress-
laxation’ or ‘release of tension’ in previous studies utilizing collagen gels [30-32], occurs upon
ereas compaction occurs over
hours to days and reflects cell traction-mediated remodeling of the gel [33, 34], passive retraction
ring
due
of
d is
clearly correlated to the level of stretch applied. In contrast to previous reports, no significant
gnment
11 22
for more complete constitutive modeling which we have left for future studies. Finally, becaus
the biaxial characterization device was developed after the continuous stretch experiments, on
measurements of the intermittently stretched gels could be made.
4.4.6. Tissue retraction is dependent on stretch magnitude
To quantify both the ability of the cells to impart residual strains in the matrix through
remodeling activities and the cells’ ability to actively contract the su
re
release of a compacted gel from the anchor and substrate. Wh
occurs immediately upon the release of prestress generated within the matrix by cells du
compaction [35]. Active retraction occurs on the order of minutes following release and is
to cells actively contracting within the matrix; this active phase is indicative of the phenotype
the cells e.g., myofibroblasts contract the matrix to a greater extent than fibroblasts [18].
The passive retraction in both continuous and intermittently stretched gels was strikingly similar,
demonstrating that the development of prestress across the matrix was dependent on the
magnitude and not the duration of stretch. In addition, it appears that there is a decrease relative
to controls in passive retraction at 2% strain in both groups. This decrease in passive prestress is
not accompanied by any change in tissue compaction or cell number relative to controls, an
increase in active retraction with dynamic culture was observed at any stretch magnitude [8, 39].
It has also been suggested that stretch-induced increases in cell contractility are due to ali
of cells and collagen fibrils in the direction of tension, thus creating a summation of contraction.
In our system this alignment has been minimized by using equibiaxial strain, indicating that
tissue alignment is not required for cells to impart forces across the matrix but may augment the
68
CChhaapptteerr 44:: MMaaggnniittuuddee aanndd dduurraattiioonn ooff ssttrreettcchh mmoodduullaattee ffiibbrroobbllaasstt rreemmooddeelliinngg ooff ffiibbrriinn ggeellss
active contractility of the cells [13].
4.4.7. Conclusions and summary
In summary, in this study we systematically investigated how mechanical conditioning modif
cell-mediated remodeling of fibrin gels by measuring structural and intrinsic parameters and
ies
ich gives different but valuable insight. For example,
yclically loading a sample at low strain (~5%) for a few hours each day appears to be more
eneficial in terms of increases in resistance to tensile stretch, collagen content, and cell number
magnitudes of strain. In addition, the methods employed in
gs
,
es
s
her insightful
commentary regarding the construction of the manuscript, and Angela Throm, Jeffery John,
hristian Grove, Justine Roberts, Vanessa Lopez, Adriana Hera, Timothy Ebner, and Jacquelyn
f istance. This work was supported in part by the U.S. Army
active and passive metrics, each of wh
c
b
than continuous stimulation at higher
this work provide valuable tools for investigating tissue remodeling in planar tissues and also for
the determination of key parameters in the culture of functional tissue substitutes. The findin
from this study provide a step towards characterizing culture conditions for tissue equivalents
developing improved wound healing treatments, and understanding tissue responses to chang
in mechanical environments during growth, repair, and disease states.
4.4.8. Acknowledgements
The authors would like to thank Dr. Gaudette of Worcester Polytechnic Institute for the generou
use of his extended phase image correlation software. We would also like to thank Dr. Jayson
Wilbur for his assistance with statistical analysis, Dr. Marsha Rolle for
C
Yousse for their technical ass
Medical Research and Materiel Command (USAMRC); grant BFR08-1011-N00.
69
CChhaapptteerr 44:: MMaaggnniittuuddee aanndd dduurraattiioonn ooff ssttrreettcchh mmoodduullaattee ffiibbrroobbllaasstt rreemmooddeelliinngg ooff ffiibbrriinn ggeellss
4.5. References
Bishop, J. E., Mitchell, J. J., Absher, P. M., Baldor, L., Geller, H. A., Woodcock-Mitchell, J., Hamblin, M. J., Vacek, P., and Low, R. B., 1993, "Cyclic mechanical
ulates human lung fibroblast proliferation and autocrine growth factor m J Respir Cell Mol Biol, 9(2), pp. 126-133.
nd
[3] e
75-582.
[8]
perties of ,"
[10]
[11]
[12] 6. ts
s, B.,
nn
[1]
deformation stimactivity," A
[2] Rudolph, R., Berg, J. V., and Ehrlick, H. P., 1992, Wound Healing: Biochemical aClinical Aspects, W.B. Saunders Co., Philadelphia, PA. Deva, A. K., Buckland, G. H., Fisher, E., Liew, S. C., Merten, S., McGlynn, M., Gianoutsos, M. P., Baldwin, M. A., and Lendvay, P. G., 2000, "Topical negative pressurin wound management," Med J Aust, 173(3), pp. 128-131.
[4] Siegel, H. J., Long, J. L., Watson, K. M., and Fiveash, J. B., 2007, "Vacuum-assisted closure for radiation-associated wound complications," J Surg Oncol, 96(7), pp. 5
[5] Clark, R. A. F., 1996, The Molecular and Cellular Biology of Wound Repair, Plenum Press, New York.
[6] Aarabi, S., Bhatt, K. A., Shi, Y., Paterno, J., Chang, E. I., Loh, S. A., Holmes, J. W., Longaker, M. T., Yee, H., and Gurtner, G. C., 2007, "Mechanical load initiates
p. hypertrophic scar formation through decreased cellular apoptosis," FASEB J, 21(12), p3250-3261.
[7] Arem, A. J., and Madden, J. W., 1976, "Effects of stress on healing wounds: I. Intermittent noncyclical tension," J Surg Res, 20(2), pp. 93-102. Seliktar, D., Black, R. A., Vito, R. P., and Nerem, R. M., 2000, "Dynamic mechanical conditioning of collagen-gel blood vessel constructs induces remodeling in vitro," Ann Biomed Eng, 28(4), pp. 351-362.
[9] Cummings, C. L., Gawlitta, D., Nerem, R. M., and Stegemann, J. P., 2004, "Proengineered vascular constructs made from collagen, fibrin, and collagen-fibrin mixturesBiomaterials, 25(17), pp. 3699-3706. Isenberg, B. C., and Tranquillo, R. T., 2003, "Long-term cyclic distention enhances the mechanical properties of collagen-based media-equivalents," Ann Biomed Eng, 31(8), pp. 937-949. Kim, B. S., Nikolovski, J., Bonadio, J., and Mooney, D. J., 1999, "Cyclic mechanical strain regulates the development of engineered smooth muscle tissue," Nat Biotechnol, 17(10), pp. 979-983. Seliktar, D., Nerem, R. M., and Galis, Z. S., 2003, "Mechanical strain-stimulated remodeling of tissue-engineered blood vessel constructs," Tissue Eng, 9(4), pp. 657-66
[13] Balestrini, J. L., and Billiar, K. L., 2006, "Equibiaxial cyclic stretch stimulates fibroblasto rapidly remodel fibrin," J Biomech, 39(16), pp. 2983-2990.
[14] Kessler, D., Dethlefsen, S., Haase, I., Plomann, M., Hirche, F., Krieg, T., and Ecke2001, "Fibroblasts in mechanically stressed collagen lattices assume a "synthetic" phenotype," J Biol Chem, 276(39), pp. 36575-36585.
[15] Grenier, G., Remy-Zolghadri, M., Larouche, D., Gauvin, R., Baker, K., Bergeron, F., Dupuis, D., Langelier, E., Rancourt, D., Auger, F. A., and Germain, L., 2005, "Tissue reorganization in response to mechanical load increases functionality," Tissue Eng, 11(1-2), pp. 90-100.
[16] Pedersen, J. A., and Swartz, M. A., 2005, "Mechanobiology in the third dimension," ABiomed Eng, 33(11), pp. 1469-1490.
70
CChhaapptteerr 44:: MMaaggnniittuuddee aanndd dduurraattiioonn ooff ssttrreettcchh mmoodduullaattee ffiibbrroobbllaasstt rreemmooddeelliinngg ooff ffiibbrriinn ggeellss
[17] e tissue remodeling," Thromb Haemost, 90(6), pp. 993-1002.
n in attached collagen lattices: dependency on an
[19] nics of
[20] ernative er
[21] , Russell, J. A., and Andreadis, S. T., 2005, "Engineering of fibrin-based
[22] , Oegema, T. R., and Tranquillo, R. T., 2002, "Enhanced fibrin
[23] kenhoevel, S., Hoerstrup, S. P., Sakyama, S., Hubbell,
[24] and Andreadis, S. T., 2005, "Fibrin-
-
Eng, 11(7-8), pp. 1122-1132.
[27] he tissue properties of engineered cardiovascular
[28] xyproline in tissue and protein pp.
[29] mammalian collagen and gelatin,"
[30] n of collagen lattices by human fibroblasts of different proliferative potential in
[31] Frey, M. T., 2005, "Biaxial failure properties of planar
[32] materials, 28(13), pp. 2183-
2191.
Hinz, B., and Gabbiani, G., 2003, "Cell-matrix and cell-cell contacts of myofibroblasts: role in connectiv
[18] Tomasek, J. J., Haaksma, C. J., Eddy, R. J., and Vaughan, M. B., 1992, "Fibroblast contraction occurs on release of tensioorganized actin cytoskeleton and serum," Anat Rec, 232(3), pp. 359-368. Wille, J. J., Elson, E. L., and Okamoto, R. J., 2006, "Cellular and matrix mechabioartificial tissues during continuous cyclic stretch," Ann Biomed Eng, 34(11), pp. 1678-1690. Grassl, E. D., Oegema, T. R., and Tranquillo, R. T., 2002, "Fibrin as an altbiopolymer to type-I collagen for the fabrication of a media equivalent," J Biomed MatRes, 60(4), pp. 607-612. Swartz, D. D.functional and implantable small-diameter blood vessels," Am J Physiol Heart Circ Physiol, 288(3), pp. H1451-1460. Neidert, M. R., Lee, E. S.remodeling in vitro with TGF-beta1, insulin and plasmin for improved tissue-equivalents," Biomaterials, 23(17), pp. 3717-3731. Ye, Q., Zund, G., Benedikt, P., JocJ. A., and Turina, M., 2000, "Fibrin gel as a three dimensional matrix in cardiovascular tissue engineering," Eur J Cardiothorac Surg, 17(5), pp. 587-591. Yao, L., Swartz, D. D., Gugino, S. F., Russell, J. A.,based tissue-engineered blood vessels: differential effects of biomaterial and culture parameters on mechanical strength and vascular reactivity," Tissue Eng, 11(7-8), pp. 9911003.
[25] Boublik, J., Park, H., Radisic, M., Tognana, E., Chen, F., Pei, M., Vunjak-Novakovic, G.,and Freed, L. E., 2005, "Mechanical properties and remodeling of hybrid cardiac constructs made from heart cells, fibrin, and biodegradable, elastomeric knitted fabric," Tissue
[26] Nerem, R. M., 2007, "Cell-based therapies: From basic biology to replacement, repair, and regeneration," Biomaterials, epub, ahead of print. Boerboom, R. A., Rubbens, M. P., Driessen, N. J., Bouten, C. V., and Baaijens, F. P., 2008, "Effect of strain magnitude on tconstructs," Ann Biomed Eng, 36(2), pp. 244-253. Woessner, J. F., Jr., 1961, "The determination of hydrosamples containing small proportions of this imino acid," Arch Biochem Biophys, 93, 440-447. Eastoe, J. E., 1955, "The amino acid composition ofBiochem J, 61(4), pp. 589-600. Bell, E., Ivarsson, B., and Merrill, C., 1979, "Production of a tissue-like structure by contractiovitro," Proc Natl Acad Sci U S A, 76(3), pp. 1274-1278. Billiar, K. L., Throm, A. M., andliving tissue equivalents," J Biomed Mater Res A, 73(2), pp. 182-191. Ahlfors, J. E., and Billiar, K. L., 2007, "Biomechanical and biochemical characteristics of a human fibroblast-produced and remodeled matrix," Bio
71
CChhaapptteerr 44:: MMaaggnniittuuddee aanndd dduurraattiioonn ooff ssttrreettcchh mmoodduullaattee ffiibbrroobbllaasstt rreemmooddeelliinngg ooff ffiibbrriinn ggeellss
[33] Altman, G. H., Horan, R. L., Martin, I., Farhadi, J., Stark, P. R., Volloch, V., Richmond, J. C., Vunjak-Novakovic, G., and Kaplan, D. L., 2002, "Cell differentiation by
[34] f t fibroblasts in fibrin matrix gel," Connect Tissue Res, 44(2), pp. 81-87.
nective 7-6542. Epub 2008 Apr 6524.
-beta," J
[37]
-656.
, pp. 2353-2368.
mechanical stress," FASEB J, 16(2), pp. 270-272. Chun, J., Tuan, T. L., Han, B., Vangsness, C. T., and Nimni, M. E., 2003, "Cultures oligamen
[35] Syedain, Z. H., Weinberg, J. S., and Tranquillo, R. T., 2008, "Cyclic distension of fibrin-based tissue constructs: evidence of adaptation during growth of engineered contissue," Proc Natl Acad Sci U S A, 105(18), pp. 653
[36] Clark, R. A., Nielsen, L. D., Welch, M. P., and McPherson, J. M., 1995, "Collagen matrices attenuate the collagen-synthetic response of cultured fibroblasts to TGFCell Sci, 108(Pt 3), pp. 1251-1261. Grassl, E. D., Oegema, T. R., and Tranquillo, R. T., 2003, "A fibrin-based arterial mediaequivalent," J Biomed Mater Res A, 66(3), pp. 550-561.
[38] Nishimura, K., Blume, P., Ohgi, S., and Sumpio, B. E., 2007, "Effect of different frequencies of tensile strain on human dermal fibroblast proliferation and survival," Wound Repair Regen, 15(5), pp. 646
[39] Wakatsuki, T., Kolodney, M. S., Zahalak, G. I., and Elson, E. L., 2000, "Cell mechanics studied by a reconstituted model tissue," Biophys J, 79(5)
72
CHAPTER 5
Applying controlled non-uniform deformation for in vitro studies of cell mechanobiology
(Jenna L Balestrini, Jeremy K Skorinko, Adriana Hera, Glenn R Gaudette, Kristen L Billiar submitted in part to
Biomechanics and modeling in mechanobiology, 2009) 5.1. Introduction
Connective tissues routinely have a wide range of mechanical loads imparted on them that are
vital for the normal health and homeostasis of cells within these tissues [1-3]; these loads have
also been demonstrated to regulate the growth, maintenance, and pathogenesis of many of these
tissues [4, 5]. To investigate how these mechanical signals regulate cell behavior in a controlled
environment, cells are often plated on an elastic membrane that is deformed equibiaxially or
uniaxially as uniformly as possible [6-8]. These classical studies have demonstrated the
profound effect of stretch on the biological responses of cells including changes in the shape of
epithelial cells [9], reorientation of fibroblasts and smooth muscle cells [10], increases in
proliferation rates [11], alteration of migratory behavior [12], and changes in the expression and
synthesis of a variety of contractile and regulatory proteins [11, 13, 14].
Although past investigations have provided a wealth of information regarding the response of
cells to homogeneous mechanical stimulation, there is very little known about how cells respond
to the complex strain fields found in vivo. Strain patterns in vivo are often anisotropic (different
magnitudes along different directions) and inhomogeneous with local gradients of strain
magnitude [15, 16]. These non-uniformities in strain direction and magnitude are especially
pronounced near local areas of increased stiffness e.g., in tissues undergoing clinical intervention
with the addition of stents, prosthetics, etc., or during disease onset such as the formation of stiff
fibrotic foci [2, 3]. Strain anisotropy has also been shown to be an important regulator in cell
activity. For example, fibroblasts and smooth muscle cells will elongate and align perpendicular
73
Chapter 5: Controlled strain gradients, anisotropy, magnitude in vitro
to the direction of principal strain under uniaxial and strip biaxial stretch (i.e., pure uniaxial
strain without transverse strain) [6, 17, 18]. Further, there is significant difference in cell
proliferation, shape, orientation, and synthetic activity [19-21] between fibroblasts stretched
biaxially and uniaxially. However, these studies typically consist of extremely anisotropic strain
that is simply compared to equibiaxial strain; therefore, the more subtle but potentially important
responses to intermediate biaxial states of strain found in vivo have been ignored.
In addition to strain direction, there is overwhelming evidence demonstrating that cell synthetic
and proliferative activities are regulated by the magnitude of the strain stimulus [14, 17, 22, 23].
Despite this knowledge, there is very little information regarding how cells will respond to
gradients of strain magnitude as seen in vivo. Cells have been shown to alter migration and
proliferation in response to gradients of stiffness (‘durotaxis’ or ‘durokinesis’)[24], yet the
effects of gradients of strain on cell migration (‘tendotaxis’) have only recently begun to be
considered [25]. Early cell stretching systems involved inflation of circularly clamped
membranes, and inadvertently created radially symmetric strain gradients [25-28]. These
systems are however no longer utilized extensively due to complex fluid stresses and difficulty in
evaluating the strain field (caused by the out of plane motion of the membrane). Given the
similarities between stiffness-dependent and strain-dependent cell behavior in terms of increases
in synthetic and contractile activity, strain gradients and gradients of strain anisotropy are likely
to have profound effects on cell biology.
The goal of this study is to develop a culture system that produces non-uniform strain patterns
for studying the effects of strain magnitude, anisotropy, and gradients on cells in culture. We
describe herein a simple method in which a circular rigid inclusion is affixed to the center of a
radially stretched membrane (in a commercially available vacuum driven device) to create strain
gradients based upon a numerical analysis performed by Moore and colleagues [29]. In addition,
using ring inserts that limit the deformation capacity of the stretch device, we are also able to run
multiple strain magnitudes simultaneously and decouple both strain magnitude and strain
gradient effects. Custom high resolution deformation mapping software is utilized to verify the
distribution of radial and circumferential stretch ratios across the membrane. As a demonstration
of the utility of the method, we measure fibroblast orientation within a single culture well along
lines of minimum principal strain.
74
Chapter 5: Controlled strain gradients, anisotropy, magnitude in vitro
5.2. Materials and Methods 5.2.1. Experimental Approach Rigid circular inclusions were affixed to the center of radially stretched homogenous circular
membranes to create an in vitro system capable of simultaneously producing multiple strain
magnitudes and differential ratios of axial stretch within the same culture well. The approach
was based on numerical simulations by Moore and colleagues [29], which demonstrate that
symmetric but highly non-uniform strain fields can theoretically be produced by a stretching the
edge of a membrane with a small circular rigid inclusion in the center.
The rigid inclusion alters both the strain magnitude and anisotropy co-localizing the highest
radial strains with the greatest strain anisotropy at the edge of the inclusion. To separate these
effects, it is advantageous to run parallel experiments at different strain magnitudes, both with
rigid inclusions and without (i.e., homogeneous equibiaxial strain). To alter the magnitude of
strain without the use of additional pressure control units, we adapted a system developed by
Boerboom et al. [30] to limit the distension of the compliant culture membrane. A series of
annular rings (see Fig. 5.1a-c) of different heights placed around the cylindrical “loading
platens” allow the user to achieve different strain levels in each well of the 6-well culture plate.
These rings enable both the decoupling of magnitude and gradient effects, and they also allow
for the use of a single control (as opposed to a control for each level of strain magnitude) in
mechanobiological studies.
5.2.2. Fabrication of the rigid inclusion model system
To create a non-uniform strain field as simulated in Mori et al. [29], 5mm, 10mm, and 15mm
diameter glass coverslips (Deckgläser, Germany) were adhered to the center of 35mm diameter
collagen coated flexible bottom Bioflex culture wells (Flexcell International, NC) using Silastic
Medical Adhesive (Dow Corning, Midland, MI). The glue was allowed to cure for 48 hours, and
75
Chapter 5: Controlled strain gradients, anisotropy, magnitude in vitro
the 6 well plates were rinsed and sterilized by washing with ethanol and subsequently rising with
deionized water, and then UV sterilized for 10 minutes. To apply cyclic stretch the Flexcell FX-
4000T (Flexcell International) was cycled up to 35kPa vacuum pressure (corresponding to ‘6%’
equibiaxial strain in unmodified well) using a square waveform at 0.2Hz and a 25mm diameter
platen.
5.2.3. Ring inserts to limit strain
Delrin rings with thicknesses ranging from 6-10mm, an outer diameter of 35mm, and an inner
diameter of 25mm were fabricated. The ring inserts were placed on the perimeter of the loading
posts and silicone lubrication was placed on the loading post and ring (Fig. 5.1a-c). Unaltered 6-
well Bioflex plates were placed onto the baseplate and markers composed of 4 ink dots placed
across the membrane. Vacuum pressure was then applied at approximately 52 and 89kPa
(corresponding to ‘10%’ and ‘20%’ applied strain in an unmodified system), and images were
taken using a digital SLR camera (6 megapixel, Cannon EOS). Displacement of the markers was
measured using Image J (version 1.38, NIH). To ensure that the strain across the membrane
remained homogeneous across the membrane with the addition of inserts, the strain distribution
across the membrane was assessed with inserts that restricted global strain to 10% strain using an
image correlation method (as described in section 2.4). All measurements were repeated on an
additional set of wells.
5.2.4. Strain field verification
For the strain field verification, a mixture of silicon carbide particles (40μm diameter) and retro-
reflective beads (60μm diameter) was applied to create a random light intensity distribution in
the region of interest (ROI) on plates with 5, 10 and 15mm diameter cover slips affixed. Digital
images were acquired at 50 frames per second using a 1280 x 1024 pixel resolution CMOS
camera (Photron; San Diego CA; Model # Fastcam-X 1280 PCI) with 8 bit pixel depth while the
flexible-bottom plates were cycled at 0.2Hz with vacuum pressures ranging from 0-35kPa
(corresponding to 0-6% equibiaxial strain in the unmodified state, i.e., the ‘applied strain’). To
76
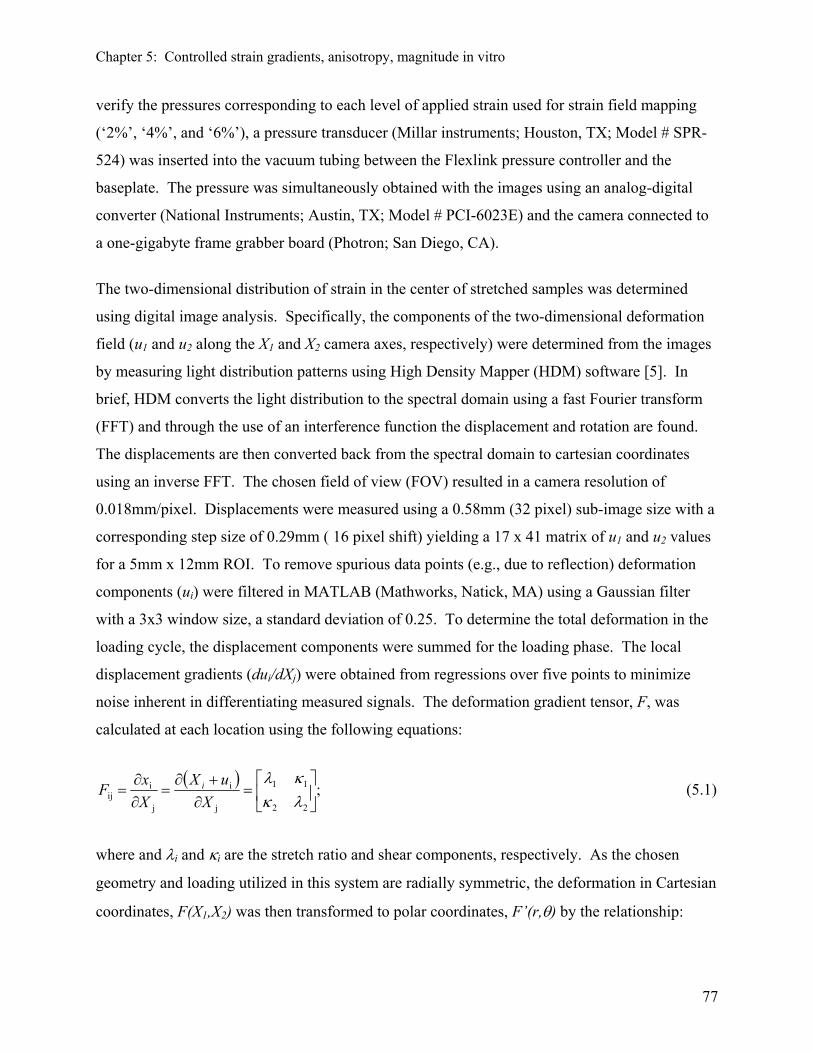
Chapter 5: Controlled strain gradients, anisotropy, magnitude in vitro
verify the pressures corresponding to each level of applied strain used for strain field mapping
(‘2%’, ‘4%’, and ‘6%’), a pressure transducer (Millar instruments; Houston, TX; Model # SPR-
524) was inserted into the vacuum tubing between the Flexlink pressure controller and the
baseplate. The pressure was simultaneously obtained with the images using an analog-digital
converter (National Instruments; Austin, TX; Model # PCI-6023E) and the camera connected to
a one-gigabyte frame grabber board (Photron; San Diego, CA).
The two-dimensional distribution of strain in the center of stretched samples was determined
using digital image analysis. Specifically, the components of the two-dimensional deformation
field (u1 and u2 along the X1 and X2 camera axes, respectively) were determined from the images
by measuring light distribution patterns using High Density Mapper (HDM) software [5]. In
brief, HDM converts the light distribution to the spectral domain using a fast Fourier transform
(FFT) and through the use of an interference function the displacement and rotation are found.
The displacements are then converted back from the spectral domain to cartesian coordinates
using an inverse FFT. The chosen field of view (FOV) resulted in a camera resolution of
0.018mm/pixel. Displacements were measured using a 0.58mm (32 pixel) sub-image size with a
corresponding step size of 0.29mm ( 16 pixel shift) yielding a 17 x 41 matrix of u1 and u2 values
for a 5mm x 12mm ROI. To remove spurious data points (e.g., due to reflection) deformation
components (ui) were filtered in MATLAB (Mathworks, Natick, MA) using a Gaussian filter
with a 3x3 window size, a standard deviation of 0.25. To determine the total deformation in the
loading cycle, the displacement components were summed for the loading phase. The local
displacement gradients (dui/dXj) were obtained from regressions over five points to minimize
noise inherent in differentiating measured signals. The deformation gradient tensor, F, was
calculated at each location using the following equations:
( ) ;22
11
j
i
j
iij ⎥
⎦
⎤⎢⎣
⎡=
∂+∂
=∂∂
=λκκλ
XuX
XxF i (5.1)
where and λi and κi are the stretch ratio and shear components, respectively. As the chosen
geometry and loading utilized in this system are radially symmetric, the deformation in Cartesian
coordinates, F(X1,X2) was then transformed to polar coordinates, F’(r,θ) by the relationship:
77
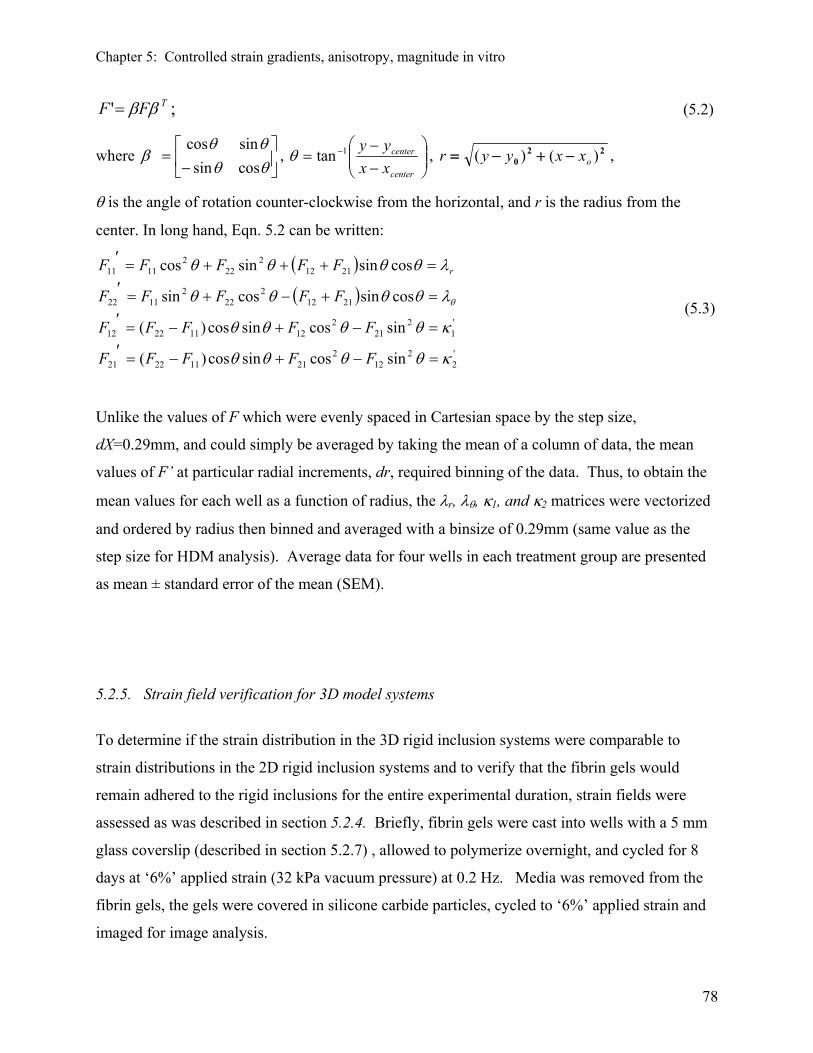
Chapter 5: Controlled strain gradients, anisotropy, magnitude in vitro
TFF ββ=' ; (5.2)
where , ⎥⎦
⎤⎢⎣
⎡−
=θθθθ
βcossinsincos
⎟⎟⎠
⎞⎜⎜⎝
⎛−−
= −
center
center
xxyy1tanθ , 22
0 )()( oxxyyr −+−= ,
θ is the angle of rotation counter-clockwise from the horizontal, and r is the radius from the
center. In long hand, Eqn. 5.2 can be written:
( )( )
'2
212
221112221
'1
221
212112212
21122
222
1122
21122
222
1111
sincossincos)(
sincossincos)(
cossincossin
cossinsincos
κθθθθ
κθθθθ
λθθθθ
λθθθθ
θ
=−+−=′=−+−=′=+−+=′=+++=′
FFFFF
FFFFF
FFFFF
FFFFF r
(5.3)
Unlike the values of F which were evenly spaced in Cartesian space by the step size,
dX=0.29mm, and could simply be averaged by taking the mean of a column of data, the mean
values of F’ at particular radial increments, dr, required binning of the data. Thus, to obtain the
mean values for each well as a function of radius, the λr, λθ, κ1, and κ2 matrices were vectorized
and ordered by radius then binned and averaged with a binsize of 0.29mm (same value as the
step size for HDM analysis). Average data for four wells in each treatment group are presented
as mean ± standard error of the mean (SEM).
5.2.5. Strain field verification for 3D model systems
To determine if the strain distribution in the 3D rigid inclusion systems were comparable to
strain distributions in the 2D rigid inclusion systems and to verify that the fibrin gels would
remain adhered to the rigid inclusions for the entire experimental duration, strain fields were
assessed as was described in section 5.2.4. Briefly, fibrin gels were cast into wells with a 5 mm
glass coverslip (described in section 5.2.7) , allowed to polymerize overnight, and cycled for 8
days at ‘6%’ applied strain (32 kPa vacuum pressure) at 0.2 Hz. Media was removed from the
fibrin gels, the gels were covered in silicone carbide particles, cycled to ‘6%’ applied strain and
imaged for image analysis.
78
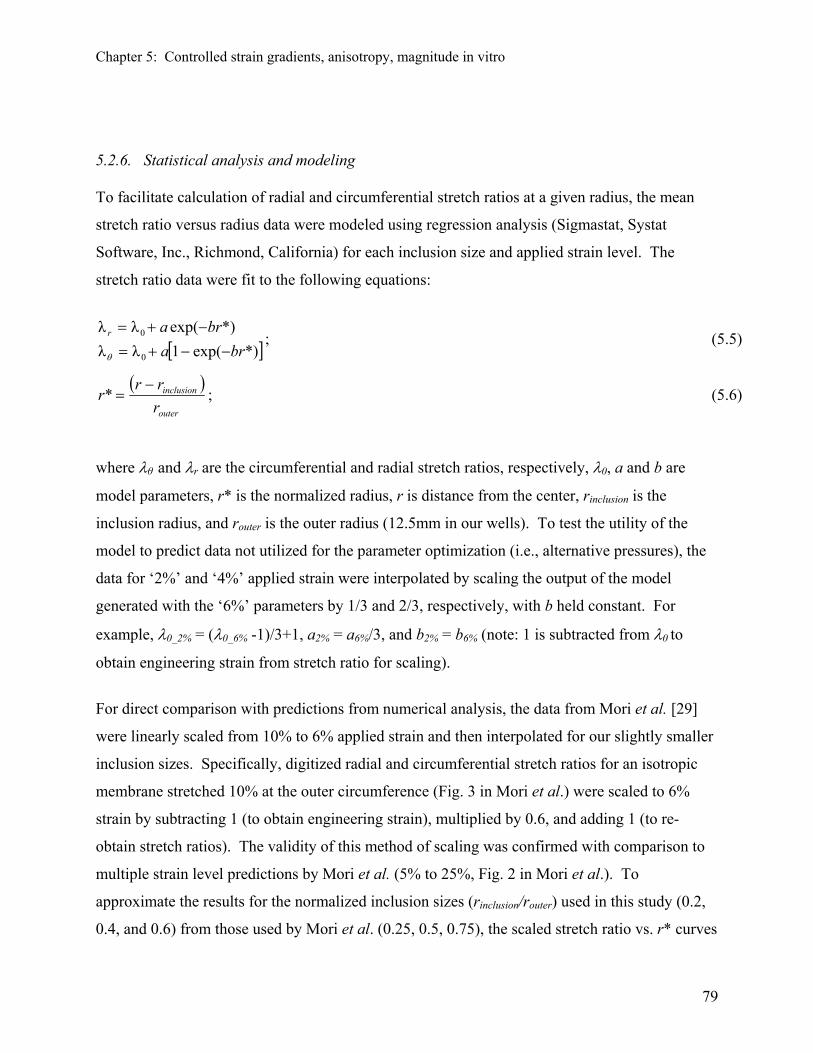
Chapter 5: Controlled strain gradients, anisotropy, magnitude in vitro
5.2.6. Statistical analysis and modeling
To facilitate calculation of radial and circumferential stretch ratios at a given radius, the mean
stretch ratio versus radius data were modeled using regression analysis (Sigmastat, Systat
Software, Inc., Richmond, California) for each inclusion size and applied strain level. The
stretch ratio data were fit to the following equations:
[ *)exp(1λλ*)exp(λλ
0
0
brabrar
−−+=−+=
θ ] ; (5.5)
( )outer
inclusion
rrr
r−
=* ; (5.6)
where λθ and λr are the circumferential and radial stretch ratios, respectively, λ0, a and b are
model parameters, r* is the normalized radius, r is distance from the center, rinclusion is the
inclusion radius, and router is the outer radius (12.5mm in our wells). To test the utility of the
model to predict data not utilized for the parameter optimization (i.e., alternative pressures), the
data for ‘2%’ and ‘4%’ applied strain were interpolated by scaling the output of the model
generated with the ‘6%’ parameters by 1/3 and 2/3, respectively, with b held constant. For
example, λ0_2% = (λ0_6% -1)/3+1, a2% = a6%/3, and b2% = b6% (note: 1 is subtracted from λ0 to
obtain engineering strain from stretch ratio for scaling).
For direct comparison with predictions from numerical analysis, the data from Mori et al. [29]
were linearly scaled from 10% to 6% applied strain and then interpolated for our slightly smaller
inclusion sizes. Specifically, digitized radial and circumferential stretch ratios for an isotropic
membrane stretched 10% at the outer circumference (Fig. 3 in Mori et al.) were scaled to 6%
strain by subtracting 1 (to obtain engineering strain), multiplied by 0.6, and adding 1 (to re-
obtain stretch ratios). The validity of this method of scaling was confirmed with comparison to
multiple strain level predictions by Mori et al. (5% to 25%, Fig. 2 in Mori et al.). To
approximate the results for the normalized inclusion sizes (rinclusion/router) used in this study (0.2,
0.4, and 0.6) from those used by Mori et al. (0.25, 0.5, 0.75), the scaled stretch ratio vs. r* curves
79
Chapter 5: Controlled strain gradients, anisotropy, magnitude in vitro
were fit to equations 2.6 above. In the case of radial stretch ratio, in order to avoid
overparameterization, the variable b was held constant at b=6, and λ0 and a were fit (resulting in
R2>0.98 for all curves). Curve fitting was utilized to obtain the following approximate
relationships between these parameters and the normalized inclusion sizes:
λ0=1.05(rinclusion/router)2-0.536(rinclusion/router)+1.18 and a=-0.047(rinclusion/router)+0.096, λ0 and a
were then interpolated for rinclusion/router =0.2, 0.4, and 0.6 using these relationships. The digitized
curves for circumferential stretch ratio, could all be fit well with a single set of parameters (λ0=1,
a=0.094, and b=6) with R2>0.95 thus, for simplicity, no further parameter optimization was
done. The interpolated parameter values were used in Eqns. 5.6 to generate curves for
comparison with our data.
5.2.7. Demonstration of cell orientation to non-homogeneous strain field created by
rigid inclusion in two and three dimensional models
As a demonstration of the utility of this method for mechanobiological studies, a proof of
concept study was performed wherein cell orientation with respect to changing anisotropy of
stretch across the membrane created by the rigid inclusion was investigated. Therefore, 2D and
3D models were created to examine cellular response to these changes in strain distribution. To
create the 2D system, human dermal foreskin fibroblasts (American Type Culture Collection,
Manassas, VA) were cultured in Dulbecco’s Modified Eagle Medium (DMEM, Mediatech,
Herndon, VA) and supplemented with 10% bovine calf serum, (BCS, HyClone, Logan, UT), 100
units/mL penicillin G sodium, 100 μg/mL streptomycin sulfate, and 250 ng/mL amphotericin B
(Gibco, Grand Island, NY). Passage 7-9 human foreskin fibroblasts were seeded into six 35mm
diameter collagen-coated Bioflex culture wells at a density of 6,000 cells/cm2 and allowed to
adhere to the substrate overnight prior to stretching. The fibroblasts were cultured at 37° C with
humidified 10% CO2, and fed DMEM supplemented with 10% fetal bovine serum (FBS,
Hyclone), 25 g/L L-ascorbate (Wako, Richmond, VA), 0.5 mL/L insulin (Sigma, St. Louis, MO),
100 units/mL penicillin G sodium, 100 μg/mL streptomycin sulfate, and 250 ng/mL
amphotericin B (Gibco) was changed every other day.
80
Chapter 5: Controlled strain gradients, anisotropy, magnitude in vitro
After 2 days of continuous sinusoidal ‘2%’ applied strain (8kPa vacuum pressure) at 0.2Hz, the
cells were fixed and permeabilized with 5.3% formaldehyde and 4 μM Triton X-100
(Calbiochem, Gibbstown, NJ) for 30 minutes and blocked with 1% bovine serum albumin (BSA,
Sigma) in PBS for 30 minutes. To visualize cells, F-actin was detected using Alexa Fluor 488
phalloidin stain (Molecular Probes, Eugene, Oregon) and DNA was detected using Hoechst
33342 stain (Molecular Probes) according to manufacturer’s instructions. All fluorescence
images were acquired using a Nikon Eclipse microscope (magnification= 200x). Cell orientation
was determined by fitting the perimeter of each cell (as made apparent by phalloidin staining) to
an ellipse using Image J software (NIH) and measuring the orientation of the long axis. Due to
symmetry, the cell orientations were converted from 360° measurements to 0-90° and binned
every 15°. A minimum of 50 cells were counted for each image, two wells were examined per
treatment group and three images were taken per well.
To investigate tissue architecture changes in response to non-uniform strain fields in 3D model
systems, fibrin gels were cast onto 5 mm inclusion model systems that were prepared as
described in the above section (5.2.6). To ensure that the fibroblast-populated fibrin gels were
attached to the glass coverslips, the rigid inclusion system was plasma cleaned prior to casting
the gels within these systems. Fibrin gels were produced and cultured as previously described
[31]. Bovine fibrinogen and thrombin (Sigma, St. Louis, MO) were combined with passage 7-9
human foreskin fibroblasts (American Type Culture Collection, Manassas, VA) in Dulbecco’s
Modified Eagle Medium (DMEM, Mediatech, Herndon, VA) and 10% bovine calf serum, (BCS,
HyClone, Logan, UT), 100 units/mL penicillin G sodium, 100 μg/mL streptomycin sulfate, and
250 ng/mL amphotericin B (Gibco, Grand Island, NY) were added to the media. The final
concentrations of each component of the gels were 0.2 U/mL thrombin, 3.8 mg/mL fibrinogen
(Sigma, St. Louis, MO), and 500,000 cells/mL.
After mixing, the fibrin and cell solution (3 mL) was poured into six 35 mm diameter flexible-
bottom culture wells with circular fibrous foam anchors and a 5 mm glass coverslip. Gels were
allowed to polymerize for 24 hours prior to mechanical stimulation and cultured at 37° C with
humidified 10% CO2. Gels were fed with DMEM supplemented with 10% fetal bovine serum
(FBS, Hyclone), 25 g/L L-ascorbate (Wako, Richmond, VA), 0.5 mL/L insulin (Sigma), 100
81
Chapter 5: Controlled strain gradients, anisotropy, magnitude in vitro
units/mL penicillin G sodium, 100 μg/mL streptomycin sulfate, and 250 ng/mL amphotericin B
(Gibco) every other day.
After 8 days of sinusoidal ‘6%’ applied strain at 0.2Hz for 6 hr/day, cells were fixed and stained
for F-actin and nuclei using the same protocol as the 2D system. Cells were visualized and
imaged across the matrix using confocal microscopy and qualitatively examined for orientation
with respect to principal strain. All fluorescence images in 3D were acquired using a Leica SP5
confocal imaging system (magnification= 200x). In order to investigate matrix reorganization
with respect to non-homogeneities produced in our system, a subset of samples were analyzed
histologically. Representative samples from each group were fixed in buffered formalin while
still attached to the anchors for 18-20 hours at 4° C and stored in 70% ethanol for histological
evaluation. The samples were then removed from their anchors and silicone membranes,
embedded in paraffin, cut into 5 μm sections, and then stained with hematoxylin and eosin
(H&E). Micrographs were taken with a Nikon Eclipse E600 camera at a magnification of 200X,
and thickness of each sample were measured using SPOT 4.0 imaging software (Diagnostic
Instruments, MI).
5.3. Results
The radial and circumferential strain distributions were assessed in a 5 mm wide section of the
image that spanned from the center of the inclusion to the edge of the platen (area of strain
contour in Fig. 5.1d). Due to the combination of edge effects near the rounded edge of the
loading post and out-of-plane displacement of the membrane (with respect to the camera) at the
edge of the platen, our analysis was limited to the central 20mm region as opposed to the entirety
of the 35mm membrane, i.e., 0 < r < 10mm or 0 < r* < 0.8.
82
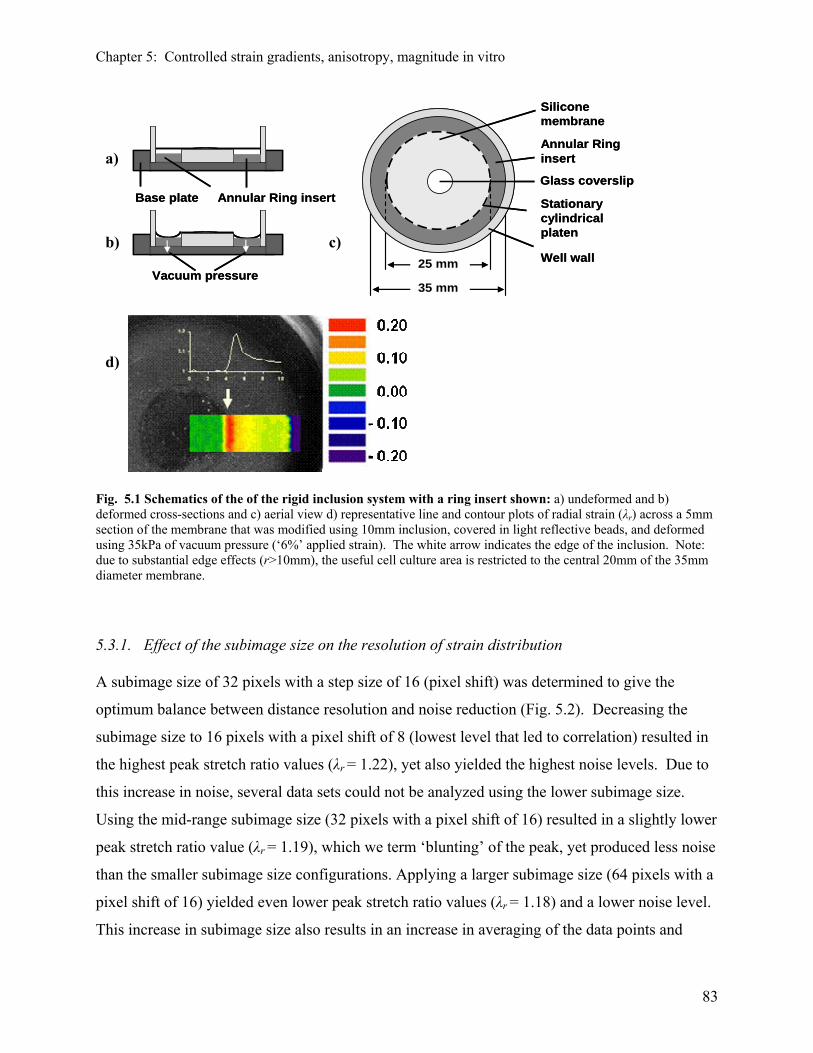
Chapter 5: Controlled strain gradients, anisotropy, magnitude in vitro
a)
b)
d)
c) Well wall
Base plate
Vacuum pressure
Glass coverslip
Annular Ringinsert
Stationary cylindrical platen
Silicone membrane
25 mm
35 mm
Annular Ring insert
Well wall
Base plate
Vacuum pressure
Glass coverslip
Annular Ringinsert
Stationary cylindrical platen
Silicone membrane
25 mm
35 mm
Annular Ring insert
Fig. 5.1 Schematics of the of the rigid inclusion system with a ring insert shown: a) undeformed and b) deformed cross-sections and c) aerial view d) representative line and contour plots of radial strain (λr) across a 5mm section of the membrane that was modified using 10mm inclusion, covered in light reflective beads, and deformed using 35kPa of vacuum pressure (‘6%’ applied strain). The white arrow indicates the edge of the inclusion. Note: due to substantial edge effects (r>10mm), the useful cell culture area is restricted to the central 20mm of the 35mm diameter membrane.
5.3.1. Effect of the subimage size on the resolution of strain distribution
A subimage size of 32 pixels with a step size of 16 (pixel shift) was determined to give the
optimum balance between distance resolution and noise reduction (Fig. 5.2). Decreasing the
subimage size to 16 pixels with a pixel shift of 8 (lowest level that led to correlation) resulted in
the highest peak stretch ratio values (λr = 1.22), yet also yielded the highest noise levels. Due to
this increase in noise, several data sets could not be analyzed using the lower subimage size.
Using the mid-range subimage size (32 pixels with a pixel shift of 16) resulted in a slightly lower
peak stretch ratio value (λr = 1.19), which we term ‘blunting’ of the peak, yet produced less noise
than the smaller subimage size configurations. Applying a larger subimage size (64 pixels with a
pixel shift of 16) yielded even lower peak stretch ratio values (λr = 1.18) and a lower noise level.
This increase in subimage size also results in an increase in averaging of the data points and
83

Chapter 5: Controlled strain gradients, anisotropy, magnitude in vitro
decrease in gradients; the impact of this averaging is made evident by observing where the λr
beings to rise from 1.0 with respect to the inclusion edge (e.g., in Fig. 5.2c the ‘ramp up’ of the
gradient begins ~ 4mm from the center, whereas the edge of the inclusion is actually at 5mm).
Therefore, in order to maintain accurate phase correlation while minimizing noise, a subimage
size of 32 with a pixel shift of 16 was utilized for the strain field data reported below.
Fig. 5.2 Representative radial stretch ratio, λr versus radius for a 10mm inclusion system cycled to ‘6%’ applied strain (35kPa vacuum pressure). The grey line represents the edge of the inclusion. Two-dimensional displacements were analyzed with a subimage size:pixel shift ratio of a) 16:8, b) 32:16, and c) 64:16. The curves become smoother and less noisy with increasing subimage size but the peaks are also increasingly “blunted” as evidenced by the decreasing λmax of 1.22, 1.19, and 1.18 for subimage sizes of 16, 32, and 64, respectively. In addition, the increase in averaging with increasing subimage size results in an offset of the λr gradient with respect to the inclusion edge.
a)
b)
c)
84
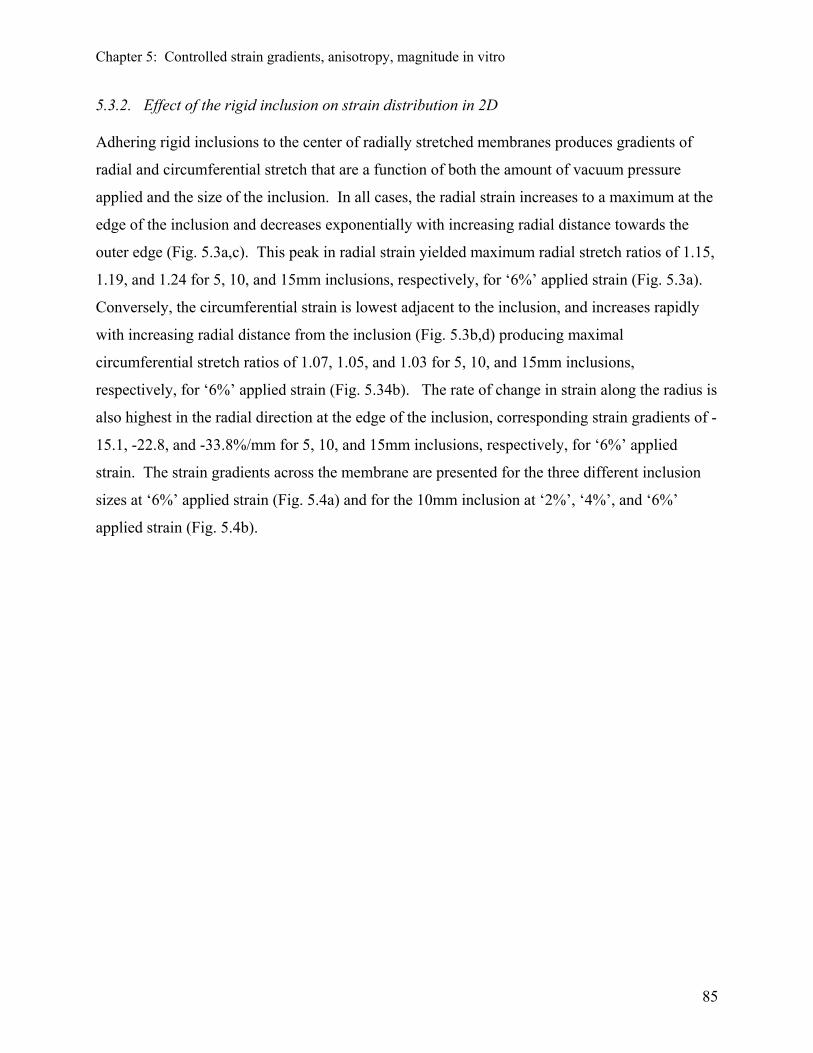
Chapter 5: Controlled strain gradients, anisotropy, magnitude in vitro
5.3.2. Effect of the rigid inclusion on strain distribution in 2D
Adhering rigid inclusions to the center of radially stretched membranes produces gradients of
radial and circumferential stretch that are a function of both the amount of vacuum pressure
applied and the size of the inclusion. In all cases, the radial strain increases to a maximum at the
edge of the inclusion and decreases exponentially with increasing radial distance towards the
outer edge (Fig. 5.3a,c). This peak in radial strain yielded maximum radial stretch ratios of 1.15,
1.19, and 1.24 for 5, 10, and 15mm inclusions, respectively, for ‘6%’ applied strain (Fig. 5.3a).
Conversely, the circumferential strain is lowest adjacent to the inclusion, and increases rapidly
with increasing radial distance from the inclusion (Fig. 5.3b,d) producing maximal
circumferential stretch ratios of 1.07, 1.05, and 1.03 for 5, 10, and 15mm inclusions,
respectively, for ‘6%’ applied strain (Fig. 5.34b). The rate of change in strain along the radius is
also highest in the radial direction at the edge of the inclusion, corresponding strain gradients of -
15.1, -22.8, and -33.8%/mm for 5, 10, and 15mm inclusions, respectively, for ‘6%’ applied
strain. The strain gradients across the membrane are presented for the three different inclusion
sizes at ‘6%’ applied strain (Fig. 5.4a) and for the 10mm inclusion at ‘2%’, ‘4%’, and ‘6%’
applied strain (Fig. 5.4b).
85

Chapter 5: Controlled strain gradients, anisotropy, magnitude in vitro
a)
c) d)
b)
Fig. 5.3. Effect of increasing inclusion size and applied strain on the deformation of the membrane. a) Radial and b) circumferential stretch ratios across 35mm diameter silicone membranes cycled to ‘6%’ applied strain. c) Radial and d) circumferential stretch ratios across a membrane with a 10mm inclusion for ‘2%’, ‘4%’, and ‘6%’ applied strain. Note that the inclusion remains central above the 25mm diameter stationary cylindrical platen during cycling due to radial symmetry. Mean ± SEM plotted; n=4 wells for each curve.
a) b) Fig. 5.4 Strain gradients for a) ‘6%’ applied strain for different inclusion sizes (5mm, 10mm, and 15mm) and for b) 10mm inclusion at ‘2%’, ‘4%’, and ‘6%’ applied strain. Note in (a) that -10%/mm (and lower) radial
86
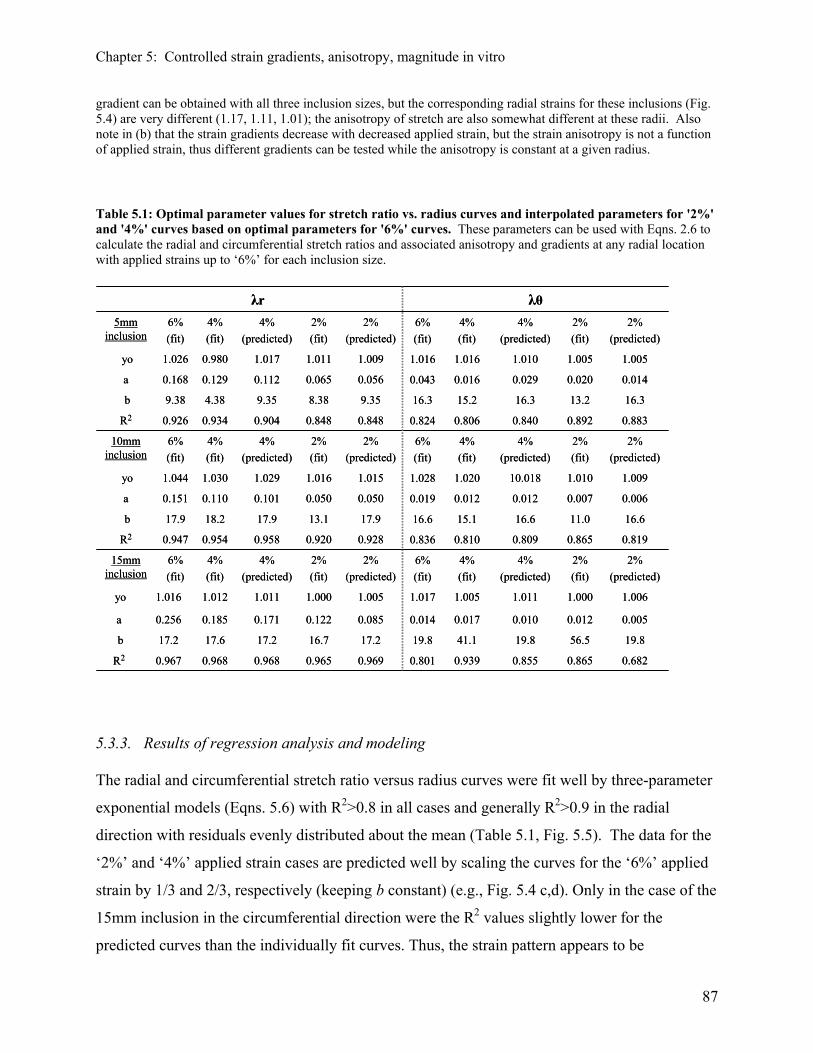
Chapter 5: Controlled strain gradients, anisotropy, magnitude in vitro
gradient can be obtained with all three inclusion sizes, but the corresponding radial strains for these inclusions (Fig. 5.4) are very different (1.17, 1.11, 1.01); the anisotropy of stretch are also somewhat different at these radii. Also note in (b) that the strain gradients decrease with decreased applied strain, but the strain anisotropy is not a function of applied strain, thus different gradients can be tested while the anisotropy is constant at a given radius.
Table 5.1: Optimal parameter values for stretch ratio vs. radius curves and interpolated parameters for '2%' and '4%' curves based on optimal parameters for '6%' curves. These parameters can be used with Eqns. 2.6 to calculate the radial and circumferential stretch ratios and associated anisotropy and gradients at any radial location with applied strains up to ‘6%’ for each inclusion size.
0.939
41.1
0.017
1.005
0.865
56.5
0.012
1.000
2%(fit)
0.865
11.0
0.007
1.010
2%(fit)
0.892
13.2
0.020
1.005
2%(fit)
0.855
19.8
0.010
1.011
4%(predicted)
0.809
16.6
0.012
10.018
4%(predicted)
0.840
16.3
0.029
1.010
4%(predicted)
4%(fit)
0.810
15.1
0.012
1.020
4%(fit)
0.806
15.2
0.016
1.016
4%(fit)
0.801
19.8
0.014
1.017
6% (fit)
0.836
16.6
0.019
1.028
6% (fit)
0.824
16.3
0.043
1.016
6% (fit)
λθ
0.682
19.8
0.005
1.006
2%(predicted)
0.819
16.6
0.006
1.009
2%(predicted)
0.883
16.3
0.014
1.005
2%(predicted)
0.968
17.2
0.171
1.011
4%(predicted)
0.958
17.9
0.101
1.029
4%(predicted)
0.904
9.35
0.112
1.017
4%(predicted)
0.967
17.2
0.256
1.016 1.0051.0001.012yo
0.0850.1220.185a
17.216.717.6b
0.9690.9650.968R2
0.9280.9200.9540.947R2
2%(predicted)
2%(fit)
4%(fit)
6% (fit)
15mm inclusion
0.0500.0500.1100.151a
17.913.118.217.9b
2%(predicted)
2%(fit)
4%(fit)
6% (fit)
10mm inclusion
1.0151.0161.0301.044yo
λr
0.848
9.35
0.056
1.009
2%(predicted)
2%(fit)
4%(fit)
6% (fit)
5mm inclusion
0.8480.9340.926R2
8.384.389.38b
0.0650.1290.168a
1.0110.9801.026yo
5.3.3. Results of regression analysis and modeling
The radial and circumferential stretch ratio versus radius curves were fit well by three-parameter
exponential models (Eqns. 5.6) with R2>0.8 in all cases and generally R2>0.9 in the radial
direction with residuals evenly distributed about the mean (Table 5.1, Fig. 5.5). The data for the
‘2%’ and ‘4%’ applied strain cases are predicted well by scaling the curves for the ‘6%’ applied
strain by 1/3 and 2/3, respectively (keeping b constant) (e.g., Fig. 5.4 c,d). Only in the case of the
15mm inclusion in the circumferential direction were the R2 values slightly lower for the
predicted curves than the individually fit curves. Thus, the strain pattern appears to be
87
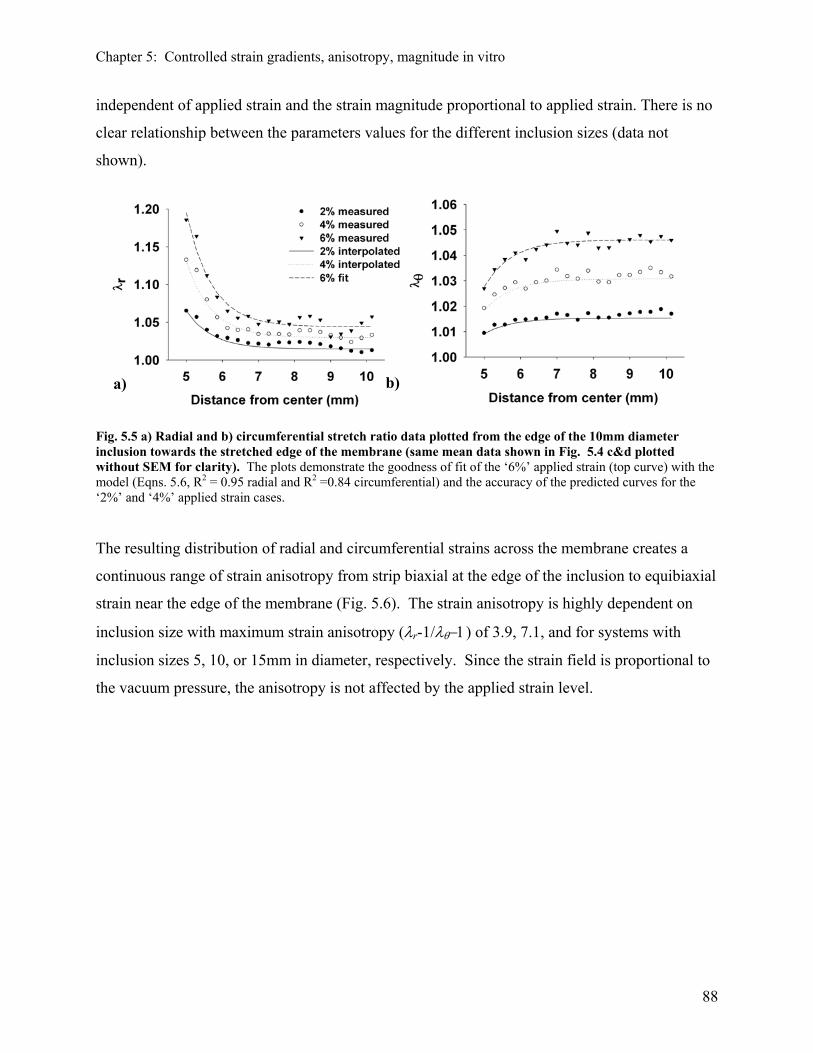
Chapter 5: Controlled strain gradients, anisotropy, magnitude in vitro
independent of applied strain and the strain magnitude proportional to applied strain. There is no
clear relationship between the parameters values for the different inclusion sizes (data not
shown).
b) a)
Fig. 5.5 a) Radial and b) circumferential stretch ratio data plotted from the edge of the 10mm diameter inclusion towards the stretched edge of the membrane (same mean data shown in Fig. 5.4 c&d plotted without SEM for clarity). The plots demonstrate the goodness of fit of the ‘6%’ applied strain (top curve) with the model (Eqns. 5.6, R2 = 0.95 radial and R2 =0.84 circumferential) and the accuracy of the predicted curves for the ‘2%’ and ‘4%’ applied strain cases.
The resulting distribution of radial and circumferential strains across the membrane creates a
continuous range of strain anisotropy from strip biaxial at the edge of the inclusion to equibiaxial
strain near the edge of the membrane (Fig. 5.6). The strain anisotropy is highly dependent on
inclusion size with maximum strain anisotropy (λr-1/λθ−1) of 3.9, 7.1, and for systems with
inclusion sizes 5, 10, or 15mm in diameter, respectively. Since the strain field is proportional to
the vacuum pressure, the anisotropy is not affected by the applied strain level.
88
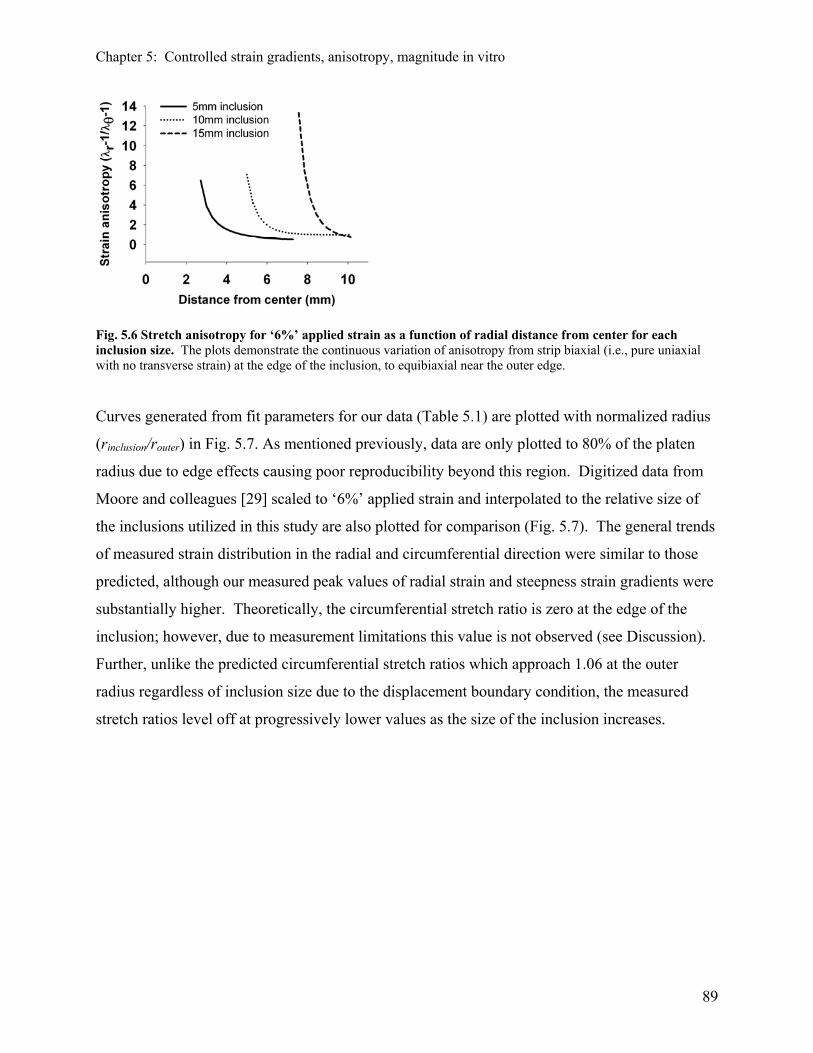
Chapter 5: Controlled strain gradients, anisotropy, magnitude in vitro
Fig. 5.6 Stretch anisotropy for ‘6%’ applied strain as a function of radial distance from center for each inclusion size. The plots demonstrate the continuous variation of anisotropy from strip biaxial (i.e., pure uniaxial with no transverse strain) at the edge of the inclusion, to equibiaxial near the outer edge.
Curves generated from fit parameters for our data (Table 5.1) are plotted with normalized radius
(rinclusion/router) in Fig. 5.7. As mentioned previously, data are only plotted to 80% of the platen
radius due to edge effects causing poor reproducibility beyond this region. Digitized data from
Moore and colleagues [29] scaled to ‘6%’ applied strain and interpolated to the relative size of
the inclusions utilized in this study are also plotted for comparison (Fig. 5.7). The general trends
of measured strain distribution in the radial and circumferential direction were similar to those
predicted, although our measured peak values of radial strain and steepness strain gradients were
substantially higher. Theoretically, the circumferential stretch ratio is zero at the edge of the
inclusion; however, due to measurement limitations this value is not observed (see Discussion).
Further, unlike the predicted circumferential stretch ratios which approach 1.06 at the outer
radius regardless of inclusion size due to the displacement boundary condition, the measured
stretch ratios level off at progressively lower values as the size of the inclusion increases.
89
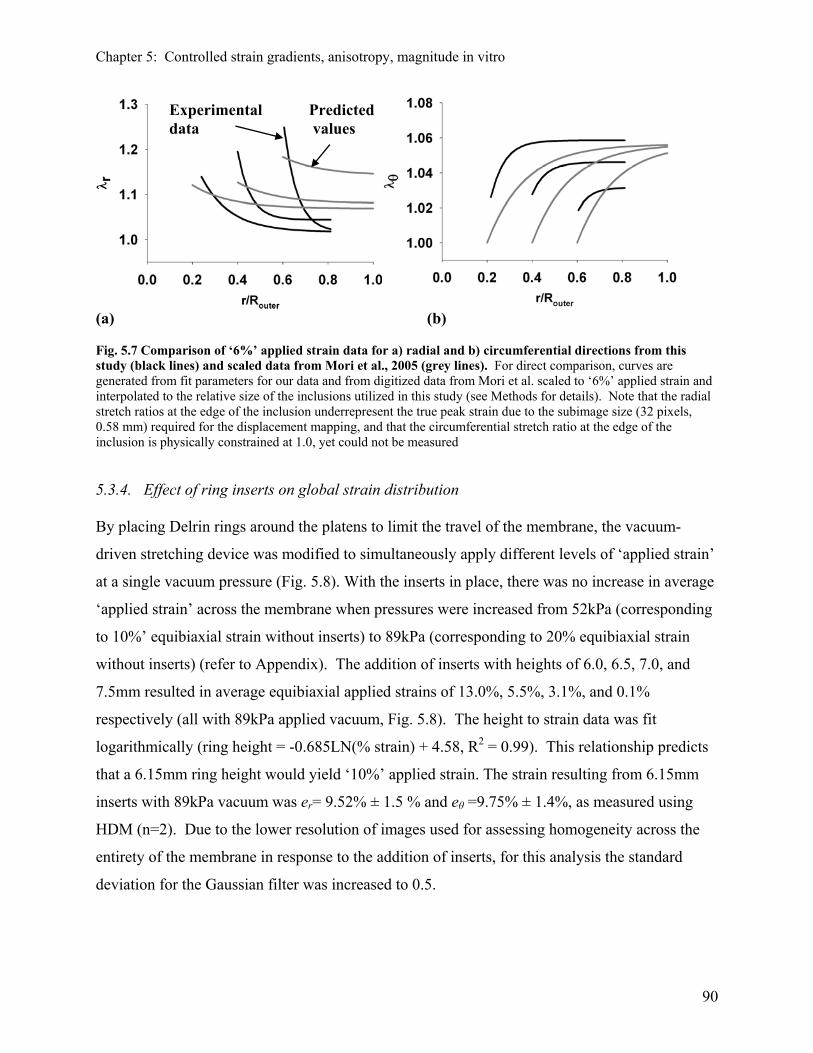
Chapter 5: Controlled strain gradients, anisotropy, magnitude in vitro
Experimental data
Predicted values
(a) (b) Fig. 5.7 Comparison of ‘6%’ applied strain data for a) radial and b) circumferential directions from this study (black lines) and scaled data from Mori et al., 2005 (grey lines). For direct comparison, curves are generated from fit parameters for our data and from digitized data from Mori et al. scaled to ‘6%’ applied strain and interpolated to the relative size of the inclusions utilized in this study (see Methods for details). Note that the radial stretch ratios at the edge of the inclusion underrepresent the true peak strain due to the subimage size (32 pixels, 0.58 mm) required for the displacement mapping, and that the circumferential stretch ratio at the edge of the inclusion is physically constrained at 1.0, yet could not be measured 5.3.4. Effect of ring inserts on global strain distribution
By placing Delrin rings around the platens to limit the travel of the membrane, the vacuum-
driven stretching device was modified to simultaneously apply different levels of ‘applied strain’
at a single vacuum pressure (Fig. 5.8). With the inserts in place, there was no increase in average
‘applied strain’ across the membrane when pressures were increased from 52kPa (corresponding
to 10%’ equibiaxial strain without inserts) to 89kPa (corresponding to 20% equibiaxial strain
without inserts) (refer to Appendix). The addition of inserts with heights of 6.0, 6.5, 7.0, and
7.5mm resulted in average equibiaxial applied strains of 13.0%, 5.5%, 3.1%, and 0.1%
respectively (all with 89kPa applied vacuum, Fig. 5.8). The height to strain data was fit
logarithmically (ring height = -0.685LN(% strain) + 4.58, R2 = 0.99). This relationship predicts
that a 6.15mm ring height would yield ‘10%’ applied strain. The strain resulting from 6.15mm
inserts with 89kPa vacuum was er= 9.52% ± 1.5 % and eθ =9.75% ± 1.4%, as measured using
HDM (n=2). Due to the lower resolution of images used for assessing homogeneity across the
entirety of the membrane in response to the addition of inserts, for this analysis the standard
deviation for the Gaussian filter was increased to 0.5.
90
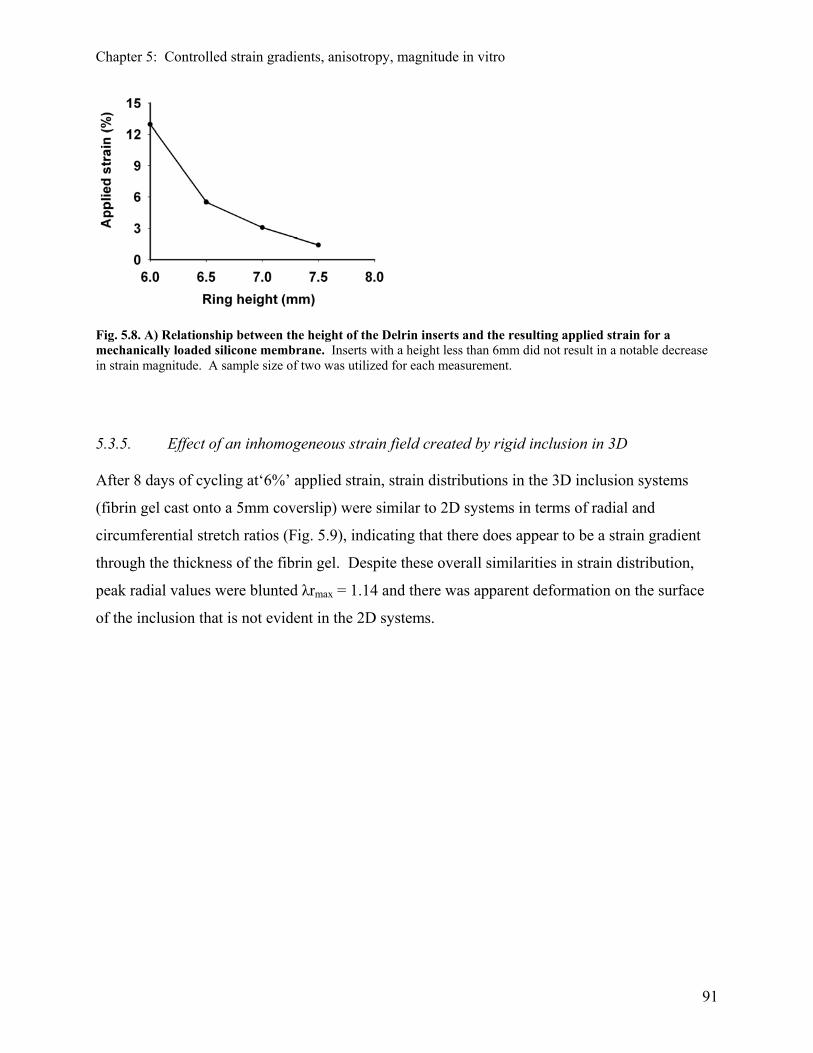
Chapter 5: Controlled strain gradients, anisotropy, magnitude in vitro
Fig. 5.8. A) Relationship between the height of the Delrin inserts and the resulting applied strain for a mechanically loaded silicone membrane. Inserts with a height less than 6mm did not result in a notable decrease in strain magnitude. A sample size of two was utilized for each measurement. 5.3.5. Effect of an inhomogeneous strain field created by rigid inclusion in 3D After 8 days of cycling at‘6%’ applied strain, strain distributions in the 3D inclusion systems
(fibrin gel cast onto a 5mm coverslip) were similar to 2D systems in terms of radial and
circumferential stretch ratios (Fig. 5.9), indicating that there does appear to be a strain gradient
through the thickness of the fibrin gel. Despite these overall similarities in strain distribution,
peak radial values were blunted λrmax = 1.14 and there was apparent deformation on the surface
of the inclusion that is not evident in the 2D systems.
91
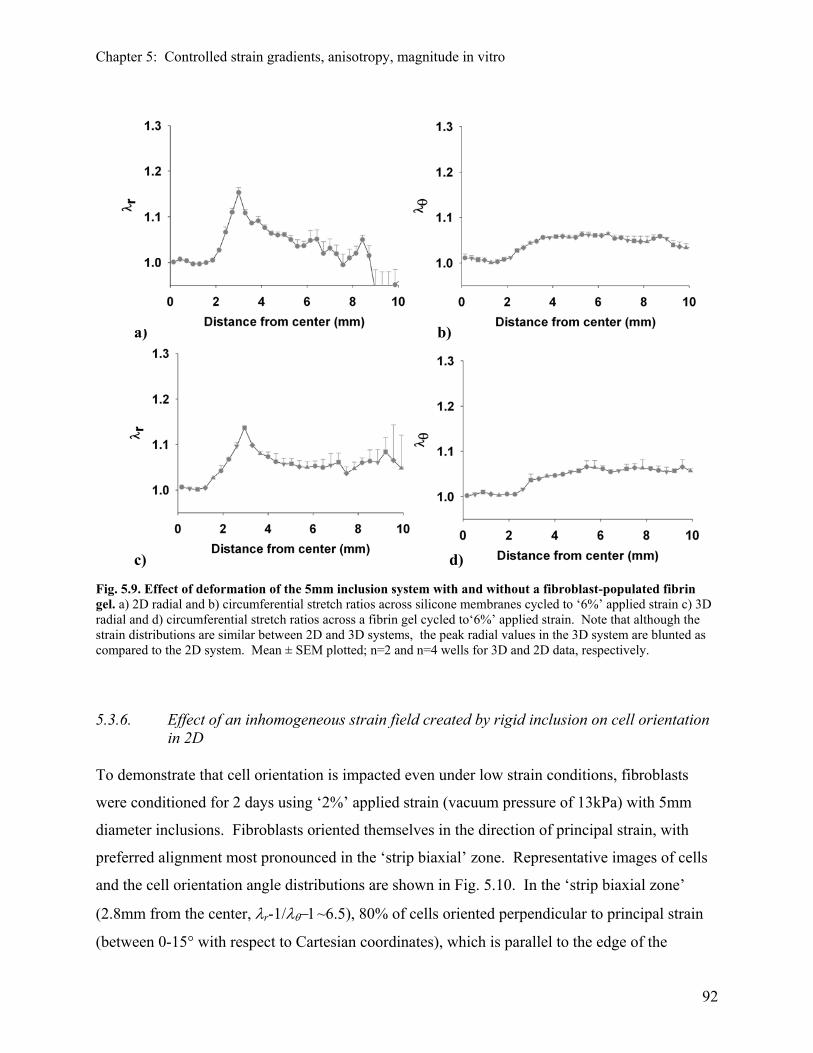
Chapter 5: Controlled strain gradients, anisotropy, magnitude in vitro
a)
c) d)
b)
Fig. 5.9. Effect of deformation of the 5mm inclusion system with and without a fibroblast-populated fibrin gel. a) 2D radial and b) circumferential stretch ratios across silicone membranes cycled to ‘6%’ applied strain c) 3D radial and d) circumferential stretch ratios across a fibrin gel cycled to‘6%’ applied strain. Note that although the strain distributions are similar between 2D and 3D systems, the peak radial values in the 3D system are blunted as compared to the 2D system. Mean ± SEM plotted; n=2 and n=4 wells for 3D and 2D data, respectively.
5.3.6. Effect of an inhomogeneous strain field created by rigid inclusion on cell orientation in 2D
To demonstrate that cell orientation is impacted even under low strain conditions, fibroblasts
were conditioned for 2 days using ‘2%’ applied strain (vacuum pressure of 13kPa) with 5mm
diameter inclusions. Fibroblasts oriented themselves in the direction of principal strain, with
preferred alignment most pronounced in the ‘strip biaxial’ zone. Representative images of cells
and the cell orientation angle distributions are shown in Fig. 5.10. In the ‘strip biaxial zone’
(2.8mm from the center, λr-1/λθ−1~6.5), 80% of cells oriented perpendicular to principal strain
(between 0-15° with respect to Cartesian coordinates), which is parallel to the edge of the
92
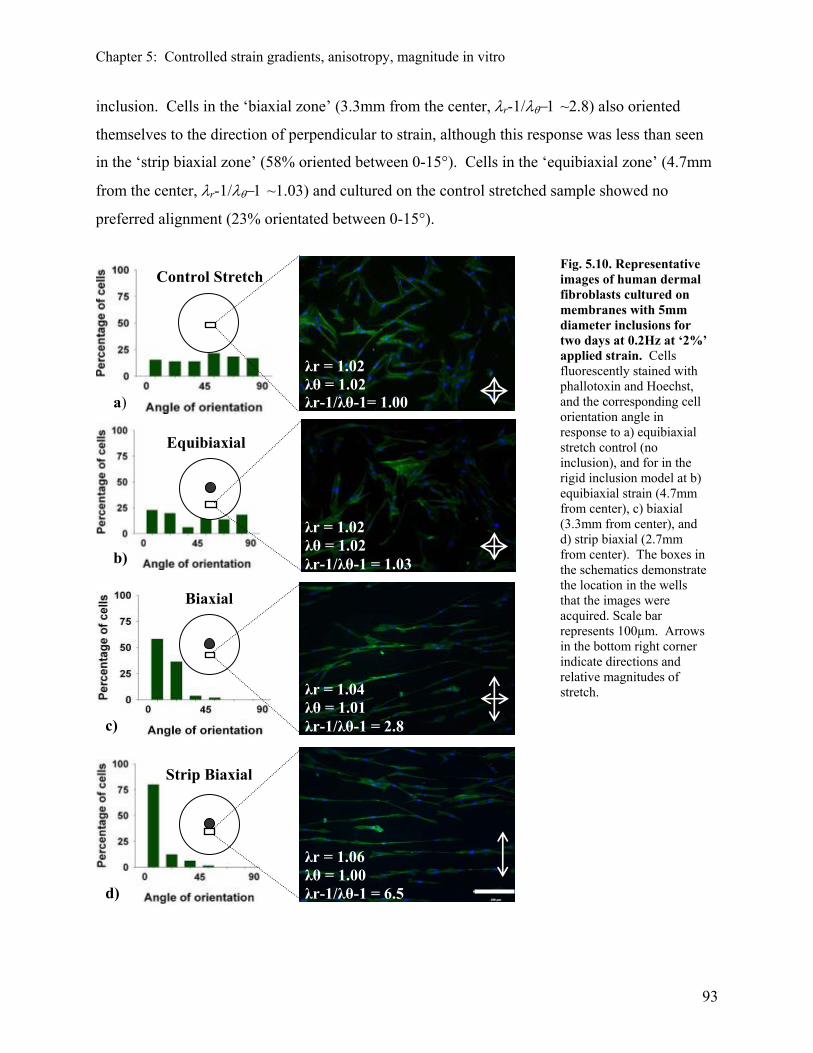
Chapter 5: Controlled strain gradients, anisotropy, magnitude in vitro
inclusion. Cells in the ‘biaxial zone’ (3.3mm from the center, λr-1/λθ−1 ~2.8) also oriented
themselves to the direction of perpendicular to strain, although this response was less than seen
in the ‘strip biaxial zone’ (58% oriented between 0-15°). Cells in the ‘equibiaxial zone’ (4.7mm
from the center, λr-1/λθ−1 ~1.03) and cultured on the control stretched sample showed no
preferred alignment (23% orientated between 0-15°).
Fig. 5.10. Representative images of human dermal fibroblasts cultured on membranes with 5mm diameter inclusions for two days at 0.2Hz at ‘2%’ applied strain. Cells fluorescently stained with phallotoxin and Hoechst, and the corresponding cell orientation angle in response to a) equibiaxial stretch control (no inclusion), and for in the rigid inclusion model at b) equibiaxial strain (4.7mm from center), c) biaxial (3.3mm from center), and d) strip biaxial (2.7mm from center). The boxes in the schematics demonstrate the location in the wells that the images were acquired. Scale bar represents 100μm. Arrows in the bottom right corner indicate directions and relative magnitudes of stretch.
Biaxial
Equibiaxial
Strip Biaxial
λr = 1.02 λθ = 1.02 λr-1/λθ-1 = 1.03
λr-1/λθ-1= 1.00
λr = 1.04 λθ = 1.01 λr-1/λθ-1 = 2.8
λr = 1.06 λθ = 1.00 λr-1/λθ-1 = 6.5
Control Stretch
λr = 1.02 λθ = 1.02 a)
b)
c)
d)
93
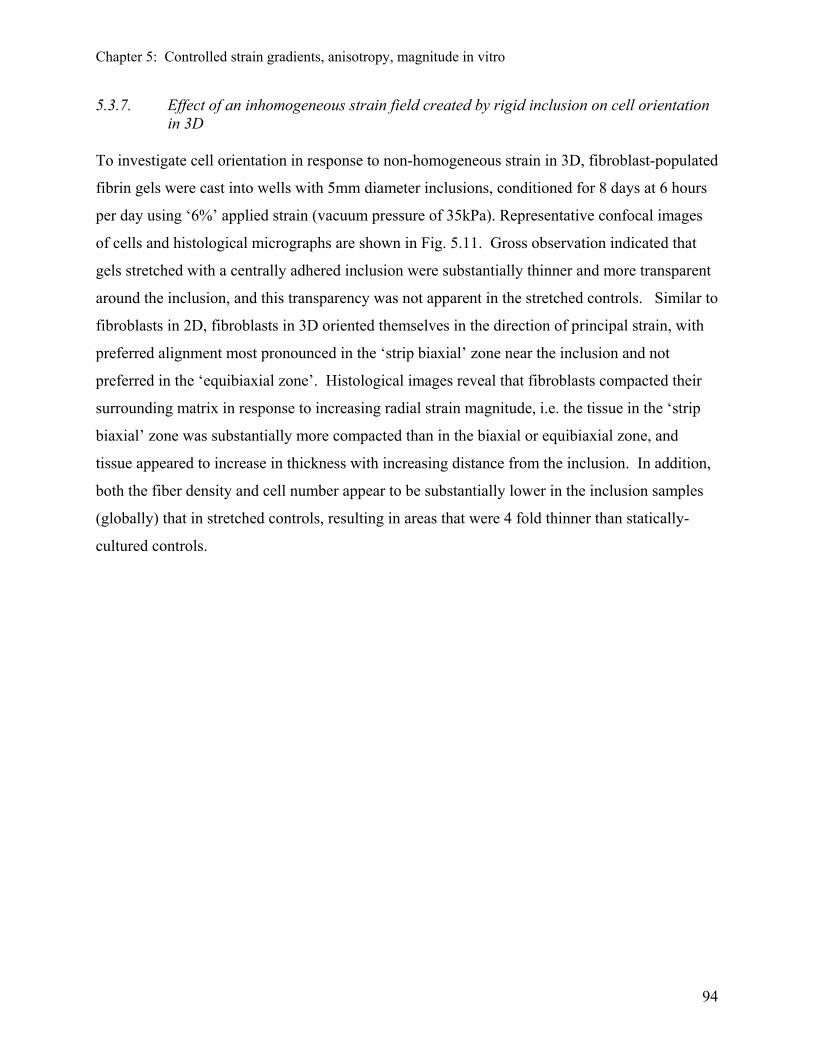
Chapter 5: Controlled strain gradients, anisotropy, magnitude in vitro
5.3.7. Effect of an inhomogeneous strain field created by rigid inclusion on cell orientation in 3D
To investigate cell orientation in response to non-homogeneous strain in 3D, fibroblast-populated
fibrin gels were cast into wells with 5mm diameter inclusions, conditioned for 8 days at 6 hours
per day using ‘6%’ applied strain (vacuum pressure of 35kPa). Representative confocal images
of cells and histological micrographs are shown in Fig. 5.11. Gross observation indicated that
gels stretched with a centrally adhered inclusion were substantially thinner and more transparent
around the inclusion, and this transparency was not apparent in the stretched controls. Similar to
fibroblasts in 2D, fibroblasts in 3D oriented themselves in the direction of principal strain, with
preferred alignment most pronounced in the ‘strip biaxial’ zone near the inclusion and not
preferred in the ‘equibiaxial zone’. Histological images reveal that fibroblasts compacted their
surrounding matrix in response to increasing radial strain magnitude, i.e. the tissue in the ‘strip
biaxial’ zone was substantially more compacted than in the biaxial or equibiaxial zone, and
tissue appeared to increase in thickness with increasing distance from the inclusion. In addition,
both the fiber density and cell number appear to be substantially lower in the inclusion samples
(globally) that in stretched controls, resulting in areas that were 4 fold thinner than statically-
cultured controls.
94
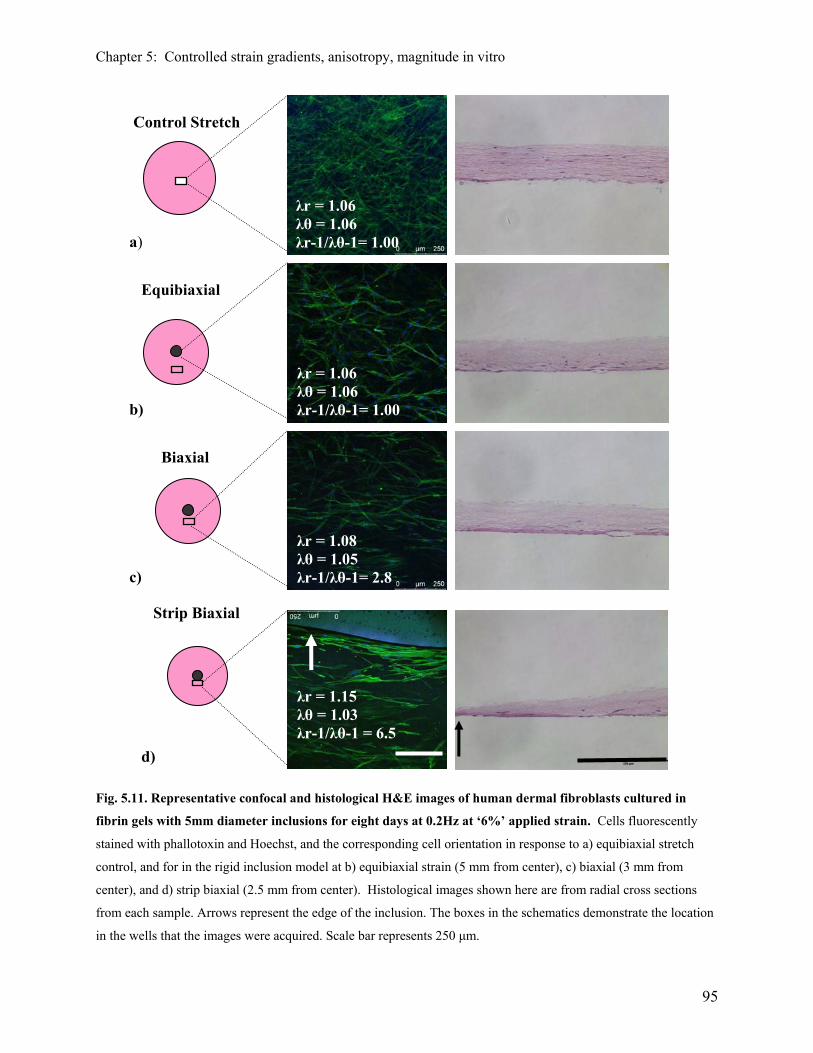
Chapter 5: Controlled strain gradients, anisotropy, magnitude in vitro
Fig. 5.11. Representative confocal and histological H&E images of human dermal fibroblasts cultured in
fibrin gels with 5mm diameter inclusions for eight days at 0.2Hz at ‘6%’ applied strain. Cells fluorescently
stained with phallotoxin and Hoechst, and the corresponding cell orientation in response to a) equibiaxial stretch
control, and for in the rigid inclusion model at b) equibiaxial strain (5 mm from center), c) biaxial (3 mm from
center), and d) strip biaxial (2.5 mm from center). Histological images shown here are from radial cross sections
from each sample. Arrows represent the edge of the inclusion. The boxes in the schematics demonstrate the location
in the wells that the images were acquired. Scale bar represents 250 μm.
λr = 1.15 λθ = 1.03 λr-1/λθ-1 = 6.5
Biaxial
Equibiaxial
Strip Biaxial
λr = 1.04 λθ = 1.01 λr-1/λθ-1 = 2.8
b)
c)
d)
Control Stretch
a)
λr = 1.06 λθ = 1.06 λr-1/λθ-1= 1.00
λr = 1.08 λθ = 1.05 λr-1/λθ-1= 2.8
λr = 1.06 λθ = 1.06 λr-1/λθ-1= 1.00
95
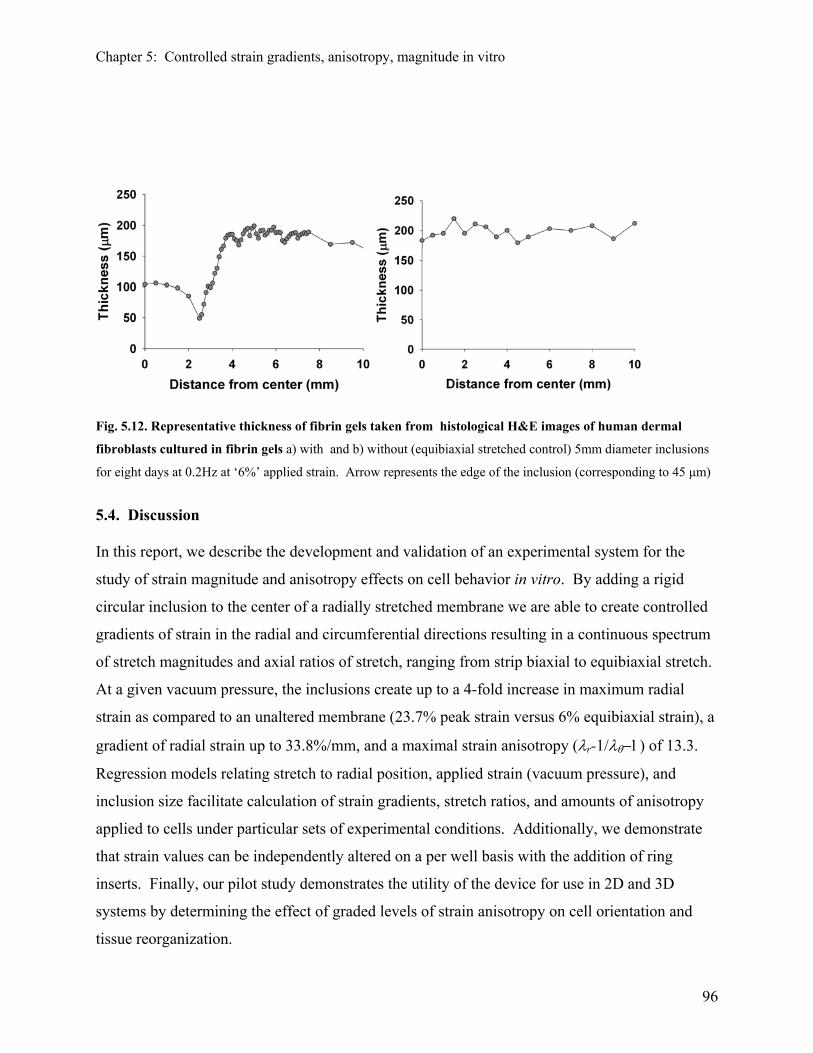
Chapter 5: Controlled strain gradients, anisotropy, magnitude in vitro
Fig. 5.12. Representative thickness of fibrin gels taken from histological H&E images of human dermal
fibroblasts cultured in fibrin gels a) with and b) without (equibiaxial stretched control) 5mm diameter inclusions
for eight days at 0.2Hz at ‘6%’ applied strain. Arrow represents the edge of the inclusion (corresponding to 45 μm)
5.4. Discussion In this report, we describe the development and validation of an experimental system for the
study of strain magnitude and anisotropy effects on cell behavior in vitro. By adding a rigid
circular inclusion to the center of a radially stretched membrane we are able to create controlled
gradients of strain in the radial and circumferential directions resulting in a continuous spectrum
of stretch magnitudes and axial ratios of stretch, ranging from strip biaxial to equibiaxial stretch.
At a given vacuum pressure, the inclusions create up to a 4-fold increase in maximum radial
strain as compared to an unaltered membrane (23.7% peak strain versus 6% equibiaxial strain), a
gradient of radial strain up to 33.8%/mm, and a maximal strain anisotropy (λr-1/λθ−1) of 13.3.
Regression models relating stretch to radial position, applied strain (vacuum pressure), and
inclusion size facilitate calculation of strain gradients, stretch ratios, and amounts of anisotropy
applied to cells under particular sets of experimental conditions. Additionally, we demonstrate
that strain values can be independently altered on a per well basis with the addition of ring
inserts. Finally, our pilot study demonstrates the utility of the device for use in 2D and 3D
systems by determining the effect of graded levels of strain anisotropy on cell orientation and
tissue reorganization.
96
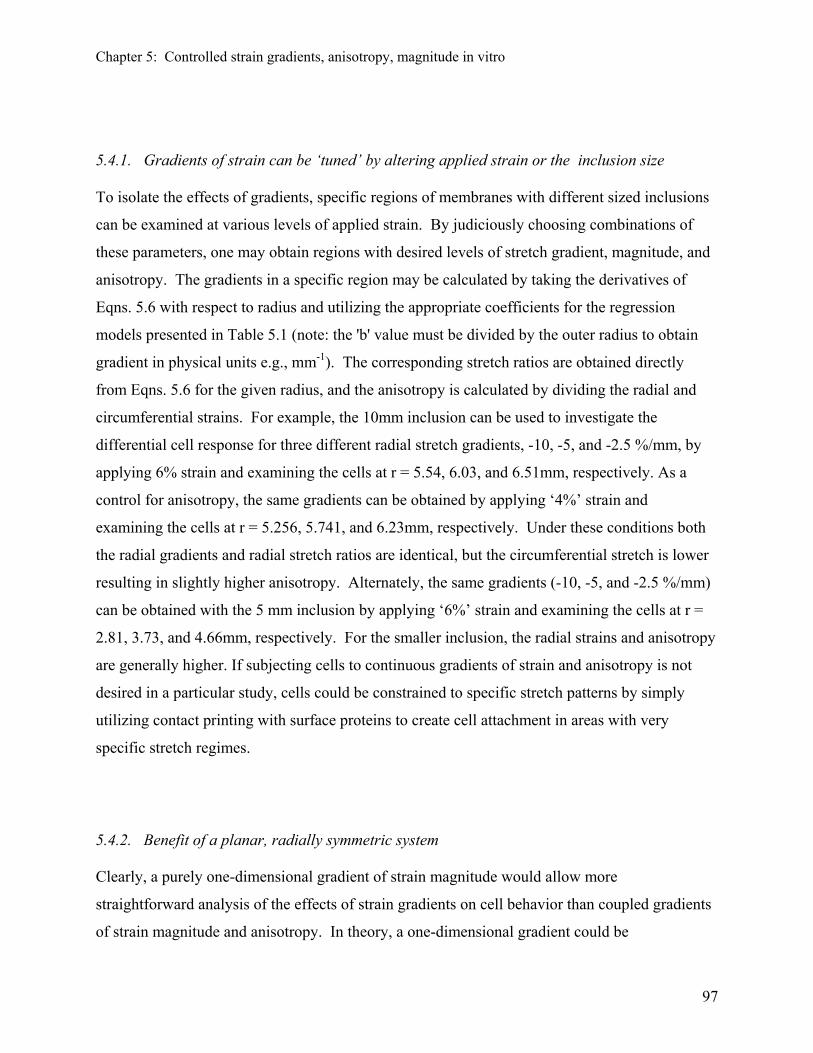
Chapter 5: Controlled strain gradients, anisotropy, magnitude in vitro
5.4.1. Gradients of strain can be ‘tuned’ by altering applied strain or the inclusion size
To isolate the effects of gradients, specific regions of membranes with different sized inclusions
can be examined at various levels of applied strain. By judiciously choosing combinations of
these parameters, one may obtain regions with desired levels of stretch gradient, magnitude, and
anisotropy. The gradients in a specific region may be calculated by taking the derivatives of
Eqns. 5.6 with respect to radius and utilizing the appropriate coefficients for the regression
models presented in Table 5.1 (note: the 'b' value must be divided by the outer radius to obtain
gradient in physical units e.g., mm-1). The corresponding stretch ratios are obtained directly
from Eqns. 5.6 for the given radius, and the anisotropy is calculated by dividing the radial and
circumferential strains. For example, the 10mm inclusion can be used to investigate the
differential cell response for three different radial stretch gradients, -10, -5, and -2.5 %/mm, by
applying 6% strain and examining the cells at r = 5.54, 6.03, and 6.51mm, respectively. As a
control for anisotropy, the same gradients can be obtained by applying ‘4%’ strain and
examining the cells at r = 5.256, 5.741, and 6.23mm, respectively. Under these conditions both
the radial gradients and radial stretch ratios are identical, but the circumferential stretch is lower
resulting in slightly higher anisotropy. Alternately, the same gradients (-10, -5, and -2.5 %/mm)
can be obtained with the 5 mm inclusion by applying ‘6%’ strain and examining the cells at r =
2.81, 3.73, and 4.66mm, respectively. For the smaller inclusion, the radial strains and anisotropy
are generally higher. If subjecting cells to continuous gradients of strain and anisotropy is not
desired in a particular study, cells could be constrained to specific stretch patterns by simply
utilizing contact printing with surface proteins to create cell attachment in areas with very
specific stretch regimes.
5.4.2. Benefit of a planar, radially symmetric system Clearly, a purely one-dimensional gradient of strain magnitude would allow more
straightforward analysis of the effects of strain gradients on cell behavior than coupled gradients
of strain magnitude and anisotropy. In theory, a one-dimensional gradient could be
97
Chapter 5: Controlled strain gradients, anisotropy, magnitude in vitro
accomplished by uniaxially stretching a membrane produced with a gradient of stiffness or
thickness; however, in practice, each of these scenarios would produce complex two-dimensional
strain patterns due to the non-uniform stress patterns in the membrane and uneven lateral
contraction (Poisson effect) along the length of the membrane. Recently, in an analogous
method as used herein, Mooney and colleagues [25] affixed a rigid glass material to the bottom
of a uniaxially stretched planar compliant culture substrate in an effort to produce a one-
dimensional strain gradient. Unfortunately, the two-dimensional deformation field resulting from
this modification was not fully analyzed, thus the effects of the inclusion and culture well
boundaries on the strain field are not clear. In particular, because this system consists of a
membrane that is roughly square, the shear and transverse strains may be substantial resulting in
cells being subjected to complex local strain patterns. The radially symmetric nature of our
design yields consistent two-dimensional strain gradients with low shear strain.
The orthogonal radial and circumferential strain gradients produce controlled anisotropy levels
that span between uniaxial, strip biaxial and equibiaxial strain (Fig. 5.10). These differential
strain patterns can be utilized to investigate cell behavior under a variety of mechanical
conditions. One application for this system would be investigating cell reorientation to stretch.
In 2D systems, fibroblasts and many other cell types have been shown to align to the direction of
minimum principal strain which is perpendicular to the direction of pure uniaxial stretch i.e.,
strip biaxial with zero transverse strain [21] or slightly off axis in standard uniaxial stretch due to
with negative transverse strain produced by the Poisson effect [6, 12]. However, to our
knowledge, no studies exist which examine how cells respond to strain anisotropies that span in
between these orientations of stretch or along a continuous gradient of strain. In our preliminary
2D study, substantial fibroblast reorientation is demonstrated with only slight stretch anisotropy
(λr-1/λθ−1= 2.8 at r = 3.3mm, 1.04:1.01), and more pronounced orientation is observed at higher
levels of anisotropy ((λr-1/λθ−1 = 6.5 at r = 2.8, 1.06:1.00). Studies utilizing our system could
also be used to test the robustness of models of stretch-induced cytoskeletal reorganization and
combined effects with small molecules which alter orientation [32].
Interestingly, our study differs with findings from previous studies where fibroblasts in a 3D
matrix oriented themselves towards the direction of principal strain [1, 33]. It is possible that
98
Chapter 5: Controlled strain gradients, anisotropy, magnitude in vitro
the dramatic increase in strain magnitude (i.e., strain gradient) at the edge of the inclusion
induced a heightened level of matrix remodeling, resulting in substantial degradation of the
matrix and a lack of scaffolding. In a previous study by Seliktar and his colleagues, an increase
in strain magnitude resulted in an increase in the production of MMP-2 and MMP-9, proteolytic
enzymes involved in matrix degradation [34]. Both confocal and histological images near the
edge of the inclusion (i.e., strip biaxial zone) indicate that this area of the tissue is substantially
less cell-populated than any other area of the gel or in stretched controls. In addition, polarized
light microscopy was attempted without success due to the insufficient amount of matrix fibers
in the inclusion samples (see appendix).
5.4.3. Isolating anisotropy, gradient and magnitude effects
Although the observed cell orientation in response to the direction of stretch is consistent with
previous studies [21], it is important to note that the magnitude of strain was different in the
regions analyzed in this study (e.g., 6% radial strain in the strip biaxial region yet only 2% radial
strain in the equibiaxial region). The non-uniformities produced by the inclusion simultaneously
alter both the strain magnitude and anisotropy; therefore, isolating these two effects requires
utilizing proper controls. As the pattern of anisotropy is independent of applied strain (both
radial and circumferential strains are proportional to applied strain as shown in Fig. 5.6), cells
exposed to the same anisotropy but different strain magnitudes can be studied by examining cells
at the same radial position exposed to different levels of applied strain. The applied strain can be
altered either globally (for all 24 wells) by changing the applied vacuum pressure or locally by
applying a high level of vacuum to all wells and adding inserts to limit membrane deformation
differently in each well. This modification, first proposed by Boerboom et al. [30], allows for
multiple strain magnitudes (and thus controls) to be run in parallel on the Flexcell system
without the use of multiple pressure control units. Interestingly, although the trends of restricted
deformation as a function of insert size are similar to those previously reported [30], the
relationship between applied strain and ring height differs. This discrepancy is likely due to
physical alterations to the membrane in the previous study and differences in our platen design
(e.g., equibiaxial as opposed to uniaxial design). To examine specific strain fields of interest,
99
Chapter 5: Controlled strain gradients, anisotropy, magnitude in vitro
one could utilize contact printing using surface proteins (e.g., collagen I) to culture cells in
specific loading areas. This method would allow for the isolation of cellular response by
minimizing cell-cell contact or paracrine soluble factors secreted by neighboring cells
undergoing different strain patterns.
5.4.4. Optimization of effective resolution
As described in the methods, to acquire accurate measurements of strain while minimizing noise,
we employed a high density displacement mapping technique (HDM) with subpixel resolution,
utilized an optimal subimage size, and filtered the data to remove spurious points. HDM
measures the displacement of random light intensity patterns created by surface markers using
phase correlation rather than image cross-correlation, resulting in an accuracy of 0.09 pixels and
a precision of 0.02 pixels [35]. Despite the high accuracy of this technique, as with all image
analysis-based strain field measurement methods, the effective spatial resolution is limited by
resolution of the camera, the need for finite sized sub-regions, filtering of spurious values (e.g.,
due to reflections), and averaging or smoothing necessary for taking derivatives (du/dx).
Although a high resolution camera is used (1280 x 1024 pixels), small sub-regions of multiple
pixels (e.g., 32x32) must be analyzed for accurate correlation of displacement and the reduction
of noise. Measuring the relative displacement of sub-regions rather than individual pixels
effectively ‘blunts’ the data and reduces the effective resolution (c.f., Fig. 5.3a, b, and c). For
example, although the ‘absolute resolution’ of HDM is based on a subpixel displacement, the
difference in strain between any two locations (i.e., ‘gradient resolution’) is limited by the pixel
shift (16 pixels ~ 0.3mm). In addition, taking derivatives of displacement over five data points
(16 pixels each) also contributes to the overall smoothing of data and lowering of the gradient
resolution. The point-by-point removal of spurious data using the 2D Gaussian filter is
accomplished by using a small window size (3x3) and low standard deviation, thus erroneous
data points were removed with minimal filtering of surrounding data and a negligible decrease in
the effective resolution.
100
Chapter 5: Controlled strain gradients, anisotropy, magnitude in vitro
5.4.5. Our findings of symmetric strain gradients support the predictions of Moore and colleagues
The general trends of strain distribution in our study were similar to those predicted by Moore
and colleagues [29], although our measured peak values of radial strain and steepness strain
gradients were much higher (Fig. 5.8). Variance from the predicted results can be attributed to
both theoretical differences (e.g., different boundary conditions) and experimental limitations
(e.g., averaging of sub-regions of the membrane necessary for accurate correlation). In terms of
boundary conditions, the strain is applied differently in our system than in the numerical
analysis. In the numerical analysis, a displacement is applied to the outer boundary of the
membrane resulting in a defined circumferential strain at the outer radius and sequentially higher
radial strains with increasing inclusion size due to the decreasing ‘gauge length’. In contrast, our
method of loading involves a vacuum pressure being applied to the lower surface of the
membrane between the edge of the platen and the fixed outer boundary (Fig. 5.2b). Because the
inclusion restricts the free motion of the membrane, at a given pressure the displacement at the
edge of the platen decreases with increasing inclusion size. This increase in effective global
stiffness creates lower circumferential and radial strains at the boundary than would occur with a
displacement boundary condition (e.g., circumferential strain near the edge of the platen with a
10mm inclusion is less than 5% when vacuum pressure corresponding to ‘6%’ strain is applied,
see Fig. 5.4d). The second source of variance from the numerical analysis results from physical
restrictions: the peak strains and strain gradients are effectively ‘blunted’ due to limitations in the
‘gradient resolution’ (discussed in the above section); and the rate of increase in radial strain at
the edge of the platen is physically limited since a step increase to the peak value predicted at the
edge of the inclusion in the numerical study is not physically possible. At present it is unclear
why we observe higher radial strains and steeper gradients than predicted by Moore and
colleagues, as the experimental limitations should result in lower peak strain values and less
steep curves.
101
Chapter 5: Controlled strain gradients, anisotropy, magnitude in vitro
5.4.6. Restrictions to utilizing the proposed system
It should be noted that there are a few restrictions to using the proposed rigid inclusion system.
In order to ensure radial symmetry of the strain distribution, it is essential that the glass coverslip
be evenly attached (even distribution of silicone glue across the coverslip) and absolutely central
to the membrane. Also, due to edge effects necessitating the restriction of cell attachment the
central 20mm region of membrane, using larger diameter inclusions will result in a limited area
for cell attachment. Specifically, using 5, 10, and 15mm inclusion result in a total usable surface
areas of 295, 236, and 138mm2 (94, 75, or 44% of the total surface area), respectively. Finally,
utilizing the ring inserts to manipulate strain magnitude will effectively blunt the waveforms
resulting in a ‘square’ waveform. This adjustment in waveform may not be appropriate for all
studies (e.g., studies requiring a sinusoidal or other special waveform). To mitigate the effects of
this alteration in the loading curve, validations in this study were performed using a square
waveform.
5.4.7. Conclusions and summary
Our new model system allows for the simultaneous study of cells exposed to different stretch
magnitudes and deformation patterns within a single well and provides a method for directly
studying the effect of gradients of stretch and stretch anisotropy on cell biology. The
commercial availability of the apparatus utilized in our system and the straightforward
modifications to the wells allow for adoption in laboratories without access to complex
equipment. Studies using this device and method could provide valuable information on cellular
adaptation to complex or changing mechanical environments produced by clinical interventions
(e.g., stents, prostheses, etc.), and possibly help understand mechanism underlying propagation
of stiff fibrotic foci as observed in diseases such as idiopathic pulmonary fibrosis. In the future,
we will examine the use of this system in three-dimensional studies in combination with
cytokines such as TGF-β to assess gradient affects on cell-mediated remodeling as seen during
wound healing and fibrocontractive diseases. In conclusion, this system represents a new tool
which may assist in the understanding the relationship between the complex and dynamic
mechanical extracellular environment and cell behavior.
102

Chapter 5: Controlled strain gradients, anisotropy, magnitude in vitro
5.4.8. Acknowledgements
The authors would like to thank Piyush Ramuka for his assistance with MATLAB, Neil
Whitehouse for his assistance with machining, and Tim Ebner, Roxanne Skowran, Angela
Throm, and Andrew Capulli for their technical assistance in the laboratory. In addition, the
authors would like to thank Dr. Daniel Tschumperlin for his valuable discussions on the topic of
strain inhomogeneity and cell behavior. This work was supported in part by the U.S. Army
Medical Research and Materiel Command (USAMRC); grant BFR08-1011-N00 (KLB), and by
the American Heart Association; Scientist Development Grant 0635013N (GRG).
5.5 References [1] Eastwood, M., McGrouther, D. A., and Brown, R. A., 1998, "Fibroblast responses to
mechanical forces," Proc Inst Mech Eng [H], 212(2), pp. 85-92. [2] Giannone, G., and Sheetz, M. P., 2006, "Substrate rigidity and force define form through
tyrosine phosphatase and kinase pathways," Trends Cell Biol, 16(4). [3] Ingber, D. E., 1997, "Tensegrity: the architectural basis of cellular mechanotransduction,"
Annu Rev Physiol, 59, pp. 575-599. [4] Zhang, S., Garbutt, V., and McBride, J. T., 1996, "Strain-induced growth of the immature
lung," J Appl Physiol, 81(4), pp. 1471-1476. [5] Aarabi, S., Bhatt, K. A., Shi, Y., Paterno, J., Chang, E. I., Loh, S. A., Holmes, J. W.,
Longaker, M. T., Yee, H., and Gurtner, G. C., 2007, "Mechanical load initiates hypertrophic scar formation through decreased cellular apoptosis," FASEB J, 21(12), pp. 3250-3261.
[6] Mudera, V. C., Pleass, R., Eastwood, M., Tarnuzzer, R., Schultz, G., Khaw, P., McGrouther, D. A., and Brown, R. A., 2000, "Molecular responses of human dermal fibroblasts to dual cues: contact guidance and mechanical load," Cell Motil Cytoskeleton, 45(1), pp. 1-9.
[7] Lee, A. A., Delhaas, T., McCulloch, A. D., and Villarreal, F. J., 1999, "Differential responses of adult cardiac fibroblasts to in vitro biaxial strain patterns," J Mol Cell Cardiol, 31(10), pp. 1833-1843.
[8] Nishimura, K., Blume, P., Ohgi, S., and Sumpio, B. E., 2007, "Effect of different frequencies of tensile strain on human dermal fibroblast proliferation and survival," Wound Repair Regen, 15(5), pp. 646-656.
[9] Arold, S. P., Wong, J. Y., and Suki, B., 2007, "Design of a new stretching apparatus and the effects of cyclic strain and substratum on mouse lung epithelial-12 cells," Ann Biomed Eng, 35(7), pp. 1156-1164. .
[10] Loesberg, W. A., Walboomers, X. F., van Loon, J. J., and Jansen, J. A., 2005, "The effect of combined cyclic mechanical stretching and microgrooved surface topography on the behavior of fibroblasts," J Biomed Mater Res A, 75(3), pp. 723-732.
103
Chapter 5: Controlled strain gradients, anisotropy, magnitude in vitro
[11] Breen, E. C., Fu, Z., and Normand, H., 1999, "Calcyclin gene expression is increased by mechanical strain in fibroblasts and lung," Am J Respir Cell Mol Biol, 21(6), pp. 746-752.
[12] Raeber, G. P., Lutolf, M. P., and Hubbell, J. A., 2008, "Part II: Fibroblasts preferentially migrate in the direction of principal strain," Biomech Model Mechanobiol, 7(3), pp. 215-225. .
[13] Katsumi, A., Naoe, T., Matsushita, T., Kaibuchi, K., and Schwartz, M. A., 2005, "Integrin activation and matrix binding mediate cellular responses to mechanical stretch," J Biol Chem, 280(17), pp. 16546-16549.
[14] Wang, J. H., Yang, G., and Li, Z., 2005, "Controlling cell responses to cyclic mechanical stretching," Ann Biomed Eng, 33(3), pp. 337-342.
[15] Hashima, A. R., Young, A. A., McCulloch, A. D., and Waldman, L. K., 1993, "Nonhomogeneous analysis of epicardial strain distributions during acute myocardial ischemia in the dog," J Biomech, 26(1), pp. 19-35.
[16] Oomens, C. W., van Ratingen, M. R., Janssen, J. D., Kok, J. J., and Hendriks, M. A., 1993, "A numerical-experimental method for a mechanical characterization of biological materials," J Biomech, 26(4-5), pp. 617-621.
[17] Dartsch, P. C., Hammerle, H., and Betz, E., 1986, "Orientation of cultured arterial smooth muscle cells growing on cyclically stretched substrates," Acta Anat (Basel), 125(2), pp. 108-113.
[18] Kulik, T. J., and Alvarado, S. P., 1993, "Effect of stretch on growth and collagen synthesis in cultured rat and lamb pulmonary arterial smooth muscle cells," J Cell Physiol, 157(3), pp. 615-624.
[19] Berry, C. C., Cacou, C., Lee, D. A., Bader, D. L., and Shelton, J. C., 2003, "Dermal fibroblasts respond to mechanical conditioning in a strain profile dependent manner," Biorheology, 40(1-3), pp. 337-345.
[20] Shelton, J. C., Bader, D. L., and Lee, D. A., 2003, "Mechanical conditioning influences the metabolic response of cell-seeded constructs," Cells Tissues Organs, 175(3), pp. 140-150.
[21] Wang, J. H., Goldschmidt-Clermont, P., Moldovan, N., and Yin, F. C., 2000, "Leukotrienes and tyrosine phosphorylation mediate stretching-induced actin cytoskeletal remodeling in endothelial cells," Cell Motil Cytoskeleton, 46(2), pp. 137-145.
[22] Balestrini, J. L., and Billiar, K. L., 2009, "Magnitude and duration of stretch modulate fibroblast remodeling," J Biomech Eng, 131(5), p. 051005.
[23] Boccafoschi, F., Bosetti, M., Gatti, S., and Cannas, M., 2007, "Dynamic fibroblast cultures: response to mechanical stretching," Cell Adh Migr, 1(3), pp. 124-128. .
[24] Lo, C. M., Wang, H. B., Dembo, M., and Wang, Y. L., 2000, "Cell movement is guided by the rigidity of the substrate," Biophys J, 79(1), pp. 144-152.
[25] Yung, Y. C., Vandenburgh, H., and Mooney, D. J., 2009, "Cellular strain assessment tool (CSAT): precision-controlled cyclic uniaxial tensile loading," J Biomech, 42(2), pp. 178-182.
[26] Gilbert, J. A., Weinhold, P. S., Banes, A. J., Link, G. W., and Jones, G. L., 1994, "Strain profiles for circular cell culture plates containing flexible surfaces employed to mechanically deform cells in vitro," J Biomech, 27(9), pp. 1169-1177.
104
Chapter 5: Controlled strain gradients, anisotropy, magnitude in vitro
[27] Williams, J. L., Chen, J. H., and Belloli, D. M., 1992, "Strain fields on cell stressing devices employing clamped circular elastic diaphragms as substrates," J Biomech Eng, 114(3), pp. 377-384.
[28] Winston, F. K., Macarak, E. J., Gorfien, S. F., and Thibault, L. E., 1989, "A system to reproduce and quantify the biomechanical environment of the cell," J Appl Physiol, 67(1), pp. 397-405.
[29] Mori, D., David, G., Humphrey, J. D., and Moore, J. E., Jr., 2005, "Stress distribution in a circular membrane with a central fixation," J Biomech Eng, 127(3), pp. 549-553.
[30] Boerboom, R. A., Rubbens, M. P., Driessen, N. J., Bouten, C. V., and Baaijens, F. P., 2008, "Effect of strain magnitude on the tissue properties of engineered cardiovascular constructs," Ann Biomed Eng, 36(2), pp. 244-253.
[31] Balestrini, J. L., and Billiar, K. L., 2006, "Equibiaxial cyclic stretch stimulates fibroblasts to rapidly remodel fibrin," J Biomech, 39(16), pp. 2983-2990.
[32] Kaunas, R., Nguyen, P., Usami, S., and Chien, S., 2005, "Cooperative effects of Rho and mechanical stretch on stress fiber organization," Proc Natl Acad Sci U S A, 102(44), pp. 15895-15900. .
[33] Hinz, B., and Gabbiani, G., 2003, "Mechanisms of force generation and transmission by myofibroblasts," Curr Opin Biotechnol, 14(5), pp. 538-546.
[34] Seliktar, D., Nerem, R. M., and Galis, Z. S., 2001, "The role of matrix metalloproteinase-2 in the remodeling of cell-seeded vascular constructs subjected to cyclic strain," Annals of Biomedical Engineering, 29(11), pp. 923-934.
[35] Kelly, D. J., Azeloglu, E. U., Kochupura, P. V., Sharma, G. S., and Gaudette, G. R., 2007, "Accuracy and reproducibility of a subpixel extended phase correlation method to determine micron level displacements in the heart," Med Eng Phys, 29(1), pp. 154-162.
105

CHAPTER 6
Conclusions and future work 6.1. Overview
This thesis describes an investigation of how mechanical factors present in connective
tissue during wound healing regulate cell-mediated matrix remodeling and changes in
tissue architecture. Harnessing the relationship between stretch and matrix remodeling
will provide new insights into the fundamental processes of wound healing, hyperplasia,
and fibrosis and assist in creating tissue-engineered constructs with custom-tailored
properties. We specifically isolate stretch effects on cell function independent of passive
matrix in-plane alignment, established functional dose-response curves to quantify the
relationship between stretch and remodeling, and developed a novel system to study the
complex non-uniform nature of strains observed in connective tissue.
6.2. Isolating the effects of mechanical loading on cell-mediated matrix remodeling
during fibroplasia
6.2.1. Minimizing fiber alignment to isolate stretch effects
We began our investigation of how mechanical cues influence fibroblast behavior in the
early stages of wound healing by isolating the effects of mechanical stimulation on 3D
planar tissue models. Previous to our original study, researchers had demonstrated
significant increases in mechanical properties of uniaxially stretched cell-populated
biopolymer gels [1-14], although it was unclear if these increases were cell-mediated or
simply a result of passive alignment of the tissue. By applying equibiaxial stretch to
fibroblast-populated fibrin gels, we were successful in minimizing in-plane alignment
106

Chapter 6: Conclusions and future work
previously observed in these uniaxially stretched systems [1, 15] and demonstrated that
cyclic stretch actively stimulates fibroblasts to produce a stronger matrix by profoundly
increasing tissue compaction, matrix fiber reorganization and collagen content. In
addition, collagen cross-linking was found to play a major role in stretch-induced tissue
compaction and compaction derived matrix strength but not the structural strengthening
during this early culture period.
Increases in tensile strength in mechanically conditioned tissue equivalents have been
suggested to result from increases in tissue compaction (often due to a decreased tissue
thickness) [16, 17], fibril alignment, enhanced entanglement of the fibrils due to the
increase in matrix density [9], intermolecular cell-fibril and fibril-fibril bonding, bundling
of the fibrils, and crosslinking [18]. Previous investigators that utilized uniaxial stretch to
collagen gels [16], fibrin gels [19], and collagen/fibrin blends [17] also observed
substantial increases in tensile strength. Although our study indicates that the majority of
increases in stretch-induced mechanical properties are primarily due to a decrease in
tissue thickness, we did observe the presence of more subtle cell-mediated strengthening
mechanisms such as collagen synthesis and crosslinking that were increased and
contributed to the increased strength of the mechanically stimulated gels.
6.2.2. Establishing the relationship between stretch magnitude, duration of stimulation
per day, and matrix remodeling
After determining that mechanical conditioning actively stimulates fibroblast remodeling
behavior in fibrin gels, we sought to investigate how cells responded to different levels
and durations (length per day) of mechanical conditioning. Using methodology
developed in the previous study, we cycled fibrin gels for 2, 4, 8 or 16 % strain for either
6 (intermittent) or 24 (continuous) hours per day. As a result, we determined that stretch-
induced fibroblast remodeling behavior was profoundly impacted by both the magnitude
and duration of strain per day, as evidenced by dose-dependent responses of several
functional remodeling metrics. We determined that tissue strength, stiffness, and the
107
Chapter 6: Conclusions and future work
accumulation of collagen increased with increasing stretch magnitude in all samples, and
that cycling intermittently rather than continuously did not reduce the level of tissue
compaction, UTS, or tissue retraction between these groups. Interestingly, stretch
magnitude-dependent increases in cell number, extensibility, failure tension, and net
collagen accumulation were contingent upon the introduction of a rest period during
stimulation. It appears that reducing the mechanical loading time increases cellular
capacity to remodel their surrounding tissue into a more cell populated, collagen-dense
and functionally stronger tissue.
Although it is well known that mechanical stretch regulates a variety of aspects of cell
function through a variety of mechanisms (e.g., regulation of cell cycle, integrin
production, integrin confirmation, cell signaling pathways), which of these underlying
mechanisms are altered by increasing the magnitude or introducing a rest period during
mechanical conditioning is not yet understood. It is however becoming clear that cells
within mechanically loaded tissues undergo an “adaptation response” to continuous
signaling (one magnitude, stretched continuously); cells exposed to a constant
mechanical stimuli initially demonstrate heightened activity but return to baseline levels
after sustained mechanical stimulation [20-22]. For example, smooth muscle cells that
are stretched continuously have been shown to undergo cell cycle arrest or “growth
arrest” via the prevention of phosphorylation of key regulatory proteins involved in the
transition from the late G1 phase to the S phase [23]. It is therefore possible that utilizing
intermittent stretch may disrupt this adaptation response by allowing for the continuation
of cell cycle events, thus increasing the effectiveness of the mechanical conditioning on
cell proliferation and matrix synthesis. This premise is supported by recent work from
Tranquillo and colleagues where incrementally increasing stretch magnitude in fibrin gels
resulted in higher ECM production, UTS, and cell number than cycling continuously at a
given magnitude of stretch [14].
In addition, the introduction of a rest period, or the increase in stretch magnitude could
have profound effects on cell activity by through the release of mediators, such as MMPs
and transforming growth factor-β, which can regulate matrix remodeling processes such
108
Chapter 6: Conclusions and future work
as proliferation and matrix deposition. Finally, it has been suggested that the effects of
cyclic stretch on cell proliferation and ECM production is matrix dependent and mediated
by integrin binding to specific matrix proteins [24]. In the event of an increase in
collagen or other ECM proteins as seen in our intermittent stretched samples, it is likely
that the cell-ECM couplings would also be affected. It has also been established that
incorporating a rest period during mechanical loading regulates fibroblasts to utilize
completely separate cell signaling pathways than when loaded continuously [25]. Hu et
al. demonstrated that mechanical stresses may directly alter receptor conformation to
initiate signaling pathways normally used by growth factors; therefore, it is possible that
differential stretch regimes would induce alterations in integrin upregulation and
conformation resulting in the usage of separate signaling pathways [26]. Although it
remains unclear as to which of these underlying mechanisms enhances cellular response
during intermittent cycling, it is clear that cells reorganize and remodel their matrix
differently when the level of mechanical stimulation is varied, and that this phenomenon
should be investigated in future studies.
6.2.3. Determining passive and active stretch effects
Although we have demonstrated that mechanically stimulated cells actively compact their
matrix through remodeling mechanisms (e.g., collagen crosslinking), it is important to
note that the compaction of fibrin gels is in part a passive event. In our first study, we
observed that cyclically stretching acellular fibrin gels resulted in a significant decrease
in thickness relative to statically-cultured acellular fibrin gels. The passive compaction
of the fibrin could simply be due to the increased proximity of fibers when stretched;
fibrin is an adhesive molecule and, when condensed, could form intermolecular bonds
between fibrils and stretch-induced entanglements. This phenomenon of passive
compaction has been previously noted; Cummings et al. [27] also observed compaction
of acellular gels, although not as marked as found in our first study. Passive compaction,
or compaction that is not cell-mediated, can be problematic when attempting to isolate
active cellular remodeling mechanisms. In addition, increases in passive tissue
109

Chapter 6: Conclusions and future work
compaction could also be impacting cell behavior and therefore remodeling activity. The
increase in matrix density would result in an increase in cell density, potentially
increasing functional cell-cell and cell-matrix interactions [17] and therefore remodeling
capacity of the resident cells. Therefore, it is important to investigate the overall impact
of stretch on the active and passive contributions to regulating cell function.
Measurements that are typically utilized to quantify intrinsic material properties and thus
matrix remodeling are generally dependent on thickness (e.g., matrix density, UTS,
Young’s modulus), and therefore it can be difficult to isolate the active cellular
contribution to these metrics. As seen in our first two studies, compaction results in very
large decreases in matrix volume creating large changes in all intrinsic parameters;
stretch-induced compaction could therefore obscure active (or more subtle) forms of cell-
mediated remodeling. This scenario is illustrated in our second study where we
investigated strain-magnitude dependent increases in UTS in continuously and
intermittently stretched gels resulted at increasing strain magnitudes resulted in similar
amounts of UTS. When comparing the strength of these tissues using UTS as a metric,
the mechanical properties of these tissues is quite similar and is not significantly
impacted by the duration of the stretch stimulus. When we examined structural
properties of these tissues (i.e., not normalized to thickness), cycling fibrin gels
intermittently rather than continuously resulted in a stronger tissue construct in terms of
failure tension. Only by examining both intrinsic and structural properties were we
capable of fully characterizing changes in tissue properties due to the different regimens
of mechanical conditioning. Based on our findings, other researchers have begun to
investigate both structural and intrinsic measurements of matrix properties [28].
6.3. Developing relevant mechanobiological models of wound healing in planar
connective tissues
6.3.1. Fibrin gels as models of early wound healing
110

Chapter 6: Conclusions and future work
Although the bulk of studies investigating mechanoregulation in three-dimensional
wound healing systems utilize collagen gels, we elected to utilize fibrin gels for our
studies. Collagen gels are an excellent model of end-stage wound healing (remodeling)
or fibrosis. However as we seek to investigate mechanical regulation in the initial stages
of wound healing (i.e., fibroplasia), fibrin gels are a more appropriate model system.
Fibrin, in combination with other components of the extracellular matrix, plays a vital
role in the fibroproliferative response in wound healing through multiple mechanisms
including a direct stimulation of cytokine production, modification of cytokine and
growth factor activity, and modulation of the expression of matrix protein degrading
proteases and their inhibitors [29, 30]. In addition, it has recently been suggested that
fibrin may play a larger role in the tensile strength and remodeling of the provisional
matrix than previously thought [31, 32]. The tensile strength is significantly lower during
early stages of wound healing in fibrinogen-deficient mice, despite finding higher
collagen levels [31]. These findings are supported by a study where scorbutic (scurvy-
induced) animals maintained a normal rate of wound size reduction despite the obvious
lack of collagen production [33]. In Chapter 3, we showed that aggregates of fibrin were
observed in TEM micrographs of cyclically stretched fibrin gels, but they were not
apparent in the statically grown fibrin gels. These formations suggest that cells could
potentially be reorganizing and bundling fibrin; these bundles could potentially provide
an interim source of mechanical stability prior to sufficient collagen accumulation and
maturation. These findings are however quite preliminary, and further morphological
investigation is required.
In the studies presented in this thesis, we elected to utilize neonatal fibroblasts as opposed
to adult dermal fibroblasts or fibroblasts from alternative connective tissue types (e.g.,
lung fibroblasts). Neonatal fibroblasts are utilized extensively as models of connective
tissue [25, 32, 34-39]; these cells produce more extracellular matrix and have a faster
proliferation rate in culture than adult dermal fibroblasts [34]. In addition, due to the
large amount of literature available on neonatal fibroblast response to mechanical
stimulation, comparisons of our findings to previous research were feasible. In addition,
previous research not included in this thesis indicated that dermal fibroblasts are
111
Chapter 6: Conclusions and future work
substantially less proteolytic than alternative fibroblast cell types (e.g., lung fibroblasts,
valvular interstitial cells), enabling the investigation of mechanical regulation of
fibroblast behavior without the necessity of using proteolytic inhibitors. In these studies,
we elected not to block proteolytic activity using inhibitors in order to better understand
how mechanical loading impacts matrix remodeling; although we did not directly
measure proteolytic activity, we wanted to more accurately represent the response of cells
to stretch in terms of protein degradation and synthesis. In addition, we did not utilize
exogenous TGF-β1 (growth factor) as it is well known that cyclic stretch and TGF-β1
have synergistic effects on cell function [40], and we sought to isolate the impact of
mechanical stretch alone on cell activity.
It is important to note that although fibrin gels as in vitro models do allow for the
investigation of mechanobiological response of cells to mechanical cues, there are several
limitations to using these analogs. Because these are simplified models of connective
tissue, they do not include other important constituents found in vivo including immune
system components (e.g., macrophages) , exogenous growth factors (e.g., EN-1, TGF-β,
EGF, etc) and alternative cell types in addition to fibroblasts found in connective tissue
(e.g., epithelial and endothelial cells). In addition, the systems utilized in these studies do
not allow for the investigation of fibroblast infiltration into the matrix, nor do they model
interactive effects of chemoattractants and cell function. Further, because fibroblasts
readily degrade the surrounding fibrin at a rapid rate, experimental duration using these
systems is somewhat limited. Therefore it is difficult to ascertain the effects of longer
term stimulation on cell function and measure therefore the functional changes in the
tissue that would require more substantial culture durations (e.g., markers seen during
pathological onset, appreciable collagen production). In order to circumvent fibroblast-
mediated fibrin degradation, one option would be to utilize protease inhibitors such as ε-
ACA or Aprotinin as done previously, or adjust the balance of protein synthesis and
degradation by adding soluble factors such as TGF-β1 that promote matrix production by
fibroblasts. Future studies utilizing these factors would allow for the investigation of long
term tissue remodeling as a function of mechanical loading, and also allow for the
112

Chapter 6: Conclusions and future work
investigation of modifying fibrin gel composition for use as tissue equivalents in
regenerative medicine.
6.3.2. Modeling the complex mechanical environment of connective tissue
Although past investigations have provided a wealth of information regarding the
response of cells to homogeneous mechanical stimulation, there is very little known
about how cells respond to the complex strain fields found in vivo. In most studies, cells
are plated on substrata that are deformed equibiaxially or uniaxially as uniformly as
possible [25, 41, 42]. Although uniaxially stretched systems produce complex strain
distributions as a result of edge effects present at the grips of the device, researchers
typically focus on the area that is most uniformly deformed [25, 41, 42]. Strain
distributions in vivo are often non-uniform, anisotropic (i.e., deformed at different
magnitudes at different directions) and produce local gradients of strain magnitude [43,
44].
We sought to develop an experimental system to produce complex but reproducible non-
homogeneous strain patterns for the study of strain magnitude, anisotropy, and gradient
effects on cells in culture. The commercially available system utilized in our first two
studies (i.e., a Flexcell device) was modified by simply affixing glass coverslips (5, 10, or
15mm diameter) to the center of 35mm diameter flexible-bottomed culture wells. To
isolate the effects of strain magnitude, we utilized ring inserts previously reported by
Boerboom [4] that allowed for multiple strain magnitudes to be run in parallel. By
rigorously validating 2D and 3D deformation fields using high density mapping, we
determined that the addition of the rigid inclusion creates strong circumferential and
radial strain gradients and produces a continuous range of stretch anisotropy ranging from
strip biaxial to equibiaxial strain. Further, we also determined that even at low levels of
applied strain, the addition of a rigid inclusion results in a substantial increase in strain
magnitudes at the edge of the inclusion (e.g., a sample with a 5 mm inclusion cycled to
“2%” applied strain will have a 3 fold increase in strain).
113
Chapter 6: Conclusions and future work
To investigate how this system impacts cellular behavior in 2D and 3D systems, either
dermal fibroblasts were seeded (5mm inclusions and cycled to ‘2%’ applied strain for 2
days), or fibroblast-populated fibrin gels were cast directly into culture wells (5mm
inclusions and cycled to ‘6%’ applied strain for 8 days at 6 hours per day) and
mechanically conditioned. Cells in 2D and 3D systems oriented themselves to the
direction of principal strain as seen previously [45], with the highest level of alignment at
the edge of the inclusion. In the 3D inclusion system, fibroblasts compacted their matrix
in a response to increasing strain magnitude as was observed in Chapter 4 in uniformly
stretched samples. As a result there was substantial compaction at the edge of the
inclusion and a subsequent gradient of tissue thickness across the tissue. Interestingly,
the histological images of fibroblasts cycled within the inclusion system appear to be
degraded more extensively, as evidenced by sparse fibrin arrangement and low cellularity
compared with stretched controls. Although the strain magnitude at the edge of the
inclusion is substantially higher than maximum strain levels in stretched control (15%
versus 6% strain magnitude, respectively), there appears to be global degradation of the
tissue, even in areas where strain magnitude is identical to control values (e.g., 6% strain
at 5 mm from the center). In our previous study where gels were cycled intermittently at
16% strain, this level of degradation was not present (refer to Figure 4.2).
Although not investigated in this preliminary experiment, it appears that the
inhomogeneities produced in our system could be increasing the proteolytic activity in
cells. If true, this finding would suggest that even at low levels of applied stretch (e.g.,
due to normal breathing), the introduction of an inclusion (e.g., stiff fibrotic focus or a
prosthetic) would profoundly impact global strain distributions and greatly enhancing
matrix remodeling. This strain distribution-dependent enhancement of matrix remodeling
could play a critical role in the persistence and propagation of disease, or be dictate the
success or failure of device implantation. Further, with the addition of increased collagen
and subsequent increase of peak radial strains (due to the increase in inclusion size), it is
possible that the addition of a stiff fibrotic foci in a mechanically loaded tissue (e.g,. the
lungs) could be creating a self-propagating disease. Experiments investigating fibrotic
disease onset or the remodeling following implantation of devices as a function strain
114
Chapter 6: Conclusions and future work
distributions would assist in the understanding of the role of mechanics during these
states of repair and are discussed in the future studies section of this thesis (6.5).
6.4. Mechanical conditioning for use in regenerative medicine
Currently, most tissue equivalents lack sufficient mechanical integrity and durability for
clinical usage in load-bearing applications [46]. Mechanical conditioning has become a
primary strategy to address these limitations in tissue strength and has been met with
some success [47]. In this thesis, we determined that the UTS of tissues increased
exponentially with increasing stretch magnitude (over the range studied), and this
enhancement of tissue strength did not require large strain levels, continuous stimulation,
exogenous growth factors such as TGF-β, or extended culture duration – all parameters
previously thought to be required for a substantial increase in tissue strength [4, 14, 36].
For example, we determined that after only eight days of mechanical conditioning with as
little as 8% strain, stretched fibrin gels become approximately 6-fold stronger, 10-fold
more collagen dense, 9-fold stiffer, and 20% more cell populated. In order to harness
stretch as a means and to custom tailor tissue analogs with specific requirements (e.g.,
strength, stiffness, contractility), quantitative relationships between mechanical
simulation and extracellular matrix remodeling are required. Our results demonstrate that
the magnitude and the duration per day of stretch are both critical parameters in matrix
remodeling and suggest that these two factors can be used independently or in concert to
manipulate different aspects of remodeling. In addition, the use of non-uniform strain
could be particularly useful for the creation of tissue analogs with girded matrix
properties. These tissue equivalents could be beneficial at the interfaces between tissues
with different material properties (and therefore different loading conditions, or at the
interface of a prosthesis).
6.5. Future work
It remains unclear as to why introducing a rest period by using intermittent stretch
increases fibroblast ability to produce more net collagen content, increase in number and
strengthen their matrix as compared with continuously cycled fibroblasts. In order to
115
Chapter 6: Conclusions and future work
determine the effects on intermittent stretch on cell cycle events, proliferation could be
measured by [3H]-thymidine incorporation [23], cell number counts over time (i.e., at
specific time points), or by histological staining for proliferative markers (e.g., by
staining for KI 67+ cells) [48]. The percentage of cells in the G0/G1, S and G2/M phase
of the cell cycle can be determined by cell cycle analysis using specific markers in
conjunction with flow cytometry [23].
An alternative application of the 2D inclusion system developed in our final study could
be the use of contact printing with surface functionalization proteins to create cell
attachment in areas with very specific stretch regimes. Surface proteins such as collagen
I could be placed within one specific area of known strain anisotropy per well, thus
eliminating cell-cell communication and soluble factors between fibroblasts undergoing
differential strain regimes. Alternative potential modifications of the system include the
addition of PDMS micro grooves on the surface of the silicone membrane to study
contact guidance and orientation dependence, investigating the impact of electrical
signaling in conjunction with dynamic conditioning, or even altering the surface stiffness
to investigate combined effects of durotaxis and tendotaxis.
Preliminary evidence from our 3D inclusion study suggests that introducing gradients of
strain magnitude and anisotropy could profoundly stimulate cell remodeling activity.
Alternative measures of tissue architecture and matrix remodeling should also be assayed.
Although we attempted to analyze fiber orientation in our inclusion system with polarized
light microscopy [49], there was not enough material remaining post conditioning to
acquire accurate measures of fiber orientation. In future studies, an antifibrolytic
inhibitor (ε-ACA, 3 mg/ml) could be utilized to restrict fibrin degradation and investigate
long-term effects of mechanical conditioning, or continuous strain could be utilized to
attain a lesser level of matrix remodeling. In addition, functional measures of remodeling
could be assayed for by measuring matrix stiffness (refer to Appendix for methods and
preliminary data), collagen deposition, or cellularity.
Studies using the 3D rigid inclusion system could also provide valuable information on
cellular adaptation to complex or changing mechanical environments produced by
116
Chapter 6: Conclusions and future work
clinical interventions (e.g., stents, prostheses, etc.), possibly helping to understand
mechanisms underlying propagation of stiff fibrotic foci as observed in diseases such as
idiopathic pulmonary fibrosis. Currently it is unclear if the stretch-induced remodeling
responses seen in these studies are indicative of fibrotic disease progression, normal
healing, or protection from a fibrotic response. In particular in our final study, it is
unclear if the heightened level of matrix remodeling at the edge of the inclusion would be
considered normal or fibrotic healing.
Fibrotic-like remodeling can be evaluated by examining the cell phenotypes within the
tissue, the persistence of these cell types, the accumulation of net collagen over time, and
the production of profibrotic and anti-fibrotic factors. For example, it is well accepted
myofibroblast persistence plays a critical role in the onset of several fibrotic diseases. The
location of myofibroblasts and the percentage of the total cell population in the fibrin gel
(compared to fibroblasts) can be determined by measuring the amount of α-SMA relative
to total cell number (e.g., staining histologically or removing the cells from their matrix
and sorting with FACS), and the persistence could be determined with by performing a
duration study where numbers of these cells in response to mechanical stimulation are
tracked over time. Endogenous profibrotic factors such as TGF-β1 [50], fibroblast
growth factor (FGF-2) [51], interlukin-1 (IL-1) [51-53], and connective tissue growth
factor (CTGF) [51] could also be measured and compared with anti-fibrotic factors such
as tissue inhibitor of metalloproteinases (TIMPs) [41, 48, 54, 55] (e.g., TIMP 1,2,3, 4)
and collagenases (e.g., collagenase-1 and collagenase-2) [48] to ascertain a profibrotic
response of fibroblasts to differential strain regimes. Further, the inclusion of a
proteolytic inhibitor would allow for the extended culture duration of these equivalents,
and allow for the examination of changes in tissue architecture, composition, and material
properties in response to the addition of an inclusion over time. If cell-mediated
remodeling resulted in global changes in tissue properties including “pathological” levels
of tissue stiffness or collagen accumulation and composition (i.e., levels and amounts that
compare to that of scar tissue [56]), this result would indicate a fibrotic response.
117
Chapter 6: Conclusions and future work
Specific integrin expression could also be an indicator of fibrotic activity. Integrins link
the cell cytoskeleton to the extracellular matrix and have been found to regulate cell
adhesion and migration, modulate growth factor sensitivity, transduce external forces into
intracellular signals, and transmit cell-generated tension [57]. Specific integrins have
been shown to mediate myofibroblast differentiation and function, particularly those
specific for collagen (α1β1, α2β1) and fibronectin (α5β1)) [58, 59]. For example, Swartz
and colleagues demonstrated that blocking α2β1 reduces aSMA expression of human lung
and dermal fibroblasts in a collagen gel model of interstitial flow [58]. These integrins
have also been associated with increased contractility, pathological remodeling, and
resistance to apoptosis of fibroblasts [60, 61]. To determine the role and production of
these integrins in response to non-homogeneous stretch, the expression of α1β1, α2β1, and
α5β1 integrins could be alternatively measured and blocked.
In the future, our model system will be utilized in combination with relevant cytokines in
three-dimensional studies to assess gradient affects on cell-mediated remodeling as seen
during fibrocontractive disease. It has also been established that fibroblasts under
mechanical stimulation respond differently to growth factor and cytokine simulation than
statically grown fibroblasts [3, 62, 63]. This is supported by findings of synergy between
stretch and profibrotic factors such as TGF-β1 on the regulation of synthetic activity [64].
TGF-β1, a fibroblast chemoattractant [65] and profibrotic cytokine, is a potent stimulus
of myofibroblast activation and fibrosis onset.[66-71] TGF-β1 is a direct inducer of the
myofibroblast phenotype; exposure to TGF-β1 induces the expression of the
myofibroblast marker α-SMA in both growing and quiescent cultured fibroblastic
populations [66], while blocking TGF-β1 results in a dramatic reduction of α-SMA
expression [66]. TGF-β1 also stimulates fibroblast contractility [67] and the production
of ECM compounds associated with fibrosis [72-74].
Future studies could also include the investigation of active versus passive stretch-
induced fiber alignment; whether fiber alignment guides cell behavior through contact
guidance or if cell mediated activity guides dictates fiber alignment. To test if cells are
actively remodeling and reorienting the fibers in response to mechanical conditioning,
118
Chapter 6: Conclusions and future work
protein degradation could be blocked by treating the fibrin gels with a proteolytic
inhibitor (e.g., Aprotinin) and the orientation of cells (e.g., via microscopy), fibers (e.g.,
PLM), and the amount of matrix synthesis could be measured. To ascertain the passive
contribution of fiber alignment in response to mechanical conditioning, acellular fibrin
gels could be compared to cellularized fibrin gels, and the fiber orientation measured.
6.5.1. Final Conclusions
This thesis describes the investigation of cellular response in complex biaxial loading
conditions, as seen in connective tissues during the process of wound healing. First, a
novel model system was developed using equibiaxial stretch that enabled the
investigation of mechanical effects on functional cell-mediated matrix remodeling.
Using this methodology, we were able to demonstrate that cyclic stretch stimulates
fibroblasts to produce a stronger matrix by dramatically increasing compaction, matrix
fiber reorganization, and collagen content without in-plane alignment.
We then further developed dose-response curves for multiple aspects of tissue
remodeling as a function of stretch magnitude and duration. Allowing a long rest period
each day, rather than cycling continuously, enhanced the effects of stretch on structural
but not intrinsic properties of the model tissue. Specifically, cycling intermittently rather
than continuously did not alter the level of tissue compaction, UTS, or tissue retraction
between these groups. Conversely, stretch magnitude-dependent increases in cell
number, extensibility, and net collagen accumulation were contingent upon this rest
period. Our results indicate that both the magnitude and the duration per day of stretch
are critical parameters in modulating fibroblast remodeling of the extracellular matrix,
and that these two factors can be used independently or in concert to regulate specific
aspects of remodeling.
Finally, we developed a model system that enables the investigation of the impact of
strain gradients, strain anisotropy, and strain magnitude in two and three dimensional
119
Chapter 6: Conclusions and future work
systems. Establishing the effects of complex strain distributions not only allows for more
relevant modeling of the mechanical conditions in connective tissue, but also allows for
the investigation of cellular adaptations to changing mechanical environment over time.
References [1] Altman, G. H., Horan, R. L., Martin, I., Farhadi, J., Stark, P. R., Volloch, V.,
Richmond, J. C., Vunjak-Novakovic, G., and Kaplan, D. L., 2002, "Cell differentiation by mechanical stress," FASEB J, 16(2), pp. 270-272.
[2] Balestrini, J. L., and Billiar, K. L., 2006, "Equibiaxial cyclic stretch stimulates fibroblasts to rapidly remodel fibrin," J Biomech, 39(16), pp. 2983-2990.
[3] Bishop, J. E., Mitchell, J. J., Absher, P. M., Baldor, L., Geller, H. A., Woodcock-Mitchell, J., Hamblin, M. J., Vacek, P., and Low, R. B., 1993, "Cyclic mechanical deformation stimulates human lung fibroblast proliferation and autocrine growth factor activity," Am J Respir Cell Mol Biol, 9(2), pp. 126-133.
[4] Boerboom, R. A., Rubbens, M. P., Driessen, N. J., Bouten, C. V., and Baaijens, F. P., 2008, "Effect of strain magnitude on the tissue properties of engineered cardiovascular constructs," Ann Biomed Eng, 36(2), pp. 244-253.
[5] Boublik, J., Park, H., Radisic, M., Tognana, E., Chen, F., Pei, M., Vunjak-Novakovic, G., and Freed, L. E., 2005, "Mechanical properties and remodeling of hybrid cardiac constructs made from heart cells, fibrin, and biodegradable, elastomeric knitted fabric," Tissue Eng, 11(7-8), pp. 1122-1132.
[6] Chun, J., Tuan, T. L., Han, B., Vangsness, C. T., and Nimni, M. E., 2003, "Cultures of ligament fibroblasts in fibrin matrix gel," Connect Tissue Res, 44(2), pp. 81-87.
[7] Isenberg, B. C., and Tranquillo, R. T., 2003, "Long-term cyclic distention enhances the mechanical properties of collagen-based media-equivalents," Ann Biomed Eng, 31(8), pp. 937-949.
[8] Kim, B. S., Nikolovski, J., Bonadio, J., and Mooney, D. J., 1999, "Cyclic mechanical strain regulates the development of engineered smooth muscle tissue," Nat Biotechnol, 17(10), pp. 979-983.
[9] Seliktar, D., Black, R. A., Vito, R. P., and Nerem, R. M., 2000, "Dynamic mechanical conditioning of collagen-gel blood vessel constructs induces remodeling in vitro," Ann Biomed Eng, 28(4), pp. 351-362.
[10] Seliktar, D., Nerem, R. M., and Galis, Z. S., 2003, "Mechanical strain-stimulated remodeling of tissue-engineered blood vessel constructs," Tissue Eng, 9(4), pp. 657-666.
[11] Swartz, D. D., Russell, J. A., and Andreadis, S. T., 2005, "Engineering of fibrin-based functional and implantable small-diameter blood vessels," Am J Physiol Heart Circ Physiol, 288(3), pp. H1451-1460.
[12] Wille, J. J., Elson, E. L., and Okamoto, R. J., 2006, "Cellular and matrix mechanics of bioartificial tissues during continuous cyclic stretch," Ann Biomed Eng, 34(11), pp. 1678-1690.
120
Chapter 6: Conclusions and future work
[13] Ye, Q., Zund, G., Benedikt, P., Jockenhoevel, S., Hoerstrup, S. P., Sakyama, S., Hubbell, J. A., and Turina, M., 2000, "Fibrin gel as a three dimensional matrix in cardiovascular tissue engineering," Eur J Cardiothorac Surg, 17(5), pp. 587-591.
[14] Syedain, Z. H., Weinberg, J. S., and Tranquillo, R. T., 2008, "Cyclic distension of fibrin-based tissue constructs: evidence of adaptation during growth of engineered connective tissue," Proc Natl Acad Sci U S A, 105(18), pp. 6537-6542. .
[15] Tranquillo, R. T., 2002, "The tissue-engineered small-diameter artery," Ann N Y Acad Sci, 961, pp. 251-254.
[16] Seliktar, D., Nerem, R. M., and Galis, Z. S., 2001, "The role of matrix metalloproteinase-2 in the remodeling of cell-seeded vascular constructs subjected to cyclic strain," Annals of Biomedical Engineering, 29(11), pp. 923-934.
[17] Cummings, C. L., Gawlitta, D., Nerem, R. M., and Stegemann, J. P., 2004, "Properties of engineered vascular constructs made from collagen, fibrin, and collagen-fibrin mixtures," Biomaterials, 25(17), pp. 3699-3706.
[18] Clark, R. A. F., 1996, The molecular and cellular biology of wound repair, Plenum Press, New York.
[19] Neidert, M. R., Lee, E. S., Oegema, T. R., and Tranquillo, R. T., 2002, "Enhanced fibrin remodeling in vitro with TGF-beta1, insulin and plasmin for improved tissue-equivalents," Biomaterials, 23(17), pp. 3717-3731.
[20] Li, Y. S., Haga, J. H., and Chien, S., 2005, "Molecular basis of the effects of shear stress on vascular endothelial cells," J Biomech, 38(10), pp. 1949-1971.
[21] Schriefer, J. L., Warden, S. J., Saxon, L. K., Robling, A. G., and Turner, C. H., 2005, "Cellular accommodation and the response of bone to mechanical loading," J Biomech, 38(9), pp. 1838-1845.
[22] Turner, C. H., Robling, A. G., Duncan, R. L., and Burr, D. B., 2002, "Do bone cells behave like a neuronal network?," Calcif Tissue Int, 70(6), pp. 435-442.
[23] Chapman, G. B., Durante, W., Hellums, J. D., and Schafer, A. I., 2000, "Physiological cyclic stretch causes cell cycle arrest in cultured vascular smooth muscle cells," Am J Physiol Heart Circ Physiol, 278(3), pp. H748-754.
[24] Wilson, E., Sudhir, K., and Ives, H. E., 1995, "Mechanical strain of rat vascular smooth muscle cells is sensed by specific extracellular matrix/integrin interactions," J Clin Invest, 96(5), pp. 2364-2372.
[25] Nishimura, K., Blume, P., Ohgi, S., and Sumpio, B. E., 2007, "Effect of different frequencies of tensile strain on human dermal fibroblast proliferation and survival," Wound Repair Regen, 15(5), pp. 646-656.
[26] Hu, Y., Bock, G., Wick, G., and Xu, Q., 1998, "Activation of PDGF receptor alpha in vascular smooth muscle cells by mechanical stress," FASEB J, 12(12), pp. 1135-1142.
[27] Balestrini, J., Lopez, V., and Billiar, K., 2004, "Biaxial stretch-induced changes in fibrin gel failure properties," Biomedical Engineering Society Annual MeetingPhiladelphia, Pa.
[28] Robinson, P. S., Johnson, S. L., Evans, M. C., Barocas, V. H., and Tranquillo, R. T., 2006, "Functional Tissue-Engineered Valves from Cell-Remodeled Fibrin with Commissural Alignment of Cell-Produced Collagen." Tissue Eng, 12(12), pp. 3285-3303
121
Chapter 6: Conclusions and future work
[29] Crouch, E., 1990, "Pathobiology of pulmonary fibrosis," Am J Physiol, 259(4 Pt 1), pp. L159-184.
[30] Olman, M. A., Mackman, N., Gladson, C. L., Moser, K. M., and Loskutoff, D. J., 1995, "Changes in procoagulant and fibrinolytic gene expression during bleomycin-induced lung injury in the mouse," J Clin Invest, 96(3), pp. 1621-1630.
[31] Drew, A. F., Liu, H., Davidson, J. M., Daugherty, C. C., and Degen, J. L., 2001, "Wound-healing defects in mice lacking fibrinogen," Blood, 97(12), pp. 3691-3698.
[32] Tuan, T. L., Song, A., Chang, S., Younai, S., and Nimni, M. E., 1996, "In vitro fibroplasia: matrix contraction, cell growth, and collagen production of fibroblasts cultured in fibrin gels," Exp Cell Res, 223(1), pp. 127-134.
[33] Abercrombie, M., Flint, M.H., and James, D.W., 1956, "Wound Contraction in relation to collagen formation in scorbutic guinea pigs," J. Embryol. Exp. Morph, 4, pp. 167-175.
[34] Berry, C. C., Cacou, C., Lee, D. A., Bader, D. L., and Shelton, J. C., 2003, "Dermal fibroblasts respond to mechanical conditioning in a strain profile dependent manner," Biorheology, 40(1-3), pp. 337-345.
[35] Brown, R. A., Prajapati, R., McGrouther, D. A., Yannas, I. V., and Eastwood, M., 1998, "Tensional homeostasis in dermal fibroblasts: mechanical responses to mechanical loading in three-dimensional substrates," J Cell Physiol, 175(3), pp. 323-332.
[36] Clark, R. A., Nielsen, L. D., Welch, M. P., and McPherson, J. M., 1995, "Collagen matrices attenuate the collagen-synthetic response of cultured fibroblasts to TGF-beta," J Cell Sci, 108(Pt 3), pp. 1251-1261.
[37] Gailit, J., Clarke, C., Newman, D., Tonnesen, M. G., Mosesson, M. W., and Clark, R. A., 1997, "Human fibroblasts bind directly to fibrinogen at RGD sites through integrin alpha(v)beta3," Exp Cell Res, 232(1), pp. 118-126.
[38] Grouf, J. L., Throm, A. M., Balestrini, J. L., Bush, K. A., and Billiar, K. L., 2007, "Differential effects of EGF and TGF-beta1 on fibroblast activity in fibrin-based tissue equivalents," Tissue Eng, 13(4), pp. 799-807.
[39] Parsons, M., Kessler, E., Laurent, G. J., Brown, R. A., and Bishop, J. E., 1999, "Mechanical load enhances procollagen processing in dermal fibroblasts by regulating levels of procollagen C-proteinase," Exp Cell Res, 252(2), pp. 319-331.
[40] Merryman, W. D., Lukoff, H. D., Long, R. A., Engelmayr, G. C., Jr., Hopkins, R. A., and Sacks, M. S., 2007, "Synergistic effects of cyclic tension and transforming growth factor-beta1 on the aortic valve myofibroblast," Cardiovasc Pathol, 16(5), pp. 268-276.
[41] Mudera, V. C., Pleass, R., Eastwood, M., Tarnuzzer, R., Schultz, G., Khaw, P., McGrouther, D. A., and Brown, R. A., 2000, "Molecular responses of human dermal fibroblasts to dual cues: contact guidance and mechanical load," Cell Motil Cytoskeleton, 45(1), pp. 1-9.
[42] Lee, A. A., Delhaas, T., McCulloch, A. D., and Villarreal, F. J., 1999, "Differential responses of adult cardiac fibroblasts to in vitro biaxial strain patterns," J Mol Cell Cardiol, 31(10), pp. 1833-1843.
[43] Hashima, A. R., Young, A. A., McCulloch, A. D., and Waldman, L. K., 1993, "Nonhomogeneous analysis of epicardial strain distributions during acute myocardial ischemia in the dog," J Biomech, 26(1), pp. 19-35.
122
Chapter 6: Conclusions and future work
[44] Oomens, C. W., van Ratingen, M. R., Janssen, J. D., Kok, J. J., and Hendriks, M. A., 1993, "A numerical-experimental method for a mechanical characterization of biological materials," J Biomech, 26(4-5), pp. 617-621.
[45] Wang, J. H., Goldschmidt-Clermont, P., Moldovan, N., and Yin, F. C., 2000, "Leukotrienes and tyrosine phosphorylation mediate stretching-induced actin cytoskeletal remodeling in endothelial cells," Cell Motil Cytoskeleton, 46(2), pp. 137-145.
[46] Grassl, E. D., Oegema, T. R., and Tranquillo, R. T., 2002, "Fibrin as an alternative biopolymer to type-I collagen for the fabrication of a media equivalent," J Biomed Mater Res, 60(4), pp. 607-612.
[47] Freed, L. E., Guilak, F., Guo, X. E., Gray, M. L., Tranquillo, R., Holmes, J. W., Radisic, M., Sefton, M. V., Kaplan, D., and Vunjak-Novakovic, G., 2006, "Advanced tools for tissue engineering: scaffolds, bioreactors, and signaling," Tissue Eng, 12(12), pp. 3285-3305.
[48] Selman, M., Ruiz, V., Cabrera, S., Segura, L., Ramirez, R., Barrios, R., and Pardo, A., 2000, "TIMP-1, -2, -3, and -4 in idiopathic pulmonary fibrosis. A prevailing nondegradative lung microenvironment?," Am J Physiol Lung Cell Mol Physiol, 279(3), pp. L562-574.
[49] Tower, T. T., Neidert, M. R., and Tranquillo, R. T., 2002, "Fiber alignment imaging during mechanical testing of soft tissues," Ann Biomed Eng, 30(10), pp. 1221-1233.
[50] Broekelmann, T. J., Limper, A. H., Colby, T. V., and McDonald, J. A., 1991, "Transforming growth factor beta 1 is present at sites of extracellular matrix gene expression in human pulmonary fibrosis," Proc Natl Acad Sci U S A, 88(15), pp. 6642-6646.
[51] Kelly, M., Kolb, M., Bonniaud, P., and Gauldie, J., "Re-evaluation of fibrogenic cytokines in lung fibrosis," pp. 39-49.
[52] Archambault, J., Tsuzaki, M., Herzog, W., and Banes, A. J., 2002, "Stretch and interleukin-1beta induce matrix metalloproteinases in rabbit tendon cells in vitro," Journal of Orthopedic Research, 20(1), pp. 36-39.
[53] Zhang, H. Y., and Phan, S. H., 1999, "Inhibition of myofibroblast apoptosis by transforming growth factor beta(1)," Am J Respir Cell Mol Biol, 21(6), pp. 658-665.
[54] Edwards, D. R., Murphy, G., Reynolds, J. J., Whitham, S. E., Docherty, A. J., Angel, P., and Heath, J. K., 1987, "Transforming growth factor beta modulates the expression of collagenase and metalloproteinase inhibitor," EMBO J, 6(7), pp. 1899-1904.
[55] Swartz, M. A., Tschumperlin, D. J., Kamm, R. D., and Drazen, J. M., 2001, "Mechanical stress is communicated between different cell types to elicit matrix remodeling," Proc Natl Acad Sci U S A, 98(11), pp. 6180-6185.
[56] Selvaggi, G., Monstrey, S., Van Landuyt, K., Hamdi, M., and Blondeel, P., 2005, "Rehabilitation of burn injured patients following lightning and electrical trauma," NeuroRehabilitation, 20, pp. 35-42.
[57] Arnaout, M. A., Goodman, S. L., and Xiong, J. P., 2002, "Coming to grips with integrin binding to ligands," Curr Opin Cell Biol, 14(5), pp. 641-651.
123
Chapter 6: Conclusions and future work
[58] Ng, C. P., Hinz, B., and Swartz, M. A., 2005, "Interstitial fluid flow induces myofibroblast differentiation and collagen alignment in vitro," J Cell Sci, 118(Pt 20), pp. 4731-4739.
[59] Racine-Samson, L., Rockey, D. C., and Bissell, D. M., 1997, "The role of alpha1beta1 integrin in wound contraction. A quantitative analysis of liver myofibroblasts in vivo and in primary culture," J Biol Chem, 272(49), pp. 30911-30917.
[60] Chiquet, M., Renedo, A. S., Huber, F., and Fluck, M., 2003, "How do fibroblasts translate mechanical signals into changes in extracellular matrix production?," Matrix Biol, 22(1), pp. 73-80.
[61] Eckes, B., Zigrino, P., Kessler, D., Holtkotter, O., Shephard, P., Mauch, C., and Krieg, T., 2000, "Fibroblast-matrix interactions in wound healing and fibrosis," Matrix Biol, 19(4), pp. 325-332.
[62] Grinnell, F., and Ho, C. H., 2002, "Transforming growth factor beta stimulates fibroblast-collagen matrix contraction by different mechanisms in mechanically loaded and unloaded matrices," Exp Cell Res, 273(2), pp. 248-255.
[63] Grinnell, F., 2003, "Fibroblast biology in three-dimensional collagen matrices," Trends Cell Biol, 13(5), pp. 264-269.
[64] Butt, R. P., and Bishop, J. E., 1997, "Mechanical load enhances the stimulatory effect of serum growth factors on cardiac fibroblast procollagen synthesis," J Mol Cell Cardiol, 29(4), pp. 1141-1151.
[65] Dhainaut, J. F., Charpentier, J., and Chiche, J. D., 2003, "Transforming growth factor-beta: a mediator of cell regulation in acute respiratory distress syndrome," Crit Care Med, 31(4 Suppl), pp. S258-264.
[66] Desmouliere, A., Geinoz, A., Gabbiani, F., and Gabbiani, G., 1993, "Transforming growth factor-beta 1 induces alpha-smooth muscle actin expression in granulation tissue myofibroblasts and in quiescent and growing cultured fibroblasts," J Cell Biol, 122(1), pp. 103-111.
[67] Arora, P. D., Narani, N., and McCulloch, C. A., 1999, "The compliance of collagen gels regulates transforming growth factor-beta induction of alpha-smooth muscle actin in fibroblasts," Am J Pathol, 154(3), pp. 871-882.
[68] Thannickal, V. J., Lee, D. Y., White, E. S., Cui, Z., Larios, J. M., Chacon, R., Horowitz, J. C., Day, R. M., and Thomas, P. E., 2003, "Myofibroblast differentiation by transforming growth factor-beta1 is dependent on cell adhesion and integrin signaling via focal adhesion kinase," J Biol Chem, 278(14), pp. 12384-12389.
[69] Zhang, H. Y., Gharaee-Kermani, M., Zhang, K., Karmiol, S., and Phan, S. H., 1996, "Lung fibroblast alpha-smooth muscle actin expression and contractile phenotype in bleomycin-induced pulmonary fibrosis," Am J Pathol, 148(2), pp. 527-537.
[70] Desmouliere, A., 1995, "Factors influencing myofibroblast differentiation during wound healing and fibrosis," Cell Biol Int, 19(5), pp. 471-476.
[71] Desmouliere, A., and Gabbiani, G., 1996, "The role of the myofibroblast in wound healing and fibrocontractive diseases," The molecular and cellular biology of wound repair, R. A. F. Clark, ed., Plenum Press, New York, pp. 391-423.
[72] Khalil, N., O'Connor, R., Unruh, H., Warren, P., Kemp, A., and Greenberg, A., 1991, "Enhanced expression and immunohistochemical distribution of transforming
124

Chapter 6: Conclusions and future work
growth factor-beta in idiopathic pulmonary fibrosis," Chest, 99(3 Suppl), pp. 65S-66S.
[73] Ignotz, R. A., and Massague, J., 1986, "Transforming growth factor-beta stimulates the expression of fibronectin and collagen and their incorporation into the extracellular matrix," J Biol Chem, 261(9), pp. 4337-4345.
[74] Border, W. A., and Ruoslahti, E., 1992, "Transforming growth factor-beta in disease: the dark side of tissue repair," J Clin Invest, 90(1), pp. 1-7.
125
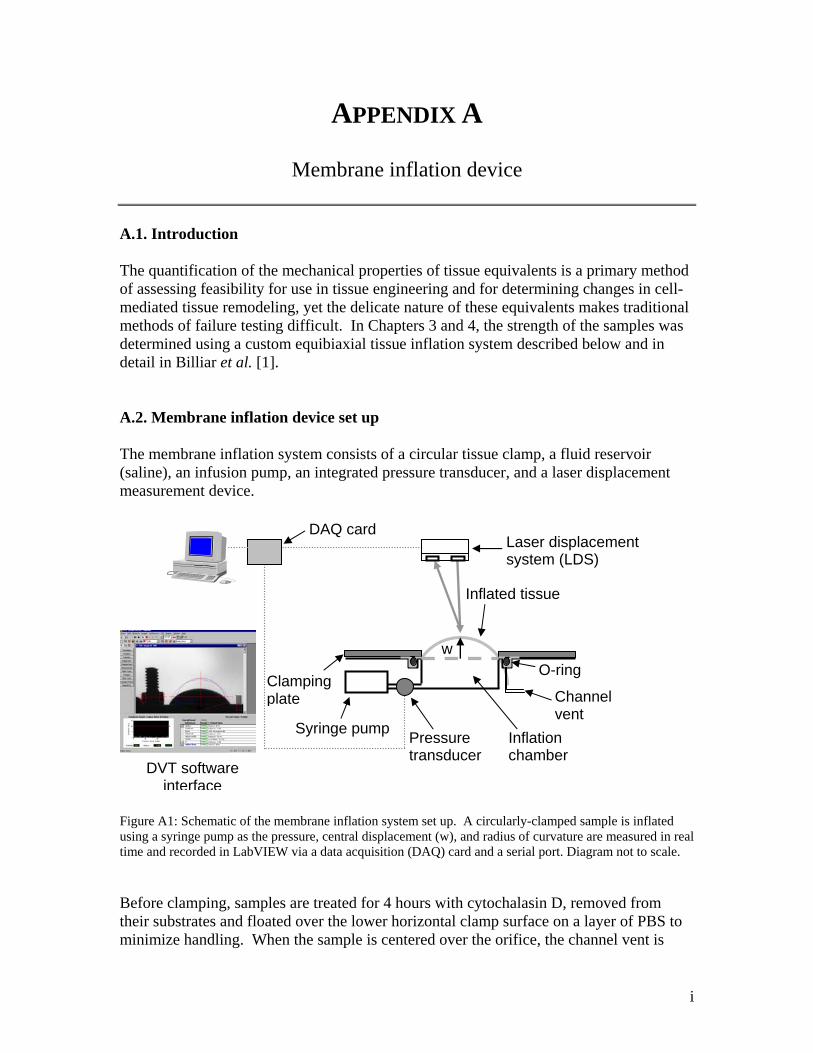
APPENDIX A
Membrane inflation device A.1. Introduction The quantification of the mechanical properties of tissue equivalents is a primary method of assessing feasibility for use in tissue engineering and for determining changes in cell-mediated tissue remodeling, yet the delicate nature of these equivalents makes traditional methods of failure testing difficult. In Chapters 3 and 4, the strength of the samples was determined using a custom equibiaxial tissue inflation system described below and in detail in Billiar et al. [1]. A.2. Membrane inflation device set up The membrane inflation system consists of a circular tissue clamp, a fluid reservoir (saline), an infusion pump, an integrated pressure transducer, and a laser displacement measurement device.
DVT software interface
Laser displacement system (LDS)
Clamping plate
Pressure transducer
Syringe pump
Inflated tissue
O-ring
Channel vent
Inflation chamber
w
DAQ card
Figure A1: Schematic of the membrane inflation system set up. A circularly-clamped sample is inflated using a syringe pump as the pressure, central displacement (w), and radius of curvature are measured in real time and recorded in LabVIEW via a data acquisition (DAQ) card and a serial port. Diagram not to scale.
Before clamping, samples are treated for 4 hours with cytochalasin D, removed from their substrates and floated over the lower horizontal clamp surface on a layer of PBS to minimize handling. When the sample is centered over the orifice, the channel vent is
i
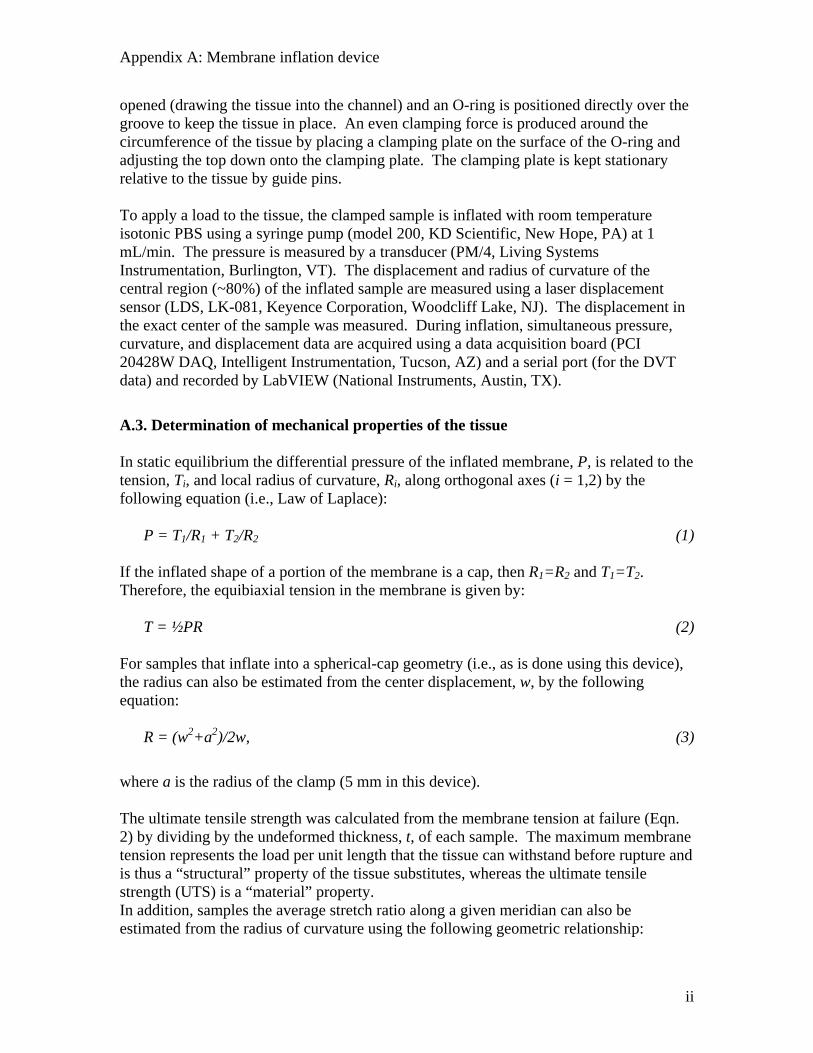
Appendix A: Membrane inflation device
opened (drawing the tissue into the channel) and an O-ring is positioned directly over the groove to keep the tissue in place. An even clamping force is produced around the circumference of the tissue by placing a clamping plate on the surface of the O-ring and adjusting the top down onto the clamping plate. The clamping plate is kept stationary relative to the tissue by guide pins. To apply a load to the tissue, the clamped sample is inflated with room temperature isotonic PBS using a syringe pump (model 200, KD Scientific, New Hope, PA) at 1 mL/min. The pressure is measured by a transducer (PM/4, Living Systems Instrumentation, Burlington, VT). The displacement and radius of curvature of the central region (~80%) of the inflated sample are measured using a laser displacement sensor (LDS, LK-081, Keyence Corporation, Woodcliff Lake, NJ). The displacement in the exact center of the sample was measured. During inflation, simultaneous pressure, curvature, and displacement data are acquired using a data acquisition board (PCI 20428W DAQ, Intelligent Instrumentation, Tucson, AZ) and a serial port (for the DVT data) and recorded by LabVIEW (National Instruments, Austin, TX).
A.3. Determination of mechanical properties of the tissue In static equilibrium the differential pressure of the inflated membrane, P, is related to the tension, Ti, and local radius of curvature, Ri, along orthogonal axes (i = 1,2) by the following equation (i.e., Law of Laplace):
P = T1/R1 + T2/R2 (1)
If the inflated shape of a portion of the membrane is a cap, then R1=R2 and T1=T2. Therefore, the equibiaxial tension in the membrane is given by:
T = ½PR (2)
For samples that inflate into a spherical-cap geometry (i.e., as is done using this device), the radius can also be estimated from the center displacement, w, by the following equation:
R = (w2+a2)/2w, (3)
where a is the radius of the clamp (5 mm in this device). The ultimate tensile strength was calculated from the membrane tension at failure (Eqn. 2) by dividing by the undeformed thickness, t, of each sample. The maximum membrane tension represents the load per unit length that the tissue can withstand before rupture and is thus a “structural” property of the tissue substitutes, whereas the ultimate tensile strength (UTS) is a “material” property. In addition, samples the average stretch ratio along a given meridian can also be estimated from the radius of curvature using the following geometric relationship:
ii

Appendix A: Membrane inflation device
aRaR ⎟⎠⎞
⎜⎝⎛
=arcsinπ
λ . (4)
The extensibility, E, is defined as Green’s tensile strain at failure:
( 121 2 −= failureE λ ). (5)
A.4. Labview interface Labview was used control the membrane inflation device. The program was designed in two parts: calibration of the device and data acquisition (thickness and burst pressure data). This program allows the user to manually manipulate flow rate of saline and the sampling rate of data acquisition. These experimental parameters enable measurements of the pressure (using the pressure transducer) and height (using the laser displacement system) of the sample at burst. A.5. References Billiar, K. L., A. M. Throm, et al. (2005). "Biaxial failure properties of planar living
tissue equivalents." Journal of Biomedical Materials Research A 73A(2): 182-91.
iii

APPENDIX B
Validation of equibiaxial strain in Flexcell system and assessment of strain and in-plane tissue alignment
B.1. Introduction As discussed in Chapter 3, in order to demonstrate that the strain distribution of our Flexcell system was equibiaxial, the two-dimensional distribution of strain in the center of stretched samples was validated by image analysis (HDM) [1]. To demonstrate that there was minimal fiber alignment in our tissue samples resulting from applying this equibiaxial stretch, polarize light microscopy was performed on 9 day old cyclically conditioned fibroblast-populated fibrin gels. B.2. Measurement of strain distribution across the fibrin gel Fibroblast-populated fibrin gels were cast into Flexcell plates cyclically stretched for 8 days at 16% equibiaxial strain at a frequency of 0.2 Hz. After 8 days, the culture media was removed, and the surface of each fibrin gels was texturized by dispersing black sand (as discussed in Chapter 3). The fibrin gels were then sequentially stretched using vacuum pressure levels that corresponded to 0, 5, and 10% equibiaxial (engineering) strain according to the manufacturer’s instructions. The resulting strain distribution was equibiaxial in the circumferential and radial directions (10 ± 1%). Figure B1 depicts fibrin gels prepared for testing, and the resulting strain in the radial direction.
iv
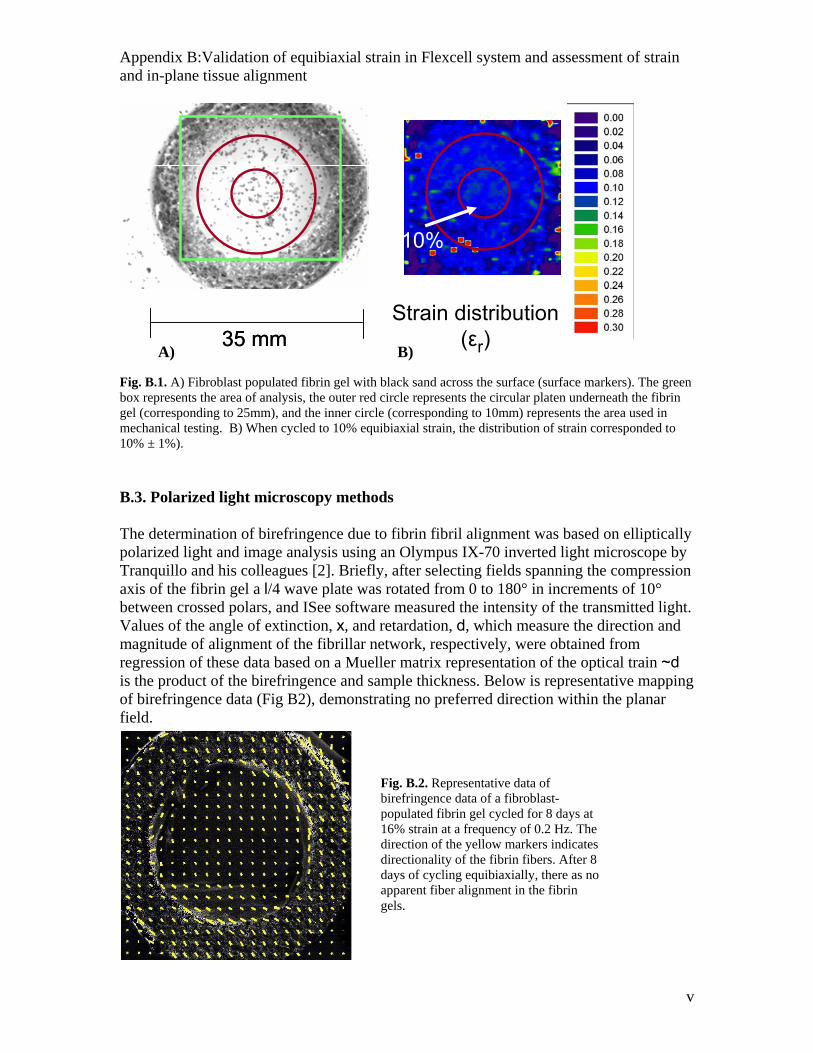
Appendix B:Validation of equibiaxial strain in Flexcell system and assessment of strain and in-plane tissue alignment
35 mm35 mmStrain distribution
(εr)
10%
A) B) Fig. B.1. A) Fibroblast populated fibrin gel with black sand across the surface (surface markers). The green box represents the area of analysis, the outer red circle represents the circular platen underneath the fibrin gel (corresponding to 25mm), and the inner circle (corresponding to 10mm) represents the area used in mechanical testing. B) When cycled to 10% equibiaxial strain, the distribution of strain corresponded to 10% ± 1%). B.3. Polarized light microscopy methods The determination of birefringence due to fibrin fibril alignment was based on elliptically polarized light and image analysis using an Olympus IX-70 inverted light microscope by Tranquillo and his colleagues [2]. Briefly, after selecting fields spanning the compression axis of the fibrin gel a l/4 wave plate was rotated from 0 to 180° in increments of 10° between crossed polars, and ISee software measured the intensity of the transmitted light. Values of the angle of extinction, x, and retardation, d, which measure the direction and magnitude of alignment of the fibrillar network, respectively, were obtained from regression of these data based on a Mueller matrix representation of the optical train ~d is the product of the birefringence and sample thickness. Below is representative mapping of birefringence data (Fig B2), demonstrating no preferred direction within the planar field.
Fig. B.2. Representative data of birefringence data of a fibroblast-populated fibrin gel cycled for 8 days at 16% strain at a frequency of 0.2 Hz. The direction of the yellow markers indicates directionality of the fibrin fibers. After 8 days of cycling equibiaxially, there as no apparent fiber alignment in the fibrin gels.
v
Appendix B:Validation of equibiaxial strain in Flexcell system and assessment of strain and in-plane tissue alignment B.4. References [1] Kelly, D. J., Azeloglu, E. U., Kochupura, P. V., Sharma, G. S., and Gaudette, G. R., 2007, "Accuracy and reproducibility of a subpixel extended phase correlation method to determine micron level displacements in the heart," Med Eng Phys, 29(1), pp. 154-162. [2] Tower, T. T., and Tranquillo, R. T., 2001, "Alignment maps of tissues: I. Microscopic elliptical polarimetry," Biophys J, 81(5), pp. 2954-2963.
vi

APPENDIX C
Assessment of ring inserts C.1. Introduction As discussed briefly in Ch 5, to assess the feasibility of using Delrin ring inserts to control the strain magnitude of individual wells within our Flexcell system, the resulting strain magnitude of wells as a function of inserts thickness was assessed. In the following section, we investigated the impact of increasing applied pressure on wells with ring inserts to alter the ultimate strain magnitude of strain across the wells. C.2. Determination of strain magnitude as a function of ring insert thickness First, delrin rings with thicknesses of 6 and 7.5mm (the range found to be effective in manipulating strain magnitude in this system) were placed on the perimeter of the loading posts, and silicone lubrication was placed across both the loading post and ring inserts. Unaltered 6-well Bioflex plates were placed onto the baseplate and markers composed of 4 ink dots placed across the membrane (Figure C.1).
Ring insert Circular Platen
Fig. C.1. Photo of a 6mm ring insert surrounding the edge of the circular platen with makers.
After the Indian ink was allowed to dry, vacuum pressures corresponding to ‘10%’ and ‘20%’ (52 and 89kPa) were applied strain to an unmodified system, and images were taken using a digital SLR camera (6 megapixel, Cannon EOS). The displacement of the markers was then measured using Image J (version 1.38, NIH), and the displacements were converted to principle strains.
vii
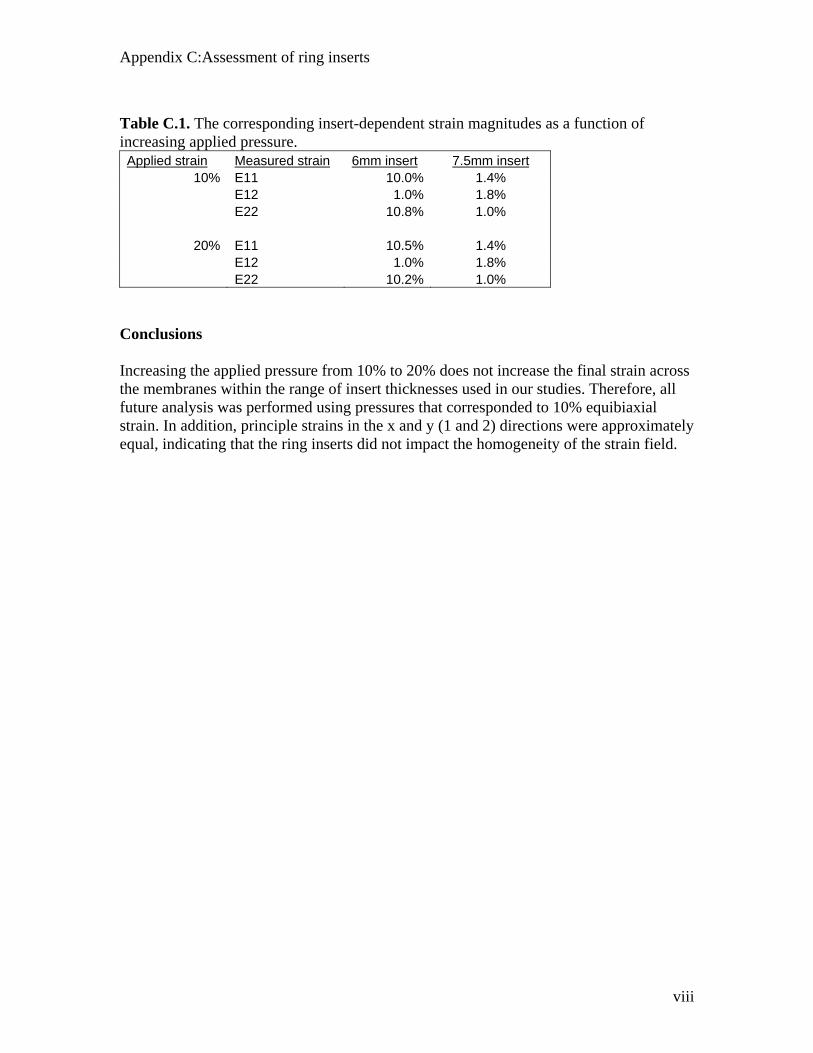
Appendix C:Assessment of ring inserts
Table C.1. The corresponding insert-dependent strain magnitudes as a function of increasing applied pressure.
Applied strain Measured strain 6mm insert 7.5mm insert 10% E11 10.0% 1.4%
E12 1.0% 1.8% E22 10.8% 1.0%
20% E11 10.5% 1.4% E12 1.0% 1.8% E22 10.2% 1.0%
Conclusions Increasing the applied pressure from 10% to 20% does not increase the final strain across the membranes within the range of insert thicknesses used in our studies. Therefore, all future analysis was performed using pressures that corresponded to 10% equibiaxial strain. In addition, principle strains in the x and y (1 and 2) directions were approximately equal, indicating that the ring inserts did not impact the homogeneity of the strain field.
viii
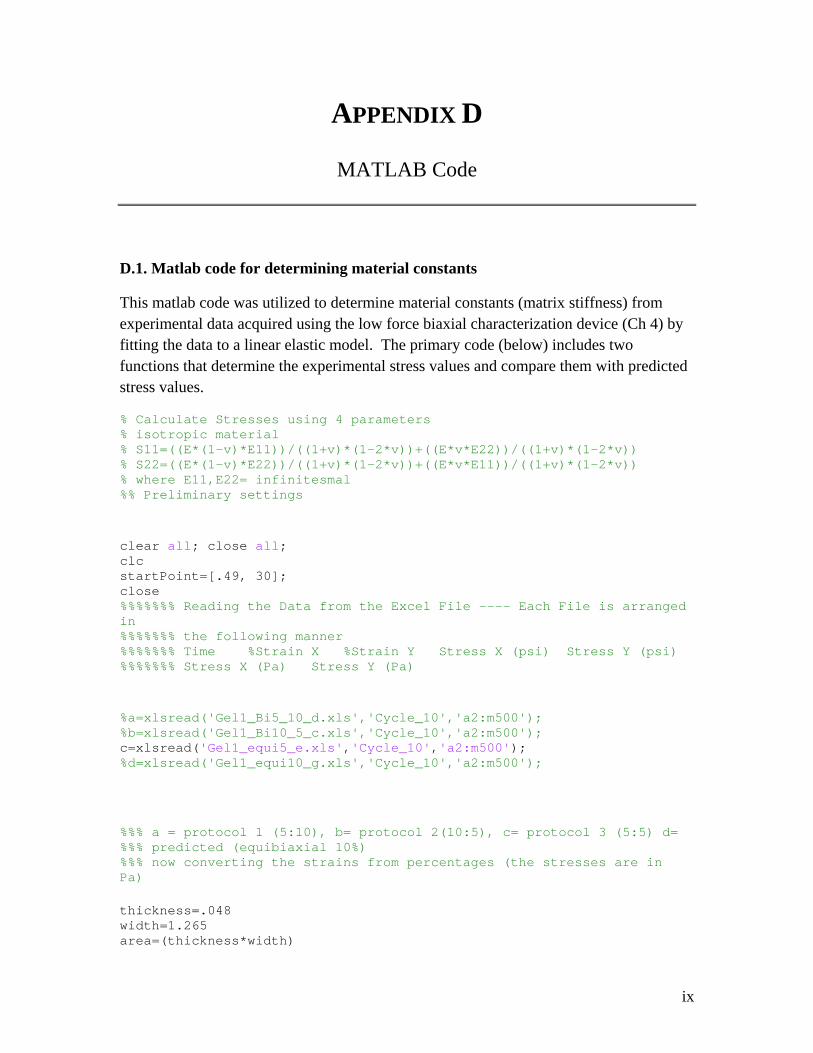
APPENDIX D
MATLAB Code
D.1. Matlab code for determining material constants
This matlab code was utilized to determine material constants (matrix stiffness) from experimental data acquired using the low force biaxial characterization device (Ch 4) by fitting the data to a linear elastic model. The primary code (below) includes two functions that determine the experimental stress values and compare them with predicted stress values.
% Calculate Stresses using 4 parameters % isotropic material % S11=((E*(1-v)*E11))/((1+v)*(1-2*v))+((E*v*E22))/((1+v)*(1-2*v)) % S22=((E*(1-v)*E22))/((1+v)*(1-2*v))+((E*v*E11))/((1+v)*(1-2*v)) % where E11,E22= infinitesmal %% Preliminary settings clear all; close all; clc startPoint=[.49, 30]; close %%%%%%% Reading the Data from the Excel File ---- Each File is arranged in %%%%%%% the following manner %%%%%%% Time %Strain X %Strain Y Stress X (psi) Stress Y (psi) %%%%%%% Stress X (Pa) Stress Y (Pa) %a=xlsread('Gel1_Bi5_10_d.xls','Cycle_10','a2:m500'); %b=xlsread('Gel1_Bi10_5_c.xls','Cycle_10','a2:m500'); c=xlsread('Gel1_equi5_e.xls','Cycle_10','a2:m500'); %d=xlsread('Gel1_equi10_g.xls','Cycle_10','a2:m500'); %%% a = protocol 1 (5:10), b= protocol 2(10:5), c= protocol 3 (5:5) d= %%% predicted (equibiaxial 10%) %%% now converting the strains from percentages (the stresses are in Pa) thickness=.048 width=1.265 area=(thickness*width)
ix

Appendix D: Matlab Code
ratio=[5 10; 10 5; 5 5; 10 10]; ex3=c(:,2)'/100; ey3=c(:,3)'/100; ox3=c(:,4)'*6.894; oy3=c(:,5)'*6.894; p= polyfit(ex3, ox3, 1); ox3=ox3-p(2); p= polyfit(ey3, oy3, 1); oy3=oy3-p(2); lambdax3=ex3+1; lambday3=ey3+1; forcex3=ox3*area; forcey3=oy3*area; %%%%%%% Creating one variable by combining the same parameter from %%%%%%% different Protocols %%%%%%% For e.g. ex = sum of the strains in the X axis from all protocols global S11 S22 E11 E22 S11=[ox3]; S22=[ox3]; E11=[ex3]; E22=[ex3]; %% Estimate the material constant by minimizing the sse % sse= sum of squared errors model = @sseStressequi; [estimate, sse, flag, output] = fminsearch(model, startPoint); [sse, S11_Fit, S22_Fit] = model(estimates);%evaluate the function [m,n]=size(S11); noDataPoints=m*n; rmsError=sqrt(sse)/noDataPoints; % a global measure of the fit goodness errorS11=S11_Fit-S11; % residuals errorS22=S22_Fit-S22; % residuals sst=S11-mean(S11); Es=estimates(1); stS11=S11-mean(S11); stS22=S22-mean(S22); sstS11=stS11.^2; sstS22=stS11.^2; sst=sstS11+sstS22; srerrorS11=sum(sum(S11_Fit-mean(S11)).^2); srerrorS22=sum(sum(S22_Fit-mean(S22)).^2); srerror=srerrorS11+srerrorS22;
x
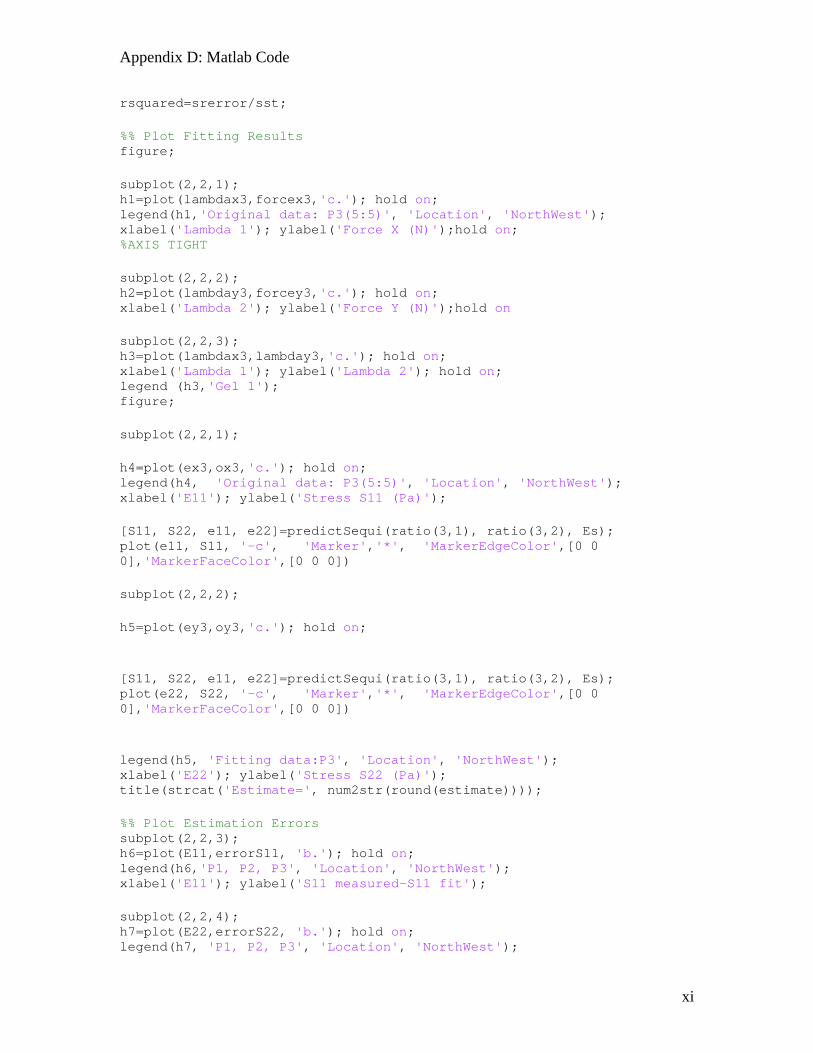
Appendix D: Matlab Code
rsquared=srerror/sst; %% Plot Fitting Results figure; subplot(2,2,1); h1=plot(lambdax3,forcex3,'c.'); hold on; legend(h1,'Original data: P3(5:5)', 'Location', 'NorthWest'); xlabel('Lambda 1'); ylabel('Force X (N)');hold on; %AXIS TIGHT subplot(2,2,2); h2=plot(lambday3,forcey3,'c.'); hold on; xlabel('Lambda 2'); ylabel('Force Y (N)');hold on subplot(2,2,3); h3=plot(lambdax3,lambday3,'c.'); hold on; xlabel('Lambda 1'); ylabel('Lambda 2'); hold on; legend (h3,'Gel 1'); figure; subplot(2,2,1); h4=plot(ex3,ox3,'c.'); hold on; legend(h4, 'Original data: P3(5:5)', 'Location', 'NorthWest'); xlabel('E11'); ylabel('Stress S11 (Pa)'); [S11, S22, e11, e22]=predictSequi(ratio(3,1), ratio(3,2), Es); plot(e11, S11, '-c', 'Marker','*', 'MarkerEdgeColor',[0 0 0],'MarkerFaceColor',[0 0 0]) subplot(2,2,2); h5=plot(ey3,oy3,'c.'); hold on; [S11, S22, e11, e22]=predictSequi(ratio(3,1), ratio(3,2), Es); plot(e22, S22, '-c', 'Marker','*', 'MarkerEdgeColor',[0 0 0],'MarkerFaceColor',[0 0 0]) legend(h5, 'Fitting data:P3', 'Location', 'NorthWest'); xlabel('E22'); ylabel('Stress S22 (Pa)'); title(strcat('Estimate=', num2str(round(estimate)))); %% Plot Estimation Errors subplot(2,2,3); h6=plot(E11,errorS11, 'b.'); hold on; legend(h6,'P1, P2, P3', 'Location', 'NorthWest'); xlabel('E11'); ylabel('S11 measured-S11 fit'); subplot(2,2,4); h7=plot(E22,errorS22, 'b.'); hold on; legend(h7, 'P1, P2, P3', 'Location', 'NorthWest');
xi
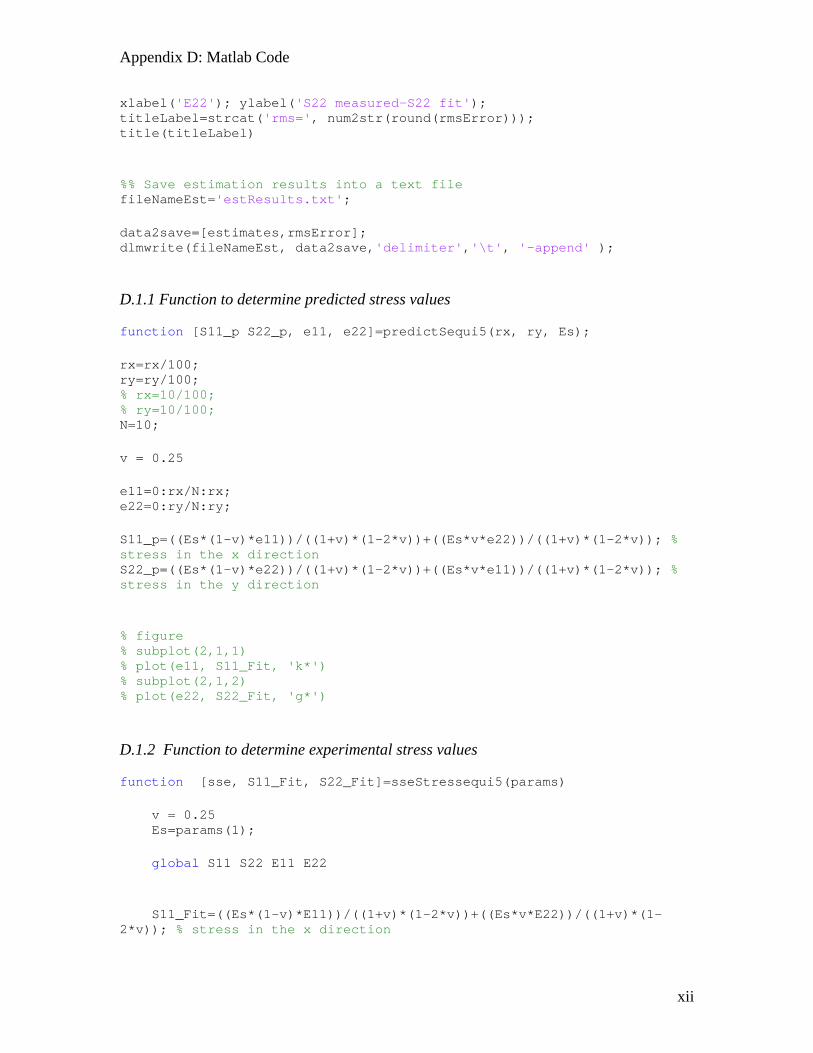
Appendix D: Matlab Code
xlabel('E22'); ylabel('S22 measured-S22 fit'); titleLabel=strcat rms=', num2str(round(rmsError))); ('title(titleLabel) %% Save estimation results into a text file fileNameEst='estResults.txt'; data2save=[estimates,rmsError]; dlmwrite(fileNameEst, data2save,'delimiter','\t', '-append' );
D.1.1 Function to determine predicted stress values
function [S11_p S22_p, e11, e22]=predictSequi5(rx, ry, Es); rx=rx/100; ry=ry/100; % rx=10/100; % ry=10/100; N=10; v = 0.25 e11=0:rx/N:rx; e22=0:ry/N:ry; S11_p=((Es*(1-v)*e11))/((1+v)*(1-2*v))+((Es*v*e22))/((1+v)*(1-2*v)); % stress in the x direction S22_p=((Es*(1-v)*e22))/((1+v)*(1-2*v))+((Es*v*e11))/((1+v)*(1-2*v)); % stress in the y direction % figure % subplot(2,1,1) % plot(e11, S11_Fit, 'k*') % subplot(2,1,2) % plot(e22, S22_Fit, 'g*') D.1.2 Function to determine experimental stress values
function [sse, S11_Fit, S22_Fit]=sseStressequi5(params) v = 0.25 Es=params(1); global S11 S22 E11 E22 S11_Fit=((Es*(1-v)*E11))/((1+v)*(1-2*v))+((Es*v*E22))/((1+v)*(1-2*v)); % stress in the x direction
xii
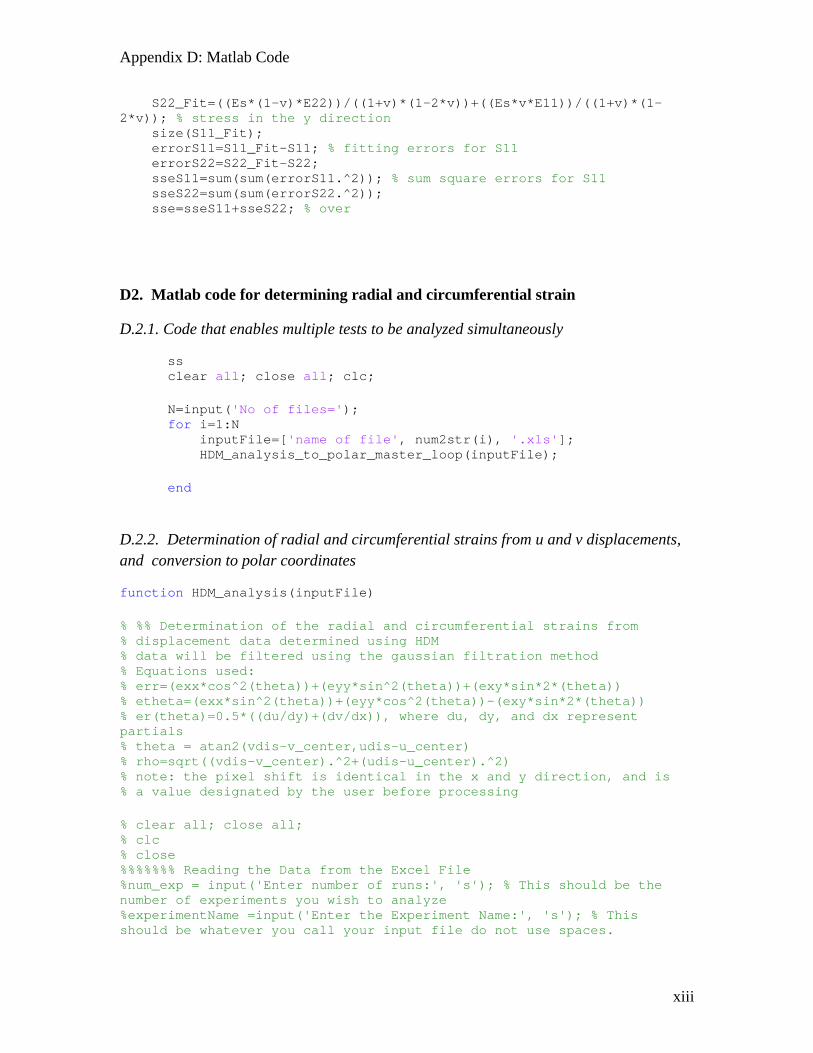
Appendix D: Matlab Code
S22_Fit=((Es*(1-v)*E22))/((1+v)*(1-2*v))+((Es*v*E11))/((1+v)*(1-2*v)); % stress in the y direction size(S11_Fit); errorS11=S11_Fit-S11; % fitting errors for S11 errorS22=S22_Fit-S22; sseS11=sum(sum(errorS11.^2)); % sum square errors for S11 sseS22=sum(sum(errorS22.^2)); sse=sseS11+sseS22; % over
D2. Matlab code for determining radial and circumferential strain
D.2.1. Code that enables multiple tests to be analyzed simultaneously
ss clear all; close all; clc; N=input('No of files='); for i=1:N inputFile=['name of file', num2str(i), '.xls']; HDM_analysis_to_polar_master_loop(inputFile); end
D.2.2. Determination of radial and circumferential strains from u and v displacements, and conversion to polar coordinates
function HDM_analysis(inputFile) % %% Determination of the radial and circumferential strains from % displacement data determined using HDM % data will be filtered using the gaussian filtration method % Equations used: % err=(exx*cos^2(theta))+(eyy*sin^2(theta))+(exy*sin*2*(theta)) % etheta=(exx*sin^2(theta))+(eyy*cos^2(theta))-(exy*sin*2*(theta)) % er(theta)=0.5*((du/dy)+(dv/dx)), where du, dy, and dx represent partials % theta = atan2(vdis-v_center,udis-u_center) % rho=sqrt((vdis-v_center).^2+(udis-u_center).^2) % note: the pixel shift is identical in the x and y direction, and is % a value designated by the user before processing % clear all; close all; % clc % close %%%%%%% Reading the Data from the Excel File %num_exp = input('Enter number of runs:', 's'); % This should be the number of experiments you wish to analyze %experimentName =input('Enter the Experiment Name:', 's'); % This should be whatever you call your input file do not use spaces.
xiii
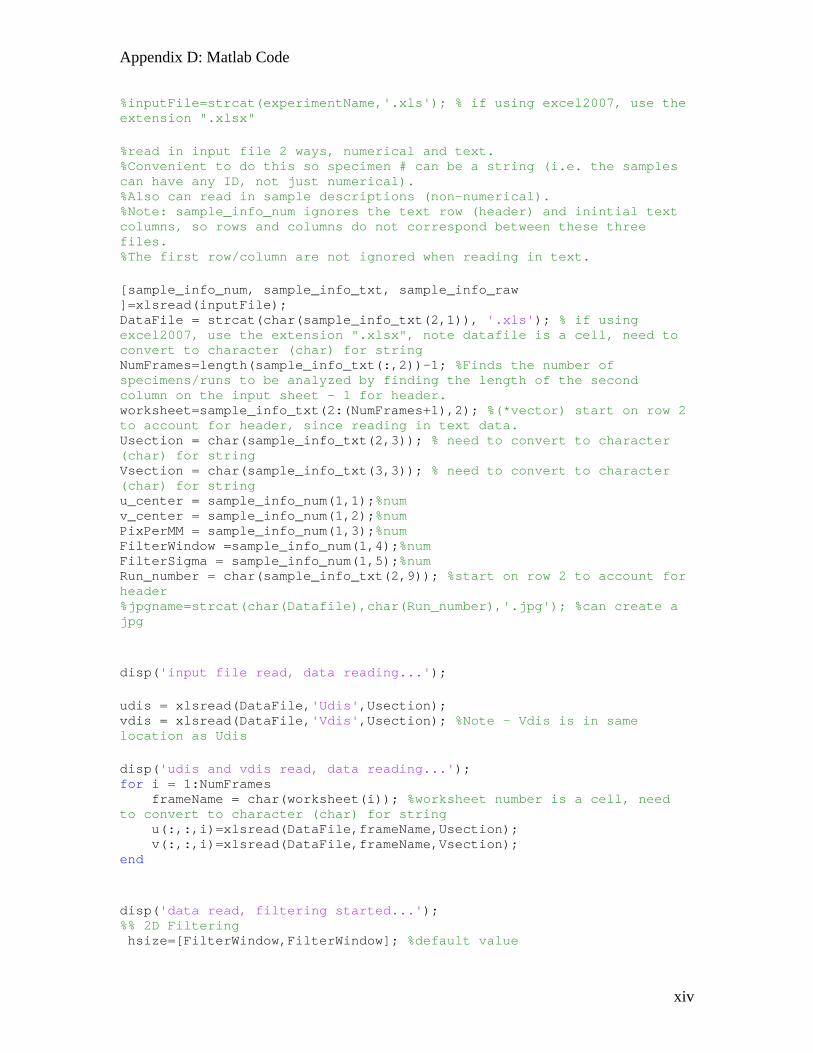
Appendix D: Matlab Code
%inputFile=strcat(experimentName,'.xls'); % if using excel2007, use the extension ".xlsx" %read in input file 2 ways, numerical and text. %Convenient to do this so specimen # can be a string (i.e. the samples can have any ID, not just numerical). %Also can read in sample descriptions (non-numerical). %Note: sample_info_num ignores the text row (header) and inintial text columns, so rows and columns do not correspond between these three files. %The first row/column are not ignored when reading in text. [sample_info_num, sample_info_txt, sample_info_raw ]=xlsread(inputFile); DataFile = strcat(char(sample_info_txt(2,1)), '.xls'); % if using excel2007, use the extension ".xlsx", note datafile is a cell, need to convert to character (char) for string NumFrames=length(sample_info_txt(:,2))-1; %Finds the number of specimens/runs to be analyzed by finding the length of the second column on the input sheet - 1 for header. worksheet=sample_info_txt(2:(NumFrames+1),2); %(*vector) start on row 2 to account for header, since reading in text data. Usection = char(sample_info_txt(2,3)); % need to convert to character (char) for string Vsection = char(sample_info_txt(3,3)); % need to convert to character (char) for string u_center = sample_info_num(1,1);%num v_center = sample_info_num(1,2);%num PixPerMM = sample_info_num(1,3);%num FilterWindow =sample_info_num(1,4);%num FilterSigma = sample_info_num(1,5);%num Run_number = char(sample_info_txt(2,9)); %start on row 2 to account for header %jpgname=strcat(char(Datafile),char(Run_number),'.jpg'); %can create a jpg disp('input file read, data reading...'); udis = xlsread(DataFile,'Udis',Usection); vdis = xlsread(DataFile,'Vdis',Usection); %Note - Vdis is in same location as Udis disp('udis and vdis read, data reading...'); for i = 1:NumFrames frameName = char(worksheet(i)); %worksheet number is a cell, need to convert to character (char) for string u(:,:,i)=xlsread(DataFile,frameName,Usection); v(:,:,i)=xlsread(DataFile,frameName,Vsection); end disp('data read, filtering started...'); %% 2D Filtering hsize=[FilterWindow,FilterWindow]; %default value
xiv

Appendix D: Matlab Code
sigma = FilterSigma; %default value h = fspecial('gaussian', hsize, sigma); clear utotal vtotal [NumRows NumColumns NumFrames]= size (u); utotal=zeros(NumRows, NumColumns); %creating an empty matrix vtotal=zeros(NumRows, NumColumns); %creating an empty matrix for i = 1:NumFrames; u(:,:,i) = filter2(h,u(:,:,i)); v(:,:,i) = filter2(h,v(:,:,i)); utotal = utotal + u(:,:,i); vtotal = vtotal + v(:,:,i); end %% The average slope disp('filtered, calculating strain and transforming...'); exx = xSlopeFinder(udis,utotal); eyy = ySlopeFinder(vdis,vtotal); dxy = ySlopeFinder(vdis,utotal); dyx = xSlopeFinder(udis,vtotal); exy = 0.5*(dxy+dxy); %% Cylindrical to Polar % find angle and radius theta = atan2(vdis-v_center,udis-u_center); rho=sqrt((vdis-v_center).^2+(udis-u_center).^2); thetaV=reshape(theta, size(theta,1)*size(theta,2),1); rhoR=reshape(rho, size(theta,1)*size(theta,2),1); [rhoSort, rhoIndex]=sort(rhoR); for i = 1 : NumRows for j = 1 : NumColumns err(i,j)=(exx(i,j)*(cos(theta(i,j))*cos(theta(i,j))))+(eyy(i,j)*(sin(theta(i,j))*sin(theta(i,j))))+(exy(i,j)*(sin(2*theta(i,j)))); etheta(i,j)=(exx(i,j)*sin(theta(i,j))*sin(theta(i,j)))+(eyy(i,j)*(cos(theta(i,j))*cos(theta(i,j))))-(exy(i,j)*(sin(2*theta(i,j)))); end end clear rhoBins binflag errBin errBinAvg errBinSD ettBin ettBinAvg ettBinSD numInBin sizeBin=16; %% the step size is 16 (pixel shift), so the bining was based on this m1=1;
xv

Appendix D: Matlab Code
i=1; numBins = floor(max(rho(:)))/sizeBin; %to include all radius values, note this may lose the last few points for bin=1:numBins rhoBins(bin,1)=bin*sizeBin-sizeBin/2; numInBin(bin)=0; binflag(bin)=0; while rhoSort(i)< sizeBin*bin i=i+1; binflag(bin)=1; numInBin(bin)=numInBin(bin)+1; end %while if binflag(bin)==1 m2=i-1; %subtract 1 since i was incremented in while loop errBin=err(rhoIndex(m1:m2)); errBinAvg(bin,1)=mean(errBin); errBinSD(bin,1)=std(errBin); ettBin=etheta(rhoIndex(m1:m2)); ettBinAvg(bin,1)=mean(ettBin); ettBinSD(bin,1)=std(ettBin); m1= i; elseif bin==1 % to avoid the 0 index errBinAvg(1)=0; errBinSD(1)=0; ettBinAvg(1)=0; ettBinSD(1)=0; else errBinAvg(bin)=errBinAvg(bin-1); errBinSD(bin)=0; end % if binflag = 1 end % bin for loop radius = (rhoBins/PixPerMM); % radiust=radius'; % errBinAvgt=errBinAvg'; % ettBinAvgt=errBinAvg'; r_max = 10; errBinMax=max(errBinAvg(:)); ettBinMax=max(ettBinAvg(:)); disp('Rendering plots'); %% Plot the results xmin = 0; xmax = r_max; ymin= -0.1; ymax = 0.2; figname=strcat('results_',char(sample_info_txt(2,1)),Run_number) titlename1= strcat('experiment name: ',char(sample_info_txt(2,1)),'_',Run_number); titlename2= strcat('errBinmax: ',errBinMax,' ethetaBinmax:',ettBinMax); m =figure; subplot(2,2,1);char
xvi
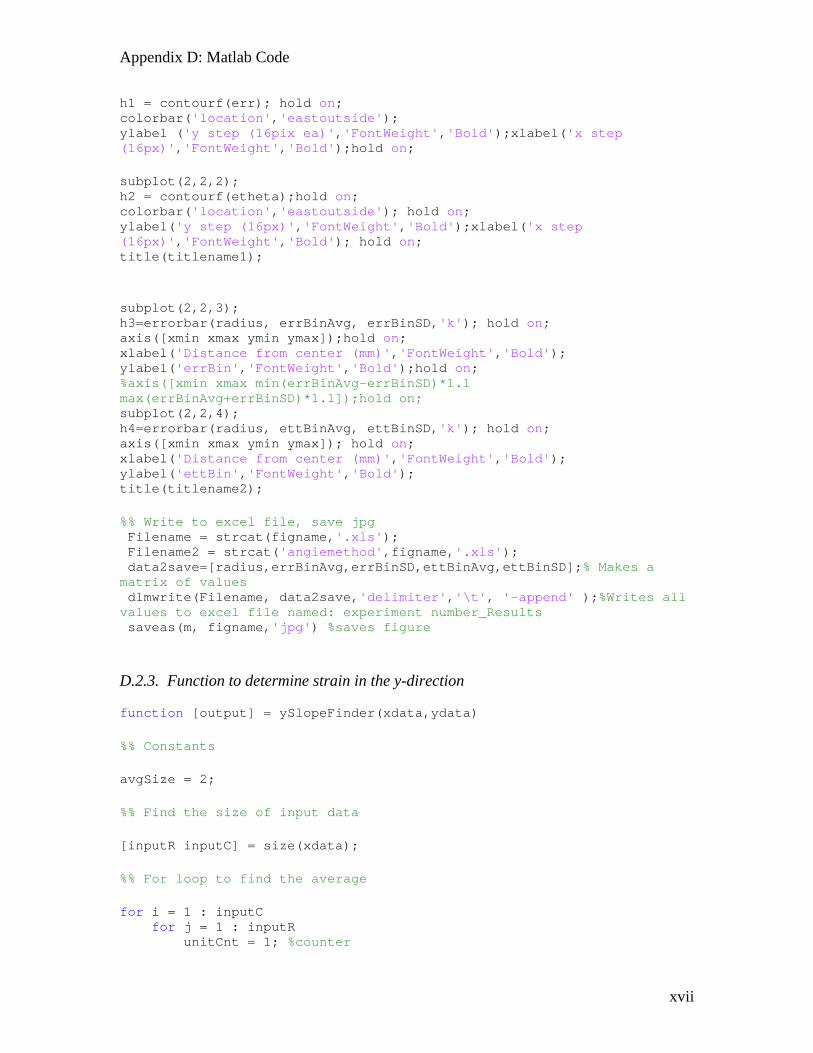
Appendix D: Matlab Code
h1 = contourf(err); hold on; colorbar('location','eastoutside'); ylabel ('y step (16pix ea)','FontWeight','Bold');xlabel('x step (16px)','FontWeight','Bold');hold on; subplot(2,2,2); h2 = contourf(etheta);hold on; colorbar('location','eastoutside'); hold on; ylabel('y step (16px)','FontWeight','Bold');xlabel('x step (16px)','FontWeight 'Bold'); hold on; ',title(titlename1); subplot(2,2,3); h3=errorbar(radius, errBinAvg, errBinSD,'k'); hold on; axis([xmin xmax ymin ymax]);hold on; xlabel('Distance from center (mm)','FontWeight','Bold'); ylabel('errBin','FontWeight','Bold');hold on; %axis([xmin xmax min(errBinAvg-errBinSD)*1.1 max(errBinAvg+errBinSD)*1.1]);hold on; subplot(2,2,4); h4=errorbar(radius, ettBinAvg, ettBinSD,'k'); hold on; axis([xmin xmax ymin ymax]); hold on; xlabel('Distance from center (mm)','FontWeight','Bold'); ylabel('ettBin','FontWeight','Bold'); title(titlename2); %% Write to excel file, save jpg Filename = strcat(figname,'.xls'); Filename2 = strcat('angiemethod',figname,'.xls'); data2save=[radius,errBinAvg,errBinSD,ettBinAvg,ettBinSD];% Makes a matrix of values dlmwrite(Filename, data2save,'delimiter','\t', '-append' );%Writes all values to excel file named: experiment number_Results saveas(m, figname,'jpg') %saves figure
D.2.3. Function to determine strain in the y-direction
function [output] = ySlopeFinder(xdata,ydata) %% Constants avgSize = 2; %% Find the size of input data [inputR inputC] = size(xdata); %% For loop to find the average for i = 1 : inputC for j = 1 : inputR unitCnt = 1; %counter
xvii
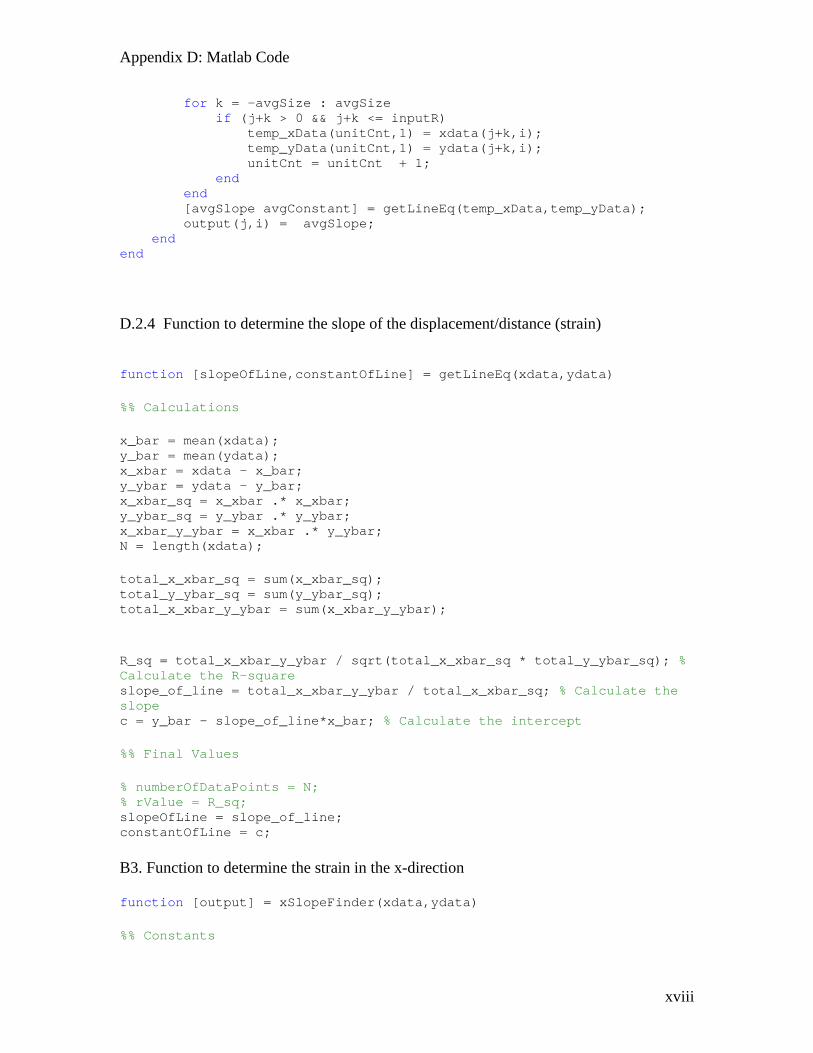
Appendix D: Matlab Code
for k = -avgSize : avgSize if (j+k > 0 && j+k <= inputR) temp_xData(unitCnt,1) = xdata(j+k,i); temp_yData(unitCnt,1) = ydata(j+k,i); unitCnt = unitCnt + 1; end end [avgSlope avgConstant] = getLineEq(temp_xData,temp_yData); output(j,i) = avgSlope; end end
D.2.4 Function to determine the slope of the displacement/distance (strain)
function [slopeOfLine,constantOfLine] = getLineEq(xdata,ydata) %% Calculations x_bar = mean(xdata); y_bar = mean(ydata); x_xbar = xdata - x_bar; y_ybar = ydata - y_bar; x_xbar_sq = x_xbar .* x_xbar; y_ybar_sq = y_ybar .* y_ybar; x_xbar_y_ybar = x_xbar .* y_ybar; N = length(xdata); total_x_xbar_sq = sum(x_xbar_sq); total_y_ybar_sq = sum(y_ybar_sq); total_x_xbar_y_ybar = sum(x_xbar_y_ybar); R_sq = total_x_xbar_y_ybar / sqrt(total_x_xbar_sq * total_y_ybar_sq); % Calculate the R-square slope_of_line = total_x_xbar_y_ybar / total_x_xbar_sq; % Calculate the slope c = y_bar - slope_of_line*x_bar; % Calculate the intercept %% Final Values % numberOfDataPoints = N; % rValue = R_sq; slopeOfLine = slope_of_line; constantOfLine = c; B3. Function to determine the strain in the x-direction function [output] = xSlopeFinder(xdata,ydata) %% Constants
xviii
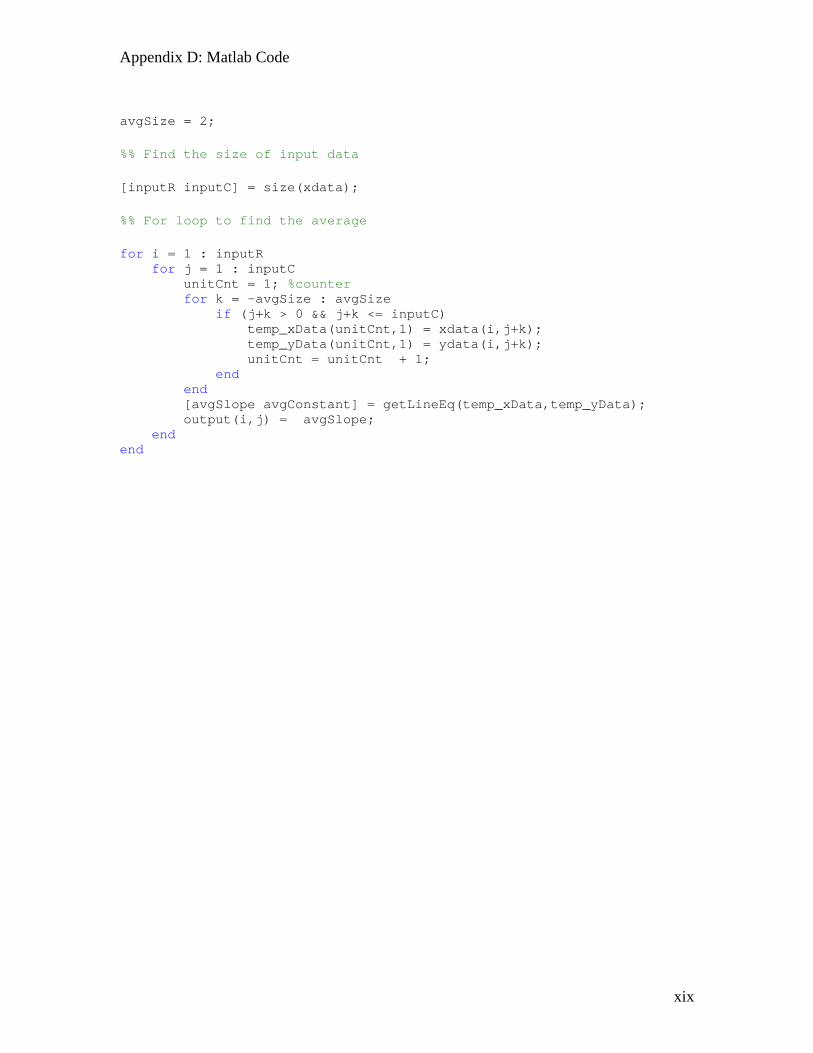
Appendix D: Matlab Code
avgSize = 2; %% Find the size of input data [inputR inputC] = size(xdata); %% For loop to find the average for i = 1 : inputR for j = 1 : inputC unitCnt = 1; %counter for k = -avgSize : avgSize if (j+k > 0 && j+k <= inputC) temp_xData(unitCnt,1) = xdata(i,j+k); temp_yData(unitCnt,1) = ydata(i,j+k); unitCnt = unitCnt + 1; end end [avgSlope avgConstant] = getLineEq(temp_xData,temp_yData); output(i,j) = avgSlope; nd eend
xix
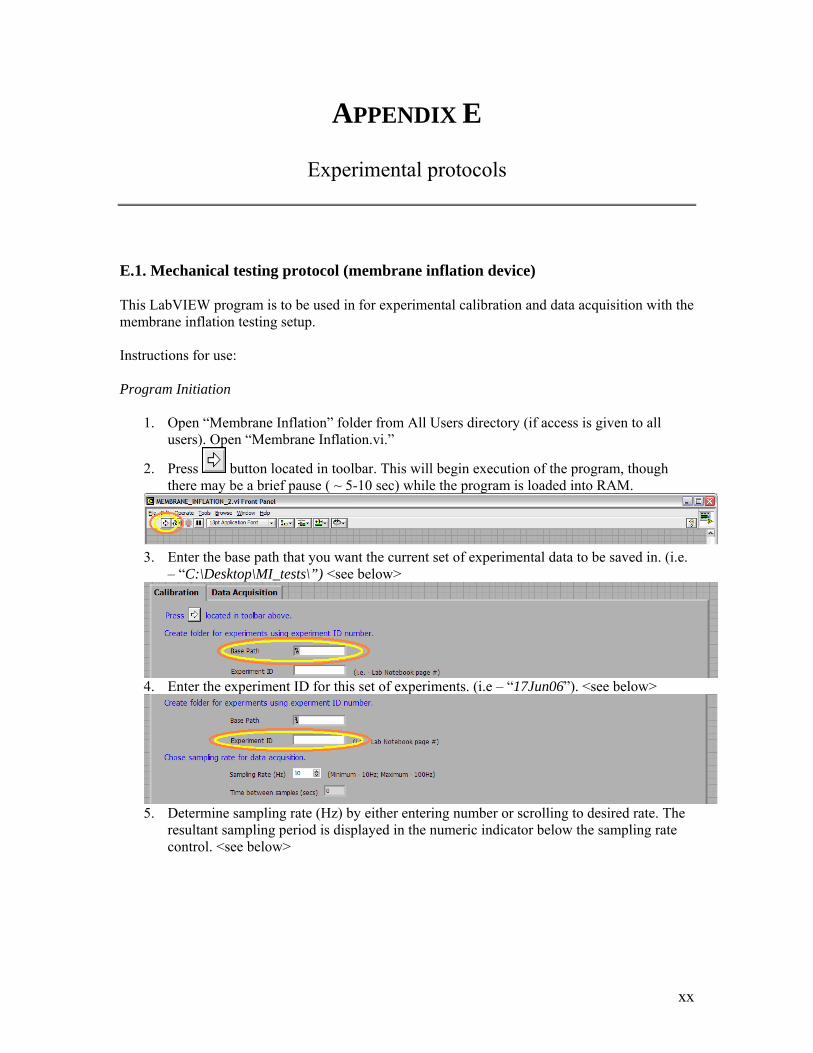
APPENDIX E
Experimental protocols E.1. Mechanical testing protocol (membrane inflation device)
This LabVIEW program is to be used in for experimental calibration and data acquisition with the membrane inflation testing setup. Instructions for use: Program Initiation
1. Open “Membrane Inflation” folder from All Users directory (if access is given to all users). Open “Membrane Inflation.vi.”
2. Press button located in toolbar. This will begin execution of the program, though there may be a brief pause ( ~ 5-10 sec) while the program is loaded into RAM.
3. Enter the base path that you want the current set of experimental data to be saved in. (i.e.
– “C:\Desktop\MI_tests\”) <see below>
4. Enter the experiment ID for this set of experiments. (i.e – “17Jun06”). <see below>
5. Determine sampling rate (Hz) by either entering number or scrolling to desired rate. The
resultant sampling period is displayed in the numeric indicator below the sampling rate control. <see below>
xx
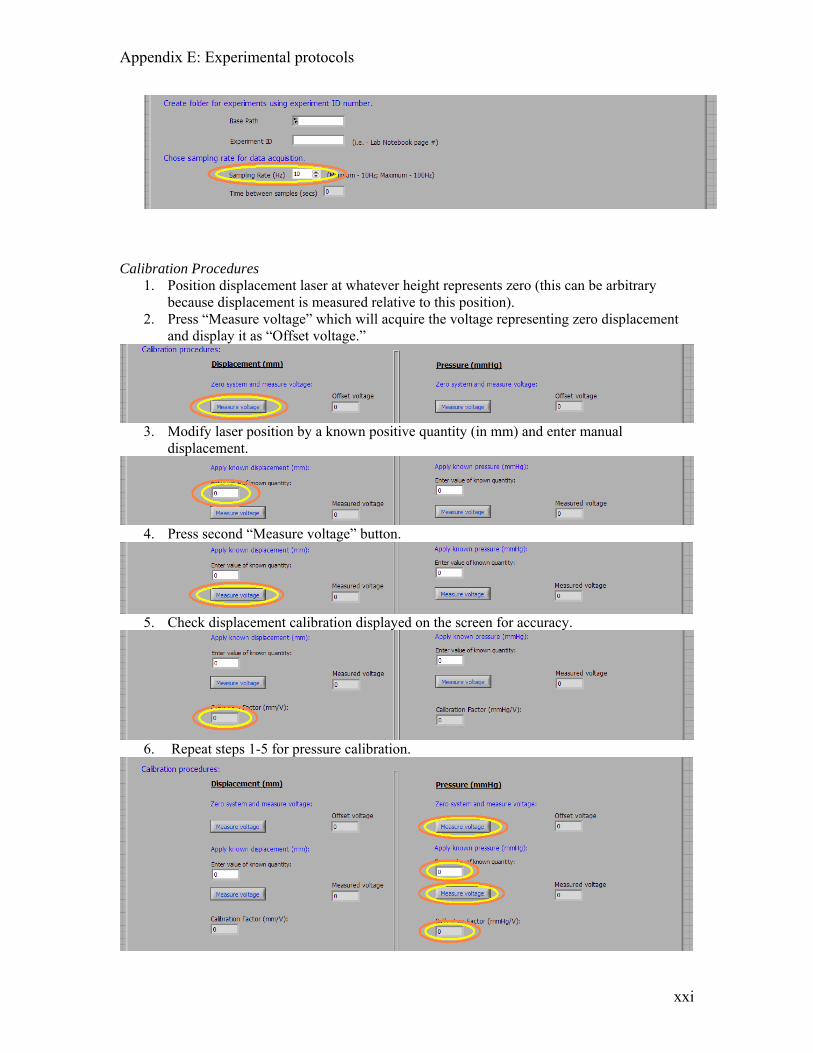
Appendix E: Experimental protocols
Calibration Procedures
1. Position displacement laser at whatever height represents zero (this can be arbitrary because displacement is measured relative to this position).
2. Press “Measure voltage” which will acquire the voltage representing zero displacement and display it as “Offset voltage.”
3. Modify laser position by a known positive quantity (in mm) and enter manual
displacement.
4. Press second “Measure voltage” button.
5. Check displacement calibration displayed on the screen for accuracy.
6. Repeat steps 1-5 for pressure calibration.
xxi
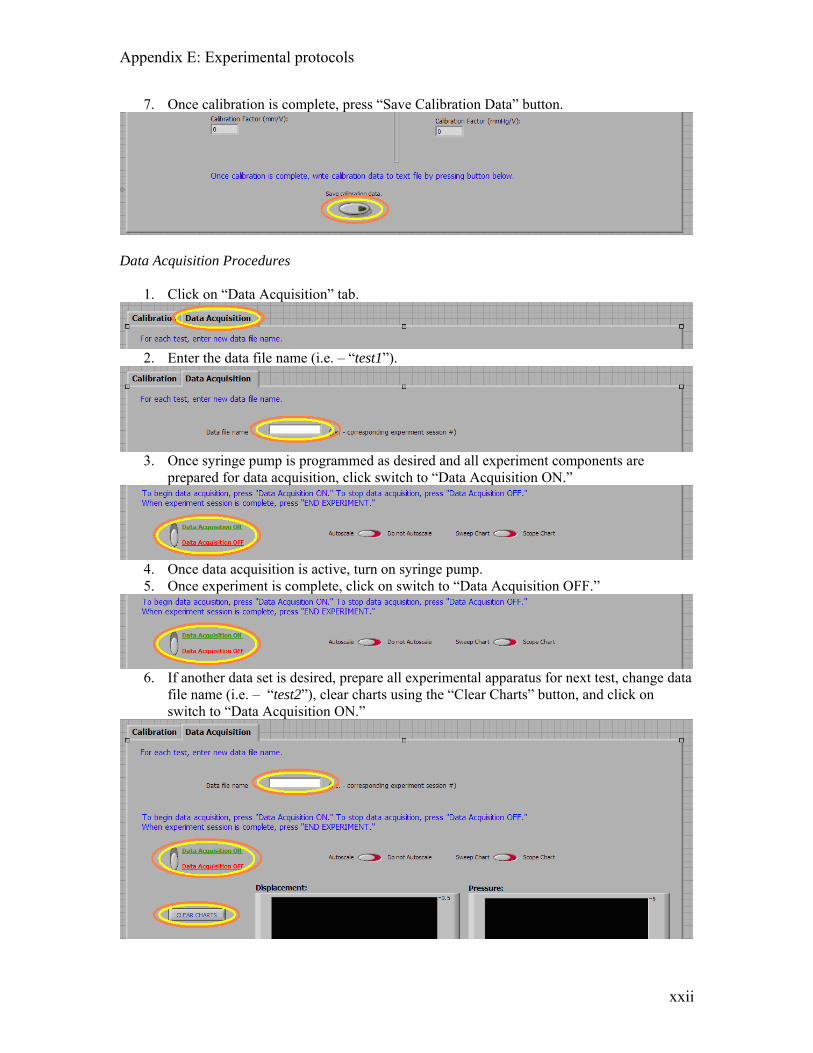
Appendix E: Experimental protocols
7. Once calibration is complete, press “Save Calibration Data” button.
Data Acquisition Procedures
1. Click on “Data Acquisition” tab.
2. Enter the data file name (i.e. – “test1”).
3. Once syringe pump is programmed as desired and all experiment components are
prepared for data acquisition, click switch to “Data Acquisition ON.”
4. Once data acquisition is active, turn on syringe pump. 5. Once experiment is complete, click on switch to “Data Acquisition OFF.”
6. If another data set is desired, prepare all experimental apparatus for next test, change data
file name (i.e. – “test2”), clear charts using the “Clear Charts” button, and click on switch to “Data Acquisition ON.”
xxii
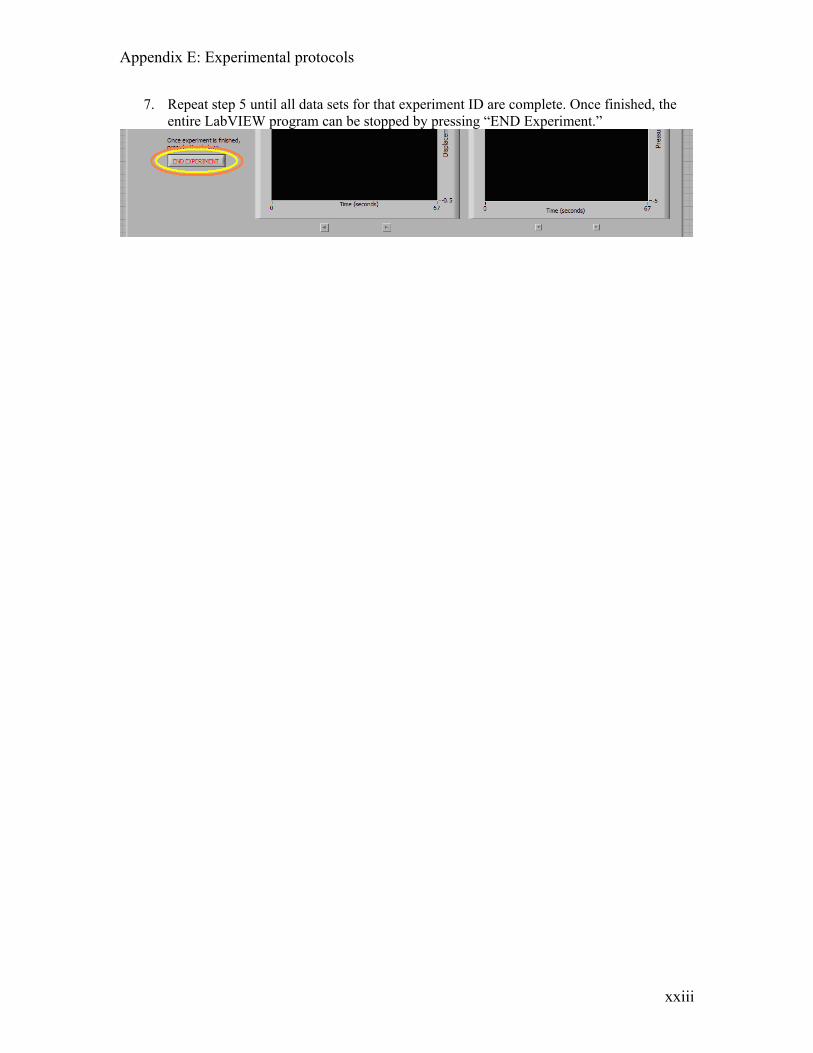
Appendix E: Experimental protocols
7. Repeat step 5 until all data sets for that experiment ID are complete. Once finished, the entire LabVIEW program can be stopped by pressing “END Experiment.”
xxiii
Appendix E: Experimental protocols
E.2. Fabrication of fibrin gels Materials:
• Thrombin aliquot (see E.3.) • Fibrinogen aliquot (see E.3.) • 20 mM HEPES in 0.9% NaCl saline solution (HBSS) • DMEM 1x • 2 N Ca++ (see E.3.) • Cell Culture Media (FBS+1% P/S+1x DMEM) • Fibroblasts • Growth media • Flexcell Tissue Train 6 well plates
Procedure:
The final solution to make fibrin gels (25 mm diameter) consists of 2/3 fibrinogen solution, 1/6 cell solution, and 1/6 thrombin solution, with the thrombin always being added last. The final concentrations should be calculated based on using 1.5mL of combined solution if you are making hemisphere gels.
Fibrinogen: • Add fibrinogen aliquot (1.5mL) to 7.5mL of HBSS. The concentration is now
5mg/mL. • Separate fibrinogen aliquots into desired amount of containers • For one aliquot it is easiest to divide the 9mL of this solution into 3 containers
each having 3mL.
Cell Suspension: • Spin down cells in centrifuge for 10 minutes @ 1200 rpm. • Resuspend cells in enough cell culture media (DMEM + 10% FBS) to give
desired final concentration. • Once desired concentration is achieved, add amount of cell suspension to each
fibrinogen container • Place containers on ice. • For one aliquot of fibrinogen and thrombin 0.67mL of cells should be added to
each container. (To keep 4:1:1 ratio)
xxiv
Appendix E: Experimental protocols
Thrombin: • Add 2mL of DMEM w/o FBS or BCS (just use 1x here) and 7.5μL of 2 N Ca++ to
100μL aliquot of thrombin. Put on ice.
Gel Preparation:
• Take the container of the fibrinogen and cell suspension and add amount of thrombin needed (0.67mL for one aliquot of each). Mix the suspension.
• Quickly place 3 ml of the total solution in the center of the Flexcell plate. • 4 gels can be made with the amount of volume of one container. (If only one
aliquot of each is used. • Repeat steps 3-5 in Gel Preparation until all of the containers are used.
xxv
Appendix E: Experimental protocols
E.2. Fabrication of stock solutions for the preparation of fibrin gels
E.2.1 Fibrinogen Stock Solution Materials:
• Bovine Fibrinogen Sigma F4753 Type IV • HEPES Buffered Saline Solution (HBSS)
20mM HEPES in 0.9% NaCl saline solution Procedure:
• Dissolve 5g of fibrinogen in 150mL of HBSS. Warm to 37 oC in H2O bath to aide in dissolution. Shake every 10 minutes or so. This will take at least an hour to dissolve.
• Once dissolved, filter solution through 0.45μm or 0.2μm bottle top filter using a glass prefilter to minimize clogging.
• Aliquot into 1.5mL volumes and freeze. Final concentration is 30mg/mL.
E.2.2. Preparation of 2N Ca2+ or 2M solution
Materials:
• Calcium Chloride • Sterile H2O
Procedure:
• Take 0.44g of CaCl2 • Place into 2mL of H2O • Filter sterilize • Place into sterile container • Store in fridge at 4°C
E.2.3. Thrombin Stock Solution Materials:
• Bovine Thrombin Sigma T7513 • HEPES Buffered Saline Solution (HBSS)
20 mM HEPES in 0.9% NaCl saline solution
xxvi

Appendix E: Experimental protocols
• Sterile H2O
Procedure:
• Dissolve 500 units of thrombin in 2mL of H2O and 18mL of HBSS. • Filter using 0.2μm syringe filter. • Divide solution into 125μL aliquots and freeze. Aliquot concentration is 25U/μL.
xxvii
Appendix E: Experimental protocols
E.3. Hoechst Stain Assay Materials:
• Hoechst Stock Solution • Sterile H2O
Procedure:
• Combine 1.5mL of sterile H2O and 5μL of stock solution • Add desired concentration of staining solution to the gel. (For fibrin gels of
1.5mL initial volume 200μL was sufficient for staining final concentration of stain is 5.7*10-6 M)
• Let staining solution + gel sit for 30-45 minutes in the incubator. • After time elapses gather samples for microscopy. • Fluorescence filter UV2A is used which excites at 380 and absorbs at 420. • Turn on spot camera and Mercury Lamp and use Spot Imaging program to
image gels.
xxviii

Appendix E: Experimental protocols
E.4. Histology Fixation
Materials:
10% buffered formalin 70% EtOH
Procedure:
Place lattice in conical tube with enough formalin to cover the sample Refrigerate for 18-24hrs at 4oC Replace formalin with 70% ethanol Refrigerate until testing begins
xxix

Appendix E: Experimental protocols
E.5. Operation of Biorad Flour-S MultiImager and Quantity-One Software for Retraction Studies
Materials:
• Circular tissue equivalent samples • Scoopula or Pasteur pipet (whichever is preferred) • Stopwatch • BIO-RAD Flour-S MultiImager • Quantity-One software
Procedure:
• Turn on Biorad one hour prior to use • Log on to TE Biorad.wpi.edu computer as Administrator • Retract gels using a scoopula in the hood if sterility is important
o NOTE: A scoopula was found to be more advantageous than a Pasteur pipet because of the greater area that can be retracted in less time with the scoopula
o If the gels are in a #-well plate, and sterility is not an issue, the gels should be retracted near Biorad to prevent loss of time by going from the hood to the Biorad machine
• Place specimen in Biorad o NOTE: Most importantly, if sterility is not an issue, leave the cover off
when scanning the gels in the multiimager. If the cover has to stay on, be aware of the fact that both condensation and/or EtOH bubbles from spraying in the laminar flow hood that form/remain on the cover may interfere with the retraction analysis
• Open Quantity One software • Click on ‘file’ and go to ‘Flour-S’ • In the Flour-S MultiImager setup screen, make sure that ‘Step III – Set Exposure
Time (sec)’ is set to an optimal exposure time for the experiment o For retraction studies, 6.1 seconds was determined to be optimal o To determine what exposure time is optimal for your experiment, vary the
exposure times and click on ‘preview’ to decide if the results are acceptable
• Click on ‘Aquire’ to save the image o NOTE: This takes about 13-14 seconds to save the scan so be sure to
click ‘aquire’ 13-14 seconds prior to the desired time interval. • Click on ‘Aquire’ at every time interval as needed
o E.g., for studies in Chapter 4, time intervals were as follows: pre-retraction, 5min, 10 min, 15min, 20min, 25min, 30 min, 24hrs
To analyze scans:
• Click on ‘zoom in’ tool and zoom into one well
xxx

Appendix E: Experimental protocols
• Click on ‘Volume’ o If your specimen is a perfect circle, you may want to try the ‘volume circle
tool.’ o If your specimen is not a perfect circle or rectangle, use the ‘volume free
hand tool.’ o You may need to determine for yourself which tool produces the more
accurate parameter determinations • Trace the specimen using the mouse • Click on ‘Volume’ again • Click on ‘Volume Analysis Report’ • Print scans
xxxi