Embed Size (px)
Citation preview
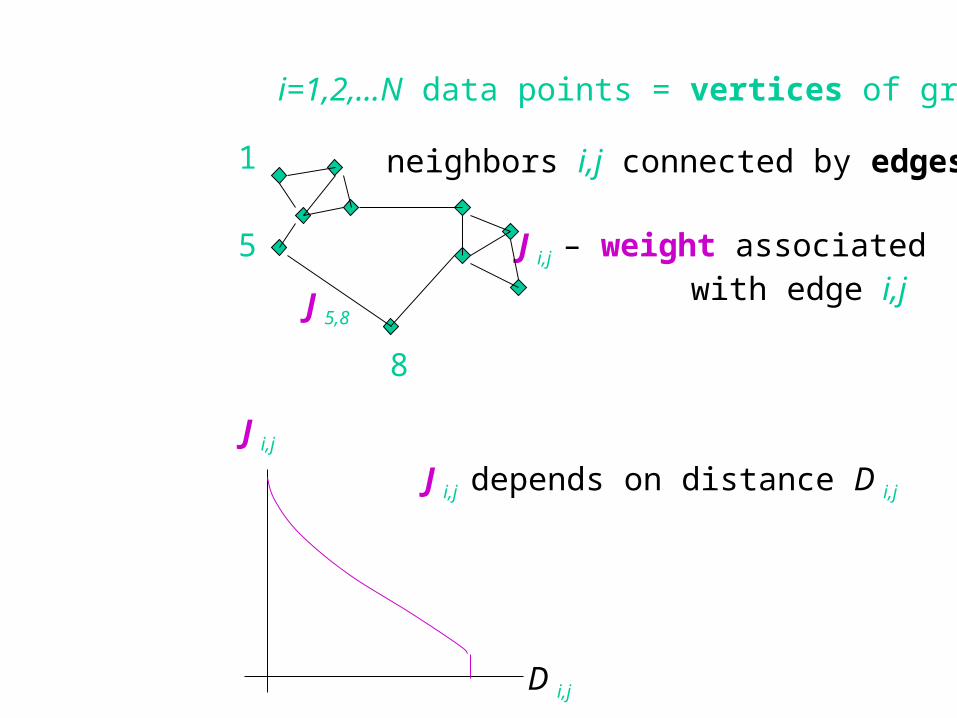
i=1,2,...N data points = vertices of graph
neighbors i,j connected by edges
5
1
8
J i,j – weight associated with edge i,jJ 5,8
J i,j depends on distance D i,j
J i,j
D i,j
weighted graph

partitions

weights

correlated pairs

clusters
C i,j > 0.5

how many clusters?
3 LARGEMANY small (SPC)
toy problem SPC

TSS vs K
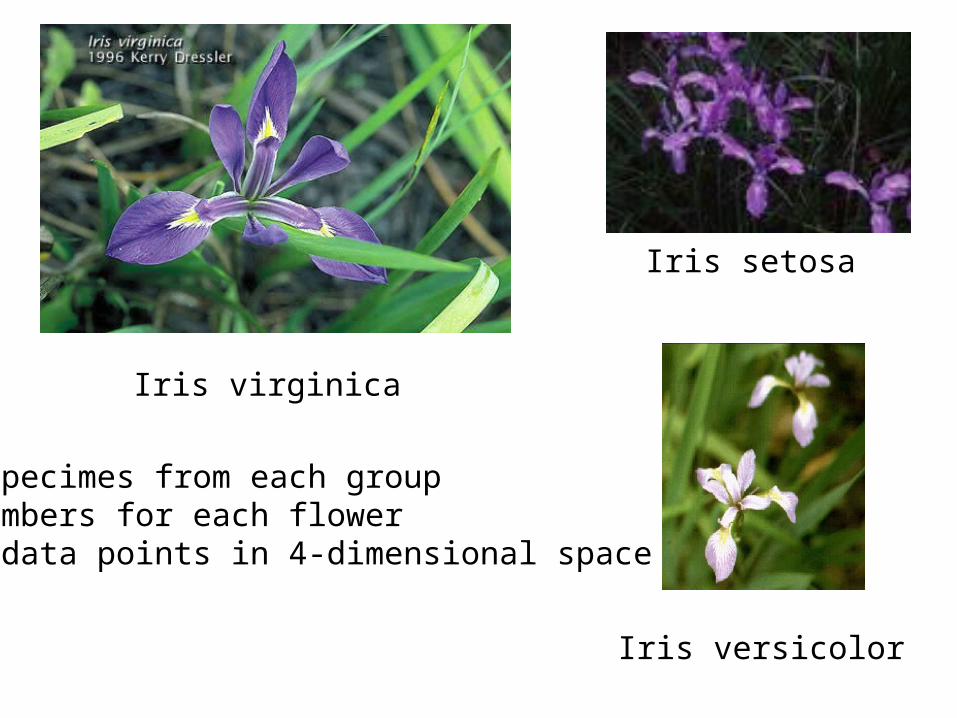
Iris setosa
Iris versicolor
Iris virginica
50 specimes from each group4 numbers for each flower150 data points in 4-dimensional space
irises

150 points in d=4
3 large clusters
d=4

comparison Iris

3circles:
N=4800 POINTS IN D=2

identifying stable clusters
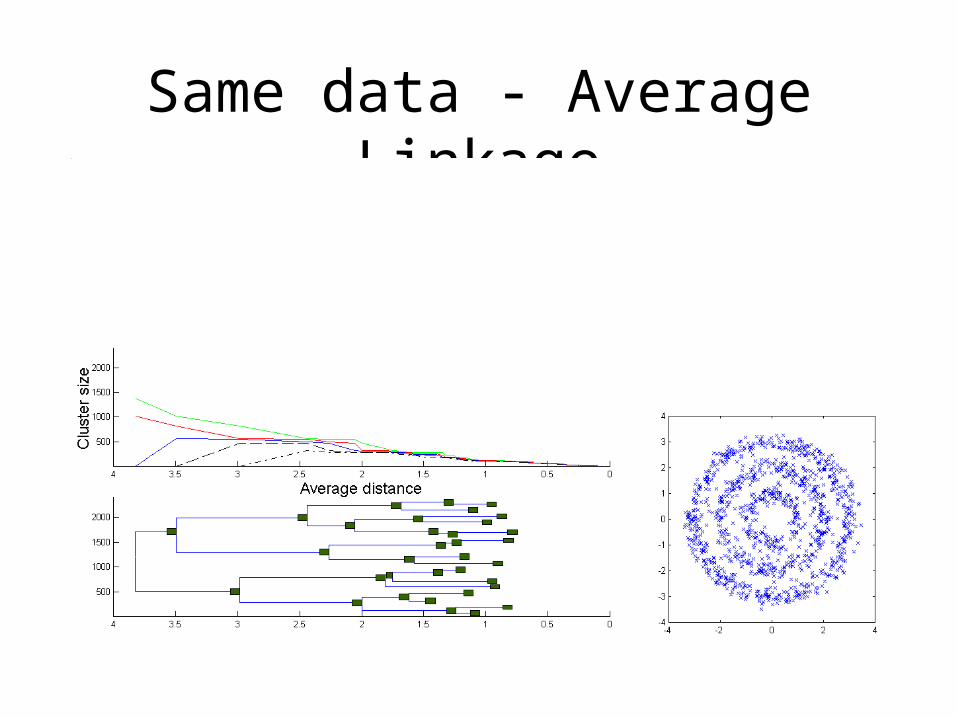
Same data - Average Linkage
No analog for No analog for

Same data - Average Linkage
Examining this cluster
Examining this cluster

Advantages of SPC
• RELIES ON PROXIMITY
• SCANS ALL RESOLUTIONS (T)
• ROBUST AGAINST NOISE AND INITIALIZATION -
CALCULATES COLLECTIVE CORRELATIONS.
• IDENTIFIES STABLE CLUSTERS (T)
• NO NEED TO PRE-SPECIFY NUMBER OF CLUSTERS

Samples
Genes5 10 15 20 25
5
10
15
20
25
30
350
10
20
30
40
50
60
70
80
90
100
%
ProtocolA
a
b
-
+ A B
5 10 15 20 25 30 35
5
10
15
20
25
30
35
C
S1G3 stability
larger T - tighter, more stable cluster
T

YEAST CELL-CYCLE EXPRESSION DATA
• EXPRESSION DATA: SIMULTANEOUS MEASUREMENT OF MRNA CONCENT-
RATION OF THOUSANDS OF GENES.
• DATA: N=2467 GENES OF KNOWN
FUNCTION MEASURED AT 18 TIME
INTERVALS (18*7 MIN) DURING CELL
CYCLE OF YEAST. .
• CELLS SYNCHRONIZED BY ALPHA FACTOR ARREST AND RELEASE.
SPELLMAN ET. AL. (1998) MOL. BIOL. CELL

CELL CYCLE
G1 –gap, decide whether to proliferate, wait
or cross to non-dividing stage G0
S -- DNA Synthesis
G2– gap, allow DNA repair
M – Mitosis, cell division

Yeast data dendrogram
500 1000 1500 2000
5
10
15
20
25
30
35
40
45
50T
- R
esol
utio
n
Genes

• WE APPLIED FILTERS TO SELECT CLUSTERS OF CELL-CYCLE RELATED GENES. THE MEAN EXPRESSION PROFILE OF A CLUSTER SHOULD HAVE – SMOOTH, LOW FREQUENCY TEMPORAL
VARIATION.– SIGNIFICANT DEVIATION FROM
CONSTANT VALUE
Choosing clusters to examine

500 1000 1500 2000
5
10
15
20
25
30
35
40
45
50T
- R
esol
utio
n
Genes
432 1
Chosen clusters

Cell-cycle clusters
0 2 4 6 8 10 12 14 16 18-0.8
-0.6
-0.4
-0.2
0
0.2
0.4
0.6
Time0 2 4 6 8 10 12 14 16 18
-0.8
-0.6
-0.4
-0.2
0
0.2
0.4
0.6
Time
0 2 4 6 8 10 12 14 16 18-0.6
-0.4
-0.2
0
0.2
0.4
0.6
0.8
Time
0 2 4 6 8 10 12 14 16 18-0.8
-0.6
-0.4
-0.2
0
0.2
0.4
0.6
Time
Late G1Cln1,2Clb5,6Swi4
G2/MClb1,2Swi5Ace2
SHistones

Progression of the cell-cycle
0 2 4 6 8 10 12 14 16 18-0.8
-0.6
-0.4
-0.2
0
0.2
0.4
0.6
Late G1 clusterS cluster G2/M cluster

Other stable clusters
500 1000 1500 2000
5
10
15
20
25
30
35
40
45
50T
- R
esol
utio
n
Genes
56
7
89
10
11

Analyzing promoters of the genes
• Mostly ribosomal proteins(Artifact - freezer)
• General metabolismA novel conserved DNA motif GCGATGAGNT in 90% of genes
• Dip at the endA novel conserved DNAmotif RNNGCWGCNNC
0 2 4 6 8 10 12 14 16 18 20-1
-0.8
-0.6
-0.4
-0.2
0
0.2
0.4
0.6
0.8
1
Cluster #5
0 2 4 6 8 10 12 14 16 18 20-1
-0.8
-0.6
-0.4
-0.2
0
0.2
0.4
0.6
0.8
1
Cluster #6
0 2 4 6 8 10 12 14 16 18 20-1
-0.8
-0.6
-0.4
-0.2
0
0.2
0.4
0.6
0.8
1
Cluster #8
0 2 4 6 8 10 12 14 16 18 20-1
-0.8
-0.6
-0.4
-0.2
0
0.2
0.4
0.6
0.8
1
Cluster #7
0 2 4 6 8 10 12 14 16 18 20-1
-0.8
-0.6
-0.4
-0.2
0
0.2
0.4
0.6
0.8
1
Cluster #10
G.Getz, E.Levine, E.Domany and M.Zhang Physica A279, 457 (2000)

0 2 4 6 8 10 12 14 16 18 20-1
-0.8
-0.6
-0.4
-0.2
0
0.2
0.4
0.6
0.8
1
Cluster #5
0 2 4 6 8 10 12 14 16 18 20-1
-0.8
-0.6
-0.4
-0.2
0
0.2
0.4
0.6
0.8
1
Cluster #6
0 2 4 6 8 10 12 14 16 18 20-1
-0.8
-0.6
-0.4
-0.2
0
0.2
0.4
0.6
0.8
1
Cluster #8
oscillations – by eye

PRIMARY TARGETS OF P53
TEMPERATURE SENSITIVE MUTANT P53, ACTIVATE - 32 C (t=0)
MEASURE EXPRESSION AT t=0,2,6,12,24 h (use t=0 as control)
REPEAT IN PRESENCE OF CYCLOHEXIMIDE (CHX) t=0,2,4,6,9,12
(CHX INHIBITS PROTEIN SYNTHESIS)
IDENTIFY UPREGULATED GENES USING FILTER:
AT LEAST 2.5 FOLD INCREASE AT 3 OR MORE TIME POINTS
(SEPARATELY IN EACH OF THE
TWO EXPTS, -CHX AND +CHX)
38 CANDIDATE PRIMARIES:EFFECT OF FILTERING??? RELEASE FILTER FROM +CHXCLUSTERING: 38 47 (31)

REDUCE EFFECT OF FILTERING BY CLUSTERING
X – 38 candidate primary targets
% candidate primary targets
c
a
K.Kannan et al, Oncogene

COLON CANCER DATA:
Colon Cancer Data

Two-way clustering
S1(G1)
G1(S1)
TWO-WAYCLUSTERING:

-0.4
-0.2
0
0.2
0.4
0.6
0.8
Experiments
Ge
ne
s
Colon cancer data (normalized genes)
10 20 30 40 50 60
200
400
600
800
1000
1200
1400
1600
1800
2000
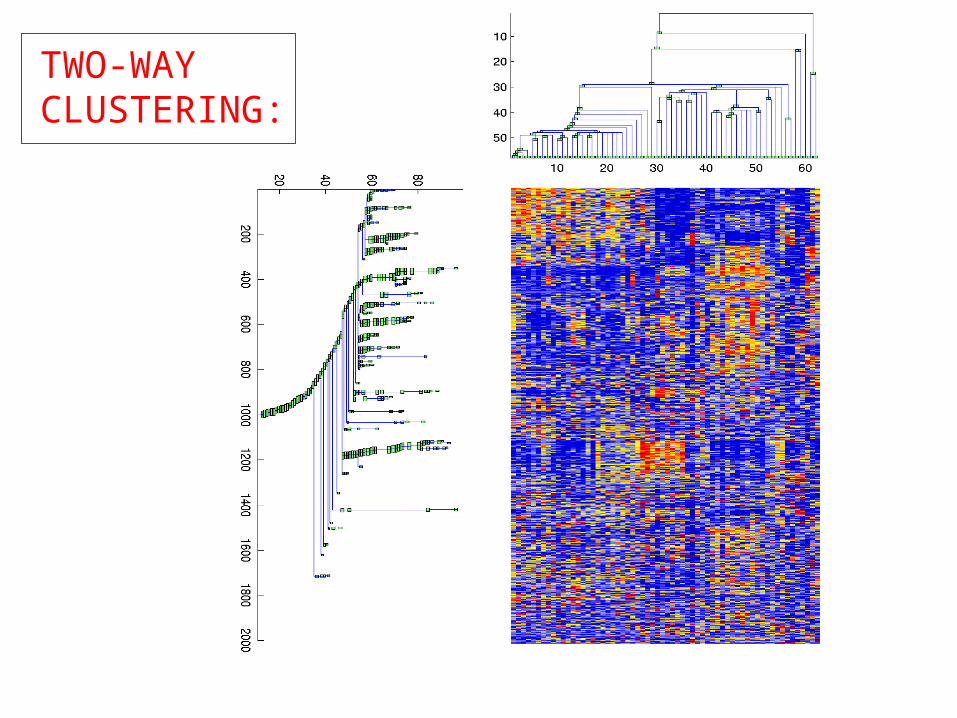
TWO-WAYCLUSTERING:
Two way clustering-ordered
S1(G1)
G1(S1)
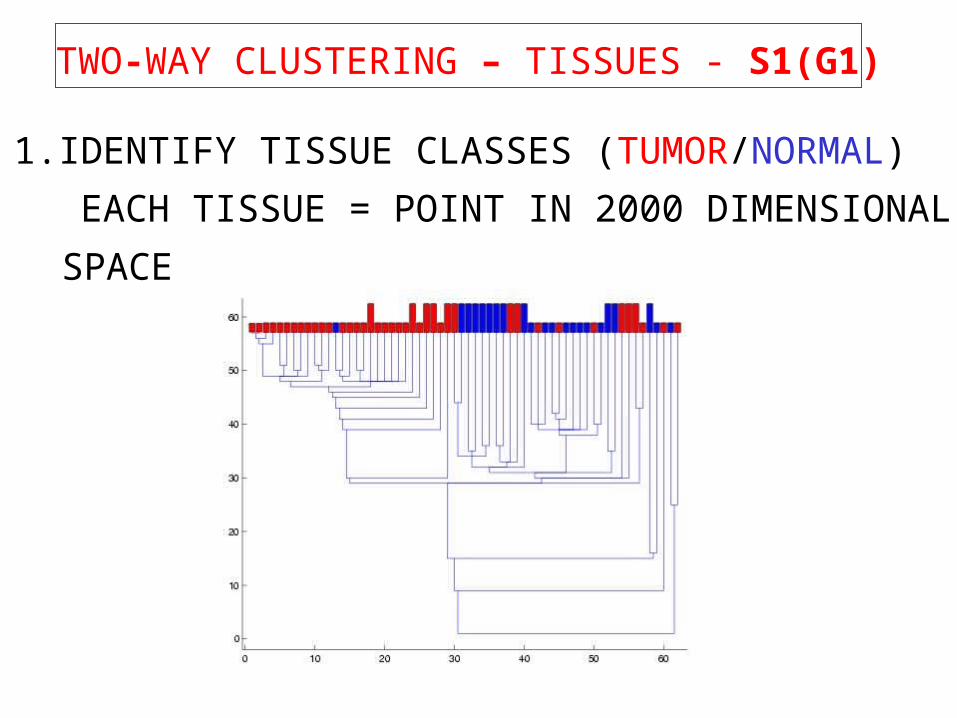
TWO-WAY CLUSTERING – TISSUES - S1(G1)
1.IDENTIFY TISSUE CLASSES (TUMOR/NORMAL)
EACH TISSUE = POINT IN 2000 DIMENSIONAL SPACE
2-way clustering - tissues

Ribosomal proteins Cytochrome C
HLA2
metabolism
2-way clustering –genes Erel
TWO-WAY CUSTERING – GENES - G1(S1)
2. FIND DIFFERENTIATING AND CORRELATED GENES EACH GENE = POINT IN 62 DIMENSIONAL SPACE
TWO-WAYCLUSTERING:
Two-way clustering

football
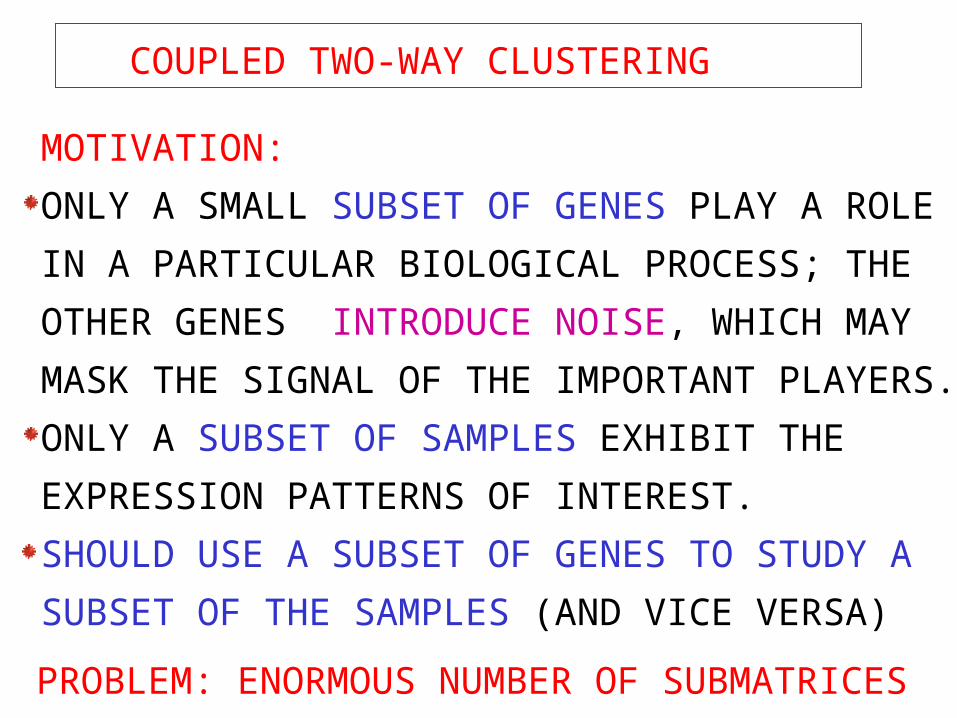
COUPLED TWO-WAY CLUSTERING
C2WC - Motivation
MOTIVATION:
ONLY A SMALL SUBSET OF GENES PLAY A ROLE
IN A PARTICULAR BIOLOGICAL PROCESS; THE
OTHER GENES INTRODUCE NOISE, WHICH MAY
MASK THE SIGNAL OF THE IMPORTANT PLAYERS.
ONLY A SUBSET OF SAMPLES EXHIBIT THE
EXPRESSION PATTERNS OF INTEREST.
SHOULD USE A SUBSET OF GENES TO STUDY A
SUBSET OF THE SAMPLES (AND VICE VERSA)
PROBLEM: ENORMOUS NUMBER OF SUBMATRICES
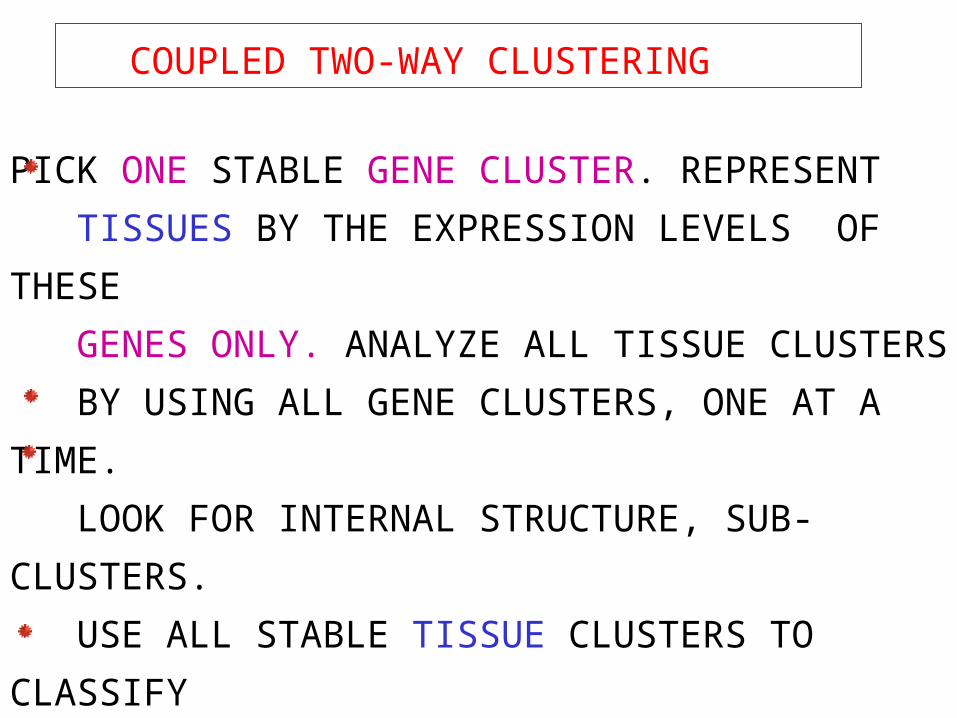
COUPLED TWO-WAY CLUSTERING
PICK ONE STABLE GENE CLUSTER. REPRESENT
TISSUES BY THE EXPRESSION LEVELS OF THESE
GENES ONLY. ANALYZE ALL TISSUE CLUSTERS
BY USING ALL GENE CLUSTERS, ONE AT A TIME.
LOOK FOR INTERNAL STRUCTURE, SUB-CLUSTERS.
USE ALL STABLE TISSUE CLUSTERS TO CLASSIFY
GENES; IDENTIFY GENE CLUSTERS THAT GOVERN
BIOLOGICAL PROCESSES.
ITERATE THE PROCEDURE UNTIL NO NEW STABLE
CLUSTERS EMERGE
C2WC - method

A
B
A
B
10 20 30 40 50 60
200
400
600
800
1000
1200
1400
1600
1800
2000
COUPLED TWO-WAY CLUSTERING OF COLON CANCER: TISSUES
G4
G12
S1(G4)
S1(G12)

A
B
A
B
10 20 30 40 50 60
200
400
600
800
1000
1200
1400
1600
1800
2000
0 10 20 30 40 50 60
0
10
20
30
40
50
60
COUPLED TWO-WAY CLUSTERING OF COLON CANCER: TISSUES
CTWC colon cancer - tissues
S1(G4)
S1(G12)
0 10 20 30 40 50 60
0
10
20
30
40
50
60
S17

0 10 20 30 40 50 60
0
10
20
30
40
50
60
genes1
S17
G1(S17)

COUPLED TWO WAY CLUSTERING OF COLON CANCER - GENES
USING ONLY THE TUMOR TISSUES TO CLUSTERGENES, REVEALS CORRELATION BETWEEN TWO GENE CLUSTERS; CELL GROWTH AND EPTHELIAL
COLON CANCER - ASSOCIATED WITH EPITHELIAL CELLS
CTWC of colon cancer - genes
G1(S17)G1(S1)

COLON CANCER: 18 PAIRED CARCINOMA/NORMAL 4 PAIRED ADENOMA/NORMALNotterman et al Cancer Res. (2001)
tumor/normal distance matrix

COLON CANCER: 18 PAIRED CARCINOMA/NORMAL 4 PAIRED ADENOMA/NORMALNotterman et al Cancer Res. (2001)
protocol A /protocol B distance matrix

A(II)ScGBM
PrGBMCL
GE
NE
S
S2S3
T
S1(G1)
G12
G5
Coupled Two-Way Clustering (CTWC)
of 358 Genes and 36 Samples
Fig. 2A
GLIOBLASTOMA: M. HEGI et al CHUV, CLONTECH ARRAYS
glioblastoma

AB004904 STAT-induced STAT inhibitor 3
M32977 VEGF
M35410 IGFBP2
X51602 VEGFR1
M96322 gravin
AB004903 STAT-induced STAT inhibitor 2
X52946 PTN
J04111 c-jun
X79067 TIS11B
S11S12
S14
S10
S13S1(G5)
Super-Paramagnetic Clustering of All Samples
Using Stable Gene Cluster G5
Fig. 2B
S1(G5)

G5Ver
LGAAIIIScGBMPrGBMRecPrGBMnew sample
validation

Induction of IGFBPs under Hypoxic Conditions in
Glioblastoma Cell Lines
Fig. 4
IGFBP EXPT

BREAST CANCER DATA (BOTSTEIN/BROWN LAB PEROU ET AL, NATURE 2000)
20 patients before/after chemotherapy. 10 of the “before” samples are in cluster b; all 3 successful treatments’ samples in this group.
Intermediate expression level of the G46 genes may serve as a marker for a relatively high success rate of the doxorubicin treatment
Predicting response to doxorubicin treatment;successful for 3/20 patients

survival S1(G33) Sorlie
BREAST CANCER DATA (BOTSTEIN/BROWN LAB),
Sorlie et al, PNAS (2001)
Cluster (a): high expression levels of the genes of G33,low survival, mutant p53.
predictor of survival.

S1(G36) Sorlie
BREAST CANCER DATA (BOTSTEIN/BROWN LAB),
Sorlie et al, PNAS (2001)
Gene cluster G36 inducesclear partition to two classes of no known clinical interpretation

signature algorithmJ. Ihmels, G. Friedlander,S. Bergmann,O. Sarig, Y Ziv, N. Barkai

((a) Ncore = 37,73,145 genes for ribosomal proteins 132 genes for biosynthesis Each used as input GI
ref, returns (nearly same) gene signature Sref
add Nrand randomly picked genes GI input set of Ncore + Nrand genes, returns gene signatures SI
Recurrence of Sref is measured by Overlap = Fraction of shared genes by Sref and SI
(b) Use as GIref sets of genes with shared regulatory sequences.
Only the truely coregulated ones are returned in Sref; recurrent.
yeast genome: 6400 genes, 1000 “conditions” (chips)
recurrence

pathways
(a) Tricarboxyl acid (TCA) cycle: known genes in E.coli, find (34) homologues in yeast used as GI ; produce SI which excludes the wrong genes and misses only few correct ones(b,c) Identify two autonomous subparts of the cycle


![DSI 2019 RUS FINAL - Ernst & Young...E b ^ _ j u j _ c l b g ] h \ a Z ] h ^ u : \ ] : i j : \ ] : i j : \ ] : \ ] H d l : i j H d l : i j : i j : i j : i j : i j : i j $8', 6.2'$](https://img.pdfslide.net/doc/110x75/5f0c93477e708231d436166a/dsi-2019-rus-final-ernst-young-e-b-j-u-j-c-l-b-g-h-a-z-h.jpg)

![I I ! i i I j - mediaserver.dnrc.mt.govmediaserver.dnrc.mt.gov/archive/fieldnotes/choteau/... · I i , am j «s \ j B i -j 4 j ] a I | 2 1 j- 1 | H ZJ j 1 1 1 j zizpzzi 1 ] 1 1 11](https://img.pdfslide.net/doc/110x75/5ecbba1bc67e880be24ef3b2/i-i-i-i-i-j-i-i-am-j-s-j-b-i-j-4-j-a-i-2-1-j-1-h-zj-j-1-1-1-j.jpg)


![Instrumentation€¦ · Bb Clarinet 2 Arranged by Jan van Kraeydonck Lively .J = 132 []J , ~II tel j I A Fir f' I " mf II J. :Rig i] I J J I J p J j I '~1I .. ) '~H t '~II I, 0 '~I](https://img.pdfslide.net/doc/110x75/60ca60521a1c4619d31b77dc/instrumentation-bb-clarinet-2-arranged-by-jan-van-kraeydonck-lively-j-132-j.jpg)