Embed Size (px)
Citation preview
1
1
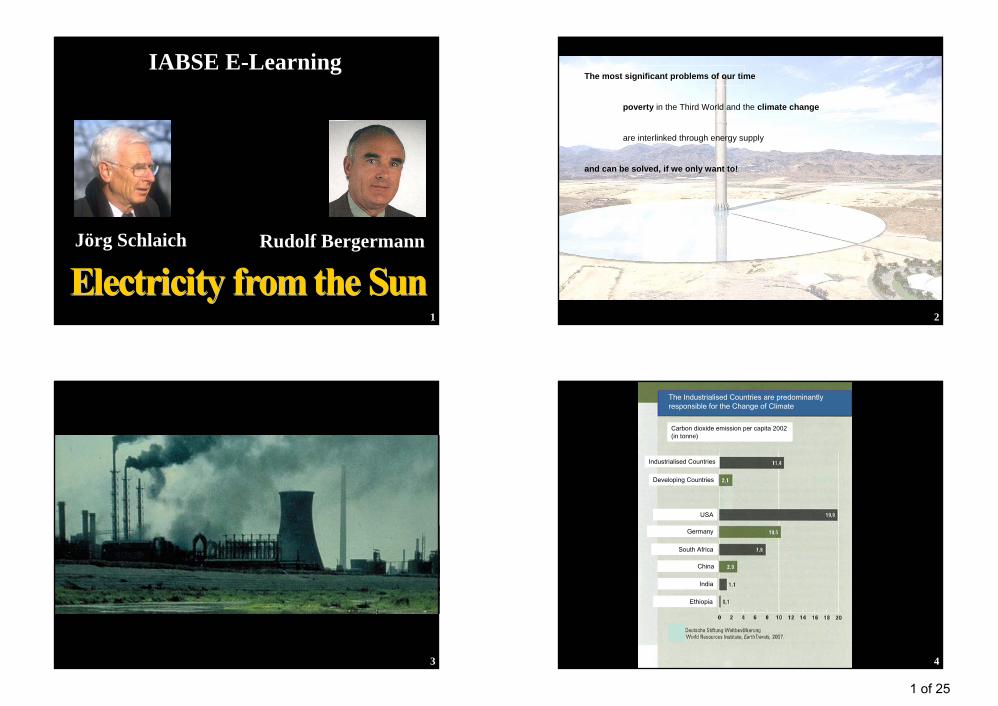
IABSE E-Learning
Jörg Schlaich Rudolf Bergermann
2
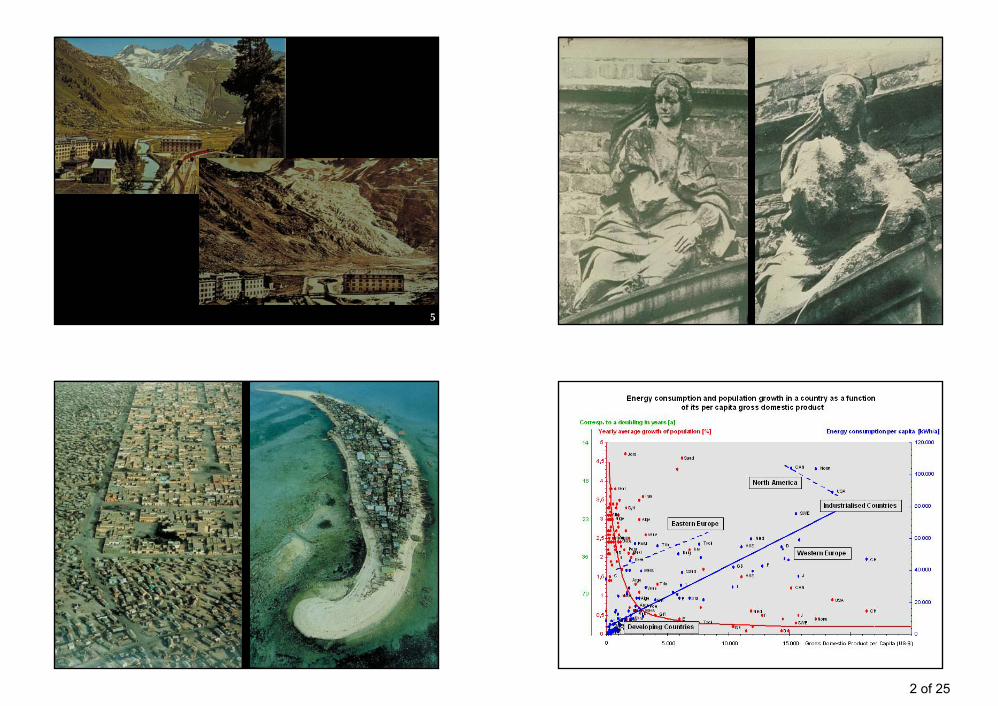
The most significant problems of our time
poverty in the Third World and the climate change
are interlinked through energy supply
and can be solved, if we only want to!
3 4
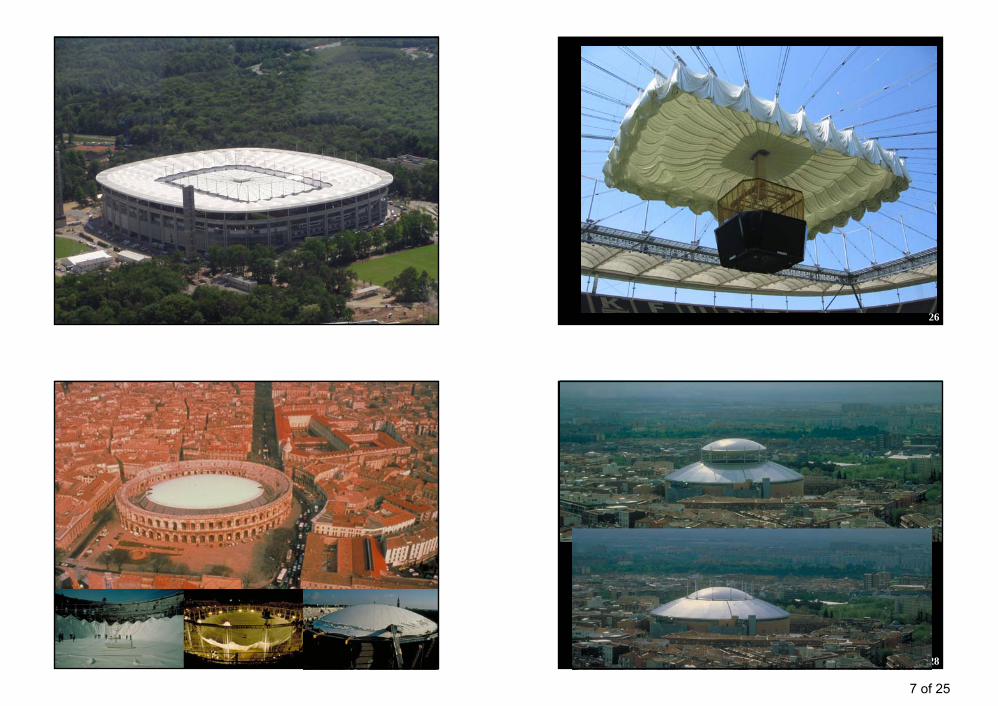
Industrialised Countries
Developing Countries
Germany
China
India
Ethiopia
USA
South Africa
Carbon dioxide emission per capita 2002(in tonne)
The Industrialised Countries are predominantly responsible for the Change of Climate
1 of 25
2
5 6
7 8
2 of 25
3
9 10
11 12
3 of 25

4
13 14
15 16
4 of 25

5
17
Large central Small decentral
power plants
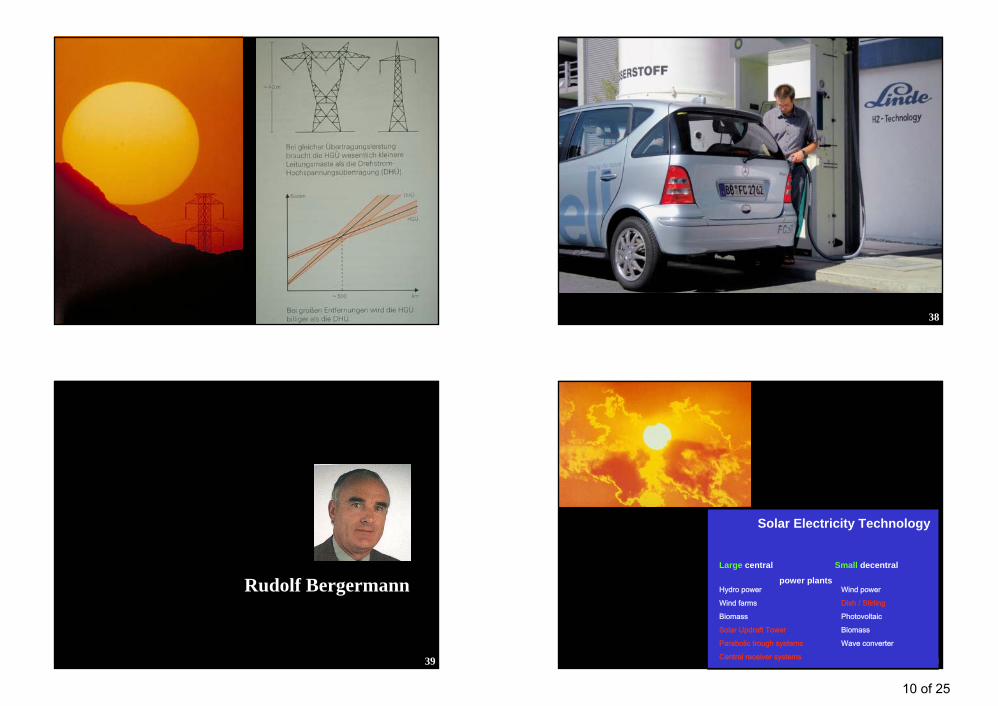
Solar Electricity Technology
Hydro power
Wind farms
Biomass
Solar Updraft Tower
Parabolic trough systems
Central receiver systems
Wind power
Dish / Stirling
Photovoltaic
Biomass
Wave converter
18
19 20
5 of 25

6
21 22
23 24
6 of 25
7
25 26
27 28
7 of 25

8
29 30
31 32
8 of 25
9
33 34
35
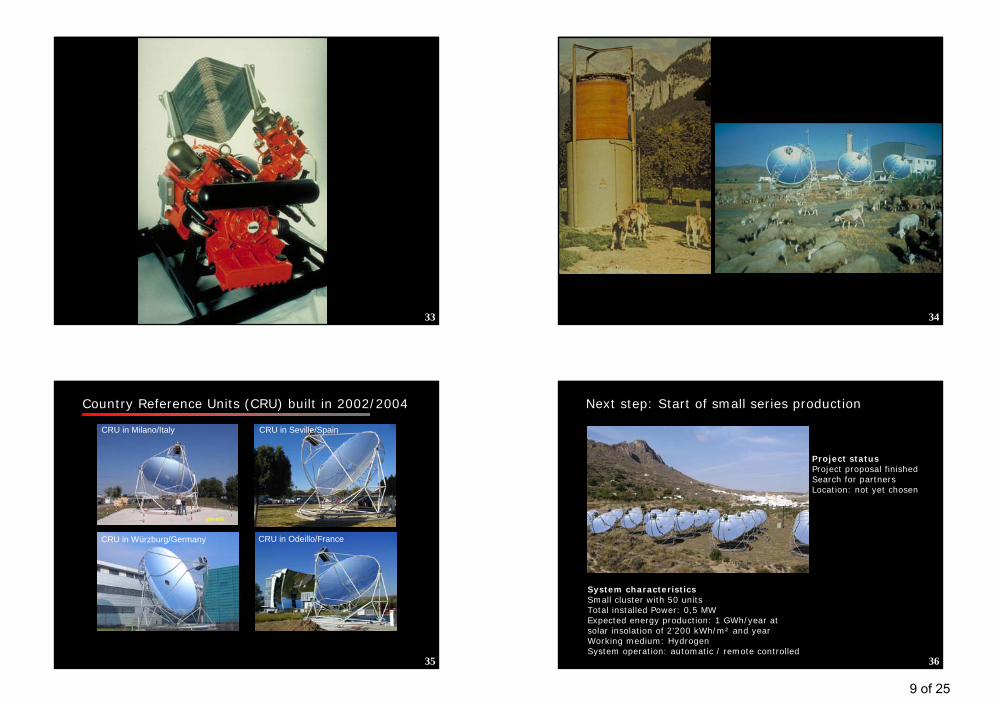
Country Reference Units (CRU) built in 2002/2004
CRU in Odeillo/FranceCRU in Würzburg/Germany
CRU in Milano/Italy CRU in Seville/Spain
36
Next step: Start of small series production
System characteristicsSmall cluster with 50 unitsTotal installed Power: 0,5 MWExpected energy production: 1 GWh/year at solar insolation of 2'200 kWh/m² and yearWorking medium: HydrogenSystem operation: automatic / remote controlled
Project statusProject proposal finishedSearch for partnersLocation: not yet chosen
9 of 25
10
37 38
39
Rudolf Bergermann
40
Large central Small decentral
power plants
Solar Electricity Technology
Hydro power
Wind farms
Biomass
Solar Updraft Tower
Parabolic trough systems
Central receiver systems
Wind power
Dish / Stirling
Photovoltaic
Biomass
Wave converter
10 of 25
11
41 42
43 44
Metallmembran-
11 of 25

12
45 46
47 48
12 of 25
13
49
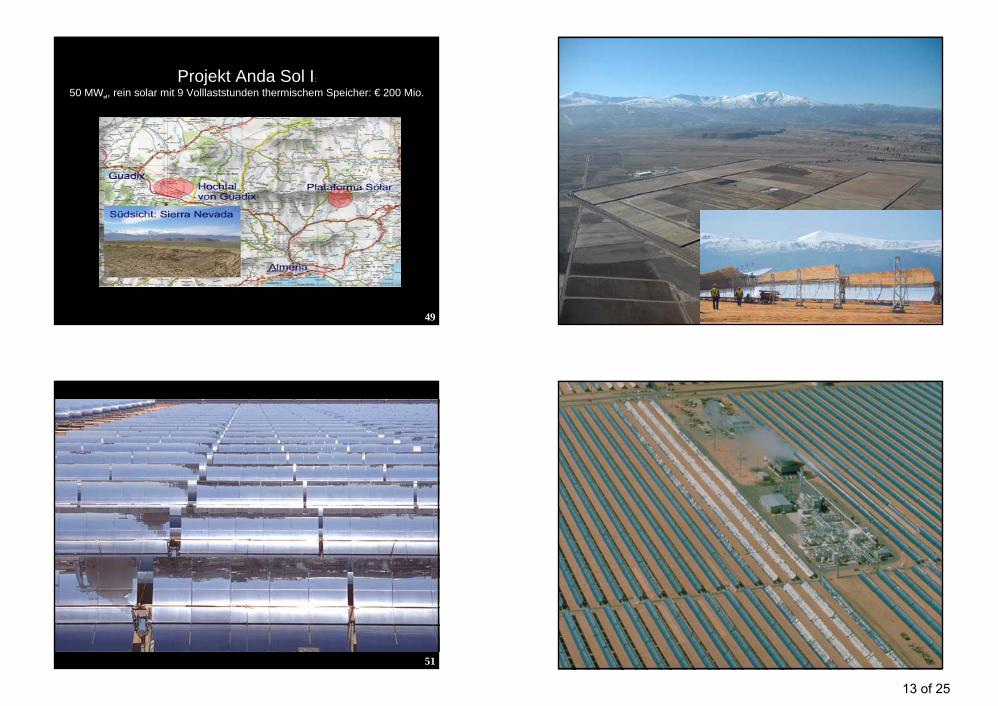
Projekt Anda Sol I:
50 MWel, rein solar mit 9 Volllaststunden thermischem Speicher: € 200 Mio.
50
51 52
13 of 25

14
53
Jörg Schlaich
54
55 56
14 of 25

15
57 58
59 60
Hx A~PelA
HGlobal Solar Radiation G
(W/m²)
15 of 25

16
61 62
63 64
16 of 25

17
65 66
67 68
17 of 25
18
69 70
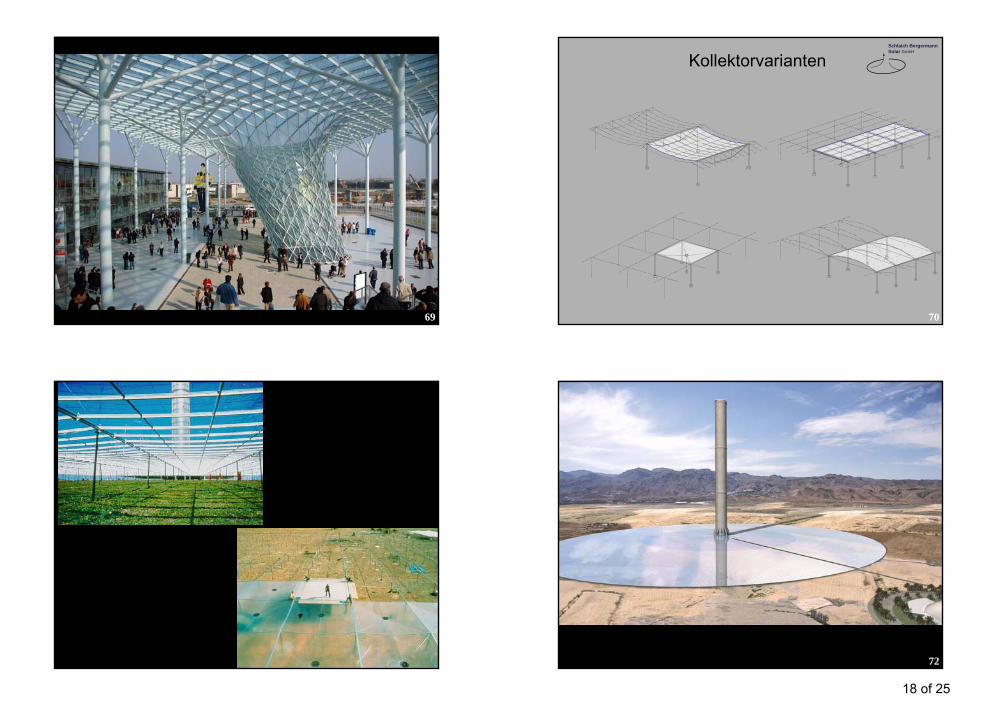
KollektorvariantenSchlaich BergermannSolar GmbH
71 72
18 of 25
19
73
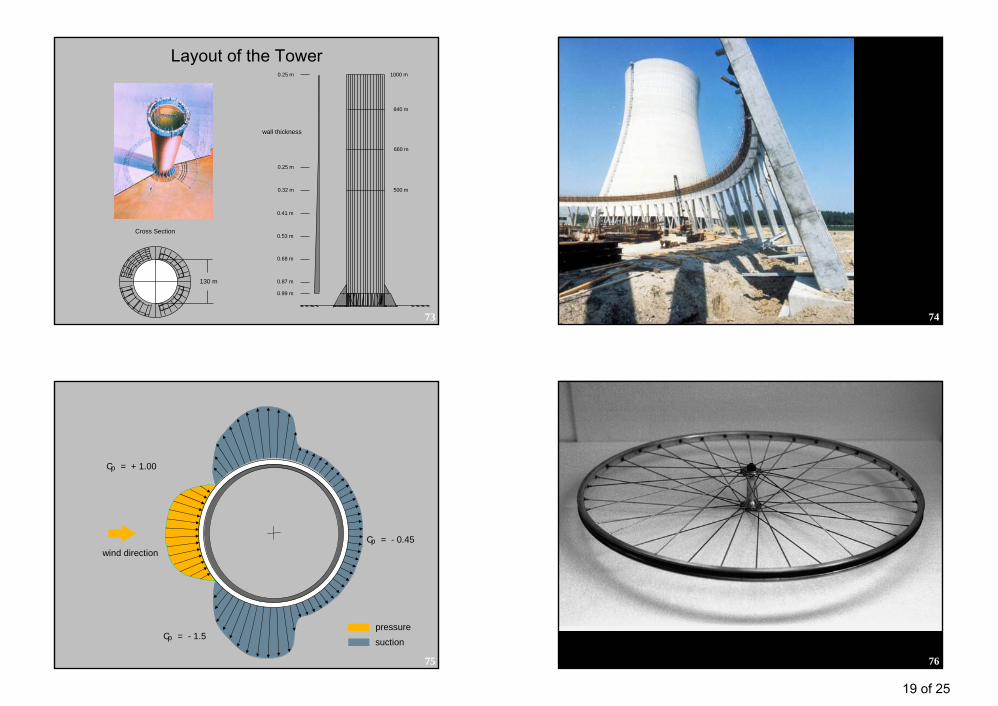
Layout of the Tower
Cross Section
130 m
wall thickness
0.25 m
840 m
660 m
500 m
0.25 m
0.99 m
0.87 m
0.68 m
0.53 m
0.41 m
0.32 m
1000 m
74
75
wind direction
pressure
suction
C = + 1.00p
C = - 0.45p
C = - 1.5p
76
19 of 25
20
77
85 80 65 43 15 -15 -43 -65 -8010
0 200 30
0 400 50
0 600 70
0 800 90
0
1000
-60
-45
-30
-15
0
15
30
45
85 80 65 43 15 -15 -43 -65 -8010
0 200 30
0 400 50
0 600 70
0 800 90
0
1000
p
85 80 65 43 15 -15 -43 -65 -80
100 20
0 300 40
0 500 60
0 700 80
0 900
1000
-60
-45
-30
-15
0
15
30
45
85 80 65 43 15 -15 -43 -65 -80
100 20
0 300 40
0 500 60
0 700 80
0 900
1000
p
85 80 65 43 15 -15 -43 -65 -80
100 20
0 300 40
0 500 60
0 700 80
0 900
1000
-60
-45
-30
-15
0
15
30
45
85 80 65 43 15 -15 -43 -65 -80
100 20
0 300 40
0 500 60
0 700 80
0 900
1000
85 80 65 43 15 -15 -43 -65 -80
100 20
0 300 40
0 500 60
0 700 80
0 900
1000
-60
-45
-30
-15
0
15
30
45
85 80 65 43 15 -15 -43 -65 -80
100 20
0 300 40
0 500 60
0 700 80
0 900
1000
diameter [m] radius [m]
mer
idia
nst
ress
[MP
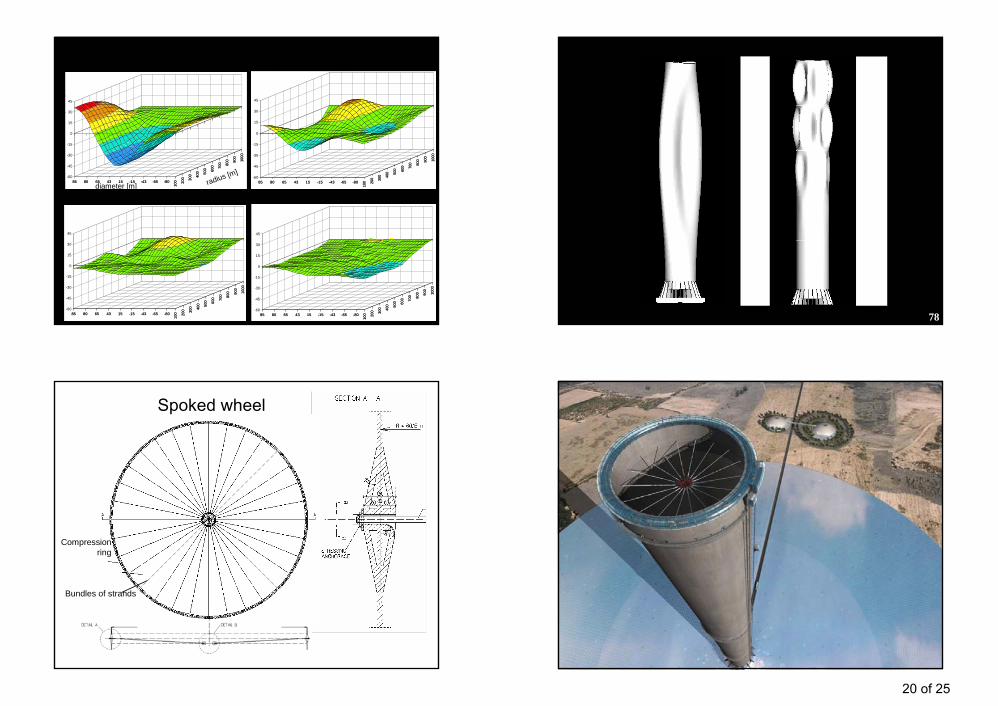
a]structural behaviour without spoked wheel structural behaviour with 1 spoked wheel at 1000 m
structural behaviour with 2 spoked wheels at 500 and 1000 m structural behaviour with 4 spoked wheels at 500, 600, 850 and 1000 m
78Bild G3-14: Schwingungsfigur ohne und mit Speichenräder (Animation)
79
Compressionring
Bundles of strands
Spoked wheel
80
20 of 25

21
81
Plan view and elevation of FEM ModelSchlaich BergermannSolar GmbH
82
Einbau zur StrömungsoptimierungEinbau zur Strömungsoptimierung
83
One turbine Many Turbines
84
21 of 25
22
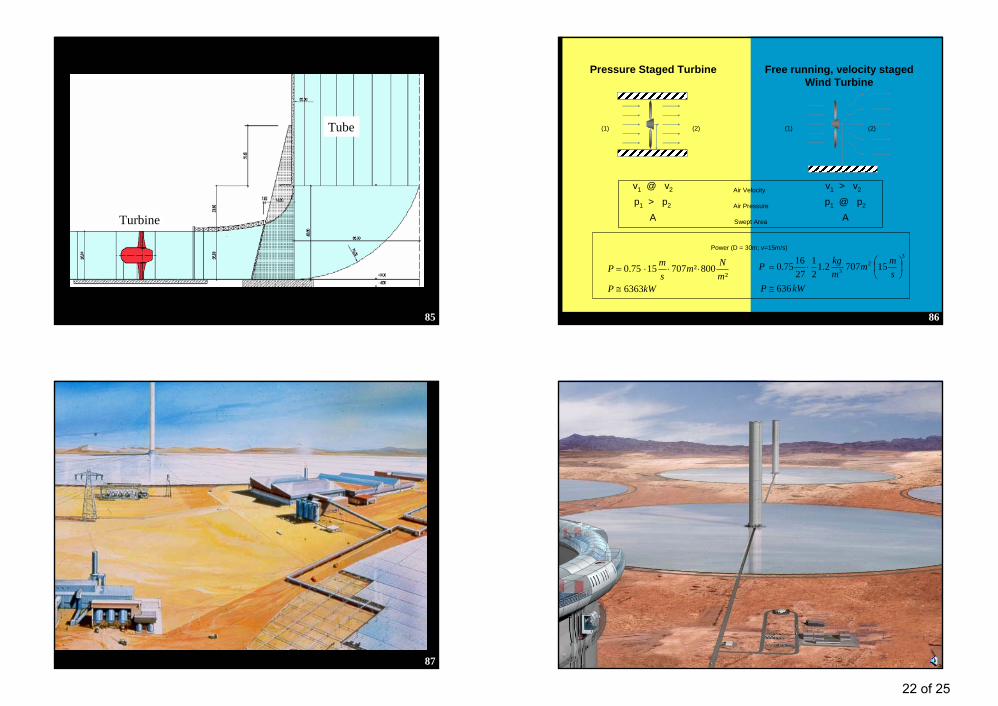
85
Turbine
Tube
86
Pressure Staged Turbine Free running, velocity staged Wind Turbine
(1) (2) (1) (2)
kWPmNm
smP
6363²
800²7071575.0
≅
⋅⋅⋅=
kWPsmm
mkgP
636
157072.121
271675.0
32
3
≅
⎟⎠⎞
⎜⎝⎛⋅=
Power (D = 30m; v=15m/s)
v1 @ v2 Air Velocity v1 > v2
Air Pressurep1 > p2 p1 @ p2
Swept AreaA A
87 88
22 of 25
23
89
Rudolf Bergermann
90
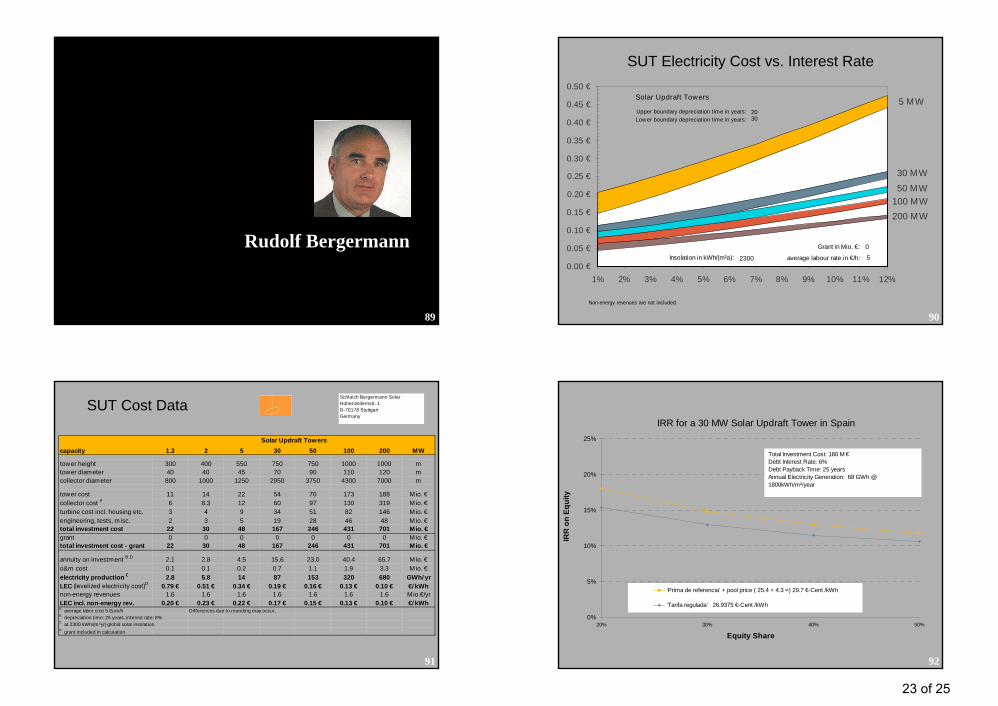
0.00 €
0.05 €
0.10 €
0.15 €
0.20 €
0.25 €
0.30 €
0.35 €
0.40 €
0.45 €
0.50 €
1% 2% 3% 4% 5% 6% 7% 8% 9% 10% 11% 12%
5 MW
30 MW
100 MW200 MW
Upper boundary depreciation t ime in years:Lower boundary depreciation t ime in years:
Solar Updraft Towers
5
Grant in Mio. €:
average labour rate in €/h:Insolation in kWh/(m²a):
50 MW
Non-energy revenues are not included.
2300
0
2030
SUT Electricity Cost vs. Interest Rate
91
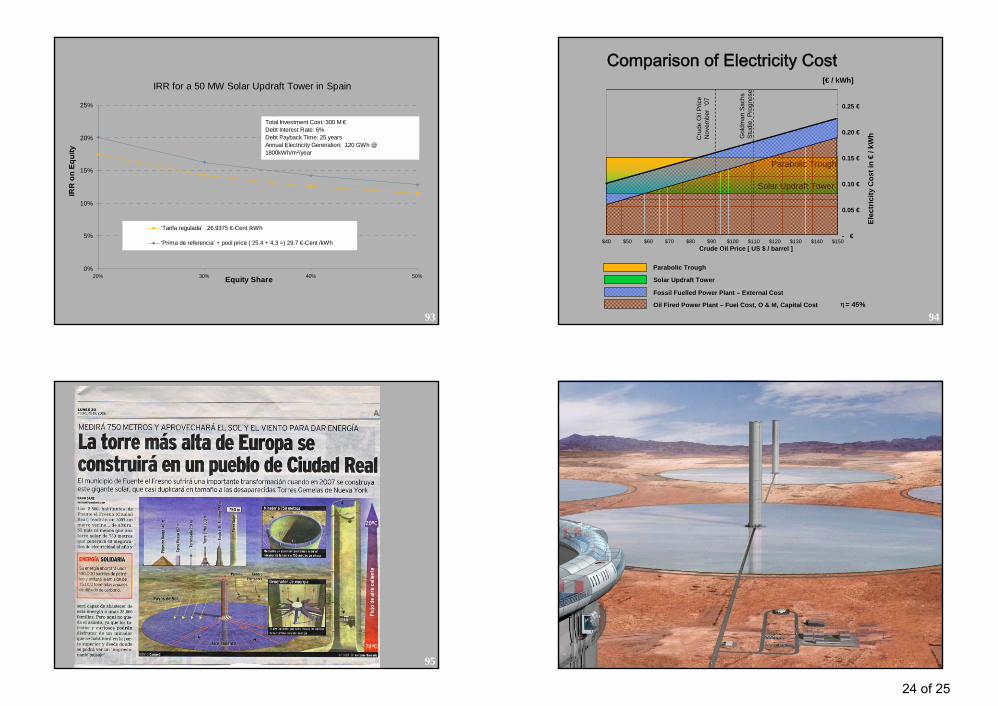
capacity 1.3 2 5 30 50 100 200 MW
tower height 300 400 550 750 750 1000 1000 mtower diameter 40 40 45 70 90 110 120 mcollector diameter 800 1000 1250 2950 3750 4300 7000 m
tower cost 11 14 22 54 70 173 188 Mio. €collector cost A 6 8.3 12 60 97 130 319 Mio. €turbine cost incl. housing etc. 3 4 9 34 51 82 146 Mio. €engineering, tests, misc. 2 3 5 19 28 46 48 Mio. €total investment cost 22 30 48 167 246 431 701 Mio. €grant 0 0 0 0 0 0 0 Mio. €total investment cost - grant 22 30 48 167 246 431 701 Mio. €
annuity on investment B,D 2.1 2.8 4.5 15.6 23.0 40.4 65.7 Mio. €o&m cost 0.1 0.1 0.2 0.7 1.1 1.9 3.3 Mio. €electricity production C 2.8 5.8 14 87 153 320 680 GWh/ yrLEC (levelized electricity cost)D 0.79 € 0.51 € 0.34 € 0.19 € 0.16 € 0.13 € 0.10 € €/ kWhnon-energy revenues 1.6 1.6 1.6 1.6 1.6 1.6 1.6 Mio.€/yrLEC incl. non-energy rev. 0.20 € 0.23 € 0.22 € 0.17 € 0.15 € 0.13 € 0.10 € €/ kWhA average labor cost 5 Euro/h Differences due to rounding may occur.B depreciation time: 25 years, interest rate: 8%C at 2300 kWh/(m²yr) global solar insolationD grant included in calculation
Solar Updraft Towers
Schlaich Bergermann SolarHohenzollernstr. 1D-70178 StuttgartGermany
SUT Cost Data
92
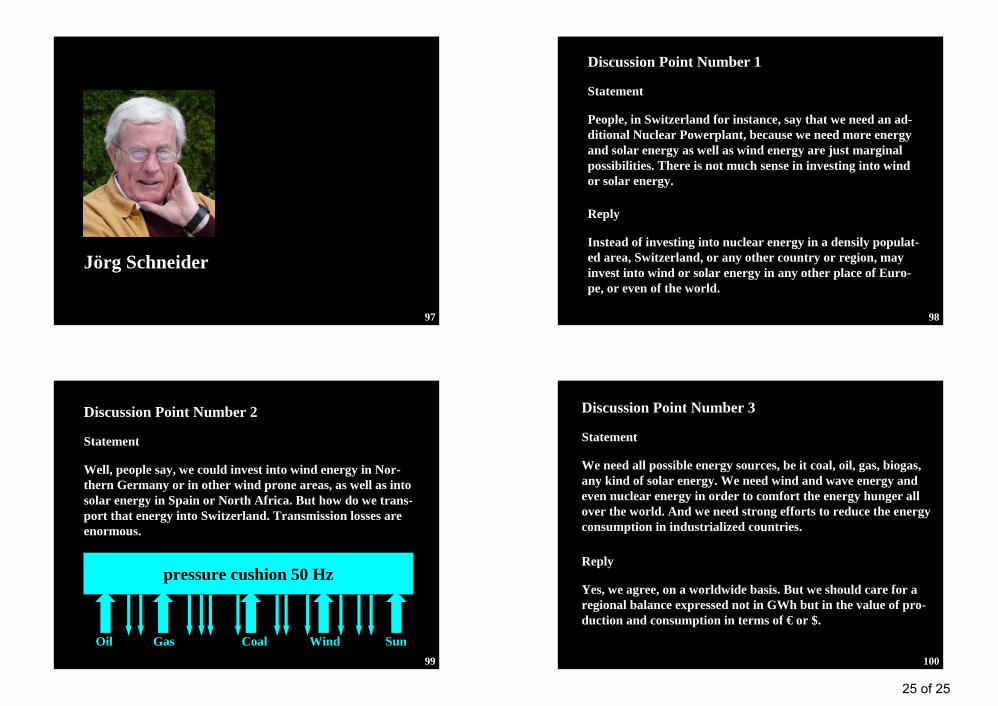
IRR for a 30 MW Solar Updraft Tower in Spain
0%
5%
10%
15%
20%
25%
20% 30% 40% 50%
Equity Share
IRR
on
Equi
ty
‘Prima de referencia’ + pool price ( 25.4 + 4.3 =) 29.7 €-Cent /kWh
‘Tarifa regulada’ 26.9375 €-Cent /kWh
Total Investment Cost: 180 M €Debt Interest Rate: 6%Debt Payback Time: 25 yearsAnnual Electricity Generation: 68 GWh @ 1800kWh/m²/year
23 of 25
24
93
IRR for a 50 MW Solar Updraft Tower in Spain
0%
5%
10%
15%
20%
25%
20% 30% 40% 50%Equity Share
IRR
on
Equi
ty
‘Tarifa regulada’ 26.9375 €-Cent /kWh
‘Prima de referencia’ + pool price ( 25.4 + 4.3 =) 29.7 €-Cent /kWh
Total Investment Cost: 300 M €Debt Interest Rate: 6%Debt Payback Time: 25 yearsAnnual Electricity Generation: 120 GWh @ 1800kWh/m²/year
94
Solar Updraft Tower
Parabolic Trough
Solar Updraft Tower
Parabolic Trough
Comparison of Electricity Cost
$40 $50 $60 $70 $80 $90 $100 $110 $120 $130 $140 $150Crude Oil Price [ US $ / barrel ]
- €
Cru
de O
il Pr
ice
Nov
embe
r ‘0
7
Gol
dman
Sac
hs
Stud
ie, P
rogn
ose
Fossil Fuelled Power Plant – External Cost
η = 45%Oil Fired Power Plant – Fuel Cost, O & M, Capital Cost
[€ / kWh]
0.05 €
0.10 €
0.15 €
0.20 €
0.25 €
Elec
tric
ity C
ost i
n €
/ kW
h
95 96
24 of 25
25
97
Jörg Schneider
98
Discussion Point Number 1
Statement
People, in Switzerland for instance, say that we need an ad-ditional Nuclear Powerplant, because we need more energy and solar energy as well as wind energy are just marginal possibilities. There is not much sense in investing into wind or solar energy.
Reply
Instead of investing into nuclear energy in a densily populat-ed area, Switzerland, or any other country or region, may invest into wind or solar energy in any other place of Euro-pe, or even of the world.
99
Discussion Point Number 2
Statement
Well, people say, we could invest into wind energy in Nor-thern Germany or in other wind prone areas, as well as into solar energy in Spain or North Africa. But how do we trans-port that energy into Switzerland. Transmission losses are enormous.
pressure cushion 50 Hz
Oil Gas Coal Wind Sun100
Discussion Point Number 3
Statement
We need all possible energy sources, be it coal, oil, gas, biogas, any kind of solar energy. We need wind and wave energy and even nuclear energy in order to comfort the energy hunger all over the world. And we need strong efforts to reduce the energy consumption in industrialized countries.
Reply
Yes, we agree, on a worldwide basis. But we should care for a regional balance expressed not in GWh but in the value of pro-duction and consumption in terms of € or $.
25 of 25


![RION - ANTIRIONthost-iabse-elearning.org/video3/Rion Antirion Bridge_Handouts.pdf · 30-may-09 2 sand and gravel clay weak alluviums : 65 m. rion antirion silt g] 1.2 g design spectrum](https://img.pdfslide.net/doc/110x75/5f0cd03b7e708231d437420f/rion-antirionthost-iabse-antirion-bridgehandoutspdf-30-may-09-2-sand-and.jpg)