Embed Size (px)
Citation preview
INTERNATIONAL ASSOCIATION
OF DRILLING CONTRACTORS
IADC Incident Statistics
Joe Hurt IADC Vice President Land
IADC Mission Statement
Our mission: promote
commitment to safety,
preservation of the environment
and advances in drilling
technology.
IADC Mission Statement
Inattention
Carelessness
Compliancy
What gives us
Incident Statistics?
ACCEPTANCE OF DEVIANCE
SWAY
NORMALIZATION
What gives us
Incident Statistics?
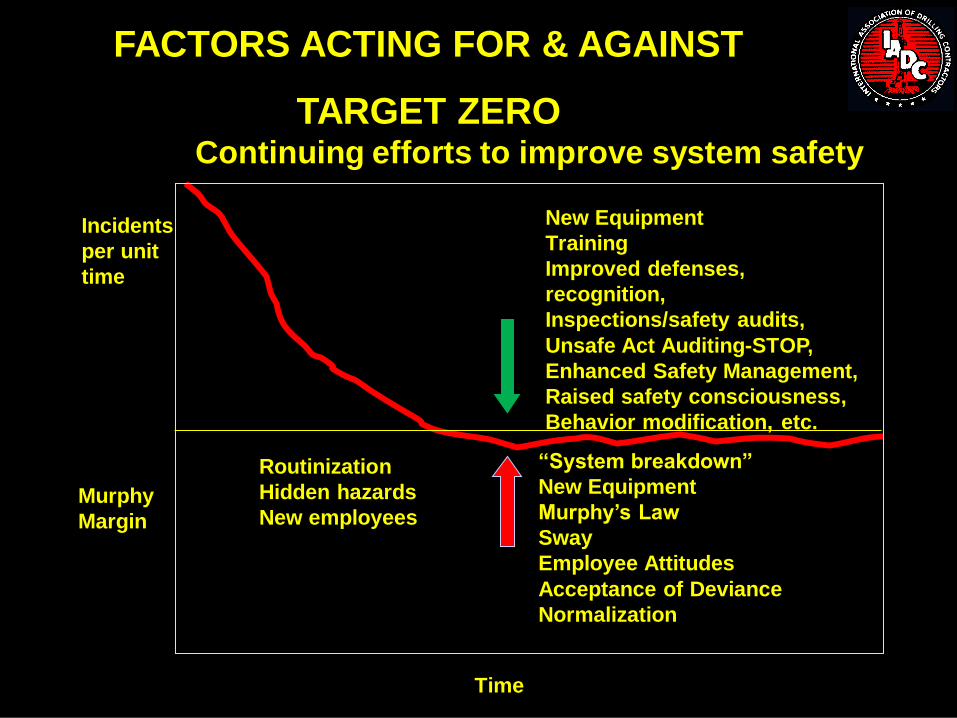
FACTORS ACTING FOR & AGAINST
TARGET ZERO
New Equipment
Training
Improved defenses,
recognition,
Inspections/safety audits,
Unsafe Act Auditing-STOP,
Enhanced Safety Management,
Raised safety consciousness,
Behavior modification, etc.
Incidents
per unit
time
Murphy
Margin
“System breakdown”
New Equipment
Murphy’s Law
Sway
Employee Attitudes
Acceptance of Deviance
Normalization
Routinization
Hidden hazards
New employees
Time
Continuing efforts to improve system safety
IADC Incident Statistics
Injuries don't just change
statistics; they change
lives!
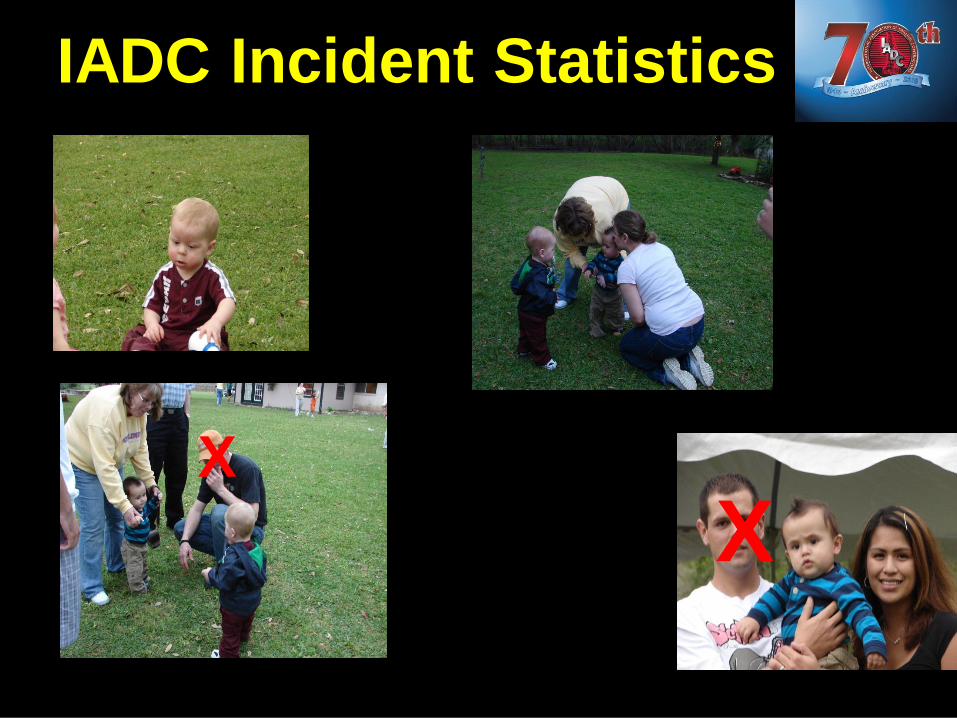
IADC Incident Statistics
X
X
IADC Incident Statistics
SO, HOW DO WE
KEEP OUR
EMPLOYEES FROM
BEING INJURED???
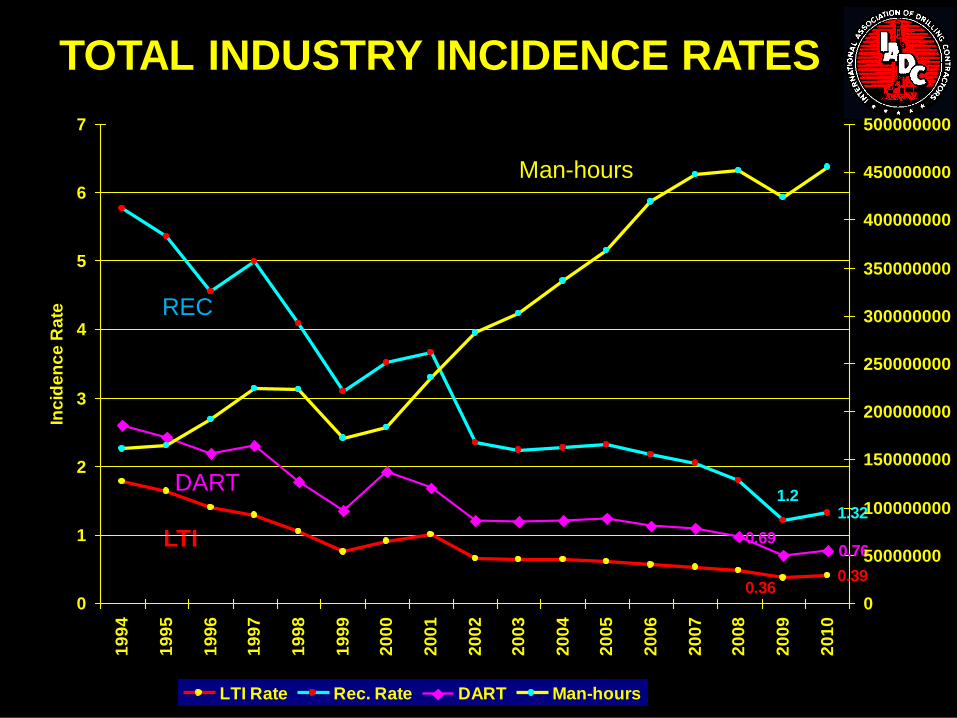
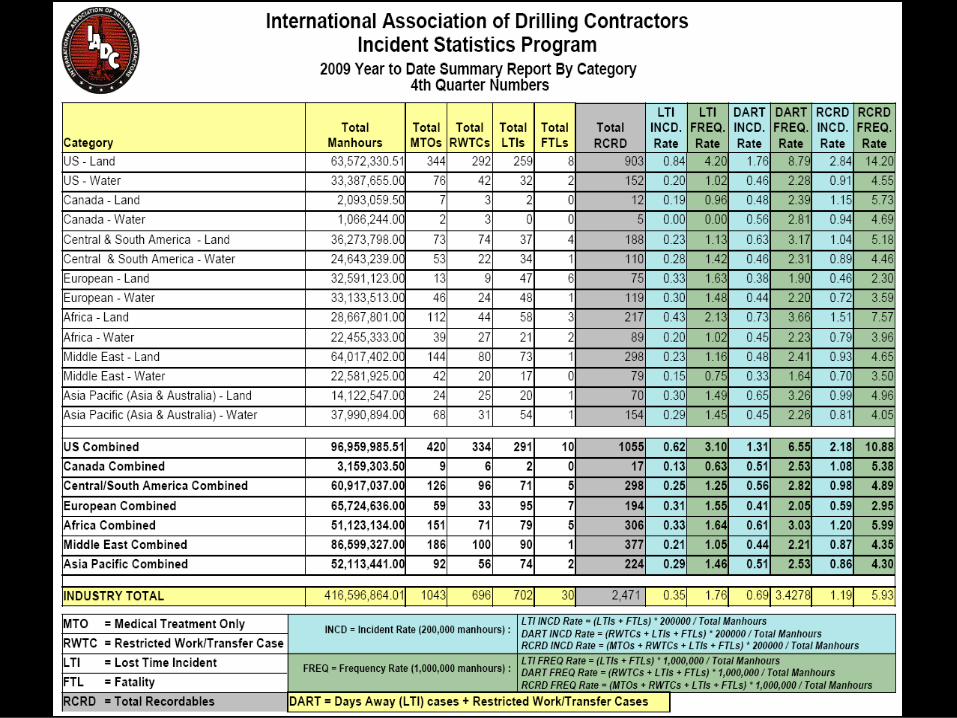
TOTAL INDUSTRY INCIDENCE RATES
LTI
Man-hours
REC
DART
0.360.39
1.21.32
0.690.76
0
1
2
3
4
5
6
71
99
4
19
95
19
96
19
97
19
98
19
99
20
00
20
01
20
02
20
03
20
04
20
05
20
06
20
07
20
08
20
09
20
10
Inc
ide
nc
e R
ate
0
50000000
100000000
150000000
200000000
250000000
300000000
350000000
400000000
450000000
500000000
Man
-ho
urs
LTI Rate Rec. Rate DART Man-hours
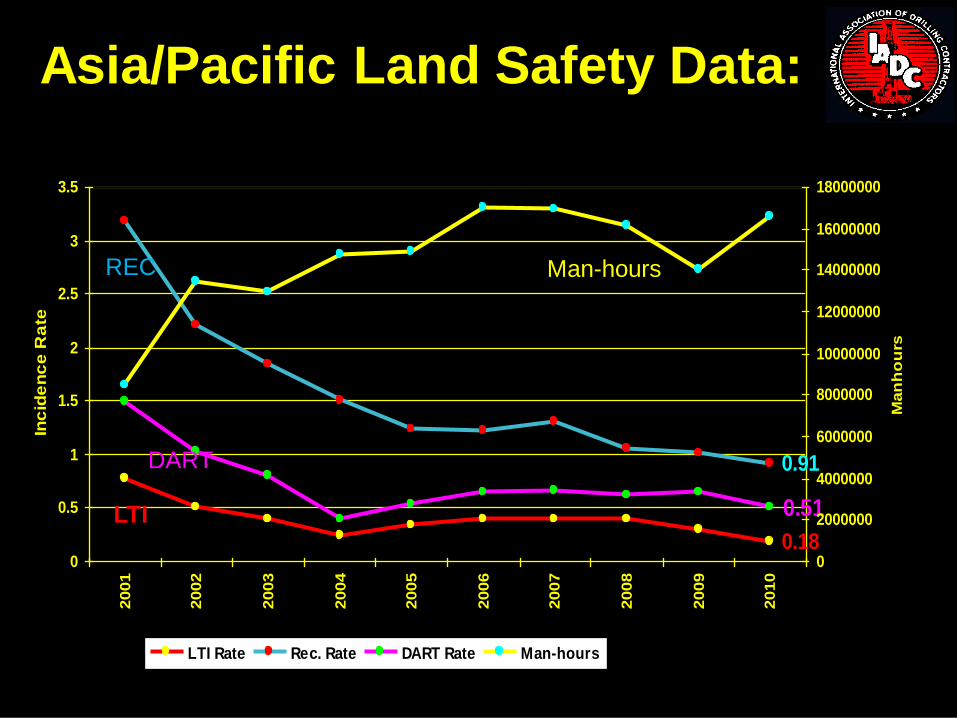
Asia/Pacific Land Safety Data:
0.18
0.91
0.51
0
0.5
1
1.5
2
2.5
3
3.5
2001
2002
2003
2004
2005
2006
2007
2008
2009
2010
Inc
ide
nc
e R
ate
0
2000000
4000000
6000000
8000000
10000000
12000000
14000000
16000000
18000000
Man
ho
urs
LTI Rate Rec. Rate DART Rate Man-hours
Man-hours REC
DART
LTI
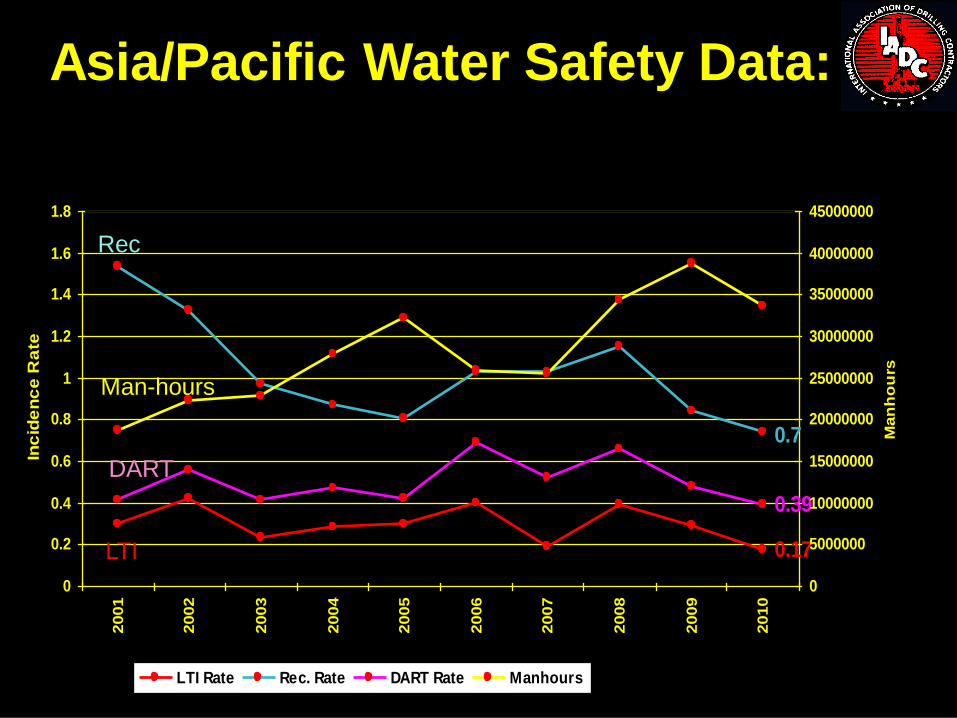
Asia/Pacific Water Safety Data:
0.17
0.74
0.39
0
0.2
0.4
0.6
0.8
1
1.2
1.4
1.6
1.8
2001
2002
2003
2004
2005
2006
2007
2008
2009
2010
Inc
ide
nc
e R
ate
0
5000000
10000000
15000000
20000000
25000000
30000000
35000000
40000000
45000000
Man
ho
urs
LTI Rate Rec. Rate DART Rate Manhours
Man-hours
Rec
DART
LTI
Man-hours
Fatalities
3332
0
10
20
30
40
50
60
70
80
901
98
0
19
81
19
82
19
83
19
84
19
85
19
86
19
87
19
88
19
89
19
90
19
91
19
92
19
93
19
94
19
95
19
96
19
97
19
98
19
99
20
00
20
01
20
02
20
03
20
04
20
05
20
06
20
07
20
08
20
09
20
10
Nu
mb
er
of
Fata
liti
es
0
50000000
100000000
150000000
200000000
250000000
300000000
350000000
400000000
450000000
500000000
Man
-ho
urs
Fatalities Man-hours
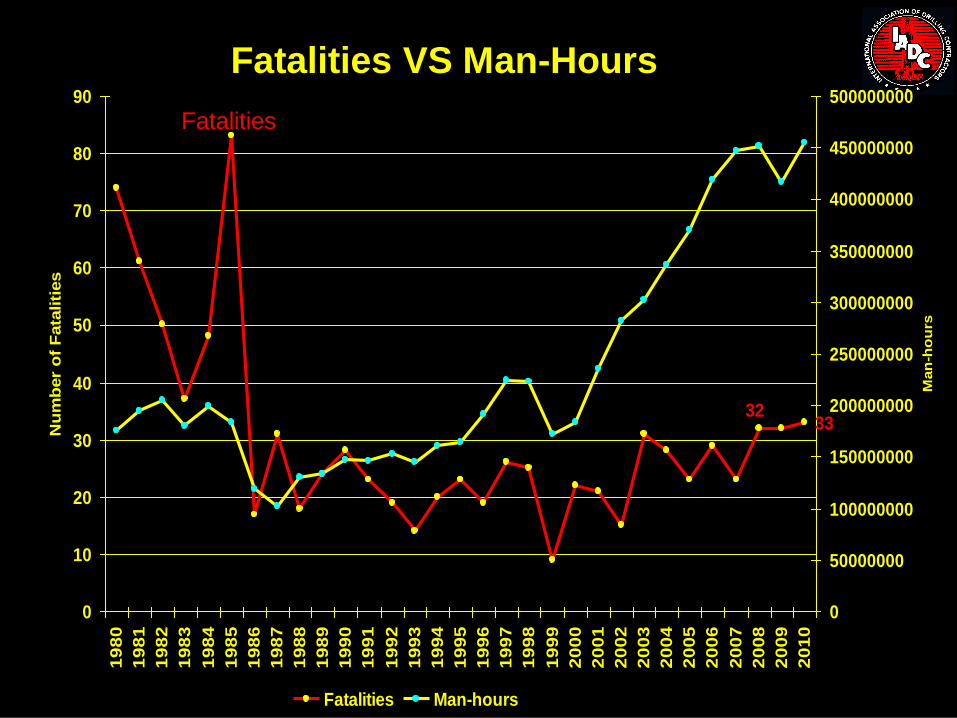
Total Industry Fatalities VS Fatalities VS Man-Hours
Man-hours
Fatalities
3332
0
10
20
30
40
50
60
70
80
901
98
0
19
81
19
82
19
83
19
84
19
85
19
86
19
87
19
88
19
89
19
90
19
91
19
92
19
93
19
94
19
95
19
96
19
97
19
98
19
99
20
00
20
01
20
02
20
03
20
04
20
05
20
06
20
07
20
08
20
09
20
10
Nu
mb
er
of
Fata
liti
es
0
50000000
100000000
150000000
200000000
250000000
300000000
350000000
400000000
450000000
500000000
Man
-ho
urs
Fatalities Man-hours
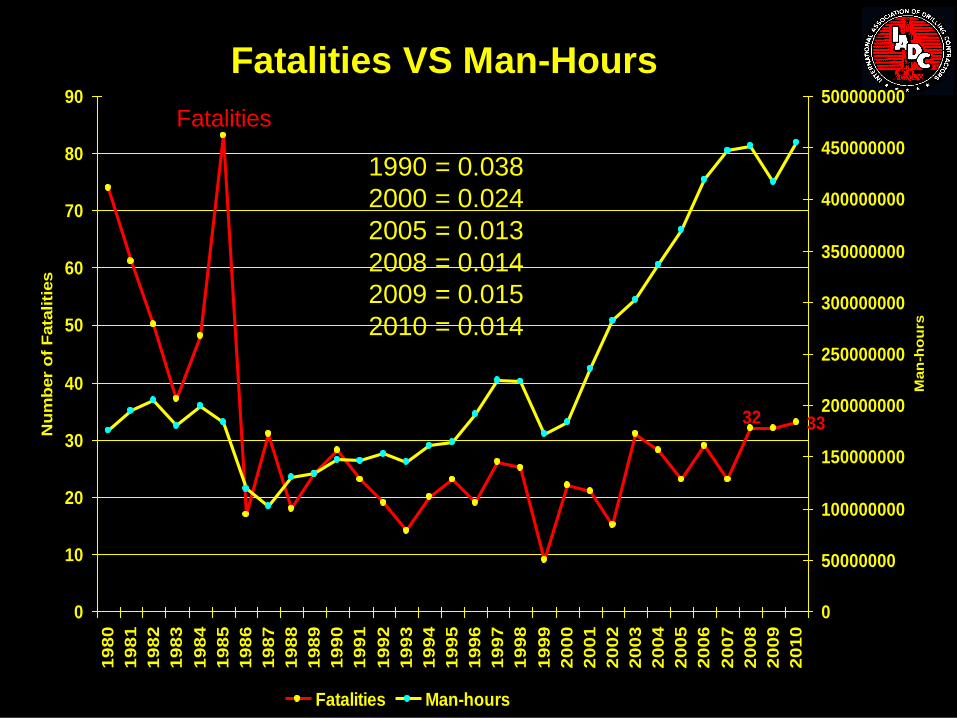
Fatalities VS Man-Hours
1990 = 0.038
2000 = 0.024
2005 = 0.013
2008 = 0.014
2009 = 0.015
2010 = 0.014
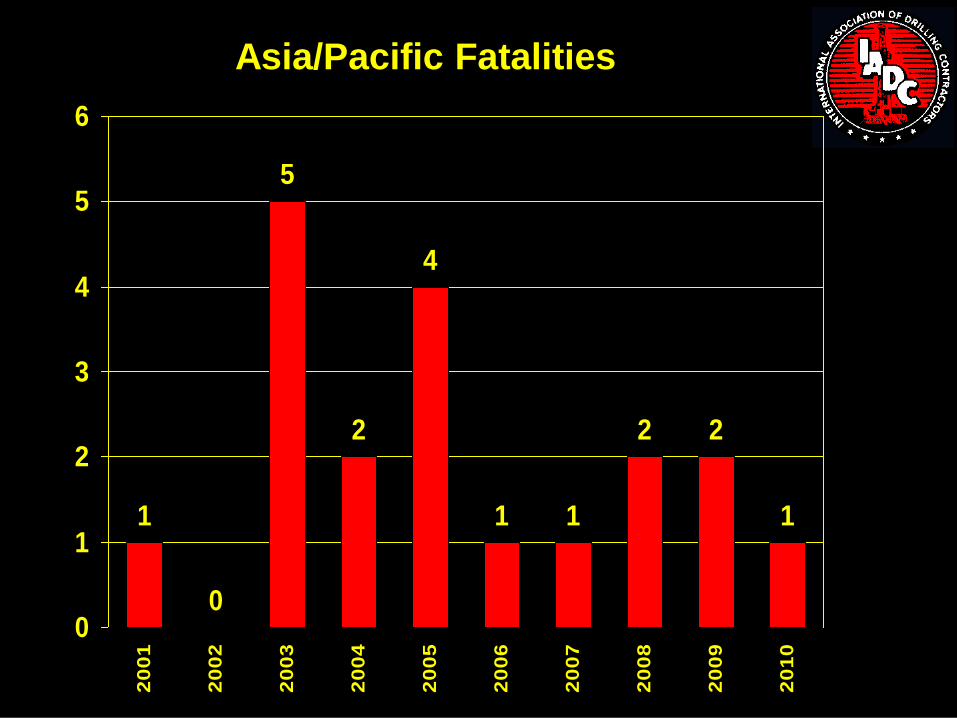
Asia/Pacific Fatalities
1
0
5
2
4
1 1
2 2
1
0
1
2
3
4
5
62
00
1
20
02
20
03
20
04
20
05
20
06
20
07
20
08
20
09
20
10
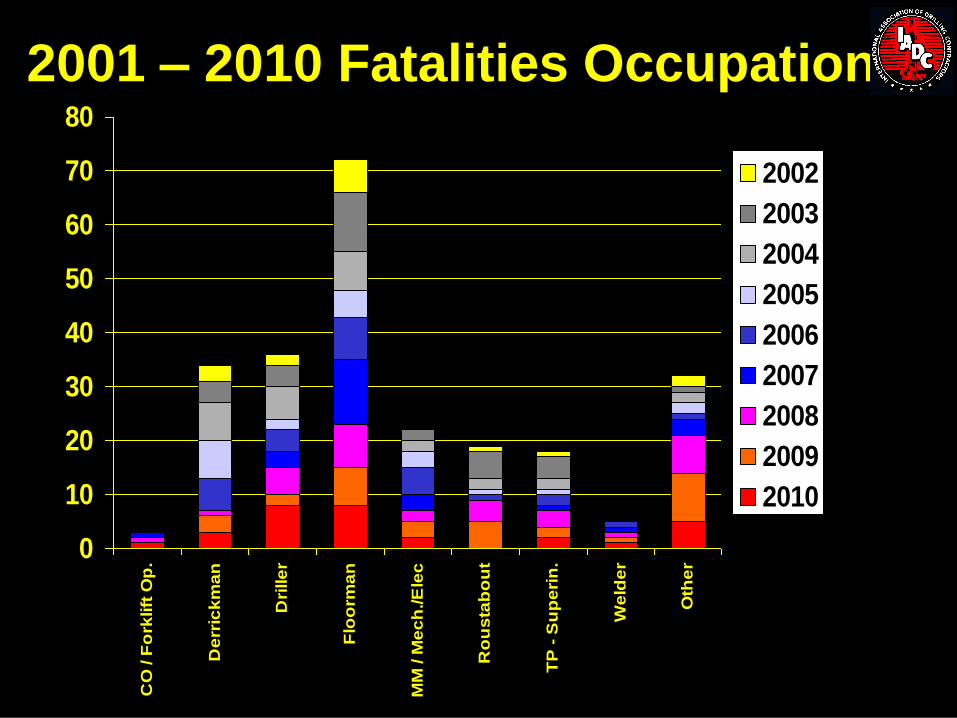
2001 – 2010 Fatalities Occupation
0
10
20
30
40
50
60
70
80C
O / F
ork
lift
Op
.
De
rric
km
an
Dri
lle
r
Flo
orm
an
MM
/ M
ec
h./E
lec
Ro
us
tab
ou
t
TP
- S
up
eri
n.
We
lde
r
Oth
er
2002
2003
2004
2005
2006
2007
2008
2009
2010
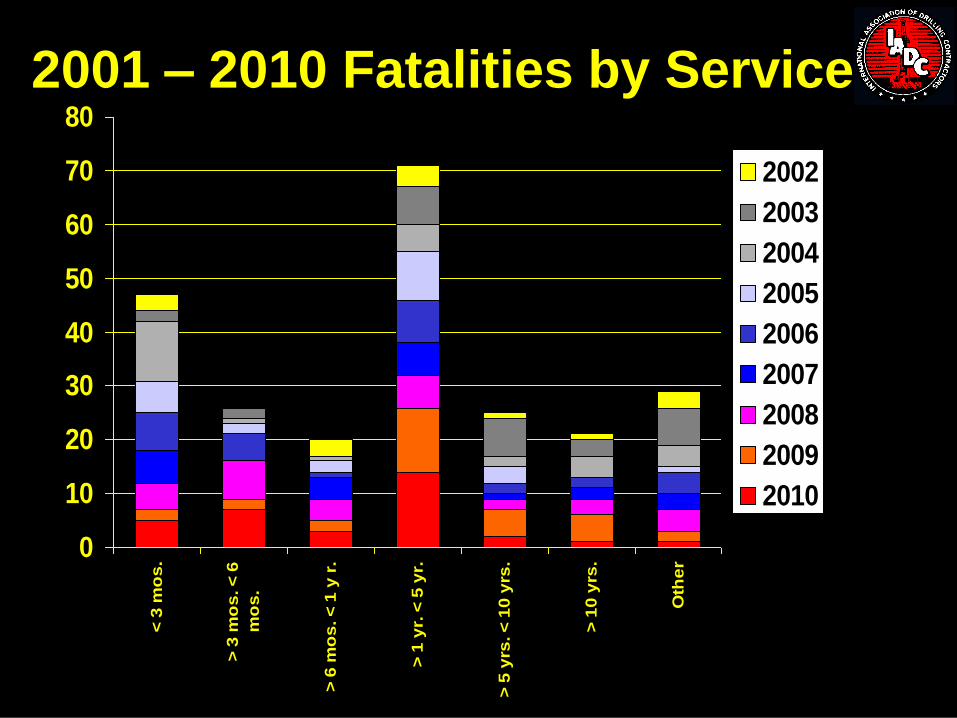
2001 – 2010 Fatalities by Service
0
10
20
30
40
50
60
70
80
< 3
mo
s.
> 3
mo
s. <
6
mo
s.
> 6
mo
s. <
1 y
r.
> 1
yr.
< 5
yr.
> 5
yrs
. <
10
yrs
.
> 1
0 y
rs.
Oth
er
2002
2003
2004
2005
2006
2007
2008
2009
2010
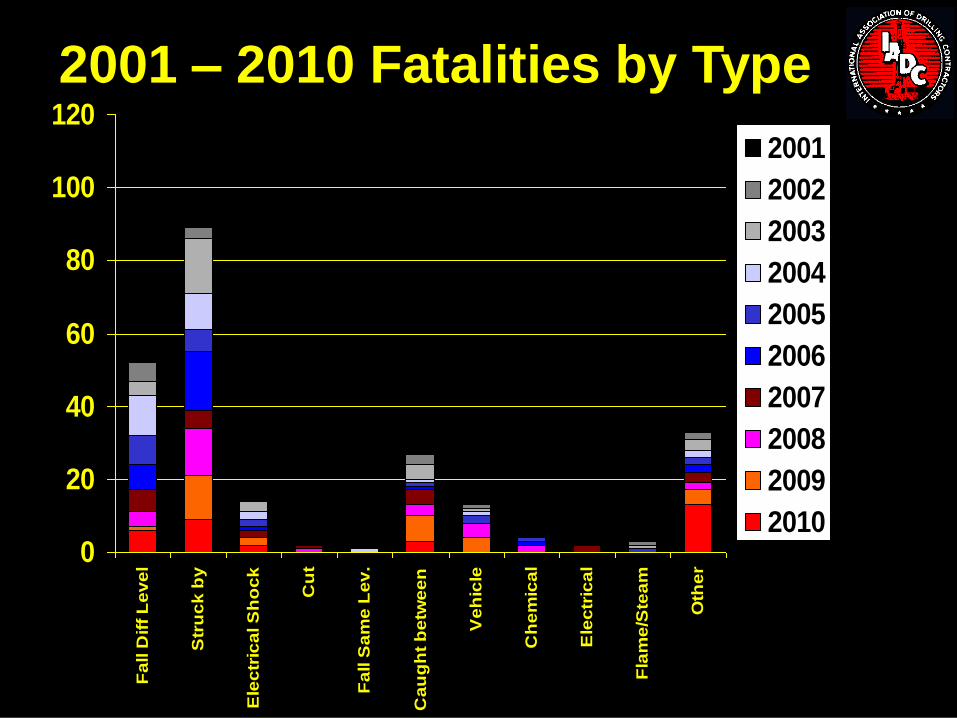
2001 – 2010 Fatalities by Type
0
20
40
60
80
100
120F
all D
iff
Le
ve
l
Str
uc
k b
y
Ele
ctr
ica
l S
ho
ck
Cu
t
Fa
ll S
am
e L
ev
.
Ca
ug
ht
be
twe
en
Ve
hic
le
Ch
em
ica
l
Ele
ctr
ica
l
Fla
me
/Ste
am
Oth
er
2001
2002
2003
2004
2005
2006
2007
2008
2009
2010
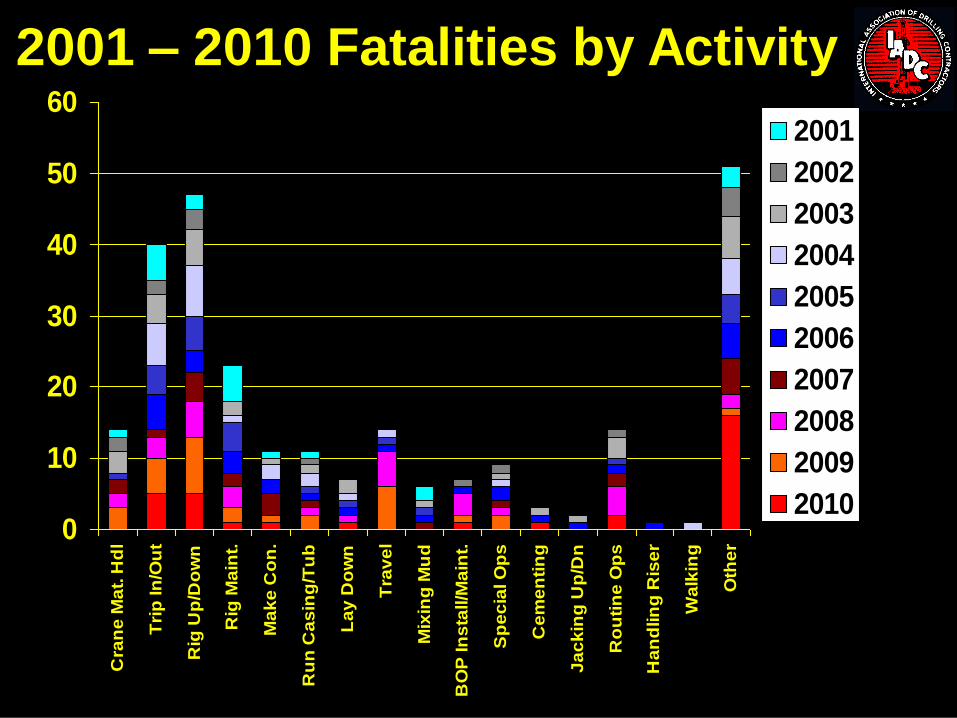
2001 – 2010 Fatalities by Activity
0
10
20
30
40
50
60C
ran
e M
at.
Hd
l
Tri
p In
/Ou
t
Rig
Up
/Do
wn
Rig
Ma
int.
Ma
ke
Co
n.
Ru
n C
as
ing
/Tu
b
La
y D
ow
n
Tra
ve
l
Mix
ing
Mu
d
BO
P In
sta
ll/M
ain
t.
Sp
ec
ial O
ps
Ce
me
nti
ng
Ja
ck
ing
Up
/Dn
Ro
uti
ne
Op
s
Ha
nd
lin
g R
ise
r
Wa
lkin
g
Oth
er
2001
2002
2003
2004
2005
2006
2007
2008
2009
2010
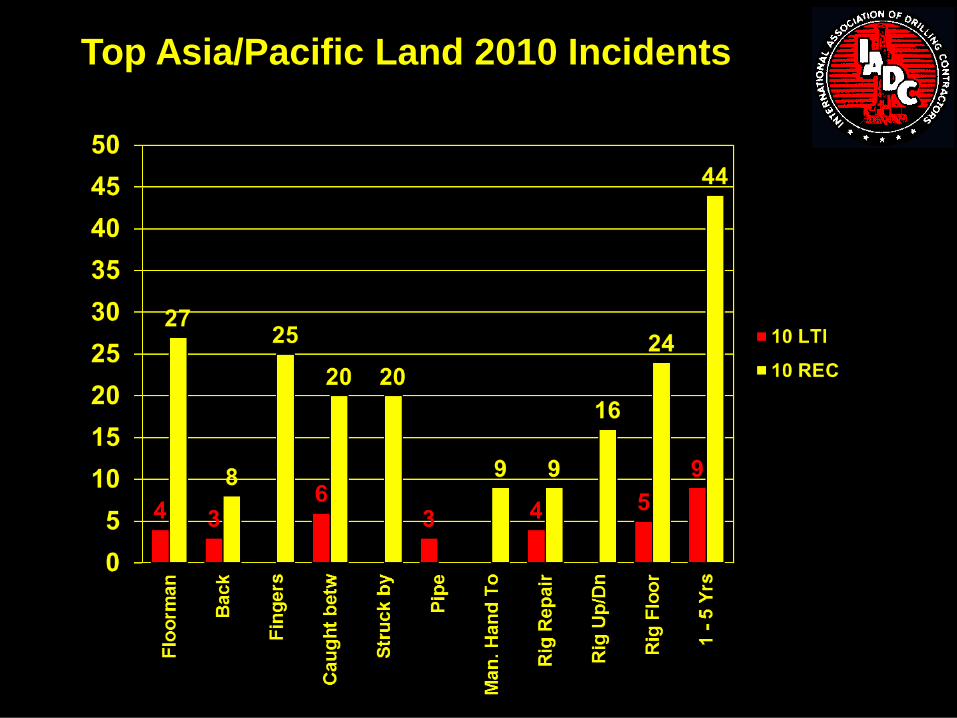
Top Asia/Pacific Land 2010 Incidents
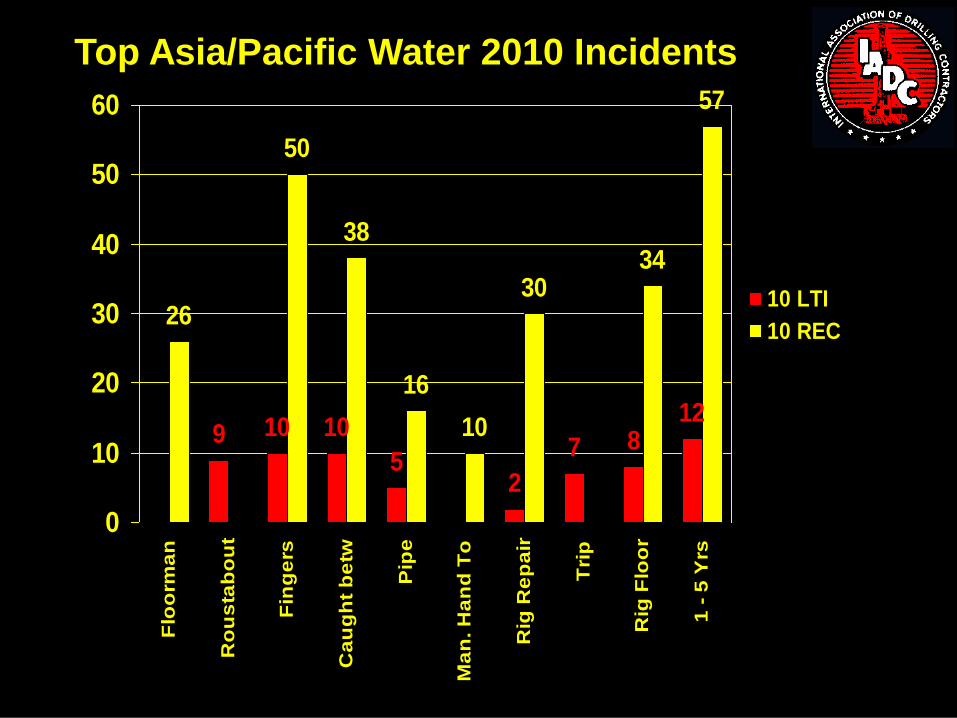
Top Asia/Pacific Water 2010 Incidents
9 10 10
52
7 812
26
50
38
16
10
3034
57
0
10
20
30
40
50
60
Flo
orm
an
Ro
us
tab
ou
t
Fin
ge
rs
Ca
ug
ht
be
tw
Pip
e
Ma
n. H
an
d T
o
Rig
Re
pa
ir
Tri
p
Rig
Flo
or
1 -
5 Y
rs
10 LTI
10 REC
IADC ISP 2011 Changes
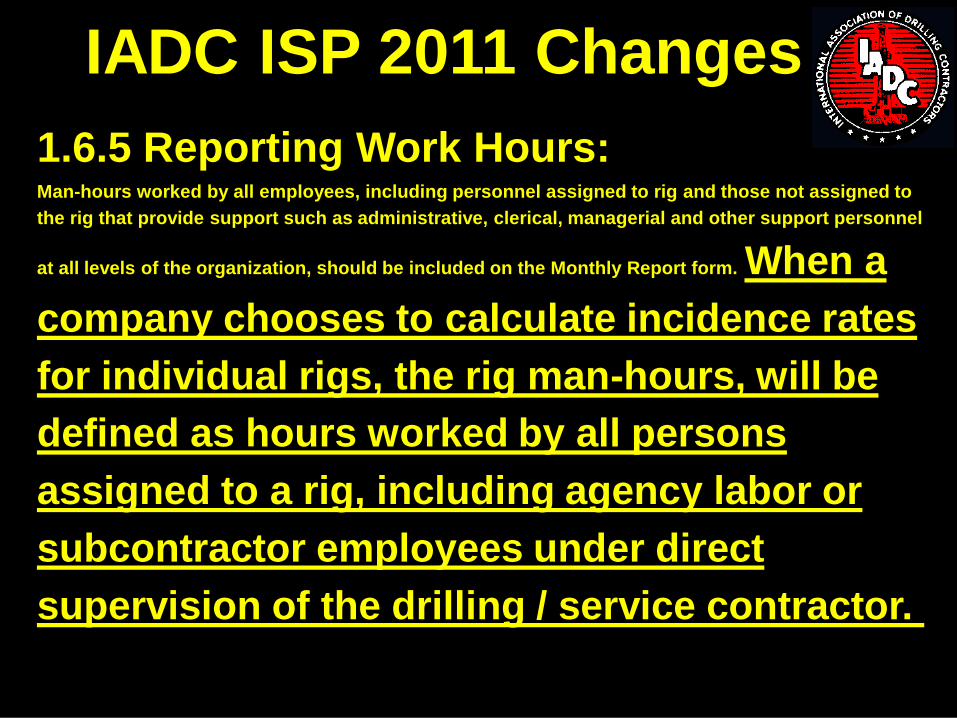
1.6.5 Reporting Work Hours: Man-hours worked by all employees, including personnel assigned to rig and those not assigned to
the rig that provide support such as administrative, clerical, managerial and other support personnel
at all levels of the organization, should be included on the Monthly Report form. When a
company chooses to calculate incidence rates
for individual rigs, the rig man-hours, will be
defined as hours worked by all persons
assigned to a rig, including agency labor or
subcontractor employees under direct
supervision of the drilling / service contractor.
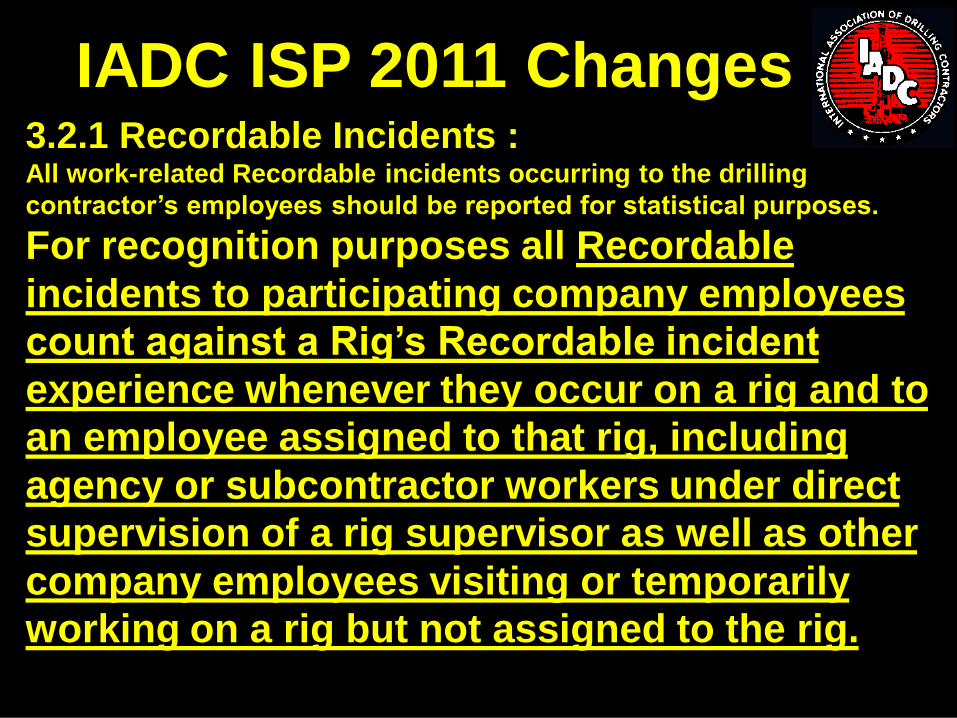
IADC ISP 2011 Changes 3.2.1 Recordable Incidents : All work-related Recordable incidents occurring to the drilling
contractor’s employees should be reported for statistical purposes.
For recognition purposes all Recordable
incidents to participating company employees
count against a Rig’s Recordable incident
experience whenever they occur on a rig and to
an employee assigned to that rig, including
agency or subcontractor workers under direct
supervision of a rig supervisor as well as other
company employees visiting or temporarily
working on a rig but not assigned to the rig.
IADC ISP 2011 Changes
3.2.2 Lost Time Incidents:
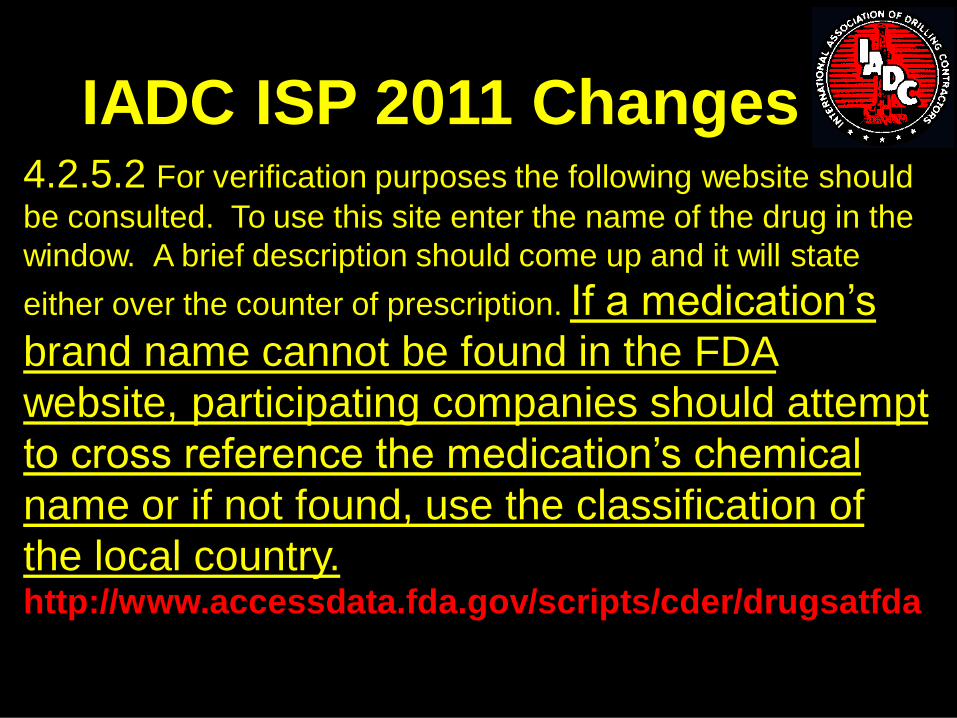
IADC ISP 2011 Changes 4.2.5.2 For verification purposes the following website should
be consulted. To use this site enter the name of the drug in the
window. A brief description should come up and it will state
either over the counter of prescription. If a medication’s
brand name cannot be found in the FDA
website, participating companies should attempt
to cross reference the medication’s chemical
name or if not found, use the classification of
the local country. http://www.accessdata.fda.gov/scripts/cder/drugsatfda
IADC ISP 2011 Changes
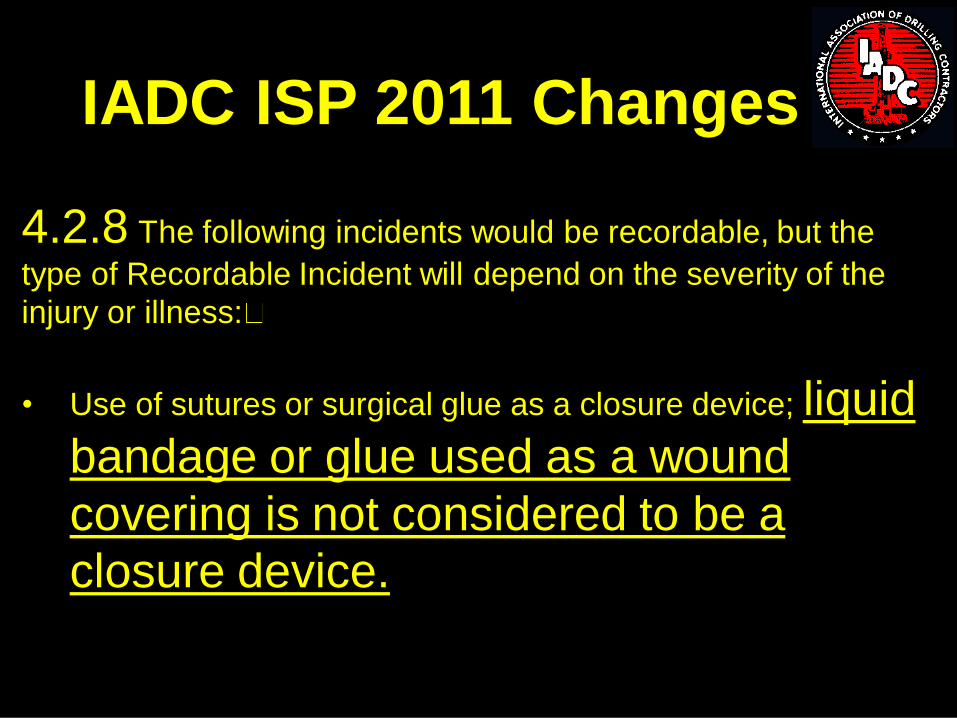
4.2.8 The following incidents would be recordable, but the
type of Recordable Incident will depend on the severity of the
injury or illness:
• Use of sutures or surgical glue as a closure device; liquid
bandage or glue used as a wound
covering is not considered to be a
closure device.
IADC ISP 2011 Changes
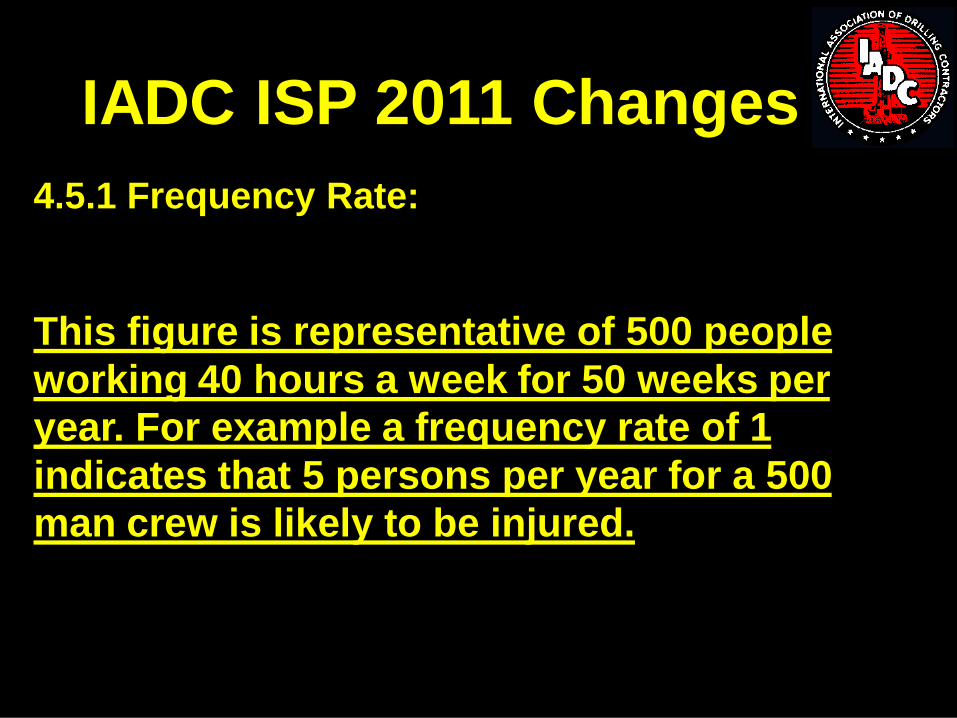
4.5.1 Frequency Rate:
This figure is representative of 500 people
working 40 hours a week for 50 weeks per
year. For example a frequency rate of 1
indicates that 5 persons per year for a 500
man crew is likely to be injured.
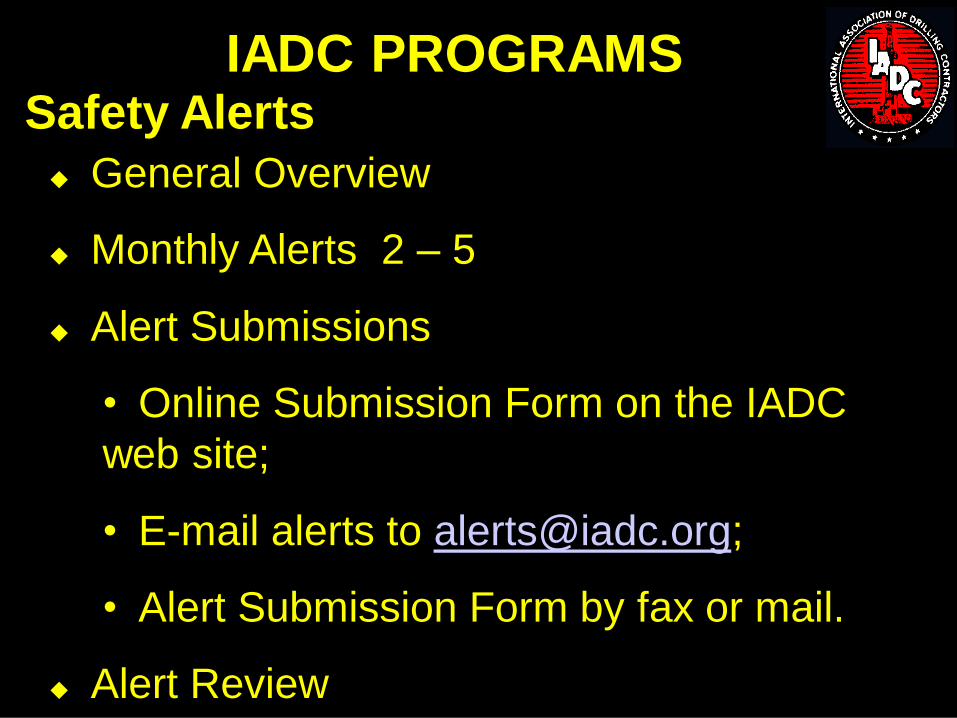
General Overview
Monthly Alerts 2 – 5
Alert Submissions
• Online Submission Form on the IADC
web site;
• E-mail alerts to [email protected];
• Alert Submission Form by fax or mail.
Alert Review
Safety Alerts
IADC PROGRAMS

QUESTIONS
?