Embed Size (px)
Citation preview

IAEA HUMAN HEALTH SERIESNo. 22
Body Composition Assessment from Birth to
Two Years of Age
IAEA HUMAN HEALTH SERIES
INTERNATIONAL ATOMIC ENERGY AGENCYVIENNA
ISBN 978–92–0–127710–7ISSN 2075–3772
This publication was developed by an international group of experts as an integral part of the IAEA’s efforts to contribute to the transfer of technology and capacity building in the use of nuclear and isotopic techniques to assist Member States in their efforts to improve the nutrition and health of infants and young children. To better defi ne and characterize healthy growth, there is a need for guidance on the use of standardized methodologies to assess body composition during early life. The book provides practical information on the assessment of body composition from birth up to 2 years of age and is intended for nutritionists, paediatricians and other health professionals.
IAEA HUMAN HEALTH SERIES

RELATED PUBLICATIONS
www.iaea.org/books
IAEA HUMAN HEALTH SERIES PUBLICATIONS
The mandate of the IAEA human health programme originates from Article II of its Statute, which states that the “Agency shall seek to accelerate and enlarge the contribution of atomic energy to peace, health and prosperity throughout the world”. The main objective of the human health programme is to enhance the capabilities of IAEA Member States in addressing issues related to the prevention, diagnosis and treatment of health problems through the development and application of nuclear techniques, within a framework of quality assurance.
Publications in the IAEA Human Health Series provide information in the areas of: radiation medicine, including diagnostic radiology, diagnostic and therapeutic nuclear medicine, and radiation therapy; dosimetry and medical radiation physics; and stable isotope techniques and other nuclear applications in nutrition. The publications have a broad readership and are aimed at medical practitioners, researchers and other professionals. International experts assist the IAEA Secretariat in drafting and reviewing these publications. Some of the publications in this series may also be endorsed or co-sponsored by international organizations and professional societies active in the relevant fields. There are two categories of publications in this series:
IAEA HUMAN HEALTH SERIESPublications in this category present analyses or provide information of an
advisory nature, for example guidelines, codes and standards of practice, and quality assurance manuals. Monographs and high level educational material, such as graduate texts, are also published in this series.
IAEA HUMAN HEALTH REPORTSHuman Health Reports complement information published in the IAEA Human
Health Series in areas of radiation medicine, dosimetry and medical radiation physics, and nutrition. These publications include reports of technical meetings, the results of IAEA coordinated research projects, interim reports on IAEA projects, and educational material compiled for IAEA training courses dealing with human health related subjects. In some cases, these reports may provide supporting material relating to publications issued in the IAEA Human Health Series.
All of these publications can be downloaded cost free from the IAEA web site:http://www.iaea.org/Publications/index.html
Further information is available from:Marketing and Sales UnitInternational Atomic Energy AgencyVienna International CentrePO Box 1001400 Vienna, Austria
Readers are invited to provide their impressions on these publications. Information may be provided via the IAEA web site, by mail at the address given above, or by email to:
ASSESSMENT OF BODY COMPOSITION AND TOTAL ENERGY EXPENDITURE IN HUMANS USING STABLE ISOTOPE TECHNIQUESIAEA Human Health Series No. 3STI/PUB/1370 (133 pp.; 2009)ISBN: 978-92-0-111708-3 Price: €38.00
INTRODUCTION TO BODY COMPOSITION ASSESSMENT USING THE DEUTERIUM DILUTION TECHNIQUE WITH ANALYSIS OF SALIVA SAMPLES BY FOURIER TRANSFORM INFRARED SPECTROMETRYIAEA Human Health Series No. 12STI/PUB/1450 (77 pp.; 2011)ISBN: 978-92-0-103210-2 Price: €37.00
INTRODUCTION TO BODY COMPOSITION ASSESSMENT USING THE DEUTERIUM DILUTION TECHNIQUE WITH ANALYSIS OF URINE SAMPLES BY ISOTOPE RATIO MASS SPECTROMETRYIAEA Human Health Series No. 13STI/PUB/1451 (65 pp.; 2011)ISBN: 978-92-0-103310-9 Price: €36.00
DUAL ENERGY X RAY ABSORPTIOMETRY FOR BONE MINERAL DENSITY AND BODY COMPOSITION ASSESSMENTIAEA Human Health Series No. 15STI/PUB/1479 (118 pp.; 2011)ISBN: 978-92-0-110610-0 Price: €50.00

BODY COMPOSITION ASSESSMENTFROM BIRTH
TO TWO YEARS OF AGE

AFGHANISTANALBANIAALGERIAANGOLAARGENTINAARMENIAAUSTRALIAAUSTRIAAZERBAIJANBAHRAINBANGLADESHBELARUSBELGIUMBELIZEBENINBOLIVIABOSNIA AND HERZEGOVINABOTSWANABRAZILBULGARIABURKINA FASOBURUNDICAMBODIACAMEROONCANADACENTRAL AFRICAN
REPUBLICCHADCHILECHINACOLOMBIACONGOCOSTA RICACÔTE D’IVOIRECROATIACUBACYPRUSCZECH REPUBLICDEMOCRATIC REPUBLIC
OF THE CONGODENMARKDOMINICADOMINICAN REPUBLICECUADOREGYPTEL SALVADORERITREAESTONIAETHIOPIAFIJIFINLANDFRANCEGABONGEORGIAGERMANYGHANAGREECE
GUATEMALAHAITIHOLY SEEHONDURASHUNGARYICELANDINDIAINDONESIAIRAN, ISLAMIC REPUBLIC OF IRAQIRELANDISRAELITALYJAMAICAJAPANJORDANKAZAKHSTANKENYAKOREA, REPUBLIC OFKUWAITKYRGYZSTANLAO PEOPLE’S DEMOCRATIC
REPUBLICLATVIALEBANONLESOTHOLIBERIALIBYALIECHTENSTEINLITHUANIALUXEMBOURGMADAGASCARMALAWIMALAYSIAMALIMALTAMARSHALL ISLANDSMAURITANIAMAURITIUSMEXICOMONACOMONGOLIAMONTENEGROMOROCCOMOZAMBIQUEMYANMARNAMIBIANEPALNETHERLANDSNEW ZEALANDNICARAGUANIGERNIGERIANORWAYOMANPAKISTANPALAU
PANAMAPAPUA NEW GUINEAPARAGUAYPERUPHILIPPINESPOLANDPORTUGALQATARREPUBLIC OF MOLDOVAROMANIARUSSIAN FEDERATIONRWANDASAUDI ARABIASENEGALSERBIASEYCHELLESSIERRA LEONESINGAPORESLOVAKIASLOVENIASOUTH AFRICASPAINSRI LANKASUDANSWAZILANDSWEDENSWITZERLANDSYRIAN ARAB REPUBLICTAJIKISTANTHAILANDTHE FORMER YUGOSLAV
REPUBLIC OF MACEDONIATOGOTRINIDAD AND TOBAGOTUNISIATURKEYUGANDAUKRAINEUNITED ARAB EMIRATESUNITED KINGDOM OF
GREAT BRITAIN AND NORTHERN IRELAND
UNITED REPUBLICOF TANZANIA
UNITED STATES OF AMERICAURUGUAYUZBEKISTANVENEZUELAVIETNAMYEMENZAMBIAZIMBABWE
The following States are Members of the International Atomic Energy Agency:
The Agency’s Statute was approved on 23 October 1956 by the Conference on the Statute of the IAEA held at United Nations Headquarters, New York; it entered into force on 29 July 1957. The Headquarters of the Agency are situated in Vienna. Its principal objective is “to accelerate and enlarge the contribution of atomic energy to peace, health and prosperity throughout the world’’.

IAEA HUMAN HEALTH SERIES No. 22
BODY COMPOSITION ASSESSMENTFROM BIRTH
TO TWO YEARS OF AGE
INTERNATIONAL ATOMIC ENERGY AGENCYVIENNA, 2013
IAEA Library Cataloguing in Publication Data
Body composition assessment from birth to two years of age. — Vienna : International Atomic Energy Agency, 2013.
COPYRIGHT NOTICE
All IAEA scientific and technical publications are protected by the terms of the Universal Copyright Convention as adopted in 1952 (Berne) and as revised in 1972 (Paris). The copyright has since been extended by the World Intellectual Property Organization (Geneva) to include electronic and virtual intellectual property. Permission to use whole or parts of texts contained in IAEA publications in printed or electronic form must be obtained and is usually subject to royalty agreements. Proposals for non-commercial reproductions and translations are welcomed and considered on a case-by-case basis. Enquiries should be addressed to the IAEA Publishing Section at:
Marketing and Sales Unit, Publishing SectionInternational Atomic Energy AgencyVienna International CentrePO Box 1001400 Vienna, Austriafax: +43 1 2600 29302tel.: +43 1 2600 22417email: [email protected] http://www.iaea.org/books
© IAEA, 2013
Printed by the IAEA in AustriaJune 2013
STI/PUB/1550
p. ; 24 cm. — (IAEA human health series, ISSN 2075–3772 ; no. 22)STI/PUB/1550ISBN 978–92–0–127710–7Includes bibliographical references.
1. Infants — Health. 2. Body composition — Measurement. 3. Body weight – Health aspects. I. International Atomic Energy Agency. II. Series.
IAEAL 12–00806

FOREWORD
During infancy and early childhood, the pace and quality of growth mark the risk of ill health in the short and longer term. Measurements of body weight and its changes are frequently taken as indicators of growth, without adequate attention being paid to linear growth or body composition during this critical window of opportunity, as these measurements are more challenging to make. To better define and characterize healthy growth, there is a need for guidance on the use of standardized methodologies to assess body composition during early life to differentiate between nutrient partitioning to fat free mass and to fat mass in infants and young children. Given the necessity for an international consensus, in 2009 the IAEA initiated a review of body composition assessment techniques as the basis for efforts aimed at the standardization of body composition assessment from birth to 2 years of age. This initiative follows the IAEA’s long standing tradition of providing guidance on the use of nuclear techniques in nutrition.
This publication was developed by an international group of experts as an integral part of the IAEA’s contribution to the transfer of technology and capacity building in this field to assist Member States in their efforts to improve the nutrition and health of infants and young children, who are among the most vulnerable population groups. This publication provides practical information on the assessment of body composition from birth up to 2 years of age and is intended for nutritionists, paediatricians and other health professionals. The body composition assessment techniques included in this publication were considered the methodologies with the highest potential for standardization globally — based on considerations such as access to equipment, cost and the training needs of staff — and include stable isotope dilution for total body water assessment as well as dual energy X ray absorptiometry and air displacement plethysmography. In addition, the importance of the standardization of anthropometric measurements is highlighted in this book, as basic measurements of body weight and length are crucial for accurate body composition assessment.
The IAEA is grateful to K. Ellis (USA), A.A. Jackson (UK) and J. Shepherd (USA) for generously sharing their extensive technical expertise in body composition assessment and paediatric nutrition. The IAEA officers responsible for this publication were L. Davidsson and C. Slater of the Division of Human Health.

EDITORIAL NOTE
This report does not address questions of responsibility, legal or otherwise, for acts or omissions on the part of any person.
Although great care has been taken to maintain the accuracy of information contained in this publication, neither the IAEA nor its Member States assume any responsibility for consequences which may arise from its use.
The use of particular designations of countries or territories does not imply any judgement by the publisher, the IAEA, as to the legal status of such countries or territories, of their authorities and institutions or of the delimitation of their boundaries.
The mention of names of specific companies or products (whether or not indicated as registered) does not imply any intention to infringe proprietary rights, nor should it be construed as an endorsement or recommendation on the part of the IAEA.
The authors are responsible for having obtained the necessary permission for the IAEA to reproduce, translate or use material from sources already protected by copyrights. Material prepared by authors who are in contractual relation with governments is copyrighted by the IAEA, as publisher, only to the extent permitted by the appropriate national regulations.
This publication has been prepared from the original material as submitted by the authors. The views expressed do not necessarily reflect those of the IAEA, the governments of the nominating Member States or the nominating organizations.
The IAEA has no responsibility for the persistence or accuracy of URLs for external or third party Internet web sites referred to in this book and does not guarantee that any content on such web sites is, or will remain, accurate or appropriate.

CONTENTS
1. INTRODUCTION . . . . . . . . . . . . . . . . . . . . . . . . . . . . . . . . . . . . . . . . 1
1.1. Background . . . . . . . . . . . . . . . . . . . . . . . . . . . . . . . . . . . . . . . . . 11.2. Objective . . . . . . . . . . . . . . . . . . . . . . . . . . . . . . . . . . . . . . . . . . . 21.3. Scope. . . . . . . . . . . . . . . . . . . . . . . . . . . . . . . . . . . . . . . . . . . . . . 31.4. Structure . . . . . . . . . . . . . . . . . . . . . . . . . . . . . . . . . . . . . . . . . . . 3
2. ANTHROPOMETRY . . . . . . . . . . . . . . . . . . . . . . . . . . . . . . . . . . . . . 4
2.1. Introduction. . . . . . . . . . . . . . . . . . . . . . . . . . . . . . . . . . . . . . . . . 42.2. Standardized procedures for measuring body weight and
length or height . . . . . . . . . . . . . . . . . . . . . . . . . . . . . . . . . . . . . . 52.3. Measuring body weight for body composition assessment . . . . 62.4. Measuring recumbent length. . . . . . . . . . . . . . . . . . . . . . . . . . . . 7
3. STABLE ISOTOPE DILUTION METHODS . . . . . . . . . . . . . . . . . . . 9
3.1. Introduction. . . . . . . . . . . . . . . . . . . . . . . . . . . . . . . . . . . . . . . . . 93.2. Basic principles of the dilution method . . . . . . . . . . . . . . . . . . . 93.3. Standardization of the total body water method . . . . . . . . . . . . . 123.4. Potential sources of error . . . . . . . . . . . . . . . . . . . . . . . . . . . . . . 153.5. Quality control . . . . . . . . . . . . . . . . . . . . . . . . . . . . . . . . . . . . . . 153.6. Reference data. . . . . . . . . . . . . . . . . . . . . . . . . . . . . . . . . . . . . . . 163.7. Summary . . . . . . . . . . . . . . . . . . . . . . . . . . . . . . . . . . . . . . . . . . . 19
4. DUAL ENERGY X RAY ABSORPTIOMETRY . . . . . . . . . . . . . . . . 20
4.1. Introduction. . . . . . . . . . . . . . . . . . . . . . . . . . . . . . . . . . . . . . . . . 204.2. Basic principles of DXA. . . . . . . . . . . . . . . . . . . . . . . . . . . . . . . 21
4.2.1. Accuracy of DXA measurements of body composition of infants . . . . . . . . . . . . . . . . . . . . . . 25
4.3. Standardized DXA procedures for infants . . . . . . . . . . . . . . . . . 264.3.1. Preparing for the infant DXA exam . . . . . . . . . . . . . . . . 27
4.3.2. Infant posteroanterior spine positioning andscanning . . . . . . . . . . . . . . . . . . . . . . . . . . . . . . . . . . . . . 284.3.3. Infant total body positioning and scanning . . . . . . . . . . . 304.3.4. Radiation dose considerations. . . . . . . . . . . . . . . . . . . . . 32

4.4. Potential sources of error . . . . . . . . . . . . . . . . . . . . . . . . . . . . . . 344.5. Quality control . . . . . . . . . . . . . . . . . . . . . . . . . . . . . . . . . . . . . . 364.6. Reference data. . . . . . . . . . . . . . . . . . . . . . . . . . . . . . . . . . . . . . . 374.7. Summary . . . . . . . . . . . . . . . . . . . . . . . . . . . . . . . . . . . . . . . . . . . 41
5. AIR DISPLACEMENT PLETHYSMOGRAPHY . . . . . . . . . . . . . . . 43
5.1. Introduction. . . . . . . . . . . . . . . . . . . . . . . . . . . . . . . . . . . . . . . . . 435.2. Basic principles of ADP . . . . . . . . . . . . . . . . . . . . . . . . . . . . . . . 46
5.2.1. Description and operation of the ADP instrument . . . . . 465.3. ADP measurement protocol . . . . . . . . . . . . . . . . . . . . . . . . . . . . 48
5.3.1. Two compartment body composition model. . . . . . . . . . 495.4. Potential sources of error . . . . . . . . . . . . . . . . . . . . . . . . . . . . . . 515.5. Quality control . . . . . . . . . . . . . . . . . . . . . . . . . . . . . . . . . . . . . . 535.6. Reference data. . . . . . . . . . . . . . . . . . . . . . . . . . . . . . . . . . . . . . . 535.7. Summary . . . . . . . . . . . . . . . . . . . . . . . . . . . . . . . . . . . . . . . . . . . 53
REFERENCES . . . . . . . . . . . . . . . . . . . . . . . . . . . . . . . . . . . . . . . . . . . . . . . 55
CONTRIBUTORS TO DRAFTING AND REVIEW . . . . . . . . . . . . . . . . . 61

1. INTRODUCTION
1.1. BACKGROUND
There is now strong evidence that growth from conception to 2 years of age represents a critical window of opportunity in terms of later risk of ill health and is central to the concept of the developmental origins of adult disease [1, 2]. However, the assessment of growth during this crucial period of early vulnerability is largely based on anthropometric measurements such as body weight, with insufficient attention given to the quality of growth and the relative partitioning of nutrients to fat free mass (FFM) or fat mass (FM). In practice, most assessments of embryo and foetal growth, from conception to delivery, are based on proxy measurements such as maternal weight gain. More specific measurements of foetal growth, such as estimates of organ volumes made by three dimensional ultrasound, are restricted to research projects. The wider use of these methods is limited by access to sophisticated equipment and lack of normative data [3].
At attended delivery, birth weight, length and head circumference might be measured as principal indicators of pregnancy outcome, and measurements of weight and length during infancy and childhood are used to assess growth by comparison with the World Health Organization (WHO) Child Growth Standards [4, 5]. However, infants of similar weight, height or even weight for height can vary substantially in body composition. For example, Indian babies have been characterized as having the thin-fat phenotype because although small and thin at birth they have proportionally more body fat and centrally deposited fat than European newborns [6]. This difference in body composition phenotype appears to be related to birth size and marks a fundamental metabolic difference [7] and a greater risk of non-communicable diseases during later adult life. These observations emphasize the importance of more detailed characterization of body structure and composition at an early age, to identify a higher risk of poor health later [8].
Body weight is a simple and informative measurement with which to mark adequate nutrition and short term risk, and has, for example, been used as the basis for the first Millennium Development Goal of halving the proportion of
1
underweight children under 5 years of age by 2015. However, body weight alone does not adequately reflect risks associated with poor child growth in the longer term and their consequences for health and development. For many countries in transition, improvements in child weight have taken place without commensurate improvements in height, with the result that if height is measured, normal weight children are increasingly identified as short and relatively fat [9, 10]. This raises

concerns about the quality of growth and the implications for metabolic regulation and later health [8]. Observations of this kind serve to highlight the importance of reliable measurements of length or height as well as body weight, to better define healthy growth [4]. The inclusion of length or height and comparison with the WHO Child Growth Standards should be encouraged in the assessment of the growth of infants and children as an integral component of the characterization of healthy growth.
However, it is clear that even though good measurements of length or height and weight provide useful information, there is a need to have a further level of differentiation of the components which contribute to body weight as a routinely available technique, in particular to differentiate the relative proportions of FFM and FM. The definition of healthy growth needs to be expanded to include measures of the quality of growth based on the assessment of body composition in infants and young children. The assessment of body composition is important in the short term in relation to the quality of diets used in the prevention and treatment of moderate and severe malnourishment in children, and for the optimization of intervention strategies [11]. In order to better understand the associations between growth during early life and later health status, there is an urgent need to better capture the dynamic nature of growth during early life by assessment of body composition, i.e. the partitioning of FM and FFM [12, 13]. However, the reliable measurement of body composition during early life represents a technically challenging area [14].
Given the necessity for an international consensus, the IAEA initiated a review of body composition assessment techniques in 2009 as a basis for efforts towards the standardization of body composition assessment from birth to 2 years of age. This follows the IAEA’s long standing tradition of providing guidance on the use of nuclear techniques in nutrition [15–18].
The overall aim of this publication is to contribute to the wider use of body composition assessment in low and middle income countries and, in particular, to facilitate the compilation of normative data. The development of normative data on body composition from birth to 2 years of age represents a critical priority in the better definition of healthy growth and the understanding of the associations between growth during early life and later health and development.
2
1.2. OBJECTIVE
The objective of this publication is to provide practical guidance on the assessment of body composition from birth to 2 years of age. It is intended for nutritionists, paediatricians and other health professionals who may have limited previous experience with the measurement techniques described in this book.

1.3. SCOPE
This publication describes the assessment of body composition in infants and young children up to 2 years of age. It should be noted that there are several different models used to describe body composition (Fig.1). The methodologies discussed in this book typically refer to body composition on the molecular level, sometimes referred to as the nutrition model.
The methodologies included in this publication were selected as techniques with high potential for successful standardization globally — based on considerations such as access to equipment, cost and the training needs of staff — and include stable isotope dilution for total body water (TBW) assessment as well as dual energy X ray absorptiometry (DXA) and air displacement plethysmography. A widely used method for body composition assessment, bioelectrical impedance analysis, is not included in this publication due to the lack of standardization of measurements of impedance and its conversion into FFM and FM. The standardization of anthropometry is given special attention in this publication, as basic measurements of body weight and length or height are crucial components in body composition assessment and are not always carried out in a standardized way.
There are a number of other techniques to assess body composition, including total body potassium [20], total body electrical conductivity [21], magnetic resonance imaging [22], ultrasound imaging [23], magnetic resonance spectroscopy [24], acoustic plethysmography [25], near infrared interactance [26], underwater weighing [27], computed tomography [28, 29] and neutron activation analysis [30]. These methods were not considered to be within the scope of this publication.
1.4. STRUCTURE
Following this introduction, Section 2 gives details of the use of anthropometry to collect accurate measurements of body weight and length or height. Section 3 provides a description of the use of stable isotope dilution to measure TBW and thereby estimate FFM and FM. Sections 4 and 5 describe the use of DXA and air displacement plethysmography for body composition
3
assessment.

2. ANTHROPOMETRY
2.1. INTRODUCTION
Accurate measurements of body weight and length are required for assessment of body composition using stable isotope dilution methods (Section 3) and air displacement plethysmography (Section 5). In this publication, the importance of ensuring standardization and the reproducibility of
FIG. 1. The five levels of body composition [19]. ECS — extracellular solids, ECF — extracellular fluids. (Figure courtesy of J. Shepherd, USA.)
4
laboratory procedures is emphasized. Equal care should also be taken to standardize procedures for measuring body weight and length for accurate assessment of body composition.

2.2. STANDARDIZED PROCEDURES FOR MEASURING BODY WEIGHT AND LENGTH OR HEIGHT
The level of accuracy and precision required depends primarily on the intended use of the data collected. Changes in body weight and length or height are well established measures that are widely used to monitor growth during infancy and childhood and which can be compared with the growth standards for infants and young children published by the WHO in 2006 [4]. These standards were developed using data collected in the WHO Multicentre Growth Reference Study (MGRS) from 1997 to 2003 to generate new data for assessing the growth and motor development of infants and young children around the world. The MGRS collected primary data using standardized techniques from approximately 8500 healthy children, who were living under conditions likely to favour achievement of their full genetic growth potential, from widely different ethnic backgrounds and cultural settings (Brazil, Ghana, India, Norway, Oman and the United States of America). The 2006 growth curves provide an international standard that represents the best description of physical growth for all children from birth to 5 years of age and establishes the breastfed infant as the normative model for growth and development. More information can be found at http://www.who.int/childgrowth/en/, including information on the MGRS and training materials on child growth assessment.
The WHO provides detailed instructions for measurements of body weight and length or height for growth monitoring. However, the level of accuracy of measurements used for growth monitoring is not the same as that required for assessment of body composition. For example, taring scales are recommended for measurements of body weight for growth monitoring, based on weighing the parent or caregiver with and without the infant. On these scales, the infant’s weight is displayed to the nearest 0.1 kg (100 g). However, this is not accurate enough to monitor changes in body composition over relatively short periods of time. For body composition assessment, electronic paediatric scales are recommended. Scales for infants are available that are capable of weighing up to 20 kg to the nearest 10 g, and the recommended procedure for their use is outlined below. The methodology for measuring length described in the WHO training materials should be adhered to for growth monitoring as well as for the assessment of body composition.
5
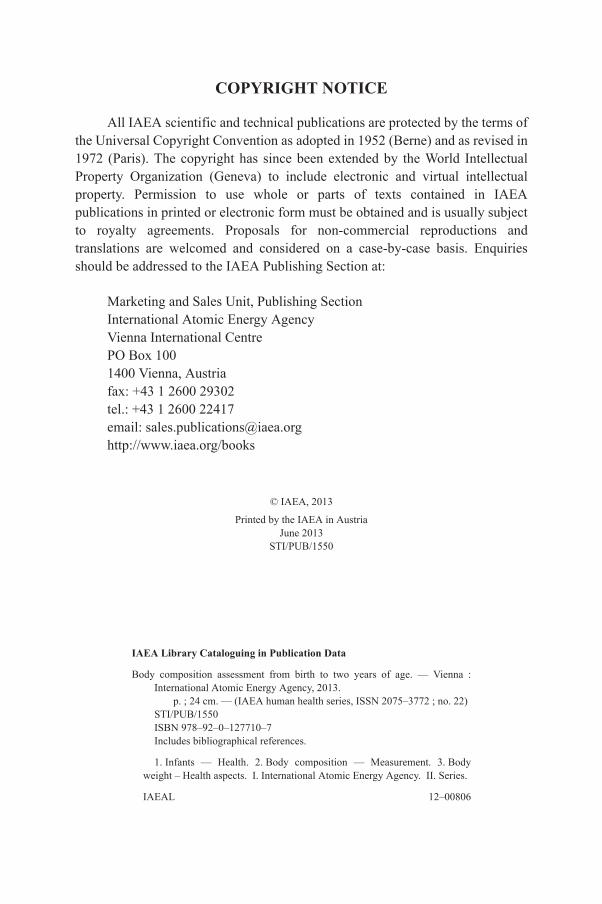
2.3. MEASURING BODY WEIGHT FOR BODY COMPOSITION ASSESSMENT
When measuring body weight for body composition assessment, these guidelines should be followed:
• An electronic paediatric scale should be used. • Weighing scales should always be placed on a firm and level surface and
adjusted to zero before each measurement. • Scales should be calibrated regularly with a set of weights of known value
and always after moving the scales to a new location. • Infants must be weighed without clothes using scales accurate to 0.01 kg.
The infant should be weighed naked, but can be wrapped in a blanket or other covering while waiting to be weighed.
• A cloth may be left in the weighing pan for hygiene reasons and to prevent the infant from becoming cold. The scales should then be adjusted to zero with the cloth in the pan.
• The naked infant should be placed gently in the centre of the weighing pan.• The infant should be allowed to settle and the weight to stabilize.• The weight should be recorded (to the nearest 10 g or 0.01 kg) immediately.
6
FIG. 2. Measuring body weight. (Photograph courtesy of M. Thame, Jamaica. N.B. The display in the picture shows the infant’s weight in non-SI units, i.e. 8 lbs 2 oz, which is equivalent to 3.7 kg.)

2.4. MEASURING RECUMBENT LENGTH
Recumbent length, i.e. with the infant lying down, is the preferred measurement in children of less than 2 years of age or 85 cm in length. Recumbent length is measured using a length board (also called an infantometer), which should be placed on a flat, stable surface such as a table. Length should be measured immediately before or after weighing, while the infant is naked. A dry nappy (diaper) can be put on after weighing and before measuring length. If the room is cool and there is a delay, keep the infant warm in a blanket until its length can be measured. All the procedures should be explained to the parent or caregiver, who can assist with the measurement.
The measurement device consists of a fixed headboard, a horizontal backboard and a moveable footboard. The length board can be covered with a thin cloth or soft paper for hygiene and for the infant’s comfort. Two people are needed to measure the child’s length.
One person should:
• Assist in positioning the infant face up on the length board, supporting the head and placing it against the headboard.
• Position the crown of the head against the headboard, compressing the hair. • Quickly position the head so that an imaginary vertical line from the ear
canal to the lower border of the eye socket is perpendicular to the board. This is known as the Frankfort plane. The child’s eyes should be looking straight up. The parent or caregiver can assist by holding the head in this position. She should stand or kneel behind the headboard.
The second person should:
• Check that the infant is lying straight along the centre line of the board and ensure that he or she does not change position. The shoulders should touch the board and the spine should not be arched.
• Place one hand on the shins above the ankles or on the knees and press down gently to straighten the legs as far as they will go without causing injury. It is not possible to straighten the knees of newborns to the same
7
degree as those of older children. Their knees are fragile and could easily be injured, so minimal pressure should be applied.
• With the other hand, place the footboard firmly against the child’s feet. The soles of the feet should be flat against the footboard, toes pointing upwards. Ensure that the toes do not prevent the footplate coming into contact with the heels. If the infant bends the toes and prevents the footboard from

touching the soles, gently stroke the soles and slide the footboard quickly into place when the toes are straightened.
• Read the measurement and record the length in centimetres to the last completed 0.1 cm (1 mm).
The length board should be kept clean and should be stored at normal room temperature and protected from humidity. The board should be checked for accuracy every week. Portable devices for the measurement of length in the field can be locally manufactured in low income settings.
8
FIG. 3. Measuring recumbent length in a clinic (a) (photograph courtesy of M. Thame, Jamaica) and in a field setting (b) (photograph courtesy of S. Good, Switzerland).

3. STABLE ISOTOPE DILUTION METHODS
3.1. INTRODUCTION
The human body can be described by different body composition models that range in complexity from the basic elemental or chemical models to multicompartment anatomical and functional models [31]. A four compartment (4-C) model consisting of water, proteins, minerals and fat is often considered the reference model for body composition. A simpler two compartment (2-C) model, however, is the one more often used, where the three compartments of water, proteins and minerals are combined into a single compartment, called the fat free mass (FFM). Body water is the major component of FFM throughout life. At birth FFM is about 80% water. The hydration of FFM gradually decreases during childhood to approximately 73% in adolescents and then remains relatively constant throughout adulthood. Thus, if one can obtain a measurement of TBW and the hydration of FFM is known, the body’s FM can be calculated as the difference between body weight and FFM.
3.2. BASIC PRINCIPLES OF THE DILUTION METHOD
The measurement of TBW using the isotope dilution technique is a well established methodology [15–17]. Stable isotopes of both hydrogen and oxygen have been used to label water. The choice of isotope is usually dictated by the type of instrumentation that is available for analysis of the tracer. The analytical technique will also influence the choice of biological tissue to be used. Likewise, the age of the subject and his or her physical condition can have an impact on these choices. For the measurement of body water, the stable (non-radioactive) isotopes used are deuterium (2H) and oxygen-18 (18O). The biological tissues can be blood, urine or saliva. The two analytical techniques used are isotope ratio mass spectrometry (IRMS) and Fourier transform infrared (FTIR) spectrometry. A promising newer technology, cavity ring-down spectroscopy, has recently been developed [32] but is not considered further in this publication.
The basic principle of the isotope dilution method for the measurement of
9
TBW is straight forward. Water is a molecule composed of two hydrogen atoms and one oxygen atom. In nature, the most abundant isotopic states for hydrogen and oxygen are 1H and 16O, respectively. If a sufficient number of water molecules composed of different isotopes of hydrogen or oxygen (for example 2H or 18O) is added to a fixed volume of natural water and sufficient time is allowed for these molecules to uniformly redistribute within the water volume, then the

original water volume can be estimated based on the amount of tracer added (dose) and its relative concentration at this equilibrium. Several publications in the IAEA Human Health Series have described in detail the various steps necessary for achieving successful measurements of TBW using stable isotopes [15–17]. These publications have focused on the use of deuterium (2H) with collection of saliva assayed using FTIR or urine assayed by IRMS. It is recommended to consult the information contained in these publications when considering the measurement of TBW in humans. In addition to an extensive bibliography, all aspects of the measurement techniques are included, along with detailed steps on setting up a research or clinical protocol.
There are several assumptions inherent to the isotope dilution technique for the measurement of TBW. In an ideal case, the labelled water molecules would distribute completely and uniformly in the body’s water spaces within a relatively rapid time period after the tracer is administered orally. During the equilibration phase, however, there is also some exchange of the tracer atoms with non-aqueous molecules in the body. The net effect of this exchange is to lower the tracer’s concentration in the body’s water pools, which, if uncorrected, would translate to a greater body water volume measurement than is the case. Also, the rate of exchange is dependent on the choice of isotopic tracer. For TBW measurements in adults, this overexpansion is approximately 4% when deuterium is the tracer and only approximately 1% for 18O [33, 34]. These rates have not been measured in infants or children, but are assumed to be the same as for adults.
The number of fluid samples and the time point they are collected following the oral tracer dose is dependent on whether the equilibration (plateau) or intercept (back extrapolation) method is used [15–17]. The plateau method requires three separate fluid samples (one pre-dose and two post-dose, about one hour apart). For saliva, post-dose collection is typically 2–3 h after the oral tracer dose. If urine is used, then the delay is of the order of 4–5 h post-dose. This delay allows sufficient time for equilibration of the tracer within the water compartment that is being sampled, yet is kept at a minimum so that the exchange of the tracer with non-aqueous tissues and excretion of the tracer from the body are limited. It is also recommended that, when possible, the subject restrict fluid intake during the equilibration period. This constraint, however, can be difficult to achieve when working with infants and younger children. For infants, the back extrapolation method is considered the more accurate technique. It is also more
10
complex to complete and requires multiple fluid samples to be collected during the 24 h following the oral dose. The tracer concentration is plotted against time on a semilog plot and fitted with a straight line for data collected after 4 h. The intercept value for this line represents the tracer concentration if the oral dose had redistributed in the body water instantaneously [16, 17].

It is important to note that the calculation of TBW using FTIR spectrometry is different from the calculation of TBW using IRMS. Although both methods calculate the increased concentration of deuterium above the amount naturally present, the units of enrichment are different and are not interchangeable. For IRMS, the increase is expressed as atom per cent excess 2H, which is a molar ratio (mol/mol). For FTIR, the enrichment is usually expressed as the concentration of deuterium in parts per million (ppm) by weight (mg/kg) above the natural abundance. These differences affect how the deuterium dilution space (VolD) is calculated. For FTIR, the oral dose is in grams of deuterium oxide and TBW is in kilograms. For IRMS, the consumed dose is calculated in moles, which produces an estimate for TBW in moles, which must then be converted to kilograms. The calculations for FTIR are much simpler than those used for the IRMS method. However, the detection limit of IRMS is at least an order of magnitude lower than that of FTIR, thus requiring a much smaller tracer dose.
The following are the calculations used to convert the deuterium concentration of the post-dose fluid sample to an estimate of TBW. For FTIR, the dilution volume (VolD; kg) is defined as:
(1)
where d is dose of D2O (mg) and E is enrichment of 2H in the post-dose sample (mg/kg), and:
(2)
where TBW is expressed in kilograms and the constant is used to adjust for the non-aqueous exchange of deuterium with hydrogen atoms of tissues.
For IRMS, the calculation of TBW is more complex and requires the following information, including information about the dilution of the dose prepared for analysis with saliva or urine samples:
(1) W — total weight of water added when making the dose dilution (g);(2) A — weight of dose taken by the subject (g);
Vol D =dE
TBW = Vol /1.041D
11
(3) B — weight of dose in diluted dose (g);(4) DD — enrichment of 2H in the diluted dose (ppm excess 2H);(5) BW — enrichment in 2H in body water (ppm excess 2H);(6) UL — cumulative loss of 2H in urine during the equilibration period.

Using this information, the deuterium dilution volume (ND; kg) is calculated as:
(3)
if there is minimum urinary loss. Otherwise 2 × UL is used to account for any sensible and insensible water loss. As noted for the FTIR calculation, the measurable 2H dilution space is larger than the true TBW space by approximately 4.1% owing to the non-aqueous exchange of hydrogen atoms in tissues, so that
(4)
It is recommended that those involved become familiar with each of the detailed laboratory steps and analytical procedures presented in the IAEA Human Health Series publications [15–17].
Information about changes in TBW during growth in infancy is interesting in itself, but the primary application for the measurement of TBW has been to calculate the infant’s body fat content. This is usually accomplished using the 2-C body composition model. That is, if body weight and TBW are measured and the hydration of the FFM (hFFM) is known, then the body’s FM can be calculated as:
(5)
On a population basis, the hydration of FFM is relatively constant (0.732 ± 0.030) for healthy adults and older children [35]. However, if there is severe dehydration or oedema, which can occur with some diseases and as a result of medication, the hydration factor can vary from 0.65 to 0.83. During the first weeks after birth, the average hydration factor is approximately 0.80–0.82 and slowly decreases to approximately 0.77–0.78 over the next 2 years [19, 36]. Table 1 provides the hydration fractions calculated for a hypothetical reference model [36] and measured in a two year longitudinal study of healthy full-term infants [19].
NDWA
BDDDDBW
= ´ ´0 001.
TBW = /1.041DN
FM Wt TBW/ FFM= - h
12
3.3. STANDARDIZATION OF THE TOTAL BODY WATER METHOD
The measurement protocols for TBW using the stable isotope dilution techniques are reasonability standardized [15–17]. The options are generally dependent on the analytical technique available, i.e. FTIR or IRMS. This can also

influence the choice of isotope, the amount that is needed for the oral dose and which body fluid should be collected following the oral dose. As noted previously, three publications in the IAEA Human Health Series provide reliable recommendations and instructions for making each of these decisions in order to conduct an accurate in vivo assessment of TBW in humans [15–17].
For infants (birth–2 years), the basic steps are as follows:
• The analytical method (IRMS or FTIR) should be established early in order to determine the oral dose of D2O to be administered. Based on the detection limit of IRMS, the tracer dose for infants is typically about 0.1 g per kg of body weight. For FTIR, the dose needs to be higher at approximately 0.7 g per kg of body weight.
• The infant does not need to be in a fully fasted state during the time before the start of the protocol or during the initial part of the equilibration period. A
TABLE 1. HYDRATION FRACTION (HFFM) OF FFM
Age (months)Males Females
Modela Longitudinalb Modela Longitudinalb
Birth 0.806 — 0.806 —
0.5 — 0.827 ± 0.015 — 0.831 ± 0.016
3 0.800 0.810 ± 0.014 0.797 0.811 ± 0.016
6 0.796 0.807 ± 0.012 0.794 0.807 ± 0.016
9 0.793 0.797 ± 0.011 0.790 0.798 ± 0.015
12 0.790 0.793 ± 0.013 0.788 0.788 ± 0.014
18 0.785 0.783 ± 0.012 0.784 0.782 ± 0.014
24 0.781 0.770 ± 0.014 0.782 0.780 ± 0.012
a Theoretical reference model [36].b Mean ± standard deviation [19].
13
pre-dose fluid sample (typically saliva or urine) needs to be collected and the same fluid is collected again several hours after dosing. Plasma can be used, but it is difficult to obtain repeat samples from infants. For older infants, the collection of urine is often preferred when using IRMS, but this cannot be used for the FTIR technique. To collect urine, cotton balls can be placed inside the infant’s nappy. After urination, the cotton balls are removed and

placed in an empty syringe and the urine is squeezed out and collected. Saliva can be used with both IRMS and FTIR. The main limitation is collection of a sufficient volume of saliva within a reasonable time frame. For both urine and saliva, a sample volume of at least 1 mL needs to be collected.
• The infant’s body weight needs to be measured accurately (±10 g) at the start of the protocol and again at the last collection of saliva or urine after the equilibration period.
• The tracer dose is based on the infant’s weight and is administered orally. This can take a few minutes, with the dose slowly dropped into the back of the mouth using a syringe (see Fig. 4). If there is any spillage, it may bepossible to estimate the amount lost, but this usually introduces unacceptable error in the final TBW estimate, and for this reason the protocol should be stopped. An accurate measurement of the administered dose can be based on the difference in weight of the filled syringe and the syringe after dosing. In some instances, when working with older infants or young children, the dose can be mixed with fruit juice or puree, but this increases the risk of the subject not consuming the full tracer amount because of occurrences such as spitting up or vomiting.
• The equilibration time assumed for infants and young children is typically 2–3 h for saliva and plasma and 4–5 h for urine. To ensure that the plateau region is reached, at least two samples about an hour apart should be collected starting approximately 2 h after the oral dose. For the intercept method, the delay before collecting post-dose samples needs to be at least 5 h, with multiple samples collected over the next 20 h.
14
FIG. 4. Infant receiving an oral dose of deuterium oxide using a syringe. (Photograph courtesy of M. Thame, Jamaica.)

• All body fluid samples should be kept in watertight containers and processed as soon as possible. For the IRMS technique, samples from the stock solution used for the dose and the tap water used for preparation of the dose dilution and calibration standards need to be analysed along with the post-dose body fluid samples.
Attention to detail is needed for each of the steps in the protocol in order to achieve precise and accurate estimates of TBW in infants.
3.4. POTENTIAL SOURCES OF ERROR
The precision (reproducibility) error for the measurement of TBW is reported to be less than 2% for adults [35]. This error is basically the technical error associated with the analytical component of the total procedure. Errors are also introduced in the preparation of the stock solution, measurement of the volume of the oral dose and the multiple dilutions of the stock solution for the calibration standards. Other potential sources of significant errors include incomplete dosing, partial equilibration and loss of tracer from the body. These errors may routinely introduce approximately 5% accuracy error of the TBW estimate and can be sufficient to totally invalidate the results [35]. In general, these types of errors will result in an overestimation of the true TBW value. The choice of the hydration factor to be used is also a potential source of inaccuracy when calculating body FM or percentage of body fat.
3.5. QUALITY CONTROL
There are several steps that can be taken in order to maintain good quality control. These are concerned with instrument calibration, analytical precision, technique variation, screening of data and identification of outliers. All analyses should include samples with natural abundance (tap water) and enriched water standards of known deuterium content. The standards can be analysed at the beginning and end of each batch of samples and for each working day. A full standard curve in the concentration range of the unknown samples should be
15
repeated and analysed whenever the instrument has been out of use for some time, after any major repairs, or after relocation of the instrument. Replicate samples can be used to establish the analytical precision. This is typically less than 1% for FTIR and below 1 ppm 2H excess for IRMS. The extent of measurement variation is dependent on factors such as equilibration, sampling, handling and analytical technique. As a rule of thumb, the tracer concentration for

the two post-dose samples obtained one hour apart should be within 2% of their mean. Identification of potential outliers generally requires an estimate of the expected or predicted value for the subject. There are several anthropometry based prediction equations (see Section 3.6) that may provide a reference range. In general, in early infancy, TBW is approximately 60–65% of body weight. If the assay has produced a TBW value substantially outside this range, all of the steps in the assay should be reviewed for potential errors.
3.6. REFERENCE DATA
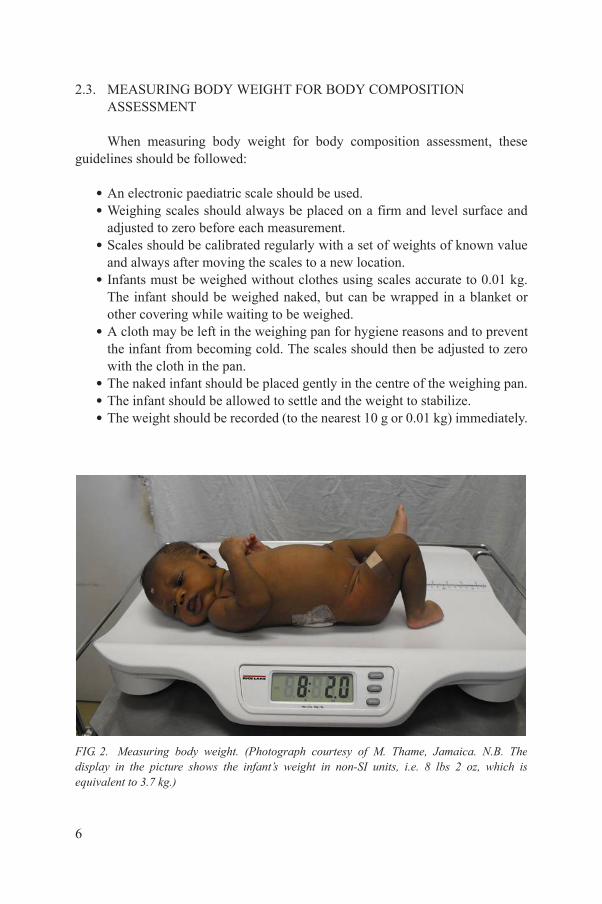
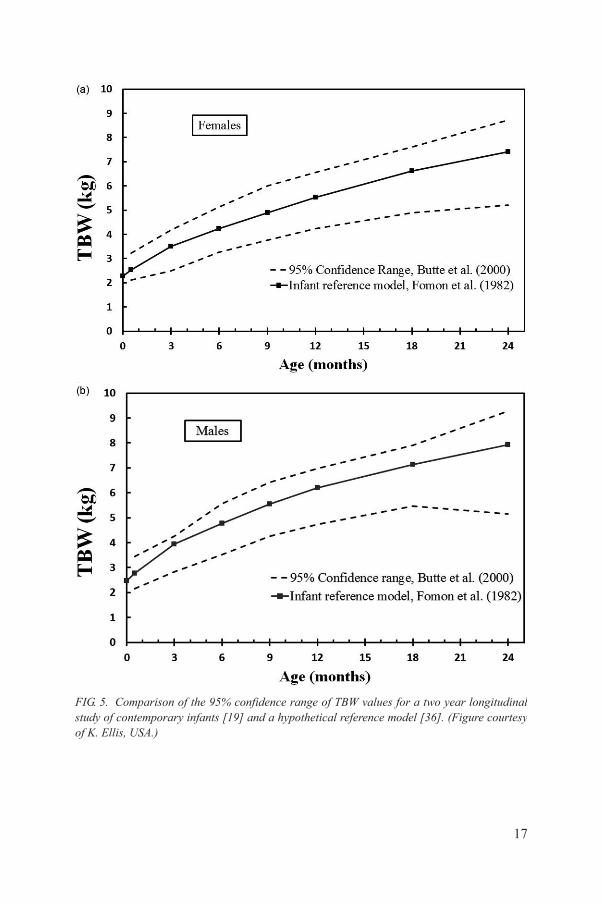
There have been no systematic studies specifically designed to establish reference values for TBW during early infancy. TBW estimates were constructed by Fomon et al. [36] based on a 4-C body composition model using only the 50th centiles for weight and height of infants and children. A more recent study, using the same 4-C model, has provided the only longitudinal TBW data for contemporary infants up to 24 months with estimates for the 95% confidence limits [19]. A comparison of the TBW values for these two studies is provided in Fig. 5. In general, the TBW values for the hypothetical model at each age were 5–7% higher than the mean values observed for the contemporary study, primarily when the age exceeded approximately 6 months. The reference model’s TBW values, however, were within the ±2 SD range for the contemporary infants.
Anthropometry based prediction equations for TBW in infants and children have also been published [37–41]. Most of these studies were in white populations. The main prediction parameters for infants are body weight and body length, with small adjustments for age and sex. Table 2 provides a summary of these prediction equations. Using the values for weight and length from Fomon’s reference infant model [36], the resultant TBW estimates for each prediction equation are given in Table 3. The difference between the prediction models is of the order of 5–10%, which is similar to the level of biological variation within any age group. Caution should be used, however, when comparing an individual’s TBW value with these body size matched predicted values. It would be advisable for professionals to develop their own reference database until more studies are published.
16
17
FIG. 5. Comparison of the 95% confidence range of TBW values for a two year longitudinal study of contemporary infants [19] and a hypothetical reference model [36]. (Figure courtesy of K. Ellis, USA.)
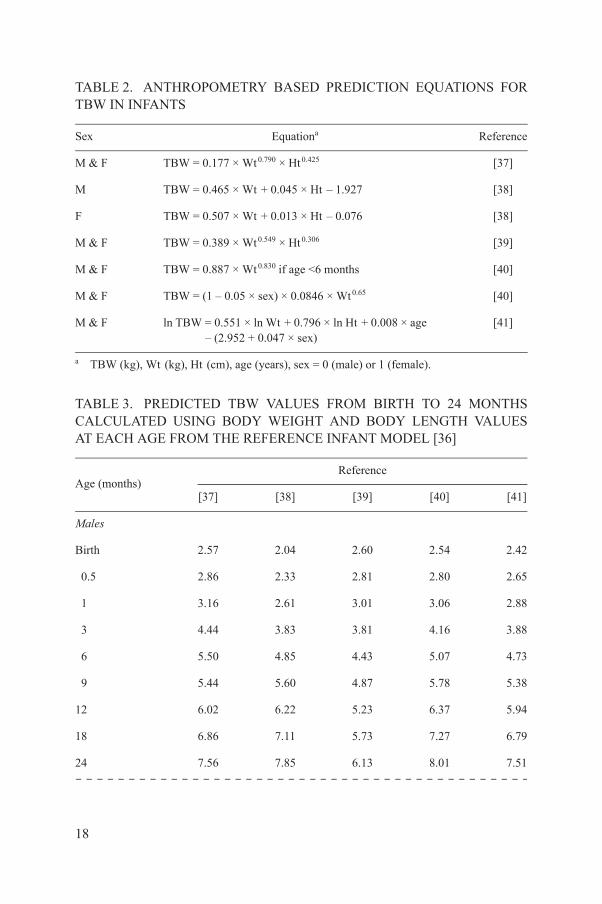
TABLE 2. ANTHROPOMETRY BASED PREDICTION EQUATIONS FOR TBW IN INFANTS
Sex Equationa Reference
M & F TBW = 0.177 × Wt0.790 × Ht0.425 [37]
M TBW = 0.465 × Wt + 0.045 × Ht – 1.927 [38]
F TBW = 0.507 × Wt + 0.013 × Ht – 0.076 [38]
M & F TBW = 0.389 × Wt0.549 × Ht0.306 [39]
M & F TBW = 0.887 × Wt0.830 if age <6 months [40]
M & F TBW = (1 – 0.05 × sex) × 0.0846 × Wt0.65 [40]
M & F ln TBW = 0.551 × ln Wt + 0.796 × ln Ht + 0.008 × age – (2.952 + 0.047 × sex)
[41]
a TBW (kg), Wt (kg), Ht (cm), age (years), sex = 0 (male) or 1 (female).
TABLE 3. PREDICTED TBW VALUES FROM BIRTH TO 24 MONTHS CALCULATED USING BODY WEIGHT AND BODY LENGTH VALUES AT EACH AGE FROM THE REFERENCE INFANT MODEL [36]
Age (months)Reference
[37] [38] [39] [40] [41]
Males
Birth 2.57 2.04 2.60 2.54 2.42
0.5 2.86 2.33 2.81 2.80 2.65
1 3.16 2.61 3.01 3.06 2.88
3 4.44 3.83 3.81 4.16 3.88
6 5.50 4.85 4.43 5.07 4.73
9 5.44 5.60 4.87 5.78 5.38
18
12 6.02 6.22 5.23 6.37 5.94
18 6.86 7.11 5.73 7.27 6.79
24 7.56 7.85 6.13 8.01 7.51

3.7. SUMMARY
The isotope dilution technique is a well established methodology for the assessment of human body composition [15–17]. It is considered the reference method for the measurement of TBW. Stable isotopes of both hydrogen and oxygen have been used. Body fluids, usually urine or salvia, are obtained several hours after the oral administration of isotopic labelled water. The samples are assayed using IRMS and FTIR spectrometry [15–17]. This technique is one of the few methods that can be used in non-urban or remote locations, as the samples can be collected and returned to a central laboratory for later analysis. The rapid turnover of body water during infancy also allows for repeat measurements that
Females
Birth 2.42 2.42 2.50 2.40 2.19
0.5 2.68 2.64 2.68 2.64 2.39
1 2.94 2.86 2.86 2.88 2.58
3 4.00 3.76 3.55 3.78 3.39
6 5.02 4.61 4.16 4.43 4.17
9 4.95 5.18 4.56 5.04 4.75
12 5.50 5.70 4.91 5.59 5.26
18 6.45 6.58 5.49 6.52 6.13
24 7.17 7.23 5.91 7.25 6.84
TABLE 3. PREDICTED TBW VALUES FROM BIRTH TO 24 MONTHS CALCULATED USING BODY WEIGHT AND BODY LENGTH VALUES AT EACH AGE FROM THE REFERENCE INFANT MODEL [36] (cont.)
Age (months)Reference
[37] [38] [39] [40] [41]
19
can be used to monitor the changing growth patterns in population studies.

4. DUAL ENERGY X RAY ABSORPTIOMETRY
4.1. INTRODUCTION
DXA is a technique that uses two X ray beams of differing energies to measure the density of bone and soft tissues in vivo. DXA was primarily designed to measure bone mineral density in adults to diagnose osteoporosis. However, it can also measure total body soft tissue composition and percentage of body fat with a high degree of accuracy and precision when compared with other methods. For adults, there are four primary dedicated scan modes: lumbar spine, proximal hip, forearm and total body. For infants, there are only two scan modes: spine and total body. Only the total body scan mode is generally used for soft tissue composition. DXA measurements of bone include measuring total body bone mineral content (BMC (g)) and areal bone mineral density (BMD; g/cm2). DXA uses a three compartment (3-C) model to describe total body mass: FM, bone mineral mass and lean soft tissue mass. DXA has unique attributes compared to other methods discussed in this book in that it can report the 3-C measurements either for total body mass or for subregions. In adults, there are standardized cutlines placed to subdivide the arms, legs, pelvis, trunk and head. However, for infants, positioning is very difficult to standardize and overlap of the arms with the trunk is common. Therefore, current methods of infant total body analysis use manually placed boxes around regions, if subregions are desired.
DXA systems are available from various manufacturers. However, there are two dominant manufacturers: Hologic (Hologic, Inc., Bedford, MA, USA) and GE Healthcare (General Electric, Madison, WI, USA). Both provide special scan modes for infants. DXA systems consist of an X ray source, a detector array, a radiolucent examination table and a computer workstation both for acquiring the DXA data and for analysis. A DXA system requires a dedicated examination room large enough to ensure that radiation is below legal limits outside the room. Limits are different in every country but in general, all DXA systems can be used in a room as small as 2.5 m × 3 m. The X ray source is generally inside the table connected to the detector array using a gantry. Virtually all DXA systems have fan beam X ray geometry, a description of the shape of the exiting beam from the X ray source. Fan beam systems expose a segmented line detector all at once such
20
that its gantry only needs to make either one or a few passes to scan the entire region of interest. Infant DXA scans take from less than a minute for spine scans to seven minutes for total body scans. The unique difficulty when scanning infants is that the infant is required to lie without moving during the entire scan time. In addition, infant bones are small and of low density compared to adult bones and are more difficult to detect. The radiation dose from infant DXA scans

is very low, typically less than the daily background dose an infant would receive from natural sources. For these reasons, DXA is a valuable clinical and investigational assessment of bone and body composition disorders in infants and young children. Safety and dose will be discussed further in Section 4.3.4.
DXA also provides a measurement of bone mass in addition to FM and lean tissue. Regardless of the DXA technique used in assessing the body composition of infants, meticulous attention needs to be paid to the details of data acquisition and data analysis. Knowledge of the limitations of the particular technique being used is also essential.
4.2. BASIC PRINCIPLES OF DXA
The basic principle underlying the DXA technique is that the attenuations of X rays with high and low photon energies are measurable and dependent on the mass and density of the attenuating tissues. Fat, lean tissues and bone mineral all have unique densities and chemical compositions, and thus unique X ray attenuation characteristics. One of the first assumptions of DXA is that the X ray characteristics of fat, lean soft tissues and bone mineral are similar for all individuals, at all ages.
X rays in the energy range used for DXA interact with tissue using three processes: photoelectric absorption, Compton (inelastic) scattering, and coherent (elastic) scattering [42, 43]. Coherent scattering occurs when X rays pass close to an atom and cause bound electrons to vibrate (resonate) at a frequency corresponding to that of the X ray photon. The electron reradiates this energy in all directions and at exactly the same frequency as the incoming photons without absorption. Although a certain amount of elastic scattering occurs at all X ray energies, it never accounts for more than 10% of the total interaction processes in diagnostic radiology. Compton scattering occurs when the incoming photon loses some of its energy to the electron and then continues in a new direction (i.e. it is scattered) but with increased wavelength and hence with decreased energy. Compton scatter creates two major problems in X ray imaging. First, it reduces the contrasts in the image unless it is removed by collimation before the photons reach the detector. Second, it presents a radiation risk to the personnel using the equipment. Attenuation by the photoelectric effect occurs when a photon
21
interacts with the atom by ejecting an electron from its orbit or shell around the nucleus. The input photon is totally absorbed in the process; however, a lower energy fluorescent photon is usually emitted. Whenever the input photon energy is slightly greater than the energy required to remove an electron from a particular shell around the nucleus, there is a sharp increase in the probability of a photoelectric interaction. This phenomenon is known as an absorption edge.

There are two reasons for the sudden increase in absorption. First, the number of electrons available for interaction and ejection from the atom increases. Second, a resonance phenomenon occurs whenever the photon energy slightly exceeds the binding energy of a given shell.
The above absorption processes contribute to the total attenuation of an X ray flux passing through a subject as represented by the following formula:
(6)
where I0 is the unattenuated X ray intensity before it passes through a material of thickness t (cm) and a total linear attenuation coefficient μ (cm–1). There are several important considerations regarding linear attenuation for X rays:
(1) µ decreases with increasing energy in the diagnostic energy range, i.e. the radiation becomes more penetrating.
(2) µ increases with increasing tissue density, i.e. the radiation is less penetrating because there are more atoms per unit volume in the material with which to collide.
(3) µ increases with atomic number, most strongly at very low energies.(4) Absorption edges cause a sharp increase of µ for energies just above the
edge energy.
Another way to express attenuation is as a mass attenuation coefficient by representing the thickness as mass per unit area by multiplying the attenuating thickness by density. In this case, Eq. (6) can be written as:
(7)
where (µ/ρ) = mass attenuation coefficient in units of cm2/g and σ = areal mass density = ρt. Equation (7) is valid for calculating the attenuation for any medium (solid, liquid or gas). Total attenuation is the sum of the mass attenuation coefficients from each effect (photoelectric, Compton and coherent). Most attenuation tables in physics handbooks will list each attenuation effect separately from the total. Attenuation coefficients are
I I e t= -0
m
I I e I e I e I ett t t
= = = =−−⎛
⎝⎜⎜⎜⎜⎞
⎠⎟⎟⎟⎟ −
⎛
⎝⎜⎜⎜⎜⎞
⎠⎟⎟⎟⎟ −
0 0 0 0μ
μρρ
μμρρ
μρρσ
⎛
⎝⎜⎜⎜⎜⎞
⎠⎟⎟⎟⎟
22
available from reference books such as the CRC Handbook of Chemistry and Physics [44] and web sites such as the NIST materials database (see http://physics.nist.gov/PhysRefData/Xcom/Text/XCOM.html).

When a substance is not a homogenous material, the mass fractions are sum weighted by their mass attenuation coefficients to form a composite mass attenuation coefficient. Examples of composite attenuations are when X rays are attenuated by different tissues such as bone, marrow, fat, muscle, etc. If the beam passes through N different materials, Eq. (7) is written as in Ref. [43]:
(8)
DXA was developed to solve for the mass density of two unknown materials when physical measurements of the materials, such as overall thickness, are either not available or not practical. Three fundamental assumptions are used to determine bone density using two energies:
(1) Transmission through the body of the X rays within the two energy windows can be accurately described by a mono-exponential attenuation process.
(2) Individual image pixels of the human body can be described as a 2-C system, e.g. soft tissue and bone mineral, or, when bone is not present, fat and lean mass. Thus, DXA is described as a 3-C model for body composition.
(3) The soft tissue overlaying the bone in the image has a composition and X ray properties that can be predicted by the composition and X ray properties of the tissue near but not overlaying the bone.
The 3-C model used for DXA is shown in Fig. 6.For simplicity, the DXA equations will be derived for two monochromatic
X ray beams with different energies (a high and low energy). The attenuation equation for each beam results in the following two equations:
(9)
(10)
I I e i
N
ii
=−
⎛
⎝⎜⎜⎜⎜⎞
⎠⎟⎟⎟⎟
=∑
01
μρσ
I I eL s
L
sb
L
b
=−⎛
⎝⎜⎜⎜⎜⎞
⎠⎟⎟⎟⎟ +
⎛
⎝⎜⎜⎜⎜⎞
⎠⎟⎟⎟⎟
⎡
⎣
⎢⎢⎢
⎤
⎦
⎥⎥⎥
0
μρσ
μρσ
I I eH s
H
sb
H
b
=−⎛
⎝⎜⎜⎜⎜⎞
⎠⎟⎟⎟⎟ +
⎛
⎝⎜⎜⎜⎜⎞
⎠⎟⎟⎟⎟
⎡
⎣
⎢⎢⎢
⎤
⎦
⎥⎥⎥
0
μρσ
μρσ
23
where the H and L superscripts represent the high and low energy X ray beams, respectively, and is the areal density in g/cm2. Equations (9) and (10) are analogous to Eq. (8) where soft tissue (s), is material 1, and bone (b), is material 2. These equations also apply if material 1 is fat and material 2 is lean mass.

Equations (9) and (10) are solved simultaneously for the bone areal density as follows:
(11)
FIG. 6. The five compartment molecular model of body composition is compared to the three compartment model for DXA. Note that lipid is used instead of fat since fat (triglycerides), membrane phospholipids and connective tissues are indistinguishable to a DXA system. (Figure courtesy of J. Shepherd, USA.)
σ
μρ
bs
L
H
H
H
LI
II
=
⎛
⎝⎜⎜⎜⎞
⎠⎟⎟⎟⎟
⎛ ⎞
⎛
⎝⎜⎜⎜⎜
⎞
⎠⎟⎟⎟⎟⎟−ln ln
II L
L H⎛
⎝⎜⎜⎜⎜
⎞
⎠⎟⎟⎟⎟⎟
⎛
⎝⎜⎜⎜⎞
⎠⎟⎟⎟⎟ −
⎛
⎝⎜⎜⎜⎜⎞
⎠⎟⎟⎟⎟
⎛
⎝⎜⎜⎜⎞
⎠μρ
μρ
μρ⎟⎟⎟⎟⎟
⎛ ⎞s
L
H
24
μρ s⎝⎜⎜⎜ ⎠⎟⎟⎟⎟
0 b b0
⎝⎜⎜⎜ ⎠⎟⎟⎟⎟
s
μρ

The ratio or R-value for the soft tissue (Rs) is defined as:
(12)
and Eq. (11) can be rewritten as:
(13)
In Eq. (13), the soft tissue measure is reduced to the Rs term. Note that the solution for σs is found in the same fashion. All the other terms in Eq. (13) are either directly measured or are defined by the known mass attenuation coefficient of bone. Using our last assumption, Eq. (13) is used to determine Rs from the tissue surrounding the bone that does not contain bone. In this region, b = 0 and the intensity is exclusively attenuated by soft tissue, denoted by I → Is:
(14)
Thus, Rs is a measure of the percentage of fat of the soft tissue. If Rs is averaged using values to either side of the bone and a constant R is used over the bone, this is called the uniform distribution model [45]. If the percentage of fat around the bone is changing in a functional way, then Rs becomes a function of position explicitly defined outside the bone and interpolated over the bone. This is called the weighted linear distribution model [45]. Both of the models of soft
Rss
L
s
H=
⎛
⎝⎜⎜⎜⎞
⎠⎟⎟⎟⎟
⎛
⎝⎜⎜⎜⎞
⎠⎟⎟⎟⎟
μρ
μρ
σμρ
b
s
H
H
L
LR
II
II
=
⎛
⎝⎜⎜⎜⎜
⎞
⎠⎟⎟⎟⎟⎟−⎛
⎝⎜⎜⎜⎜
⎞
⎠⎟⎟⎟⎟⎟
⎛
⎝⎜⎜⎜⎞
⎠⎟⎟⎟
ln ln0 0
⎟⎟ −⎛
⎝⎜⎜⎜⎞
⎠⎟⎟⎟⎟
b
L
b
H
sRμρ
R
I
I
I
I
s
sL
L
sH
H
=
−⎛
⎝⎜⎜⎜⎜
⎞
⎠⎟⎟⎟⎟⎟
−⎛
⎝⎜⎜⎜⎜
⎞
⎠⎟⎟⎟⎟⎟
ln
ln
0
0
25
tissue are used for different regions of interests.
4.2.1. Accuracy of DXA measurements of body composition of infants
Accuracy studies for infant DXA scans are few and somewhat dated. Accuracy can be defined as both trueness, the per cent difference from a criterion

measure, and repeatability (i.e. precision), the standard deviation of repeated measurements. There are several studies that have investigated the accuracy of body composition and bone measurements using infant scan protocols and foetal pigs. Based on carcass analysis of whole piglets it is generally agreed that the DXA instrument underestimates bone mass and overestimates the fat content of infants.
Precision studies were performed by Koo et al. [46] by performing triplicate scans on 22 piglets on a Hologic QDR 1000/W pencil beam system, software version V5.64p. The average weight of the piglets was 2794 g (with a range of 886–8494 g). The precision (%CV) for total weight, bone mineral content, bone area, bone mineral density, fat and lean mass was 0.1, 3.0, 1.5, 2.2, 7.7 and 0.6%, respectively.
Rigo et al. [47] also explored infant body composition accuracy using piglets. Forty-one DXA scans were acquired on 21 piglets, followed by chemical analysis of each piglet. The DXA scanner used was a Hologic QDR 2000 pencil beam system with an infant scanning platform and infant whole body software V5.65P. The QDR 2000 system can scan using either a pencil or fan beam configuration, however, no mention was made in the paper as to which was used in this study. Some scans were acquired with the application of porcine lard to alter the per cent fat. They found that the DXA FM was highly correlated to chemical FM (coefficient of determination, r2 = 0.98). Accuracy estimates ranged from ±30% for 100 g FM to ±12% for 500 g FM.
In the past 10 years, fan beam DXA systems have replaced virtually all pencil beam DXA systems. Koo et al. [48] scanned 14 piglets on a Hologic QDR-4500A (software version not reported). Duplicate DXA scans were highly reproducible with adjusted r2 values from 0.992–1.000. DXA-measured total body, bone mineral, lean and fat masses were validated against scale weight and chemical analysis of mineral ash, lean mass and FM, with adjusted r2 values from 0.974–0.999 and residual errors of 157, 27, 122 and 72 g, respectively. Thus, fan beam DXA has been shown to have very high precision and accuracy in piglets, similar to the previous generation pencil beam systems.
4.3. STANDARDIZED DXA PROCEDURES FOR INFANTS
26
To ensure high quality results, all aspects of the procedures should be well documented. For the highest quality data, the scan acquisition protocol, the make and model of DXA instrument, the clothing including nappy and blanket and the positioning of the infant must all be standardized. It should be noted that older pencil beam DXA systems, such as the Hologic QDR-1000/W, QDR-2000 and Lunar DPX-L, require an aluminium platform [46], but this is no longer needed

by current systems. Once the scan has been acquired, it needs to be reviewed for proper positioning and the presence of motion artefacts or foreign objects. Motion artefacts are common and can be the cause of scans being rejected. The software version should also be noted since changes occur over time and can impact the calibration used. When reporting values in journal publications, it is recommended to always report the in vivo test–retest precision for infant scans, in terms of a standard deviation or coefficient of variation in per cent.
Two scan modes are mostly used for infants and children under 6 years of age: total body and spine. Generally, these are special scan modes that may have to be installed or purchased in addition to the standard software. It is advisable to check with the DXA system representative to ensure that infant scans can be performed. Total body scans allow for the measurement of soft tissue composition and total body BMC. However, it is difficult to achieve high quality whole body scans due to movement. Total body scans can take 3–7 min. Infant spine scans can be as short as 15 s and the infant can be held by the shoulders and legs outside the scan field.
4.3.1. Preparing for the infant DXA exam
Before the DXA appointment. The infant DXA appointment should be scheduled preferably in the morning at a time that the infant would be napping. Ask the parent or caregiver to make sure the infant is dry, clean and wearing comfortable loose fitting clothing. He or she should also avoid dressing the infant in clothing with metal components such as buttons, pins or snaps. If possible, it is helpful to feed the infant at the DXA centre so the infant falls asleep immediately afterwards for the scanning.
Day of the DXA exam. On the day of the exam, check once again if the infant’s caregiver has complied with the above recommendations. Swaddle the infant in a blanket. Remove all artefacts, such as pins or any other objects, if possible. Infants over 3 months old may be scanned without swaddling and with only a nappy. Have a blanket or sheet on hand to cover the scan area. Consider having a new blanket for each infant DXA scan to avoid the need for washing. Make every effort to ensure that the infant is dry, clean and well fed before placing on the scanning table. All of this will help the infant remain calm during scanning. If the scans that day are follow-up scans, they should be acquired with
27
attention to all the details recorded regarding the previous visit, i.e. same scanner, clothing, scan mode, etc. Print out the previous images of the baseline scans to ensure that positioning and scan parameters can be duplicated.
Prepare the DXA biography and system before placing the infant on the table. Note that on some systems, such as the Hologic, the analysis will not choose the correct bone density threshold if the age is not correct. Make sure the

birth date is entered correctly as well as name, ethnicity, sex and patient ID. In addition, make sure the gantry arm is close to the starting position of the scan. For infant spine scans, this would be with the gantry in the centre of the table. For the total body scans, it would be with the arm at the starting place for the scan, typically near the head of the table.
4.3.2. Infant posteroanterior spine positioning and scanning
Have the parent or caregiver place the infant in the centre of the table. Position the laser light so it is centred 2 cm below the iliac crest (or navel). Feel for the top of the iliac crests to position accurately. Make sure the laser light is not in the infant’s eyes. As the image is being acquired, look at the scan image for scan quality. It is critical that there is no movement in the L1–L4 region. Light restraint to the infant’s arms and lower body may be needed to keep him or her still (see Fig. 7). If physical restraint is used, make sure the restrainer’s hands are not in the scan field. A lead apron may be worn to reduce scattered radiation dose to the restrainer. It is necessary to see the top of the iliac crests and all of L5.
FIG. 7. Example of light restraint during an infant spine scan. A second person could be used to restrain the shoulders if warranted. The scan starts near the navel and scans towards the head for Hologic and GE scanners. Make sure the adult’s hands and head are out of the scan area. (Photograph courtesy of C. Mukwasi, Zimbabwe.)
28
Include at least 5 vertebral bodies.If there is obvious movement during the scanning of L1–L4, click the
reposition button to stop the scan and start again. Never leave the infant unattended. No more than three attempts should be made to acquire the infant spine scan. If the infant is not cooperating, take a break and try again at a later

time. Repeat the scan if movement is visible on the scan image or if the image quality is questionable.
During acquisition, it is common for the image appearing on the screen not to be clearly visible due to the low BMD typically found in infants. If this is the case, and if the infant is lying still, continue the scan and then pull it back up on the screen after acquisition and adjust the brightness/contrast to assess the quality of the scan.
Observe the emerging image to ensure that the spine is centrally positioned, and is as straight as possible, and that the top of the iliac crests, all of L5 and the first set of ribs are visible (see Fig. 8). Some examples of good lumbar scans areshown in Fig. 9. If there is movement during the scan, continue the scan untilT12, then stop the scan and take another. Some examples of scans with motion are found in Section 4.4. If an error free scan is not acquired in three attempts, the
FIG. 8. Properly acquired DXA spine scans. Identifying the vertebrae can be challenging since the immature infant spine does not have distinctive shapes. Firstly, always make sure a scan starts below the iliac crests so that at least the top of the sacrum is visible. Label the vertebrae from the bottom up by confidently identifying L5 and L4. Then label L3 to L1. The first visible ribs cannot be assumed to be T12. (Scans courtesy of J. Shepherd, USA.)
29
FIG. 9. Acceptable infant spine scans for ages 6 months to 12 months (left to right). These scans could have started lower in order to visualize the sacrum, but L5 can still be confidently identified at the tip of iliac crest on all scans. The arrows are pointing to either breathing lines or intestinal gas. The vertebra was not disrupted so these are most likely not movement lines and the results should not be affected. The two scans on the right do not have any issues. (Scans courtesy of H. Kalkwarf, USA.)
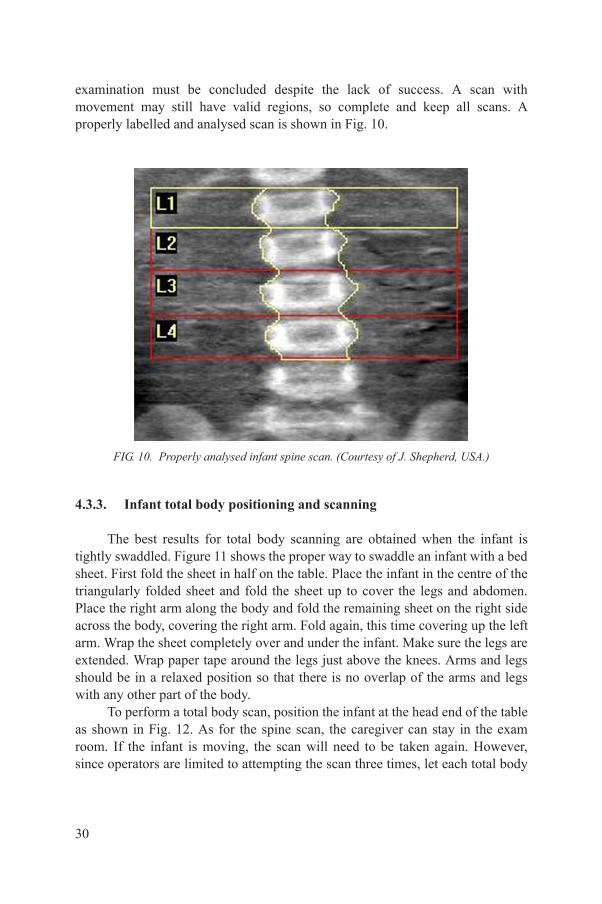
examination must be concluded despite the lack of success. A scan with movement may still have valid regions, so complete and keep all scans. A properly labelled and analysed scan is shown in Fig. 10.
4.3.3. Infant total body positioning and scanning
The best results for total body scanning are obtained when the infant is tightly swaddled. Figure 11 shows the proper way to swaddle an infant with a bed sheet. First fold the sheet in half on the table. Place the infant in the centre of the triangularly folded sheet and fold the sheet up to cover the legs and abdomen. Place the right arm along the body and fold the remaining sheet on the right side across the body, covering the right arm. Fold again, this time covering up the left arm. Wrap the sheet completely over and under the infant. Make sure the legs are extended. Wrap paper tape around the legs just above the knees. Arms and legs should be in a relaxed position so that there is no overlap of the arms and legs
FIG. 10. Properly analysed infant spine scan. (Courtesy of J. Shepherd, USA.)
30
with any other part of the body.To perform a total body scan, position the infant at the head end of the table
as shown in Fig. 12. As for the spine scan, the caregiver can stay in the exam room. If the infant is moving, the scan will need to be taken again. However, since operators are limited to attempting the scan three times, let each total body

scan complete, otherwise there is a risk of not having any data. If you have three scans with motion artefacts, you may be able to use valid regions from the three different scans to create a whole scan dataset.
Figure 13 shows an infant during a scan on a Hologic Discovery/Wi. Note that the infant is tightly swaddled and wearing a little cap. To keep the head straight, a folded towel was used. The legs were wrapped with masking tape on the outside of the swaddling and knees to keep the legs straight. An additional piece of tape was used to immobilize the legs. An example DXA scan is shown in
FIG. 11. Swaddling for total body DXA scan. (a) Lay the blanket or sheet out on a flat surface in the shape of a diamond. Place the infant on the blanket so that the head is towards the diamond peak. Bring the bottom of the blanket up over the legs and abdomen. Tuck the blanket under both arms. (b) Place the infant's left arm along the side of the body and then fold the right corner of the blanket tightly across the body, tucking it behind the opposite side of the back. (c) Bring the right arm along the side of the body outside the blanket and wrap the blanket completely over and under the infant. (d) Straighten the legs after swaddling by securing with a tape (can be seen in Fig. 13). Keep the legs as straight as possible. (Photograph courtesy of C. Mukwasi, Zimbabwe.)
FIG. 12. Top view of the DXA scan table showing the proper positioning of an infant for spine (left) and total body (right) scanning. (Courtesy of J. Shepherd, USA.)
31
Fig. 13.Scan analysis. There is no standardized analysis offered by either Hologic
or GE for infant total body scans. In general, most publications report total body values. Both manufacturers provide a general region of interest tool to place subregions on the infant. Placing individual regions on each of the arms, legs and head may provide a means for using valid regions from scans that contain isolated

motion artefacts (see Fig. 14). For example, if there is motion in the left arm in the first attempt of the total body scan in an otherwise valid scan, then the left arm from the second scan may be used to replace the value from the first scan in analysis.
4.3.4. Radiation dose considerations
Radiation dose from DXA scanning is dependent on the make, model and scan mode of the DXA system. Dose calculations have been made for children down to 5 years by Blake et al. [49] and for 1 year olds by Thomas et al. [50] when scanned on Hologic QDR 4500A and 4500W systems. Njeh et al. [51, 52] estimated dose for GE Lunar DPX-L systems. Reference [50] is most appropriate for spine and total body scans for 1 year olds. On the basis of Refs [49–52], it is reasonable to state that total body and spine scans for infants and young children
FIG. 13. Infant during a total body scan. Note that the legs are wrapped with masking tape around the outside of the knees to keep the legs straight. An additional piece of masking tape is placed over the legs and secured to the table edges to immobilize the legs. (Courtesy of J. Shepherd, USA.)
32
have an effective dose of 10 µSv or less. If the spine and total body scans are both attempted three times in a single visit, the X ray exposure to the infant would be up to (10 × 3) + (10 × 3) = 60 µSv (6 mrem). This dose and scan protocol conform to the principle of ALARA (as low as reasonably achievable). DXA is the lowest dose modality to quantify bone density and mass. For safety reasons, scanning is stopped after three scans to make sure the technologist performing the scan does not keep
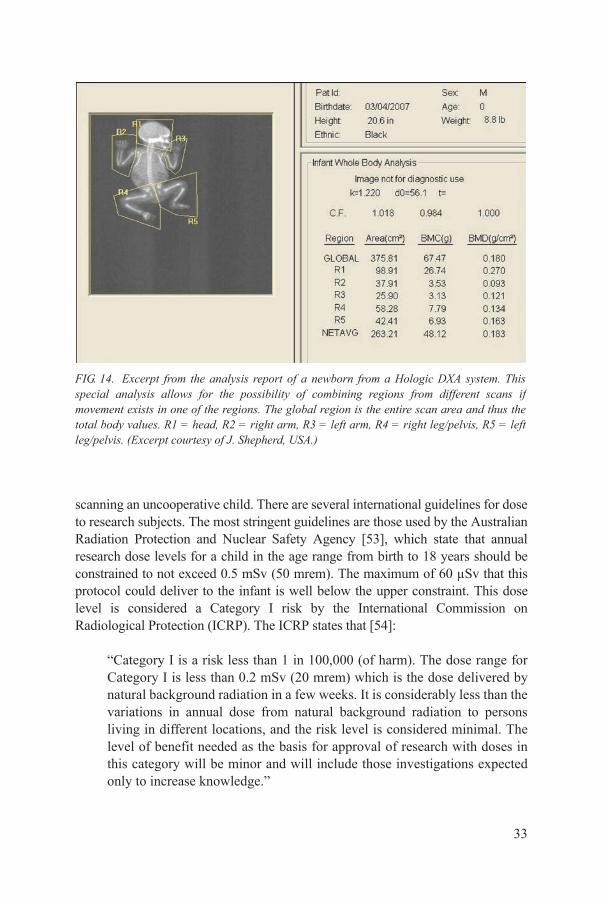
scanning an uncooperative child. There are several international guidelines for dose to research subjects. The most stringent guidelines are those used by the Australian Radiation Protection and Nuclear Safety Agency [53], which state that annual research dose levels for a child in the age range from birth to 18 years should be constrained to not exceed 0.5 mSv (50 mrem). The maximum of 60 µSv that this protocol could deliver to the infant is well below the upper constraint. This dose level is considered a Category I risk by the International Commission on Radiological Protection (ICRP). The ICRP states that [54]:
“Category I is a risk less than 1 in 100,000 (of harm). The dose range for Category I is less than 0.2 mSv (20 mrem) which is the dose delivered by
FIG. 14. Excerpt from the analysis report of a newborn from a Hologic DXA system. This special analysis allows for the possibility of combining regions from different scans if movement exists in one of the regions. The global region is the entire scan area and thus the total body values. R1 = head, R2 = right arm, R3 = left arm, R4 = right leg/pelvis, R5 = left leg/pelvis. (Excerpt courtesy of J. Shepherd, USA.)
33
natural background radiation in a few weeks. It is considerably less than the variations in annual dose from natural background radiation to persons living in different locations, and the risk level is considered minimal. The level of benefit needed as the basis for approval of research with doses in this category will be minor and will include those investigations expected only to increase knowledge.”

In summary, DXA scanning in infants is considered appropriate for measuring bone density and body composition, when designed to minimize dose to the participating infant and to have a minimal risk of harm.
4.4. POTENTIAL SOURCES OF ERROR
The single most limiting error for DXA scanning of infants is motion artefacts. Since a DXA scanner scans a line at a time, the infant must remain still for an extended period of time lasting from 30 s to several minutes. Motion artefacts present themselves as discontiguous bone or limbs. Sometimes long bones may look shortened. Movement, in the extreme case, looks like discontinuities in the bone or soft tissue when, from visual observation, there are no physical anomalies (e.g. missing arms, misalignment of long bones, etc.).
Motion artefacts are so common that a strategy to compensate for the lack of a perfect scan even after three attempts is needed (see Figs 15 and 16). Forspine scans, individual vertebrae can be eliminated if they contain an artefact. Note that if an avoidable artefact, such as motion, is present in one vertebrae, the infant should be rescanned up to three times to try to get a valid scan, saving each scan. Each scan should be analysed and individual vertebrae that have problems excluded. If all three scans are kept, there is the possibility of acquiring four valid vertebrae from different spine scans. This is referred to as ‘piecewise analysis’, using valid regions from different scans taken at the same visit to create a more complete analysis. Piecewise analysis should be done with caution and only as a
34
FIG. 15. DXA spine scans that are not acceptable due to acquisition errors and movement. Errors: (a) iliac crests not visible, L1 possible movement; (b) vertebrae look grainy and mottled, L4/L5 misaligned and probable movement, spine not centred; (c) iliac crest on bottom left of image misshapen, all vertebrae misshapen, probable movement; (d) iliac crests not visible, movement lines L3, L1 misaligned, probable movement. (Scans courtesy of H. Kalkwarf, USA.)

last resort since there is little validation data on this technique. Piecewise analysis could also be used for the total body if separate regions are defined for each arm, leg and for the torso and head.
Implementing the following will prevent errors in scan acquisition:
• Checking for correct and consistent positioning;• Making sure scans are performed using the same scan mode on each subject;• Removing all radiopaque objects from areas of interest;• No barium, nuclear medicine, or CT with contrast exams at least a week
prior to scheduling DXA;
In studies with foetal pigs, Koo et al. [55] found that acquiring scans with and without accessories commonly used in a hospital setting (e.g. intravenous catheters with attached tubing and connector; plastic identification tags; umbilical cord clamps; urine bags and feeding tubes) did not significantly impact the bone density
FIG. 16. (a) No movement. Scan is acceptable even though the arms are elevated. (b) Motion of the legs with poor projection of the arms. The scan should have been redone. (c) Motion in the arms and head. The scan should have been redone. (Scans courtesy of E. Fung, USA.)
35
and mineral values. However, the highest scan quality is obtained if these accessories are consistently included (or excluded) from serial scans.
The variations between different DXA technologies and DXA equipment and the software they use are a major source of error. Although they are all based on the same physical principles and assumptions, the various instruments differ in how the low and high energy beams are generated (filter versus switching

voltage), the imaging geometry (pencil versus fan beam), the X ray detectors, calibration methodology and the algorithms used in the software. Thus, it is difficult, if not impossible, to accurately compare quantitative results acquired on different makes of DXA systems. It is important that DXA users continue to use the same equipment with the same software for longitudinal studies or when carrying out cross-sectional population comparisons.
4.5. QUALITY CONTROL
The radiology centres must ensure the overall quality and completeness of the DXA data and that all protocols and procedures are strictly followed. DXA systems can be calibrated using phantoms. Phantoms are objects of a known quantity and density that simulate fat, soft tissue and bone and are used periodically to check the accuracy of the DXA system. Phantoms of human shapes or total body phantoms are preferred since they can be analysed using the same analysis regions and algorithms used for the infants. However, there are very few available. The Orthometrix ‘Oscar, Jr.’ phantom is suitable for DXA quality control (QC) purposes and is completely anthropomorphic with head, trunk, pelvis, arms and legs. It has a length of 145 cm and weighs 30 kg [56]. Hologic, Inc. also makes a total body phantom with a simple skeleton represented by blocks of aluminium [57]. Phantoms based on infant morphology have been used and compared with those of adults but are not commercially available [58]. The same scan mode of the DXA instrument as used for infant scanning should ideally be used to scan the paediatric QC phantom. Specific QC responsibilities include the following:
(1) The requirement that operators are properly trained and certified. If there are local, state, or national requirements for DXA operators, these must be met.
(2) The performance and review of QC scans on the day of each infant scan, but at least 3 times per week if scans take place fewer than three days weekly. Cross-calibration scans using travelling phantoms are to be performed if data is to be pooled between different DXA centres.
(3) Ensuring that proper archiving and backup procedures for participant scans
36
are performed and that archives are stored securely on appropriate archiving media until the end of each study.
(4) Ensuring the proper functioning of hardware and software and requesting service from the manufacturer. It is necessary to:

(a) Notify the service provider of any machine or software problems or if the scanner is being relocated.
(b) Record machine or software problems and service on a repair/service/upgrade form. Keep a copy in the DXA service logbook near the system.
(c) Perform 10 QC phantom scans before (if possible) and after all field service. The before and after average BMD and BMC results should not differ by more than 1%.
(d) Perform 10 QC phantom scans before and after scanner relocation. The before and after average BMD and BMC results should not differ by more than 1%.
(e) The DXA system should have regular preventive maintenance visits by manufacturer field service personnel.
To obtain consistent results, the densitometry operators must be aware of possible sources of error that may affect data collection and analysis. Only those operators who have been specifically trained in the scanning of infants with the specific DXA system either by representatives of the manufacturer or by other qualified personnel should be allowed to perform infant scanning. It is strongly recommended that each DXA centre have at least two people, preferably three, who are trained and certified for infant scanning. One person should be identified as the primary operator who will obtain the majority of the scans. This will reduce variability in scan acquisition.
4.6. REFERENCE DATA
Reference data for healthy infants and young children are available but there are several caveats to consider when using reference data for DXA. Firstly, DXA values for total body and infant spine have never been standardized. Known systematic differences exist between the Hologic, GE and Norland systems that are well described for adult spine [59], hip [60] and forearm [61] bone density. Secondly, the technology used to scan infants has been advancing over the last two decades and many of the systems used to create reference data are no longer in production. The old systems used different scan acquisition factors. These
37
factors include X ray beam geometry, X ray energies, hardness of the X ray spectra (i.e. removal of low energy X rays in the spectrum before the beam enters the infant using a metal filter), etc. It is beyond the scope of this section to describe all the specifications of each model system for different makes, but one has to be very careful when comparing an individual’s data to reference data to make sure their DXA system measurements are comparable to those used to
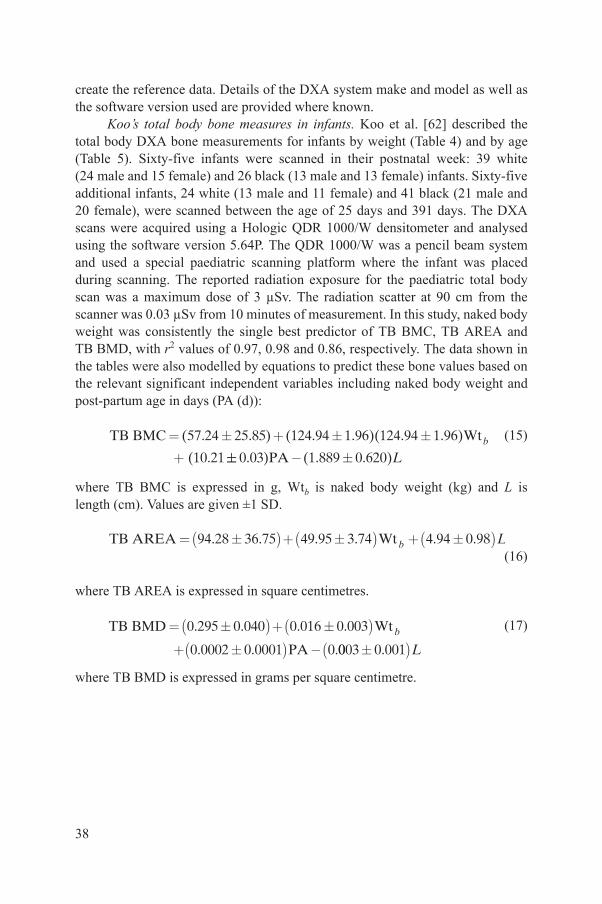
create the reference data. Details of the DXA system make and model as well as the software version used are provided where known.
Koo’s total body bone measures in infants. Koo et al. [62] described the total body DXA bone measurements for infants by weight (Table 4) and by age (Table 5). Sixty-five infants were scanned in their postnatal week: 39 white (24 male and 15 female) and 26 black (13 male and 13 female) infants. Sixty-five additional infants, 24 white (13 male and 11 female) and 41 black (21 male and 20 female), were scanned between the age of 25 days and 391 days. The DXA scans were acquired using a Hologic QDR 1000/W densitometer and analysed using the software version 5.64P. The QDR 1000/W was a pencil beam system and used a special paediatric scanning platform where the infant was placed during scanning. The reported radiation exposure for the paediatric total body scan was a maximum dose of 3 µSv. The radiation scatter at 90 cm from the scanner was 0.03 µSv from 10 minutes of measurement. In this study, naked body weight was consistently the single best predictor of TB BMC, TB AREA and TB BMD, with r2 values of 0.97, 0.98 and 0.86, respectively. The data shown in the tables were also modelled by equations to predict these bone values based on the relevant significant independent variables including naked body weight and post-partum age in days (PA (d)):
(15)
where TB BMC is expressed in g, Wtb is naked body weight (kg) and L is length (cm). Values are given ±1 SD.
(16)
where TB AREA is expressed in square centimetres.
(17)
where TB BMD is expressed in grams per square centimetre.
TB BMC Wt
(
= +
+
( . . ) ( . . )( . . )
.
57 24 25 85 124 94 1 96 124 94 1 96
10 21b
- 0 03 1 889 0 620. ) ( . . )PA L
TB AREA Wt= + + ( ) ( ) ( )94 28 36 75 49 95 3 74 4 94 0 98. . . . . .b L
TB BMD
PA
Wt= +
+ -
( ) ( )( )0 295 0 040 0 016 0 003
0 0002 0 0001 0
. . . .
. . .b
0003 0 001( ). L
38

TABLE 4. MEAN DXA VALUES AND STANDARD DEVIATIONS (SDs) FOR TOTAL BODY BONE MINERAL CONTENT (TB BMC), BONE AREA (TB AREA) AND AREAL BONE MINERAL DENSITY (TB BMD) AT 1 kg
Naked body weighta TB BMC (g) TB AREA (cm2) TB BMD (g/cm2)
g n Mean SD Mean SD Mean SD
2501–3500 48 64.5 8.2 298 20.5 0.216 0.016
3501–4500 23 79.7 9.7 345 27.9 0.231 0.016
4501–5500 9 109.4 8.6 446 26.2 0.245 0.014
5501–6500 10 128.6 14.6 508 21.2 0.253 0.025
6501–7500 12 161.4 17.9 579 32.3 0.278 0.020
7501–8500 9 199.9 19.9 642 43.4 0.311 0.019
8501–9500 8 228.7 23.0 708 46.6 0.323 0.023
9501–10 500 5 253.1 15.6 793 49.3 0.321 0.030
10501–13 500 6 300.9 32.9 841 52.5 0.358 0.033
a Intervals for naked body weight based on information in Ref. [62].
TABLE 5. MEAN DXA VALUES AND STANDARD DEVIATIONS (SDs) FOR TOTAL BODY BONE MINERAL CONTENT (TB BMC), BONE AREA (TB AREA) AND AREAL BONE MINERAL DENSITY (TB BMD) AT VARIOUS POSTNATAL AGE INTERVALS [62]
Postnatal age TB BMC (g) TB AREA (cm2) TB BMD (g/cm2)
d n Mean SD Mean SD Mean SD
1–8 65 68.2 10.2 308 26.4 0.221 0.017
9–90 16 103.4 21.4 431 58.1 0.238 0.022
39
91–150 17 137.1 20.0 527 45.4 0.259 0.024
151–270 12 196.4 26.6 650 64.3 0.302 0.018
271–390 20 253.2 41.3 754 87.8 0.335 0.029

Note that ethnicity, seasonal effects and sex did not survive as statistically significant effects in these models.
Rigo’s Hologic infant total body reference data. Body composition data on healthy newborn infants were acquired by Rigo et al. [47] using a Hologic QDR 2000 pencil beam DXA system. The scans were analysed using the infant whole body software V5.65P supplied by the manufacturer, which is identical to the V5.64P package previously described [63]. A total of 106 healthy, with appropriate weight for gestational age, newborn infants were studied. Of the 106 infants, 53 were healthy pre-term infants (25 male and 28 female) and 53 were healthy full-term infants (23 male and 30 female). Of those, 86 of the neonates were scanned during the first week following birth and 20 pre-term infants during the second week. Table 6 shows the prediction equations for the total body measurements and Fig. 17 shows the plots of each variable as a function of weight with percentiles.
Alos’ GE infant spine reference data. Alos et al. [64] scanned 155 infants and young children (77 male and 78 female) with a mixed ethnic distribution living in Montreal, Canada. Twenty five were newborns (13 male and 12 female). All children had normal weight and height for their age within the 5th to 95thpercentiles. L2–L4 lumbar spine BMD was measured using the GEProdigy (no software version stated). Note that representing the total spine region of interest
TABLE 6. INFANT DXA PREDICTION EQUATIONS FOR BONE AND BODY COMPOSITION [47]
LBM = 0.733BWtDXA + 50Sex + 250.0 (r2 = 0.98, SE = 81.8, p < 0.00001)
FM = 0.249BWtDXA – 49.7Sex – 238.2 (r2 = 0.85, SE = 80.4, p < 0.00001)
FM (%) =30.7 log BWtDXA – 2.1Sex – 89.3000 (r2 = 0.72, SE = 2.7, p < 0.00001)
BMC = 0.215BWtDXA – 12.6 (r2 = 0.94, SE = 4.33, p < 0.00001)
BA = 0.746BWtDXA + 51.33 (r2 = 0.95, SE = 13.5, p < 0.00001)
BMC = (8.311 × 10⁻⁴)A2 – (1.827 × 10⁻⁹)A4 – 0.13 (r2 = 0.96, SE = 3.6, p < 0.00001)
Note: LBM is lean body mass, FM is fat mass, BMC is bone mineral content, BA is bone area, BWtDXA is body weight as determined by DXA, Sex is sex (where female = 1, male = 2) and
40
A is bone area. SE is the standard error of the equation.

as L2–L4 was popular on GE Lunar systems in the 1980s and 1990s. GE has since standardized L1–L4. The mean and SD values are given in Table 7.
FIG. 17. Infant reference curves for bone and body composition reproduced from Ref. [47] with permission.
41
4.7. SUMMARY
DXA is a useful tool for quantifying whole body and regional bone, lean soft tissue and fat masses in infants and young children. Dedicated whole body and spine scans can be performed on children of all ages. The accuracy of DXA in young children has been shown to be very high in older systems and continued

validation is needed as newer models become available. A standard protocol for preparing infants for the scan, the scan acquisition and analysis has been presented. The most challenging aspect of DXA for this age group is that the infant must lie still for up to 5 minutes for the whole body scan. Otherwise, motion artefacts can invalidate the scan results. Example scans for both the whole body and spine were presented for both ideal acquisitions and problem scans. The scan dose is very low and of the order of the radiation a child would receive in 1 week from background natural sources living at sea level. The lack of descriptive DXA data on reference populations is one of the most limiting aspects of DXA in this age group. However, reference data for both boys and girls is available for the most popular makes and models and for some ethnicities. The future clinical and research utility of DXA in this age group requires expanding the reference data available, continued accuracy validation, a strong quality control programme that includes system calibration monitoring with phantoms and operator training to minimize motion artefacts and improper scan analysis.
TABLE 7. LUMBAR SPINE REFERENCE DATA FOR AREAL BONE MINERAL DENSITY (BMD) AND THE POPULATION SD FROM BIRTH TO 5 YEARS OF AGE FOR THE GE PRODIGY DXA SYSTEM [64]
Category n (children; total = 138) Mean L2–L4 lumbar BMD (g/cm2) SD (g/cm2)
0–1 months 14 0.302 0.037
1–3 months 12 0.310 0.030
3–6 months 14 0.323 0.027
6–12 months 22 0.351 0.041
1–2 years 20 0.411 0.054
2–3 years 18 0.515 0.065
3–4 years 20 0.580 0.054
y 18 0.618 0.079
42
Knowledge of these strengths and limitations is essential for the accurate and precise use of DXA in infants and young children.

5. AIR DISPLACEMENT PLETHYSMOGRAPHY
5.1. INTRODUCTION
Underwater weighing was one of the first methodologies successfully developed for body composition assessment in humans. Its early success contributed to its being elevated to gold standard status [65]. The applicability of air displacement plethysmography (ADP) for the assessment of body composition in humans has been developed over the last two decades [66, 67]. This methodology is used to obtain an accurate measurement of the body’s total volume, which is used with body weight to derive total body density (dTB). This, in turn, is used with the basic 2-C model of FM and FFM to calculate the body’s percentage of fat (%FM). This newer ADP approach has now replaced hydrodensitometry as the preferred method for the measurement of body density [65]. A primary contributing factor was the elimination of underwater measurement. Also, the excellent precision attained with ADP has contributed to this transition. Additionally, ADP is also favoured by many investigators because of its relatively low cost, low maintenance, high degree of operator friendliness, short measurement time, minimal need for subject compliance, minimal risks and the fact that it can be repeated as frequently as needed. The ability to examine infants, a goal unachievable with hydrodensitometry, has also led to ADP being the preferred methodology for paediatric applications.
A precise measurement of body weight is relatively easy to obtain, but an equally precise measurement of body volume is a more challenging task. As mentioned above, for many years, the method used to obtain a measurement of body density was weighing a person totally submersed in a tank of water, i.e. underwater weighing. The subject also had to exhale as much air as possible from their lungs while submersed [68]. In contrast, for an ADP measurement, the subject is placed in a chamber filled with air, not water. Therefore it is suitable for use with all age groups, including infants and younger children. The first commercially successful ADP instrument (BOD POD, Life Measurement, Inc., Concord, CA, USA, now manufactured by Cosmed, Rome, Italy) was designed for use with adults [66]. A second, smaller device, called the PEA POD, was developed for exclusive use with infants [69, 70] (Fig. 18). One limitation,
43
however, is that the PEA POD ADP instrument can no longer be used when infants reach about 10 kg body weight (at about 8 months of age). This is because the test chamber cannot accommodate larger body sizes. The adult sized ADP instrument (BOD POD) has been successfully used with smaller body sizes down to 6 years of age. The manufacturer (Cosmed, Rome, Italy) has also recently

FIG. 18. Infant sized PEA POD ADP with an infant in the test chamber and an operator observing the infant’s behaviour and the progress of the measurement on the display monitor. (Photograph courtesy of COSMED USA Inc., reproduced with permission.)
44
developed the ‘Pediatric Option’ insert that is reported to extend the application of the BOD POD to about 2 years of age (Fig. 19). Fields et al. [71], reporting the first evaluation of this device in 2–5 year olds, found it to provide accurate and precise estimates of %FM in this population. Whether this device can be used with appropriate software to cover the age gap of 8 months to 24 months is unknown. In the interim, however, continued successful comparisons of ADP

FIG. 19. Adult sized (BOD POD) ADP with paediatric insert. (a) The insert used to position the infant in the test chamber and the appropriate sized NIST certified calibration standard. (b) Child seated in the “Pediatric Option” insert positioned in the BOD POD test chamber. Note the cap on the child’s head used to cover the hair. (Photographs courtesy of COSMED
45
USA Inc., reproduced with permission.)

against multicompartment models, based on more complex methodologies, will only reinforce the acceptance of ADP as a reference method for the measurement of body composition in early infancy. This section addresses the application of this instrument.
5.2. BASIC PRINCIPLES OF ADP
ADP is based on the application of Boyle’s law, which describes the relationship between pressure (P) and volume (V) of a gas while held at a constant (isothermal) temperature:
(18)
that is, the product of pressure and volume is constant for a given temperature. The subscripts denote two different conditions such that when volume increases (or decreases) there is a corresponding decrease (or increase) in pressure. This pressure–volume relationship only applies for isothermal conditions, i.e. when the temperature of the gas remains unchanged. If the gas is not held at a constant temperature (adiabatic conditions), then the relationship between pressure and volume become more complex:
(19)
where the value for the exponent m is 1.4 for air. This means that for equal volume changes in air, the isothermal and adiabatic conditions will produce different pressure changes. A small pressure change in air under adiabatic conditions will be about 40% higher than under isothermal conditions. Alternately, air under isothermal conditions requires less pressure to achieve the same volume change as for adiabatic conditions. These differences are important when using ADP because air in close contact with the skin surface acts isothermally and can have a higher temperature than ambient air [66, 69, 70]. Likewise, air trapped in the lungs is best described as isothermal. Thus, two corrections are needed in order to appropriately adjust the initial raw measurement of body volume.
P V P V1 1 2 2=
P P V V m1 2 1 2/ /= ( )
46
5.2.1. Description and operation of the ADP instrument
The basic components and operation of the infant sized ADP instrument is similar to the adult instrument. One important exception, however, is that the infant device does not have the capacity to measure an infant’s lung volume,

which is instead calculated using a formula based on the infant’s age and body size [70]. It has been estimated that the error introduced by using the calculated value for lung volume instead of a measured value is less than ±0.5% for %FM.
The basic design of the infant ADP instrument consists of two air filled chambers of comparable volumes, connected by a common diaphragm, which is oscillated at a low frequency during the calibration set-up and subject testing. The oscillation of the diaphragm produces small volume changes within the two chambers that are equal in magnitude but opposite in sign. The concurrent fluctuations in pressure reflect differences in the relative chamber volume changes and are also in opposite directions. To calibrate the system, an object of known volume (National Institute Standards and Technology (NIST) reference standard) is placed in the test chamber and while the diaphragm is oscillated, the increase in pressure differences compared with an empty chamber is inversely related to the decreased volume available for air. This process is then repeated with the infant in the test chamber and the pressure changes are recorded and compared with those for the NIST standard. During the volume measurements, the pressure changes introduced by the oscillating diaphragm are quite small (<0.5 cm H2O), non-detectable by the infant and present no risk. The pressure change is comparable to the change in atmospheric pressure one experiences when moving up or down one floor in a building. A potential risk could be the buildup of CO2 in the test chamber if an infant were kept inside too long. However, the CO2 level inside the test chamber is continuously monitored and an alarm is sounded and the chamber door automatically opened to let in air from the room if the level exceeds safety limits. The door is normally held closed by an electromagnet for only a few seconds during the actual pressure measurements. If electrical power is interrupted, the magnet releases, the door opens and an alarm is sounded. Whenever an alarm is activated, further testing of infants is not allowed until a successful restart of the complete system.
In general, air in the test chamber exhibits adiabatic behaviour as it does not remain at a constant temperature during the testing phase. Some air in the chamber, however, does behave isothermally. This is the air close to the infant’s skin surface and within the lungs. If the isothermal nature of this air is not corrected for, the raw body volume estimate will be substantially inaccurate. To simulate the isothermal skin surface effect, the manufacturer has performed tests with thin aluminium sheets of various sizes and shapes in order to derive an
47
empirical correction factor (k) that is assumed constant per unit surface area [66, 69]. For an infant, the correction for the surface area artefact (SAA) becomes:
(20)SAA BSA= ´k

where body surface area (BSA; cm2) is obtained using the following equation [72]:
(21)
where L is length (cm) and Wt is weight (kg). During normal breathing the air in the lungs is called the thoracic gas volume (VTG (mL)) and is considered to be isothermal. If it was incorrectly assumed to be adiabatic, then the true volume would be overestimated by about 40%. In infants, it is difficult to measure VTG
accurately, thus an estimate is obtained based on the functional residual capacity (FRC (mL)) and the tidal volume (VT). The relationship between these different lung volume parameters is:
(22)
where
(23)
In infancy, there is a gradual increase in VT from 7 mL/kg at birth to about 9.5 mL/kg at 12 months. Thus, for a PEA POD measurement of an infant, neither of the two isothermal effects is directly measured, but instead are calculated based on the infant’s age and body size.
Assuming only adiabatic conditions, the difference in volume between the empty chamber and the chamber with an infant provides an initial raw estimate of the infant’s body volume (Vr). When the two isothermal effects are taken into consideration, the true total body volume (VTB) is:
(24)
Total body density (dTB) can then be defined as the ratio of body weight to VTB. Body weight can be measured with good accuracy, therefore most of the error for the body density value can be attributed to the error in measuring body volume.
BSA Wt= ´ ´178 27 0 5 0 4838. . .L
V VTG TFRC= + ´0 5.
FRC Wt= ´ ´2 36 0 75 0 63. . .L
V V VTB r TGSAA= - + ´40%
48
5.3. ADP MEASUREMENT PROTOCOL
Before performing measurements in infants, the instrument should be powered up for at least 60–90 min, located in a relatively stable temperature and humidity environment and have successfully completed a series of self-checking

tests without an error message. Then, a solid aluminium cylinder of known weight is placed on the tray of the electronic scales to verify its calibration. Next, the volume calibration is performed firstly with the test chamber empty and secondly with an aluminium cylinder of known volume. Both the weight and volume standards are certified by NIST. Only when each of these calibration steps has been successfully completed can the instrument be used to measure infants.
At the start of the measurement, general anthropometric information including sex, date of birth and body length must be provided. The infant’s body length can be measured with a commercial infant length board. Next, the infant is placed on the open tray of the electronic scales and multiple readings are obtained within a few seconds, averaged and automatically recorded. The infant is then placed headfirst in a supine position into the test chamber (Figs 18 and 20). The operator closes the chamber door and starts the system’s software which automatically controls the oscillations of the diaphragm, measurement of pressure changes and calculation of the infant’s body volume including isothermal corrections. During this time, which takes approximately 1–2 minutes to complete, the operator is in direct view of the infant’s movements and behaviour (Fig. 18). When the measurement is complete, the chamber door automatically opens allowing recirculation of air from the room into the chamber. At any time, the operator can easily manually abort a measurement by opening the chamber door or using the abort button on the system’s console. Typically, two sets of measurements are obtained. If the values for body volume differ by more than 2%, a third measurement is recommended. If the infant is crying excessively, it is recommended that the test be stopped, the infant removed from the chamber and calmed before restarting. If the infant urinates or defecates during the volume measurement, the full set of procedures should be repeated, starting with the body weight measurement. Also, if an infant has a substantial amount of head hair, a few drops of baby oil can be rubbed onto the hair in order to mat it closer to the head. This is necessary because air trapped in the hair tends to act isothermally and thus would introduce an error for the body volume estimate [69, 73]. An equally effective solution is to compress the hair close to the head by placing a tightly woven nylon net (wig cap) on the infant’s head (Fig. 20).
5.3.1. Two compartment body composition model
49
The basic 2-C model, where body weight equals FM plus FFM, is used for the routine ADP measurement. Total body volume (VolTB) is the sum of the volumes of the two compartments and body density (dTB) is weight/VolTB. That is:
(25)Wt FM FFM= +

FIG. 20. PEA POD used for body composition assessment in Ethiopia. Note the cap on the infant’s head used to cover the hair in (b). (Photographs courtesy of K. Fleischer Michaelsen,
50
Denmark and T. Girma, Ethiopia.)

(26)
(27)
If the density for each of the two compartments is known and denoted as dFM for FM and dFFM for FFM, respectively, then the percentage content of either compartment can be calculated. For example, the body’s percentage fat (%FM) is
(28)
where
(29)
and
(30)
The density of fat is assumed constant (0.903 ± 0.003 g/mL). The density of FFM is not constant, increasing slightly with age by about 0.009 g/mL (<1%) from birth to 24 months of age. This change in density reflects the changes in the relative proportions of water, protein and mineral that make up the FFM. Two sets of age and sex dependent estimates for the density of FFM are provided in Table 8 for infants and young children from birth to 24 months. The values of Fomon et al. [36] are for a hypothetical model, whereas those of Butte et al. [19] were obtained in a 2 year longitudinal study of contemporary infants. There are small differences for dFFM between the two studies, with the values for the Butte model consistently lower by about 0.003 g/mL (0.4%) during the first 9 months. The largest differences are at 2 weeks of age, where the Fomon values are about 0.010 g/mL higher. This means that for the same body density value (obtained with an ADP measurement), the Butte model will result in a lower %FM than the Fomon model at younger ages, while the opposite occurs after 3 months. This discrepancy has not been fully resolved, but recent studies seem to favour the Fomon model for the first weeks of life, while the Butte model may be the better choice for older children [74, 75].
Vol = Vol + VolTB FM FFM
dTB TBWt/Vol=
%FM /1 TB= ´ -100 2( )k d k
k d d d d1 = ´ -( ) ( )FM FFM FFM FM/
k d d d2 = -FM FFM FM/( )
51
5.4. POTENTIAL SOURCES OF ERROR
A validation study of the infant ADP system (PEA POD) was performed with 49 full-term infants, ages 1.7 (12 d) to 23 weeks and weight 2.7–7.1 kg [73].

The measurement precision (reproducibility) for %FM was 0.4 ± 1.3%. The accuracy of %FM for the PEA POD was assessed by comparison with a 4-C reference model based on the measurements of body water, potassium and bone mineral content. This is the same multicompartment model as used by Fomon et al. [36] and Butte et al. [19]. The mean %FM obtained using the PEA POD system (16.9 ± 6.5%) was not statistically different (paired t-test, p > 0.05) from the %FM for the 4-C reference model (16.3 ± 7.2%). Regression analysis (p < 0.001) indicated slope and intercept values not statistically different from 1 and 0, respectively. Additional tests were performed for precision and accuracy including effects of infant behaviour (sleeping, awake and crying) while in the test chamber and using oil on the infant’s hair. The study concluded that the PEA POD system provided reliable, accurate and immediate assessments of %FM in infants [19]. Furthermore, it was noted that the ease of use, minimal safety
TABLE 8. ESTIMATES OF DENSITY (g/mL) OF FFM IN INFANCY AND EARLY CHILDHOOD USED FOR ADP
Age (months)Fomon et al. [36]a Butte et al. [19]b
Boys Girls Boys Girls
Birth 1.063 1.064 — —
0.5 1.064 1.064 1.054 ± 0.006 1.053 ± 0.005
3 1.065 1.066 1.061 ± 0.005 1.060 ± 0.006
6 1.066 1.067 1.062 ± 0.004 1.062 ± 0.006
9 1.068 1.068 1.066 ± 0.004 1.066 ± 0.006
12 1.068 1.069 1.068 ± 0.005 1.070 ± 0.005
18 1.070 1.070 1.072 ± 0.004 1.072 ± 0.005
24 1.072 1.071 1.077 ± 0.005 1.073 ± 0.005
a Standard deviation values were not calculated.b Mean ± standard deviation.
52
concerns and bedside accessibility were also important contributing factors when considering body fat measurements in a clinical setting.

5.5. QUALITY CONTROL
The first step for good quality control is to follow the instrument’s calibration procedures and instructions for handling infants. In order to obtain the isothermal corrections related to body surface area and lung volume, the operator needs to obtain accurate measurements of the infant’s weight and body length. An error of 1 cm in length can translate to a 0.5% error in the estimate of body volume. The infant’s behaviour while in the test chamber needs to be monitored as excessive crying can introduce up to a 1% error for %FM. Equally important is the use of a correct date of birth, otherwise an unsuitable dFFM value may be used. The operator needs to have some knowledge of the range of possible %FM values in order to identify potential outliers. This may indicate an instrument malfunction, incorrect calibration or misentry of an anthropometric parameter. Although there are minimal risks, no further measurements of infants should be performed until the problem is appropriately identified and corrected.
5.6. REFERENCE DATA
The use of the ADP methodology is relatively new in paediatrics. Hence there have been no systematic national or international studies specifically focused on establishing ADP based reference values. Several multicentre studies, however, have reported cross-sectional and longitudinal measurements, mainly focused on exclusively breastfed infants and the neonatal period [74–76]. The 95% ranges for %FM values during the first 4 months of life reported by Fields et al. [72, 74] are presented in Fig. 21. Although there is now a general acceptance of the one commercially available ADP instrument (PEA POD), which consistently and accurately measures body volume, differences remain in its translation to a correct %FM value. These differences have been traced to the values for the hydration of FFM during the first months of life [77, 78].
5.7. SUMMARY
The advantages offered by ADP, such as its operator friendliness, high
53
precision, brief measurement time, low cost, low maintenance, low risk, its lack of need for subject compliance and the unlimited possibility of repetition, has enabled it to overtake hydrodensitometry as the primary method for measuring

body density. Additionally, the inconvenience of the underwater measurement involved in hydrodensitometry was a significant motivation to replace this technique. ADP is the preferred means for conducting paediatric measurements, as hydrodensitometry cannot be used with infants.
However, ADP has one significant limitation: the time window between 8 months and 2 years of age during which measurement is not possible by this method. This is because the infant sized instrument can only be used by babies of less than 10 kg, a weight they reach approximately 8 months after birth, while the adult sized equipment adapted for paediatric use is only suitable for children aged two years and over. It is hoped that further research and possible software modifications may establish a methodology for using the same instruments to perform ADP in children aged between 8 and 24 months. However, independently of the success of these investigations, it seems likely that
FIG. 21. The 2.5–97.5 percentile range of %FM values for breastfed infants from birth to 4 months of age [74]. (Figure courtesy of K. Ellis, USA.)
54
continued comparisons of ADP against multi-compartment models will further increase its acceptance as a reference method for body composition measurement.

REFERENCES
[1] BARKER, D.J., The developmental origins of adult disease, J. Am. Coll. Nutr. 23 6 Suppl. (2004) 588S–595S.
[2] THE INTERNATIONAL BANK FOR RECONSTRUCTION AND DEVELOPMENT/ THE WORLD BANK, Repositioning Nutrition as Central to Development: A Strategy for Large-Scale Action, World Bank, Washington D.C. (2006).
[3] WHITWORTH, M., et al., Ultrasound for fetal assessment in early pregnancy, Cochrane Database Syst. Rev. 4 (2010) CD007058.
[4] WORLD HEALTH ORGANIZATION, WHO Child Growth Standards: Length/ Height-for-Age, Weight-for-Age, Weight-for-Length, Weight-for-Height and Body Mass Index-for-Age: Methods and Development, WHO, Geneva (2006).
[5] VICTORA, C.G., et al., Worldwide timing of growth faltering: Revisiting implications for interventions, Pediatrics 125 3 (2010) e473–e480.
[6] YAJNIK, C.S., et al., Neonatal anthropometry: The thin-fat Indian baby. The Pune maternal nutrition study, Int. J. Obes. Relat. Metab. Disord. 27 2 (2003) 173–180.
[7] KENSARA, O.A., et al., Substrate-energy metabolism and metabolic risk factors for cardiovascular disease in relation to fetal growth and adult body composition, Am. J. Physiol. Endocrinol. Metab. 291 2 (2006) E365–371.
[8] CORVALAN, C., et al., Impact of growth patterns and early diet on obesity and cardiovascular risk factors in young children from developing countries, Proc. Nutr. Soc. 68 3 (2009) 327–337.
[9] KAIN, J., et al., Accelerated growth in early life and obesity in preschool Chilean children, Obesity (Silver Spring) 17 8 (2009) 1603–1608.
[10] IANNOTTI, L.L., et al., Growth and body composition of Peruvian infants in a periurban setting, Food Nutr. Bull. 30 3 (2009) 245–253.
[11] LARTEY, A., Maternal and Child nutrition in Sub-Saharan Africa: Challenges and interventions, Proc. Nutr. Soc. 67 1 (2008) 105–108.
[12] WELLS, J.C., et al., Body composition by 2H dilution in Gambian infants: Comparison with UK infants and evaluation of simple prediction methods, Br. J. Nutr. 102 12 (2009) 1776–1782.
[13] AHMAD, I., et al., Body composition and its components in preterm and term newborns: A cross-sectional, multimodal investigation, Am. J. Hum. Biol. 22 1 (2010) 69–75.
[14] ELLIS, K.J., Evaluation of body composition in neonates and infants, Semin. Fetal Neonat. Med. 12 1 (2007) 87–91.
[15] INTERNATIONAL ATOMIC ENERGY AGENCY, Assessment of Body Composition and Total Energy Expenditure in Humans Using Stable Isotope Techniques, IAEA Human Health Series No. 3, IAEA, Vienna (2009).
[16] INTERNATIONAL ATOMIC ENERGY AGENCY, Introduction to Body Composition
55
Assessment Using the Deuterium Dilution Technique with Analysis of Salvia Samples by Fourier Transform Infrared Spectrometry, IAEA Human Health Series No. 12, IAEA, Vienna (2011).

[17] INTERNATIONAL ATOMIC ENERGY AGENCY, Introduction to Body Composition Assessment Using the Deuterium Dilution Technique with Analysis of Urine Samples by Isotope Ratio Mass Spectrometry, IAEA Human Health Series No. 13, IAEA, Vienna (2011).
[18] INTERNATIONAL ATOMIC ENERGY AGENCY, Dual Energy X Ray Absorptiometry for Bone Mineral Density and Body Composition Assessment, IAEA Human Health Series No. 15, IAEA, Vienna (2011).
[19] WANG, Z.M., PIERSON, R.N., JR., HEYMSFIELD, S.B., The five-level model: A new approach to organizing body-composition research, Am. J. Clin. Nutr. 56 1 (1992) 19–28.
[20] BUTTE, N.F., et al., Body composition during the first 2 years of life: An updated reference, Pediatr. Res. 47 5 (2000) 578–585.
[21] DE BRUIN, N.C., et al., Quantitative assessment of infant body fat by anthropometry and total-body electrical conductivity, Am. J. Clin. Nutr. 61 2 (1995) 279–286.
[22] ELLIS, K.J., Human body composition: in vivo methods, Physiol. Rev. 80 2 (2000) 649–680.
[23] PADOAN, A., et al., Differences in fat and lean mass proportions in normal and growth-restricted fetuses, Am. J. Obstet. Gynecol. 191 4 (2004) 1459–1464.
[24] BAUER, K., et al., Body composition, nutrition, and fluid balance during the first two weeks of life in preterm neonates weighing less than 1500 grams, J. Pediatr. 118 4 (1991) 615–620.
[25] VALERIO JIMENEZ, O.S., et al., Pre-term infant volume measurements by acoustic plethysmography, J. Biomed. Eng. 15 2 (1993) 91–98.
[26] CONWAY, J.M., NORRIS, K.H., BODWELL, C.E., A new approach for the estimation of body composition: Infrared interactance, Am. J. Clin. Nutr. 40 6 (1984) 1123–1130.
[27] KATCH, F., MICHAEL, E.D., HORVATH, S.M., Estimation of body volume by underwater weighing: Description of a simple method, J. Appl. Physiol. 23 5 (1967) 811–813.
[28] BORKAN, G.A., et al., Relationships between computed tomography tissue areas, thicknesses and total body composition, Ann. Hum. Biol. 10 6 (1983) 537–545.
[29] BORKAN, G.A., et al., Age changes in body composition revealed by computed tomography, J. Gerontol. 38 6 (1983) 673–677.
[30] COHN, S.H., ELLIS, K.J., WALLACH, S., In vivo neutron activation analysis. Clinical potential in body composition studies, Am. J. Med. 57 5 (1974) 683–686.
[31] WANG, Z.M., et al., Five-level model: Reconstruction of body weight at atomic, molecular, cellular and tissue-system levels from neutron activation analysis, Basic Life Sci. 60 (1993) 125–128.
[32] O’GRADY, S.P., et al., Accuracy and precision of a laser-spectroscopy approach to the analysis of δ2H and δ18O in human urine, Isotopes Environ. Health Stud. 46 4 (2010) 476–483.
56
[33] RACETTE, S.B., et al., Relative dilution spaces of 2H- and 18O-labeled water in humans, Am. J. Physiol. Endocrin. Metabol. 267 4 (1994) E585-E590.
[34] WONG, W.W., LEE, L.S., KLEIN, P.D., Deuterium and oxygen-18 measurements on microliter samples of urine, plasma, salvia, and human milk, Am. J. Clin. Nutr. 45 5 (1987) 905–913.
[35] SCHOELLER, D.A., “Hydrometry”, Human Body Composition (ROCHE, A.F., HEYMSFIELD, S.B., LOHMAN, T.G., Eds), Human Kinetics, Champaign, IL (1996) 25–44.
[36] FOMON, S.J., et al., Body composition of reference children from birth to age 10 years, Am. J. Clin. Nutr. 35 5 (1982) 1169–1175.
[37] FRIIS-HANSEN, B., Changes in body water compartments during growth, Acta Paediatr. 46 Suppl. 110 (1957) 1–68.
[38] MELLITS, E.D., CHEEK, D.B., The assessment of body water and fatness from infancy to adulthood, Monogr. Soc. Res. Child Dev. 35 7 (1970) 12–26.
[39] BUTTE, N.F., WONG, W.W., GARZA, C., Prediction equations for total body water during early infancy, Acta Paediatr. 81 3 (1992) 264–265.
[40] MORGENSTERN, B.Z., MAHONEY, D.W., WARADY, B.A., Estimating total body water in children on the basis of height and weight: A reevaluation of the formulas of Mellits & Cheek, J. Am. Soc. Nephrol. 13 7 (2002) 1884–1888.
[41] WELLS, J.C.K., et al., Prediction of total body water in infants and children, Arch. Dis. Child. 90 9 (2005) 965–971.
[42] HOBBIE, R.K., Intermediate Physics for Medicine and Biology, AIP Press, New York (1997).
[43] WEBB, S. (Ed.), The Physics of Medical Imaging, Taylor & Francis, London (1996).[44] LIDE, D.R. (Ed.), CRC Handbook of Chemistry and Physics, 89th edn, CRC Press,
Boca Raton, FL (2008).[45] NORD, R., PAYNE, H., Body composition by dual-energy X-ray absorptiometry — a
review of the technology, Asia Pac. J. Clin. Nutr. 4 (1995) 167–171.[46] KOO, W.W., HOCKMAN, E.M., HAMMAMI, M., Dual energy X-ray absorptiometry
measurements in small subjects: Conditions affecting clinical measurements, J. Am. Coll. Nutr. 23 3 (2004) 212–219.
[47] RIGO, J., et al., Reference values of body composition obtained by dual energy X-ray absorptiometry in preterm and term neonates, J. Pediatr. Gastroenterol. Nutr. 27 2 (1998) 184–190.
[48] KOO, W.W., HAMMAMI, M., HOCKMAN, E.M., Use of fan beam dual energy X-ray absorptiometry to measure body composition of piglets, J. Nutr. 132 6 (2002) 1380–1383.
[49] BLAKE, G.M., NAEEM, M., BOUTROS, M., Comparison of effective dose to children and adults from dual X-ray absorptiometry examinations, Bone 38 6 (2006) 935–942.
[50] THOMAS, S.R., et al., Effective dose of dual-energy X-ray absorptiometry scans in children as a function of age, J. Clin. Densitom. 8 4 (2005) 415–422.
[51] NJEH, C.F., et al., Radiation dose and in vitro precision in paediatric bone mineral density measurement using dual X-ray absorptiometry, Br. J. Radiol. 70 835 (1997) 719–727.
[52] NJEH, C.F., et al., Radiation exposure in bone mineral density assessment, Appl. Radiat.
57
Isot. 50 1 (1999) 215–236.[53] AUSTRALIAN RADIATION PROTECTION AND NUCLEAR SAFETY AGENCY
(ARPANSA), Code of Practice for the Exposure of Humans to Ionizing Radiation for Research Purposes, Radiation Protection Series No. 8, Commonwealth of Australia, Barton (2005).

[54] INTERNATIONAL COMMISSION ON RADIOLOGICAL PROTECTION, Radiological Protection in Biomedical Research, Publication 62, Pergamon Press, Oxford and New York (1992).
[55] KOO, W.W., WALTERS, J., BUSH, A.J., Technical considerations of dual-energy X-ray absorptiometry-based bone mineral measurements for pediatric studies, J. Bone Miner. Res. 10 12 (1995) 1998–2004.
[56] ORTHOMETRIX, Inc., Universal Whole Body DXA Phantom — Oscar, Jr. (accessed 2011-9-13), http://www.orthometrix.net/products/diagnostic/oscar/.
[57] DIESSEL, E., et al., Evaluation of a new body composition phantom for quality control and cross-calibration of DXA devices, J. Appl. Physiol. 89 2 (2000) 599–605.
[58] PICAUD, J.C., et al., First all-solid pediatric phantom for dual X-Ray absorptiometry measurements in infants, J. Clin. Densitom. 6 1 (2003) 17–23.
[59] HUI, S.L., et al., Universal standardization of bone density measurements: a method with optimal properties for calibration among several instruments, J. Bone Miner. Res. 12 9 (1997) 1463–1470.
[60] LU, Y., et al., Standardization of bone mineral density at femoral neck, trochanter and Ward’s triangle, Osteoporos. Int. 12 6 (2001) 438–444.
[61] SHEPHERD, J.A., et al., Universal standardization of forearm bone densitometry, J. Bone Miner. Res. 17 4 (2002) 734–745.
[62] KOO, W.W., et al., Postnatal development of bone mineral status during infancy, J. Am. Coll. Nutr. 17 1 (1998) 65–70.
[63] PICAUD, J.C., et al., Evaluation of dual-energy X-ray absorptiometry for body-composition assessment in piglets and term human neonates, Am. J. Clin. Nutr. 63 2 (1996) 157–163.
[64] ALOS, N., et al., “Pediatric Reference Data for Bone Mineral Density of the Lumbar Spine in Infants and Young Children (0–5 Years)”, 2006 Annual Mtg of the American Society for Bone and Mineral Research, Philadelphia, PA, 2006 (abstract).
[65] DEWIT, O., et al., Whole body air displacement plethysmography compared with hydrodensitometry for body composition analysis, Arch. Dis. Child. 82 2 (2000) 159–164.
[66] DEMPSTER, P., AITKENS, S., A new air displacement method for determination of human body composition, Med. Sci. Sports Exerc. 27 12 (1995) 1692–1697.
[67] FIELDS, D.A., GORAN, M.I., MCCRORY, M.A., Body-composition assessment via air-displacement plethysmography in adults and children: A review, Am. J. Clin. Nutr. 75 3 (2002) 453–467.
[68] GOING, S.B., “Hydrodensitometry and air displacement plethysmography”, Human Body Composition (HEYMSFIELD, S.B., LOHMAN, T.G., WANG, Z.M., GOING, S.B., Eds) Human Kinetics, Champaign, IL (2005) 17–34.
[69] URLANDO, A., DEMPSTER, P., AITKENS, S., A new air displacement plethysmograph for the measurement of body composition in infants, Ped. Res. 53 3
58
(2003) 486–492.[70] MA, G.S., et al., Validation of a new pediatric air-displacement plethysmograph for
assessing body composition in infants, Am. J. Clin. Nutr. 79 4 (2004) 653–660.

[71] FIELDS, D.A., et al., “Evaluation of air-displacement plethysmography whole body composition in children 2–5 years old using the 4-compartment model as a criterion method”, Pediatric Academic Societies and Asian Society for Pediatric Research (PAS/ASPR) 2011 Joint Mtg, Denver, CO, 2011 (abstract).
[72] BOYD, E., The experimental error inherent in measuring the growing human body, Am. J. Phys. Anthropol. 13 3 (1929) 389–432.
[73] ELLIS, K.J., et al., Body-composition assessment in infancy: Air-displacement plethysmography compared with a reference 4-compartment model, Am. J. Clin. Nutr. 85 1 (2007) 90–95.
[74] FIELDS, D.A., et al., Longitudinal body composition data in exclusively breast-fed infants: A multicenter study, Obesity (Silver Spring) 19 9 (2011) 1887–1891.
[75] ROGGERO, P., et al., Quality of growth in exclusively breast-fed infants in the first six months of life: An Italian study, Pediatr. Res. 68 6 (2010) 542–544.
[76] ROGGERO, P., et al., Neonatal period: Body composition changes in breast-fed full-term newborns, Neonatology 97 2 (2010) 139–143.
[77] ERIKSSON, B., et al., Fat-free mass hydration in newborns: Assessment and implications for body composition studies, Acta Paediatr. 100 5 (2011) 680–686.
[78] ERIKSSON, B., LOF, M., FORSUM, E., Body composition in full-term healthy infants measured with air displacement plethysmography at 1 and 12 weeks of age, Acta Paediatr. 99 4 (2010) 563–568.
59

.

CONTRIBUTORS TO DRAFTING AND REVIEW
Butte, N. Baylor College of Medicine, United States of America
Davidsson, H. Bor, Sweden
Davidsson, L. International Atomic Energy Agency
Deshmukh, U. King Edward Memorial Hospital and Research Centre, India
Ellis, K. Baylor College of Medicine, United States of America
Ferriolli, E. University of Sao Paulo, Brazil
Fleischer Michaelsen, K. University of Copenhagen, Denmark
Forsum, E. Linköping University, Sweden
Fung, E. Children’s Hospital of Oakland, United States of America
Girma, T. University of Jimma, Ethiopia
Good, S. Swiss Federal Institute of Technology, Switzerland
Heymsfield, S.B. Pennington Biomedical Research Center, United States of America
Hills, A.P. Queensland University of Technology, Australia
Huq, S. International Centre for Diarrhoeal Disease Research, Bangladesh
Jackson, A.A. University of Southampton, United Kingdom
Kalkwarf, H.J. Cincinnati Children's Hospital Medical Center, United States of America
Kurpad, A. St. John’s National Academy of Health Sciences, India
Liu, A. Ministry of Health, China
Mukwasi, C. University of Zimbabwe, Zimbabwe
61

Norris, S. University of the Witwatersrand, South Africa
Pettifor, J. University of the Witwatersrand, South Africa
Pietrobelli, A. Verona University Medical School, Verona, Italy
Poh, B.K. National University of Malaysia, Malaysia
Shepherd, J. University of California at San Francisco, United States of America
Siberry, G. Eunice Kennedy Shriver National Institute of Child Health and Human Development, United States of America
Slater, C. International Atomic Energy Agency
Thame, M. University of the West Indies, Jamaica
Uuay, R. University of Chile, Chile
Villegas Valle, C. University of Sonora, Mexico
Ward, L. University of Queensland, Australia
Westerterp, K. Maastricht University, Netherlands
62

@������
��������� ���������������� ��������������������������������� �������������������������� ������������ ���������
����������������������������������� �������������������������������� ����� !"����������
������ �#��������� ��� ��$�����%&'�(� �������)�����*�+!,�*�-.-/��
+�������0�1%.�-�2/.3�4444�5�6�70�1%.�-�2/.3�44''��
���0����$��8������ ��������5�(���� �0�� �099���������� ��������
!� " �#:�������;��������$��������)��/3/��<=..23�<��������
+�������0�1-/�/�>-'�&-�3'�5�6�70�1-/�/�>-'�3'�&.��
���0��������������8������������5�(���� �0�� �099��������=��=���������
$���%�<������������ ����&>3.�6������<$��� � ��/33��;�������*#�/343%=&-&%��� ���
+�������0�.='33='%>=-&>4�5�6�70�.='33='%>=-&>3��
���0���� ��������8�����������5�(���� �0�� �099���������������
)������������?�!�������; ����.=>-%2�!��� ���)����" �����"� �����@.:�2:-��
+�������0�1%.-�4&>�/%%>�5�6�70�1%.-�4&>�4%%3��
���0���������� 8����������������5�(���� �0�� �099��������������������
$& ������������ ������!�����0�!���������������?������� ���!������ ����+����� ��� �� ������"��<�7�/.3-��<���?�
$'�$&���(�! $ ������!A�� �)�"���@�����$��-&4��.'3�/.�������2��
+�������0�1&/3�/%%3-�>-%&�5�6�70�1&/3�/'&'/�.%&%��
���0������8��������B�5�(���� �0�� �099������������B�
) � ��%��� �������@������������"�<"C�./'�D@������� ��.E��6��=33.3.�,������
+�������0�1->'�2�./.�&.�5�6�70�1->'�2�./.�&&>3��
���0���� ���8��� �����������5�(���� �0�� �099������� �����������
)���$�6���=�� ��>������:����������"��<�7�/>��6=4>2/.������!���7�.2��
+�������0�1--�.�&/�3.�&2�&2�5�6�70�1--�.�&/�3.�23�23��
���0������� 8������ ����5�(���� �0�� �099����������� ����
;�$����� � ��.&>�����������$?����2&/-%�!������!���7��
+�������0�1�--�.�&4�&3�%4�3/�5�6�7�1--�.�&4�&3�%4�3/��
���0��������$�����8�$��������5�(���� �0�� �099�����$��������
"��#��*��"=F���?��F�� ����=�����F���?��G��,�����,��?�� ���.3��#=>-..-�<�����
+�������0�1�&2�//'�2&�23�/3�5�6�70�1&2�//'�2&�23�/3����1&2�//'�2&�23�///��
���0���� ���?8���=$���?����5�(���� �0�� �099�������=$���?����
&��"��*;��� �����; ����<��������� ����"��<�7�./%��,=.%>%�<������ ��
+�������0�1-%�.�/>4�4444�5�6�70�1-%�.�/>4�4&4/�5����0������8��� ��������
�% ��������������G������.� �6�����#������,������.>��:�����,������*��?��<������� � ���*�����&33�33.���
+�������0�12.�//�//%.42/%9/4�5�6�70�12.�//�//%.42/'��
���0�����8$�������5�(���� �0�� �099��������������������
<�������/94/����������!������#���..3332��
+�������0�12.�..�/-/%'4'%��12.�..�/-/>4/%&�5�6�70�12.�..�/-/'.-.>��
���0�������8$����� �
�� *;������ ��� H���#� ��;������<����I���"�J��F��!������%���=/3.&%�*����
+�������0�1-2�3/�&'�2>�&>�>/����&'�2>�&>�%/�5�6�70�1-2�3/�&'�2>�&>�&'��
���0����8�������������5�(��� �0�����������������

JAPANMaruzen Company Ltd, 1-9-18, Kaigan, Minato-ku, Tokyo, 105-0022
Telephone: +81 3 6367 6079 • Fax: +81 3 6367 6207
Email: [email protected] • Web site: http://www.maruzen.co.jp
REPUBLIC OF KOREAKINS Inc., Information Business Dept. Samho Bldg. 2nd Floor, 275-1 Yang Jae-dong SeoCho-G, Seoul 137-130
Telephone: +02 589 1740 • Fax: +02 589 1746 • Web site: http://www.kins.re.kr
NETHERLANDSDe Lindeboom Internationale Publicaties B.V., M.A. de Ruyterstraat 20A, NL-7482 BZ Haaksbergen
Telephone: +31 (0) 53 5740004 • Fax: +31 (0) 53 5729296
Email: [email protected] • Web site: http://www.delindeboom.com
Martinus Nijhoff International, Koraalrood 50, P.O. Box 1853, 2700 CZ Zoetermeer
Telephone: +31 793 684 400 • Fax: +31 793 615 698
Email: [email protected] • Web site: http://www.nijhoff.nl
Swets and Zeitlinger b.v., P.O. Box 830, 2160 SZ Lisse
Telephone: +31 252 435 111 • Fax: +31 252 415 888
Email: [email protected] • Web site: http://www.swets.nl
NEW ZEALANDDA Information Services, 648 Whitehorse Road, MITCHAM 3132, Australia
Telephone: +61 3 9210 7777 • Fax: +61 3 9210 7788
Email: [email protected] • Web site: http://www.dadirect.com.au
SLOVENIACankarjeva Zalozba d.d., Kopitarjeva 2, SI-1512 Ljubljana
Telephone: +386 1 432 31 44 • Fax: +386 1 230 14 35
Email: [email protected] • Web site: http://www.cankarjeva-z.si/uvoz
SPAINDíaz de Santos, S.A., c/ Juan Bravo, 3A, E-28006 Madrid
Telephone: +34 91 781 94 80 • Fax: +34 91 575 55 63
Email: [email protected], [email protected], [email protected], [email protected]
Web site: http://www.diazdesantos.es
UNITED KINGDOMThe Stationery Office Ltd, International Sales Agency, PO Box 29, Norwich, NR3 1 GN
Telephone (orders): +44 870 600 5552 • (enquiries): +44 207 873 8372 • Fax: +44 207 873 8203
Email (orders): [email protected] • (enquiries): [email protected] • Web site: http://www.tso.co.uk
On-line orders
DELTA Int. Book Wholesalers Ltd., 39 Alexandra Road, Addlestone, Surrey, KT15 2PQ
Email: [email protected] • Web site: http://www.profbooks.com
Books on the Environment
Earthprint Ltd., P.O. Box 119, Stevenage SG1 4TP
Telephone: +44 1438748111 • Fax: +44 1438748844
Email: [email protected] • Web site: http://www.earthprint.com
UNITED NATIONSDept. I004, Room DC2-0853, First Avenue at 46th Street, New York, N.Y. 10017, USA
(UN) Telephone: +800 253-9646 or +212 963-8302 • Fax: +212 963-3489
Email: [email protected] • Web site: http://www.un.org
UNITED STATES OF AMERICABernan Associates, 4501 Forbes Blvd., Suite 200, Lanham, MD 20706-4346
Telephone: 1-800-865-3457 • Fax: 1-800-865-3450
Email: [email protected] · Web site: http://www.bernan.com
Renouf Publishing Company Ltd., 812 Proctor Ave., Ogdensburg, NY, 13669
Telephone: +888 551 7470 (toll-free) • Fax: +888 568 8546 (toll-free)
Email: [email protected] • Web site: http://www.renoufbooks.com
Orders and requests for information may also be addressed directly to:
Marketing and Sales Unit, International Atomic Energy Agency
Vienna International Centre, PO Box 100, 1400 Vienna, Austria
Telephone: +43 1 2600 22529 (or 22530) • Fax: +43 1 2600 29302
Email: [email protected] • Web site: http://www.iaea.org/books
12-09231

RELATED PUBLICATIONS
www.iaea.org/books
IAEA HUMAN HEALTH SERIES PUBLICATIONS
The mandate of the IAEA human health programme originates from Article II of its Statute, which states that the “Agency shall seek to accelerate and enlarge the contribution of atomic energy to peace, health and prosperity throughout the world”. The main objective of the human health programme is to enhance the capabilities of IAEA Member States in addressing issues related to the prevention, diagnosis and treatment of health problems through the development and application of nuclear techniques, within a framework of quality assurance.
Publications in the IAEA Human Health Series provide information in the areas of: radiation medicine, including diagnostic radiology, diagnostic and therapeutic nuclear medicine, and radiation therapy; dosimetry and medical radiation physics; and stable isotope techniques and other nuclear applications in nutrition. The publications have a broad readership and are aimed at medical practitioners, researchers and other professionals. International experts assist the IAEA Secretariat in drafting and reviewing these publications. Some of the publications in this series may also be endorsed or co-sponsored by international organizations and professional societies active in the relevant fields. There are two categories of publications in this series:
IAEA HUMAN HEALTH SERIESPublications in this category present analyses or provide information of an
advisory nature, for example guidelines, codes and standards of practice, and quality assurance manuals. Monographs and high level educational material, such as graduate texts, are also published in this series.
IAEA HUMAN HEALTH REPORTSHuman Health Reports complement information published in the IAEA Human
Health Series in areas of radiation medicine, dosimetry and medical radiation physics, and nutrition. These publications include reports of technical meetings, the results of IAEA coordinated research projects, interim reports on IAEA projects, and educational material compiled for IAEA training courses dealing with human health related subjects. In some cases, these reports may provide supporting material relating to publications issued in the IAEA Human Health Series.
All of these publications can be downloaded cost free from the IAEA web site:http://www.iaea.org/Publications/index.html
Further information is available from:Marketing and Sales UnitInternational Atomic Energy AgencyVienna International CentrePO Box 1001400 Vienna, Austria
Readers are invited to provide their impressions on these publications. Information may be provided via the IAEA web site, by mail at the address given above, or by email to:
ASSESSMENT OF BODY COMPOSITION AND TOTAL ENERGY EXPENDITURE IN HUMANS USING STABLE ISOTOPE TECHNIQUESIAEA Human Health Series No. 3STI/PUB/1370 (133 pp.; 2009)ISBN: 978-92-0-111708-3 Price: €38.00
INTRODUCTION TO BODY COMPOSITION ASSESSMENT USING THE DEUTERIUM DILUTION TECHNIQUE WITH ANALYSIS OF SALIVA SAMPLES BY FOURIER TRANSFORM INFRARED SPECTROMETRYIAEA Human Health Series No. 12STI/PUB/1450 (77 pp.; 2011)ISBN: 978-92-0-103210-2 Price: €37.00
INTRODUCTION TO BODY COMPOSITION ASSESSMENT USING THE DEUTERIUM DILUTION TECHNIQUE WITH ANALYSIS OF URINE SAMPLES BY ISOTOPE RATIO MASS SPECTROMETRYIAEA Human Health Series No. 13STI/PUB/1451 (65 pp.; 2011)ISBN: 978-92-0-103310-9 Price: €36.00
DUAL ENERGY X RAY ABSORPTIOMETRY FOR BONE MINERAL DENSITY AND BODY COMPOSITION ASSESSMENTIAEA Human Health Series No. 15STI/PUB/1479 (118 pp.; 2011)ISBN: 978-92-0-110610-0 Price: €50.00

IAEA HUMAN HEALTH SERIESNo. 22
Body Composition Assessment from Birth to
Two Years of Age
IAEA HUMAN HEALTH SERIES
INTERNATIONAL ATOMIC ENERGY AGENCYVIENNA
ISBN 978–92–0–127710–7ISSN 2075–3772
This publication was developed by an international group of experts as an integral part of the IAEA’s efforts to contribute to the transfer of technology and capacity building in the use of nuclear and isotopic techniques to assist Member States in their efforts to improve the nutrition and health of infants and young children. To better defi ne and characterize healthy growth, there is a need for guidance on the use of standardized methodologies to assess body composition during early life. The book provides practical information on the assessment of body composition from birth up to 2 years of age and is intended for nutritionists, paediatricians and other health professionals.
IAEA HUMAN HEALTH SERIES