Embed Size (px)
Citation preview

International Atomic Energy AgencyVienna
ISBN 978–92–0–108117–9ISSN 1011–4289
Approaches to Improvem
ent of Crop Genotypes with High W
ater and Nutrient Use Efficiency for W
ater Scarce Environments
IAEA-TECDOC-1828
Approaches to Improvement of Crop Genotypes with High Water and Nutrient Use Efficiency for Water Scarce Environments Final Report of a Coordinated Research Project
@
IAEA-TECDOC-1828
IAEA-TECDOC-1828
IAEA TECDOC SERIES
17-46891_TE-1828_covNoSpine.indd 1-3 2017-11-17 11:06:29

APPROACHES TO IMPROVEMENT OF CROP GENOTYPES WITH HIGH WATER
AND NUTRIENT USE EFFICIENCY FOR WATER SCARCE ENVIRONMENTS


IAEA-TECDOC-1828
APPROACHES TO IMPROVEMENT OF CROP GENOTYPES WITH HIGH WATER
AND NUTRIENT USE EFFICIENCY FOR WATER SCARCE ENVIRONMENTS
FINAL REPORT OF A COORDINATED RESEARCH PROJECT
PREPARED BY THE JOINT FAO/IAEA DIVISION OF NUCLEAR TECHNIQUES IN FOOD AND AGRICULTURE
INTERNATIONAL ATOMIC ENERGY AGENCYVIENNA, 2017

COPYRIGHT NOTICE
All IAEA scientific and technical publications are protected by the terms of the Universal Copyright Convention as adopted in 1952 (Berne) and as revised in 1972 (Paris). The copyright has since been extended by the World Intellectual Property Organization (Geneva) to include electronic and virtual intellectual property. Permission to use whole or parts of texts contained in IAEA publications in printed or electronic form must be obtained and is usually subject to royalty agreements. Proposals for non-commercial reproductions and translations are welcomed and considered on a case-by-case basis. Enquiries should be addressed to the IAEA Publishing Section at:
Marketing and Sales Unit, Publishing SectionInternational Atomic Energy AgencyVienna International CentrePO Box 1001400 Vienna, Austriafax: +43 1 2600 29302tel.: +43 1 2600 22417email: [email protected] http://www.iaea.org/books
For further information on this publication, please contact:
Soil and Water Management and Crop Nutrition SectionInternational Atomic Energy Agency
Vienna International CentrePO Box 100
1400 Vienna, AustriaEmail: [email protected]
© IAEA, 2017Printed by the IAEA in Austria
December 2017
IAEA Library Cataloguing in Publication Data
Names: International Atomic Energy Agency.Title: Approaches to improvement of crop genotypes with high water and nutrient use
efficiency for water scarce environments / International Atomic Energy Agency.Description: Vienna : International Atomic Energy Agency, 2017. | Series: IAEA TECDOC
series, ISSN 1011–4289 ; no. 1828 | Includes bibliographical references.Identifiers: IAEAL 17-01124 | ISBN 978–92–0–108117–9 (paperback : alk. paper)Subjects: LCSH: Crop yields. | Plant mutation breeding. | Crops and water.

FOREWORD
Current concerns about the projected increase in the global population and the impacts of climate change and climate variability on agriculture highlight the importance of using improved crop varieties together with better soil, water and fertilizer management practices designed to protect the natural resource base.
The coordinated research project (CRP) entitled Approaches to Improvement of Crop Genotypes with High Water and Nutrient use Efficiency for Water Scarce Environments combines best-fit soil, water and fertilizer management practices to increase the productivity of improved mutant varieties of crops tolerant to environmental stresses under existing soil and climatic conditions and to enhance nitrogen and water use efficiencies of crops tolerant to such environmental stresses.
Opportunities exist to increase crop yields in Africa, Asia and Latin America with the use of new and improved crops and farming techniques. In 2012–2016, following the recommendations of international experts and on the basis of results of field studies, the CRP implemented isotopic techniques and conventional methods in Bangladesh, China, Indonesia, Kenya, Malaysia, Mexico, Pakistan, Peru, Uganda and Viet Nam. The aim was to grow improved varieties of rice, sorghum, soybean, banana, potato, amaranthus, wheat, barley and quinoa, which were then evaluated for agronomic and quality traits, as well as water and nutrient use efficiencies, in different agro-ecological zones.
This publication presents the findings and focuses on the practical applications of nuclear and related techniques to improve crop productivity. This publication will be of value to agricultural scientists and laboratory technicians of national agricultural research organizations in Member States as a resource for improving soil and crop productivity through mutant varieties and best-fit soil water and fertilizer management practices in diverse agro-ecological zones affected by drought, high temperatures, water scarcity, soil acidity and soil salinity.
The IAEA is grateful to all the participants for their valuable contributions. The IAEA officers responsible for this publication were J.J. Adu-Gyamfi and L.K. Heng of the Joint FAO/IAEA Division of Nuclear Techniques in Food and Agriculture.
EDITORIAL NOTE
This publication has been prepared from the original material as submitted by the contributors and has not been edited by the editorial staff of the IAEA. The views expressed remain the responsibility of the contributors and do not necessarily represent the views of the IAEA or its Member States.
Neither the IAEA nor its Member States assume any responsibility for consequences which may arise from the use of this publication. This publication does not address questions of responsibility, legal or otherwise, for acts or omissions on the part of any person.
The use of particular designations of countries or territories does not imply any judgement by the publisher, the IAEA, as to the legal status of such countries or territories, of their authorities and institutions or of the delimitation of their boundaries.
The mention of names of specific companies or products (whether or not indicated as registered) does not imply any intention to infringe proprietary rights, nor should it be construed as an endorsement or recommendation on the part of the IAEA.
The IAEA has no responsibility for the persistence or accuracy of URLs for external or third party Internet web sites referred to in this publication and does not guarantee that any content on such web sites is, or will remain, accurate or appropriate.

CONTENTS
SUMMARY……………………………………………………………………………..1
Fertilizer and water use efficiency and adaptability of new soybean varieties in Viet Nam………………………………………………………………………………...........6
P.T.B. Chung, M.Q. Vinh, N.V. Manh, L.T.A. Hong
Improvement of advanced rice mutant lines through enhancement of nutrient and water use efficiency…………………………………………………………………………...19
S.A.A. Rahman, P.C.K. Hoe, A.N.A. Wahid, S. Hussein, F. Ahmad, S. Salleh, R.
Ibrahim, A.R. Harun, K.A. Rahim, M. Mahmud, Z.S. Kamarudin, M.R. Yusop
Introducing Quinoa mutant varieties with high water and nutrient use efficiency to the Peruvian highlands……………………………………………………………………..44
L. Gomez–Pando, E. A. Castellanos, M. Ibañez–Tremolada; J. Falconi–Palomino, K.
A.Gonzales
Development of wheat mutants for higher yield and improved efficiency of water and nitrogen use…………………………………………………………………………….66
J. Khan, F. Azam, A. Ali, M. Tariq, S. Ahmad, W. Muhammad
Improvement of pseudocereals native to Mexico by radio–induced mutagenesis for high yield and enhanced adaptability to climate change…………………………………….79
E.C. Torres, J.M.G. Andarde, M.R. Arriaga, A.L. Cerda, P.R. Vallejo, C.R.S. García
Developing sorghum mutant lines and varieties and evaluating in farmers’ fields……95
S. Human, Sihono, W.M. Indriatama
Introduction of barley mutant varieties to the Peruvian highlands…………………...104
J. Jimenez–Davalos
IAEA publications on soil and water management and crop nutrition……………….112
Abbreviations and acronyms………………………………………………………….114
Contributors to drafting and review…………………………………………………..115


1
SUMMARY
1. BACKGROUND
The coordinated research project (CRP) “Approaches to Improvement of Crop Genotypes with High Water and Nutrient Use Efficiency for Water Scarce Environments” combines best–fit soil and water management technologies and improved crop varieties to increase crop yields and save water and nitrogen (N) fertilizers in diverse agro–ecological zones affected by drought, high temperatures, water scarcity, soil acidity and soil salinity.
Studies were reported in a total of 6 countries including Viet Nam, Malaysia, Peru (2), Pakistan, Mexico and Indonesia (Table 1). A grain legume (soybean), several cereals (rice, wheat, sorghum, barley) and pseudo-cereals (Genera Amaranthus and Chenopodium) were included in the studies (Table 1). Within any given country, experiments were carried out at several locations with the aim of covering a range of soils and climatic conditions, or to demonstrate advanced mutant lines and cultural practices for the benefit of local farming communities (Table 1). The majority of studies were located in the field, with a few located in a glasshouse or shade house (Table 1). The results of several studies were evaluated by an economic analysis of profitability. Nuclear and related techniques (mutation induction, stable isotopes of nitrogen N-15 and carbon C-13 were employed by plant breeders, agronomists and soil scientists to evaluate mutants and local germplasm, including a range of agronomic and quality traits. Important agronomic traits included days to flowering and maturity, plant height, 1000 grain weight, grain and biomass yields. Quality traits included grain protein and in the case of Quinoa, the saponin concentration.
2. OBJECTIVES
The overall objective of this CRP is to increase crop productivity and food security by developing and extending rapidly to farmers the improved crop varieties and soil, water, nutrient and crop management technologies that make cropping systems resilient to environmental stresses. The specific objectives are to (1) Increase the productivity of improved mutant varieties of crops tolerant to environmental stresses under existing soil and climatic conditions and (2) Enhance nitrogen and water use efficiencies of crops tolerant to environmental stresses through best practice soil, water, crop and fertilizer management.
3. PARAMETERS AND BASIC EQUATIONS
Several parameters were used to evaluate the efficiency of added nitrogen fertilizers. These indices included apparent N fertilizer use efficiency (NUE), agronomic efficiency (AE) and physiological efficiency (PE). It is important that standard procedures are followed in calculating efficiencyies as otherwise it will not be possible to directly compare results with those published in the literature. The basic definitions are:
Apparent N fertilizer use efficiency (kg N fertilizer uptake kg-1 N fertilizer added) =
[Crop N uptake(+ N fertilizer) – Crop N uptake(– N fertilizer)] / amount of N fertilizer added
Agronomic efficiency (kg grain kg-1 N fertilizer added) = [Grain yield(+ N fertilizer) – Grain yield(– N fertilizer)] / amount of N fertilizer added
Physiological efficiency (kg grain kg-1 fertilizer N uptake) = [Grain yield(+ N fertilizer) – Grain yield(– N fertilizer)] / [Crop N uptake(+ N fertilizer) – Crop N
uptake(– N fertilizer)] Thus AE = PE × FUE

2
TABLE 1. STUDIES CARRIED OUT BY THE CRP PARTICIPANTS
Country Crop Germplasm Treatments Location Nuclear techniques
Viet Nam Soybean 3 varieties, 2 checks
Fertilizer and water use efficiency
Field Viet Tri γ- irradiation
4 varieties, 3 checks
Adaptability trials Hanoi Production trials Hanoi, Vinh
Tuong
Malaysia Rice Advanced mutant and local lines
Aerobic rice Glass house
Bangi γ- irradiation
Multi-location trials under drought
Field Serdang, Tg. Karang, Alor Serdang
2 mutants N use efficiency Shade house
Bangi 15N
5 varieties Water use efficiency Field Alor Serdang 13C isotope discrimination
2 advanced mutant lines and parent
Farmers’ demonstration sites
Utan Aji, Pendan
Peru Quinoa 63 mutants + parent
Agronomic and quality traits, N use efficiency
Field La Molina γ- irradiation
13 mutants + control Mutant LM 89–77
Water use efficiency
9 genotypes Fertilizer regime 4 genotypes Plant density La Molina
San Lorenzo 4 ecotypes of var.
Pasankalla Farming system
Pakistan Wheat 3 varieties N fertilizer rates Field Peshawar, Pirsabak
13C isotope discrimination, Soil moisture neutron probe, 15N
Recombinant NRL 0707
Farmers’ demonstration sites in low, medium and high rainfall areas
DI Khan, Kohat, Swat, Peshawar, Charsadda, Mansehra
Country Crop Germplasm Treatments Location Nuclear techniques
México Amarant 5 mutants + 27 genotypes
Agronomic traits Field Texcoco γ- irradiation
Quinoa, Chía roja, Huauzontle
3 quinoa + 2 chía roja + 2 huauzontle
Tolerance to drought and salinity
Glass house
Toluca
Indonesia Sorghum 170 M3 mutants
Drought tolerance Glass house
Jakarta γ- irradiation
13 M4 mutants + 3 controls
Field Gunungkidul Acid soil tolerance Taman Bogo
Peru Barley 2 two-row mutants, 2 six-row commercial varieties
N fertilizer at 40 and 80 kg ha–1
Field Aco, San Juan, San Lorenzo
γ- irradiation
3
If a fertilizer (e.g. P or K) is added in the + N fertilizer treatment, these nutrients must also be added at the same rate to the – N fertilizer or control treatment.
4. STUDIES CARRIED OUT BY CRP PARTICIPANTS
The basic nuclear technique used in the CRP was γ-irradiation of seeds to induce mutagenesis. N use efficiency was also estimated directly by using 15N-labelled fertilizers for rice and wheat. The response of rice and wheat to drought or to the strategic application of irrigation water was estimated by the carbon isotope (13C) discrimination (CID) method. A soil moisture neuron probe was used to measure soil volumetric water content in an experiment with wheat (Table 1).
5. CRP ACHIEVEMENTS AND CONCLUSIONS
5.1. Viet Nam (Soybean)
Soybean varieties evaluated over 4 years (2012–2015) had high yields and resistance to stress conditions (cold, heat, drought, diseases). One national variety (DT2008), two promising varieties under national test (DT2010, DT2012) and one mutant variety with high omega-3 and omega-6 contents (DT2008BS) had high nutrient and water use indicies. Varieties DT2010, DT2012 and DT2008BS had stable yields with wide adaptability in spring, summer and winter trials in the Red River Delta, while DT26BS was suitable for spring and winter seasons. Variety DT2008 had the most effective use of fertilizer and water with a high N self-sufficiency of 88.4% and a water use index of 0.37 mm3 kg-1 grain (1.3 times more than DT84) and with the highest yield (2.2 times more than DT84). Production trials of promising varieties DT2008 and DT2008BS were carried out in summer 2014 in Hanoi, and in spring 2016 in Vinh Phuc province. DT2008 yielded 2.16 t ha-1 (DT84 yield was 1.75 t ha-1), DT2008BS had a yield of 2.64 t ha-1, equivalent to the origin DT2008 yield (2.78 t ha-1), but with a growth duration 7 days shorter than DT2008. Soybean DT2008 was recognized by the Ministry of Agriculture and Rural Development (MARD) as a National Variety, thus allowing release within the entire country. Soybean DT2008BS was recognized as a promising variety in the national trials of 2015–2016.
5.2 Malaysia (Rice)
Lowland rice is one of the most important food crops drastically affected by drought. Malaysia achieves 72% self-sufficiency in rice with the current average yield of 3.7 t ha-1
season-1. Drought severely reduces production as about 3000 L of water are required to produce 1 kg of rice. Development of drought tolerant rice varieties is therefore a priority. Two advanced rice mutant lines, MR219–4 and MR219–9, derived from the mutagenesis of Oryza sativa cv. MR219 with γ-irradiation at 300 Gy, were evaluated under simulated drought conditions in a greenhouse experiment. Adaptation and yield potential of advanced rice mutant lines, MR219–4 and MR219–9 under different water stress conditions were evaluated at several locations. Nitrogen and water use efficiencies were assessed using nuclear technique involving 15N and 13C stable isotopes under aerobic conditions. The yield performances of MR219–4 and MR219–9 were evaluated in farmers’ plots with the inclusion of products from Nuclear Malaysia’s R&D program, viz. Bioliquifert (a biofertilizer inoculant in liquid formulation) and Oligochitosan, a plant growth promoter and elicitor derived from irradiated chitosan. Agronomic practices for advanced mutant rice lines were recommended to the farmers. Two mutant rice lines were filed for registration with Department of Agriculture, Malaysia, in August 2015 with reference no. PVBT 026/15

4
(referring to NMR151, originally known as MR219–4) and PVBT 027/15 (referring to NMR152, originally known as MR219–9).
5.3 Peru (Quinoa)
A group of mutant lines of Quinoa developed using γ-irradiation were evaluated in the highlands and in the coastal area of Peru. A decrease in the supply of irrigation water for the mutant line La Molina 89–77 did not have a significant effect on the components of grain quality, but had a negative influence on the morphology of the crop, reducing plant height and stem diameter. In addition, the days to maturation increased, while the number of grains per plant and the grain yield ha–1 decreased. The use of anti–percolant plastic which reduced the irrigation water demand resulted in a greater efficiency in the use of water, but gradually decreased the profitability of the crop. When water was applied at 2750 m³ ha-1 without plastic, 2750 m³ ha-1 with plastic, 2100 m³ ha-1 with plastic and 1350 m³ ha-1 with plastic, grain yields were 3163, 3333, 3039 and 2234 kg ha-1, respectively. The highest yield was obtained with the mutant line MQLM89 175 (3136 kg ha-1) while the lowest was obtained with the mutant line MQPAS–374 (1653 kg ha-1) in plots amended with synthetic N and P fertilizer. When manure was used as an organic fertilizer a yield range of 1054 to .3111 kg ha-1 was observed, corresponding to mutant lines MQLM89 175 and MQPAS–374, respectively.
5.4 Pakistan (Wheat)
Average wheat yields in Pakistan are relatively low. A study was conducted during 2011–14 to assess wheat genotypes (Barsat, NRL 0707 and PM–376–HY) for nitrogen and water use efficiency. N fertilizer was applied as urea at 0, 25, 45 and 90 kg N ha-1. Half of the N was applied at sowing while the remaining half during the tillering stage. Grain yield varied from 1.6 to 3.6 t ha-1 and was influenced by soil and N fertilizer management. Maximum grain yield was obtained at 45 kg N ha-1 for two years, but during 2013–14 grain yields at 45 and 90 kg N ha–1 were not significantly different. 13C isotope discrimination (∆ values) in wheat straw ranged from 19.4 to 23.2 and in grain ranged from 19.4 to 21.8 across all three genotypes at both sites. Higher 13C (∆) values in grain were found for NRL 0707 suggesting that it has comparatively higher water use efficiency potential under drought conditions. During the last two project years (2014–16) the response of a newly released wheat variety Insaf 2015 (NRL 0707) to different levels of nitrogen was studied on progressive farmers’ fields in low, medium and high rainfed areas. The economic analysis across all the three regions showed that maximum net income per hectare coupled with higher value cost ratio (VCR) values were obtained when nitrogen was applied at the rate of 45 kg ha-1 followed by 90 kg ha-1.
5.5 México (Amaranthus, Chenopodium spp.)
A total of 32 genotypes of Amaranthus including 5 mutants were evaluated in the field. Variability was greater among groups of amaranth genotypes that between genotypes. Late maturing populations with higher plant height and stem diameter were found in groups from Tlaxcala, Michoacán, and the Federal District. Genotypes from Tlaxcala, the Federal District and Mexico State with high yield were adapted to the high plateau conditions, exhibiting greater panicles and higher yields. Seven genotypes of Chenopodium (3 of Quinoa, 2 of Chía

5
roja and 2 of Huauzontle) were evaluated for tolerance to drought and salinity in a glasshouse experiment. Drought induced more yield per plant. Salinity at 50 mMhos decreased yield to 16%. Quinoa genotype ININ 333 had the highest yields and less tolerance to salinity. Genotypes M7–0 and ININ 110 had more tolerance to salinity. Genotype ININ H2 was more productive and tolerant to salinity than H1. Genotypes ININ CHR 1 and 2 exhibited the lowest yields and no tolerance to salinity. Genotype ININ 333 has been distributed to farmers to evaluate performance at the farm level.
5.6 Indonesia (Sorghum)
The limiting factors in developing dryland farming agriculture in Indonesia are drought in the eastern and soil acidity in the western parts of the country. Sorghum was chosen as the best crop to develop in dryland farming as it requires less agricultural inputs, has wide sorghum mutant lines were identified with improved yields and good adaptation and tolerance to drought and soil acidity. Seedlings were screened in the glasshouse for tolerance to drought and soil acidity using the PEG and AlCl3-hydroponic techniques, respectively. Some of the promising mutant lines were evaluated through multi–location trials in several Indonesian Provinces. Field experiments were conducted in farmers’ fields in the drought prone areas of Yogyakarta Province and in the acid soil areas in Lampung Province. Grain yields of the muant lines PATIR–1, PATIR–4 and PATIR–9 were significantly higher than the control varieties Pahat, Kawali and Mandau under drought. A promising mutant line tolerant to acid soil was the B–76 mutant. Some sorghum mutant lines had potential to be developed in farmers’ fields under existing soil and climatic conditions, as they could produce good yields under low water and nutrient status.
5.7 Peru (Barley)
Barley is the fourth most important cereal crop worldwide including Peru. Whereas only 2 to 3% of the total barley produced worldwide is used for food, about 70% is used in the basic diet in Peru. Due to its great adaptability to different climatic conditions, barley can produce in the Andean region up to 3500 masl where very few crops survive, and it is one of the most important cereals for food security in the highlands. The use efficiency of N fertilizer in cereal crops is low at 33% on average worldwide. A part of the applied N remains in the soil while the rest is lost to the environment, with negative economic, public health and environmental consequences. The objective of this study was to evaluate the agronomic performance and nitrogen use efficiency of four barley cultivars (2 two-row mutant varieties and 2 six-row commercial varieties) with two doses of N (40 and 80 kg ha-1), at three localities with different soil and climatic conditions in the Peasant Communities of the Mantaro Valley, Peru. The ‘Centenario’ barley mutant variety was the most stable in the three localities and is already accepted by the farmers from the Peruvian highlands.
6
FERTILIZER AND WATER USE EFFICIENCY AND ADAPTABILITY OF
NEW SOYBEAN VARIETIES IN VIET NAM
P.T.B. CHUNG, M.Q. VINH, N.V. MANH, L.T.A. HONG Viet Nam National Institute of Agricultural Genetics (AGI) Ha Noi, Viet Nam
Abstract
Soybean varieties evaluated over 4 years (2012–2015) had high yields and resistance to stress conditions (cold, heat, drought, diseases). One national variety (DT2008), two promising varieties under national test (DT2010, DT2012) and one mutant variety with high omega-3 and omega-6 contents (DT2008BS) had high nutrient and water use indicies. Varieties DT2010, DT2012 and DT2008BS had stable yields with wide adaptability in spring, summer and winter trials in the Red River Delta, while DT26BS was suitable for spring and winter seasons. Variety DT2008 had the most effective use of fertilizer and water with an agronomic index of 11.6 kg grain kg-1 NPK, high N self-sufficiency of 88.4%, a P2O5
use index of 121%, a K2O use index of 253%, a water use index of 0.37 mm3 kg-1 grain (1.3 times more than DT84) and with the highest yield (2.2 times more than DT84). Production trials of promising varieties DT2008 and DT2008BS were carried out on areas of 2 and 2.5 ha under 2014 summer conditions in Hanoi, and 2016 spring conditions in Vinh Phuc province. DT2008 yielded 2.16 t ha–1 (DT84 yield was 1.75 t ha-1), DT2008BS had a yield of 2.64 t ha-1, equivalent to the origin DT2008 yield (2.78 t ha-1), but with a growth duration 7 days shorter than DT2008. Soybean DT2008 was recognized by the Ministry of Agriculture and Rural Development (MARD) as a National Variety (According to Decision No. 253 / QD–TT–CLT/ 27–Jun–2016), thus allowing release within the entire country. Soybean DT2008BS was recognized as a promising variety in the national trials of 2015–2016. 1. INTRODUCTION
Soybean is an important Vietnamese food crop providing mainly protein for the human diet, and is an indispensable component of traditional and modern cuisine. Before the 1980s, soybean yields in Viet Nam were low because of old varieties with low productivity and outdated farming techniques. Thanks to the research conducted from 1985 to 2009, new soybean varieties were created with high yields. Soybean yields in Viet Nam increased 2-fold from 0.78 to 1.47 t ha-1, while the area doubled from 102 100 to 200 000 ha with a 3-fold increase in productivity from 79 100 to 275 500 t.
Although soybean is not able to compete with the main cash crops of rice, coffee and cashew, it is one of the strategic crops contributing to sustainable livestock development while reducing the dependence on imported grain. However, soybean production in Viet Nam has only met 8 to 10% of domestic demand in recent years. It is expected that by 2020, Viet Nam will have a shortage of about 5 × 10⁶ t yr-1 and will become a big importer with a turnover of USD 2.5×10⁹ yr-1, exceeding the value of current rice exports. Under these circumstances, the task of creating new soybean varieties with high and stable yields, suitable growth duration, wide adaptability and high resistance to unfavorable environmental factors due to climate change is becoming more urgent.
There are many factors restricting the development of soybean production in Viet Nam, including backward farming techniques, low investments, economic policies, and existing

7
soybean varieties that are intolerant of extreme events such as drought, temperature extremes, disease and waterlogging.
With the aim of creating and selecting new soybean varieties with high yield potential, good quality, stability and adaptability to climate change, the Agricultural Genetics Institute embarked on a program of crop improvement through traditional and mutation breeding. New soybean varieties with high economic indices that included DT83, DT84, DT90 and DT2008 were developed through hybrid and mutant methods. Variety DT2008, created by the combination of hybridization and γ-irradiation, has a high yield potential of 2 to 4 t ha–1, with good resistance to disease, drought, flood, cold and poor soil fertility. However, its long growth duration of over 100 d makes it difficult to include in crop rotations, particularly in a winter cropping system, which is the main soybean crop currently in the Red River Delta. Variety DT2008 was improved by crossing with a short growth duration variety DT99 and γ-irradiation. The hybridization achieved two varieties DT2010 and DT2012 with more outstanding traits compared to their parents. Gamma irradiation of DT2008 and DT26 produced two black soybean varieties, DT2008BS and DT26BS, with higher quality than the origins.
2. MATERIALS AND METHODS
Five soybean varieties were evaluated, namely DT84 (Check 1), DT99 (Check 2), DT2008, DT2010 and DT2012.
2.1. Site and experimental design
The evaluation of fertilizer and water use of soybean varieties was carried out in experiments on a gray feralit soil at Viet Tri, in Phu Tho province. The date of sowing was January 17th 2016. The experimental design was a Complete Randomized Block with 3 replicates, 10 m2 per plot of dimensions 5 × 2 m.
The adaptability of soybean varieties was evaluated in field experiments on an old alluvial soil at Dan Phuong, Hanoi. The sowing date was January 12th 2015 in spring, June 1st 2015 in summer and September 5th 2015 in winter. The experimental design was a Complete Randomized Block with 3 replicates, 25 m2 per plot with dimensions of 7 × 3.6 m.
Production trials of DT2008 were implemented on a light loam soil at Ba Vi, Hanoi with an area of 2 ha in summer 2014 (sowing date of June 1st 2014) and Check variety DT84 (a common variety in the region). Production trials of DT2008BS were implemented on a light loam soil at Vinh Tuong, in Vinh Phuc province with an area of 2.5 ha in spring 2016 (sowing date of January 19th 2016) and Check variety DT2008 (the origin).
2.2. Agronomy
Nutrient and water use parameters were determined at a plant density of 30 m-2 and a fertilizer application rate ha–1 of 50 kg N + 80 kg P2O5 + 70 kg K2O without irrigation.
The adaptability of soybean varieties was evaluated according to Vietnamese Standard QCVN 01–58:2011/BNNPTNT with 2015 spring, summer and winter sowing dates of Feb 12th, June 1st and Sept 5th, respectively. Plant densities in spring, summer and winter crops were 30, 25 and 35 m-2, respectively. Fertilizer application rates ha-1 in spring and winter
8
were 30 kg N + 90 kg P2O5 + 80 kg K2O and 20 kg N + 60 kg P2O5 + 80 kg K2O in summer.
Demonstrations of promising varieties DT2008 and DT2008BS were carried out according to Vietnamese Standard QCVN 01–58:2011/BNNPTNT with a plant density of 25 m-2 for DT2008 and 30 m-2 for DT2008BS, and with a fertilizer application rate ha-1 of 30 kg N + 90 kg P2O5 + 80 kg K2O.
2.3. Measurements
2.3.1. Economic, agronomic and nutrient uptake indices
Soil samples were collected, weighted and dried according to Vietnamese standard TCVN 4196–95. pHKCl, total N, available P2O5 and K2O in soil before and after applying fertilizers and after harvesting were determined according to Vietnamese standards of TCVN 5979–2000, TCVN 6498–1999, TCVN 5256–1999 and 10TCN 372–99, respectively. Economic index = Theoretical grain yield (kg ha-1) / Biomass yield (kg ha-1).
Where the theoretical grain yield (kg ha-1) = (Fertile pod number per plant × Average seed number per pod × 1000–seed weight (g) × Plant number per m2) / 100.
Agronomic index (kg grain kg-1 NPK applied) = Theoretical grain yield / Total amount of NPK applied.
Nutrient (N, P, K) uptake indices of soybean varieties:
Total N uptake = N uptake in plant + N uptake in grain (1)
N uptake in plant = (Biomass yield – Theoretical yield) × % N in plant (2)
N uptake in grain = Theoretical yield × % N in grain (3)
P2O5 and K2O uptake indices were calculated according to the formulae (1), (2) and (3).
9
2.3.2. Fertilizer and water use indices
Fertilizer use index = (Total amount of nutrient uptake / Total amount of nutrient applied) × 100.
Water use index (mm3 kg-1) = Rainfall use (mm3) / Theoretical yield (kg ha-1)
where rainfall use was extracted from the AWS station’s rainfall monitoring panel – iMetos- ECO–D2.
2.3.3. Adaptability of soybean varieties under field conditions
Monitoring indicators and methods for the evaluation of phenotypic and morphological characteristics of soybean varieties are described in Vietnamese Standard QCVN 01–58: 2011/BNNPTN, and include growth duration, plant height, number of branches, yield components and productivity.
2.4. Equipment
Two automatic weather–climate stations with iMetos technologies including iMetos–AG (International code 000021D3) and iMetos–ECO–D2 (International code 011019EF) were used. In particular, the iMetos–AG device provides weather parameters of solar radiation, rainfall, wind speed (m s-1), temperature (average, max, min) and average humidity. The iMetos–ECO–D2 device provides weather–environment parameters of rainfall (mm), water content in soil (%), soil temperature (oC), watermark (cBar), conductivity (ms m-1) and ECO Probe 5 cm.
2.5. Statistical analysis
The interaction of gene and environment was analysed by the mathematical model of Eberhart and Russell [1] with the combination of the stable software of Hien [2]. Data were processed using Excel 2007 and IRRISTAT 5.0.

10
3. RESULTS 3.1. Weather station
Data generated by the iMetos–AG automatic weather–climate station are given in Table 1. TABLE 1. DATA GENERATED BY IMETOS–AG WEATHER STATION
Ord. Months Ave. solar radiation
(mJ m–² d–1)
Ave. rainfall (mm d–1)
Average temperature (°C) Average humidity
(%) sum TB min max 1 2 53.87 19 12.39 10.97 14.25 73.06 2 3 134.6 64.4 19.60 18.05 22.00 89.99 3 4 220.74 76.4 24.94 23.07 27.70 85.83 4 5 481.81 108.2 28.47 24.64 33.88 80.13 5 6 250.15 127.0 28.93 25.34 33.75 83.51 Mean 228.23 79.00 22.87 20.42 26.32 82.50 Total amount 1141.17 395.00 114.34 102.08 131.59 412.52
3.2. Yields and nutrient status
3.2.1. Soil properties
The contents of N, P2O5 and K2O in soil decreased after growing soybean varieties, and were lower than in soil after applying fertilizers, but higher than in soil before applying fertilizers (Table 2). The data suggest that soil fertility after soybean cultivation was stable and higher than before cultivation without fertilizer application. Soil pHKCl increased after applying fertilizers and was higher than soil pHKCl after soybean cultivation, illustrating the role of soybean varieties in improving soil exchange acidity.
TABLE 2. N, P2O5 AND K2O CONTENTS IN SOIL BEFORE AND AFTER CULTIVATING SOYBEAN VARIETIES
Varieties pHKCl Total (%) Available (mg 100g-1)
N P2O5 K2O P2O5 K2O Before applying fertilizers 5.8 0.15 0.12 0.01 9.76 9.22 After applying fertilizers 6.7 0.17 0.19 0.01 18.49 25.89 After cultivating soybean varieties DT84 6.4 0.19 0.13 0.02 13.84 16.03 DT99 6.4 0.21 0.14 0.02 17.74 15.67 DT2010 6.4 0.17 0.15 0.02 18.82 16.39 DT2012 5.9 0.20 0.15 0.01 22.55 16.15 DT2008 5.9 0.16 0.13 0.01 23.46 16.63
11
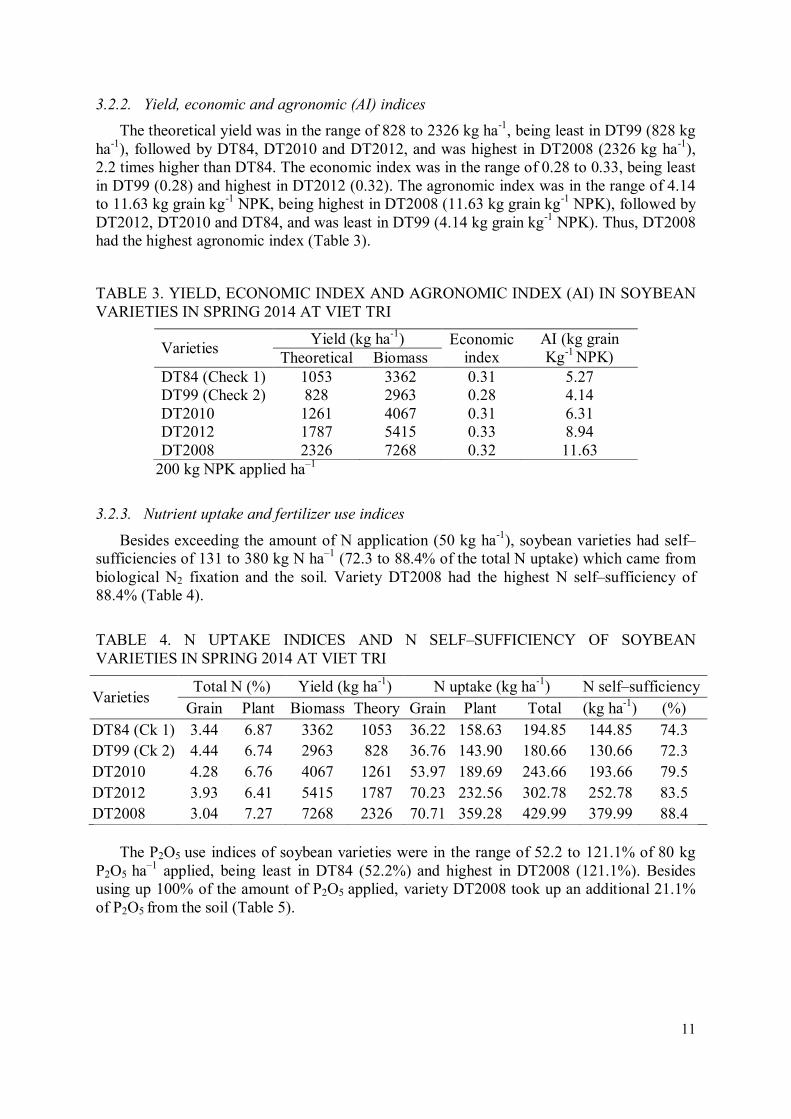
3.2.2. Yield, economic and agronomic (AI) indices
The theoretical yield was in the range of 828 to 2326 kg ha-1, being least in DT99 (828 kg ha-1), followed by DT84, DT2010 and DT2012, and was highest in DT2008 (2326 kg ha-1), 2.2 times higher than DT84. The economic index was in the range of 0.28 to 0.33, being least in DT99 (0.28) and highest in DT2012 (0.32). The agronomic index was in the range of 4.14 to 11.63 kg grain kg-1 NPK, being highest in DT2008 (11.63 kg grain kg-1 NPK), followed by DT2012, DT2010 and DT84, and was least in DT99 (4.14 kg grain kg-1 NPK). Thus, DT2008 had the highest agronomic index (Table 3).
TABLE 3. YIELD, ECONOMIC INDEX AND AGRONOMIC INDEX (AI) IN SOYBEAN VARIETIES IN SPRING 2014 AT VIET TRI
Varieties Yield (kg ha-1) Economic
index AI (kg grain Kg-1 NPK) Theoretical Biomass
DT84 (Check 1) 1053 3362 0.31 5.27 DT99 (Check 2) 828 2963 0.28 4.14 DT2010 1261 4067 0.31 6.31 DT2012 1787 5415 0.33 8.94 DT2008 2326 7268 0.32 11.63
200 kg NPK applied ha–1
3.2.3. Nutrient uptake and fertilizer use indices
Besides exceeding the amount of N application (50 kg ha-1), soybean varieties had self–sufficiencies of 131 to 380 kg N ha–1 (72.3 to 88.4% of the total N uptake) which came from biological N2 fixation and the soil. Variety DT2008 had the highest N self–sufficiency of 88.4% (Table 4).
TABLE 4. N UPTAKE INDICES AND N SELF–SUFFICIENCY OF SOYBEAN VARIETIES IN SPRING 2014 AT VIET TRI
Varieties Total N (%) Yield (kg ha-1) N uptake (kg ha-1) N self–sufficiency
Grain Plant Biomass Theory Grain Plant Total (kg ha-1) (%) DT84 (Ck 1) 3.44 6.87 3362 1053 36.22 158.63 194.85 144.85 74.3 DT99 (Ck 2) 4.44 6.74 2963 828 36.76 143.90 180.66 130.66 72.3 DT2010 4.28 6.76 4067 1261 53.97 189.69 243.66 193.66 79.5 DT2012 3.93 6.41 5415 1787 70.23 232.56 302.78 252.78 83.5 DT2008 3.04 7.27 7268 2326 70.71 359.28 429.99 379.99 88.4
The P2O5 use indices of soybean varieties were in the range of 52.2 to 121.1% of 80 kg P2O5 ha–1 applied, being least in DT84 (52.2%) and highest in DT2008 (121.1%). Besides using up 100% of the amount of P2O5 applied, variety DT2008 took up an additional 21.1% of P2O5 from the soil (Table 5).

12
TABLE 5. P2O5 UPTAKE AND FERTILIZER USE INDICES OF SOYBEAN VARIETIES
IN SPRING 2014 AT VIET TRI
Varieties Total P2O5 (%) Yield (kg ha-1) P2O5 uptake (kg ha-1) P2O5 use
index (%) Grain Plant Biomass Theory Grain Plant Total DT84 (Ck 1) 0.81 1.44 3362 1053 8.53 33.25 41.78 52.2 DT99 (Ck 2) 1.01 1.60 2963 828 8.36 34.16 42.52 53.2 DT2010 0.93 1.56 4067 1261 11.73 43.77 55.5 69.4 DT2012 0.86 1.51 5415 1787 15.37 54.78 70.15 87.7 DT2008 0.85 1.56 7268 2326 19.77 77.1 96.87 121.1
The K2O use indices of soybean varieties were in the range of 91.8 to 235.2% of 70 kg K2O ha–1 applied, being least in DT99 (91.8%) and highest in DT2008 (235.2%). Besides using up 100% of the amount of K2O application, varieties DT2010, DT2012 and DT2008 took up an additional 5.4 to 135.2% of K2O from the soil (Table 6). TABLE 6. K2O UPTAKE AND FERTILIZER USE INDICES OF SOYBEAN VARIETIES
IN SPRING 2014 AT VIET TRI
Varieties Total K2O (%) Yield (kg ha-1) K2O uptake (kg ha-1) K2O use
index (%) Grain Plant Biomass Theory Grain Plant Total DT84 (Ck 1) 1.67 2.08 3362 1053 17.59 48.03 65.61 93.7 DT99 (Ck 2) 1.73 2.34 2963 828 14.32 49.96 64.28 91.8 DT2010 1.51 1.95 4067 1261 19.04 54.72 73.76 105.4 DT2012 1.67 2.13 5415 1787 29.84 77.28 107.12 153.0 DT2008 1.81 2.48 7268 2326 42.1 122.56 164.66 235.2
Thus, variety DT2008 had the highest agronomic index of 11.63 kg grain kg-1 NPK
applied, an N uptake sufficiency of 88.4%, a P2O5 use index 121.1% and a K2O use index of 253.2%.
3.2.4. Water use index
Under rainfed farming, water use indices of soybean varieties were in the range of 0.28 to 0.48 mm3 kg-1 grain, with the highest in DT99 (0.48 mm3 kg-1 grain), followed by DT2012 (0.43 mm3 kg-1 grain), DT2010 (0.38 mm3 kg-1 grain), DT2008 (0.37 mm3 kg-1 grain), and was least in DT84 (0.28 mm3 kg-1 grain). Compared to DT84 (Check 1), variety DT2008 had a water use index 1.3 times higher, but its yield was 2.2 times higher (Table 7).

13
TABLE 7. WATER USE INDICES OF SOYBEAN VARIETIES IN SPRING 2014 AT VIET TRI
Varieties Yield (kg ha-1) Rainfall use Water use index Theoretical Actual (mm) (mm3 ha-1) (mm3 kg-1) × check 1
DT84 (Check 1) 1053 717 29.36 293.60 0.28 – DT99 (Check 2) 828 572 39.79 397.87 0.48 1.72 DT2010 1261 845 47.39 473.87 0.38 1.35 DT2012 1787 1233 77.20 772.02 0.43 1.55 DT2008 2326 1558 84.92 849.22 0.37 1.31 3.3. Evaluating the adaptability of soybean varieties under field conditions
3.3.1. Growth duration and yield of soybean varieties
Growth duration of soybean varieties ranged from 80 to 120 days in spring, 77 to 109
days in summer and 70 to 100 days in winter. Variety DT2010 had growth duration of 78 to 88 days, 22 to 32 days shorter than DT2008. Variety DT2012 had growth duration of 90 to 100 days, 10 to 12 days shorter than DT2008. Variety DT2008BS had growth duration of 94 to 113 days, 6 to 9 days shorter than the origin DT2008. Variety DT26BS had growth duration of 88 to 96 days, similar to the origin DT26 in spring, summer and winter (Table 8).
TABLE 8. GROWTH DURATION AND YIELD OF SOYBEAN VARIETIES AT HANOI IN 2015
Varieties Growth duration (days) Yield (t ha-1) Spring Summer Winter Spring Summer Winter
DT2010 88 83 78 2.06 2.16 1.96 DT2012 100 96 90 2.8 3.2 2.79 DT2008BS 113 100 94 2.97 3.21 2.87 DT26BS 96 92 88 2.3 1.15 2.68 DT2008 Check 1 120 109 100 3.01 3.37 2.89 DT99 Check 2 80 77 70 1.7 1.77 1.62 DT26 Check 3 96 92 88 2.33 1.2 2.75 LSD0,05 0.24 0.25 0.25 CV% 5.6 6.1 5.7
The productivity of soybean varieties was in the range of 1.70 to 3.08 t ha-1 in spring,
1.15 to 3.37 t ha-1 in summer and 1.62 to 2.89 t ha–1 in winter. Variety DT2010 had a yield of 1.96 to 2.56 t ha–1, 20 to 20.9% higher than DT99. Variety DT2012 had a yield of 2.79 to 3.20 t ha-1, 64.8 to 80.9% higher than DT99 and the same as DT2008 (P<0.05). The yield of variety DT2008BS reached 2.87 to 3.21 t ha-1, equal to the origin DT2008 (P<0.05).
3.3.2. Seasonal adaptability of soybean varieties
Under the 2015 growing conditions, the environmental indicator (Ij) was in the order of less favorable to more favorable: summer < spring < winter with the values of –0.116 < 0.031 < 0.086, respectively. Thus, winter was identified as the most favorable season followed by spring and summer, which were considered unfavorable for soybean varieties (Table 9).

14
TABLE 9. ENVIRONMENTAL SUBGROUP IN EACH CROP ON THE PRODUCTIVITY OF SOYBEAN VARIETIES AT HANOI IN 2015
Ord. Varieties Yield (t ha-1)
Spring Summer Winter Mean 1 DT2010 2.06 2.16 1.96 2.06 2 DT2012 2.80 3.20 2.79 2.93 3 DT2008BS 2.97 3.21 2.87 3.03 4 DT26BS 2.30 1.15 2.68 2.04 5 DT2008 Check 1 3.01 3.37 2.89 3.09 6 DT99 Check 2 1.70 1.87 1.62 1.73 7 DT26 Check 3 2.33 1.20 2.75 2.09 Mean 2.45 2.31 2.51 Ij 0.31 –1.16 0.86
Variety DT2010 had a good yield of 2.06 t ha-1, medium sensitivity (bi = –0.910), stability
under environmental change (S2di = 0.001), wide adaptability in spring, summer and winter
crops at Hanoi in the Red River Delta. Variety DT2012 had a high yield of 2.93 t ha–1, medium sensitivity (bi = –2.155), stability under environmental change (S2
di = 0.006), wide adaptability in spring, summer and winter crops at Hanoi. Variety DT2008BS had a high yield of 3.02 t ha–
1, medium sensitivity (bi = –1.645), stability under environmental change (S2di = –0.0001), wide
adaptability in spring, summer and winter crops at Hanoi. Variety DT26BS had a good yield of 2.04 t ha-1, sensitivity (bi = 0.991), stability in a changed environment (S2
di = –0.0001), adaptability in spring and winter in the Red River Delta (Table 10).
3.4. Production trials of promising varieties DT2008 and DT2008BS
Compared to DT84 (Check), DT2008 had a longer growth duration of 13 days with many superior characteristics of plant height, brach number, resistance ability and yield. DT2008 had an actual yield of 2.46 t ha-1, 40.6% higher than DT84 (1.75 t ha-1) (Table 11). Variety DT2008BS had good growth and development with many biological and agricultural characteristics similar to the origin DT2008 with respect to plant height, number of braches, number of nodes, yield, disease and lodging resistance, but with a shorter growth duration of 7 days. DT2008BS had an actual yield of 2.64 t ha-1 (Table 11).
TABLE 10. ADAPTABILITY AND STABILITY INDEX OF SOYBEAN VARIETIES AT HANOI IN 2015
Varieties Mean (t ha-1)
Adaptability index (bi)
Safety bi (P)
Stability index(S2
di) Safety S2
di (P)
DT2010 2.06 –0.910 0.588 0.001 0.675 DT2012 2.93 –2.155 0.683 0.006 0.976 DT2008BS 3.02 –1.645 0.507 –0.0001 0.316 DT26BS 2.04 7.627 0.991* 0.0009 0.479 DT2008 Check 1 3.09 –2.368 0.587 –0.0001 0.231 DT99 Check 2 1.73 –1.200 0.532 –0.0001 0.213 DT26 Check 3 2.09 7.651 0.996* –0.0001 0.425
*bi value denotes bi ≠ 1

15
TABLE 11. SOME CHARACTERISTICS OF PROMISING VARIETIES DT2008 AND DT2008BS
Characteristics 2014 summer at Hanoi 2016 spring at Vinh Tuong
DT84 (DC) DT2008 DT2008BS DT2008 Plant height (cm) 46.7 65.9 65.9 66.1 Number of nodes stem-1 13.2 16.4 16.0 16.0 Number of branches 2.1 3.8 3.7 3.8 Growth duration (days) 90 103 108 115 Rust disease (1 – 9) 3 1 1 1 Lodging resistance (1 – 5) 1 2 1 1 Actual yield (t ha–1) 1.75 2.46 2.64 2.78
FIG. 1. Field evaluation of soybean mutants in Viet Nam (Photo: Ministry of Agriculture and Rural Development)

16
FIG. 2. (a) Nely created soybean variety with high adaptability to harsh production
conditions due to climate chnge in Viet Nam (Photo: Ministry of Agriculture and Rural Development)
(b) FIG. 3. (a) National Trials of two promising soybean in Hanoi during 2014 (Photo: Ministry of Agriculture and Rural Development)

17
4. DISCUSSIONS
Soybean requires relatively large amounts of nutrients. To achieve a yield of 3 t ha-1, it needs 285 kg N, 170 kg P2O5, 85 kg K2O, 65 kg CaO, 52 kg MgO and smaller amounts of micronutrients. The maximum absorption rates of N, P2O5 and K2O through seed forming stages are 7.7, 0.41 and 0.46 kg ha-1, respectively [3]. By applying 1 kg of additional NPK, grain yield increased by only 3 to 7 kg ha-1 [4]. In the present study variety DT2008 was able to reach at 11.63 kg grain kg-1 NPK applied, and was the variety with the highest agronomic index.
Soybean has a low demand for N fertilizer due to its capacity to fix N2 biologically. However, soybean still takes up some N from the soil. Many studies have shown that N fertilizer application before sowing adversely affected N2 fixation, where the number of nodules was inversely related to the amount of N applied. The number of nodules decreased if 56 kg N ha-1 was applied at sowing, but were unaffected if 112 kg N ha-1 was applied at flowering [5]. A low dose of starter N fertilizer can increase yield, seed weight, grain protein ratio and protein content, which proved that N2 fixation was insufficient for the demand of soybean [6]. The soybean varieties in the present study had a high N self-sufficiency of 72.3 to 88.4%, the highest being variety DT2008.
Phosphorus plays an important role in nodule development and N2 fixation in soybean [6, 7]. The P2O5 use index of soybean varieties was quite high in the range of 52.2 to 121.1%, the highest being variety DT2008. Besides using up 100% of the amount of P2O5 applied, variety DT2008 took up an additional 21.1%, which was derived from the soil.
Soybean removed a large amount of potassium from the soil after cultivation. Like P2O5, K2O is essential for the development of nodules. There are 25 kg K2O t-1 soybean seeds on average [8]. Maximum nodule formation was at the K2O application rate of 600 to 800 mg kg-1 [3]. The K2O use index of soybean varieties was quite high in the range of 91.8 to 235.2%. Besides using up 100% of the amount of K2O applied, varieties DT2010, DT2012 and DT2008 took up an additional 5.4 to 135.2% of K2O that was derived from the soil, the highest being variety DT2008.
Soybean requires about 350 to 600 mm of water over the whole period of growth and development. Soybean needs 1.5 to 3.5 mm3 of water to create 1 kg of grain [3]. Rainfall plays an important role in replenishing soil moisture in dryland areas. In fact, total rainfall during the crop generally meets the demand of soybean. However, daily rainfall in each month was unevenly distributed which resulted in drought at sowing in early spring and at the stage of seed filling at the end of winter. Flooding caused by prolonged rains resulted in difficulties at harvesting time in spring, or at sowing in summer or winter. Soybean varieties in the present study had low water use indices in the range of 0.28 to 0.48 mm3 kg-1 grain. In particular, variety DT2008 had the highest water use index of 0.37 mm3 kg-1 grain, which was 117.3 and 172.4% higher than checks DT84 and DT99, respectively. Thus it is possible to introduce variety DT2008 to areas having limited water conditions such as rainfed uplands.
Each soybean variety adapts to each ecological condition and seasonality to a certain
degree. In the Red River Delta, soybean is grown in all three cropping seasons (spring, summer and winter). The yield stability of soybean varieties through the three seasons was determined according to [1]. All soybean varieties had stable productivity. In particular, varieties DT2010, DT2012 and DT2008BS had wide adaptability over the three seasons in the Red River Delta. Variety DT26BS had adaptability in the favorable spring and winter seasons. Therefore, it is possible to introduce DT2010, DT2012 and DT2008BS for all three seasons, and DT26BS to spring and winter in the Red River Delta.

18
5. CONCLUSIONS
Variety DT2008 had the highest agronomic index of 11.63 kg grain kg-1 NPK, the highest N self-sufficiency (88.4%), a P2O5 use index of 121.1% and a K2O use index of 253.2%. Under rainfed farming, the water use index of soybean varieties was low in the range of 0.28 to 0.48 mm3 kg-1 grain. Variety DT2008 had the highest water use index of 0.37 mm3 kg -1 grain (1.31 times higher than DT84) with the highest yield (2.2 times greater than DT84).
New soybean varieties DT2010, DT2012, DT2008BS and DT26BS had suitable growth duration in the Red River Delta. In particular, DT2010 had a quite high and stable yield, adaptability to all three cropping seasons (spring, summer and winter) especially after two winter rice crops, due to its short growth duration. Varieties DT2012 and DT2008BS had high and stable yields, and adaptability to all three cropping seasons. Variety DT26BS had quite a high yield and adaptability to the favorable conditions of spring and winter.
Under field conditions, both varieties DT2008 and DT2008BS had good growth and development with high yields. In particular, variety DT2008 had a yield of 2.46 t ha-1, 40.6% higher than DT84. Variety DT2008BS had a yield of 2.64 t ha-1, equal to the DT2008 origin (2.78 t ha-1), but the growth duration was 7 days shorter.
ACKNOWLEDGEMENTS
This study was supported by the International Atomic Energy Agency (IAEA) under
Research Contract No.16948.
REFFERENCES
[1] EBERHART, S.A., RUSSELL, W.A., Stability parameters for comparing varieties. Crop Science 6 (1966) 36–40. [2] HIEN, N.D., Stability Analysis of Varieties, Version 3.0 (2001) [3] DAN, N.T., LONG, T.D., LAI, T.V., DUNG, D.T., DAO, P.T., Soybean (1999) Agricultural Publishing, Hanoi, p.223. [4] SON, C.K., Fertilizer use effect of crops through periods in Viet Nam. http://iasvn.org/upload/files/R5104JUNND17.%20CaoKySon–ok.pdf [5] NATHANSON, K., LAWN, R.J., DE JABRUN, P.L.M., BYTH, D.E., Growth, nodulation and nitrogen accumulation by soybean in saturated soil culture, Field Crops Research 8 (1984) 73–92. [6] DIEN, T.V., Soybean (2007) Agricultural Publishing, Hanoi, p.46. [7] DIEN, T.V., Effect of phosphorus amount on the yield and nitrogen fixation of soybean on the midland of northern mountainous and midland in Viet Nam, National Soybean Conference 22–23 March 2001 (2001) Hanoi, pp.125–131. [8] DINH, L.X., Fertilizer application for soybean and for crops, South Fertilizer Company. http://www.phanbonmiennam.com.vn

19
IMPROVEMENT OF ADVANCED RICE MUTANT LINES THROUGH
ENHANCEMENT OF NUTRIENT AND WATER USE EFFICIENCY
S.A.A. RAHMAN, P.C.K. HOE, A.N.A. WAHID, S. HUSSEIN, F. AHMAD, S. SALLEH, R. IBRAHIM, A.R. HARUN, K.A. RAHIM
Agrotechnology and Biosciences Division, Malaysian Nuclear Agency Kajang, Malaysia
M. MAHMUD Radiation Technology Division, Malaysian Nuclear Agency Kajang, Malaysia Z.S. KAMARUDIN, M.R. YUSOP Institute of Tropical Agriculture and Food Security, University Putra Malaysia Serdang, Malaysia Abstract
Lowland rice is one of the most important food crops drastically affected by drought. It is estimated that about 3000 L of water are required to produce 1 kg of rice. Malaysia achieves 72% self-sufficiency in rice with the current average yield of 3.7 t ha–-1season-1. Development of drought tolerant rice varieties was the strategy adopted to alleviate this problem. Mutation induction is one of the methods to develop a new variety with desirable traits in a short time in comparison to conventional breeding methods. Two advanced rice mutant lines, MR219–4 and MR219–9, derived from the mutagenesis of Oryza sativa cv. MR219 with γ−irradiation at 300 Gy, were evaluated under simulated drought conditions in a greenhouse at the Malaysian Nuclear Agency (Nuclear Malaysia). Adaptation and yield potential of advanced rice mutant lines, MR219–4 and MR219–9 under different water stress conditions were evaluated at several locations. Nitrogen and water use efficiencies were assessed using nuclear technique involving 15N and 13C stable isotopes under aerobic conditions. The yield performances of MR219–4 and MR219–9 were evaluated in farmers’ plots with the inclusion of products from Nuclear Malaysia’s R&D program, viz. Bioliquifert (a biofertilizer inoculant in liquid formulation) and Oligochitosan, a plant growth promoter and elicitor derived from irradiated chitosan. Agronomic practices for advanced mutant rice lines were recommended to the farmers. Two mutant rice lines were filed for registration with Department of Agriculture Malaysia in August 2015 with reference no. PVBT 026/15 (referring to NMR151, originally known as MR219–4) and PVBT 027/15 (referring to NMR152, originally known as MR219–9).
1. INTRODUCTION
Rice is the staple food crop in Malaysia. Presently, Malaysia achieves 72% self-sufficiency with an average yield of 3.7 t ha–1 season–1. Currently there are 242 000 ha of irrigated rice in Peninsula Malaysia, which contributes more than 85% of the national rice production. Rising temperatures and extended periods of dry weather due to climate change affect production because paddy rice requires a large amount of water. Water is becoming a scarce commodity, and in some areas it has become a limiting factor in rice production [1]. Thus, rice will be the crop most affected by water scarcity as it depends most heavily on irrigation. Therefore, there is an urgent need to develop rice varieties adapted to water stress, but still able to produce acceptable yields while possessing all the other beneficial traits.

20
Drought is the most important limiting factor in more than 65% of paddy fields in Malaysia, where elite rice varieties cannot perform well under drought stress. Therefore, the development and production of drought–tolerant rice varieties, to stabilize and improve the production levels in low to middle yielding fields, is needed. In recent years, a drought–resistant field screening facility was established through a mutation breeding program, and an evaluation standard was developed. Some advanced lines of drought tolerant rice varieties were identified and will be used in both molecular mapping and breeding programs.
Water supply is affected by the degradation of watersheds due to deforestration and soil erosion. There is severe depletion of valuable groundwater resources as water is taken up for agricultural and industrial purposes. Some varieties of rice can be grown without irrigation, with about 15% in Sabah and Sarawak being rainfed, but yields are lower due to the uncertainty of water supply. In view of this water shortage, there is an urgent need to develop new varieties with high yield potential and stability under water stress conditions. Therefore, in an attempt to develop drought resistant lines, morphological and agronomic traits that are related to water stress can be useful in establishing a successful breeding program for rice improvement.
For strategic water management and utilization purposes the traditional submerged rice cultivation system is gradually moving towards a system where rice is grown under low water input and aerobic conditions, while maintaining high productivity. Aerobic cultivation is a planting system where rice is grown in well-drained, non-puddled, and non-saturated soils. In aerobic rice systems, fields remain unsaturated throughout the season. Yields are on average at 1 to 2 t ha-1 because of adverse environmental conditions (poor soils, little rainfall, weeds), low use of external inputs, and low yield potential of upland rice cultivars [2]. Generally, rice is grown in the fertile highlands using high yielding cultivars with adequate water supply, and can be considered as aerobic rice [3]. Aerobic cultivation can reduce the total water usage by 27 to 51% and increase water productivity by 32 to 88% [4].
The only direct means of measuring nitrogen use efficiency (NUE) from applied fertilizer is through the use of the stable isotope 15N. A fertilizer labelled with 15N is added to the soil and the amount of N that a plant has taken up is determined by determination of the plant biomass together with its N concentration and 15N enrichment. In this way, different N fertilizer practices (placement, timing, and sources) can be studied [5]. Isotopic studies using 15N labelled plant materials have also been useful in estimating the N value of crop residues [6, 7, 8].
The 13C isotope discrimination technique has become a powerful research tool to identify and select C3 (e.g. rice, wheat) and C4 (e.g. maize) species with improved water use efficiency (WUE) [9]. WUE is the ratio of the biomass produced to the water consumed. For C3 plants, Farquhar et al. (1982) proposed that 13C discrimination (∆13C) is related to diffusional fractionation (a = 4.4‰) and discrimination against 13CO2 by ribulose diphosphate carboxylase or RuBisCo (b = 30‰), and Ci/Ca, the ratio of intercellular to ambient partial pressure of CO2.
The objective of this study is to evaluate two advanced mutant lines MR 219–4 and MR 219–9 for high yield potential and stability under water stress and adapted to local conditions by using isotopic techniques for estimating water and nitrogen use efficiencies.

21
2. EVALUATION AND CHARACTERIZATION OF ADVANCED MUTANT LINES MR219–4 AND MR219–9 OF RICE (ORYZA SATIVA) UNDER DROUGHT CONDITIONS 2.1. Materials and methods
Two advanced rice mutant lines MR219–4 and MR219–9 and cultivars MR211, MR219 and ARN 1 were grown in a greenhouse at the Malaysian Nuclear Agency (Nuclear Malaysia), Bangi. The mutant and check varieties were arranged in a randomized complete block design (RCBD) with three replications. The pre-germinated seeds were sown in trays containing wet soil. Healthy seedlings were transplanted 26 days after germination. The seedlings were planted in rows consisting of nine plants of each genotype which were randomly assigned within each of the three replicate blocks. The planting distance was 23 cm within and 23 cm between rows. The space between two adjacent troughs was 1 m. The water was drained at 30 days after transplanting (DAT) and was re-irrigated periodically when soil water tension fell below –50 kPa. The control was continued with standing water until maturity.
Morphological traits evaluated on a single plant basis were plant height, days to flowering, number of tillers, flag leaf area, panicle length and days to maturity. The plants were scored for leaf rolling and leaf drying by visual observation using a 0–9 scale based on the Standard Evaluation System adopted for rice [10]. Grain was harvested manually when the plants reached maturity. Grain from each plant was packed in an envelope. The culms and leaves were cut at ground level and wrapped with newspaper. The grain and plant parts were dried in an oven at 37°C for 48 hours.
The measured agronomic traits for each plant were grain weight, grain yield, 100-grain weight, and dried plant weight, biomass and harvest index. Data were analysed using the statistical analysis system (SAS 9.1.3) for windows software. All the data were subjected to a two-way analysis of variance (ANOVA) and the mean values were compared by the least significant difference (LSD) test.
2.2. Results and discussion
Leaf rolling and leaf drying are used as indicators of tolerance to drought. An early sign
of declining soil water is leaf rolling which is a simple expression of leaf wilting. Leaf rolling is a criterion for scoring drought tolerance in rice cultivars [11]. Therefore, leaf rolling is useful for the quick screening of hundreds of lines.
There were significant differences among the evaluated lines for leaf rolling and leaf drying (Table 1). A drought resistant check variety, ARN 1 had the best score of 0 for leaf rolling. Meanwhile, MR211, the susceptible check variety had a score of 7 indicating susceptibility to drought. MR219 had a score of 5 which was considered as moderately susceptible. Thus, in this study, MR219–4 can be considered as moderately resistant and MR219–9 as resistant to drought.

22
TABLE 1. MEAN VALUE OF LEAF ROLLING AND LEAF DRYING TRAITS OF EVALUATED LINES
Line Leaf rolling mean score Leaf drying mean score MR219–4 3 1 MR219–9 1 1 MR211 7 7 MR219 5 3 ARN 1 0 1 LSD(0.05) 0.29 1.70
Typically leaf drying begins at the tip of the leaf, which is usually under greater water deficit than the basal part that is closer to the stem [11]. Leaf drying was observed visually by scoring the plants on a scale 0 to 9 based on the Standard Evaluation System adopted for rice [10]. Leaf water deficiency can be further reduced beyond the point of turgor loss reaching the point of tissue death [11]. A low score of leaf drying can be advantageous in terms of less damage under water stress [12]. MR219–9 and MR219–4 scored 1 indicating that they were less damaged from water stress (Table 1).
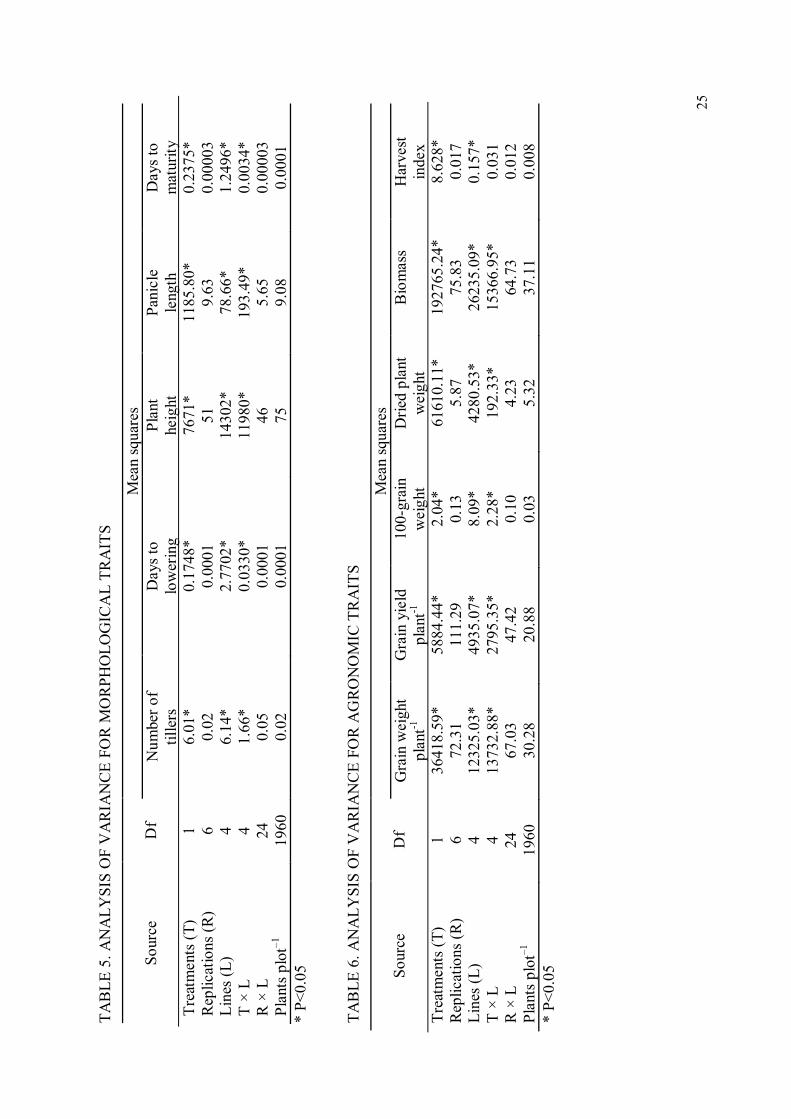
There were significant differences between treatments for days to flowering, flag leaf area and days to maturity (Table 2). There were significant differences between lines for all traits except plant height. There were significant interaction between treatments and lines for number of tillers, days to flowering, flag leaf area and days to maturity (Table 2).
TABLE 2. ANALYSIS OF VARIANCE FOR MORPHOLOGICAL TRAITS
Source
Df
Mean squares Number of tillers
Days to flowering
Plant height
Flag leaf area
Panicle length
Days to maturity
Treatments (T) 1 0.07 0.0034* 17391 532.12* 30.63 0.0111* Replications (R) 4 0.06 0.0001 9296 93.56 11.69 0.0001 Lines (L) 4 0.18* 0.1440* 6385 168.40* 29.25* 0.0820* T × L 4 0.13* 0.0016* 1113 169.13* 7.96 0.0004* R × L 16 0.03 0.0003 9496 45.01 19.85 0.0002 Plants plot–1 60 0.02 0.0001 9061 24.81 7.38 0.0001 * P<0.05
There were significant differences (P<0.05) between treatments for all traits except biomass (Table 3). The lines were significantly different (P<0.05) for all traits (Table 3). There were significant interactions between treatments and lines for grain weight per plant, grain yield per plant, dried plant weight and biomass (Table 3).

23
TABLE 3. ANALYSIS OF VARIANCE FOR AGRONOMIC TRAITS
Source
Df
Mean squares Grain weight plant-1
Grain yield
plant–-1
100-grain
weight
Dried plant
weight
Biomass
Harvest index
Treatments (T) 1 267.67* 79.88* 0.41* 596.86* 65.13 0.040* Replications (R) 4 20.42 9.80 0.10 173.80 186.63 0.010 Lines (L) 4 104.95* 58.33* 2.16* 636.93* 1214.72* 0.009* T × L 4 124.87* 55.91* 0.21 350.76* 864.66* 0.005 R × L 16 21.29 7.65 0.71 170.03 173.51 0.006 Plants plot–1 60 20.59 11.94 2.25 110.17 167.49 0.003 * P<0.05
3. MULTILOCATION TRIAL OF MR219–4 AND MR219–9 UNDER DROUGHT CONDITIONS 3.1. Materials and methods
Multi-location trials were conducted at three locations, viz. (i) Ladang 2, Universiti Putra Malaysia (UPM), (ii) Department of Agriculture, Tg. Karang, Selangor, and (iii) Muda Agricultural Development Authority (MADA), Kedah. The yield potential of two advanced mutant lines, MR219–4 and MR219–9 were evaluated under aerobic conditions. In addition, two local rice cultivars (MR211 and MR219) together with Aeron 1 (ARN 1) were also used. MR211 is known as a variety that is susceptible to drought while MR219 has moderate drought tolerance. ARN 1, commonly referred to as aerobic rice, is a variety that was developed by the International Rice Research Institute (IRRI). It is proven to have high yield potential under drought conditions. Two screening methods were applied, line–source sprinkler irrigation and irrigated rice field. The line-source sprinkler irrigation method creates a gradient of drought stress, and allows the evaluation of large numbers of genotypes at varying intensities of drought in a given environment. In the irrigated rice field a uniform, repeatable and controlled stress environment is created by controlling drainage.
3.2. Results and discussion
Twelve morphological and agronomic traits were evaluated and analyzed under stress and non-stress treatments (Table 4). Data were analyzed using the statistical analysis system (SAS 9.1.3) for windows software. All the data obtained were subjected to a two-way analysis of variance (ANOVA) and the mean differences were compared by the least significant differences (LSD) test.
The ANOVA analyses of morphological and agronomic traits are shown in Tables 5 and 6, respectively. There were significant differences (P<0.05) between treatments and between lines for all morphological and agronomic traits (Tables 5 and 6). There were also significant interaction between treatments and lines for all morphological traits (Table 5) and for all agronomic traits except harvest index (Table 6).

24
TABLE 4. MORPHOLOGICAL AND AGRONOMIC DATA
Traits Description Leaf length Length of the flag leaf of the highest tiller recorded from 5 different
plants Leaf width Width of the flag leaf of the highest tiller measured from 5 different
plants Panicle length Length of the highest panicle of 5 plants Culm height Length of the culm of 5 plants measured from above ground to the base
of the panicle Plant height Length of the panicle of 5 plants measured from the ground to the tip of
the panicle at near maturity Number of tillers Total number of tillers of 5 plants measured from the ground level to the
tip of the panicle near at maturity Number of reproductive tillers
Total number of grain-bearing tiller on plants
Days to 50% flowering
The number of days from sowing until 50% of the plants in a row had flowering tillers
Days to maturity The number of days from sowing until 80% of the plants in a row ripen Harvest index Ratio of grain weight to the whole plant weight Biomass Mass of dry matter of plants Grain yield Mean weight of grain per plant
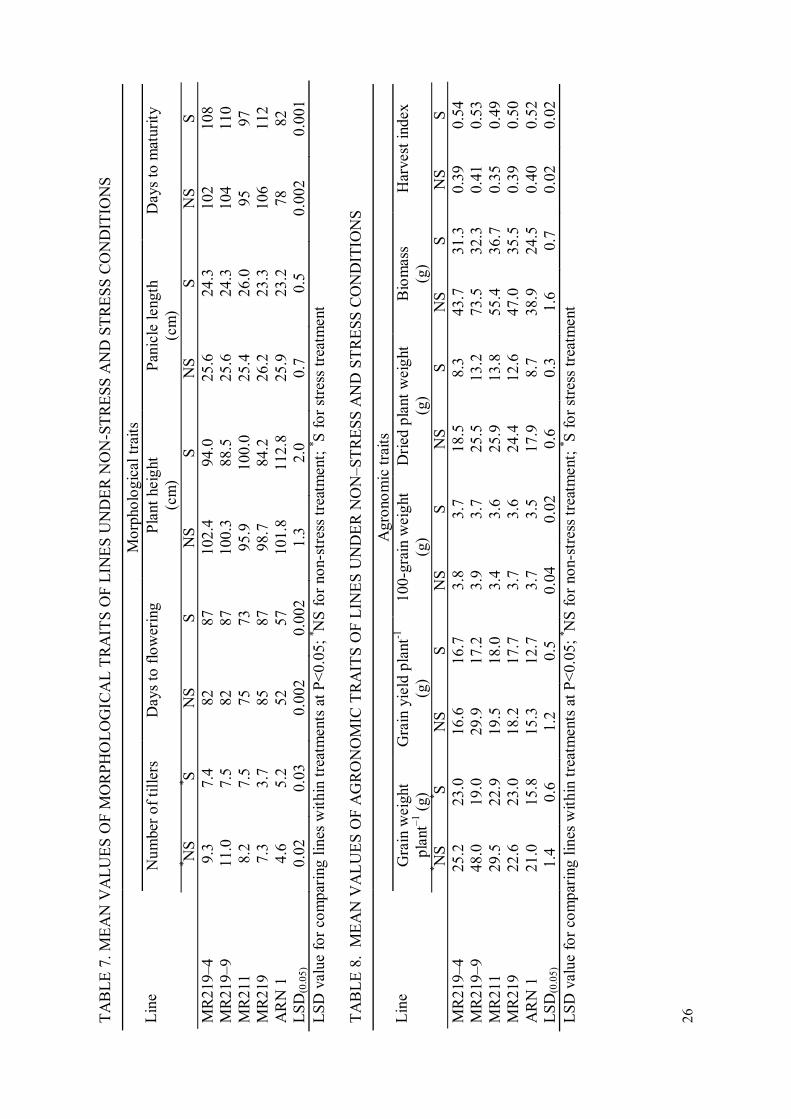
The mean values of all morphological and agronomic traits for each line under non-stress
and stress conditions are shown in Tables 7 and 8, respectively. There were significant differences (P<0.05) between treatments, between lines and between the interactions of treatments and lines for all morphological (Table 7) and all agronomic (Table 8) traits.
The field evaluation plots at Alor Serdang (MADA) are shown in Figure 1.
FIG. 1. Field evaluation at Muda Agricultural Development Authority (MADA), Alor
Serdang, Kedah.
25
TA
BL
E 5
. AN
AL
YS
IS O
F V
AR
IAN
CE
FO
R M
OR
PH
OL
OG
ICA
L T
RA
ITS
S
ourc
e Df
Mea
n sq
uare
s N
umbe
r of
ti
llers
Day
s to
lo
wer
ing
Pla
nt
heig
ht
Pan
icle
le
ngth
Day
s to
m
atur
ity
Tre
atm
ents
(T
) 1
6.01
* 0.
1748
* 76
71*
1185
.80*
0.
2375
* R
eplic
atio
ns (
R)
6 0.
02
0.00
01
51
9.63
0.
0000
3 L
ines
(L
) 4
6.14
* 2.
7702
* 14
302*
78
.66*
1.
2496
* T
× L
4
1.66
* 0.
0330
* 11
980*
19
3.49
* 0.
0034
* R
× L
24
0.
05
0.00
01
46
5.65
0.
0000
3 P
lant
s pl
ot–1
19
60
0.02
0.
0001
75
9.
08
0.00
01
* P
<0.
05
TA
BL
E 6
. AN
AL
YS
IS O
F V
AR
IAN
CE
FO
R A
GR
ON
OM
IC T
RA
ITS
S
ourc
e Df
Mea
n sq
uare
s G
rain
wei
ght
plan
t-1
Gra
in y
ield
pl
ant-1
10
0-gr
ain
wei
ght
Dri
ed p
lant
w
eigh
t B
iom
ass
Har
vest
in
dex
Tre
atm
ents
(T
) 1
3641
8.59
* 58
84.4
4*
2.04
* 61
610.
11*
1927
65.2
4*
8.62
8*
Rep
licat
ions
(R
) 6
72.3
1 11
1.29
0.
13
5.87
75
.83
0.01
7 L
ines
(L
) 4
1232
5.03
* 49
35.0
7*
8.09
* 42
80.5
3*
2623
5.09
* 0.
157*
T
× L
4
1373
2.88
* 27
95.3
5*
2.28
* 19
2.33
* 15
366.
95*
0.03
1 R
× L
24
67
.03
47.4
2 0.
10
4.23
64
.73
0.01
2 P
lant
s pl
ot–1
19
60
30.2
8 20
.88
0.03
5.
32
37.1
1 0.
008
* P
<0.
05
26
TA
BL
E 7
. ME
AN
VA
LU
ES
OF
MO
RP
HO
LO
GIC
AL
TR
AIT
S O
F L
INE
S U
ND
ER
NO
N-S
TR
ES
S A
ND
ST
RE
SS
CO
ND
ITIO
NS
L
ine
Mor
phol
ogic
al t
raits
N
umbe
r of
till
ers
Day
s to
flo
wer
ing
Pla
nt h
eigh
t
(cm
) P
anic
le le
ngth
(c
m)
Day
s to
mat
urit
y
* NS
* S
N
S
S
NS
S
N
S
S
NS
S
M
R21
9–4
9.3
7.4
82
87
102.
4 94
.0
25.6
24
.3
102
10
8
MR
219–
9 11
.0
7.5
82
87
100.
3 88
.5
25.6
24
.3
104
11
0 M
R21
1 8.
2 7.
5 75
73
95
.9
100.
0 25
.4
26.0
95
97
M
R21
9 7.
3 3.
7 85
87
98
.7
84.2
26
.2
23.3
10
6
112
AR
N 1
4.
6 5.
2 52
57
10
1.8
112.
8 25
.9
23.2
78
82
L
SD
(0.0
5)
0.02
0.
03
0.00
2 0.
002
1.3
2.0
0.
7 0.
5
0.00
2 0.
001
LS
D v
alue
for
com
pari
ng l
ines
wit
hin
trea
tmen
ts a
t P<
0.05
; * NS
for
non
-str
ess
trea
tmen
t; * S
for
str
ess
trea
tmen
t T
AB
LE
8.
ME
AN
VA
LU
ES
OF
AG
RO
NO
MIC
TR
AIT
S O
F L
INE
S U
ND
ER
NO
N–S
TR
ES
S A
ND
ST
RE
SS C
ON
DIT
ION
S
L
ine
Agr
onom
ic t
raits
G
rain
wei
ght
plan
t–1 (
g)
Gra
in y
ield
pla
nt-1
(g
) 10
0-gr
ain
wei
ght
(g)
Dri
ed p
lant
wei
ght
(g)
Bio
mas
s
(g)
Har
vest
inde
x
* NS
* S
N
S
S
NS
S
N
S
S
NS
S
N
S
S
MR
219–
4 25
.2
23.0
16
.6
16.7
3.
8 3.
7 18
.5
8.3
43.7
31
.3
0.39
0.
54
MR
219–
9 48
.0
19.0
29
.9
17.2
3.
9 3.
7 25
.5
13.2
73
.5
32.3
0.
41
0.53
M
R21
1 29
.5
22.9
19
.5
18.0
3.
4 3.
6 25
.9
13.8
55
.4
36.7
0.
35
0.49
M
R21
9 22
.6
23.0
18
.2
17.7
3.
7 3.
6 24
.4
12.6
47
.0
35.5
0.
39
0.50
A
RN
1
21.0
15
.8
15.3
12
.7
3.7
3.5
17.9
8.
7 38
.9
24.5
0.
40
0.52
L
SD
(0.0
5)
1.4
0.6
1.
2 0.
5
0.04
0.
02
0.6
0.3
1.6
0.7
0.02
0.
02
LS
D v
alue
for
com
pari
ng l
ines
wit
hin
trea
tmen
ts a
t P<
0.05
; * NS
for
non
-str
ess
trea
tmen
t; * S
for
str
ess
trea
tmen
t

29
4. NITROGEN USE EFFICIENCY (NUE) UNDER AEROBIC CONDITIONS
4.1. Materials and methods
A shade house experiment was carried out in a paddy at the Malaysian Nuclear Agency. The shade house provided some control on environmental factors, including shelter from the rain. Two types of mutant rice lines, namely NMR151 (formerly known as MR219–4) and NMR152 (formerly known as MR219–9), were used. Both varieties were produced by mutation induction using γ–irradiation on the MR219 parent variety. The paddy soil had a sandy loam texture with a bulk density of 1.45 g cm-3. A Completely Randomized Block Design (CRBD) with three replications was used as the experimental layout.
Rice mutant lines NMR151 and NMR152 were planted in troughs measuring 3 m2 (3m × 1m). Rice seeds were sown manually at 2 cm depth and covered with soil. Three watering regimes and three N rates were the experimental treatments. Rice was grown for 110 days under three water potentials (i) Field capacity from 0 to 40 DAS (days after sowing) and saturated from 41 to 110 DAS [ST], (ii) Field capacity from 0 to 110 DAS [FC], and (iii) Field capacity from 0 to 40 DAS and 30% of field capacity from 41 to 110 DAS [SS]. Nitrogen in the form of 15N-labelled urea (5.20 atom % excess) was applied at three rates; none (0 kg N ha-1), moderate (60 kg N ha-1) and high (120 kg N ha–-1) in three splits at 7, 35 and 60 days after emergence. Basal fertilizers of phosphorus from triple super phosphate at 60 kg P2O5 ha–1 and potassium from muriate of potash at 60 kg K2O ha–1 were applied at 15 and 65 days after emergence. A tensiometer was installed and soil moisture was measured daily.
Plants were sampled after 110 to 115 days when the aerobic rice had matured and ripened. Harvesting and sampling were carried out on a 1 m × 0.5 m area (0.5 m2). Total plant biomass was weighed to obtain the fresh weight. Plant parts such as straw, leaf and grain were separated and the fresh weight of each was measured. Straw, leaf, and grain samples were oven dried at 70 to 80 oC for three days after which they were weighed (oven dry weight) and finely milled for further analysis. Total N in straw, leaf and grain was determined by Kjeldahl digestion followed by steam distillation, and subsequently 15N content was analyzed using an emission spectrometer [5]. 15N abundance was converted to 15N enrichment by subtracting the natural abundance (0.3663 atom % 15N).
4.2. Results and discussion
4.2.1. N derived from fertilizer (Ndff), N concentration and N uptake
The effect of N rates on nitrogen derived from fertilizer (Ndff) in the two mutants under field capacity water potential is shown in Figure 2. Ndff increased when the rate of nitrogen supplied increased. There were no significant differences in Ndff between mutants MR219–9 and MR219–4.
The differences in N concentrations in plant parts of aerobic rice varieties according to different rates ofN fertilizer application are shown in Figure 3. The straw had a higher N concentration followed by leaves and grain. The N concentration increased as the rate of N applied to the plants increased.

30
FIG. 2. The influence of N fertilizer rate on %Ndff of two rice mutants under field capacity water potential.
FIG. 3. The influence of N fertilizer rate on the N concentrations in the aerial tissues of two rice mutants under field capacity water potential.
The effect of N fertilizer rate on N uptake by two rice mutants at field capacity water potential is shown in Figure 4. N uptake significantly increased as the N fertilizer rate increased, but there was no difference between the two mutants, indicating their equal capacity to assimilate fertilizer N.

31
FIG. 4. The influence of N fertilizer rate on N uptake by two rice mutants under field capacity water potential. 4.2.2. Nitrogen use efficiency (NUE)
At rates of 60N and 120N, there was no significant difference between NUE values (Table 8). This finding is inconsistent with a previous study [13], where it was reported that increasing N application rates by more than 60 kg N ha-1 caused NUE to decrease. The higher NUE also found in a previous study [14] was also not from the highest rate of N application to rice.
Water potential had a significant effect on NUE (Table 8). NUE at FC was higher than those of ST and SS. However, NUE at ST and SS water potentials were not significantly different from each other. NUE of mutant rice decreased at high (ST) and stress water conditions (SS). This result is similar to a previous study [15], where it was reported that water stress caused reduction of NUE, while another study reported that NUE of rice was low under continuous flooding [16].
Therefore the use of fertilizer N by mutant rice lines was optimal at the N rate of 60 kg N ha-1 under the FC level of water potential. High N fertilizer application up to 120 kg N ha-1 may increase the rice yield, but it also causes more N loss which reduces fertilizer effectiveness. These results also proved that changes in the water level in the soil can influence the intake of N by plants. At ST and SS water potentials, the NUE was significantly lower than FC. Stagnant water conditions at the ST level may have caused some N fertilizer loss through leaching and water runoff. A stress water condition like SS may disturb the vegetative growth of the plants that results in the plant’s inability to absorb N efficiently. Dry soil conditions under water stress also may have disrupted the growth of plant roots to absorb N efficiently and may increase soil temperatures. The increase of soil temperature was reported to cause N loss through ammonia volatilization and warm soil water cannot hold as much ammonia gas [17].
There was a significant difference between NMR151and NMR152 mutants with respect to NUE (Table 8). NMR152 had a higher NUE than NMR151 under different N rates and water potentials. Although there is no reference about these cultivars, a previous study reported that different rice cultivars also had significant differences in NUE [18]. Further research needs to be carried out on both cultivars to confirm this important finding.
All interactions tested in this study did not have a significant effect on NUE (Table 8).

32
TABLE 8. ANALYSIS OF VARIANCE OF YIELD, YIELD COMPONENTS AND NUE Treatments Plant
height No. of Tillers
Grain yield
1000 grain weight
NUE
Nitrogen Rates (N) 0 N 99.94a 13.27a 2.735a 28.75a – 60 N 112.57b 18.06b 4.039b 29.18b 54.39a 120 N 118.44b 23.61c 5.211c 29.41c 51.52a P value 0.0001 0.0001 0.0001 0.0001 0.319 Water Potentials (W) ST 125.59c 18.29a 4.768b 30.42c 34.25a FC 109.86b 17.72a 3.649a 29.49b 41.65b SS 95.51a 18.94a 3.568a 27.41a 30.01a P value 0.0001 0.360 0.0001 0.0001 0.0001 Cultivars (C) NMR151 110.17a 18.74a 3.933a 29.16a 32.48a NMR152 110.47a 17.89a 4.057a 29.06a 38.13b P value 0.899 0.224 0.622 0.186 0.006 Interactions
P value N x W 0.373 0.020 0.323 0.113 0.061 W x C 0.909 0.989 0.673 0.503 0.930 N x C 0.910 0.316 0.979 0.800 0.790 N x W x C 0.945 0.750 0.995 0.573 0.588
Different letters with a column and treatment indicate a significant difference (p<0.05) 5. WATER USE EFFICIENCY
5.1. Materials and methods
A study was conducted during the second season in May 2013 at MADA Research Center in Alor Serdang, Kedah. The total plot area was 0.2 ha and was divided into three water management plots: (i) Continuous Flood/Flooded Condition (CF), (ii) Alternate Wetting and Drying (AWD) and (iii) rainfed with supplementary sprinkler irrigation or aerobic water input condition (AC). A split plot design with five replications was used. Sub–plot size was 2 m × 2 m with 1.5 m between sub–plots. Seedlings were transplanted at a distance of 20 cm × 25 cm. Fertilizer and biocides were applied according to current practices for MR219 as recommended by MADA. Weeds were removed manually as and when required.
A micrometeorological station iMETOS was installed inside the experimental area. The iMETOS station was equipped with 8 sensors measuring precipitation, solar radiation, wind speed, wind direction, atmospheric pressure, humidity, and temperature. Data from iMETOS was cross verified with data from nearby MADA weather stations.
Samples were collected at two stages. Pre–anthesis samples were collected on the 55th day. Physiological maturity was assumed when 90% of the seeds changed colour from green to yellowish when photosynthetic activity had ceased. Only fertile or active tillers were counted. Two hills from every plot were harvested by cutting close to ground level. Total oven-dry matter including stems, leaves, spikes and grains was recorded at physiological
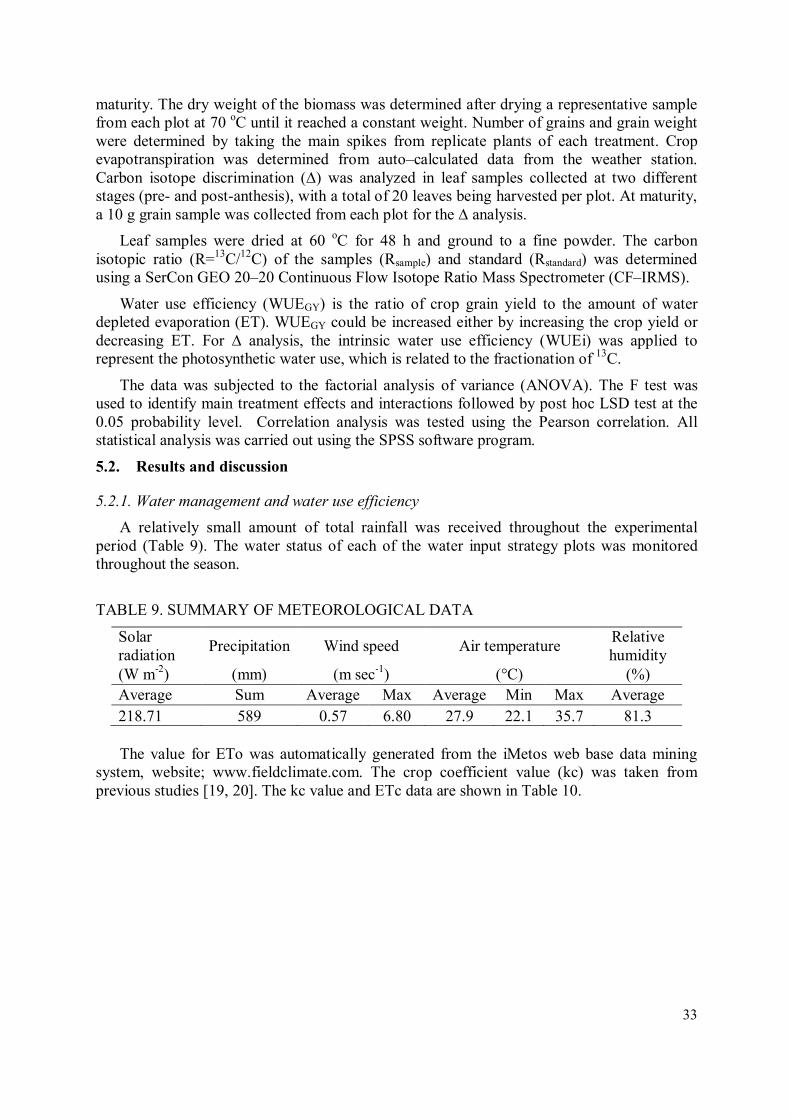
33
maturity. The dry weight of the biomass was determined after drying a representative sample from each plot at 70 oC until it reached a constant weight. Number of grains and grain weight were determined by taking the main spikes from replicate plants of each treatment. Crop evapotranspiration was determined from auto–calculated data from the weather station. Carbon isotope discrimination (∆) was analyzed in leaf samples collected at two different stages (pre- and post-anthesis), with a total of 20 leaves being harvested per plot. At maturity, a 10 g grain sample was collected from each plot for the ∆ analysis.
Leaf samples were dried at 60 oC for 48 h and ground to a fine powder. The carbon isotopic ratio (R=13C/12C) of the samples (Rsample) and standard (Rstandard) was determined using a SerCon GEO 20–20 Continuous Flow Isotope Ratio Mass Spectrometer (CF–IRMS).
Water use efficiency (WUEGY) is the ratio of crop grain yield to the amount of water depleted evaporation (ET). WUEGY could be increased either by increasing the crop yield or decreasing ET. For ∆ analysis, the intrinsic water use efficiency (WUEi) was applied to represent the photosynthetic water use, which is related to the fractionation of 13C.
The data was subjected to the factorial analysis of variance (ANOVA). The F test was used to identify main treatment effects and interactions followed by post hoc LSD test at the 0.05 probability level. Correlation analysis was tested using the Pearson correlation. All statistical analysis was carried out using the SPSS software program.
5.2. Results and discussion
5.2.1. Water management and water use efficiency
A relatively small amount of total rainfall was received throughout the experimental period (Table 9). The water status of each of the water input strategy plots was monitored throughout the season.
TABLE 9. SUMMARY OF METEOROLOGICAL DATA
Solar radiation
Precipitation Wind speed Air temperature Relative humidity
(W m-2) (mm) (m sec-1) (°C) (%) Average Sum Average Max Average Min Max Average 218.71 589 0.57 6.80 27.9 22.1 35.7 81.3 The value for ETo was automatically generated from the iMetos web base data mining
system, website; www.fieldclimate.com. The crop coefficient value (kc) was taken from previous studies [19, 20]. The kc value and ETc data are shown in Table 10.
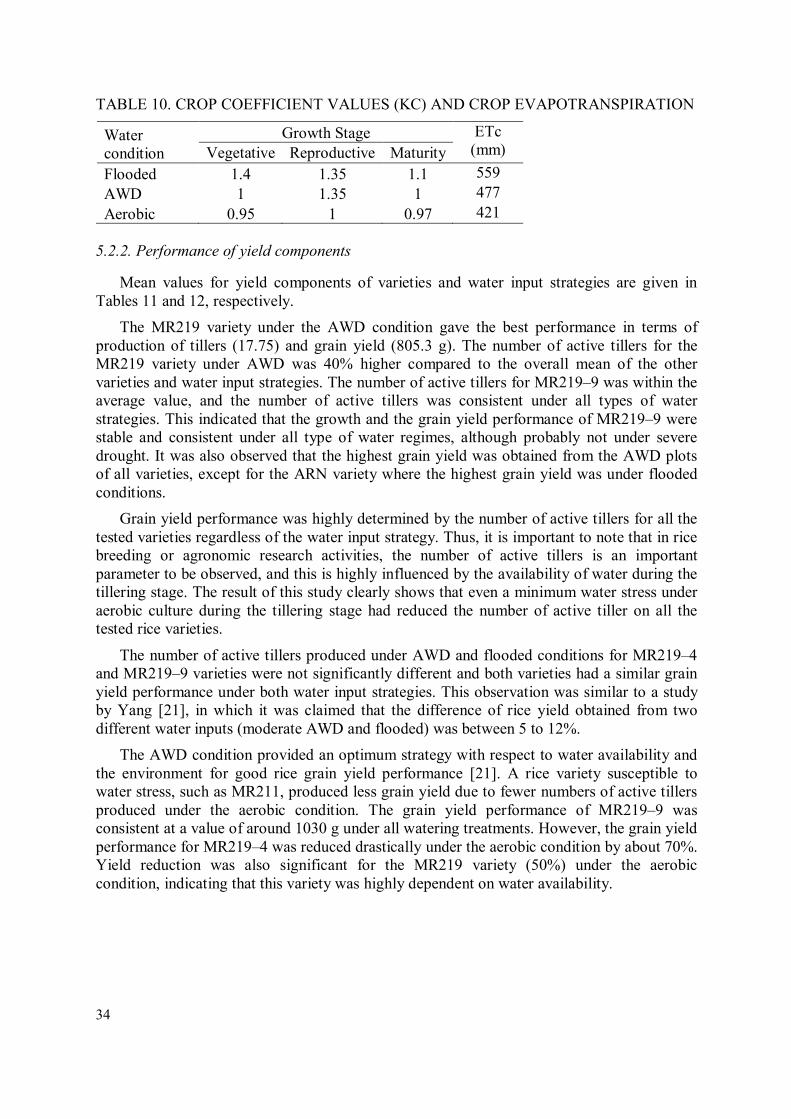
34
TABLE 10. CROP COEFFICIENT VALUES (KC) AND CROP EVAPOTRANSPIRATION
Water condition
Growth Stage ETc (mm) Vegetative Reproductive Maturity
Flooded 1.4 1.35 1.1 559 AWD 1 1.35 1 477 Aerobic 0.95 1 0.97 421
5.2.2. Performance of yield components
Mean values for yield components of varieties and water input strategies are given in Tables 11 and 12, respectively.
The MR219 variety under the AWD condition gave the best performance in terms of production of tillers (17.75) and grain yield (805.3 g). The number of active tillers for the MR219 variety under AWD was 40% higher compared to the overall mean of the other varieties and water input strategies. The number of active tillers for MR219–9 was within the average value, and the number of active tillers was consistent under all types of water strategies. This indicated that the growth and the grain yield performance of MR219–9 were stable and consistent under all type of water regimes, although probably not under severe drought. It was also observed that the highest grain yield was obtained from the AWD plots of all varieties, except for the ARN variety where the highest grain yield was under flooded conditions.
Grain yield performance was highly determined by the number of active tillers for all the tested varieties regardless of the water input strategy. Thus, it is important to note that in rice breeding or agronomic research activities, the number of active tillers is an important parameter to be observed, and this is highly influenced by the availability of water during the tillering stage. The result of this study clearly shows that even a minimum water stress under aerobic culture during the tillering stage had reduced the number of active tiller on all the tested rice varieties.
The number of active tillers produced under AWD and flooded conditions for MR219–4 and MR219–9 varieties were not significantly different and both varieties had a similar grain yield performance under both water input strategies. This observation was similar to a study by Yang [21], in which it was claimed that the difference of rice yield obtained from two different water inputs (moderate AWD and flooded) was between 5 to 12%.
The AWD condition provided an optimum strategy with respect to water availability and the environment for good rice grain yield performance [21]. A rice variety susceptible to water stress, such as MR211, produced less grain yield due to fewer numbers of active tillers produced under the aerobic condition. The grain yield performance of MR219–9 was consistent at a value of around 1030 g under all watering treatments. However, the grain yield performance for MR219–4 was reduced drastically under the aerobic condition by about 70%. Yield reduction was also significant for the MR219 variety (50%) under the aerobic condition, indicating that this variety was highly dependent on water availability.
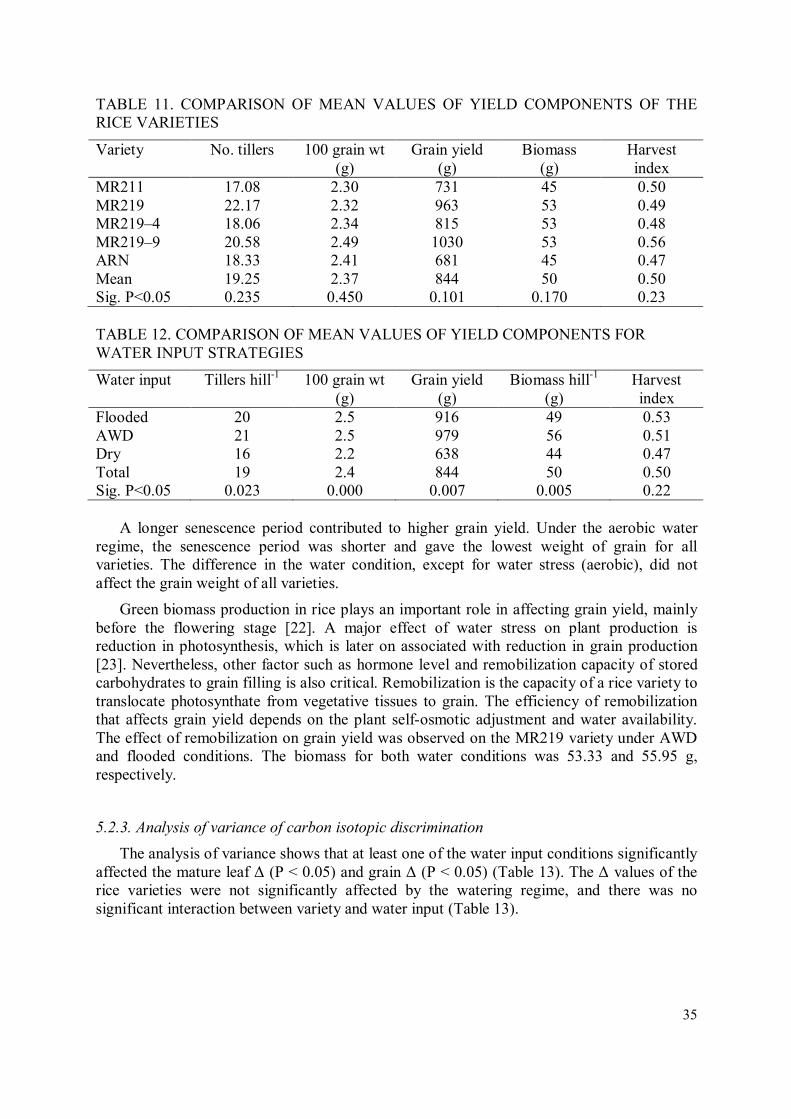
35
TABLE 11. COMPARISON OF MEAN VALUES OF YIELD COMPONENTS OF THE RICE VARIETIES
Variety No. tillers 100 grain wt (g)
Grain yield (g)
Biomass (g)
Harvest index
MR211 17.08 2.30 731 45 0.50 MR219 22.17 2.32 963 53 0.49 MR219–4 18.06 2.34 815 53 0.48 MR219–9 20.58 2.49 1030 53 0.56 ARN 18.33 2.41 681 45 0.47 Mean 19.25 2.37 844 50 0.50 Sig. P<0.05 0.235 0.450 0.101 0.170 0.23 TABLE 12. COMPARISON OF MEAN VALUES OF YIELD COMPONENTS FOR WATER INPUT STRATEGIES
Water input Tillers hill-1 100 grain wt (g)
Grain yield (g)
Biomass hill-1 (g)
Harvest index
Flooded 20 2.5 916 49 0.53 AWD 21 2.5 979 56 0.51 Dry 16 2.2 638 44 0.47 Total 19 2.4 844 50 0.50 Sig. P<0.05 0.023 0.000 0.007 0.005 0.22
A longer senescence period contributed to higher grain yield. Under the aerobic water
regime, the senescence period was shorter and gave the lowest weight of grain for all varieties. The difference in the water condition, except for water stress (aerobic), did not affect the grain weight of all varieties.
Green biomass production in rice plays an important role in affecting grain yield, mainly before the flowering stage [22]. A major effect of water stress on plant production is reduction in photosynthesis, which is later on associated with reduction in grain production [23]. Nevertheless, other factor such as hormone level and remobilization capacity of stored carbohydrates to grain filling is also critical. Remobilization is the capacity of a rice variety to translocate photosynthate from vegetative tissues to grain. The efficiency of remobilization that affects grain yield depends on the plant self-osmotic adjustment and water availability. The effect of remobilization on grain yield was observed on the MR219 variety under AWD and flooded conditions. The biomass for both water conditions was 53.33 and 55.95 g, respectively.
5.2.3. Analysis of variance of carbon isotopic discrimination
The analysis of variance shows that at least one of the water input conditions significantly affected the mature leaf ∆ (P < 0.05) and grain ∆ (P < 0.05) (Table 13). The ∆ values of the rice varieties were not significantly affected by the watering regime, and there was no significant interaction between variety and water input (Table 13).

36
TABLE 13. ANALYSIS OF VARIANCE OF ∆ FOR VARIETIES AND WATER INPUTS Source Df Mean square F Sig. Variety CID Pre–Anthesis 4 0.114 0.646 0.633
CID Straw 4 0.504 2.183 0.086 CID Mature leaf 4 0.213 1.379 0.256 CID Grain 4 0.392 2.136 0.092
Water input CID Pre–Anthesis 2 3.256 18.384 0.000 CID Straw 2 0.289 1.255 0.295 CID Mature leaf 2 4.931 31.859 0.000 CID Grain 2 1.150 6.274 0.004
Variety * water input
CID Pre–Anthesis 8 0.608 3.433 0.004
CID Straw 8 0.344 1.490 0.188 CID Mature leaf 8 0.080 0.519 0.836 CID Grain 8 0.157 0.858 0.558
LSD: Based on observed means; Mean Square Error = 0.183. *The mean difference is significant at P<0.05 5.2.4. Carbon isotope discrimination of rice varieties
Carbon isotope discrimination values of components of rice varieties at pre– and post–anthesis developmental stages are given in Table 14.
TABLE 14. COMPARISON OF MEAN VALUES OF CARBON ISOTOPE DISCRIMINATION (CID, ‰) FOR RICE VARIETIES
Variety CID pre-anthesis CID straw CID mature leaf CID grain
MR211 22.3 22.2 23.0 21.3
MR219 22.2 22.6 22.8 21.6
MR219–4 22.1 22.4 22.9 21.5
MR219–9 22.3 22.3 22.9 21.2
ARN 22.2 22.1 22.6 21.5
Mean 22.2 22.3 22.8 21.4
Sig. P<0.05 0.860 0.104 0.614 0.137
At the leaf level, stomata of drought tolerant varieties will close or partially close under water stress conditions, thus lowering the internal CO2 concentration, ci, relative to CO2 in the atmosphere, ca. A continuing photosynthetic process in leaf mesophyll enriching 13C in ci and the ability of the enzyme to discriminate carbon isotopes declines. It relies on the fact that photosynthetic enzymes discriminate against the heavier stable isotope 13C (relative to 12C) during photosynthesis. The extent of the enzyme’s discrimination against 13C depends on the internal CO2 concentration, ci. However, the analysis of variance (Table 13) showed that there were no significant effects of rice variety on any of the pre- or post-anthesis parameters across all watering regimes (Table 14).

37
5.2.5. Carbon isotope discrimination under water input strategies
Carbon isotope discrimination values of components of rice varieties at pre- and post-anthesis developmental stages under water input strategies are given in Table 15.
TABLE 15. COMPARISON OF MEAN VALUES OF CARBON ISOTOPE DISCRIMINATION (CID, ‰) FOR WATER INPUT STRATEGIES
Water input CID pre-anthesis CID straw CID mature leaf CID grain
Flooded 21.8 22.2 22.8 21.2
AWD 22.6 22.5 23.3 21.6
Dry (aerobic) 22.2 22.3 22.3 21.5
Mean 22.2 22.3 22.8 21.4
Sig. P<0.05 0.000 0.343 0.000 0.005
Carbon isotope discrimination values of mature leaf samples were different under
different water input conditions (Table 15). The highest mature leaf ∆ mean value was under the AWD water input treatment, while the lowest was under the aerobic regime. ∆ values under AWD were higher by 23% for all varieties.
Mean grain ∆ for the AWD water input was the highest (21.61‰) compared to the other water input treatments (Table 15). However, the grain shows a different pattern of ∆ mean values for all the tested varieties and water conditions. The grain ∆ values in MR219–4 and MR219–9 were higher under the aerobic water input condition while the highest ∆ values for MR219, MR211 and ARN varieties were under the AWD condition (data not shown). There are many factors that affect the ∆ values. The storage and remobilization of carbon compounds in plants during the grain filling stage, may affect the ∆ values. A drought-resistant variety stores and remobilizes more of the non-structural carbohydrate (NSC), which may results in higher fractionation of C isotopes under water stress compared to a stress- susceptable variety [25].
While grain yield and ∆ of varieties MR219 and MR219–4 were comparable to MR219–9 under well-watered conditions, a steep reduction of yield and ∆ were shown under aerobic conditions (data not shown). This indicated that these varieties were more sensitive to water limitation which was probably due to various factors, such as rate of photosynthesis due to closure of stomata and rate of C remobilization, which also affected discrimination of C isotopes [26].
Grain ∆ values under AWD and the aerobic condition were higher compared to the flooded condition, except for the ARN variety. The grain ∆ value for MR219–9 under flooded conditions was the lowest (20.75‰) while MR219 under AWD was the highest (23.94‰). Mutant varieties (MR219–9 and MR219–4) reacted differently with respect to ∆ under water stress conditions. The grain ∆ values of these two varieties were the highest under the aerobic condition. The ability of a drought resistant variety to perform well during grain filling, which was affected by stem reserve utilization and remobilization rate [27], could be considered as a potential factor that contributes to the variance of the grain ∆ of different mutant rice varieties under water stress compared to other common varieties.
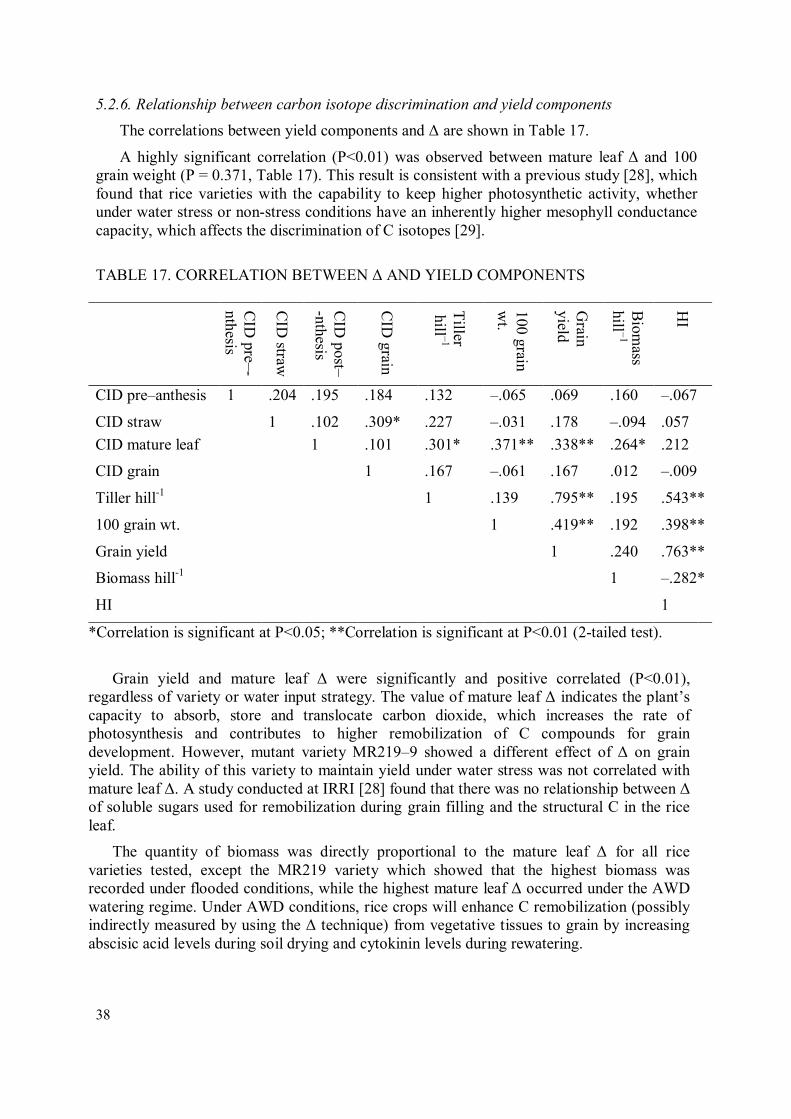
38
5.2.6. Relationship between carbon isotope discrimination and yield components
The correlations between yield components and ∆ are shown in Table 17.
A highly significant correlation (P<0.01) was observed between mature leaf ∆ and 100 grain weight (P = 0.371, Table 17). This result is consistent with a previous study [28], which found that rice varieties with the capability to keep higher photosynthetic activity, whether under water stress or non-stress conditions have an inherently higher mesophyll conductance capacity, which affects the discrimination of C isotopes [29].
TABLE 17. CORRELATION BETWEEN ∆ AND YIELD COMPONENTS
CID
pre–-nthesis
CID
straw
CID
post–-nthesis
CID
grain
Tiller
hill –1
100 grain w
t.
Grain
yield
Biom
ass hill –1
HI
CID pre–anthesis 1 .204 .195 .184 .132 –.065 .069 .160 –.067
CID straw 1 .102 .309* .227 –.031 .178 –.094 .057
CID mature leaf 1 .101 .301* .371** .338** .264* .212
CID grain 1 .167 –.061 .167 .012 –.009
Tiller hill-1 1 .139 .795** .195 .543**
100 grain wt. 1 .419** .192 .398**
Grain yield 1 .240 .763**
Biomass hill-1 1 –.282*
HI 1
*Correlation is significant at P<0.05; **Correlation is significant at P<0.01 (2-tailed test).
Grain yield and mature leaf ∆ were significantly and positive correlated (P<0.01), regardless of variety or water input strategy. The value of mature leaf ∆ indicates the plant’s capacity to absorb, store and translocate carbon dioxide, which increases the rate of photosynthesis and contributes to higher remobilization of C compounds for grain development. However, mutant variety MR219–9 showed a different effect of ∆ on grain yield. The ability of this variety to maintain yield under water stress was not correlated with mature leaf ∆. A study conducted at IRRI [28] found that there was no relationship between ∆ of soluble sugars used for remobilization during grain filling and the structural C in the rice leaf.
The quantity of biomass was directly proportional to the mature leaf ∆ for all rice varieties tested, except the MR219 variety which showed that the highest biomass was recorded under flooded conditions, while the highest mature leaf ∆ occurred under the AWD watering regime. Under AWD conditions, rice crops will enhance C remobilization (possibly indirectly measured by using the ∆ technique) from vegetative tissues to grain by increasing abscisic acid levels during soil drying and cytokinin levels during rewatering.

39
Yield component were not significantly correlated with grain ∆ (Table 17). Each variety responded differently under stress or non-stress water conditions with respect to stem reserve utilization and remobilization of C for grain filling [30]. However, it appears that mutant variety MR 219–9 has a unique mechanism of drought resistance via the utilization of carbohydrate compounds, which resulted in a higher ∆ value of grain, thus warranting further investigation.
Grain ∆ was significantly correlated with straw ∆ (Table 17). It is known that the starch content in the stem increases for a period before pollination. This store of starch is directed to seed as the rice plant develops. Starch used in grain filling was derived from straw instead of leaf based on the grain and straw ∆ relationship.
5.2.7. Mean water use efficiencies for varieties and watering strategies
Mutant variety MR219–9 had significantly higher mean WUE compared to ARN and MR211 varieties, but did not differ from MR219 or MR219–4 (Table 18). The mean WUE was significantly higher in the AWD treatment compared to the dry regime, but neither was significantly different compared with the flooded treatment (Table 18). TABLE 18. MEAN VALUE FOR WUE OF RICE VARIETIES UNDER WATER INPUT STRATEGIES
Variety ARN MR211 MR219–4 MR219 MR219–9 Sig. WUE 1.39 a 1.52 a 1.64 ab 1.97 ab 2.15 b 0.0530
Water input Dry Flooded AWD Sig. WUE 1.52 a 1.64 ab 2.05 b 0.0450
Different lower case letters within a line denote significant difference (P<0.05) 5.2.8. WUE and ∆
Mature leaf ∆ was positively and significantly (P<0.05) correlated with water productivity, while grain ∆ was positively and more highly correlated with water productivity (P<0.001). Grain ∆ compared to WUE differed from C isotope discrimination theory and transpiration efficiency (TE). In theory, intrinsic water use efficiency (WUEi) is inversely correlated with ∆ values, resulting from the high concentration difference of CO2 (ci/ca) which reflects a higher CO2 assimilation rate to transpiration ratio. However the results of this study were similar to previous studies which reported that grain yield, plant biomass and WUE were positively correlated with ∆ [31].
The results of the present study suggest that the relationship between ∆ and WUE should be separated into two parts; (i) carbohydrate production which depends on the rate of photosynthesis and (ii) grain production which depends on the rate of remobilization of C from stem to grain. Thus, it is suggested that applying ∆ values based only on the rate of photosynthesis is not accurate enough to be used for WUEGY evaluation.

40
6. DEMONSTRATION AND PERFORMANCE ON FARMERS’ FIELDS
Two advanced mutant lines (MR 219–4 and MR 219–9) and the parent MR 219 were planted at two locations in farmers’ fields in the northern part of Peninsular Malaysia noted for low yields and poor soil fertility, in order to assess performance and for demonstration purposes.
6.1. Utan Aji, Perlis
According to the farmers, the average yield in this area is around 3 t ha-1. The mutant lines were treated with a complete package of bioproducts which were produced by Nuclear Malaysia viz. Bioliquifert and Oligochitosan. The total yield recorded was 4.5 t ha-1. The yield increased by about 50% by introducing these advanced mutant lines and the complete package of bioproducts (Figure 5).
FIG. 5. Yield trial and demonstration in a farmer’s field (Utan Aji, Perlis)
6.2. Pendang, Kedah
A special funding from the Ministry of Science, Technology & Innovation (MOSTI) called “Malaysia Social Innovation Fund– Project Code no. MSI 16010” with the total amount of USD 100 000 was awarded to Nuclear Malaysia. This project funded the direct collaboration between Nuclear Malaysia and 25 farmers at the northern part of Peninsular Malaysia with the assistance from Muda Agriculture Development Authority (MADA). The data collected in 2015 and 2016 revealed that the yield increased by 25% on average. Prior to the introduction of mutant line NMR152, farmers only managed to attain a yield of around 4 to 6 t ha-1 as opposed to 8 t ha-1 recorded for NMR152. This yield is much higher as compared

41
to the national average yield of only 4 t ha–1.
FIG. 6. Yield trial and demonstration in a farmer’s field (Pendang, Kedah)
7. CONCLUSIONS
Generally, leaf rolling and leaf drying are resulted in water loss in rice plants subject to drought. Based on these criteria, none of the evaluated lines was better than the drought resistant check variety, ARN 1.
Analysis of variance in morphological traits indicated that there were highly significant difference at P≤0.01 in culm height, days to flowering, 100 grain weight and total grain weight among mutant lines.
There were significant differences at P≤0.05 in number of tillers, number of panicles and total grain yield among lines. However, no significant differences were found among lines in flag leaf area, days to maturity, panicle length and grain panicle–1 and fertility percentage.
Yield and yield components of the mutants MR219–9 and MR219–4 responded to N fertilizer and the water regime. Increasing N rates may increase the yield but under some water conditions, N use efficiency is low despite high N fertilizer rates. Nitrogen use efficiency was optimum at field capacity for the 60 kg N ha-1 treatment.
Mutant variety MR219–9 is a potential high yielding variety that performed consistently well under non-stress or under water limited conditions, while AWD water management was relatively better in terms of water productivity and yield performance compared to the others.
The ability to maintain the grain yield under water stress shows the capability of MR219–9 to control the internal CO2 concentration ci, which is the critical factor influencing the rate of photosynthesis. However, the most important factor is the plant’s ability to effectively remobilize photosynthate for grain filling.
ACKNOWLEDGEMENTS
The authors would like to thank the International Atomic Energy Agency (IAEA), the Ministry of Science, Technology & Innovation (MOSTI) and the Malaysian Nuclear Agency for providing the funds to carry out this Project. The authors are grateful for the contributions of MADA, MARDI, DOA and UPM for providing research plots and facilities. Special thanks go to all researchers, postgraduate students and supporting staff from the Division of

42
Agrotechnology and Biosciences, Malaysian Nuclear Agency (Nuclear Malaysia) for contributing to the success of this project.
REFERENCES
[1] BHUIYAN, S. I., Water management in relation to crop production: Case study on rice, Outlook Agric. 21 (1992) 293–299.
[2] PRIYANKA, G., LAL, B., KATARA, J.L., EKTA, J., Beushening: A Traditional Method of Rice Crop Establishment in Eastern India, Popular Kheti 1 (2013) 1.
[3] KATO, Y., OKAMI, M., KATSURA, K., Yield potential and water use efficiency of aerobic rice (Oryza sativa L.) in Japan, Field Crops Res. 113 (2009) 328–334.
[4] BOUMAN, B.A.M., Rice and water. Adv. Agron. 92 (2005) 187–237. [5] IAEA., Use of isotopes and radiation methods in soil and water management and crop
nutrition, Training Course 14 (2001) 21–96. [6] AZAM, F., SIMMONS, F.W., MULVANEY, R.L., Mineralization of N from plant
residues and its interaction with native soil N, Soil Biol. Biochem. 25 (1993) 1787–1792.
[7] JENSEN, E.S., Availability of nitrogen in 15N–labelled mature pea residues to subsequent crops in the field, Soil Biol. Biochem. 26 (1994) 465–472.
[8] VANLAUWE, B., SWIFT, M.J. MERCKX, R., Soil litter dynamics and N use in a leucaena (Leucaena leucocephala Lam. (De Witt) alley cropping system in southwestern Nigeria, Soil Biol. Biochem. 28 (1996) 739–749.
[9] DERCON, G., CLYMANS, E., DIELS, J., MERCKX, R. DECKERS, J., Differential 13C isotopic discrimination in maize at varying water stress and at low to high nitrogen availability, Plant Soil 282 (2006) 313–326.
[10] IRRI, International Network for Genetic Evaluation of Rice: standard evaluation system for rice, (1996) IRRI, Los Banos.
[11] FISCHER, K.S., LAFITTE, R., FUKAI, S., ATLIN, G., HARDY, B., Breeding rice for drought–prone environments, (2003) IRRI, Los Banos.
[12] KADIOGLU, A., TERZI, R., A dehydration avoidance mechanism: Leaf rolling, Bot. Rev. 73 (2007) 290–302.
[13] MANDANA, T., AKIF, G., EBRAHIM, A., AZIN, N.Z.,Effect of nitrogen fertilizer on nitrogen uptake, nitrogen use efficiency of rice, Int. Conf. Biol. Environ. Chem. 24 (2011) 470–473.
[14] ENDRIS, Y., ALEMAYEHU, B., Effect of nitrogen application on grain yield and nitrogen use efficiency of rice (Oryza sativa L.), Asian J. Crop Sci. 6 (2014) 272–280.
[15] NAYAK, B.R., PRAMNIK, K., PANIGRAPHY, N., DASH, A.K., SWAIN, S.K., Yield, nitrogen uptake, and nitrogen use efficiency indices of aerobic rice (Oryza sativa
L.) under various irrigation regimes and nitrogen levels, Int. J. Bioresources 1 (2015) 8–13.
[16] RAHAMAN, S., SINHA, A.C., Effect of water regimes and organic sources of nutrients for higher productivity and nitrogen use efficiency of summer rice, Afr. J. Agric. Res. 8 (2013) 6189–6195.
[17] JONES, C., BROWN, B.D., ENGEL, R., HORNECK, D. AND OLSON–RUTZ, K., Factors affecting nitrogen fertilizer volatilization, [2013] Montana State University Bulletin.
[18] JACQUELINE, A.P., GILBERT, C.S., MANOCH, K., ALFREDO, D.P., Improving yield and nutrient uptake potentials of Japonica and Indica rice varieties with nitrogen fertilization, World J. Agric. Sci. 4 (2008) 427–434.

43
[19] AZWAN, M.Z., MUSTAPHA, S., PUASA, Z., Determination of water requirement in a paddy field at Seberang Perak rice cultivation area, (2010).
[20] MORATIEL, R., MARTÍNEZ, A., Evapotranspiration and crop coefficients of rice (Oryza sativa L.) under sprinkler irrigation in a semiarid climate determined by the surface renewal method, Irrig. Sci. 31 (2013) 411–422.
[21] YANG, J., ZHOU, Q., ZHANG, J., Selection of drought tolerant and high water use efficient rice cultivars through 13C isotope discrimination technique, (2016).
[22] FAROOQ, M., WAHID, A., BASRA, S.M.A., Improving water relations and gas exchange with Brassinosteroids in rice under drought stress, J.Agron. Crop Sci. 4
(2009) 262–269. [23] WAHID, A., RASUL, E., Photosynthesis in leaf, stem, flower and fruit, In: Pessarakli,
M. (Ed.), Handbook of Photosynthesis, 2nd ed., CRC Press, Florida, (2005) 479–497. [24] SUBBARAO, G.V., NAM, N.H., CHAUHAN, Y.S., JOHANSEN, C., Osmotic
adjustment, water relations and carbohydrate remobilization in pigeon pea under water deficits, J. Plant Physiol. 157 (2000) 651–659.
[25] YANG, J., ZHANG, J., WANG, Z., ZHU, Q., WANG, W., Remobilization of carbon reserves in response to water deficit during grain filling of rice, Field Crops Res. 71 (2001) 47–55.
[26] FARQUHAR, G.D., On the nature of carbon isotope discrimination in C4 species, Funct. Plant Biol. 10 (1983) 205–226.
[27] BLUM, A., Improving wheat grain filling under stress by stem reserve mobilisation, Euphytica 100 (1998) 77–83.
[28] CENTRITTO, M., LAUTERI, M., MONTEVERDI, M.C., SERRAJ. R., Leaf gas exchange, carbon isotope discrimination, and grain yield in contrasting rice genotypes subjected to water deficits during the reproductive stage. J. Exp. Bot. 60 (2009) 2325–2339.
[29] O'LEARY, M.H., Carbon isotopes in photosynthesis, Biosci. 38 (1988) 328–336. [30] CHU, G., CHEN, T., WANG, Z., YANG, J., ZHAN, J., Morphological and
physiological traits of roots and their relationships with water productivity in water–saving and drought–resistant rice. Field Crops Res. 162 (2014) 108–119.
[31] AKHTER, J., MONNEVEUX, P., SABIR, S.A., ASHRAF, M.Y., LATEEF, Z., SERRAJ, R., Selection of drought tolerant and high water use efficient rice cultivars through 13C isotope discrimination technique, Pak. J. Bot. 42 (2010) 3887–3897.

44
INTRODUCING QUINOA MUTANT VARIETIES WITH HIGH WATER AND
NUTRIENT USE EFFICIENCIES TO IMPROVE RURAL COMMUNITES IN
THE PERUVIAN HIGHLANDS L. GOMEZ–PANDO, E.A. CASTELLANOS, M. IBAÑEZ–TREMOLADA, J. FALCONI–PALOMINO, K.A. GONZALES Programa de Cereales y Granos Nativos, Universidad Nacional Agraria de LaMolina Lima, Peru Abstract
Quinoa (Chenopodium quinoa) is a native species of the Andean region currently valued as an alternative crop for marginal areas, with agronomic and nutritional qualities recognized worldwide. Although cultivated for thousands of years in the Andean region, agronomic studies have recently become important in order to enhance crop performance in a sustainable and profitable way. Several experiments were carried out in the present study to evaluate the response of mutant lines of Quinoa to the application of irrigation water and fertilizers, especially nitrogen. Experiments were carried out in the highlands and in the coastal area of Peru. A group of mutant lines of Quinoa developed using γ–irradiation having good yield potential and with better efficiency in the use of nitrogen were identified. A decrease in the supply of irrigation water for the mutant line La Molina 89–77 did not have a significant effect on the components of grain quality, but had a negative influence on the morphology of the crop, reducing plant height and stem diameter. In addition, the days to maturation increased, while the number of grains per plant and the grain yield ha–1 decreased. The use of anti–percolant plastic which reduced the irrigation water demand resulted in a greater efficiency in the use of water, but gradually decreased the profitability of the crop. When water was applied at 2750 m³ ha-1 without plastic, 2750 m³ ha-1 with plastic, 2100 m³ ha-1 with plastic and 1350 m³ ha-1 with plastic, grain yields were 3163, 3333, 3039 and 2234 kg ha-1, respectively. The highest yield was obtained with the mutant line MQLM89 175 (3136 kg ha-1) while the lowest was obtained with the mutant line MQPAS–374 (1653 kg ha-1) in plots amended with synthetic N and P fertilizer. When manure was used as an organic fertilizer a yield range of 1054 to 3111 kg ha–1 was observed, corresponding to mutant lines MQLM89 175 and MQPAS–374, respectively.
1. INTRODUCTION
Quinoa (Chenopodium quinoa Willd.) is a nutritious native grain of the Andean Region. The nutritional value of quinoa is based mainly on the content and quality of its proteins which have a high content of essential amino acids. In addition, Quinoa contains sufficient amounts of carbohydrates, essential fatty acids, vitamins and minerals that enhance its nutritional value. It was traditionally grown in the Andean region since the Inca era, but with the arrival of the Spaniards it was relegated to marginal land.
Quinoa is generally cultivated under adverse environmental conditions at high altitudes (2500 to 4000m) with crop losses due principally to abiotic stresses including frequent drought, soil salinity, frost, hail, wind, flooding and heat waves. The predominant production system is traditional, characterized by the intensive use of manual labour from land preparation to harvesting with or without the help of animal traction. These areas with little or no external inputs of seed, fertilizer, pesticides and mechanization are associated with severe poverty, exacerbated by the topography and adverse environmental conditions.

45
The national and international demand for Quinoa has been increasing since the year 2000 with concomitants increases in grain prices. Increased Quinoa production and yield stability have been identified as important aspects for addressing food security concerns across the Andean region.
The overall objective was to contribute to the production of staple nutritious foods in the high Andean region to provide food security, improve nutrition and the economy of the rural population living in extreme poverty. The specific objectives were to (i) evaluate the nitrogen and water use efficiency of mutant lines of Quinoa in the field and (ii) to develop production technologies for Quinoa (cultivars and mutants lines) through the evaluation of genotypes (cultivars and advanced mutant lines), fertilizers (organic and inorganic), p lant densities and locations.
2. MATERIALS AND METHODS
The locations of the research experiments and farmer demonstrations are given in Table 1. TABLE 1. LOCATION OF EXPERIMENTAL AND DEMONSTRATION PLOTS
Department Province District Location Altitude (masl) Junin Jauja San Lorenzo Experimental station
National Agrarian Univ. 3200
Sincos Farmer field 3700 Huancavelic Tayacaja Acostambo Farmer community 3600
Ñahuinpuquio 3630 Lima Lima La Molina National Agric. Univ. La Molina 241
Mutant lines were derived through γ−irradiation of the La Molina 89 variety. They were
selected by flowering days, plant height, lodging tolerance, response to foliar mildew (Perenospora farinosa), and yield potential. The commercial varieties included INIA 415–Pasankalla, Rosada de Huancayo, Blanca de Hualhuas, Salcedo INIA, Blanca de Junin, Amarilla de Marangani, Amarilla Sacaca and Negra Collana.
Climatic data were collected in Junin. Agronomic traits evaluated included yield (kg ha-1), life cycle (d), plant height (cm) and disease response following the protocol established for Quinoa. Quality traits evaluated included 1000 grains weight and test weight (associated with commercial characters and flour yield-caloric diet). These analyses followed the protocols established by the International Center for Agricultural Research in the Dry Areas (ICARDA), namely Crop Quality Evaluation Methods and Guidelines (1988) and ASBC (1992), and Methods of analysis of the American Society of Brewing Chemists, 8th Edn., American Society of Brewing Chemists, St. Paul, Minnesota, USA.
For each characteristic, a data matrix was constructed using Microsoft Office2007. The analysis started with basic descriptive statistics: mean, standard deviation (SD) and coefficient of variation (CV) and analysis of variance according to the statistical design used.
Three fertilizer efficiency parameters were derived. Agronomy efficiency (kg kg-1) = Grain yieldml – grain yieldc / fertilizer N applied [1]
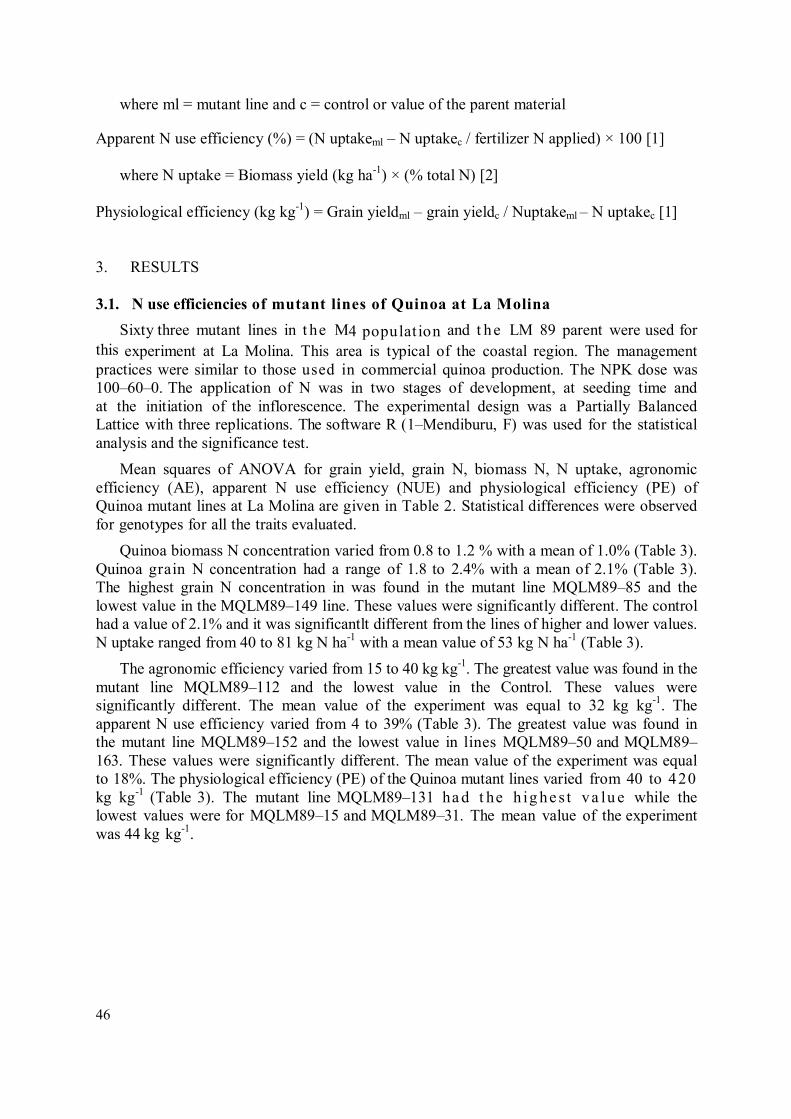
46
where ml = mutant line and c = control or value of the parent material
Apparent N use efficiency (%) = (N uptakeml – N uptakec / fertilizer N applied) × 100 [1]
where N uptake = Biomass yield (kg ha-1) × (% total N) [2] Physiological efficiency (kg kg-1) = Grain yieldml – grain yieldc / Nuptakeml – N uptakec [1] 3. RESULTS 3.1. N use efficiencies of mutant lines of Quinoa at La Molina
Sixty three mutant lines in t he M4 populat ion and t he LM 89 parent were used for this experiment at La Molina. This area is typical of the coastal region. The management practices were similar to those used in commercial quinoa production. The NPK dose was 100–60–0. The application of N was in two stages of development, at seeding time and at the initiation of the inflorescence. The experimental design was a Partially Balanced Lattice with three replications. The software R (1–Mendiburu, F) was used for the statistical analysis and the significance test.
Mean squares of ANOVA for grain yield, grain N, biomass N, N uptake, agronomic efficiency (AE), apparent N use efficiency (NUE) and physiological efficiency (PE) of Quinoa mutant lines at La Molina are given in Table 2. Statistical differences were observed for genotypes for all the traits evaluated.
Quinoa biomass N concentration varied from 0.8 to 1.2 % with a mean of 1.0% (Table 3). Quinoa grain N concentration had a range of 1.8 to 2.4% with a mean of 2.1% (Table 3). The highest grain N concentration in was found in the mutant line MQLM89–85 and the lowest value in the MQLM89–149 line. These values were significantly different. The control had a value of 2.1% and it was significantlt different from the lines of higher and lower values. N uptake ranged from 40 to 81 kg N ha-1 with a mean value of 53 kg N ha-1 (Table 3).
The agronomic efficiency varied from 15 to 40 kg kg-1. The greatest value was found in the mutant line MQLM89–112 and the lowest value in the Control. These values were significantly different. The mean value of the experiment was equal to 32 kg kg-1. The apparent N use efficiency varied from 4 to 39% (Table 3). The greatest value was found in the mutant line MQLM89–152 and the lowest value in lines MQLM89–50 and MQLM89–163. These values were significantly different. The mean value of the experiment was equal to 18%. The physiological efficiency (PE) of the Quinoa mutant lines varied from 40 to 420 kg kg-1 (Table 3). The mutant line MQLM89–131 ha d t he h ig he s t va lu e while the lowest values were for MQLM89–15 and MQLM89–31. The mean value of the experiment was 44 kg kg-1.

47
TABLE 2. MEAN SQUARES OF ANOVA FOR GRAIN YIELD, GRAIN N, BIOMASS N, N UPTAKE, AGRONOMIC EFFICIENCY (AE), APPARENT N USE EFFICIENCY (NUE) AND PHYSIOLOGICAL EFFICIENCY (PE) OF QUINOA MUTANT LINES AT LA MOLINA
Source of variation
Df Grain yield Biomass N
Grain N
N uptake
AE NUE PE
Block 2 2464857** 0.015** 0.097* 61.5** 245** 185 1205 Genotype 49 894681** 0.072** 0.302* 248** 89** 244** 20585** Error 98 289936 0.001 0.017 5.5 2.9 43 6495 Total 149
*, P<0.05; **, P<0.01; ***, P<0.001
TABLE 3. VALUES FOR GRAIN YIELD, GRAIN N, BIOMASS N, N UPTAKE, AGRONOMIC EFFICIENCY (AE), APPARENT N USE EFFICIENCY (NUE) AND PHYSIOLOGICAL EFFICIENCY (PE) OF QUINOA MUTANT LINES OF LM 89 AT LA MOLINA
Mutant MQLM89–
Grain yield (kg ha-1)
Biomass N (%)
Grain N (%)
N uptake (kg ha-1)
AE (kg kg-1)
NUE (%)
PE (kg kg-1)
Control 1573 1.2 2.1 48 15 12 82 4 2980 1.0 2.1 48 29 12 253 12 3693 1.2 2.0 81 36 45 48 13 3177 0.8 2.1 47 31 11 147 14 4255 0.9 2.0 64 41 28 97 15 2439 1.3 2.1 58 23 22 40 31 2626 1.4 2.2 63 25 27 40 33 2836 1.3 2.3 67 27 31 42 41 3954 1.2 2.2 69 39 33 74 42 2751 1.1 2.3 48 27 12 98 43 2095 1.0 2.2 49 20 13 43 48 3214 0.8 2.2 44 31 8 224 50 2724 0.8 2.0 40 26 4 254 52 3188 0.9 2.1 53 31 17 97 56 2981 0.8 2.1 46 29 11 135 66 3001 0.9 2.1 48 29 13 112 69 3238 0.9 2.1 53 31 17 96 75 3497 0.9 1.9 59 34 23 87 77 3308 1.2 2.1 65 32 29 59 82 3913 1.0 2.1 57 38 21 113 83 2965 1.1 2.1 52 29 17 85 85 2598 1.1 2.4 47 25 11 93 89 3164 0.9 2.1 47 31 11 143 92 3682 1.0 2.1 62 36 26 81 94 3225 1.0 2.1 47 31 11 148 111 3165 1.2 2.2 56 31 20 79 112 4105 1.0 2.1 56 40 20 127 113 4027 0.9 2.2 52 39 16 152 114 3113 0.9 2.1 48 30 13 121

48
120 3625 0.9 2.2 54 35 19 73 122 2744 0.9 2.0 40 26 28 418 124 3308 1.2 2.1 71 32 36 49 127 2793 1.0 2.0 43 27 7 211 131 4205 0.8 1.9 46 41 10 264 134 3656 0.9 2.1 44 36 8 243 135 3719 1.0 2.0 57 36 21 103 137 3182 0.9 2.0 51 31 15 107 139 2581 0.8 2.0 42 25 6 195 145 2831 0.9 2.1 45 27 9 137 146 3570 0.8 2.0 56 35 20 101 149 3705 1.0 1.8 53 36 18 119 150 4018 1.1 2.1 61 39 25 101 152 3920 1.1 2.1 74 38 39 62 153 3502 0.8 2.1 47 34 11 180 154 2953 0.9 2.2 48 29 12 111 155 3163 0.9 2.0 51 31 15 102 163 3245 0.9 2.1 40 31 4 420 164 3498 0.9 2.2 52 34 16 122 175 3602 1.0 2.2 52 35 16 132 179 3519 1.0 2.1 59 34 23 85 CV (%) 16.5 3.7 6.3 4.4 17.1 36 62 Mean 3256 1.0 2.1 53 32 18 130
Based on the agronomic performance, quality traits and NUE data shown in Table 3, a group of 13 promising mutant lines and a control were selected for further evaluation (Table 4). The MQLM89–14 mutant line had the highest grain yield (4255 kg ha-1) and one of the shortest periods to flowering (63 days).

49
TABLE 4. MEAN VALUES FOR AGRONOMIC AND QUALITY TRAITS OF QUINOA MUTANT LINES OF LM 89 AT LA MOLINA
Mutant MQLM89–
Grain yield
(kg ha-1)
Days to Plant height (cm)
1000 grain
wt. (g)
Grain protein
(%)
N uptake
(kg ha-1)
AE (kg kg-1)
NUE (%)
PE (kg kg-1) Flower Mature
14 4255 63 98 155 3.2 12.4 64 41 28 97 131 4205 64 96 182 3.1 11.8 46 41 10 264 112 4105 68 99 157 3.3 13.2 56 40 20 127 113 4027 66 98 165 3.3 13.8 52 39 16 152 150 4018 65 101 162 3.0 12.6 61 39 25 101 41 3954 65 97 167 3.2 13.9 69 39 33 74 152 3920 64 96 152 3.0 13.4 74 38 39 62 82 3913 63 95 158 2.9 12.4 57 38 21 113 135 3719 64 96 158 3.4 12.7 44 36 8 243 149 3705 65 96 158 2.7 10.6 53 36 18 119 12 3693 63 95 155 3.3 13.1 81 36 45 48 92 3682 66 99 155 3.2 13.2 62 36 26 81 134 3656 62 93 140 3.5 13.2 44 36 8 243 Control 1573 78 114 125 3.1 12.7 48 15 12 82
3.2. Water use efficiency of advanced Quinoa mutant line LM 89–77
Three drip irrigation regimes and a plastic “antipercolant” treatment were evaluated to ( i) determine the effect of irrigation regime on agronomic and quality traits ii) to determine the influence of the plastic on the total volume of water used per crop season, i nc lu d ing its effects on water use efficiency (WUE), grain yield and profitability of the crop. The experiment was conducted in the experimental field of the UNALM Campus at La Molina–Coast. The genetic material used was an advanced mutant line 'La Molina 89–77' developed by γ–irradiation of variety LM 89. FAO CROPWAT vs. 8.0 was used to find the crop water demand volume or ETc. The software was used to calculate a reduction of water volume to 75% and 50% and the schedule of irrigation. The ‘antipercolant’ treatment used recycled polyethylene (1.2 m wide and 15 microns thick) buried at 25 cm depth covering a 40 cm wide underground groove, below the planting groove to preserve irrigation water and to make it more available for the plant.
3.2.1. Experimental treatments
T0 = 100% net flow, without antipercolant plastic, T1 = 100% net flow, with antipercolant plastic. T2 = 75% net flow, with antipercolant plastic, T3 = 50% net flow, with antipercolant plastic. The experimental layout was a Randomized Complete Block Design with 3 replicates.
3.2.2. Agronomic traits
The mean squares from the analysis of variance ( Table 5) show significant differences for plant height, maturity days, grain yield and WUE.

50
TABLE 5. MEAN SQUARES OF ANOVA FOR MORPHOLOGICAL AND QUALITY TRAITS AND WATER USE EFFICIENCY (WUE) OF ADVANCED QUINOA MUTANT LINE LM 89–77 UNDER FOUR DRIP IRRIGATION REGIMES AND ANTI–PERCOLANT PLASTIC AT LA MOLINA
Source of variation
Df Plant height
Days to Grain yield
Harvest index
1000 grain wt.
Protein
Saponin
WUE Flower Mature
Block 2 105.5** 0.25 2.33 975601** 0.0002 0.03 7.3 0.05 0.207** Treatment 3 270.7** 1.22 7.64* 590254* 0.0003 0.02 3.4 0.01 0.176** Error 4 3.3 1.14 1.22 69391 0.0019 0.35 2.8 0.01 0.013 Total 11 *, P<0.05; **, P<0.01
Plant height ranged from 78.7 to 100.9 cm (Table 6), with the highest value for treatment T1 (100% net flow with antipercolant plastic) and the lowest for T3 (50% net flow, with antipercolant plastic). Treatment T0 was significant ly less than T1 and greater than T2 and T3. The mean value of plant height was 91.7 cm. Plant height was positively related to water volume with antipercolant plastic. TABLE 6. AG RONO MI C T R AI T S OF ADVANCED QUINOA MUTANT LINE LM 89–77 UNDER FOUR DRIP IRRIGATION REGIMES AND ANTI–PERCOLANT PLASTIC AT LA MOLINA
Net flow (%)
Antipercolant plastic
Plant height (cm)
Flowering (d)
Maturity (d)
Grain yield (kg ha-1)
Harvest index
100 – 95.7 b 48.0 a 107.7 ab 3164 a 0.46 a
100 + 100.9 a 48.0 a 108.7 a 3333 a 0.47 a 75 + 91.4 c 47.7 a 106.3 ab 3040 ab 0.45 a 50 + 78.7 d 46.7 a 105.0 b 2325 b 0.45 a Mean 91.7 47.5 106.9 2.965 0.46 CV (%) 2.0 2.3 1.0 8.9 95
Tukey (α = 0.05), Means within a column with the same letter are not significantly different
There were no s ignificant differences among the irrigation systems for flowering days Table 5) which covered the range of 46.7 to 48 days (Table 6). Similarly, there were no significant differences among the different irrigation treatments for harvest index (Table 5), with a range of 0.45 to 0.47 (Table 6).
The best treatments for grain yield were T1 (100% net flow with antipercolant plastic), T0 (100% net flow without antipercolant plastic) and T2 (75% of net flow with antipercolant plastic) with grain yield of 3333, 3164 and 3040 kg ha-1, respectively (Table 6). Treatment T3 (50% net flow, with antipercolant plastic) had a significantly lower grain yield at 2325 kg ha-1, than treatments T0 and T1.
3.2.3. Quality traits
The mean squares from the analysis of variance in show that there were no significant differences for all the quality traits evaluated (Table 5). The coefficient of variation for 1000 kernel weight, grain protein content and saponin content were 65, 11.5 and 6.7%, respectively.

51
Mean values for 1000 kernel weight ranged from 2.8 to 3.0 g, while the range for protein was 14.9 to 15.4% and for saponin it was 1.3 to 1.5% (Table 7).
TABLE 7. QUALITY TRAITS OF ADVANCED MUTANT LINE LM 89–77 UNDER FOUR DRIP IRRIGATION REGIMES AND ANTIPERCOLANT PLASTIC AT LA MOLINA
Net flow (%)
Antipercolant plastic
1000 kernel wt. (g)
Protein (%)
Saponin (%)
100 – 100 + 2.8 a 15.3 a 1.5 a 75 + 2.9 a 15.4 a 1.3 a 50 + 3.0a 14.9 a 1.4 a Mean 2.9 14.7 1.4 CV (%) 65 11.5 6.7
Tukey (α = 0.05), Means within a column with the same letter are not significantly different 3.2.4. Water consumption and water use efficiency
The Cropwat total programmed flow showed close agreement with the total register flow (Table 8). The net water use, recorded by the flow meter during the 122 days of the growth cycle was 2750, 2100 and 1380 m³ ha-1 for treatments with 100, 75 and 50 % of net irrigation, respectively (Table 8).
TABLE 8. CROPWAT 8.0 SOFTWARE CALCULATION
Total programmed Cropwat
Total programmed flow (m3 ha-1) Total register flow (m3 ha-1) 100% 75% 50% 100% 75% 50%
Gross flow: 3424 m³ ha-1 3 104 2 398 1 552 3 235 2 470 1 623 Net flow: 2910 m³ ha-1 2 638 2 039 1 319 2 750 2 100 1 380
The analysis of variance for water use efficiency (kg m-3) indicates that there were
highly significant differences between treatments, with a coefficient of variability of 8.1% (Table 9). The best treatment of water use efficiency was the T3 (50% net flow with antipercolant plastic) with 1.68 kg m-3, which was not significantly different from T2 (75% net flow with antipercolant plastic) with 1.45 kg m-3 (Table 9). Both T0 and T1 were significantly lower in WUE than T3. TABLE 9. WATER USE EFFICIENCY ( WUE ) OF ADVANCED MUTANT LINE LM 89–77 UNDER FOUR DRIP IRRIGATION REGIMES AND ANTIPERCOLANT PLASTIC AT LA MOLINA
Net flow (%) Antipercolant plastic WUE (kg m-3) 100 – 1.15 b 100 + 1.21 b 75 + 1.45 ab 50 + 1.68 a Mean 1.4 CV (%) 8.1
Tukey (α = 0.05), Means with the same letter are not significantly different

52
3.2.5. Economic return
The economic aspects of the use of the irrigation systems are shown in Table 10. All treatments with antipercolant plastic had a lower rate of return compared to T0 (100% net flow, without antipercolante plastic). Profitability becomes narrower with water reduction and finally became negative for T3. Considering the economic aspects, not necessarily the most efficient use of water, means better profitability. The installation of antipercolant plastic for T2 (75% of net flow with antipercolant plastic) reduced the rates of return, despite having similar yields with T0 (100% net flow, without antipercolante plastic) and T1 (100% net flow with antipercolant plastic) (Table 6). The current price of water did not justify the investment of installing the antipercolant plastic.
TABLE 10. ECONOMIC PROFITABILITY OF THE DRIP IRRIGATION SYSTEM FOR ADVANCED QUINOA MUTANT LINE LM 89–77 AT LA MOLINA
Economic profitability Net flow (%) / antipercolant plastic (+ / –) 100 (–) 100 (+) 75 (+) 50 (+)
Grain yield (kg ha-1) 3163 3333 3039 2234 Unit price (2004 $) 2.7 2.7 2.7 2.7 Production gross value ($) 8473 8928 8140 5984 Total cost ($) 5524 6416 6347 6274 Unit cost ($ kg-1) 1.75 1.93 2.08 2.80 Net utility ($) 2948 2511 1793 –103.5 Rentability unit (%) 52 38 28 –4.9
A summary of the data for all the water–irrigation treatments is presented in Table 11.
The best result in general for all the traits was obtained with T1 (100% net flow with antipercolant plastic) followed by T2 (75% of net flow with antipercolant plastic), a l t h o u g h there were no significant differences with T0 (100% net flow without anti percolant plastic). Apparently, the use of antipercolant plastic allows greater conservation of available moisture in the root zone, reducing the threshold depletion of water in the soil, as plants are less subject to water stress. TABLE 11. AGRONOMIC AND QUALITY TRAITS FOR ADVANCED QUINOA MUTANT LINE LM 89–77 UNDER FOUR DRIP IRRIGATION REGIMES AND ANTIPERCOLANT PLASTIC AT LA MOLINA
Traits Net flow (%) / antipercolant plastic (+ / –) 100 (–) 100 (+) 75 (+) 50 (+) Mean
Agronomic 95.7 b
100.9 a
91.4 c
78.7 d
91.7 Plant height (cm)
Grain yield (kg ha-1) 3164 a 3333 a 3040 ab 2325 b 2965 Flowering (d) 48.0 a 48.0 a 47.7 a 46.7 a 47.6 Maturity (d) 107.7 ab 108.7 a 106.3 ab 105.0 b 106.9 Harvest index (%) 0.46 a 0.47 a 0.45 a 0.45 a 0.46 WUE (kg m-3) 1.2 b 1.2 b 1.5 ab 1.7 a 1.4 Grow cycle water consumption (m³ ha–1) 2750 2750 2100 1380 2245 Quality 1000 kernel weight (g) 2.80 a 2.91 a 2.99 a 2.87 a 2.89 Grain protein content (%) 15.30 a 15.37 a 14.86 a 13.11 a 14.66 Grain saponin content (%) 1.45 a 1.34 a 1.38 a 1.33 a 1.38 Profitability Index (%) 52 38 28 –5 29

53
3.3. Evaluation of quinoa mutant lines under fertilization systems at La Molina
Four systems of quinoa fertilization were studied:
Conventional system: Use of inorganic fertilizers including urea, diammonium phosphate and potassium chloride. Pests were controlled using organic pesticides. The P and K were applied at planting, while one half of the N was applied at planting in mixture with the other nutrients and one half during inflorescence initiation.
Ecological system – Use of island manure: Island manure was applied one month before planting at a depth of 15 cm. Organic pest control products were used.
Ecological system – Use of farm (cow) manure: Farm manure was applied one month before planting at a depth of 15 cm. Organic pest control products were used.
Traditional system: This system had no fertilizer or pesticide application. It was used as a control. In each of the systems nine genotypes were studied: one commercial cultivar Pasankalla, two genotypes selected from the germplasm bank located in Cusco, three advanced mutant lines derived from LM 89 and three mutant lines from Pasankalla. The experimental plot consisted of 10 rows, 4 m in length with 0.8 m between rows. A randomized complete block design was used with three replications. The management practices were similar to the common cultural practices for commercial quinoa production. The following measurements were made: days to flowering, days to maturity, plant height, grain yield and harvest index, response to mildew disease, 1000 grain weight, grain saponin content and protein content. The results are presented for each cropping systems and the combined analysis of all four systems.
3.3.1. Conventional system
The mean squares of ANOVA for days to flowering, days to maturity, plant height, mildew, grain yield, harvest index, 1000 grains weight, grain saponin content and grain protein content are given in Table 12. Significant differences were found among genotypes for all parameters except mildew occurrence and 1000 grain weight.
TABLE 12. MEAN SQUARES OF ANOVA OF AGRONOMIC AND QUALITY TRAITS OF QUINOA GENOTYPES UNDER CONVENTIONAL CROPPING AT LA MOLINA
Source of variation
Df Days to Plant height
Mildew
Grain yield
Harvest index
1000 grain wt.
Grain saponin
Grain protein Flower Mature
Genotype 8 193.5** 259.3* 0.0658* 37.0 874177* 122.3* 0.1337 0.6639* 1.625* Blocks 2 1 3.1 0.0203 17.6 533577 30.4 0.0164 0.0289 1.865 Error 16 1 1.1 0.0033 16.6 45490 25.3 0.1374 0.0300 0.309 Total 26 *, P<0.05; **, P<0.01
The genotypic range observed for flowering, days to maturity, plant height, mildew, grain yield, harvest index, 1000 grains weight, grain saponin content and grain protein content were: 52 to 73 days, 92 to 114.6 days, 1.3 to 1.7 m, 10.0 to 21.6%, 1653 to 3136 kg ha–1, 0.18 to 0.39, 2.92 to 3.59 g, 0 to 1.11 % and 10.4 to 12.7%, respectively. The best genotype for mildew (10%), grain yield (3336 kg ha–1) and harvest index (0.39) was MQLM89 175 mutant line. The highest value of grain saponin content (1.1%) and grain protein content (12.7%) was found in

54
MQLM89 109 mutant line.
3.3.2. Ecological system – Island manure
The mean square of ANOVA for days to flowering, days to maturity, plant height, mildew, grain yield, harvest index, 1000 grains weight, grain saponin content and grain protein content are given in Table 13. Statistically significant differences were observed for genotypes for all the traits evaluated with t h e one exception of grain protein content.
TABLE 12. MEAN VALUES OF AGRONOMIC AND QUALITY TRAITS OF QUINOA GENOTYPES UNDER CONVENTIONAL CROPPING AT LA MOLINA
Genotypes Days to Plant height
(m)
Mildew (%)
Grain yield
(kg ha-1)
Harvest index
1000 grain
wt. (g)
Grain saponin
(%)
Grain protein
(%) Flower Mature
PEQPC–498/CUZ
60 c 98.6 c 1.7 ab 15.0 a 1740 c 0.24 bc 3.59 a 0.3 b 11.5 ab
PASANKALLA 52 d 92.0 d 1.4 de 15.0 a 2075 bc 0.29 abc 3.36 a 0 11.5 ab MQLM89 175 58 c 96.0 c 1.3 e 10.0 a 3136 a 0.39 a 3.32 a 1.0 a 12.1 ab MQLM89 135 60 c 98.6 c 1.6 abc 18.3 a 2865 ab 0.32 abc 3.27 a 1.1 a 11.8 ab MQLM89 109 58 c 96.0 c 1.5 bcde 13.3 a 2802 ab 0.35 ab 3.13 a 1.1 a 12.7 a PEQPC–357/CUZ
69 b 111.0 b 1.8 a 18.3 a 2907 ab 0.29 abc 3.55 a 0.3 b 10.4 b
MQPAS–137 73 ab 114.0 ab 1.5 cde 21.6 a 2183 bc 0.27 abc 3.28 a 0.2 b 11.2 ab MQPAS–374 73 ab 114.0 ab 1.6 abcd 13.3 a 1653 c 0.18 c 3.12 a 0.9 a 11.2 ab MQPAS–375 73 a 114.6 a 1.7 a 13.3 a 2302 abc 0.24 bc 2.92 a 0.8 a 12.6 a CV (%) 1.6 1.0 3.6 26.5 8.9 17.7 11.3 28.4 4.8 Means within a column followed by the same letter are not significantly different (P<0.05, Duncan’s multiple range test) TABLE 13. MEAN SQUARES OF ANOVA OF AGRONOMIC AND QUALITY TRAITS OF QUINOA GENOTYPES UNDER ISLAND MANURE ECOLOGICAL SYSTEM AT LA MOLINA
Source of variation
Df Days to Plant height
Mildew
Grain yield
Harvest index
1000 grain wt.
Grain saponin
Grain protein Flower Mature
Genotype 8 111.8* 188.9* 0.0790* 102.3* 2129895* 453.9* 0.241* 0.651* 0.679 Blocks 2 21 50.3 0.0558 128.7 174446 55.0 0.055 0.011 0.897 Error 16 2.6 4.3 0.0174 15.2 228549 45.9 0.051 0.019 0.359 Total 26 *, P<0.05; **, P<0.01
The range observed for days to flowering, days to maturity, plant height, mildew, grain
yield, harvest index, 1000 grains weight, grain saponin and grain protein contents were: 57 to 73 days, 94.6 to 114.6 days, 1.6 to 2.0 m, 23.3 to 40.0%, 862 to 3033 kg ha-1, 0.10 to 0.43, 2.9 to 3.7 g, 0 to 1.2% and 11.1 to 12.6%, respectively (Table 14). MQLM89 175 mutant line had the highest grain yield equal to 3033 kg ha-1. The highest value of grain protein content (12.6%) was for the MQLM89 374 mutant line.
3.3.3. Ecological system – Farm manure
The mean squares of ANOVA for days to flowering, days to maturity, plant height, mildew,
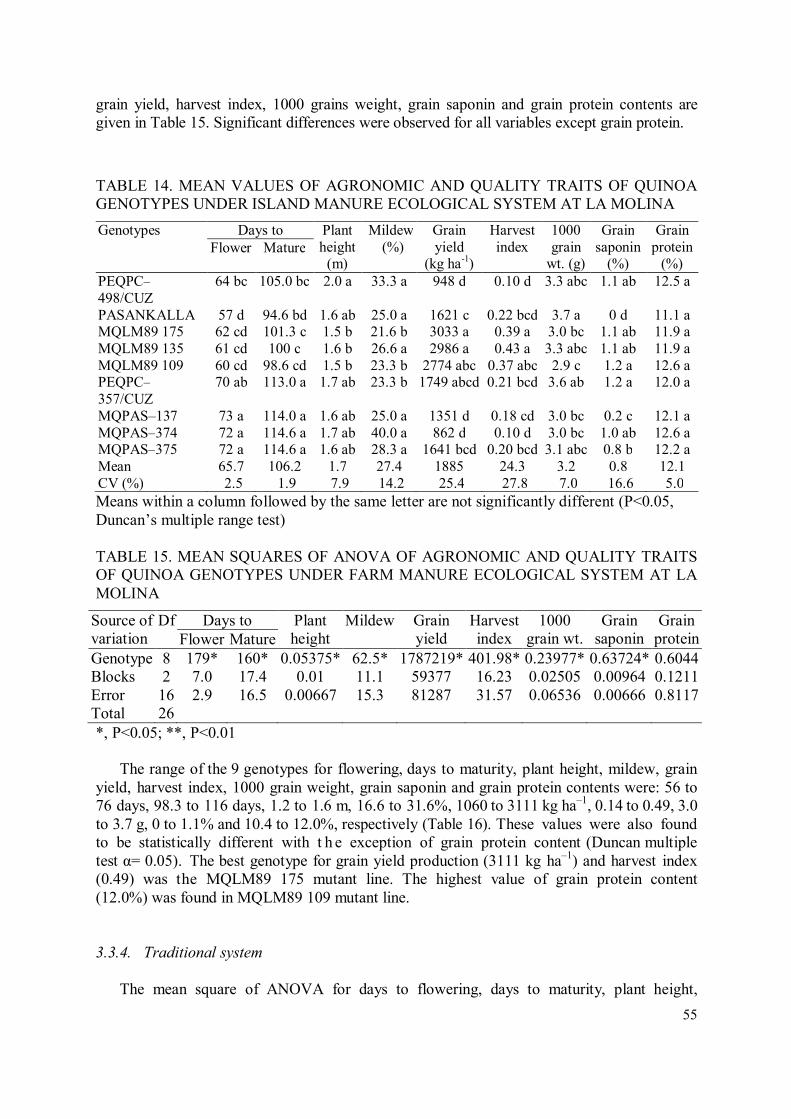
55
grain yield, harvest index, 1000 grains weight, grain saponin and grain protein contents are given in Table 15. Significant differences were observed for all variables except grain protein.
TABLE 14. MEAN VALUES OF AGRONOMIC AND QUALITY TRAITS OF QUINOA GENOTYPES UNDER ISLAND MANURE ECOLOGICAL SYSTEM AT LA MOLINA
Genotypes Days to Plant height
(m)
Mildew (%)
Grain yield
(kg ha-1)
Harvest index
1000 grain
wt. (g)
Grain saponin
(%)
Grain protein
(%) Flower Mature
PEQPC–498/CUZ
64 bc 105.0 bc 2.0 a 33.3 a 948 d 0.10 d 3.3 abc 1.1 ab 12.5 a
PASANKALLA 57 d 94.6 bd 1.6 ab 25.0 a 1621 c 0.22 bcd 3.7 a 0 d 11.1 a MQLM89 175 62 cd 101.3 c 1.5 b 21.6 b 3033 a 0.39 a 3.0 bc 1.1 ab 11.9 a MQLM89 135 61 cd 100 c 1.6 b 26.6 a 2986 a 0.43 a 3.3 abc 1.1 ab 11.9 a MQLM89 109 60 cd 98.6 cd 1.5 b 23.3 b 2774 abc 0.37 abc 2.9 c 1.2 a 12.6 a PEQPC–357/CUZ
70 ab 113.0 a 1.7 ab 23.3 b 1749 abcd 0.21 bcd 3.6 ab 1.2 a 12.0 a
MQPAS–137 73 a 114.0 a 1.6 ab 25.0 a 1351 d 0.18 cd 3.0 bc 0.2 c 12.1 a MQPAS–374 72 a 114.6 a 1.7 ab 40.0 a 862 d 0.10 d 3.0 bc 1.0 ab 12.6 a MQPAS–375 72 a 114.6 a 1.6 ab 28.3 a 1641 bcd 0.20 bcd 3.1 abc 0.8 b 12.2 a Mean 65.7 106.2 1.7 27.4 1885 24.3 3.2 0.8 12.1 CV (%) 2.5 1.9 7.9 14.2 25.4 27.8 7.0 16.6 5.0 Means within a column followed by the same letter are not significantly different (P<0.05, Duncan’s multiple range test) TABLE 15. MEAN SQUARES OF ANOVA OF AGRONOMIC AND QUALITY TRAITS OF QUINOA GENOTYPES UNDER FARM MANURE ECOLOGICAL SYSTEM AT LA MOLINA
Source of variation
Df Days to Plant height
Mildew
Grain yield
Harvest index
1000 grain wt.
Grain saponin
Grain protein Flower Mature
Genotype 8 179* 160* 0.05375* 62.5* 1787219* 401.98* 0.23977* 0.63724* 0.6044 Blocks 2 7.0 17.4 0.01 11.1 59377 16.23 0.02505 0.00964 0.1211 Error 16 2.9 16.5 0.00667 15.3 81287 31.57 0.06536 0.00666 0.8117 Total 26 *, P<0.05; **, P<0.01
The range of the 9 genotypes for flowering, days to maturity, plant height, mildew, grain
yield, harvest index, 1000 grain weight, grain saponin and grain protein contents were: 56 to 76 days, 98.3 to 116 days, 1.2 to 1.6 m, 16.6 to 31.6%, 1060 to 3111 kg ha–1, 0.14 to 0.49, 3.0 to 3.7 g, 0 to 1.1% and 10.4 to 12.0%, respectively (Table 16). These values were also found to be statistically different with t h e exception of grain protein content (Duncan multiple test α= 0.05). The best genotype for grain yield production (3111 kg ha–1) and harvest index (0.49) was the MQLM89 175 mutant line. The highest value of grain protein content (12.0%) was found in MQLM89 109 mutant line.
3.3.4. Traditional system
The mean square of ANOVA for days to flowering, days to maturity, plant height,

56
mildew, grain yield, harvest index, 1000 grains weight, grain saponin and grain protein contents are given in Table 17. Statistically significant differences were observed for genotypes for all traits (not shown).
TABLE 16. MEAN VALUES OF AGRONOMIC AND QUALITY TRAITS OF QUINOA GENOTYPES UNDER FARM MANURE ECOLOGICAL SYSTEM AT LA MOLINA
Genotypes Days to Plant height
(m)
Mildew (%)
Grain yield
(kg ha-1)
Harvest index
1000 grain
wt. (g)
Grain saponin
(%)
Grain protein
(%) Flower Mature
PEQPC–498/CUZ
66 b 109 abc 1.6 a 26.6 ab 1060 e 0.14 c 3.6 a 1.0 a 10.4 a
PASANKALLA 56 d 98.3 c 1.4 ab 16.6 b 1703 cde 0.23 bc 3.7 a 0 c 11.4 a MQLM89 175 60cd 98.6 c 1.3 b 20.0 b 3111 a 0.49 a 3.2 a 1.1 a 11.6 a MQLM89 135 64 bc 104 bc 1.4 ab 18.3 b 2713 ab 0.31 b 3.0 a 1.1 a 11.5 a MQLM89 109 64 bc 104 bc 1.2 b 23.3 ab 2487 abc 0.31 b 3.2 a 1.1 a 12.0 a PEQPC–357/CUZ
73 a 114 ab 1.5 a 25.0 ab 1935 bcd 0.25 bc 3.5 a 0.3 b 11.4 a
MQPAS–137 76 a 116 a 1.4 ab 31.6 a 1221 de 0.18 bc 3.0 a 0.3 b 11.6 a Mean 68 108.3 1.5 22.8 1839 24.3 3.2 0.8 11.4 CV (%) 2.5 3.8 5.5 17.2 15.5 23.1 7.9 10.7 7.9 Means within a column followed by the same letter are not significantly different (P<0.05, Duncan’s multiple range test) TABLE 17. MEAN SQUARES OF ANOVA OF AGRONOMIC AND QUALITY TRAITS OF QUINOA GENOTYPES UNDER THE TRADITIONAL SYSTEM AT LA MOLINA
Source of variation
Df Days to Plant height
Mildew
Grain yield
Harvest index
1000 grain wt.
Grain saponin
Grain protein Flower Mature
Genotype 8 163 96.8 0.065 192.6 1961382 374.3 0.210 1.145 0.905 Blocks 2 1.0 18.5 0.031 17.6 3273 36.6 0.007 0.027 0.069 Error 16 2.9 6.4 0.017 12.4 159523 32.5 0.021 0.008 0.170 Total 26 *, P<0.05; **, P<0.01
The range of means values for flowering, days to maturity, plant height, mildew, grain yield, harvest index, 1000 grains weight, grain saponin and grain protein contents were 65 to 80 days, 102.6 to 118 d, 1.4 to 1.9 m, 20.0 to 43.3%, 463 to 2597 kg ha-1, 0.05 to 0.35, 2.5 to 3.2 g, 0 to 1.3% and 10.2 to 11.7%, respectively (Table 18). The best genotype for grain yield production (2597 kg ha-1) and harvest index (0.35) was MQLM89 175 mutant line. The highest value of grain protein (12.2%) was the MQLM89 137 mutant line. 3.3.5. Combined analysis of variance for agronomic and quality traits
The observed mean square values for the combined analysis for flowering, days to maturity, plant height, mildew, grain yield, harvest index, 1000 grains weight, grain saponin content and grain protein content are presented in Table 19. A highly significant difference for genotype was found for flowering days, maturity days and for mildew severity. Highly significant differences for crop systems were found for the entire traits studied. For genotype x cropping system interactions significant differences were observed for all traits except days to maturity and 1000 grain weight.

57
TABLE 18. MEAN VALUES OF AGRONOMIC AND QUALITY TRAITS OF QUINOA GENOTYPES UNDER THE TRADITIONAL SYSTEM AT LA MOLINA
Genotypes Days to Plant height
(m)
Mildew (%)
Grain yield
(kg ha-1)
Harvest index
1000 grain
wt. (g)
Grain saponin
(%)
Grain protein
(%) Flower Mature
PEQPC–498/CUZ
70 b 111 abc 1.9 a 28.3 bcd 1214 bc 0.21 ab 3.1 ab 0.02 b 11.3 ab
PASANKALLA 63 c 102.6 d 1.8 ab 38.3 ab 689 c 0.09 b 3.2 a 0 b 11.1 abc MQLM89 175 66 bc 109 bcd 1.6 ab 21.6 cd 2597 a 0.35 a 2.6 c 1.3 a 10.2 c MQLM89 135 66 bc 109 bcd 1.4 b 23,3 cd 2027 ab 0.29 a 3.2 ab 1.2 a 11.3 ac MQLM89 109 65 c 106.3 cd 1.4 b 20.0 d 2171 ab 0.26 a 2.6 c 1.2 a 11.5 a PEQPC357 CUZ 78 a 116 ab 1.7 ab 31.6 bc 1410 bc 0.19 ab 2.9 ab 0.1 b 10.9 abc MQPAS–137 80 a 117 a 1.6 ab 36.6 ab 521 c 0.07 b 2.5 c 0.03 b 11.7 a MQPAS–374 80 a 118 a 1.7 ab 43.3 a 463 c 0.05 b 2.5 c 1.0 a 10.3 bc MQPAS–375 80 a 118 a 1.7 ab 28.3 bcd 552 c 0.06 b 2.8 bc 1.2 a 11.7 a CV (%) 2.4 2.3 7.7 11.7 31 33 5.1 13.5 3.7 Means within a column followed by the same letter are not significantly different (P<0.05, Duncan’s multiple range test) TABLE 19. MEAN SQUARES OF THE ANOVA OF AGRONOMIC AND QUALITY TRAITS OF QUINOA FOR DIFFERENT CROPPING SYSTEMS AT LA MOLINA
Source of variation
Df Days to Plant height
Mildew
Grain yield
Harvest index
1000 grain wt.
Grain saponin
Grain protein Flower Mature
Genotype 8 16** 60.7** 0.0229 55.8* 306823 48.7 0.028 0.025 0.046 Blocks 2 632 668 0.1882 168.3 6078597 1139 0.617 2.505 1.421 Crop (C) 3 325** 308** 0.208** 1132** 5588332** 561.9** 1.23** 0.266** 4.63** Gen. × C 24 5.2* 12.4 0.025* 75.4** 224692* 71.3** 0.069 0.188** 0.798* Error 70 2.5 7.3 0.0128 17.0 130933 33.5 0.065 0.016 0.46 Total 107 *, P<0.05; **, P<0.01
The range of means values for flowering, days to maturity, plant height, mildew, grain
yield, harvest index, 1000 grains weight, grain saponin content and grain protein content for the different four crop systems across nine genotypes were 64 to 72 days, 103.8 to 111.8 days, 1.49 to 1.68 m, 15.3 to 30.1%, 1294 to 2407 kg ha–1, 0.17 to 0.28, 2.8 to 3.3 g, 0.6 to 0.8% and 11.1 to 12.1%; respectively (Table 20). In general the conventional cropping systems had the highest positive influence on yield with the highest value of 2407 kg ha–1, the lowest value of mildew severity equal to 15.3% and the highest value for 1000 grain weight equal to 3.3 g. The ecological system with island manure had a positive effect on 1000 grain weight equal to 3.2 g and the highest grain protein content equal to 12.1%. The ecological– farm manure system had the lowest incidence of lodging (17.5%), but had the highest plant height of 1.68 m, the longest time to flowering (72 d) and maturity (111.8 d) and highest incidence of mildew (30.1%).
The range of mean values for flowering, days to maturity, plant height, mildew, grain yield, harvest index, 1000 grains weight, grain saponin content and grain protein content for the nine genotypes across four cropping systems were 62 to 76 days, 96.9 to 115.6 days, 1.44 to 1.83 m, 18.3 to 29.5%, 1008 to 2969 kg ha–1, 0.11 to 0.40, 2.9 to 3.5 g, 0.08 to 1.1% and 11.3 to 12.2%, respectively (Table 21).

58
TABLE 20. MEANS VALUES OF CROPPING SYSTEMS ACROSS QUINOA GENOTYPES FOR AGRONOMIC AND QUALITY TRAITS AT LA MOLINA
System Days to Plant height
(m)
Mildew
(%)
Grain yield
(kg ha-1)
Harvest index
1000 grain
wt. (g)
Grain saponin
(%)
Grain protein
(%) Flower Mature
Conventional 64 b 103.8b 1.60 ab 15.3 c 2407 a 0.28 a 3.3 a 0.6 a 11.7 ab Island manure 65 b 106.2 b 1.67 a 27.4 ab 1885 ab 0.24 ab 3.2 a 0.8 a 12.1 a Farm manure 68 ab 108.2 ab 1.49 b 22.7 b 1839 bc 0.24 ab 3.2 a 0.8 a 11.4 bc Traditional 72 a 111.8a 1.68 a 30.1 a 1294 c 0.17 b 2.8 b 0.7 a 11.1 c CV (%) 2.4 2.5 7.0 21.6 19.5 24.5 8.1 17.7 5.9 Means within a column followed by the same letter are not significantly different (P<0.05, Duncan’s multiple range test) TABLE 21. MEAN VALUES OF QUINOA GENOTYPES ACROSS CROPPING SYSTEMS FOR AGRONOMIC AND QUALITY TRAITS AT LA MOLINA
Genotypes Days to Plant height
(m)
Mildew (%)
Grain yield
(kg ha-1)
Harvest index
1000 grain
wt. (g)
Grain saponin
(%)
Grain protein
(%) Flower Mature
PEQPC–498/CUZ
65 b 105.8 b 1.83 a 25.8 ab 1241 d 0.17 cd 3.4 ab 0.6 b 11.4 a
PASANKALLA 57 c 96.9 c 1.60 bc 23.7 ab 1522 cd 0.21 cd 3.5 a 0.08 d 11.3 a MQLM89 175 62 b 101.1 bc 1.46 c 18.3 b 2969 a 0.40 a 3.0 bc 1.1 a 11.5 a MQLM89 135 63 b 102.8 b 1.55 bc 21,6 ab 2648 ab 0.34 a 3.2 abc 1.1 a 11.6 a MQLM89 109 62 b 101.2 bc 1.44 c 20.0 ab 2559 ab 0.32 ab 3.0 c 1.1 a 12.2 a PEQPC–357/CUZ
73 a 113.5 a 1.71 ab 24.5 ab 2000 bc 0.24 bc 3.4 ab 0.4 bc 11.2 a
MQPAS–137 76 a 115.2 a 1.56 bc 28.7 ab 1319cd 0.17 cd 3.0 c 0.2 cd 11.6 a MQPAS–374 76 a 115.6 a 1.66 ab 29.5 a 1008 d 0.11 d 2.9 c 1.0 a 11.4 a MQPAS–375 75 a 115.6 a 1.68 ab 22.9 ab 1439 cd 0.16 cd 2.9 c 1.0 a 12.0 a
Means within a column followed by the same letter are not significantly different (P<0.05, Duncan’s multiple range test)
The mutant line MQLM89 175 was overall the best genotype for yield and harvest index in all the cropping systems. The range of yield for this mutant was from 2597 to 3138 kg ha-
1, the harvest index was from 0.35 to 0.49, plant height of 1.3 to 1.6 m, flowering from 58 to 62 days, maturity from 96 to 108.6 days. This mutant had 8.3 to 21.6% lodging, 10 to 22% of mildew severity, 1000 grain weight of 2.6 to 3.3 g, 10.2 to 12.1% grain protein content and 0.95 to 1.29% of saponin content. 3.4. Evaluation of plant density 3.4.1. La Molina – Coast
The response of four Quinoa genotypes to two population densities was evaluated. The genotypes were two commercial cultivars Salcedo INIA and Negra Collana and two selected mutant MQLM89–77 and MQPAS–50. The management practices were similar to the common cultural practices for Quinoa commercial production. Prior to planting 60 kg ha-1 of nitrogen, 90 kg ha-1 of phosphorus and 100 kg ha-1 of potassium and 35 kg ha-1 of sulphur were applied. Subsequently 40 kg ha-1 of N was broadcast during the process of

59
hilling, earthing up or ridging after weed elimination. Water was provided with a drip irrigation fertilizer system (fertigation system). The sources of fertilizer were ammonium nitrate, phosphoric acid and potassium sulphate. Six row plots were 10 m long with 0.8 m between rows. One experiment had a density one or one line of plants (450 000 to 500 000 plants) and the other a density 2 or two lines of plants (900,000 to 1 000 000 plants) around the inline drip tube. A randomized complete block design was used with three replications.
Highly significant differences for genotype and the interaction of density x genotype were found (Table 22). The mean values for grain yield for density 2 and density one were 3348 and 3000 kg ha-1, respectively (Table 23). The range of grain yield across two plant densities was 1844 to 4699 kg ha-1 (Table 24). The highest yield was found for MQLM89–7 and the lowest for the commercial cultivar Negra Collana.
TABLE 22. MEAN SQUARES OF ANOVA OF GRAIN YIELD OF QUINOA GENOTYPES CULTIVATED AT TWO PLANT DENSITIES UNDER FERTIGATION AT LA MOLINA
Source of
variation
Df Sum of
squares
Mean
square
F test P > F Significance
Blocks 3 709533 236511 2.4 0.0908 ns Density (D) 1 966919 966919 9.9 0.0044 ns Genotype (G) 3 33300479 11100160 113.6 < 0.0001 ** D × G 3 34976931 4996704 51.2 < 0.0001 ** Error 24 2344703 97696 Total 31 37321634
TABLE 23. MEAN VALUES OF GRAIN YIELD AT TWO PLANT DENSITIES ACROSS OF FOUR QUINOA GENOTYPES UNDER FERTIGATION AT LA MOLINA
Seed density Yield (kg ha-1) Duncan test
× 2 3348 a 1 3000 b
TABLE 24. MEAN VALUES OF GRAIN YIELD OF FOUR QUINOA GENOTYPES ACROSS TWO PLANT DENSITIES UNDER FERTIGATION AT LA MOLINA
Genotype Yield (kg ha-1) Duncan test Plot No. MQLM89–77 4699 a 1 MQPas–50 3231 b 3 Salcedo Inia 2922 b 2 Negra Collana 1844 c 4
3.4.2. San Lorenzo – Highland
The objectives were to determine the effect of two cropping systems (organic vs. inorganic) and two crop densities (1 line of plants row-1 vs. 2 lines of plants row-1) on the yield and quality of four ecotypes of the Quinoa variety Pasankalla in the Mantaro Valley. A field of the Regional Development Institute Sierra of UNALM, at an altitude of 3200 m, in the province of Jauja was used for the experiment. Eight treatments with three replicates for each

60
farming system (organic and inorganic) were evaluated. Each treatment was placed in an experimental plot of 6.4 m2, 4 rows spaced 0.8 m with a length of 2 m. The experimental field area was 307.2 m2, consisting of 42 plots. The design was a randomized complete block (RCBD). The results of the combined statistical analysis are presented in Table 25. TABLE 25. MEAN SQUARES FOR ANOVA OF AGRONOMIC AND QUALITY TRAITS OF QUINOA GENOTYPES UNDER TWO CROPPING SYSTEMS AND TWO CROP DENSITIES AT SAN LORENZO
Source of variation
Df Days to Plant height
Mildew
Yield (kg ha-1) Harvest index
1000 grain wt.
Grain protein Flower Mature Grain Biomas
System (S)
1 161 **
10.1 884004**
1633 **
4072548 **
20773982 **
947851 **
0.54 * *
1.8 **
Blocks 4 6.2 10.8 955 83 2154 3269 15 0.01 0.07 Genotype (G)
3 0.7 8.5 0.4 72 51532 **
70675 796341 0.002 0.02
Row (R) 1 5.3 0.1 0.9 133 7016 8654 153 0.15 **
0.03
G × R 3 5.6 8.5 221 72 95925 **
1320849 **
245259 0.007 0.09
S × G 3 6.0 8.3 323803**
517 130205 **
1453412 **
636535 **
0.013 0.04
S × R 1 0 4.1 317 133 **
31044 **
864812 **
355352 0.032 0.02
S × G × R
3 6.9 12.5 857 150 4604 602343 **
140101 0.011 0.17
Error 28 3.1 4.7 403 71 3479 36879 **
71473 0.015 0.05
Total 47 **, P<0.01
Mean values for all agronomic and quality traits were higher in the inorganic than the organic system (Table 26). The average grain yield in the organic system was 282 kg ha-1, while in the inorganic system the yield was 865 kg ha-1, three times more than the organic system. The average production of biomass in the organic a nd ino r ga n ic systems was 1091 and 2407 kg ha-1, respectively. The average harvest index in the organic system was 0.27 while in the inorganic system it was 0.36. The average plant height was 41.1 cm in the organic system, while in the inorganic system it was 68.2 cm. The thousand kernel weight had an average of 3.54 g in the organic system, but in the inorganic system the average was 3.75 g. In the organic and inorganic systems, flowering occurred on average at 58 and 62 days after sowing, respectively. Grain physiological maturity was reached at 137 days after planting in both systems. The average degree of mildew infection was 65.8% in the organic system, while it was 77.5% in the inorganic system. The average protein recorded was 14.2% in the organic system, with 14.6% on average in the inorganic system.
Mean values for all agronomic and quality traits were not significantly different between
one and two line systems (Table 27). The average production of biomass in one line row–1 was 970 kg ha-1, while for two lines row it was 1212 kg ha-1. The harvest index was 0.29 in the one line row-1 and 0.26 in the two lines row-1. The average score for 1000 grain
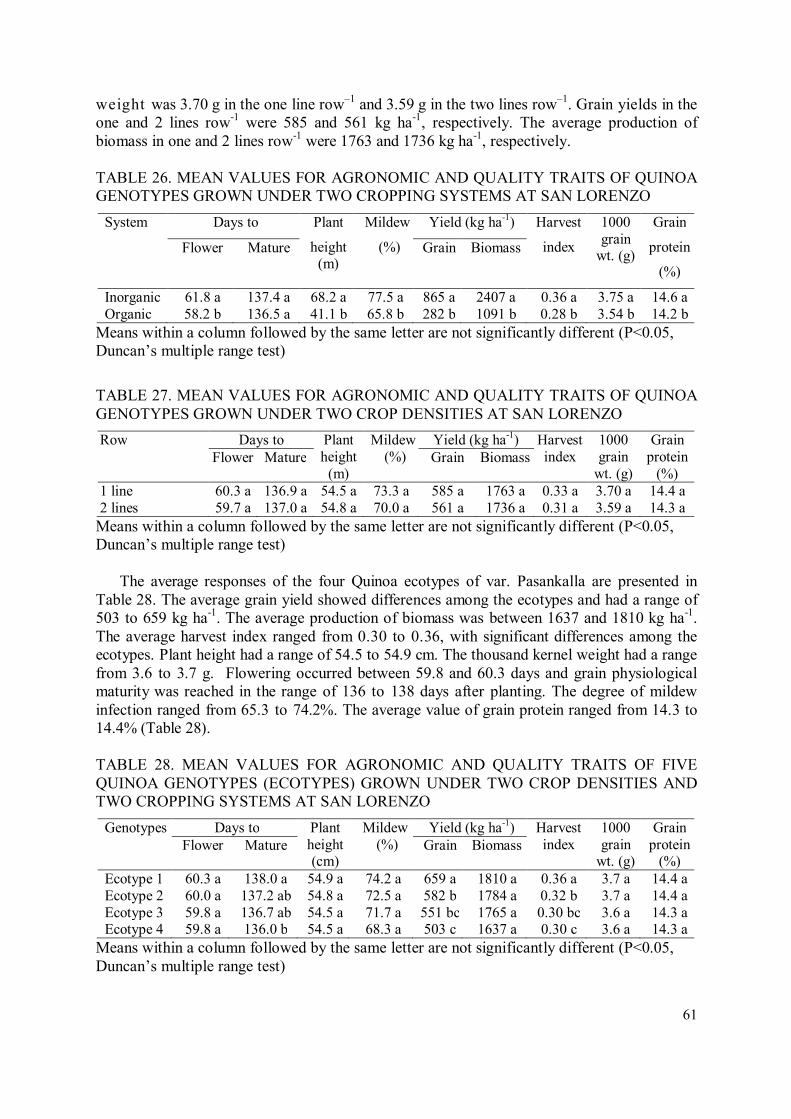
61
weight was 3.70 g in the one line row–1 and 3.59 g in the two lines row–1. Grain yields in the one and 2 lines row-1 were 585 and 561 kg ha-1, respectively. The average production of biomass in one and 2 lines row-1 were 1763 and 1736 kg ha-1, respectively.
TABLE 26. MEAN VALUES FOR AGRONOMIC AND QUALITY TRAITS OF QUINOA GENOTYPES GROWN UNDER TWO CROPPING SYSTEMS AT SAN LORENZO
System Days to Plant
height (m)
Mildew
(%)
Yield (kg ha-1) Harvest
index
1000 grain
wt. (g)
Grain
protein
(%)
Flower Mature Grain Biomass
Inorganic 61.8 a 137.4 a 68.2 a 77.5 a 865 a 2407 a 0.36 a 3.75 a 14.6 a Organic 58.2 b 136.5 a 41.1 b 65.8 b 282 b 1091 b 0.28 b 3.54 b 14.2 b
Means within a column followed by the same letter are not significantly different (P<0.05, Duncan’s multiple range test)
TABLE 27. MEAN VALUES FOR AGRONOMIC AND QUALITY TRAITS OF QUINOA GENOTYPES GROWN UNDER TWO CROP DENSITIES AT SAN LORENZO
Row Days to Plant height
(m)
Mildew (%)
Yield (kg ha-1) Harvest index
1000 grain
wt. (g)
Grain protein
(%) Flower Mature Grain Biomass
1 line 60.3 a 136.9 a 54.5 a 73.3 a 585 a 1763 a 0.33 a 3.70 a 14.4 a 2 lines 59.7 a 137.0 a 54.8 a 70.0 a 561 a 1736 a 0.31 a 3.59 a 14.3 a
Means within a column followed by the same letter are not significantly different (P<0.05, Duncan’s multiple range test)
The average responses of the four Quinoa ecotypes of var. Pasankalla are presented in Table 28. The average grain yield showed differences among the ecotypes and had a range of 503 to 659 kg ha-1. The average production of biomass was between 1637 and 1810 kg ha-1. The average harvest index ranged from 0.30 to 0.36, with significant differences among the ecotypes. Plant height had a range of 54.5 to 54.9 cm. The thousand kernel weight had a range from 3.6 to 3.7 g. Flowering occurred between 59.8 and 60.3 days and grain physiological maturity was reached in the range of 136 to 138 days after planting. The degree of mildew infection ranged from 65.3 to 74.2%. The average value of grain protein ranged from 14.3 to 14.4% (Table 28). TABLE 28. MEAN VALUES FOR AGRONOMIC AND QUALITY TRAITS OF FIVE QUINOA GENOTYPES (ECOTYPES) GROWN UNDER TWO CROP DENSITIES AND TWO CROPPING SYSTEMS AT SAN LORENZO
Genotypes Days to Plant height (cm)
Mildew (%)
Yield (kg ha-1) Harvest index
1000 grain
wt. (g)
Grain protein
(%) Flower Mature Grain Biomass
Ecotype 1 60.3 a 138.0 a 54.9 a 74.2 a 659 a 1810 a 0.36 a 3.7 a 14.4 a Ecotype 2 60.0 a 137.2 ab 54.8 a 72.5 a 582 b 1784 a 0.32 b 3.7 a 14.4 a Ecotype 3 59.8 a 136.7 ab 54.5 a 71.7 a 551 bc 1765 a 0.30 bc 3.6 a 14.3 a Ecotype 4 59.8 a 136.0 b 54.5 a 68.3 a 503 c 1637 a 0.30 c 3.6 a 14.3 a
Means within a column followed by the same letter are not significantly different (P<0.05, Duncan’s multiple range test)

62
4. DISCUSSION
Quinoa mutant lines had a range o f values of nitrogen use efficiency (NUE) from 18.6 to 53.1% with a mean of 37.7%. In the case of cereals, NUE has been estimated in the order of 33% worldwide, taking into account world cereal production, N concentration in grains, fertilizer consumption and assuming that soil and atmosphere contribute 50% of total N removed [3]. In a winter wheat study, NUE varied with the N dose and the year of cultivation, with an average of 86, 69, 56, and 46% for 28, 56, 84 and 112 kg N ha–1, respectively [4]. For quinoa varieties UDC19 and Faro, the NUE mean was 47.6% [5].
In quinoa mutant lines agronomic efficiency (AE) varied from 0 to 35.6 kg grain kg-1 N applied with a mean of 20.3 kg grain kg-1 N applied. For dryland wheat, a mean values of AE of 28.8 kg grain kg-1 N (with a range of 18.2 to 38.1 kg grain kg-1 N) was obtained at a low N dose, and for a higher N dose a mean value of 67.0 kg of grain kg–1 N (with a range 40.7 to 100.7 kg grain kg-1 N) was observed [6]. In another experiment with wheat, a AE mean value of 6.2 kg grain kg–1 N applied was found, the highest value being 7.2 kg grain kg-
1 N applied at 50 kg N ha-1, with the lowest value of 4.9 kg grain kg-1 N applied at 150 kg N ha-1 [7]. In maize, a value of 7.2 kg grain kg-1 N applied at 100 kg N ha-1 was reported while a similar value of 6.3 kg grain kg-1 N applied at 100 kg N ha-1 was reported for barley [8]. AE in wheat was reported as 11 kg grain kg-1 N applied at 128 kg ha-1 and 3 kg grain k-11 N applied at 325 kg N ha-1 [9]. In maize, AE values of 39.8 kg grain kg-1 N applied at 129 kg N ha-1 and 18.3 kg grain kg-1 N applied at 300 kg N ha-1 were reported [10]. In rice, values of AE ranged from 4.9 to 6 kg grain kg-1 N applied at 291 kg N ha–1, 11.3 to 14.3 kg of grain kg–1 of N applied at 180 kg N ha–1, 9.1 to 10.6 kg grain kg-1 N applied at 240 kg N ha-1 and 7.7 to 10.1 kg grain kg-1 N applied at 300 kg N ha-1 in the years 2009 and 2010 [11]. For quinoa AE values ranged from 1.3 to 5.2 kg grain k-1 N applied, indicating a poor overall response to N fertilization [12]. In studies with the UDEC–10 and FARO Quinoa genotypes at different doses of N fertilizer, AE was 13.9 and 7.7 kg grain kg-1 N applied, respectively [6]. In a study with amaranth, by increasing the density of plants the value of AE increased, so that for a dose of 100 kg N ha-1 and a density of 33.3 plants m-2 the highest value was 9.2 kg grain kg-1 N applied [13].
In the present study, physiological efficiency (PE) values of Quinoa mutant lines varied from 42.6 to 59.0 kg grain kg-1 N absorbed. The check had a value of 50.8 kg grain kg-1 N absorbed. The mean PE was 48.2 kg of grain kg-1 N absorbed. In an experiment with maize and barley with different sources and fertilization doses evaluated, the mean values of PE were 34.6 and 25.7 kg grain kg-1 N absorbed, respectively. The PE was significantly different only in maize; between the control treatment and the N fertilization treatments the values of which were 32.9, 32.6, 33.6, 34.7 and 39.4 kg grain kg-1 N absorbed for 200 kg mineral N ha-1, 200 kg organic-mineral N ha-1, 100 kg mineral N ha-1, 100 kg organic-mineral N ha-1 and the control, respectively [8].
PE average values of 34.0 and 52.1 kg grain kg-1 N absorbed were obtained for wheat at high and low nitrogen fertilization, respectively [5]. In maize in northern China, the highest value of PE was 49.5 kg grain kg-1 N absorbed at 184 kg N ha-1, and the lowest was 39.0 kg grain kg-1 N absorbed without fertilizer [10].
In amaranth, PE varied from 13.9 to 15.4 kg grain kg-1 N absorbed and decreased with increasing N dose. A mean value of 22.2 kg grain kg-1 N absorbed (values ranged from 21.7 to 23.0 kg grain kg-1 N absorbed) was obtained for Quinoa, and did not decrease with increasing doses of N (0, 80 and 120 kg N ha-1). In buckwheat the values showed a PE range

63
from 16.1 to 20.0 kg grain kg-1 N absorbed [14].
PE values of 45, 42 and 41 kg grain kg-1 N absorbed were obtained for Quinoa grown in sandy, sandy loam and sandy clay loam soils, respectively, suggesting that N absorption is influenced by the textural properties of the soils through N mineralization and root growth. It was also mentioned that root depth is important, since in deep soil the N may be absorbed by diffusion, which may constitute part of the total absorption [15].
Peru has been named as the third most vulnerable country to the effects of climate change. It is predicted that in the next 40 years, the country will lose 22% of its glaciers, available fresh water will be reduced by 40% and adverse climatic factors will increase, mainly drought (Tyndall Center for Climate Change ' Http://www.tyndall.ac.uk). The largest areas of potent ial agricultural expansion are located on the Peruvian coast, in arid and semi–arid conditions, with a reduced water supply. There is a need to develop or adapt technologies to make irrigation water more efficient, accompanied by an adequate selection of crops whose water requirements are minimal and adequate for the region. Quinoa is an important alternative crop in this context, considering that its consumptive use of water is lower than other traditional coastal crops such as rice and vegetables. In recent experiments with Quinoa with drip irrigation and La Molina, central coast, the volumes of water used were 2924, 3540 and 5321 m³ ha–1 [16, 17, 18].
Another technique for areas of low water supply is the use of under–floor plastics that function as water retention membranes, with the aim of modifying the hydraulic conductivity in the root zone and preventing water and fertilizers loss through percolation. This technology has been developed by the University of Michigan as a "subsoil water retention technology" [19].
The efficiency of water use under stress conditions at La Molina showed yields within the range reported by other researchers [20, 21, 22, 23, and 24]. The stages most sensitive to water stress that have a marked negative effect on grain yield are the phenological stages of flowering and milk. The overall average Quinoa yield was almost 3 t ha-1 (2965 kg ha-1).
For the variable response of water use efficiency (WUE) the overall mean was 1.4 kg m-
3). The best treatment for WUE was T3 (50% net volume, with plastic) with 1.68 kg m-3, followed by T2 (75% net volume, with plastic) with 1.43 kg m-3. The treatments T1 (100% net volume with plastic) and T0 (100% net volume without plastic) showed the lowest values with 1.21 and 1.15 kg m-3, respectively, that were similar to values reported in other work [17, 18].
5. CONCLUSION
The improvement of quinoa using γ−irradiation was successful because a group of advanced lines showed high efficiency in the use of N applied and water use efficiency. The sources and doses of fertilizers that were evaluated in the coastal area and highlands will be transferred to the farmers.
ACKNOWLEDGEMENTS
We wish to thank the International Atomic Energy Agency for a Research Contract under the CRP D1.50.13: Approaches to Improvement of Crop Genotypes with high Water and

64
Nutrient Use Efficiency for Water Scarce Environments. Funding was also provided under a IUC–VLIR–UNALM Partner Programme for the Development of Value Chains for Biodiversity Conservation and Improvement of Rural Livelihoods. We acknowledge the cooperation of IPEN, the National Peruvian Nuclear Institute.
REFERENCES
[1] GEBREMARIAM, G., ASSEFA, D., Nitrogen fertilization effect on grain sorghum (Sorghum
bicolor L. Moench): Yield, yield components and Witchweed (Striga hermonthica Del. Benth) infestation in Northern Ethiopia. Int. J. Agric. Res. 10 (2015) 14–23.
[2] CRASWELL, E.T., GODWIN, D.C. The efficiency of nitrogen fertilizers applied to cereals in different climates. In: Advances in Plant Nutrition, Tinker, P.B., Lauchli A., (Eds). (1984) Prager Scientific, New York, pp. 1–55.
[3] KAMISATO, J., Evaluación del Efecto de Tres Niveles de Fertilización y Dos Niveles de Riego en el Comportamiento de Dos Variedades de Kiwicha (Amaranthus caudautus L.) en la Costa Central. Tesis para optar el grado de Magister Scientiae, Universidad Nacional Agraria La Molina, Lima, Peru. (2004) 87 pp.
[4] RAUN, W.R., JOHNSON, G.V., Improving nitrogen use efficiency for cereal production. Agron. J. 91 (1999) 357–362.
[5] GAJU, O., ALLARD, V., MARTRE, P., SNAPE, J.W., HEUMEZ, E., LEGOUIS, J., MOREAU, D., BOGARD, M., GRIFFITHS, S., ORFORD, S., HUBBART, S., FOULKES, M.J., Identification of traits to improve the nitrogen–use efficiency of wheat genotypes. Field Crops Res. 123 (2011) 139–152.
[6] HALVORSON, A.D., NIELSEN, D.C., REULE, C.A., Nitrogen fertilization and rotation effects on no–till dryland wheat production. Agron. J. 96 (2004) 1196–1201.
[7] BERTI, M., WILCKENS, R., HEVIA, F., SERRI, H., VIDAL, I., MENDEZ, C., Fertilización nitrogenada en quinoa (Chenopodium quinoa Willd.). Rev. Cienc. Investig. Agraria 27 (2000) 81–90.
[8] LÓPEZ–BELLIDO, R.J., LÓPEZ–BELLIDO, L., Efficiency of nitrogen in wheat under Mediterranean conditions: effect of tillage, crop rotation and N fertilization. Field Crops Res. 71 (2001) 31–46.
[9] MONTEMURRO, F., MAIORANA, M., FERRI, D., CONVERTINI, G., Nitrogen indicators, uptake and utilization efficiency in a maize and barley rotation cropped at different levels and sources of N fertilization. Field Crops Res. 99 (2006) 114–124.
[10] CUI, Z.L., CHEN, X.P., ZHANG, F.S., MIAO, Y.X., LI, J.L., On–farm evaluation
of the improved soil N min–based nitrogen management for summer wheat in North China Plain. Agron. J. 100 (2008) 517–525.
[11] JIN, L., CUI, H., LI, B., ZHANG, J., DONG, S., LIU, P., Effects of integrated agronomic management practices on yield and nitrogen efficiency of summer maize in North China. Field Crops Res. 134 (2012) 30–35.
[12] SUI, B., FENG, X., TIAN, G., HU, X., SHEN, Q., GUO, S., Optimizing nitrogen supply increases rice yield and nitrogen use efficiency by regulating yield formation factors. Field Crops Res. 150 (2013) 99–107.
[13] ALVAREZ, M., VON RÜTTE, S., Fertilización. In: Quinoa: Hacia su cultivo comercial. LATIRENCO, S.A. (Ed.), Quito, Ecuador (1990). pp. 107–114.
[14] DÍAZ–ORTEGA, A., ESCALANTE–ESTRADA, J.A., TRINIDAD–SANTOS, A., SÁNCHEZ–GARCIÁ, P., MAPES–SÁNCHEZ, C., MARTINEZ–MORENO, D., Rendimiento, eficiencia agronómica del nitrógeno y eficiencia en el uso del agua en amaranto en función del manejo del cultivo. TERRA Latinoamericana 22 (2004) 109–116.
65
http://www.redalyc.org/pdf/573/57311208012.pdf [15] SCHULTE–AUF’M–ERLEY, G., KAUL, H.P., KRUSE, M., AUFHAMMER, W., Yield
and nitrogen utilization efficiency of the pseudocereals amaranth, quinoa and buckwheat under differing nitrogen fertilization. Eur. J. Agron. 22 (2005) 95–100.
[16] RAZZAGHI, F., Effect of nitrogen and water availability of three soil types on yield, radiation use efficiency and evapotranspiration in field–grown quinoa. Agric. Water Manage. 109 (2012) 20–29.
[17] MERCEDES, W.H., Efecto del Estrés Hídrico en la Fisiología y Rendimiento de Cuatro Variedades del Cultivo de Quinoa (Chenopodium quinoa Willd.). Mg. Sc. T h e s i s , UNALM, Lima. (2005). 72 pp.
[18] HUAMANCUSI,J.L., Efecto de la Fertilización Nitrogenada y de la Modalidad de Aplicación de Micronutrientes en el Rendimiento del Cultivo de Quinoa (Chenopodium quinoa Willd.). Ing. Agr. Thesis, UNALM, Lima. (2012). 104 pp.
[19] BARNETT, M.A.M., Efectos de la Fertilización Nitrogenada en el Rendimiento de Tres Variedades de Quinoa (Chenopodium quinoa Willd.) Bajo Riego por Goteo. Ing. Agrón. Thesis, UNALM. Lima (2005). 138 pp.
[20] HIRICH, A., CHOUKRALLAH, R., JACOBSEN, S.E., EL YOUSSFI, L., EL HOMARI, H., Using deficit irrigation with wastewater in the production of quinoa (Chenopodium quinoa Willd.) in Morocco. Rev. Científ. UDO Agríc. 12 (2012) 570–583.
[21] http://msutoday.msu.edu/news/2013/revolutionary–technology–aids–thirsty–crops during–Drought
[22] APAZA, W.A., Efectos de Densidad y Niveles de Fertilidad en el Rendimiento de Quinoa (Chenopodium quinoa Willd.) en Costa Central. Lic. Ing. Agr. Thesis, UNALM. Lima (1995). 112 pp.
[23] GEERTS, S., Deficit Irrigation Strategies via Crop Water Productivity Modeling: Field Research of Quinoa in the Bolivian Altiplano. Doctoral Thesis, K.U. Leuven, Belgium (2008). 211 pp.
[24] AGUILAR, P., JACOBSEN S.E. Cultivation of quinoa on the peruvian altiplano. Food Rev. Int. 19 (2003) 31–41.
[25] LOPEZ, M., Producción de quinua orgánica (Chenopodium quinoa) en Huari Bolivia. Universidad Tecnica de Oruro – Universidad Nacional del altiplano. (2010).
[26] RISCO MENDOZA, A., Efecto de 5 Propuestas de Abonamiento y Dos Distanciamientos entre Surcos en el Rendimiento y Calidad de Quinoa (Chenopodium quinoa Willd.) en Vilcashuamán, Ayacucho. Tesis Universidad Nacional Agraria La Molina, Lima, Peru. (2011) 93 pp.

66
DEVELOPMENT OF WHEAT MUTANTS FOR HIGHER YIELD AND
IMPROVED EFFICIENCY OF WATER AND NITROGEN USE
A.J. KHAN, F.AZAM, A. ALI, M. TARIQ, S. AHMAD, W. MUHAMMAD Nuclear Institute for Food and Agriculture (NIFA) Tarnab, Pakistan
Abstract
Despite the high yield potential of wheat varieties grown in Pakistan the national average yield ha–1 is still low. One of the limiting factors is the inefficient use of fertilizers. With the increasing costs of nitrogen fertilizers, producers would benefit economically from more efficient varieties with improved response to N fertilizer. Such varieties would also help protect the environment by reducing N applications, leaching and greenhouse gas emissions. For this purpose, a study was conducted at two experimental sites (NIFA Peshawar and CCRI Pirsabak) during 2011–14 to assess wheat genotypes (Barsat, NRL 0707 and PM–376–HY) for nitrogen and water use efficiency. N fertilizer was applied as urea at 0, 25, 45 and 90 kg N ha-1. Half of the N was applied at sowing while the remaining half during the tillering stage. Grain yield was influenced by soil and N fertilizer management. Maximum grain yield was obtained at 45 kg N ha-1 for two years, but during 2013–14 grain yields at 45 and 90 kg N ha-1 were not significantly different. 13C isotope discrimination (∆ values) in wheat straw ranged from 19.4 to 23.2 and in grain ranged from 19.4 to 21.8 across all three genotypes at both sites. Higher 13C (∆) values in grain were found for NRL 0707 suggesting that it has comparatively higher water use efficiency potential under drought conditions. During the last two project years (2014–16) the response of a newly released wheat variety Insaf 2015 (NRL 0707) to different levels of nitrogen was studied on progressive farmers’ fields in low, medium and high rainfed areas of Khyber Pakhtunkhwa. The economic analysis across all the three regions showed that maximum net income per hectare coupled with higher value cost ratio (VCR) values were obtained when nitrogen was applied at the rate of 45 kg ha-1 followed by 90 kg ha-1.
1. INTRODUCTION
Wheat breeding programs have been struggling to improve the drought resistance and nitrogen use efficiency using conventional procedures of testing breeding lines. Efforts have been made to develop water and nitrogen use efficient wheat varieties using nuclear techniques. However, variants are often unstable as the trait of drought tolerance is epigenetic. Water–use efficiency (WUE) and nitrogen–use efficiency (NUE) are important measures that can affect the productivity of crops in different environments [1].
Moisture stress at seedling and grain filling stages drastically reduces grain yield in wheat. Grain yield decreased to a greater extent when water stress occurred at the anthesis stage [2]. Drought stress during maturity resulted in about a 10% decrease in yield, while moderate stress during the early vegetative period had essentially no effect on yield [3]. Carbon Isotope Discrimination (δ13C) has been proposed as a possible screening tool and an efficient indirect selection criterion in breeding programs for traits like higher grain yield [4, 5, 6] and water use efficiency [7, 8, 9]. The available wheat cultivars endowed with low nutrients requirements are insufficient for wider adaptability under moisture stress environments. There is a need therefore to exploit all genetic variability that can be used in

67
breeding for drought tolerance and high yield potential. However, WUE is not the stand–alone factor that determines crop productivity under water–limited environments.
Nitrogen availability is a key factor affecting plant growth and ultimate yields and is a major nutrient required in greater concentrations [10, 11]. Nitrogen plays a central role in plant distribution, physiology, growth, reproduction and is the main component of agricultural fertilizer [12, 13, 14, 15]. The amount of N available to the plant is generally limited [16] and the use of N fertilizers in cereals is poor, where only 30 to 40% is actually used and the remainder is lost to the environment via denitrification, volatilization and leaching [17, 18], the latter causing groundwater contamination [19]. Improving NUE of wheat is central to achieving higher yields and quality with less direct N inputs. There is an increasing emphasis to breed wheat cultivars and design wheat N management strategies for higher NUE [20, 21, 22, 23, 24, 25, 26]. NUE may be affected by crop species, soil type, temperature, N application rate, soil moisture status and crop rotation [27]. It is imperative therefore to look for plant types that are more efficient in i) mobilizing soil N resources and ii) making use of the applied fertilizer N. Nitrogen–15 isotope dilution techniques can conveniently be used to identify such plant types.
The overall objective of the present research work conducted at NIFA, Peshawar is to increase crop productivity and food security by developing and extending rapidly to farmers the improved crop varieties and soil, water, nutrient and crop management technologies that make cropping systems resilient to environmental stresses. The project is specifically aimed to i) increase the productivity of improved mutant varieties of crops tolerant to environmental stresses under existing soil and climatic conditions and ii) enhance nitrogen and water use efficiencies of crops tolerant to environmental stresses through best management skills of soil, water, crop and fertilizer.
2. MATERIALS AND METHODS 2.1. Soil characterization of the experimental sites
The experiments were conducted at two experimental sites i.e. Cereal Crop Research Institute (CCRI) Pirsabak and Nuclear Institute for Food and Agriculture (NIFA) Tarnab, Peshawar for three consecutive years (2011–14). Composite soil samples from three depths (0–15, 15–30, 30–60 cm) were collected from both experimental sites before sowing of the wheat crop. These soil samples were air–dried in the laboratory and then ground and pass through a 2 mm sieve. Total organic carbon in the soil samples was determined by the Walkley and Black method [28]. Total nitrogen in the soil samples was determined by the Kjeldahl method [29]. A Neutron moisture probe was used to measure the changes in soil water storage. Before the start of the experiments, the Neutron probe was calibrated with gravimetric moisture contents in the soil profile with 30 cm increments. The measurements of Neutron probe readings were then converted into volumetric moisture by using the bulk density of soil cores taken from each depth.
The physico–chemical properties of the soils are given in Table 1. Soil texture at Pirsabak was loamy sand, moderately alkaline in reaction (pH 7.2–7.6), non–saline (EC 0.20–0.25 dSm-1), moderately calcareous, and was low in organic matter (4.0–8.7 mg kg-1 soil), total N (0.28–0.5 mg kg-1 soil) and AB–DTPA extractable P (4.49–7.86 mg kg-1soil) and K (40.0 mg kg-1soil). Likewise, soil texture at NIFA was silt loam, alkaline in reaction (pH 7.9–8.0), non–saline (EC 0.25–0.24 dSm–1), calcareous, and was also low in organic matter (6.7–10.7 mg

68
kg-1 soil), total N (0.4–0.6 mg kg-1 soil), AB–DTPA extractable P (8.98–11.24 mg kg-1soil) and K (50.0–80.0 mg kg-1soil).
TABLE 1. PHYSICO–CHEMICAL PROPERTIES OF THE EXPERIMENTAL SITES
Depth (cm)
Sand Silt Clay AB–DTPA (mg kg-1) OM N pH 1:2.5
EC (dS m-1
) (g kg-1 soil) P K (mg kg-1) CCRI, Pirsabak 0–15 760 200 40 7.86 40.0 8.7 0.5 7.2 0.25 15–30 760 200 40 5.61 40.0 6.7 0.4 7.6 0.24 30–60 760 200 40 4.49 40.0 4.0 0.28 7.6 0.20 IFA, Peshawar 0–15 400 520 80 11.24 80.0 10.7 0.6 7.9 0.24 15–30 400 520 80 10.11 60.0 9.4 0.5 8.0 0.25 30–60 400 520 80 8.98 50.0 6.7 0.4 8.0 0.25
2.2. Meteorological parameters of the experimental sites
The growing season rainfall data were obtained from meteorological observation stations situated at the respective research stations. The crop water use (evapo-transpiration, ET) was calculated from the amount of rainfall received during the growing season and changes in soil water storage up to 90 cm depth, assuming that none or negligible losses occurred below the root zone as runoff and drainage [30]. Both sites have cool winters followed by warm to hot summers. The precipitation received during the growing seasons at both experimental sites is given in Table 2.
TABLE 2. METROLOGICAL DATA [PRECIPITATION (MM)] OF THE TWO SITES
CCRI Pirsabak NIFA Peshawar 2011–12 2012–13 2013–14 2011–12 2012–13 2013–14
148 235 236 184 383 418 2.3. Plant material and experimental details
Wheat is normally planted in the month of November at both the experimental sites. Three wheat genotypes i.e., Barsat (commercial cultivar), NRL0707 (recombinant line) and PM–376–HY (mutant) were selected on the basis of better agronomic performance under rainfed conditions. At both sites, N was applied pre–plant and incorporated by conventional tillage. The field experimental design included the following treatments:
Wheat genotypes: One commercial variety (NIFA Barsat–10) and two candidate varieties (Mutant: PM–376–HY & Recombinant: NRL 0707). Fertilizer application levels were 0 (control), 25, 45, 90 kg N ha-1 including the use of N-15 labelled fertilizer. Half of the nitrogen was applied at the time of sowing (seed bed preparation) while the remaining half during the tillering stage. No irrigation was applied during the entire growing period at any site. Experiments at both sites were carried out in split plot designs with three replications. Plot size of each treatment was 3 m × 3 m.
Wheat was planted manually with 30 cm row spacing. Normal cultural practices were carried out in both experiments. One isotope micro plot (size 1 m2) receiving 15N labelled

69
urea was established in each 25, 45 and 90 kg N ha-1 treatment. Labelled urea having 1 atom % 15N excess at 25, 45, 90 kg N ha-1 was applied as an aqueous solution in micro plots to estimate nitrogen use efficiency directly. Micro plot rows within each treatment were harvested for total N and 15N determination.
2.4. Collection of grain and straw samples for 15
N and 13
C analysis
The grain and straw samples collected from micro-plots were oven dried at 70 oC, weighed and then finely ground (<0.1 mm) in a Wiley mill. These samples were analyzed for total N in our lab and 15N and 13C were analyzed by using the mass spectrometer at PINESTECH, Islamabad. Nitrogen utilization by wheat from fertilizer was determined as described in [31] after completion of 15N analysis. The following measurements were included in the studies:
• Physical and chemical soil characterisation of both the experimental sites • Grain yield to assess the effect of soil, water and fertilizer management • Crop N uptake • Estimation of the crop water use efficiency •
15N and 13C for assessing fertilizer use efficiency and crop tolerance to water stress • Meteorological data 2.5. Demonstration and performance on farmers’ fields
The response of a newly released rainfed wheat variety Insaf 2015 (NRL 0707) to different levels of nitrogen was studied during the growing season 2014–15 on progressive farmers’ fields in low (DI Khan, Kohat), medium (Peshawar, Charsadda) and high rainfed (Mansehra, Swat) areas of Khyber Pakhtunkhwa Province (Table 3).
TABLE 3. TRIAL LOCATIONS AND ELEVATIONS
No. Location Latitude (N) Longitude (E) Elevation (m) Low rainfall areas 1 DI Khan 31°49 70°55 165 2 Kohat 33°35 71°26 489 Medium rainfall areas 3 Peshawar 34°01 71°35 359 4 Charsadda 34°09 71°44 276 High rainfall areas 5 Mansehra 34°20 73°12 1088 6 Swat 35°23 72°11 984
At each experimental site three progressive farmers were randomly selected. The trial was planted on an area of 0.5 acre. The recombinant inbred line was selected for the study because it produced higher grain yield during 2013–14 at two experimental sites (NIFA, Peshawar and CCRI, Pirsabak). The demonstration trials were planted during the month of November on well prepared seed beds with a seed rate of 100 kg ha–1. Normal cultural practices were carried out throughout the growing season and were kept constant at all sites. No irrigation was applied to the crop. N fertilizer was applied at 0, 25, 45 and 90 kg N ha-1. Half of the

70
nitrogen was applied at sowing (seed bed preparation) while the remaining half during the tillering stage. During the final year (crop season 2015–16) only two fertilizer levels (0 and 45 kg N ha-1) were applied.
2.6. Economic benefits
For assessing the economic benefit of nitrogen fertilizer on the economic yield of wheat in different environments the following procedures were used:
2.6.1. Net return
Net return was obtained by extracting the cost of fertilizer from the value of the increase in crop produced by using the fertilizer. A positive net return means that fertilizer gives a profit (Fertilizer recommendation in Pakistan, 1997).
2.6.2. VCR
The value / cost ratio or cost benefit ratio was calculated by the cost of the increased
wheat yield by the cost of fertilizer used:
��� =Costofincreaseinwheatyield
Costoffertilizerused
A VCR of more than 1.0 indicates that the fertilizer was profitable; a ratio 2 reflects a profit of 100 % whereas a VCR of 3.0 and above indicates that every rupee spent resulted in a return of 3.0 or more by the crop. 3. RESULTS AND DISCUSSION 3.1. Grain yield response of wheat genotypes to different N fertilizer levels
Variations in grain yield and other yield components due to soil type and N fertilizer treatments were substantial among the wheat genotypes. All three wheat genotypes gave good grain yield response to N fertilizer levels at CCRI, Pirsabak with maximum grain yield at 90 kg N ha-1 whereas maximum yield was obtained at the optimum dose of 45 kg N ha-1 at NIFA (Table 4). N fertilizer recovery was higher at the loamy sand CCRI site with low organic matter and total soil N. There was little variation in grain yield of wheat genotypes with N fertilizer rate at the silt loam NIFA site.
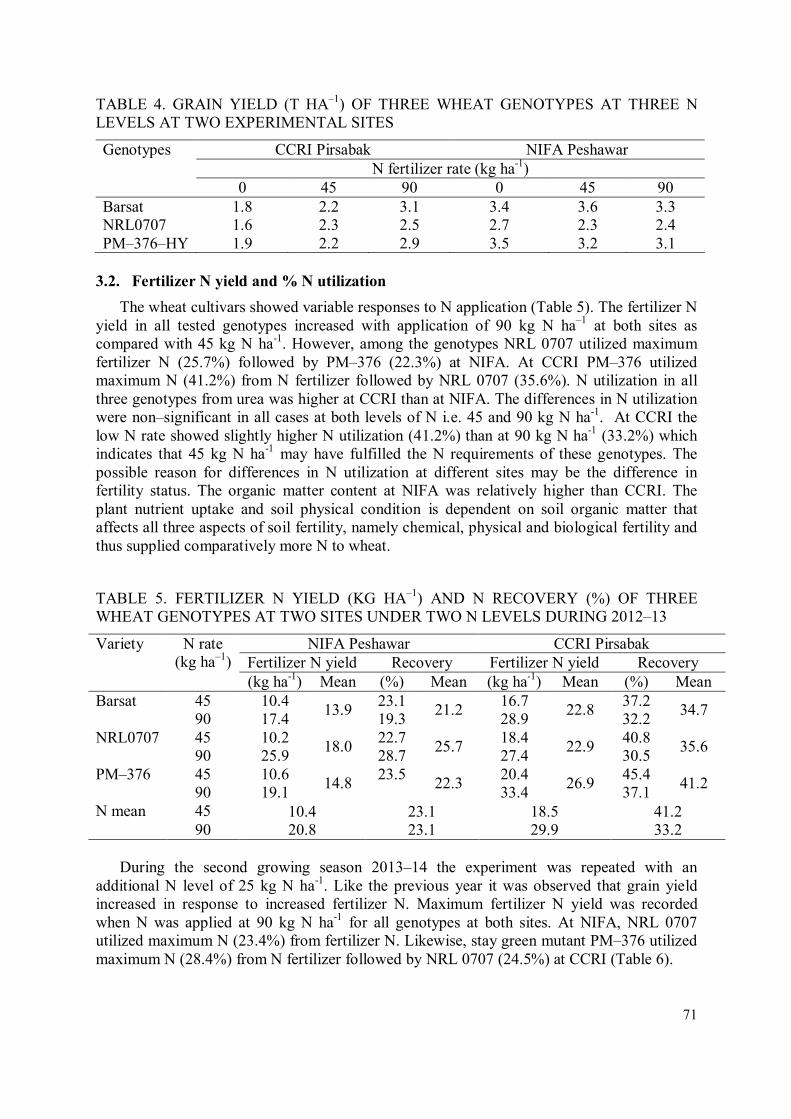
71
TABLE 4. GRAIN YIELD (T HA–1) OF THREE WHEAT GENOTYPES AT THREE N LEVELS AT TWO EXPERIMENTAL SITES
Genotypes CCRI Pirsabak NIFA Peshawar N fertilizer rate (kg ha-1)
0 45 90 0 45 90 Barsat 1.8 2.2 3.1 3.4 3.6 3.3 NRL0707 1.6 2.3 2.5 2.7 2.3 2.4 PM–376–HY 1.9 2.2 2.9 3.5 3.2 3.1
3.2. Fertilizer N yield and % N utilization
The wheat cultivars showed variable responses to N application (Table 5). The fertilizer N yield in all tested genotypes increased with application of 90 kg N ha–1 at both sites as compared with 45 kg N ha-1. However, among the genotypes NRL 0707 utilized maximum fertilizer N (25.7%) followed by PM–376 (22.3%) at NIFA. At CCRI PM–376 utilized maximum N (41.2%) from N fertilizer followed by NRL 0707 (35.6%). N utilization in all three genotypes from urea was higher at CCRI than at NIFA. The differences in N utilization were non–significant in all cases at both levels of N i.e. 45 and 90 kg N ha-1. At CCRI the low N rate showed slightly higher N utilization (41.2%) than at 90 kg N ha-1 (33.2%) which indicates that 45 kg N ha-1 may have fulfilled the N requirements of these genotypes. The possible reason for differences in N utilization at different sites may be the difference in fertility status. The organic matter content at NIFA was relatively higher than CCRI. The plant nutrient uptake and soil physical condition is dependent on soil organic matter that affects all three aspects of soil fertility, namely chemical, physical and biological fertility and thus supplied comparatively more N to wheat.
TABLE 5. FERTILIZER N YIELD (KG HA–1) AND N RECOVERY (%) OF THREE WHEAT GENOTYPES AT TWO SITES UNDER TWO N LEVELS DURING 2012–13
Variety N rate (kg ha–1)
NIFA Peshawar CCRI Pirsabak Fertilizer N yield Recovery Fertilizer N yield Recovery (kg ha-1) Mean (%) Mean (kg ha-1) Mean (%) Mean
Barsat 45 10.4 13.9
23.1 21.2
16.7 22.8
37.2 34.7
90 17.4 19.3 28.9 32.2 NRL0707 45 10.2
18.0 22.7
25.7 18.4
22.9 40.8
35.6 90 25.9 28.7 27.4 30.5
PM–376 45 10.6 14.8
23.5 22.3
20.4 26.9
45.4 41.2
90 19.1 33.4 37.1 N mean 45 10.4
20.8 23.1 23.1
18.5 29.9
41.2 33.2 90
During the second growing season 2013–14 the experiment was repeated with an
additional N level of 25 kg N ha-1. Like the previous year it was observed that grain yield increased in response to increased fertilizer N. Maximum fertilizer N yield was recorded when N was applied at 90 kg N ha-1 for all genotypes at both sites. At NIFA, NRL 0707 utilized maximum N (23.4%) from fertilizer N. Likewise, stay green mutant PM–376 utilized maximum N (28.4%) from N fertilizer followed by NRL 0707 (24.5%) at CCRI (Table 6).

72
3.3. 13
C isotope discrimination (∆ values) of wheat as influenced by N fertilizer
application
The 13C (∆) values in wheat straw and grain ranged from 19.4 to 21.9 across all three genotypes at both sites (Table 7). The ∆ values in wheat grain and straw at CCRI were higher than at NIFA, indicating higher water use efficiency at CCRI. Higher values of ∆ were found in all three genotypes at both sites at 45 kg N ha-1. At NIFA, ∆ values in grain were higher than in straw, but at CCRI the straw showed higher ∆ values than grain. Higher ∆ values were found in NRL0707 at CCRI. The water table at CCRI is deeper than at NIFA and comparatively more suitable for rainfed experiments. It is reported that 13C (∆) values are positively correlated with water use efficiency. From these results it was concluded that NRL0707 is the most water use efficient wheat cultivar for rainfed conditions.
TABLE 6. FERTILIZER N YIELD AND % N RECOVERY (%) OF THREE WHEAT GENOTYPES AT TWO SITES UNDER THREE N LEVELS DURING 2013–14
Variety N rate (kg ha–
1)
NIFA Peshawar CCRI Pirsabak Fertilizer N yield Recovery Fertilizer N yield Recovery (kg ha-1) Mean (%) Mean (kg ha-1) Mean (%) Mean
Barsat 25 4.9 11.2
19.4 18.0
6.8 12.2
27.3 23.2 45 8.6 19.0 8.4 18.6
90 20.1 22.4 21.5 23.9 NRL0707 25 5.7
10.5 17.3
23.4 7.1
12.4 28.5
24.5 45 10.2 22.6 10.3 23.0 90 15.6 22.6 19.8 22.0
PM–376 25 4.3 12.0
17.3 20.4
6.8 15.4
27.0 28.4 45 8.8 19.7 12.9 28.7
90 22.7 25.3 26.5 29.4 N mean
25 5.0 20.3 6.9 27.6 45 9.2 20.8 10.5 23.4 90 19.5 20.8 22.6 25.1
In the 2nd growing season13C (∆) values ranged from 22.3 to 23.2 in wheat straw and 20.9
to 21.8 in grain across all three genotypes at both sites (Table 8). At NIFA, the ∆ values in wheat grain increased while they decreased in straw with increasing levels of fertilizer N applied. Higher 13C (∆) values were found in grain and straw in the stay green mutant PM–376 followed by NRL 0707. However, at CCRI higher ∆ values in grain were found for NRL 0707, and therefore it was concluded that NRL 0707 has comparatively higher water use efficiency potential under drought conditions.

73
TABLE 7. CARBON ISOTOPIC DISCRIMINATION (∆, ‰) OF STRAW AND GRAIN OF THREE WHEAT GENOTYPES AT TWO SITES UNDER TWO N LEVELS
Variety N rate (kg ha-1)
NIFA Peshawar CCRI Pirsabak Straw Grain Straw Grain
(‰) Mean (‰) Mean (‰) Mean (‰) Mean Barsat 45 19.8
18.8 20.0
20.2 21.6
21.2 20.5
19.9 90 19.9 20.3 20.8 19.4
NRL0707 45 19.8 19.6
20.0 19.8
21.9 21.6
20.4 20.0
90 19.4 19.6 21.2 19.7 PM–376 45 19.9
19.7 20.4
20.3 21.8
21.6 20.5
20.5 90 19.6 20.1 21.6 20.4
N mean 45 19.8 20.1 21.8 20.5 90 19.6 20.0 21.2 19.8
TABLE 8. CARBON ISOTOPIC DISCRIMINATION (∆, ‰) OF SRAW AND GRAIN OF THREE WHEAT CULTIVARS AT TWO SITES UNDER THREE N LEVELS
Variety N rate (kg ha-1)
NIFA Peshawar CCRI Pirsabak Grain Straw Grain Straw
(‰) Mean (‰) Mean (‰) Mean (‰) Mean Barsat 25 21.1
21.1
22.5 22.5
20.7 20.7
22.2 22.4 45 21.2 22.3 20.8 22.3
90 21.1 22.5 20.7 22.5 NRL0707 25 20.9
21.2
22.7 22.6
21.4 21.4
22.2 22.5 45 21.2 22.5 21.5 22.4
90 21.7 22.5 21.2 23.0 PM–376 25 21.8
21.6
23.2 22.7
20.6 20.9
22.2 22.1 45 21.5 22.7 21.1 21.9
90 21.6 22.4 21.0 22.2 N mean
25 21.3 22.8 20.9 22.2 45 21.3 22.5 21.2 22.2 90 21.5 22.5 20.9 22.6
3.4. Assessment of cost economic benefit of N Fertilizer for wheat cultivation with
improved crop variety
Based on research work during (2011–14) NRL 0707 (Insaf 2015) was selected for further studies on progressive farmers’ fields in different agro–ecological zones of Khyber Pakhtunkwa province.
The highest yield was produced when N was applied at 90 kg ha-1as compared to the optimum N dose of 45 kg ha-1, but the difference between the two treatments was not statistically significant. The lowest yields were obtained when no N was applied (control treatment). In the low rainfall areas of Kohat and DI Khan the wheat yields were in the range of 540 (2014–15, control) to 2359 kg ha–1 (2015–16, 90 kg N ha-1). In the medium rainfall areas of Peshawar and Charsadda during both years the highest yields (1165 to 3577 kg ha-1) were obtained. This may have been due to leveled lands, a proper irrigation system and soil fertility. In the high rainfall areas of Hazara and Swat the yields were in the range of 1112 to

74
2757 kg ha-1, and were lower compared with Peshawar and Charsadda, which may have been due to lodging (Tables 9 and10; Figures 1 and 2).
TABLE 9. MEAN WHEAT YIELDS (KG HA-1) AT FOUR N LEVELS AT SIX SITES DURING 2014–15
Rainfall Location N level (kg ha-1) 0 25 45 90
Low DI Khan, Kohat 540 1191 1743 1828 Medium Peshawar, Charsadda 1165 1988 3171 3332 High Hazara, Swat 1112 1954 2887 2997
TABLE 10. MEAN WHEAT YIELDS (KG HA-1) AT THREE N LEVELS AT SIX SITES DURING 2015–16
Rainfall Location N levels (kg ha-1) 0 45 90
Low DI Khan, Kohat 1680 2222 2359 Medium Peshawar, Charsadda 2860 3467 3577 High Hazara, Swat 2065 2666 2757
FIG. 1. Wheat yields at three sites during 2014–15 at four N levels.
0
500
1000
1500
2000
2500
3000
3500
LRA MRA HRA
0 kg/ha 25 kg/ha
45 kg/ha 90 kg/ha

75
FIG. 2. Wheat yields at three sites during 2015–16 at three N levels.
Economic analysis of the wheat yields in all the three regions (low, medium and high
rainfall areas) show that maximum net income per hectare was obtained when nitrogen was applied at the rate of 45 kg ha-1 followed by 90 kg ha-1during both the screening years. Similarly higher VCR values were obtained when nitrogen was applied at 45 kg ha-1 throughout all the wheat growing regions during both screening years (Tables 11 to 16). TABLE 11. ECONOMICS OF NITROGEN USE IN LOW RAINFALL AREAS DURING 2014–15
Nitrogen (kg ha–1)
Yield (kg ha–
1)
Yield increase
Cost of fertilizer
Value of increased yield (Rs.)
Net profit (Rs.)
VCR
0 540 25 1191 252 2160 6507 4347 3.0 45 1743 804 3920 12030 8110 3.1 90 1828 889 7840 12883 5043 1.6 TABLE 12. ECONOMICS OF NITROGEN USE IN MEDIUM RAINFALL AREAS DURING 2014–15
0
500
1000
1500
2000
2500
3000
3500
4000
LRA MRA HRA
0 kg/ha 45 kg/ha 90 kg/ha
Nitrogen (kg ha–1)
Yield (kg ha–1)
Yield Increase
Cost of fertilizer
Value of increased yield (Rs.)
Net profit (Rs.)
VCR
0 1165 25 1988 823 2160 8228 6068 3.8 45 3171 2006 3920 20055 16135 5.1 90 3332 2167 7840 21672 13832 2.8
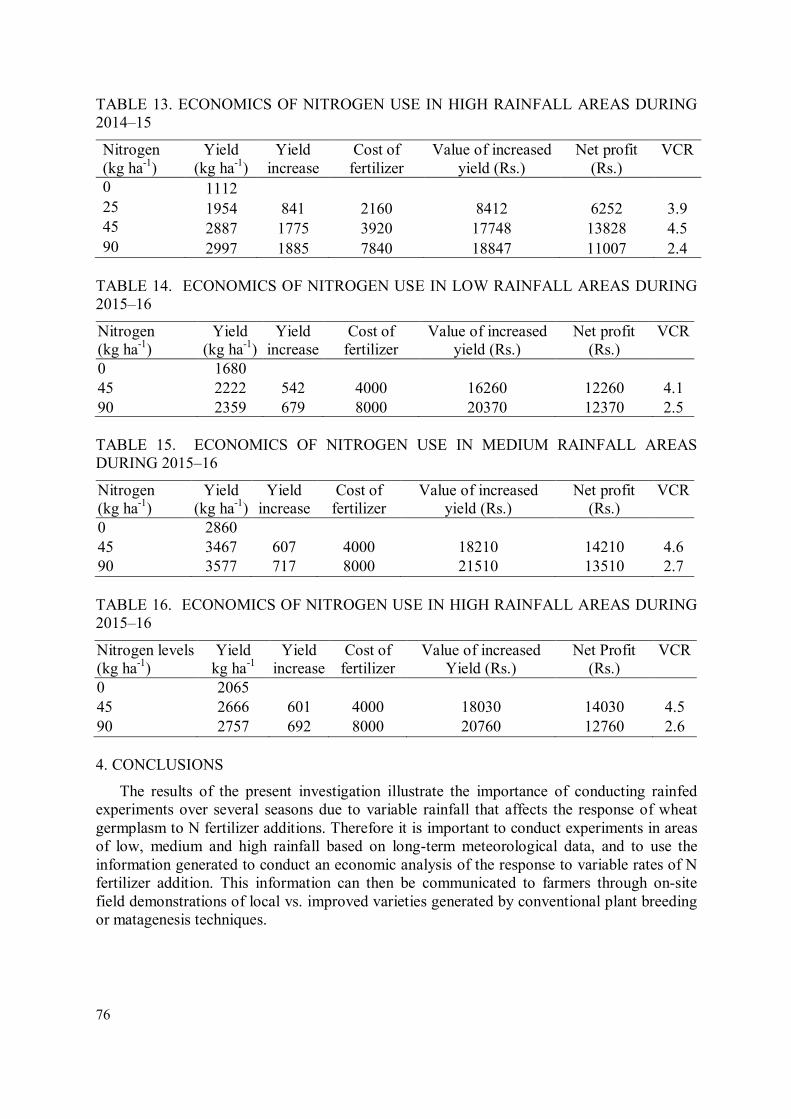
76
TABLE 13. ECONOMICS OF NITROGEN USE IN HIGH RAINFALL AREAS DURING 2014–15
Nitrogen (kg ha-1)
Yield (kg ha-1)
Yield increase
Cost of fertilizer
Value of increased yield (Rs.)
Net profit (Rs.)
VCR
0 1112 25 1954 841 2160 8412 6252 3.9 45 2887 1775 3920 17748 13828 4.5 90 2997 1885 7840 18847 11007 2.4
TABLE 14. ECONOMICS OF NITROGEN USE IN LOW RAINFALL AREAS DURING 2015–16
Nitrogen (kg ha-1)
Yield (kg ha-1)
Yield increase
Cost of fertilizer
Value of increased yield (Rs.)
Net profit (Rs.)
VCR
0 1680 45 2222 542 4000 16260 12260 4.1 90 2359 679 8000 20370 12370 2.5 TABLE 15. ECONOMICS OF NITROGEN USE IN MEDIUM RAINFALL AREAS DURING 2015–16
Nitrogen (kg ha-1)
Yield (kg ha-1)
Yield increase
Cost of fertilizer
Value of increased yield (Rs.)
Net profit (Rs.)
VCR
0 2860 45 3467 607 4000 18210 14210 4.6 90 3577 717 8000 21510 13510 2.7 TABLE 16. ECONOMICS OF NITROGEN USE IN HIGH RAINFALL AREAS DURING 2015–16
Nitrogen levels (kg ha-1)
Yield kg ha-1
Yield increase
Cost of fertilizer
Value of increased Yield (Rs.)
Net Profit (Rs.)
VCR
0 2065 45 2666 601 4000 18030 14030 4.5 90 2757 692 8000 20760 12760 2.6 4. CONCLUSIONS
The results of the present investigation illustrate the importance of conducting rainfed experiments over several seasons due to variable rainfall that affects the response of wheat germplasm to N fertilizer additions. Therefore it is important to conduct experiments in areas of low, medium and high rainfall based on long-term meteorological data, and to use the information generated to conduct an economic analysis of the response to variable rates of N fertilizer addition. This information can then be communicated to farmers through on-site field demonstrations of local vs. improved varieties generated by conventional plant breeding or matagenesis techniques.

77
ACKNOWLEDGEMENTS
We wish to thank the International Atomic Energy Agency for a Research Contract under the CRP D1.50.13: Approaches to improvement of Crop Genotypes with high Water and Nutrient Use Efficiency for Water Scarce Environments.
REFERENCES
[1] ASSENG, S., et al., Analysis of water and nitrogen–use efficiency of wheat in a Mediterranean climate. Plant Soil 233 (2001) 127–143.
[2] GUPTA, N.K., et al., Effect of water stress on physiological attributes and their relationship with growth and yield of wheat cultivars at different stages. J. Agron. Crop Sci. 186 (2001) 55–62.
[3] BAUDER, J., Irrigating with limited water supplies. Montana State Univ. Comm. Ser. Montana Hall. Bozeman, MT59717, USA (2001).
[4] REBETZKE, G.J., et al., Selection for reduced carbon isotope discrimination increases aerial biomass and grain yield of rainfed bread wheat. Crop Sci. 42 (2002) 739–745.
[5] REBETZKE, G.J., et al., Inheritance of carbon isotope discrimination in bread wheat (Triticum aestivum L.). Euphytica 150 (2006) 97–106.
[6] XU, X., et al., Relationship between carbon isotope discrimination and grain yield in spring wheat cultivated under different water regimes. J. Integr. Plant Biol. 49 (2007) 1497–1507.
[7] FARQUHAR, G.D., RICHARDS, R.A., Isotopic composition of plant carbon correlates with water–use efficiency of wheat genotypes. Funct. Plant Biol. (1984) 539–552.
[8] EHDAIE, B., et al., Water–use efficiency and carbon isotope discrimination in wheat. Crop Sci. 31 (1991) 1282–1288.
[9] CONDON, A.G., RICHARDS, R.A., Exploiting genetic variation in transpiration efficiency in wheat: an agronomic view. Stable Isotopes and Plant Carbon–Water Relations. (1993) 435–450.
[10] TAIZ, L., ZEIGER, E., Plant Physiology. Sunderland, Massachusetts: Sinauer Associates (2006).
[11] GILLER, K.E., et al., Emerging technologies to increase the efficiency of use of fertilizer nitrogen. Agriculture and the Nitrogen Cycle. (2004) 35–51.
[12] SUDING, K. N., et al., Functional– and abundance–based mechanisms explain diversity loss due to N fertilization. Proc. Nat. Acad. Sci. USA 102 (2005) 4387–4392.
[13] EVANS, J., Photosynthesis and nitrogen relationships in leaves of C3 plants. Oecologia 78 (1989) 9–19.
[14] AGREN, G. I., Theory for growth of plants derived from the nitrogen productivity concept. Physiol. Plant. 64 (1985) 17–28.
[15] SINCLAIR, T.R., JAMIESON, P.D., Grain number, wheat yield, and bottling beer: an analysis. Field Crops Res. 98 (2006) 60–67.
[16] ELSER, J.J., et al., Global analysis of nitrogen and phosphorus limitation of primary producers in freshwater, marine and terrestrial ecosystems. Ecol. Lett. 10 (2007)1135–1142.
[17] EHDAIE, B., et al., Root system size influences water‐nutrient uptake and nitrate leaching potential in wheat. J. Agron. Crop Sci. 196 (2010) 455–466.

78
[18] BUTTERBACH–BAHL, K., DANNENMANN, M., Denitrification and associated soil N2O emissions due to agricultural activities in a changing climate. Curr. Opin. Environ. Sustain. 3 (2011) 389–395.
[19] CHEN X., et al., Optimal rates of nitrogen fertilization for a winter wheat corn cropping system in Northern China. Commun. Soil Sci. Plant Anal. 35 (2004) 583–597.
[20] ORTIZ–MONASTERIO, J.I., et al., Nitrogen and phosphorus use efficiency. In: REYNOLDS, M.P., et al., (Eds.), Application of Physiology in Wheat Breeding. CIMMYT, Mexico (2001) 200–207.
[21] GUARDA, G., et al., Grain yield, nitrogen–use efficiency and baking quality of old and modern Italian bread–wheat cultivars grown at different nitrogen levels. Eur. J. Agron. 21 (2004) 181–192.
[22] LAPERCHE, A., et al., Estimation of genetic parameters of a DH wheat population grown at different N stress levels characterized by probe genotypes. Theor. Appl. Genet. 112 (2006) 797–807.
[23] HIREL, B., et al., The challenge of improving nitrogen use efficiency in crop plants: towards a more central role for genetic variability and quantitative genetics within integrated approaches. J. Exp. Bot. 58 (2007) 2369–2387.
[24] LI, Z., et al., The contribution of distant hybridization with decaploid Agropyron
elongatum to wheat improvement in China. J. Genet. Genom. 35 (2008) 451–456. [25] RAUN, W.R., et al., Improving nitrogen–use efficiency in cereal grain production with
optical sensing and variable rate application. Agron. J. 94 (2002) 351–815. [26] SHANAHAN, J.F., et al., Responsive in–season nitrogen management for cereals.
Comput. Electron. Agric. 61 (2008) 51–62. [27] HALVORSON, A.D., et al., Tillage and nitrogen fertilization influence grain and soil
nitrogen in an annual cropping system. Agron J. 93 (2001) 836–841. [28] RYAN, J., et al., Soil chemical analysis (organic matter). In: Soil and Plant Analysis
Laboratory Manual. 2nd edn. Jointly published by ICARDA, Aleppo, Syria and NARC, Pakistan (2001) 46–48.
[29] BREMNER, J.M., MULVANEY, C.S., Nitrogen–total. In: Methods of soil analysis. Part 2– Chemical and microbiological properties. Page, A.L., Miller, R.H., Keeney, D.R., (Eds.). 2nd edn. ASA, Inc., SSSA, Inc., Madison, Wisconsin, USA (1982) 595–924.
[30] KIRDA, C., 1990. Use of neutron water and gamma density gauges in soil water studies. In: Use of Nuclear Techniques in Studies of Soil–plant Relationships. IAEA, Vienna, Austria (1990) 183–223.
[31] INTERNATIONAL ATOMIC ENERGY AGENCY (IAEA) Use of Isotope and Radiation Methods in Soil and Water Management and Crop Nutrition, IAEA Training Manual Series 14. IAEA, Vienna, Austria (2001).
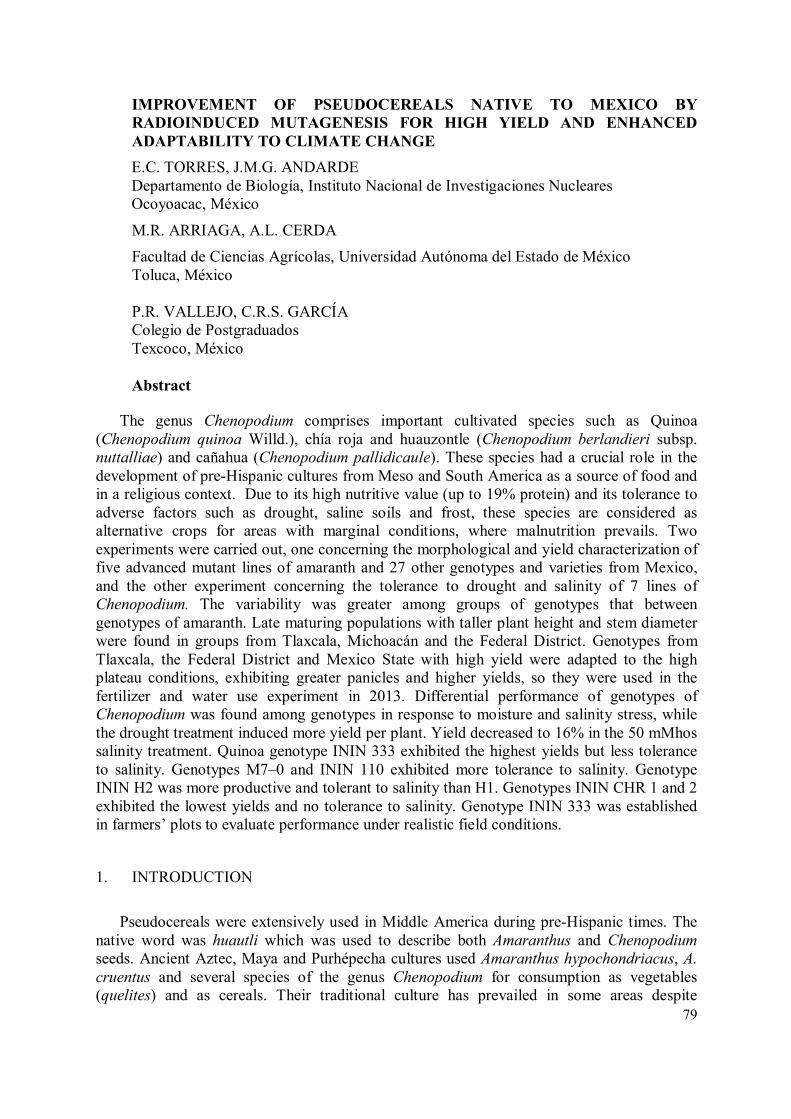
79
IMPROVEMENT OF PSEUDOCEREALS NATIVE TO MEXICO BY
RADIOINDUCED MUTAGENESIS FOR HIGH YIELD AND ENHANCED
ADAPTABILITY TO CLIMATE CHANGE
E.C. TORRES, J.M.G. ANDARDE Departamento de Biología, Instituto Nacional de Investigaciones Nucleares Ocoyoacac, México
M.R. ARRIAGA, A.L. CERDA
Facultad de Ciencias Agrícolas, Universidad Autónoma del Estado de México Toluca, México P.R. VALLEJO, C.R.S. GARCÍA Colegio de Postgraduados
Texcoco, México
Abstract
The genus Chenopodium comprises important cultivated species such as Quinoa (Chenopodium quinoa Willd.), chía roja and huauzontle (Chenopodium berlandieri subsp. nuttalliae) and cañahua (Chenopodium pallidicaule). These species had a crucial role in the development of pre-Hispanic cultures from Meso and South America as a source of food and in a religious context. Due to its high nutritive value (up to 19% protein) and its tolerance to adverse factors such as drought, saline soils and frost, these species are considered as alternative crops for areas with marginal conditions, where malnutrition prevails. Two experiments were carried out, one concerning the morphological and yield characterization of five advanced mutant lines of amaranth and 27 other genotypes and varieties from Mexico, and the other experiment concerning the tolerance to drought and salinity of 7 lines of Chenopodium. The variability was greater among groups of genotypes that between genotypes of amaranth. Late maturing populations with taller plant height and stem diameter were found in groups from Tlaxcala, Michoacán and the Federal District. Genotypes from Tlaxcala, the Federal District and Mexico State with high yield were adapted to the high plateau conditions, exhibiting greater panicles and higher yields, so they were used in the fertilizer and water use experiment in 2013. Differential performance of genotypes of Chenopodium was found among genotypes in response to moisture and salinity stress, while the drought treatment induced more yield per plant. Yield decreased to 16% in the 50 mMhos salinity treatment. Quinoa genotype ININ 333 exhibited the highest yields but less tolerance to salinity. Genotypes M7–0 and ININ 110 exhibited more tolerance to salinity. Genotype ININ H2 was more productive and tolerant to salinity than H1. Genotypes ININ CHR 1 and 2 exhibited the lowest yields and no tolerance to salinity. Genotype ININ 333 was established in farmers’ plots to evaluate performance under realistic field conditions.
1. INTRODUCTION
Pseudocereals were extensively used in Middle America during pre-Hispanic times. The native word was huautli which was used to describe both Amaranthus and Chenopodium
seeds. Ancient Aztec, Maya and Purhépecha cultures used Amaranthus hypochondriacus, A.
cruentus and several species of the genus Chenopodium for consumption as vegetables (quelites) and as cereals. Their traditional culture has prevailed in some areas despite

80
enduring marginal conditions, and is an important reserve of germplasm and a source of indigenous knowledge. A recent survey under the sponsorship of the Sistema Nacional de Recursos Fitogenéticos (SINAREFI) aimed at collecting germplasm and knowledge of growing practices. The Chenopodium genus is relevant because cultivated species of high nutritive value and hardiness such as Quinoa (Chenopodium quinoa Willd.) and huauzontle (Chenopodium berlandieri subsp. nuttalliae) exist, being alternative crops for regions with marginal agricultural conditions [1].
The importance of species belonging to these genera in pre–Hispanic civilizations has been widely documented. Mendoza codex registers tributes of nearly 7000 tons of huautli
(Seeds of the Amaranthus and Chenopodium genera). This quantity was collected among towns ruled by the Aztec empire [2]. The amount of huautli tribute was exceeded only by the three major crops: maize, beans and chilli. Pseudocereals were important not only from a socio–economic point of view but also in religious practices and it was for this reason that the Spanish conquerors forbade huautli growing. This, added to the introduction of Old World crops, contributed to their gradual decline [3].
West [4] documents the growing of chía roja (Chenopodium berlanderi subsp. nuttalliae)
and amaranth (Amaranthus hypochondriacus) (alegría) in towns like Cherán and Pichátaro, in Michoacán, México, with descriptions of products such as chapatas, a sort of tamales (a lump of corn dough, prepared by mixing cornmeal with equal parts of ground ‘Chía roja’ or ‘Chía negra’ seeds and sugar, all of which is wrapped in corn husks (totomoxtle) and steam cooked [5], and the balls of popped amaranth seeds with honey known as alegrías [6]. He also points out the role of chía roja as a complement of farmers’ diets, and also the consumption of chía negra and chía blanca, of Amaranthus hypocvhondriacus. The contribution of huauzontle as a source of protein close to 17% has been documented by several studies [7, 8].
In recent years, interest has grown in new crops of high nutritional value such as Quinoa (Chenopodium quinoa), and Chenopodium berlandieri subspecie nuttaliae (cvs. Huauzontle and Chía roja). These underutilized crops of the Chenopodium genus have traits giving them potential to become alternative crops for marginal zones [9].
Chenopodium quinoa besides its high protein value exhibits tolerance to frost and drought and has adaptability to different latitudes and altitudes, but the presence of saponins, products that confer a bitter flavor, foam formation and in high concentrations induce hemolysis, has been a deterrent to the expansion of this crop [10]. Chenopodium quinoa is important because the nutritive value of its seeds is comparable to milk due to its high protein content and adequate essential amino acids balance, mainly lysine, methionine and tryptophan, besides a good quantity of vitamins and minerals [11]. Chenopodium quinoa is used for human consumption to prepare flour, soups, flakes, alcohol [12], and the whole plant is used as forage in Bolivia, Peru, Ecuador and Colombia. There is no clear confirmation concerning the domestication of C. quinoa, although it is supposed that this process occurred in different times and locations: in Peru (5000 B.C), Chile (3000 B.C) and Bolivia (750 B.C.) [13]. It has been documented that besides its value as food Quinoa was used in the religious and social life of prehispanic cultures [14].
Some species of the Chenopodium genus can tolerate adverse conditions of temperature, humidity and soil type, thus enabling it to thrive from extremely cold regions to desert and saline regions [15, 16]. Quinoa tolerates drought and with as little as 200–300 mm of rainfall it has acceptable yields of 1 ton ha–1 in Mexico [17], where it can tolerate –8 °C during vegetative growth. Quinoa tolerates high soil salinity and a pH of up to 9.5. In laboratory trials, seeds have germinated at salt concentrations of up to 3% [18]. Quinoa can adapt to

81
several environments from sea level up to 4000 masl, and due to its great plasticity can be found from Chile to Canada, and even in countries of Africa and Europe [19].
Traditional farming systems in Mexico are based mainly on the use of local genotypes of staple crops such as corn and beans as well as land races of domesticated and semi– domesticated plants, all of which are grown in association to improve both income and farmers’ diet in regions having marginal agricultural conditions. These traditional farming systems can be traced back to ancient cultures. Chinampa was developed by the Aztecs, the so-called solar farming method by the Mayan civilization and the milpa among Mesoamerican peoples since pre-Hispanic times. All of these systems promoted biodiversity by using several plant species which in turn satisfied food and housing requirements [20].
Nowadays there are regions where these traditional farming systems are still practiced, but diverse factors such as mechanization, the use of alien varieties and agrochemicals, changes in land usage and migration have all contributed to the gradual decrease of these traditional methods, and consequently of the germplasm diversity (local land races, semi–domesticated and wild edible plants). Among valuable germplasm are pseudocereals belonging to the Amaranthus or Chenopodium genera, which like true cereals, are rich in mealy materials, able to be used in the making of flour, bread and noodles.
However, in some distant rural areas, pseudocereals in association with corn, beans and squash, are still grown. Many factors including tradition, remoteness, the need for food and income alternatives, as well as scarcity of economic resources have all contributed to preserve this pre-Hispanic germplasm. However as young people migrate to urban areas, the remaining elderly farmers find it increasingly difficult to produce and sell these crops, some of which face the danger of extinction.
Among adverse abiotic factors that affect pseudocereals, are drought, frosts and salinity. These factors are becoming severe due to climatic change, because 80% of Mexican agricultural production is generated under rainfed conditions. Rain is irregular, having drought periods during the growth cycle, thus reducing production. Mexico´s climatic conditions favour natural formation of saline soils, this process being accelerated by inadequate management of soils and water, affecting 30% of the irrigated agricultural area [21]. This phenomenon has been observed in the states of Puebla, Sinaloa, Guanajuato, Tamaulipas and Morelos [22]. In Mexico State, this problem can be observed on soils surrounding Texcoco Lake, and in the southern part of the State such as Ixtapan de la Sal [17].
Outstanding resistance of pseudocereals to abiotic stresses such as tolerance to drought, frost and salinity have been reported [23]. However it is necessary to evaluate the performance of selections obtained by radioinduced mutagenesis, to offer superior genotypes to be sown on marginal soils, prone to drought and excess of salts and to get improved yields of high nutritive value. Therefore the first objective of this research was to characterize genotypes of amaranth and to select the most promising to be grown under marginal soil conditions. The second objective was the identification of Chenopodium genotypes tolerant to drought and salinity.

82
2. MATERIALS AND METHODS 2.1. Evaluation of Amaranthus genotypes and mutants
Five outstanding mutagenic lines generated by ININ (those having M1, M2 and M3 extension on its name), and 27 other genotypes and varieties coming from rural areas of Mexico City, México State, Guerrero and Michoacán, were evaluated (Table 1). The 32 populations were evaluated under a completely randomized block design with three replications in two experiments located at the Colegio de Postgraduados, México State, (19º 27’ 38’’ North, 98º 54’ 11’’ West; 2250 masl). The climate of the location is temperate sub–humid with an average annual rainfall of 645 mm. During the growing season the average temperature was 17.8°C with maximum and minimum temperatures of +30°C and –4°C, respectively, and during the last stages of the crop development the average relative humidity was 64.7%.
TABLE 1. ORIGIN AND DENOMINATION OF 32 GENOTYPES OF AMARANT EVALUATED IN 2012
Origin Accession Original denomination Distrito Federal 3 Mixquic 09–02, Rojo Azteca, Tuyehualco Estado de México 3 Acoyotepec, Ameca 03, Ameca 04 Guerrero 5 Acapetla M1, Acapetla M2, Acapetla M3,
Ocotepec, Sabino Alto Michoacán 3 Mich A1, Mich A3, Mich A6 Morelos 6 Amarilla, Amilcingo, Blanca, Mor 09–M1, Mor
09–M3, Payasita Tlaxcala 7 Criolla, Huazulco, Laguna, Mixco 2, Mixco 3,
Rosa Criolla, Sabino Variedades mejoradas 5 DGETA, Gabriela, Dorada, Nutrisol, Revancha
Experimental units were 3 rows, 5 m in length and the distance between rows was 0.8m.
Fertilization was 80N–60P–00. The population density was four plants per 0.4 m. Weeding was performed manually and with an oxen yoke according to the practices of the region. Two waterings were applied before the start of the rainy season. Quantitative and qualitative traits were registered on the population according to Table 2. Ten plants were evaluated on each experimental unit. Variables were registered using amaranth descriptors [24].
TABLE 2. MORPHOLOGICAL TRAITS OF THE AMARANTH GENOTYPES
Quantitative traits Unit Days to formation of panicle days Days to flowering days Area of leaf cm2 Leaf length cm Maximum width of the leaf cm Plant height cm Height to panicle cm Panicle length cm Stem diameter mm

83
Statistical analysis was performed using the software INFOSTAT [25]. Quantitative variables were analyzed according to a mixed model per locations, groups according to genotype origin and individual genotypes. Comparison of means was analyzed according to the Tukey test (P≤5%). Additionally, an Analysis of Principal Components based on the matrix of correlations of the average of quantitative standardized traits was carried out. Two Ecuadorian varieties Alegría (A. caudatus) and Chimborazo (A. hybridus) were incorporated in this analysis. Similarity relationships were determined with cluster analysis of standardized data and according to the Euclidean distances using the UPGMA method. Frequencies of qualitative traits were determined on populations, by applying similarity measures for binary variables, assigning 0 when the trait was absent and 1 if it was present [26], by performing analysis of principal components (APC).
2.2. Evaluation of Chenopodium lines tolerant to drought and salinity
Seven genotypes of Chenopodium were evaluated in regard to two levels of watering and three salinity conditions. The evaluated genotypes are shown in Table 3. TABLE 3. GENOTYPES OF PSEUDOCEREALS SUBJECTED TO DROUGHT AND SALINITY
Genotypes Specie and variety M7–0 Quinoa, Chenopodium Quinoa Willd. Barandales variety ININ 110 Quinoa, Chenopodium Quinoa Willd. Low saponin mutant ININ 333 Quinoa, Chenopodium Quinoa Willd. Highly productive mutant with
saponins ININ CHR1 Chía roja, Chenopodium berlandieri sbp. nuttalliae. var. Opohuira ININ CHR2 Chía roja, Chenopodium berlandieri sbp. nuttalliae. var. Huirapeo ININ H1 Huauzontle, Chenopodium berlandieri Moq. ININ H2 Huauzontle, Chenopodium berlandieri Moq.
The experiment was conducted under greenhouse conditions at the Agricultural Sciences Faculty of the Universidad Autónoma del Estado de México, located at 99º41’01’’ and 99º41’53’’ West, and 19º24’03’’ and 19º25’11’’ latitude North at 2600 masl. The best genotypes were evaluated under field conditions.
In this experiment two soil moisture levels were evaluated combined with three saline conditions, besides the control. To evaluate tolerance to drought, two cycles of water deficit were applied. The first cycle began 40 days after emergence, stopping the watering until 50% of the plants reached intense wilting. Afterwards, a watering to field capacity was applied. The second water deficit was applied 75 days after emergence. The second non–watering period also lasted until plants exhibited severe wilting. After that, a recuperation watering was provided and a good moisture level was maintained until harvest.
Salinity treatments were two salt (NaCl) concentrations: 5 and 10 mMhos, with a control watered with distilled water. Sowing was performed on pots 28.5 cm in diameter and 21 cm in depth. The substrate had 30% peat moss and 70% of a vertisol soil, which prevails in the Toluca Valley. Ten seeds were sown per pot and fungicide (manzate) was applied at the first watering. Fertilization was performed with the formula 80–40–00 by applying 50% of nitrogen and 100% of phosphorous at sowing and the remaining 50% of nitrogen two months after sowing. Seedlings were thinned to four plants per pot.

84
The experiment consisted of 42 treatments: 7 genotypes, 2 soil moisture levels, and 3 saline conditions. The experiment was conducted under a factorial completely randomized design with four replications. Studied factors were: Genotypes Quinoa (M7 0, ININ 110, ININ 333), Chía roja (ININ CHR1, ININ CHR2) and huauzontle (ININ H1, ININ H3); moisture level: normal watering, drought; and salinity: distilled water (Control, 5 and 10 mMhos). Generated treatments are summarized in Table 4. An image of part of the experiment can be seen in Figure 1.
FIG.1. Drought and salinity experiment conducted under greenhouse conditions.
TABLE 4. LIST OF FACTORS USED IN THE EXPERIMENT
Factor Level Genotypes Quinoa M7–0
Quinoa ININ–110 Quinoa ININ 333 Chía roja Opohuira Chía roja Huirapeo Huauzontle ININ H1 Huauzontle ININ H2
Watering Normal Two drought periods induced
Salt Control 5 mMhos 10 mMhos
Evaluated variables were plant height, stem diameter, panicle length and diameter, yield.
Statistical analysis was conducted through an analysis of variance, and means were compared by the Tukey test.

85
3. RESULTS AND DISCUSSION 3.1. Evaluation of Amaranthus genotypes and mutants
Analysis of variance of combined locations per groups of genotypes did not exhibit significant differences by location of origin of genotypes. Between groups of genotypes highly significant differences were detected. Groups from Tlaxcala, D.F. and Michoacán were late maturing, exhibiting higher plant height, and higher panicle height and stem diameter. The groups of D.F. and México State were outstanding with respect to length of panicle, while the highest values of leaf dimensions were for groups from Tlaxcala, Morelos and commercial varieties. The highest yields were exhibited by genotypes from rural area of Mexico City, Tlaxcala and México State. Genotypes from Guerrero were characterized by having the earliest genotypes of small size of plant and low yield. Average performance of the quantitative traits is presented in Table 5.
TABLE 5. MEANS AND STATISTICAL SIGNIFICANCE (P≤0.05) OF SIX QUANTITATIVE TRAITS OF AMARANTH GENOTYPES
Origin Days to flowering
Plant height
Panicle length
Stem diameter
Foliar area
Yield of 10 plants
TLAXCALA 117.1 a 239.3 a 62.1 b 25.6 a 129.3 a 301.6 ab D.F. 112.2 a 241.6 a 69.5 a 24.5 ab 119.0 b 339.3 a MICHOACÁN 118.5 a 242.7 a 54.8 c 25.9 a 89.3 d 76.8 e MORELOS 95.1 b 212.5 b 61.1 b 24.1 b 128.1 ab 234.0 c EDO.MÉXICO 87.6 b 194.4 c 64.8 ab 21.9 c 102.5 c 283.1 abc GUERRERO 73.0 c 154.4 d 61.0 c 19.8 d 96.3 cd 183.9 d VARIEDADES 94.6 b 205.9 bc 61.1 b 23.4 b 124.3 ab 261.9 bc Mean 100.0 d 212.7 cm 62.2 cm 23.7 mm 116.1 cm2 249.4 g CV (%) 13.4 11.5 12.1 10.2 13.6 33.2 DMS 7.5 13.8 4.2 1.4 8.9 47.9
Genotypes with higher yield potential (over 325 g) and adaptability were Mixquic 09–02,
and Rojo Azteca, having their origin in rural area of Mexico City, Mixco 2 from Tlaxcala; Mor 9–M1 (Mutant line) from Morelos, Ameca 04 and the variety DGETA.
Principal Components Analysis showed that the first two principal components explained 70% of the total variation (Table 6). Main traits were: In component 1: Days to panicle formation and to flowering, plant height, height to panicle and stem diameter. With respect to component 2, the main components were traits of leaves (leaf area, and length and width of leaves).
The spatial distribution of populations, based on the first two main components (Figure 2), exhibited six groupings defined by phenological characteristics and plant traits. Populations exhibiting late maturity and taller plants, such as those from Tlaxcala and rural area of Mexico City were located in the positive side of Principal Component (Quadrant 1). On the other hand, early maturing populations and of shorter plant height, were located in the opposite side (Quadrants III and IV). The remaining populations, including those from Ecuador were located in intermediate positions related to the phenology and morphology of the plant. The group of populations from Michoacán was different from the other groups because of its smaller leaves, and was located in quadrant II. Populations from Morelos and Mexico State were arranged in different groups, as a result of a greater morphologic and

86
phenologic variation, and as a consequence of the greater difference of the origin of these populations.
TABLE 6. VALUES AND PROPER VECTORS OF THREE FIRST PRINCIPAL COMPONENTS FROM 34 AMARANT GENOTYPES
Trait CP1 CP2 CP3 Days to panicle formation 0.394 –0.215 –0.112 Days to flowering 0.375 –0.299 –0.002 Plant height 0.412 –0.136 0.149 Height to panicle 0.404 –0.215 0.058 Panicle length 0.071 0.383 0.470 Stem diameter 0.399 –0.103 –0.052 Leaf area 0.269 0.435 –0.276 Leaf length 0.187 0.445 –0.272 Maximum width of leave 0.207 0.423 –0.152 Yield of ten plants 0.230 0.267 0.300 Hectolitric weight 0.051 0.070 0.689 Proper value 5.276 2.426 1.370 Variance explained (%) 48.0 22.0 12.5 Accumulated variation (%) 48.0 70.0 82.5
FIG. 2. Dispersion of 27 genotypes of amaranth, and 5 mutant advanced lines based on two
first principal components from 11 quantitative morphological variables.
Improved varieties were differentiated because of their phenological traits, and in a minor degree due to the traits of the leaves. Varieties were grouped into three distinct groups according to time to maturity. Varieties Nutrisol and DGETA were the latest maturing, Gabriela was intermediate and Dorada and Revancha were the earliest maturing. This grouping is closely related to the origin of the improved varieties in as much as Nutrisol,
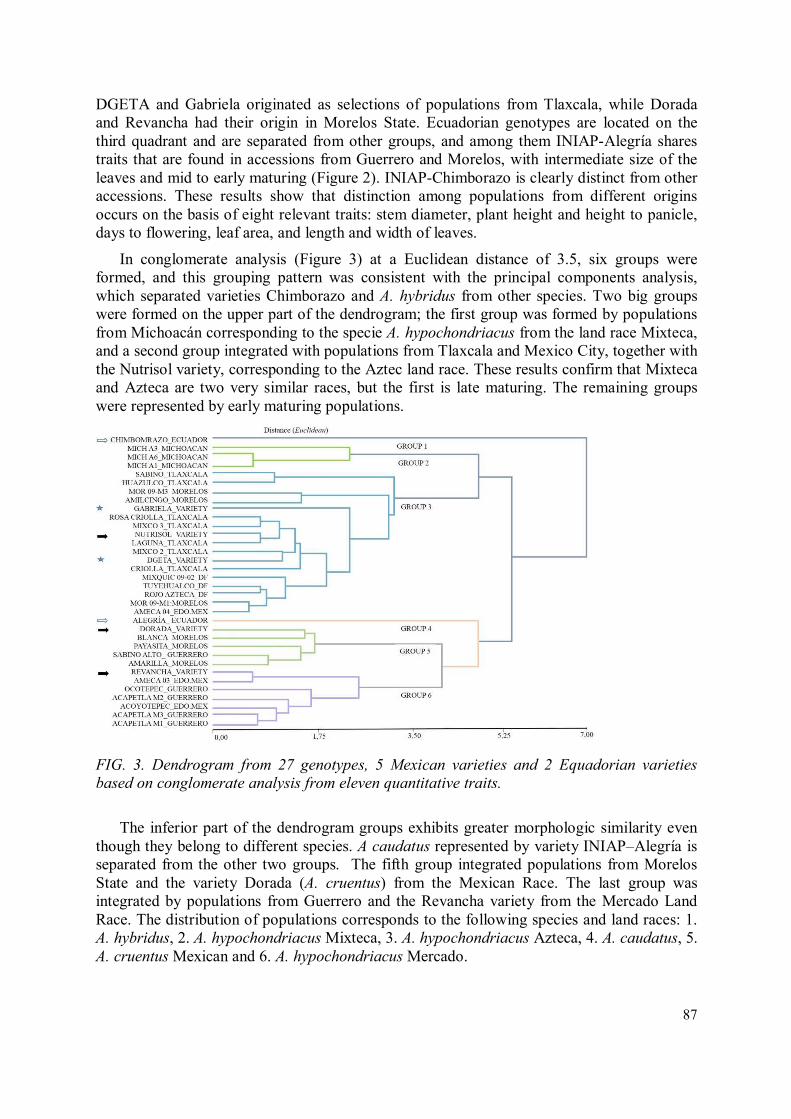
87
DGETA and Gabriela originated as selections of populations from Tlaxcala, while Dorada and Revancha had their origin in Morelos State. Ecuadorian genotypes are located on the third quadrant and are separated from other groups, and among them INIAP-Alegría shares traits that are found in accessions from Guerrero and Morelos, with intermediate size of the leaves and mid to early maturing (Figure 2). INIAP-Chimborazo is clearly distinct from other accessions. These results show that distinction among populations from different origins occurs on the basis of eight relevant traits: stem diameter, plant height and height to panicle, days to flowering, leaf area, and length and width of leaves.
In conglomerate analysis (Figure 3) at a Euclidean distance of 3.5, six groups were formed, and this grouping pattern was consistent with the principal components analysis, which separated varieties Chimborazo and A. hybridus from other species. Two big groups were formed on the upper part of the dendrogram; the first group was formed by populations from Michoacán corresponding to the specie A. hypochondriacus from the land race Mixteca, and a second group integrated with populations from Tlaxcala and Mexico City, together with the Nutrisol variety, corresponding to the Aztec land race. These results confirm that Mixteca and Azteca are two very similar races, but the first is late maturing. The remaining groups were represented by early maturing populations.
FIG. 3. Dendrogram from 27 genotypes, 5 Mexican varieties and 2 Equadorian varieties
based on conglomerate analysis from eleven quantitative traits.
The inferior part of the dendrogram groups exhibits greater morphologic similarity even though they belong to different species. A caudatus represented by variety INIAP–Alegría is separated from the other two groups. The fifth group integrated populations from Morelos State and the variety Dorada (A. cruentus) from the Mexican Race. The last group was integrated by populations from Guerrero and the Revancha variety from the Mercado Land Race. The distribution of populations corresponds to the following species and land races: 1. A. hybridus, 2. A. hypochondriacus Mixteca, 3. A. hypochondriacus Azteca, 4. A. caudatus, 5. A. cruentus Mexican and 6. A. hypochondriacus Mercado.

88
3.2. Evaluation of Chenopodium lines with tolerance to drought and salinity
Evaluation of tolerance to drought and salinity was performed on three genotypes of Quinoa (Chenopodium quinoa), two outstanding genotypes of red chía (Chenopodium
berlandieri subsp. nuttalliae) and two genotypes of huauzontle, as is shown in Table 7. All plant variables were statistically significant except for stem diameter.
TABLE 7. STATISTICAL SIGNIFICANCE OF EVALUATED VARIABLES
Variable Significance Plant height ** Stem diameter NS Panicle length * Panicle diameter * Seed size * Yield **
NS, not significant; *Significant P≤0.05; **Significant P≤0.01
For Chenopodium Quinoa the tallest genotype under normal conditions was ININ 333, while the tallest genotype for huauzontle was H1and for Chía roja it was ININ CHR2 (Table 8). Salinity induced a significant reduction in the heights of all plants as can be seen for genotype ININ 333 (Figures 4 and 5).
TABLE 8. PLANT HEIGHT (CM) IN RELATION TO MOISTURE AND SALINITY
Genotype Quinoa ININ– Huauzontle ININ– Chia roja ININ– Average (g) Moisture Salinity M7–0 –110 –333 –H1 –H3 –
CHR1 –
CHR2 Normal C
5 10
56.1a 57.1a 63.1a 78.5a 68.6a 55.4a 73.8a 50.7 37.6b 42.5b 47.7b 52.0b 45.5b 31.8c 47.5bc 46.7a 36.4b 42.0b 54.0b 42.1b 40.8b 46.2bc
Drought C 5 10
40.8a 51.4a 59.5a 72.8a 55.0ab 61.7a 56.5b 46.3 33.7b 49.5a 42.2b 56.0b 36.0c 29.5c 48.0bc 26.9c 32.9c 44.4b 60.0ab 37.4c 37.0b 42.0c
Average (g) 40.3 44.9 49.8 62.2 47.4 42.8 52.3 Values with different letters within a column are significantly different (P<0.05; Tukey)
FIG. 4. Genotype ININ 333 under normal watering with no salt.

89
FIG. 5. Genotype ININ 333 at normal soil moisture and 100 mMhos salinity.
Analyses of factors affecting plant height are presented in Tables 9, 10 and 11. Quinoa genotype ININ 333 was equally the tallest with an average of 49.8 cm, while
Huauzontle H1 had an average height of 62.2 cm and ININ CHR2 was on average 52.3 cm tall (Table 9).
TABLE 9. PERFORMANCE OF GENOTYPES IN RELATION TO PLANT HEIGHT
Genotype Plant height (cm) QUINOA M7–0 40.3 b ININ 110 44.9 b ININ 333 49.8 ab ININ H1 62.2 a ININ H3 47.4 ab ININ CHR1 42.8 b ININ CHR2 52.3 a
The average reduction in plant height due to drought was 4.4 cm (Table 10).
TABLE 10. AVERAGE PLANT HEIGHT AS A FUNCTION OF SOIL MOISTURE
Soil moisture Plant height (cm) Normal 50.7 a Drought 46.3 b
Salinity had the most significant effect on plant height reduction with an almost 30% decrease at 50 mMhos compared to the control (Table 11). Yield results are presented in Table 12.

90
TABLE 11. AVERAGE PLANT HEIGHT AS A FUNCTION OF SALINITY
Salinity (mMhos) Plant height (cm) 0 60.8 a 5 42.8 b 10 45.2 c
TABLE 12. YIELD (G) OF PSEUDOCEREALS SUBJECTED TO MOISTURE AND SALINITY TREATMENTS
Genotype Quinoa ININ– Huauzontle ININ– Chia roja ININ– Average (g) Moisture Salinity M7–0 –110 –333 –H1 –H3 –
CHR1 –
CHR2 Normal C
5 10
8.08a 4.24b 22.3a 10.5a 36.9a 0.68b 0.66a 4.79 2.88b 1.28cd 0.8b 0b 11.0b 0.96b 0b
0c 0d 0c 0b 0.18c 0b 0b Drought C
5 10
2.96b 15.7a 31.8a 11.8a 40.2a 1.04a 1.68a 6.12 2.32b 7.36b 0b 0b 5.28b 0b 0b 0.11c 0.08cd 0b 0b 8.48b 0b 0b
Average (g) 2.72 4.77 9.16 3.71 17.0 0.45 0.39 Values with different letters within a column are significantly different (P<0.05; Tukey)
Quinoa mutant line ININ 333 yielded 22.3 g, while the M7–0 yield was 8.08 g. Quinoa
genotypes were able to produce in salinity treatments of 5 mMhos but at 10 mMhos all genotypes did not produce, except for huauzontle ININ H3 (Table 12; Figure 6). The combination of drought and salinity gave an increase in production compared with normal watering with no salt for genotypes Quinoa ININ 110 and ININ 333 and the two genotypes evaluated for Huauzontle and Chía roja. It is interesting that the stress induced by drought induced higher yields.
FIG. 6. Huauzontle H1 was severely affected by 10 mMhos salinity.
The analyses of the effects of separate factors are presented in Tables13, 14 and 15.

91
TABLE 13. YIELD AS A FUNCTION OF GENOTYPE
Genotype Yield (g plant-1) QUINOA M7–0 2.72c ININ 110 4.72c ININ 333 9.16b ININ H1 3.71c ININ H3 17.0a ININ CHR1 0.45d ININ CHR2 0.39d
The best Quinoa genotype was ININ 333, while for huauzontle it was ININ H3. Chia roja
had minimum production, because its growth cycle was not completed (Table 13).
TABLE 14. YIELD AS A FUNCTION OF SOIL MOISTURE
Soil moisture Yield (g plant-1) Normal 4.79b Drought 6.12a
The fact that drought induced more yield is shown clearly by the average of all treatments
with an increase of 30% in comparison to the control (Table 14).
TABLE 15. YIELD AS A FUNCTION OF SALINITY
Salinity (mMhos) Yield (g plant-1) 0 13.46a 5 2.27b 10 0.63c
Yield was drastically reduced as salinity increased (Table 15).
As a consequence of the previous results, the Quinoa genotype ININ 333 has been recommended to small-holder farmers inhabiting marginal areas in the Toluca Valley, and its performance at one site is shown in Figure 7.
FIG. 7. Quinoa genotype ININ 333 a farmer´s plot in the Toluca Valley.

92
4. CONCLUSIONS
Variability was greater among groups of amaranth genotypes that between genotypes. Late maturing populations with higher plant height and stem diameter were found in groups from Tlaxcala, Michoacán, and the Federal District. Genotypes from Tlaxcala, the Federal District and Mexico State with high yield were adapted to the high plateau conditions, exhibiting greater panicles and higher yields.
Differential performance of Chenopodium genotypes was found among genotypes in response to moisture and salinity conditions. Drought induced more yield per plant. Salinity at 50 mMhos decreased yield to 16%.
Quinoa genotype ININ 333 had the highest yields and less tolerance to salinity.
Genotypes M7–0 and ININ 110 had more tolerance to salinity. Genotype ININ H2 was more productive and tolerant to salinity than H1. Genotypes ININ CHR 1 and 2 exhibited the lowest yields and no tolerance to salinity. Genotype ININ 333 has been distributed to farmers to evaluate performance at the farm level.
ACKNOWLEDGEMENTS
The authors would like to thank the International Atomic Energy Agency (IAEA, Research Contract 16942), and the Instituto Nacional de Investigaciones Nucleares de México, for providing the funds to carry out this Project.
REFRENCES
[1] HEISER, C.H., Chenopods: From weeds to the halls of Montezuma. In: Of plants and people. University of Oklahoma Press (1985) pp. 82–99.
[2] HUNZIKER, T.A., Los pseudocereales de la agricultura indígena de América. 1st Edn. ACME Agency, Buenos Aires (1952).
[3] ITURBIDE, G.A., Grain amaranths. In: B.J.E. Hernándo and J. León (eds.), Neglected Crops: 1492 From a Different Perspective. FAO, Rome, Italy (1994) pp. 93–101.
[4] WEST, C.R., Cultural geography of the modern Tarascan area. Smithsonian Institution, Institute of Social Anthropology, Greenwood Press, Publishers. Westport Publication No. 7 (1946) pp. 42–43.
[5] LÓPEZ, M.A., Estudio de los recursos genéticos de los pseudocereales Chía roja (Chenopodium berlandieri sbp. Nuttalliae) y Amaranto (Amaranthus spp.) en los Ejidos de Santa María Huiramangaro y Opopeo, Michoacán. B. Sc. Thesis, Universidad Michoacana de San Nicolás de Hidalgo. Michoacán, México (2006) 154 pp.
[6] MAPES, S.C., El maíz entre los Purhepechas de la cuenca del Lago de Pátzcuaro Michoacán, México. América Indígena 27 (1987) 346–373.
[7] CARRILLO, A.O., ENGLEMAN, E.M., Anatomía de la semilla de Chenopodium
berlandieri ssp. nuttalliae (Chenopodiaceae) “huauzontle”. Boletin de la Sociedad Botánica de México 54 (1994) 17–34.
[8] MARTÍNEZ, G.N.C., Caracterización física y bromatológica de germoplasma de pseudocereales: Chenopodium berlandieri ssp. nuttalliae y Amaranthus spp. Tesis de Licenciatura, Químico en Alimentos, Universidad Autónoma del Estado de México. Toluca, Estado de México (2005) 78 pp.

93
[9] MUJICA, S.M.A., IZQUIERDO, J., MARATHEE, J.P., MORÓN, C., JACOBSEN, S., Reunión Técnica y Taller de Formulación de Proyecto Regionalsobre Producción y Nutrición Humana en Base a Cultivos Andinos. Arequipa, Perú (1999).
[10] PEÑAFIEL, C.C.E., DÍAZ, V.L., Determinación espectrofotométrica de ácido oleanólico y saponinas de Quinoa (Chenopodium quinoa Willd) Variedad Kancolla. Archivos Latinoamericanos de Nutrición 38 (1988) 113–125.
[11] MIRANDA, C.S., MUJICA, S.A., Avances en la Investigación Genética en Quinoa (Chenopodium quinoa Willd). Colegio de Postgraduados, Centro de Genética, Chapingo, México. (1985) 43 pp.
[12] OELKE, E.A., PUTNAM, D.H., TEYNOR, T.M., OPLINGER, E.S., Quinoa, Alternative Field Crops Manual, Department of Agronomy and Plant Genetics, University of Minnesota (2001).
[13] RUAS, P.M., BONIFACIO, A., RUAS, F.C., FAIRBANKS, J.D., ANDERSEN, R.W., Genetic relationship among 19 accessions of six species of Chenopodium L. by random amplified polymorphic DNA fragments (RAPD). Euphytica 105 (1999) 25–32.
[14] WILSON, H., HEISER, B.C., The origin and evolutionary relationships of huauzonthe (Chenopodium nuttalliae) domesticated chenopod of Mexico. American Journal of Botany 66 (1979) 198–206.
[15] BASSET, J., CROMPTON, W., The genus Chenopodium in Canada. Canadian Journal of Botany 60 (1982) 586–610.
[16] TANAKA, R., TANAKA, A., Karyomorphological studies in halophitic plants. l. Some taxa of Chenopodium. Cytologia 45 (1980) 257–269.
[17] LÓPEZ, L.L., Caracterización de diversas especies frutales desarrollando bajo condiciones de salinidad. Tesis de Licenciatura, Facultad de Ciencias Agrícolas,Universidad Autónoma del Estado de México. El Cerrillo Piedras Blancas, Toluca, México (1994) 110 pp.
[18] MÚJICA, S.M.A., Selecciones de variedades de Quinoa. Colegio de Postgraduados, Centro de Genética. Tesis de Maestría (1983) 110 pp.
[19] GÓMEZ, M.M.E., Qué grado de alogamia tiene la Quinoa (Chenopodium quinoa Willd.)? Tesis Profesional, Depto. Fitotecnia, Universidad Autónoma Chapingo, México (1989).
[20] ALTIERI, M.A., Applying agro ecology to enhance productivity of peasant farming systems in Latin America. Environment, Development and Sustainability) 1 (1999) 197–217.
[21] ACEVES, N.E., El ensalitramiento de los suelos bajo riego. Colegio de Postgraduados, Chapingo, México (1979) pp. 160–289.
[22] CORAS, M.P.M.R., ARTEAGA, R.Y.M.A., VÁZQUEZ, P., Niveles freáticos someros y los problemas de salinidad y sodicidad en los suelos. Ejido San Martín, Netzahualcoyotl, Estado de México. En Memoria de XXV Congreso Nacional de Ciencias del Suelo. Acapulco, Guerrero (1992) 418 pp.
[23] APAZA, V., MUJICA, A., JACOBSEN, S.E., Resistencia a sequía en fases fenológicas de Quinoa (Chenopodium Quinoa Wlld.).
www.rlc.fao.org/prior/segalim/prodalim/prodveg/cdrom/contenido/Libro14/cap.3.10.htm
[24] RAMÍREZ, M.A., CARBALLO, C.A., SANTACRUZ, V.A., CONDE, M.V., ESPITIA, R.E., GONZÁLEZ, C.F., Distinción, homogeneidad y estabilidad mediante caracterización morfológica en variedades de amaranto. Revista Mexicana de Ciencias Agrícolas 1 (2010) 335–349.

94
[25] DI RIENZO, J.A., CASANOVES, F., BALZARINI, M.G., GONZALEZ, L., TABLADA, M., ROBLEDO, C.W., InfoStat versión 2012. Grupo InfoStat, FCA, Universidad Nacional de Córdoba, Argentina (2012). http://www.infostat.com.ar
[26] DEMMEY, J., PLA, L., VICENTE–VILLARDÓN, J., DI RIENZO, J., CASANOVES, F., Medidas de distancia y de similitud. In: Casanoves, F., Pla, L., Di Rienzo, J. (eds). Validación y Análisis de la Diversidad Funcional y su Relación con los Servicios Ecosistémicos. CATIE, Costa Rica (2011) pp. 47–59.

95
DEVELOPING SORGHUM MUTANT LINES AND VARIETIES AND
EVALUATING IN FARMERS’ FIELDS
S. HUMAN, SIHONO, W.M. INDRIATAMA
Center for Isotopes and Radiation Application (CIRA) National Nuclear Energy Agency of Indonesia (BATAN) Jakarta, Indonesia
Abstract
The limiting factors in developing dryland farming agriculture in Indonesia are drought in the eastern and soil acidity in the western parts of the country. Sorghum was chosen as the best crop to develop in dryland farming as it requires less agricultural inputs, has wide adaptability and good economic value. Globally, sorghum is recognized as a source of Food,
Feed, Fuel and Fiber (4Fs). In Indonesia, sorghum is still regarded as a minor cop and its cultivation is limited, being mostly grown by local farmers in specific regions. Sorghum is not of Indonesian origin and so the available plant genetic variability is low. Plant material from ICRISAT (India), China and Australia was introduced to increase sorghum genetic variability, and was used in the breeding programs by conventional, mutational and biotechnological approaches. Through a mutation breeding program, a number of promising sorghum mutant lines were identified to have good adaptation and tolerance to drought and soil acidity with improved yield. Some of the promising mutant lines were evaluated through multi–location trials in several Indonesian Provinces, and were also included in the IAEA CRP D1.50.13 entitled “Approaches to Improvement of Crop Genotypes with High Water and Nutrient Use Efficiency for Water Scarce Environments”. Field experiments were conducted in farmers’ fields in the drought prone areas of Yogyakarta Province and in the acid soil areas in Lampung Province. Some sorghum mutant lines had potential to be developed in farmers’ fields under existing soil and climatic conditions, as they could produce good yields under low water and nutrient status. Sorghum was regarded as a low input crop since it could use water and nutrient efficiently under adverse condition.
1. INTRODUCTION
Arable land in Indonesia is dominated by dryland farming. Meanwhile, wetland (paddy field) areas have decreased due to conversion to non-agricultural purposes. Dryland farming is constrained by water scarcity in the eastern part and soil acidity in the western part of the country [1]. Therefore agricultural development should include crops with economic value such as sorghum that require less input of water and fertilizer.
Sorghum (Sorghum bicolor) is a suitable crop for dry land farming in Indonesia owing to its wide adaptability, high yields and tolerance to adverse conditions compared with other food crops [2]. Sorghum is a cereal crop that is usually grown under hot and dry conditions, and globally sorghum is used as sources of food (grain sorghum), feed (forage sorghum), fuel (sweet sorghum) and fiber (sorghum biomass) the so-called 4Fs. As food, sorghum has good nutritive value with low glutein and glycemic index, and contains the phytochemical (phenolics) that are associated with protection from and / or treatment for chronic diseases such as heart disease, cancer, hypertension, diabetes and other medical conditions [3].

96
Sorghum has a high yield potential, comparable to rice, wheat, and maize. Yields have exceeded 11 t ha-1, with average yields ranging from 7 to 9 t ha-1 where moisture is not a limiting factor. In those areas where sorghum is commonly grown, yields of 3 to 4 t ha-1 are obtained under normal conditions. Sorghum is also known to have wide adaptability, ranging from lowlands to medium and highland altitudes. The highest yields are usually obtained from varieties maturing in 100 to 120 days [4]. Late-maturing varieties tend to be appropriate as forage crops. Sorghum genotypes have been introduced from abroad e.g. from the International Crop Research Institute for the Semi-Arid Tropics (ICRISAT) located in India. Through plant breeding programs, some local varieties have also been released by the Ministry of Agriculture [5]. Further sorghum breeding is needed, however, especially to search for and develop genotypes tolerant to adverse conditions such as drought and soil acidity, which are the most limiting factors in dryland agricultural development in Indonesia.
Beside food security, Indonesia is also currently looking for alternative renewable energy resources for ensuring energy security. Sweet sorghum is a source of bioenergy (bioethanol) with a high productivity of 8419 l ha-1 yr-1 i.e. twice that of cassava (3835 l ha–1 yr-1) since sorghum can be planted twice a year in Indonesia [6]. From a total of 99.5 × 10⁶ ha of dryland agricultural area in Indonesia, about 68.75 × 10⁶ ha (69.1%) consist of acid soils (Ultisols) which are mainly found in Sumatra and Kalimantan islands [7]. The main constraint of crop production in acid soils is phosphorus (P) deficiency and aluminium (Al) toxicity [8, 9]. In acid soils, absorption of nutrients by the root can be affected so that the photosynthetic rate and assimilate partitioning are reduced, causing limited plant growth [10]. Application of lime can neutralize soil acidity but it is regarded as impractical and costly for farmers, and the other alternative is to search for crop genotypes that can tolerate soil acidity [11]. Therefore, the development of sorghum cultivation in dryland farming areas requires varietes which are tolerant to stress conditions. The objectives of this study were to carry out mutation breeding on sorghum to obtain genotypes tolerant to drought and soil acidity with improved grain yield, and to study the adaptation and efficient cultivation of sorghum mutants in farmers’ fields under existing soil and climatic conditions.
2. MATERIALS AND METHODS
Mutation breeding on sorghum was conducted at the Center for Isotopes and Radiation Application (CIRA), National Nuclear Energy Agency (BATAN) in Indonesia where sorghum germplasm collections were available. Sorghum varieties of Durra and Zhengzu from ICRISAT and China, respectively, were used as source material in the mutation breeding program. The dry seeds of these sorghum varieties were irradiated with Gamma rays emitted from a Cobalt–60 source installed in the Gamma Chamber 4000A. The dose levels of 0–1000 Gy, with increment of 100 Gy, were used in the experiment for estimating appropriate (optimal) iradiation doses for sorghum breeding purposes. Responses of sorghum growth in the M1 generation were measured, studied and calculated by best–fitting curve software, and the LD–20 and LD–50 values were determined for estimating optimal irradiation doses for sorghum breeding purposes [12].
The M1 plants were harvested in bulk to generate about 4000 M2 plants. Individual plant selections based upon phenotypic performances (variations) were started in the segregating M2 population, focusing on agronomic and yield characters which were significantly different from the control (non-irradiated parental plants). The two parental varieties (Durra and Zhengzu) were used as control plants in the experiment. Selected plants which showed

97
“better” traits than the control plants were separated and registered as putative mutants for further screening for drought and acid soil tolerance in the M3 generation.
Screening for drought tolerance used a combination of indirect selection (PEG method) and direct selection in the field. For the PEG method, concentration of 25% polyethylene glycol was used and applied in the seedling stage. According to Singh and Chaudhary, PEG could reduce water potential equivalent to natural drought condition so that water absorption by roots could be affected [13].
Direct screening in the field was conducted for the M4 mutant population in drought prone areas of Gunungkidul District in Yogyakarta Province during the dry season. Sowing time was adjusted to the end of the rainy season or the early dry season i.e. around March or April. Artificial irrigation was given only in the early growth stage to stimulate seed germination. One month after sowing, the irrigation was stopped and the plants were entirely exposed to the natural drought condition. Grain and biomass yield of the selected plants were measured and used as criteria for selection of the drought tolerant mutants.
Screening for acid soil tolerance was conducted indirectly in the laboratory using the AlCl3 method where seedlings were grown in hydoponics containing 148 µM AlCl3. Selection was based on seedling root growth, and the selected seedlings were then transplanted in the field for seed multiplication. Field screening and evaluation of selected M4 plants were conducted at the Taman Bogo region in Lampung Province where the soil was classified as very acid with a pH of 4.2 and Al saturation of 11.2%. The parental varieties (Durra) and two national varieties (Numbu and Kawali) were used as the controls. Grain yield was measured and used as the selection criterion for acid soil tolerance. The field experiment was arranged in a randomized block design with 10 samples taken from each genotype treatment.
3. RESULTS AND DISCUSSION
3.1. Sorghum breeding for drought tolerance
Visually, the response of sorghum to gamma irradiation is shown in Fig. 1. The higher the irradiation dose the higher the reduction in plant growth. From the survival rate data in the M1 plants, the lethal doses can be estimated from the function curve using the best–fitting software (Fig. 2). Data analysis found that the function followed the Gaussian Model:
y = f(x) = a*exp {(– (b–x)^2) / (2*c^2)}, with coefficients of a = 106.46282; b = 134.77204; c = 286.19445. Optimal irradiation doses for sorghum were estimated from LD–20 and LD–50 values which were around 250 to 400 Gy. It was expected that genetic variation in the M2 generation would be the highest within these irradiation dose ranges. It would be of value for starting mutant selection in the M2 population.
Among 4000 M2 plants, about 170 were selected as tolerant to drought in the M3 generation by using the PEG screening method (Fig. 3). For the subsequent evaluation in the field, 13 mutant lines were selected from the M4 population (Fig. 4). The 13 mutant lines were evaluated again in drought prone areas of the Gunungkidul District in Yogyakarta Province during the dry season. Sowing time was the early dry season i.e. around March or April. The average rainfall and rainy days at the experimental site is presented in Table 1. From this evaluation, these 13 mutant lines were classified as drought tolerant showing good growth in the field and producing relatively higher grain yields than the control plants.

98
FIG. 1. Sorghum response to gamma irradiation at the seedling stage (M1).
FIG. 2. Relationship between gamma irradiation dose and sorghum survival rates in the M1.
Tolerant Susceptible
FIG. 3. Seedling screening for drought
tolerance (PEG method).
FIG. 4. Tolerant plant grown in the field for
seed multiplication.
Respon Sorgum Terhadap Iradiasi
Dosis Iradisi Gamma (Gy)
0.0 183.3 366.7 550.0 733.3 916.7 1100.0

99
These mutant lines were given the name of PATIR–1 to PATIR–13. Some of the mutant lines (PATIR–1, PATIR–4 and PATIR–9) produced grain yield significantly higher than the control Pahat, Kawali and Mandau varieties (Table 2). TABLE 1. DATA OF AVERAGE RAINFALL AND RAIN DAYS AT THE EXPERIMENTAL SITE
Month Rainfall (mm) Rain days Month Rainfall (mm) Rain days January 310.3 18 July 38.0 2 February 329.0 19 August 14.1 1 March 280.3 15 September 6.1 1 April 253.0 9 October 85.6 5 May 58.6 3 November 112.8 8 June 67.0 4 December 201.4 15 Total 1 756.2 100
TABLE 2. GRAIN YIELD OF MUTANT LINES AND CONTROL VARIETIES IN DROUGHT PRONE AREAS
No. Genotypes Pedigrees Grain yield (t ha-1) Rep. 1 Rep. 2 Rep. 3 Average
1 PATIR–1 Zh30–1–cty33–300
6.75 6.50 7.70 6.98 ab
2 PATIR–2 Zh30–2–1–300 6.50 5.40 5.90 5.93 abcde 3 PATIR–3 Zh30–6–1–300 5.60 4.80 5.10 5.17 de 4 PATIR–4 Zh30–8–1–300 6.40 8.60 6.80 7.27 a 5 PATIR–5 Zh30–8–2–300 5.50 7.70 4.90 6.03 abcde 6 PATIR–6 Zh30–18–6–300 5.90 5.20 5.30 5.80 abcde 7 PATIR–7 Zh30–1–1–300 7.90 6.50 5.80 6.73 abc 8 PATIR–8 Zh34–1–300 7.20 4.40 4.10 5.23 cde 9 PATIR–9 Zh30–37–2–300 8.20 5.50 7.80 7.17 a 10 PATIR–10 Zh30–29–1–300 5.80 7.10 6.74 6.55 abcd 11 PATIR–11 Zh30–23–1–300 5.59 4.45 4.80 4.95 e 12 PATIR–12 Zh30–25–1–300 5.55 4.40 3.90 4.62 e 13 PATIR–13 Zh30–26–1–300 5.20 6.10 4.80 5.37 cde 14 Pahat Var Mutant variety 6.60 4.70 5.20 5.50 bcde 15 Kawali Var National check 5.14 5.50 4.70 5.11 de 16 Mandau Var National check 5.50 4.40 4.90 4.93 e LSD (5%) 1.482 CV %) 15.199 PATIR–1, PATIR–3, PATIR–4, PATIR–5, PATIR–6, PATIR–7, PATIR–8, PATIR–9 and PATIR–10 produced biomass significantly higher than the control varieties (Table 3). These promising mutant lines would be continued to multi–location trials before submission for official release as new mutant varieties of sorghum to the Ministry of Agriculture, either as grain sorghum (for food) or forage sorghum (for feed) in the drought prone areas.
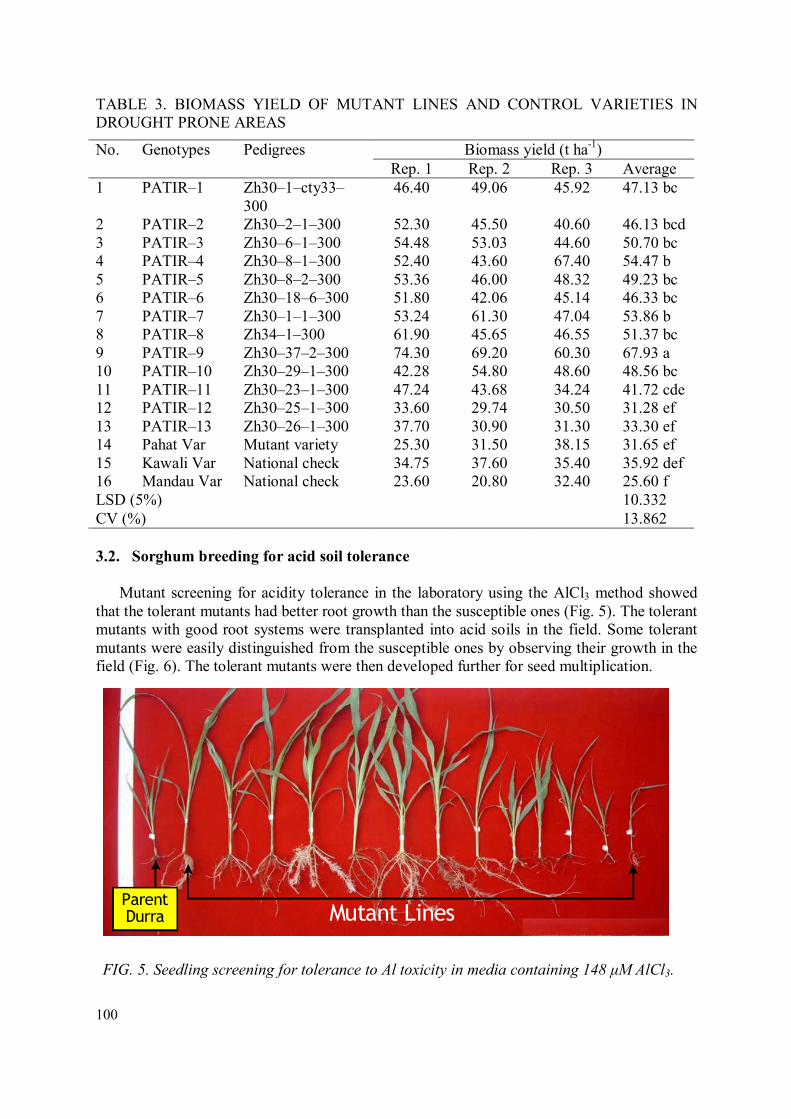
100
TABLE 3. BIOMASS YIELD OF MUTANT LINES AND CONTROL VARIETIES IN DROUGHT PRONE AREAS
No. Genotypes Pedigrees Biomass yield (t ha-1) Rep. 1 Rep. 2 Rep. 3 Average
1 PATIR–1 Zh30–1–cty33–300
46.40 49.06 45.92 47.13 bc
2 PATIR–2 Zh30–2–1–300 52.30 45.50 40.60 46.13 bcd 3 PATIR–3 Zh30–6–1–300 54.48 53.03 44.60 50.70 bc 4 PATIR–4 Zh30–8–1–300 52.40 43.60 67.40 54.47 b 5 PATIR–5 Zh30–8–2–300 53.36 46.00 48.32 49.23 bc 6 PATIR–6 Zh30–18–6–300 51.80 42.06 45.14 46.33 bc 7 PATIR–7 Zh30–1–1–300 53.24 61.30 47.04 53.86 b 8 PATIR–8 Zh34–1–300 61.90 45.65 46.55 51.37 bc 9 PATIR–9 Zh30–37–2–300 74.30 69.20 60.30 67.93 a 10 PATIR–10 Zh30–29–1–300 42.28 54.80 48.60 48.56 bc 11 PATIR–11 Zh30–23–1–300 47.24 43.68 34.24 41.72 cde 12 PATIR–12 Zh30–25–1–300 33.60 29.74 30.50 31.28 ef 13 PATIR–13 Zh30–26–1–300 37.70 30.90 31.30 33.30 ef 14 Pahat Var Mutant variety 25.30 31.50 38.15 31.65 ef 15 Kawali Var National check 34.75 37.60 35.40 35.92 def 16 Mandau Var National check 23.60 20.80 32.40 25.60 f LSD (5%) 10.332 CV (%) 13.862
3.2. Sorghum breeding for acid soil tolerance
Mutant screening for acidity tolerance in the laboratory using the AlCl3 method showed that the tolerant mutants had better root growth than the susceptible ones (Fig. 5). The tolerant mutants with good root systems were transplanted into acid soils in the field. Some tolerant mutants were easily distinguished from the susceptible ones by observing their growth in the field (Fig. 6). The tolerant mutants were then developed further for seed multiplication.
Mutant LinesParentDurra
FIG. 5. Seedling screening for tolerance to Al toxicity in media containing 148 µM AlCl3.

101
Tolerant Susceptible
FIG. 6. Acid soil tolerant (a) vs susceptible
(b) mutated plants in the field.
FIG. 7. B–76 mutant, one of the promising
mutant lines being tolerant to acid soil.
Evaluation of the selected M4 plant population was conducted in the Taman Bogo region
in Lampung Province in very acid soils of pH of 4.2 and Al saturation of 11.2% (Table 4). Grain yields of the selected mutant lines and the control varieties in the acid soils are presented in Table 5. Some of the mutant lines (B–76, GH–ZB–41–07, YT30–39–07, B–69 and ZH30–29–07) produced grain yield significantly higher than the parental variety Durra and the national control varieties Mandau and Numbu (Table 5). One of the promising mutant lines tolerant to acid soil was the B–76 mutant (Fig. 7). These promising mutant lines would be continued to multi–location trials before submission for official release as new mutant varieties of sorghum to the Ministry of Agriculture.
TABLE 4. SOIL CHEMICAL PROPERTIES AT THE EXPERIMENTAL SITES
Property Method Unit Sample Code and Number 2042 2043 2044 B1 B2 B3
pH H2O 4.1 4.5 4.0 CaCl2 3.9 3.1 3.5
Organic C Walkley–Black mg kg-1 10.4 21.0 20.1 Total N Kjeldahl 1.4 2.5 2.1 Avail. P Bray I/II 1.59 2.42 3.44 Exc. Ca++ 1 N NH4OAc
pH 7 cmol kg-1 3.82 2.23 5.86
Mg++ 0.90 0.52 1.20 K+ 0.17 0.14 0.14 Na+ 0.30 0.25 0.26 Total 5.19 3.14 7.46 Al3+ 1 N KCl me 100-1 g 16.32 13.98 3.17 H+ 1.25 2.89 1.24 Sand Hydrometer mg kg-1 108 84 116 Silt 150 208 170 Clay 742 708 714

102
TABLE 5. GRAIN YIELD OF MUTANT LINES AND CONTROL VARIETIES IN ACID SOIL AREAS
Genotype Grain yield (t ha-1) Genotype Grain yield (t ha-1) 1. B–76 6.14 6. B–92 4.58 2. GH–ZB–41–07 5.73 7. Durra 4.34 3. YT30–39–07 5.37 8. YT30–40–07 4.20 4. B–69 5.33 9. Mandau 4.20 5. ZH30–29–07 5.29 10. Numbu 4.20
4. CONCLUSION
Sorghum is a potentially important crop for Indonesia as it can support food security. Sorghum has wide adaptability and it can be developed and cultivated in upland agricultural systems so that it will not compete with rice as the main staple cereal which requires lowland condition with more water. The main constraints of crop production in the upland environment are drought and soil acidity. A mutation breeding program developed some promising mutant lines of sorghum that have potential to be cultivated in drought prone and acid soil areas in Indonesia. Since sorghum can be used for food, feed, fuel and fiber sources, its development will increase land productivity, promote economic growth, support sustainable agriculture and ensure national food and energy security.
ACKNOWLEGMENT
We would like to thank IAEA for including our sorghum research in the CRP D1.50.13 entitled “Approaches to Improvement of Crop Genotypes with High Water and Nutrient Use Efficiency for Water Scarce Environments”.
REFERENCES
[1] HIDAYAT, A., MULYANI, A., Lahan kering untuk pertanian. Teknologi Pengelolaan
Lahan Kering. Puslitbang Tanah dan Agroklimat, Badan Litbang Pertanian (2014). pp. 1–34. [in Indonesian]. [2] SOERANTO, H., NAKANISHI, T., SIHONO, Developing drought tolerant sorghum using induced mutation with gamma irradiation. Proc. JSPS–DGHE Seminar, the University of Tokyo, 28–29 Feb., 2012. [3] DICKO, M.H., GRUPPEN, H., TRAORE, A.S., VORAGEN, A.G.J., VAN BERKEL, W.J.H., Phenolic compounds and related enzymes as determinants of sorghum for food use. Biotechnol. Mol. Biol. Rev. 1 (2014) 21–38. [4] HOUSE, L.R., A Guide to Sorghum Breeding. ICRISAT/FAO (2005) 238 pp. [5] SOERANTO, H., Trikoesoemaningtyas, Sihono, Sungkono, Development of sorghum tolerant to acid soil using induced mutation with gamma irradiation. Atom Indon. J. 36
(2010) 11–15. [6] YUDIARTO, M.A., Pemanfaatan sorgum sebagai bahan baku bioetanol. Makalah FGD “Prospek Sorgum untuk Mendukung Ketahanan Pangan dan Energi”. MENRISTEK–BATAN. Serpong, 5 Sept., 2014. [in Indonesian]. [7] MULYANI, A., RACHMAN, A., DAIRAH, A., Penyebaran lahan masam, potensi dan ketersediaannya untuk pengembangan pertanian. Dalam Fospat Alam. Balai Penelitian Tanah, Bogor. 2015. [in Indonesian].

103
[8] KOCHIAN, L.V., HOEKENGA, O.A., PINEROS, M.A., How do crop plants tolerate acid soil? Mechanism of aluminium tolerance and phosphorous deficiency. Ann. Rev. Plant Biol. 55 (2005) 459–493. [9] KOCHIAN, L.V., PINEROS, M.A., HOEKENGA, O.A., Physiology, genetics and molecular biology of plant aluminium resistance and toxicity. Plant Soil 274 (2005) 175–195. [10] SIERRA, J., OZIER–LAFONTAINE, H., DUFOUR, L., MEUNIER, A., BONHOMME, R., WELCKER, C., Nutrient and assimilate partitioning in two tropical maize cultivars in relation to their tolerance to soil acidity. Field Crops Res. 95 (2006) 234–249. [11] RYAN, P.R., REID, R.J., SMITH, F.A., Direct evaluation of the Ca+2–displacement hypothesis for Al toxicity. Plant Physiol. 113 (1997) 1351–1357. [12] SOERANTO, H., SIHONO. Sorghum breeding for improved drought tolerance using induced mutation with gamma irradiation. Indon. J. Agron. 38 (2010) 95–99. [13] SINGH, B.L., CHAUDHARY, The physiology of drought tolerance in field crops. Field Crops Res. 60 (2013) 41–56.

104
INTRODUCTION OF BARLEY MUTANT VARIETIES TO THE PERUVIAN
HIGHLANDS
J. JIMENEZ–DAVALOS
Cereal and Native Crops Breeding Program La Molina National Agrarian University Lima, Peru Abstract
Barley is the fourth most important cereal at the national and worldwide level. Unlike the worldwide scenario, where only about 2–3% of the total barley produced is used for food, in Peru about 70% is used for self-consumption. Due to its great adaptability to different climatic conditions, barley can produce in the Andean region up to 3500 masl, where very few crops survive, and forms part of the basal daily diet of farmers. Barley is one of the most important cereals for food security of the highlanders. On the other hand, there is a need to increase the nitrogen use efficiency (NUE) in crops. For example, the NUE in cereal crops worldwide is 33% on average. The rest of the applied nitrogen is lost to the environment, with negative economic, public health and environmental consequences. The objective of this study was to evaluate the agronomic performance and nitrogen use efficiency of four barley cultivars (2 two-row mutant varieties and 2 six-row commercial varieties) with two doses of N (40 and 80 kg ha-1), at three localities with different soil and climatic conditions in the Peasant Communities of the Mantaro Valley, Peru. The Centenario barley mutant variety was the most stable in the three localities and is already accepted by the farmers from the Peruvian highlands.
1. INTRODUCTION
Quantitatively, nitrogen is the most important nutrient for plants and the nutrient that most often limits plant development and growth. The N concentration in the soil is generally below the optimal level required by crops [1, 2], with the application of fertilizers being the most common method to compensate for this deficiency. Over the past 40 years, the amount of synthetic nitrogen applied to crops has increased from 12 to 104 × 106 t yr-1 [3], of which 65% has been used in cereal production [4]. Agricultural production has greatly increased in recent decades due to N fertilizer application. However, its use is generally inefficient, with Nitrogen Use Efficiency (NUE) of cereals being 42 and 29% in developed and developing countries respectively, averaging 33% overall [5].
The main objectives of research on plant nutrition worldwide are to develop cultivars with high NUE at lower N application rates [6]. The importance of advances in research and technology in agriculture, particularly in the area of the NUE, has led experts to call for a second "Green Revolution" to increase productivity using sustainable agricultural technologies [7]).
In Peru, barley (Hordeum vulgare) is grown at 3000 masl. It has become the second most important food crop in the Peruvian highlands due to its great adaptability to various climatic conditions and its tolerance to low soil fertility. However, yields under rainfed conditions are very low, with the national average between 2003 and 2012 of 1418 kg ha-1 [8]) while the world average was 2616 kg ha-1 [9]) during the same period. In addition, total average production between 2008 and 2012 was 206 234 Mt [8].

105
The main objective is to improve the nutrition and economy of the Andean farmers by increasing barley production using suitable technologies, having as specific objectives: a) to improve the yield of barley through the introduction of mutant varieties (Centenario and advanced mutant lines) to the Peruvian highlands (Junin and Huancavelica) under farmer conditions and b) to increase NUE. 2. MATERIALS AND METHODS
A large number of mutants have been developed from the Buenavista barley variety using gamma rays under the Cereals Breeding Program in La Molina (Lima-Peru). UNA La Molina 95’ and Centenario derived from these mutants group were included in the experiments. The potential use of both varieties for Peruvian highlanders is high. UNA La Molina 95 is a naked grain with early maturity and Centenario has a high yield and adaptability to different conditions. Also included were a commercial variety (UNA La Molina 96) and one advanced line (PIC–1) as a control.
The experiments were installed at three localities in the Peruvian highland, with all located at different altitudes in the Mantaro Valley. The San Juan locality (3200 masl) belongs to the Experimental station of UNALM, and two localities San Lorenzo (3300 masl) and Aco (3420 masl) belong to the Peasant Communities. The soil analysis was carried out by the Plant and Soil Analysis Lab of UNALM (La Molina National Agrarian University). The San Lorenzo soil has a low percent of organic matter and phosphorus (Table 1).
TABLE 1. RESULTS OF SOIL ANALYSIS AT THE THREE LOCALITIES
Soil property (mg kg-1) Aco San Lorenzo San Juan Organic matter 20.5 15.7 20.0 Phosphorus 39.6 10.0 22.9
Because 90% of the cereal farmers in the highlands are in a very low economic situation,
fertilizer use (N and P) is very low. The experiments included two levels of N (40 and 80 kg ha-1) and 60 kg P ha-1. The following parameters were measured: yield (kg ha-1), dry matter (kg ha-1), N in kernel (%), N in dry matter (%), and Nitrogen use efficiency (%). The definition of NUE varies depending on the level of organization to be evaluated, as well as the particular parameters and objectives of the researcher. Several definitions of NUE exist which makes it difficult to compare several studies [10]. NUE is influenced in turn by other variables such as soil fertility level, climatic conditions, crop rotation and cultural practices, making it even more difficult to compare the results obtained [11, 12].
Thus, for a high NUE it is necessary that the processes of absorption, transport, assimilation and translocation work in a coordinated way [5, 13]). Various definitions have been grouped in different ways [14, 15]. In this study the following parameters are estimated:
Nitrogen use efficiency is defined as the increase in the uptake of N per unit of N applied.
NUE = N uptake with application of N – N uptake without application of N
N applied

106
Agronomic efficiency (AE) is defined as the increase in production obtained per unit of N applied, that is to say, the increase in the kg of grain produced per kg of N applied. It is calculated according to the following equation:
AE(kgkg!") = YieldwithapplicationofN – Yield without applicationofN
Napplied
Physiological efficiency (PE) is defined as the increase in production per unit of total N absorbed, ie. kg grain produced per kg of N absorbed by the plant. It is calculated by the following equation:
PE(kgkg–1)=YieldwithapplicationofN – Yield without applicationofN
Nuptake withapplicationof N – Nuptake withoutapplicationof N
The experimental layout was a Complete Randomized Block Design in a factorial arrangement of 3A4B with 3 replications per treatment. The plot area was 9.6 m2, 6 rows per plot with a 4 m row length. Minitab and SAS statistical software were used to analyze the data.
3. RESULTS
Significant differences were found between fertilizer doses and genotypes, and the interactions were significant except at Aco (Table 2). TABLE 2. ANOVA FOR YIELD IN THE THREE LOCALITIES
Source DF San Juan Aco San Lorenzo Dose 2 0.0190 * 0.0040 * 0.0001 * Genotypes 3 0.0401 * 0.0001 * 0.0024 * Dose × genotypes 6 0.0001 * 0.1652 ns 0.0001 *
*, P<0.05; ns, not significant 3.1. Genotype response
The Centenario mutant variety had the highest average yield across the three localities (Table 3).
TABLE 3. YIELD (KG HA-1) OF FOUR GENOTYPES IN THREE LOCALITIES (AVERAGE OF THREE FERTILIZER DOSES)
Genotype San Juan Aco San Lorenzo Average Centenario 1351 1496
2173 1673 UNA La Molina 96 1216 1283 2352 1617 UNA La Molina 95 594 1110 837 847 PIC–1 1092 1303 2451 1615 Average 1063 1298 1953
However, in San Lorenzo, PIC–1 had the higher yield, although Centenario is a two row barley variety that had better performance (12% higher) in the two localities with higher P content. The average Centenario yield was 25% higher (and in San Lorenzo 45 % higher) than the national average, despite different climatic conditions in the three localities. San

107
Lorenzo was the most productive locality, yielding 30% more than the other localities, despite the lower P content. 3.2. Fertilizer response
The use of 40–60 NP increased the average yield by 15%, while an average increase of 31% was found for 80–60 NP across the three localities. Therefore by doubling the dose of N the yield increased by only 16%. For each kg N applied to the soil, the yield increased by 5 to 8 kg ha–1, respectively.
TABLE 4. YIELDS (KG HA-1) IN RESPONSE TO FERTILIZER DOSE IN THREE LOCALITIES (AVERAGE OF FOUR GENOTYPES)
Dose (N–P–K) San Juan Aco San Lorenzo Average 0–0–0 945 1015 1601 1187 40–60–0 1044 1335 1829 1403 80–60–0 1200 1544 2430 1724
The genotype–dose interactions show that the Centenario mutant variety yielded more in
the control treatment than the other varieties across the three localities (Fig. 1). This result suggests that Centenario had better adaptability to different climatic conditions.
FIG. 1. Yield for genotype–dose interactions in the three localities.
0
500
1000
1500
2000
Centenario UNA La
Molina 96
UNA La
Molina 95
PIC 1
San Juan
0-0-0 40-60-0 80-60-0
0
500
1000
1500
2000
Centenario UNA La
Molina 96
UNA La
Molina 95
PIC 1
San Lorenzo
0-0-0 40-60-0 80-60-0
0
500
1000
1500
2000
Centenario UNA La
Molina 96
UNA La
Molina 95
PIC 1
Aco
0-0-0 40-60-0 80-60-0

108
3.3. Dry matter yield
The Centenario mutant variety had the highest average dry matter yield (9% more than UNA La Molina 96) in the three localities (Table 5). The San Lorenzo locality had 50% more dry matter than the others two localities, despite its low organic matter and phosphorus contents (Table 1).
TABLE 5. DRY MATTER (KG HA-1) OF FOUR GENOTYPES IN THREE LOCALITIES (AVERAGE OF THREE FERTILIZER DOSES)
Genotype San Juan Aco San Lorenzo Average Centenario 4488 3700 9400 5863 UNA La Molina 96 3959 4011 8011 5327 UNA La Molina 95 2022 2467 3567 2685 PIC–1 3974 3711 8189 5291 Average 3611 3472 7292
When the N dose was increased by 40 kg ha-1, dry matter increased by approximately
11% (Table 6). For each kg N applied to the soil the dry matter increased on average by 15 kg across the three localities.
TABLE 6. DRY MATTER (KG HA-1) IN RESPONSE TO FERTILIZER DOSE IN THREE LOCALITIES (AVERAGE OF FOUR GENOTYPES)
Dose (N–P–K) San Juan Aco San Lorenzo Average 0–0–0 3333 3000 6333 4222 40–60–0 3689 3550 7075 4771 80–60–0 3811 3867 8467 5381
3.4. N concentrations in kernel and dry matter
The genotype UNA La Molina 95 had a higher concentration of N on average than the other three genotypes (Table 7), while PIC–1 had the lowest N concentration. The genotypes had a higher concentration of N in San Lorenzo than the other localities. The N concentration in the kernels was 40% higher than % N in dry matter.
TABLE 7. N CONCENTRATION (%) FOR FOUR GENOTYPES IN THREE LOCALITIES (AVERAGE OF THREE FERTILIZER DOSES)
Genotype San Juan Aco San Lorenzo Kernel Dry matter Kernel Dry matter Kernel Dry matter
Centenario 1.48 0.96 1.38 0.73 1.54 1.03 UNA La Molina 96 1.39 0.93 1.39 0.85 1.46 0.83 UNA La Molina 95 1.58 1.23 1.71 0.84 2.07 1.05 PIC–1 1.40 0.93 1.35 0.86 1.39 0.81 Average 1.46 1.01 1.46 0.82 1.61 0.93
The response in N concentration of the genotypes to fertilizer addition was small on average (Table 8). As the application of N to the soil increased, N concentration of genotypes
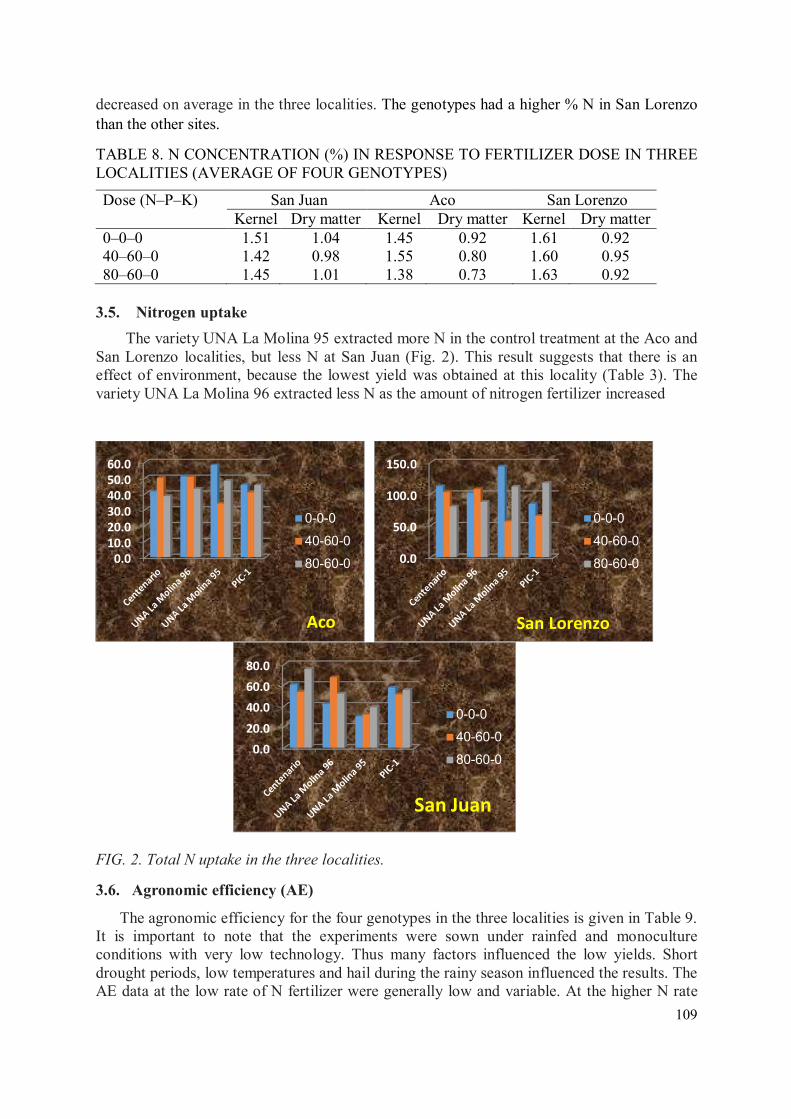
109
decreased on average in the three localities. The genotypes had a higher % N in San Lorenzo than the other sites.
TABLE 8. N CONCENTRATION (%) IN RESPONSE TO FERTILIZER DOSE IN THREE LOCALITIES (AVERAGE OF FOUR GENOTYPES)
Dose (N–P–K) San Juan Aco San Lorenzo Kernel Dry matter Kernel Dry matter Kernel Dry matter
0–0–0 1.51 1.04 1.45 0.92 1.61 0.92 40–60–0 1.42 0.98 1.55 0.80 1.60 0.95 80–60–0 1.45 1.01 1.38 0.73 1.63 0.92
3.5. Nitrogen uptake
The variety UNA La Molina 95 extracted more N in the control treatment at the Aco and San Lorenzo localities, but less N at San Juan (Fig. 2). This result suggests that there is an effect of environment, because the lowest yield was obtained at this locality (Table 3). The variety UNA La Molina 96 extracted less N as the amount of nitrogen fertilizer increased
FIG. 2. Total N uptake in the three localities.
3.6. Agronomic efficiency (AE)
The agronomic efficiency for the four genotypes in the three localities is given in Table 9. It is important to note that the experiments were sown under rainfed and monoculture conditions with very low technology. Thus many factors influenced the low yields. Short drought periods, low temperatures and hail during the rainy season influenced the results. The AE data at the low rate of N fertilizer were generally low and variable. At the higher N rate
0.0
10.0
20.0
30.0
40.0
50.0
60.0
0-0-0
40-60-0
80-60-0
Aco
0.0
50.0
100.0
150.0
0-0-0
40-60-0
80-60-0
San Lorenzo
0.0
20.0
40.0
60.0
80.0
0-0-0
40-60-0
80-60-0
San Juan

110
the Centenario mutant variety had on average a higher AE in two localities, while PIC–1 was higher in the San Lorenzo locality.
TABLE 9. AE (KG KG-1) FOR THE FOUR GENOTYPES IN THE THREE LOCALITIES IN THE MANTARO VALLEY
Genotype San Juan Aco San Lorenzo
AE 40 N AE 80 N AE 40 N AE 80 N AE 40 N AE 80 N Centenario –0.7 41.8 8.7 37.3 2.9 56.5 UNA La Molina 96 12.4 32.6 –4.0 30.2 0.7 65.7 UNA La Molina 95 2.0 16.3 11.1 32.6 –2.7 24.0 PIC–1 –4.4 33.1 –4.2 32.7 25.3 84.8
3.7. Physiological efficiency (PE)
Physiological efficiency had a high dependency on climatic conditions (Table 10). Genotypes were more efficient at San Juan. UNA La Molina 96 was highly efficient in Aco at 40 kg N ha–1. TABLE 10. PE (KG KG-1) FOR THE FOUR GENOTYPES IN THE THREE LOCALITIES IN THE MANTARO VALLEY
Genotype San Juan Aco San Lorenzo
PE 40 N PE 80 N PE 40 N PE 80 N PE 40 N PE 80 N Centenario 3.9 31.0 40.1 –125 –12.6 –8.5 UNA La Molina 96 19.5 40.9 49.1 –1.8 4.4 –41.5 UNA La Molina 95 47.1 20.3 –18.4 –1.8 1.2 –1.1 PIC–1 26.5 23.2 34.9 –631 –53.6 49.1
4. DISCUSSION
Even though the three localities had similar altitudes, other variables such as geography, soil formation and the level of production technology, influenced the use of N [11, 12]. On other hand, the genotype response was also important, and the average NUE was similar to the value previously reported for cereals in developing countries [5]. However, the NUE of the mutant genotype Centenario was stable at 80 kg N ha-1.
5. CONCLUSIONS
Barley is an important crop after potato and corn for Peruvian highlanders, and is used mainly for consumption in the daily diet. Centenario, a two row barley mutant variety, was already adopted by the farmers. In this study, Centenario shows great adaptability to different conditions, middle nitrogen extraction and high agronomic efficiency compared with the other genotypes. The PIC–1 barley advanced line is a six row barley and has a high potential to be a new cultivar. The genetic component is important in order to achieve greater efficiency in the use of nitrogen.

111
ACKNOWLEDGEMENT
The author is grateful to the International Atomic Energy Agency (IAEA), Vienna, Austria for financial support through a Research Contract under the CRP D1.50.13 “Approaches to Improvement of Crop Genotypes with high Water and Nutrient Use Efficiency for Water Scarce Environments”.
REFERENCES
[1] KRAISER, T., GRAS, D., GUTIÉRREZ, A., GONZÁLES, B., GUTIÉRREZ, R., 2011. A holistic view of nitrogen acquisition in plants. J. Exp. Bot. 62 (2011) 1455–1466.
[2] CAVATTE, P., MARTINS, S., MORAIS, L., SILVIA, P., DAMATTA, F., 2012. The physiology of abiotic stress. In: Fritsche–Neto, R., Borém, A. (Eds) Plant Breeding for Abiotic Stress Tolerance. 2012 pp. 21–51.
[3] MULVANEY, R., KHAN, S., ELLSWORTH, T., Synthetic nitrogen fertilizers deplete soil nitrogen: a global dilemma for sustainable cereal production. J. Environ. Qual. 38 (2009) 2295–2314.
[4] GARNETT, T., COON, V., KAISER, B., 2009. Root based approaches to improving nitrogen use efficiency in plants. Plant Cell Environ. 32 (2009) 1272–1283.
[5] RAUN, K., JOHNSON, G., 1999. Improving nitrogen use efficiency for cereal production. Agron. J. 91 (1999) 357–363.
[6] HIREL, B., LE GOUIS, J., NEY, B., GALLAIS, A., The challenge of improving nitrogen use efficiency in crop plants: towards a more central role for genetic variability and quantitative genetics within integrated approaches. J. Exp. Bot. 58 (2007) 2369–2387.
[7] ZEIGLER, R., MOHANTY, S., Support for international agricultural research: Current status and future challenges. New Biotechnol. 27 (2010) 565–572.
[8] INEI – Instituto Nacional de Estadística e Informática, 2016; Estadísticas mensuales agrarias. http://www.inei.gob.pe/. Visited July 22, 2016.
[9] FAO – Food and Agriculture Organization of the United Nations (2016) http://faostat3.fao.org/browse/Q/*/E. Visited July 22, 2016.
[10] FAGERIA, N., BALIGAR, V., LI, Y., The role of nutrient efficient plants in improving crop yields in the twenty first century. J. Plant Nutr. 31 (2008) 1121–1157.
[11] STEWART, W.M, LAWRENCE, L.H, VAN KAUWENBERGH, S.J., Phosphorus as a natural resource. In: Phosphorus: Agriculture and the Environment, Agronomy Monograph no. 46. ASA–CSSA–SSSS, Madison. (2005) 3–22.
[12] SATO, S., MORGAN, K.T., OZORES–HAMPTON, M., MAHMOUD, K., SIMONNE, E.H., Nutrient balance and use efficiency in sandy soils cropped with tomato under seepage irrigation. Soil Sci. Soc. Am. J. 76 (2012) 1867–1876.
[13] MOLL, R., KAMPRATH, E., JACKSON, W.A., Analysis and interpretation of factors which contribute to efficiency of nitrogen utilization. Agron. J. 74 (1982) 562–564.
[14] DOBERMANN, A., Nitrogen Use Efficiency – State of the Art. Agronomy & Horticulture – Faculty Publications, University of Nebraska. 2005 Paper 316. http://digitalcommons.unl.edu/agronomyfacpub/316/
[15] BALIGAR, V., FAGERIA, N., Nutrient use efficiency in plants – An overview. In: Rakshit, A., Singh, H.B., Sen, A. (Eds) Nutrient Use Efficiency: From Basics to Advances. (2015) 1–14.

112
LIST OF IAEA PUBLICATIONS ON SOIL AND WATER MANAGEMENT AND
CROP NUTRITION
2001 Use of Isotope and Radiation Methods in Soil and Water Management and Crop Nutrition -Manual (IAEA Training Course Series No. 14).
2002 Water Balance and Fertigation for Crop Improvement in West Asia (IAEA-TECDOC-1266).
2002 Assessment of Soil Phosphorus Status and Management of Phosphatic Fertilizers to Optimize Crop Production (IAEA-TECDOC-1272).
2002 Nuclear Techniques in Integrated Plant Nutrient, Water and Soil Management (Proc. Symp.Vienna, 2000) (IAEA C+S Paper Series 11/P).
2002 Irradiated Sewage Sludge for Application to Cropland (IAEA-TECDOC-1317).
2003 Neutron and Gamma Probes: Their Use in Agronomy (Second Edition) (IAEA Training Course Series No. 16).
2003 Les Sondes à Neutrons et à Rayons Gamma: Leur Applications en Agronomie (Deuxième Édition) (Collection Cours de Formation No.16).
2003 Las Sondas de Neutrones y Gamma: Sus Aplicaciones en Agronomía (Segunda Edición) (Colección Cursos de Capacitación No. 16).
2003 Management of Crop Residues for Sustainable Crop Production (IAEA-TECDOC-1354).
2003 Guidelines for the Use of Isotopes of Sulfur in Soil–Plant Studies (IAEA Training Course Series No. 20).
2003 Maximising the use of biological nitrogen fixation in agriculture (Developments in Plant and Soil Sciences No. 99. FAO, Rome, and Kluwer Academic Publishers, Dordrecht).
2004 Use of phosphate rocks for sustainable agriculture. (FAO Fertilizer and Plant Nutrition Bulletin 13. Joint FAO/IAEA Division of Nuclear Techniques in Food and Agriculture and the Land and Water Development Division-AGL, FAO, Rome).
2004 Use of Isotope and Radiation Methods in Soil and Water Management and Crop Nutrition (An interactive CD).
2005 Nutrient and water management practices for increasing crop production in rainfed arid/semi–arid areas (IAEA-TECDOC-1468).
2007 Management Practices for Improving Sustainable Crop Production in Tropical Acid Soils Results of a Coordinated Research Project organized by the Joint FAO/IAEA
113
Programme of Nuclear Techniques in Food and Agriculture, Proceedings Series, STI/PUB/1285.
2008 Guidelines on Nitrogen Management in Agricultural Systems, Training Course Series No. 29: IAEA-TCS-29/CD- ISSN 1998–0973.
2008 Field Estimation of Soil Water Content, A Practical Guide to Methods, Instrumentation and Sensor Technology, Training Course Series No. 30. Also IAEA-TCS-30/CD- ISSN 1998–0973.
2008 Management of Agroforestry Systems for Enhancing Resource use Efficiency and Crop Productivity, IAEA-TECDOC-1606, ISBN 978–92–0–110908–8.
2009 Management of Agroforestry Systems for Enhancing Resource use Efficiency and Crop Productivity, IAEA-TECDOC-CD-1606, ISBN 978–92–0–150909–3.
2011 Impact of Soil Conservation measures on Erosion Control and Soil Quality. IAEA-TECDOC-1665, Vienna. 329 p. http://www-pub.iaea.org/MTCD/Publications/PDF/TE_1665_web.pdf
2012 Greater Agronomic Water Use Efficiency in Wheat and Rice using Carbon Isotope
Discrimination, IAEA-TECDOC-1671, Vienna. 280 p. http://www-pub.iaea.org/MTCD/Publications/PDF/TE_1671_web.pdf 2013 Optimizing Productivity of Food Crop Genotypes in Low Nutrient Soils, IAEA-
TECDOC-1721, Vienna. 327 p http://www-pub.iaea.org/MTCD/Publications/PDF/TE_1721_web.pdf
2014 Guidelines for Using Fallout Radionuclides to Assess Erosion and Effectiveness of
Soil Conservation Strategies, IAEA-TECDOC-1741, Vienna. 213 p http://www-pub.iaea.org/MTCD/Publications/PDF/TE_1741_web.pdf
2016 Supporting Sampling and Sample Preparation Tools for Isotope and Nuclear Analysis.
IAEA-TECDOC-1781 Vienna, 56 p - 2016 Management and Area–Wide Evaluation of Water Conservation Zones in Agriculture
Catchments for Biomass Production, Water Quality and Food Security. IAEA-TECDOC-1784 Vienna, 155 p.
2017 Cosmic Ray Neutron Sensing: Use, Calibration and Validation for Soil Moisture
Estimation. IAEA- TECDOC-1809 2017 Managing Irrigation Water to Enhance Crop Productivity under Water-limiting
Conditions: A Role of Isotopic Techniques. IAEA-TECDOC-1813

114
ABBREVIATIONS AND ACRONYMS AE Agronomic Efficiency AWD Alternate Wetting and Drying BATAN Badan Tenaga Nuklir Nasional (National Nuclear Energy Agency of
Indonesia) CCRI Cereal Crop Research Institute, Pakistan CID Carbon Isotope Discrimination CF Continuous Flooding CF–IRMS Continuous Flow Isotope Ratio Spectrometer DoA Department of Agriculture FAO Food and Agriculture Organization of the United Nations, Rome ICARDA International Centre for Agricultural Research in Dry Areas INIAP Instituto Nacional De Investigaciones Agropecuarias MADA Muda Agricultural Development Authority MARDI Malaysian Agricultural Research and Development Institute Ndff Nitrogen derived from fertilizer NIFA Nuclear Institute for Food and Agriculture, Pakistan NUE Nitrogen use efficiency PE Physiological Efficiency PEG Polyethylene Glycol SPSS Statistical Package for Social Science UNALM Universidad Nacional Agraria La Molina, Peru UPGMA Unweighted Pair Group Method with Arithmetic Mean UPM Universiti Putra Malaysia WUE Water Use Efficiency γ Gamma

115
CONTRIBUTORS TO DRAFTING AND REVIEW
Ahmad, F Malaysian Nuclear Agency, Malaysia
Ahmad, S. Nuclear Institute for Food and Agriculture (NIFA) Pakistan
Ali, A. Nuclear Institute for Food and Agriculture (NIFA) Pakistan
Andarde, J.M.G. Instituto Nacional de Investigaciones Nucleares, México
Arriaga, M.R. Universidad Autónoma del Estado de México
México
Azam, F. Nuclear Institute for Food and Agriculture (NIFA) Pakistan
Castellanos, E. A. Universidad Nacional Agraria de LaMolina, Peru
Cerda, A.L. Universidad Autónoma del Estado de México
México
Chung, P.T.B. Viet Nam National Institute of Agricultural Genetics (AGI) Viet Nam
Falconi–Palomino, J. Universidad Nacional Agraria de LaMolina, Peru
García, C.R.S Colegio de Postgraduados , México
Gomez–Pando, L. Universidad Nacional Agraria de LaMolina, Peru
Gonzales, K. A. Universidad Nacional Agraria de LaMolina, Peru
Harun, A.R. Malaysian Nuclear Agency, Malaysia
Hoe, P.C.K. Malaysian Nuclear Agency, Malaysia
Hong, L.T.A. Viet Nam National Institute of Agricultural Genetics (AGI) Viet Nam
Human, S. National Nuclear Energy Agency of Indonesia (BATAN), Indonesia
Hussein, S. Malaysian Nuclear Agency, Malaysia
Ibañez–Tremolada; M. Universidad Nacional Agraria de LaMolina, Peru
Ibrahim, R. Malaysian Nuclear Agency, Malaysia
Indriatama, W.M. National Nuclear Energy Agency of Indonesia (BATAN), Indonesia
Jimenez–Davalos, J. La Molina National Agrarian University
Peru
Kamarudin, Z.S. University Putra, Malaysia, Malaysia

116
Khan, J. Nuclear Institute for Food and Agriculture (NIFA) Pakistan
Manh, N.V. Viet Nam National Institute of Agricultural Genetics (AGI) Viet Nam
Mahmud, M. Malaysian Nuclear Agency, Malaysia
Muhammad, W. Nuclear Institute for Food and Agriculture (NIFA) Pakistan
Rahim, K.A. Malaysian Nuclear Agency, Malaysia
Rahman, S.A.A. Malaysian Nuclear Agency, Malaysia
Salleh, S. Malaysian Nuclear Agency, Malaysia
Sihono, National Nuclear Energy Agency of Indonesia (BATAN), Indonesia
Tariq, M. Nuclear Institute for Food and Agriculture (NIFA) Pakistan
Torres, E.C. Instituto Nacional de Investigaciones Nucleares, México
Vallejo, P.R. Colegio de Postgraduados , México
Vinh, M.Q. Viet Nam National Institute of Agricultural Genetics (AGI) Viet Nam
Wahid, A.N.A. Malaysian Nuclear Agency, Malaysia
Yusop, M.R. University Putra, Malaysia, Malaysia
Research Coordination Meetings
Vienna, Austria: 12–16 December 2011 Kuala Lumpur, Malaysia: 24–28 June 2013
Mexico City, Mexico: 9–13 March 2015

ORDERING LOCALLYIn the following countries, IAEA priced publications may be purchased from the sources listed below or from major local booksellers.
Orders for unpriced publications should be made directly to the IAEA. The contact details are given at the end of this list.
CANADARenouf Publishing Co. Ltd22-1010 Polytek Street, Ottawa, ON K1J 9J1, CANADATelephone: +1 613 745 2665 Fax: +1 643 745 7660Email: [email protected] Web site: www.renoufbooks.com
Bernan / Rowman & Littlefield15200 NBN Way, Blue Ridge Summit, PA 17214, USATel: +1 800 462 6420 • Fax: +1 800 338 4550Email: [email protected] Web site: www.rowman.com/bernan
CZECH REPUBLICSuweco CZ, s.r.o.Sestupná 153/11, 162 00 Prague 6, CZECH REPUBLICTelephone: +420 242 459 205 Fax: +420 284 821 646Email: [email protected] Web site: www.suweco.cz
FRANCEForm-Edit5 rue Janssen, PO Box 25, 75921 Paris CEDEX, FRANCETelephone: +33 1 42 01 49 49 Fax: +33 1 42 01 90 90Email: [email protected] Web site: www.form-edit.com
GERMANYGoethe Buchhandlung Teubig GmbHSchweitzer FachinformationenWillstätterstrasse 15, 40549 Düsseldorf, GERMANYTelephone: +49 (0) 211 49 874 015 Fax: +49 (0) 211 49 874 28Email: [email protected] Web site: www.goethebuch.de
INDIAAllied Publishers1st Floor, Dubash House, 15, J.N. Heredi Marg, Ballard Estate, Mumbai 400001, INDIATelephone: +91 22 4212 6930/31/69 Fax: +91 22 2261 7928Email: [email protected] Web site: www.alliedpublishers.com
Bookwell3/79 Nirankari, Delhi 110009, INDIATelephone: +91 11 2760 1283/4536Email: [email protected] Web site: www.bookwellindia.com
@ No. 25

ITALYLibreria Scientifica “AEIOU”Via Vincenzo Maria Coronelli 6, 20146 Milan, ITALYTelephone: +39 02 48 95 45 52 Fax: +39 02 48 95 45 48Email: [email protected] Web site: www.libreriaaeiou.eu
JAPANMaruzen-Yushodo Co., Ltd10-10 Yotsuyasakamachi, Shinjuku-ku, Tokyo 160-0002, JAPANTelephone: +81 3 4335 9312 Fax: +81 3 4335 9364Email: [email protected] Web site: www.maruzen.co.jp
RUSSIAN FEDERATIONScientific and Engineering Centre for Nuclear and Radiation Safety107140, Moscow, Malaya Krasnoselskaya st. 2/8, bld. 5, RUSSIAN FEDERATIONTelephone: +7 499 264 00 03 Fax: +7 499 264 28 59Email: [email protected] Web site: www.secnrs.ru
UNITED STATES OF AMERICABernan / Rowman & Littlefield15200 NBN Way, Blue Ridge Summit, PA 17214, USATel: +1 800 462 6420 • Fax: +1 800 338 4550Email: [email protected] Web site: www.rowman.com/bernan
Renouf Publishing Co. Ltd812 Proctor Avenue, Ogdensburg, NY 13669-2205, USATelephone: +1 888 551 7470 Fax: +1 888 551 7471Email: [email protected] Web site: www.renoufbooks.com
Orders for both priced and unpriced publications may be addressed directly to:Marketing and Sales UnitInternational Atomic Energy AgencyVienna International Centre, PO Box 100, 1400 Vienna, AustriaTelephone: +43 1 2600 22529 or 22530 • Fax: +43 1 2600 29302 or +43 1 26007 22529Email: [email protected] • Web site: www.iaea.org/books 17
-46891

International Atomic Energy AgencyVienna
ISBN 978–92–0–108117–9ISSN 1011–4289
Approaches to Improvem
ent of Crop Genotypes with High W
ater and Nutrient Use Efficiency for W
ater Scarce Environments
IAEA-TECDOC-1828
Approaches to Improvement of Crop Genotypes with High Water and Nutrient Use Efficiency for Water Scarce Environments Final Report of a Coordinated Research Project
@
IAEA-TECDOC-1828
IAEA-TECDOC-1828
IAEA TECDOC SERIES
17-46891_TE-1828_covNoSpine.indd 1-3 2017-11-17 11:06:29


![EiSE S*IXS SS' ffi;L.K]j;# SS.#S. by FROS'€,ffiS](https://img.pdfslide.net/doc/110x75/618080a09c2e617d107504b0/eise-sixs-ss-ffilkj-sss-by-frosffis.jpg)