Embed Size (px)
Citation preview
IAS 2013 - SymposiumHealth-Related Quality of Life
Why and how ?
Pr Olivier CHASSANYPatient-Reported Outcomes Research Unit, University Paris 7 & Hôpital Saint-Louis
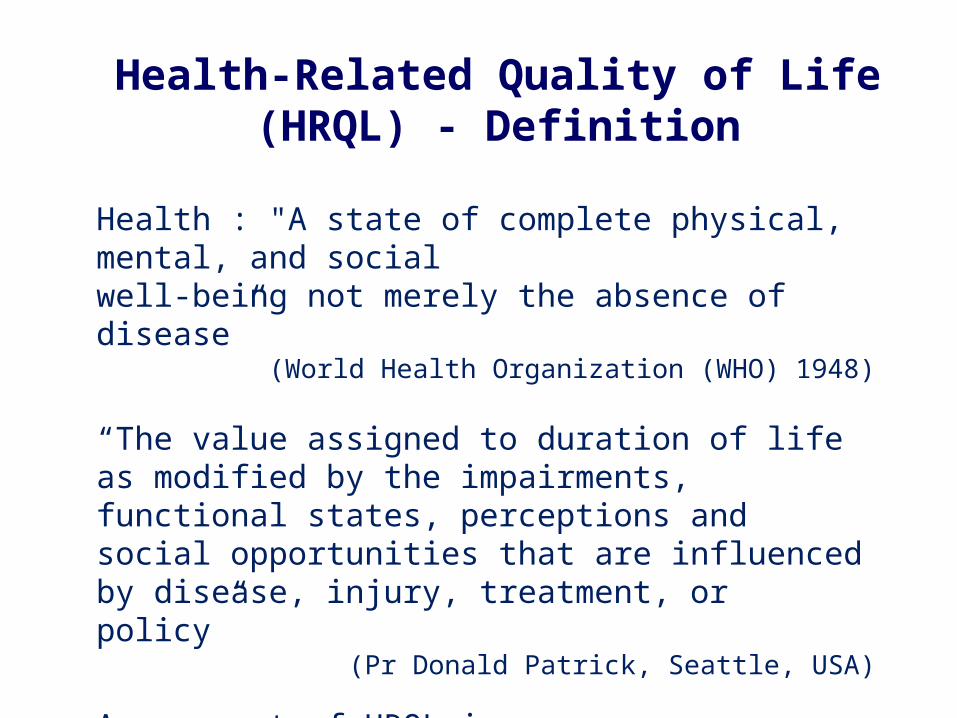
Health : "A state of complete physical, mental, and socialwell-being not merely the absence of disease”
(World Health Organization (WHO) 1948)
“The value assigned to duration of life as modified by the impairments, functional states, perceptions and social opportunities that are influenced by disease, injury, treatment, or policy”
(Pr Donald Patrick, Seattle, USA)
Assessment of HRQL is:• Subjective (patient’s perception)• Self-reported in most conditions• Multidimensional
Health-Related Quality of Life (HRQL) - Definition
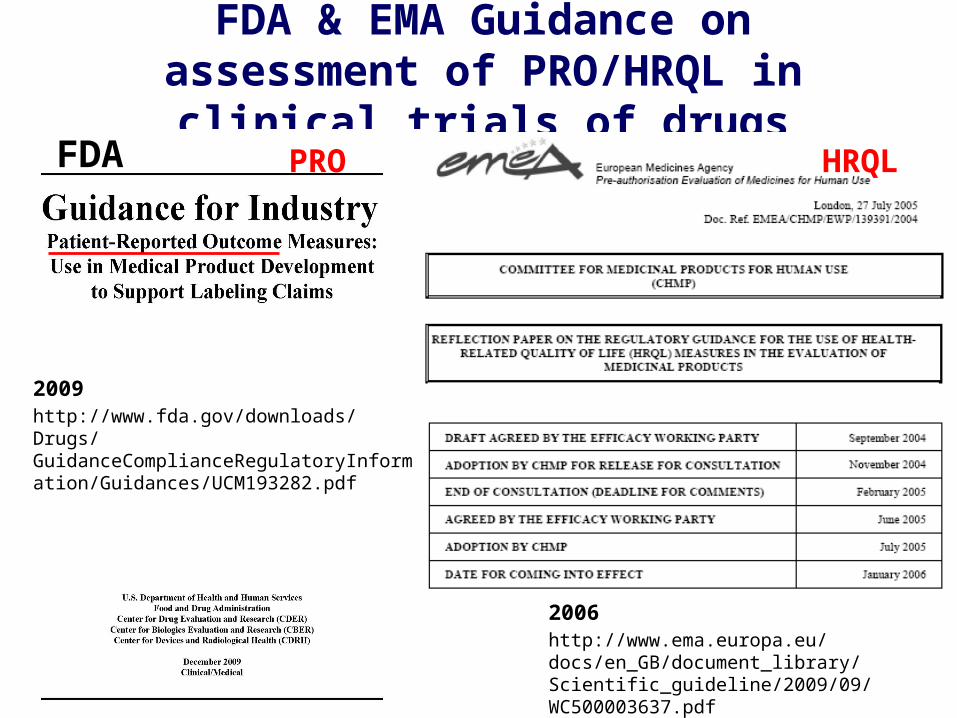
FDA & EMA Guidance on assessment of PRO/HRQL in clinical trials of drugs
2006http://www.ema.europa.eu/docs/en_GB/document_library/Scientific_guideline/2009/09/WC500003637.pdf
2009http://www.fda.gov/downloads/Drugs/GuidanceComplianceRegulatoryInformation/Guidances/UCM193282.pdf
PRO HRQLFDA
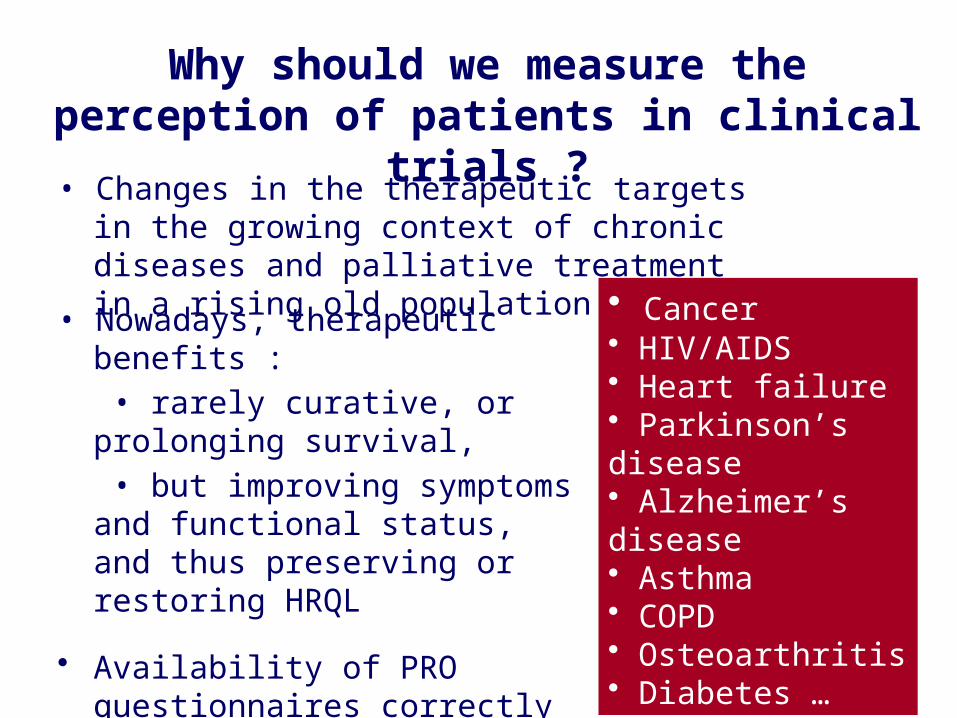
Why should we measure the perception of patients in clinical trials ?
• Changes in the therapeutic targets in the growing context of chronic diseases and palliative treatment in a rising old population
• Cancer• HIV/AIDS• Heart failure• Parkinson’s disease • Alzheimer’s disease • Asthma • COPD • Osteoarthritis• Diabetes …
• Nowadays, therapeutic benefits : • rarely curative, or prolonging survival, • but improving symptoms and functional status, and thus preserving or restoring HRQL
• Availability of PRO questionnaires correctly validated and translated for many diseases / conditions
1. “Objective” markers versus PROs
2. Clinician-Reported Outcomes and proxies/caregivers versus PROs
3. Between PROs
What is the agreement between different perspectives ?
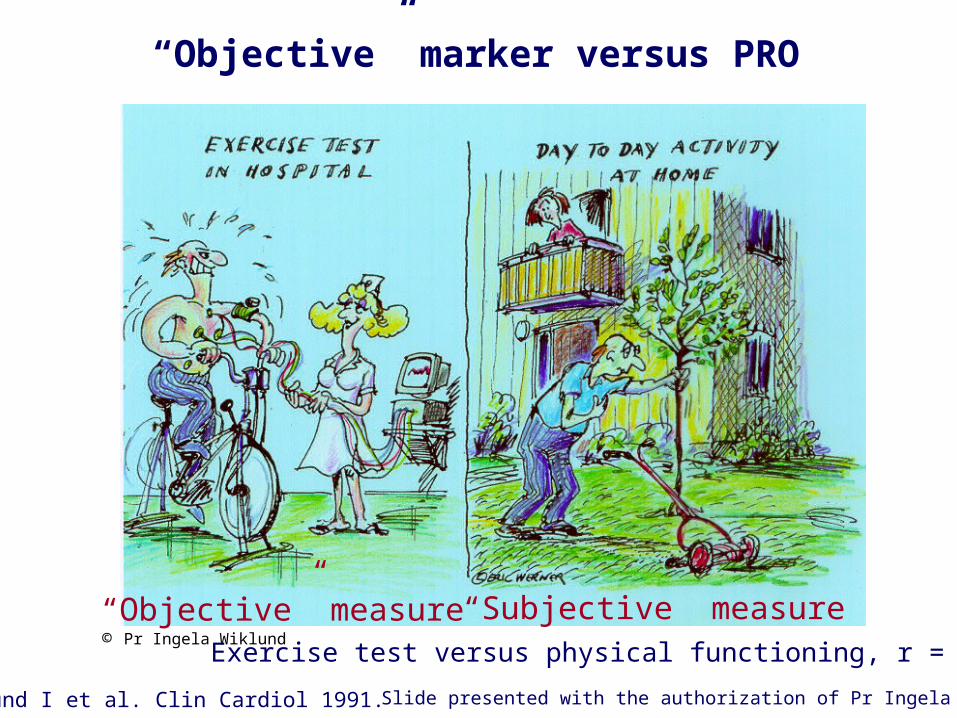
“Objective” measure Exercise test versus physical functioning, r = 0.40
“Subjective” measure
Wiklund I et al. Clin Cardiol 1991. Slide presented with the authorization of Pr Ingela Wiklund
“Objective” marker versus PRO
© Pr Ingela Wiklund
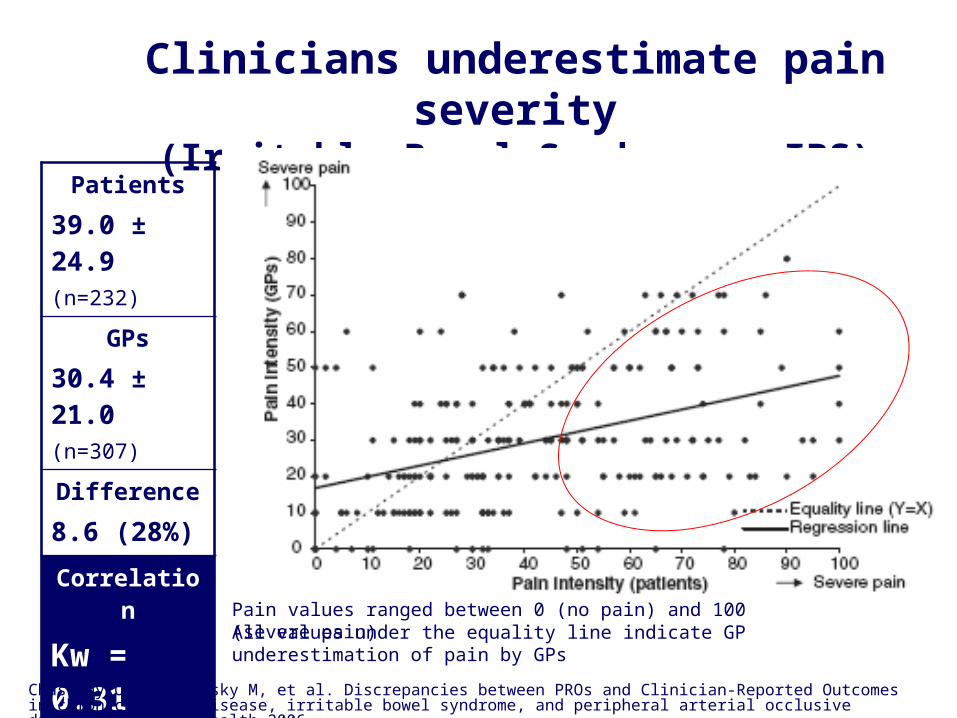
Patients39.0 ± 24.9(n=232)
GPs30.4 ± 21.0(n=307)
Difference8.6 (28%)
CorrelationKw = 0.31 (n=232)
Clinicians underestimate pain severity(Irritable Bowel Syndrome - IBS)
All values under the equality line indicate GP underestimation of pain by GPsPain values ranged between 0 (no pain) and 100 (severe pain)
Chassany O, Duracinsky M, et al. Discrepancies between PROs and Clinician-Reported Outcomes in chronic venous disease, irritable bowel syndrome, and peripheral arterial occlusive disease. Value in Health 2006.
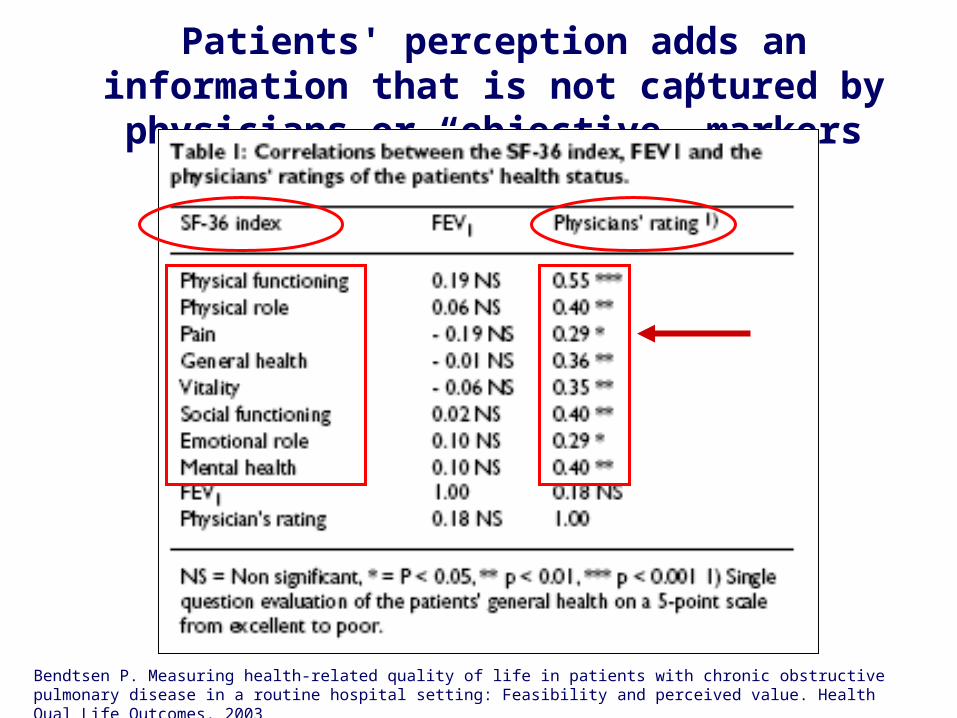
Bendtsen P. Measuring health-related quality of life in patients with chronic obstructive pulmonary disease in a routine hospital setting: Feasibility and perceived value. Health Qual Life Outcomes. 2003
Patients' perception adds an information that is not captured by physicians or “objective” markers
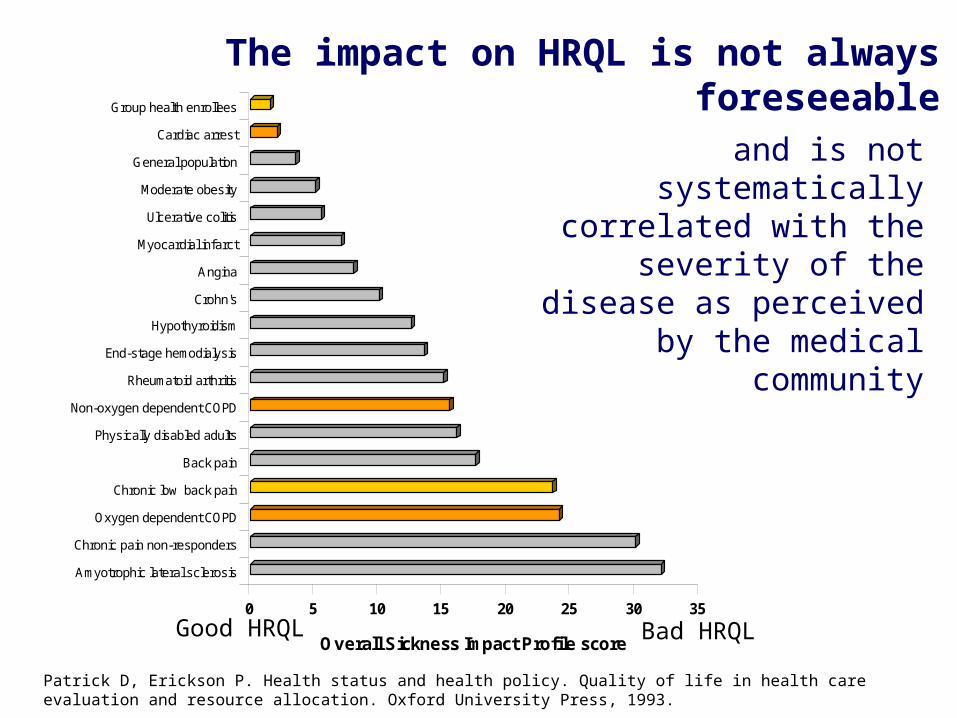
The impact on HRQL is not always foreseeable
0 5 10 15 20 25 30 35
Overall Sickness Impact Profile score
Amyotrophic lateral sclerosis
Chronic pain non-responders
Oxygen dependent COPD
Chronic low back pain
Back pain
Physically disabled adults
Non-oxygen dependent COPD
Rheumatoid arthritis
End-stage hemodialysis
Hypothyroidism
Crohn's
Angina
Myocardial infarct
Ulcerative colitis
Moderate obesity
General population
Cardiac arrest
Group health enrolleesbetter HRQL lower HRQL
and is not systematically correlated with the severity of
the disease as perceived by the medical community
Good HRQL Bad HRQL
Patrick D, Erickson P. Health status and health policy. Quality of life in health care evaluation and resource allocation. Oxford University Press, 1993.
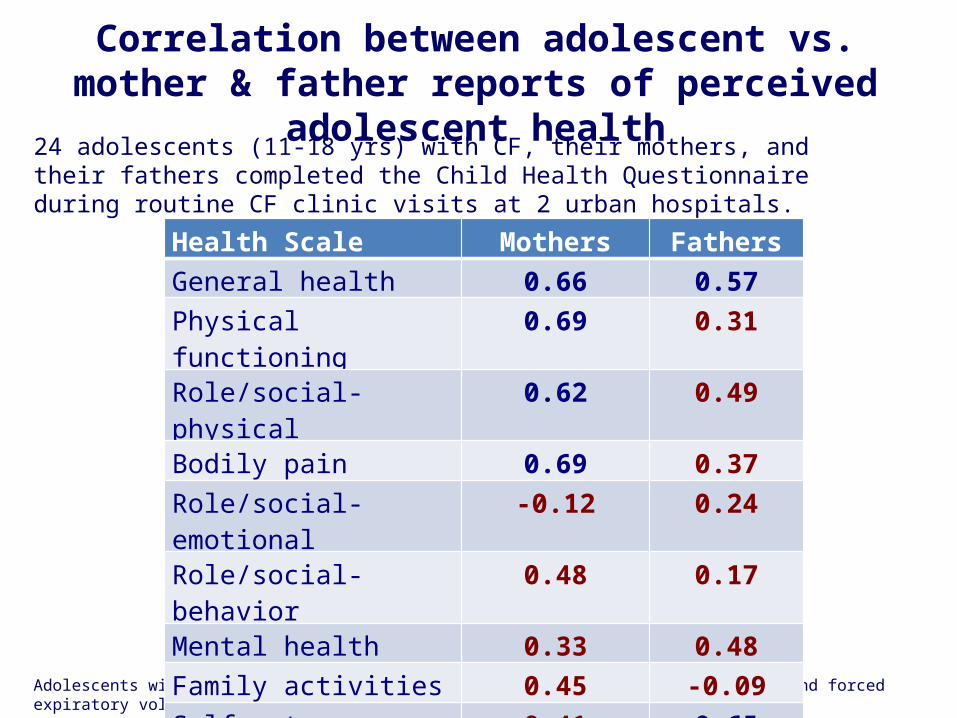
24 adolescents (11-18 yrs) with CF, their mothers, and their fathers completed the Child Health Questionnaire during routine CF clinic visits at 2 urban hospitals.
Correlation between adolescent vs. mother & father reports of perceived adolescent health
Adolescents with cystic fibrosis: family reports of adolescent quality of life and forced expiratory volume in one second. Powers PM et al. Pediatrics 2001; 107: E70.
Health Scale Mothers FathersGeneral health 0.66 0.57Physical functioning 0.69 0.31Role/social-physical 0.62 0.49Bodily pain 0.69 0.37Role/social-emotional -0.12 0.24Role/social-behavior 0.48 0.17Mental health 0.33 0.48Family activities 0.45 -0.09Self-esteem 0.41 0.65Behavior problems 0.71 0.66
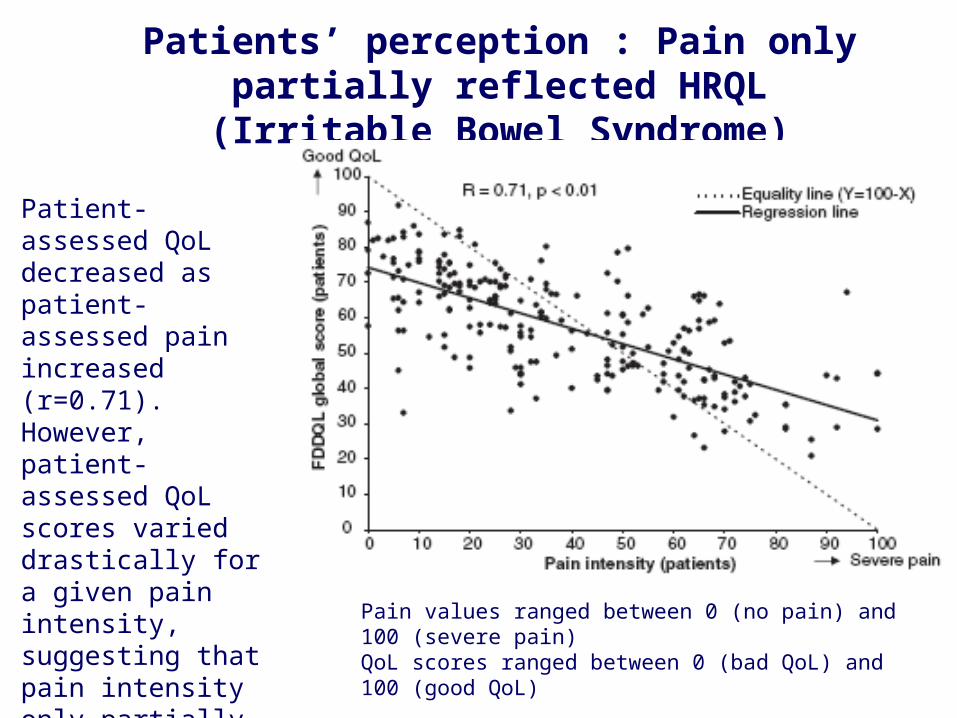
Pain values ranged between 0 (no pain) and 100 (severe pain)QoL scores ranged between 0 (bad QoL) and 100 (good QoL)
Patients’ perception : Pain only partially reflected HRQL (Irritable Bowel Syndrome)
Patient-assessed QoL decreased as patient-assessed pain increased (r=0.71). However, patient-assessed QoL scores varied drastically for a given pain intensity, suggesting that pain intensity only partially reflected QoL.
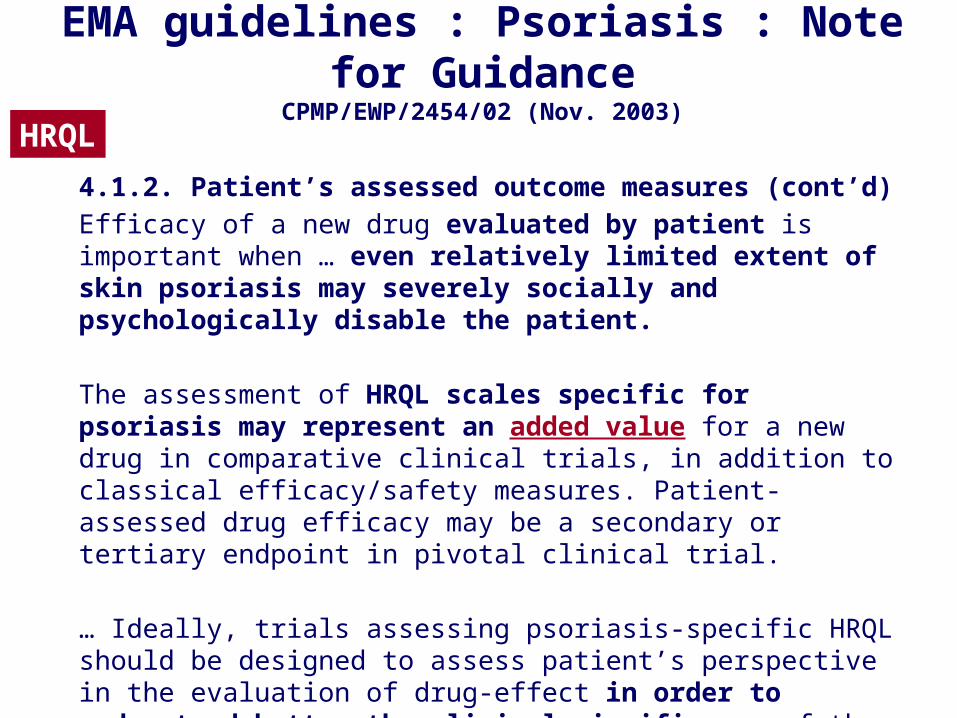
4.1.2. Patient’s assessed outcome measures (cont’d)Efficacy of a new drug evaluated by patient is important when … even relatively limited extent of skin psoriasis may severely socially and psychologically disable the patient.
The assessment of HRQL scales specific for psoriasis may represent an added value for a new drug in comparative clinical trials, in addition to classical efficacy/safety measures. Patient-assessed drug efficacy may be a secondary or tertiary endpoint in pivotal clinical trial.
… Ideally, trials assessing psoriasis-specific HRQL should be designed to assess patient’s perspective in the evaluation of drug-effect in order to understand better the clinical significance of the benefit observed and to be sure that the administered treatment does not impact adversely on patient’s HRQL.
EMA guidelines : Psoriasis : Note for GuidanceCPMP/EWP/2454/02 (Nov. 2003)
HRQL
From Pr Ingela Wiklund (UBC)
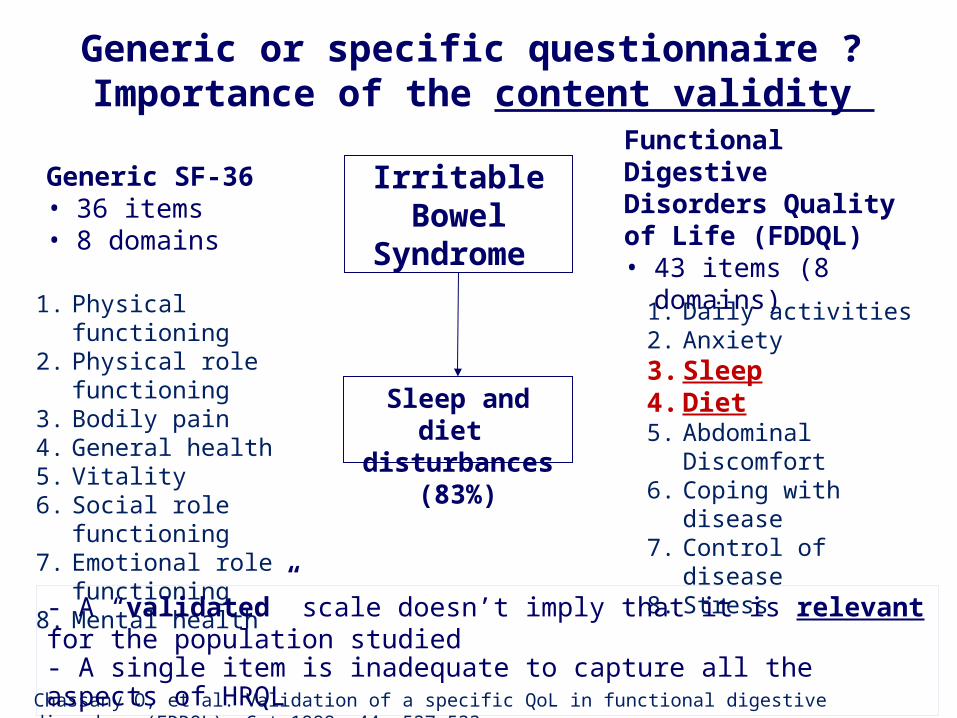
Chassany O, et al. Validation of a specific QoL in functional digestive disorders (FDDQL). Gut 1999; 44: 527-533
1. Physical functioning2. Physical role functioning3. Bodily pain4. General health5. Vitality 6. Social role functioning7. Emotional role
functioning8. Mental health
Sleep and diet disturbances (83%)
Generic SF-36• 36 items• 8 domains
Irritable Bowel Syndrome
Functional Digestive Disorders Quality of Life (FDDQL)• 43 items (8 domains)
1. Daily activities 2. Anxiety3. Sleep4. Diet5. Abdominal Discomfort6. Coping with disease7. Control of disease8. Stress
Generic or specific questionnaire ? Importance of the content validity
- A “validated” scale doesn’t imply that it is relevant for the population studied- A single item is inadequate to capture all the aspects of HRQL
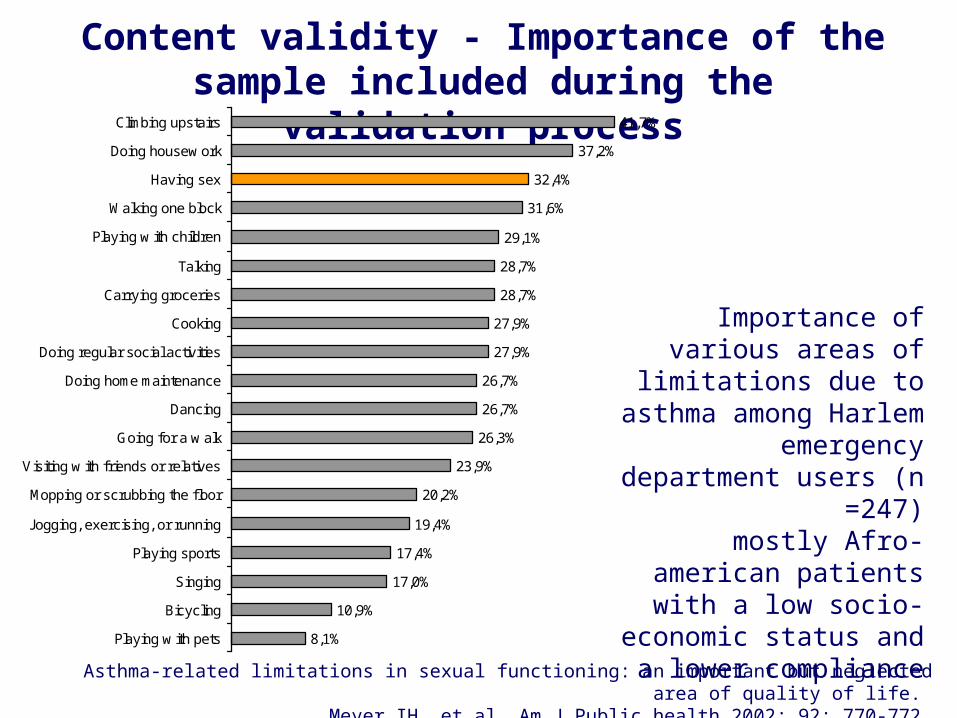
Importance of various areas of limitations due to asthma
among Harlem emergency department users (n =247)
mostly Afro-american patients with a low socio-
economic status and a lower compliance
8,1%
10,9%
17,0%
17,4%
19,4%
20,2%
23,9%
26,3%
26,7%
26,7%
27,9%
27,9%
28,7%
28,7%
29,1%
31,6%
32,4%
37,2%
41,7%
Playing w ith pets
Bicycling
Singing
Playing sports
Jogging, exercising, or running
Mopping or scrubbing the f loor
Visiting w ith friends or relatives
Going for a w alk
Dancing
Doing home maintenance
Doing regular social activities
Cooking
Carrying groceries
Talking
Playing w ith children
Walking one block
Having sex
Doing housew ork
Climbing upstairs
Content validity - Importance of the sample included during the validation process
Asthma-related limitations in sexual functioning: an important but neglected area of quality of life. Meyer IH, et al. Am J Public health 2002; 92: 770-772.
Number of lipodystrophy regions
6543210
Me
an
AB
CD
sco
re 100
90
80
70
60
50
40
30
20
10
0
4245
5456
64
71
85
Score de qualité de vie ABCD
100806040200Score
résum
é m
enta
l du S
F-1
2 (
MC
S)
70
60
50
40
30
20
10
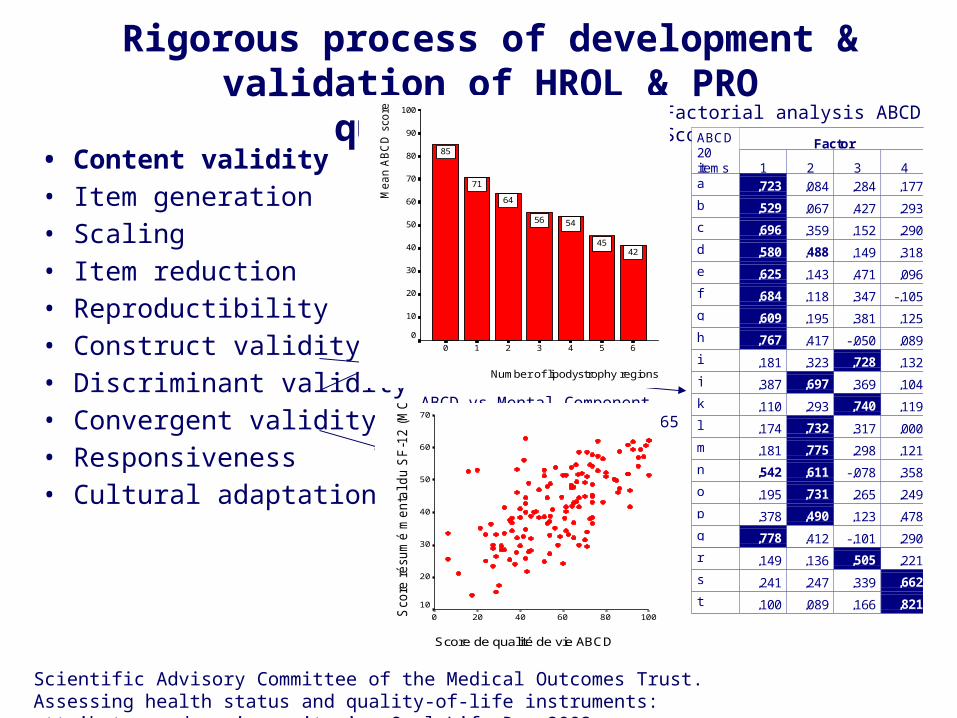
ABCD vs Mental Component Summary (MCS) SF-12, r=0.65
Rigorous process of development & validation of HRQL & PRO questionnaires
• Content validity• Item generation• Scaling• Item reduction• Reproductibility• Construct validity• Discriminant validity• Convergent validity• Responsiveness• Cultural adaptation
Scientific Advisory Committee of the Medical Outcomes Trust. Assessing health status and quality-of-life instruments: attributes and review criteria. Qual Life Res 2002
Factorial analysis ABCD ScoreFactorABCD
20items 1 2 3 4a ,723 ,084 ,284 ,177
b ,529 ,067 ,427 ,293
c ,696 ,359 ,152 ,290
d ,580 ,488 ,149 ,318
e ,625 ,143 ,471 ,096
f ,684 ,118 ,347 -,105
g ,609 ,195 ,381 ,125
h ,767 ,417 -,050 ,089
i ,181 ,323 ,728 ,132
j ,387 ,697 ,369 ,104
k ,110 ,293 ,740 ,119
l ,174 ,732 ,317 ,000
m ,181 ,775 ,298 ,121
n ,542 ,611 -,078 ,358
o ,195 ,731 ,265 ,249
p ,378 ,490 ,123 ,478
q ,778 ,412 -,101 ,290
r ,149 ,136 ,505 ,221
s ,241 ,247 ,339 ,662
t ,100 ,089 ,166 ,821
ABCD score vs nb of lipodystrophy regions
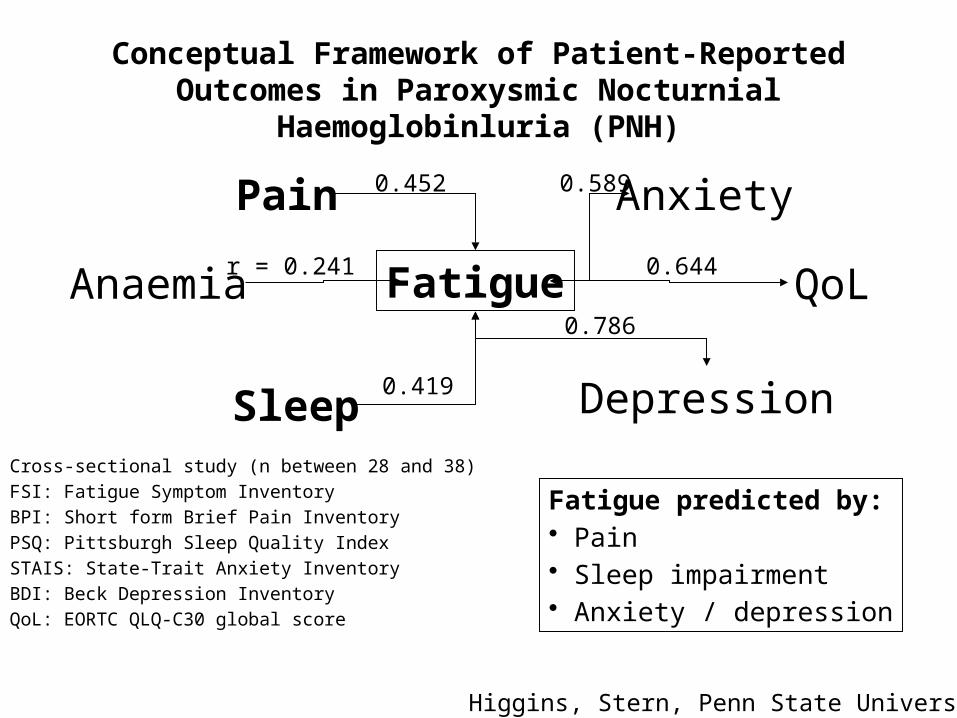
Conceptual Framework of Patient-Reported Outcomes in Paroxysmic Nocturnial Haemoglobinluria (PNH)
Cross-sectional study (n between 28 and 38)FSI: Fatigue Symptom InventoryBPI: Short form Brief Pain InventoryPSQ: Pittsburgh Sleep Quality IndexSTAIS: State-Trait Anxiety InventoryBDI: Beck Depression InventoryQoL: EORTC QLQ-C30 global score
Anaemia Fatigue
Sleep
Pain
Depression
Anxiety
QoLr = 0.241
0.452
0.419
0.589
0.644
0.786
Fatigue predicted by:• Pain• Sleep impairment• Anxiety / depression
Higgins, Stern, Penn State University
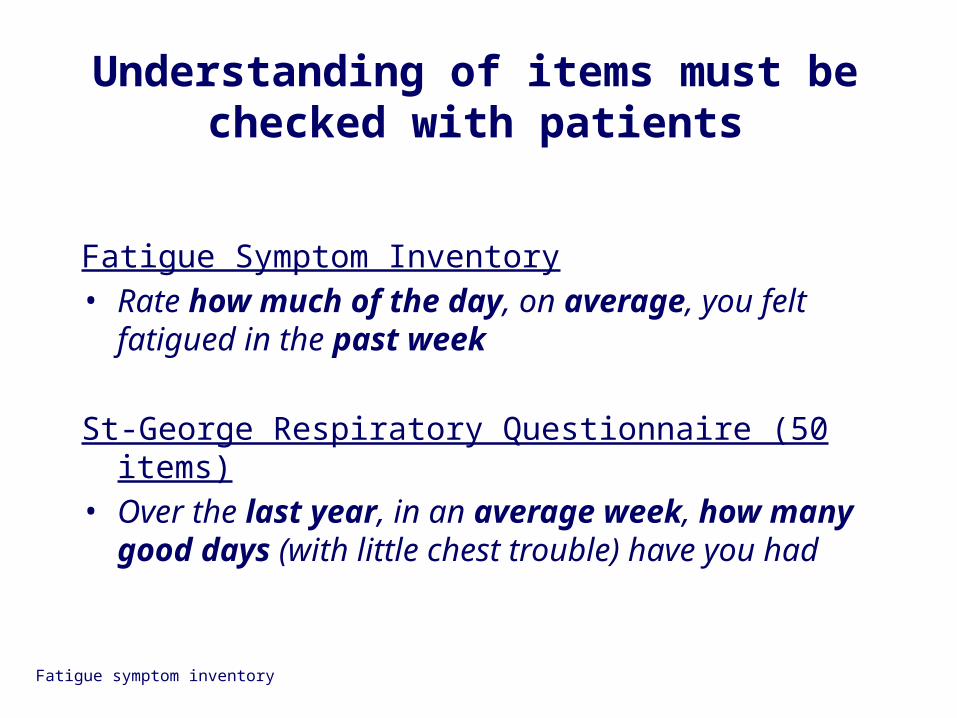
Fatigue Symptom Inventory• Rate how much of the day, on average, you felt fatigued
in the past week
St-George Respiratory Questionnaire (50 items)• Over the last year, in an average week, how many good
days (with little chest trouble) have you had
Fatigue symptom inventory
Understanding of items must be checked with patients
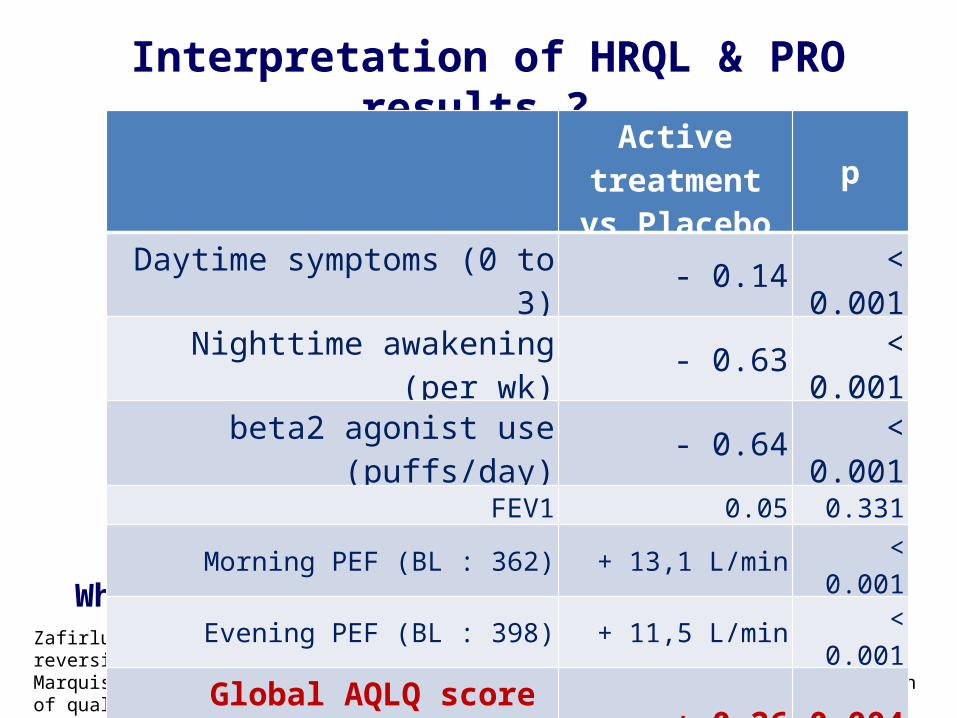
Interpretation of HRQL & PRO results ?
Zafirlukast improves asthma symptoms and HRQL in patients with moderate reversible airflow obstruction. Nathan RA et al. J Allergy Clin Immunol 1998.Marquis P, Chassany O, Abetz L. A comprehensive strategy for the interpretation of quality of life data based on existing methods. Value in Health 2004 ; 7 : 93-104.
What does mean this HRQL difference ?
Active treatment vs Placebo p
Daytime symptoms (0 to 3) - 0.14 < 0.001Nighttime awakening (per wk) - 0.63 < 0.001beta2 agonist use (puffs/day) - 0.64 < 0.001
FEV1 0.05 0.331Morning PEF (BL : 362) + 13,1 L/min < 0.001Evening PEF (BL : 398) + 11,5 L/min < 0.001
Global AQLQ score (BL : 4.28, range score 1-7) + 0.26 0.004
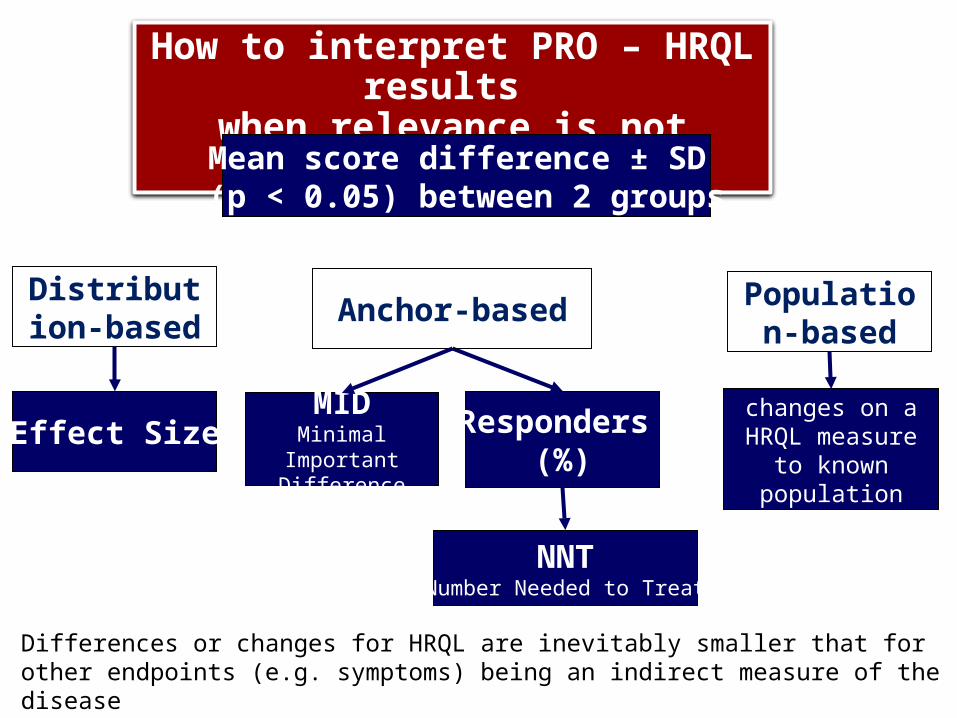
How to interpret PRO – HRQL results when relevance is not obvious ?
Mean score difference ± SD (p < 0.05) between 2 groups
MIDMinimal Important
Difference
Responders (%)
NNTNumber Needed to Treat
Effect Size
Anchor-basedDistribution-
basedPopulation-
based
Relate changes on a HRQL measure to known population
norms
Differences or changes for HRQL are inevitably smaller that for other endpoints (e.g. symptoms) being an indirect measure of the diseaseBut different interpretations will not save a small mean difference between groups
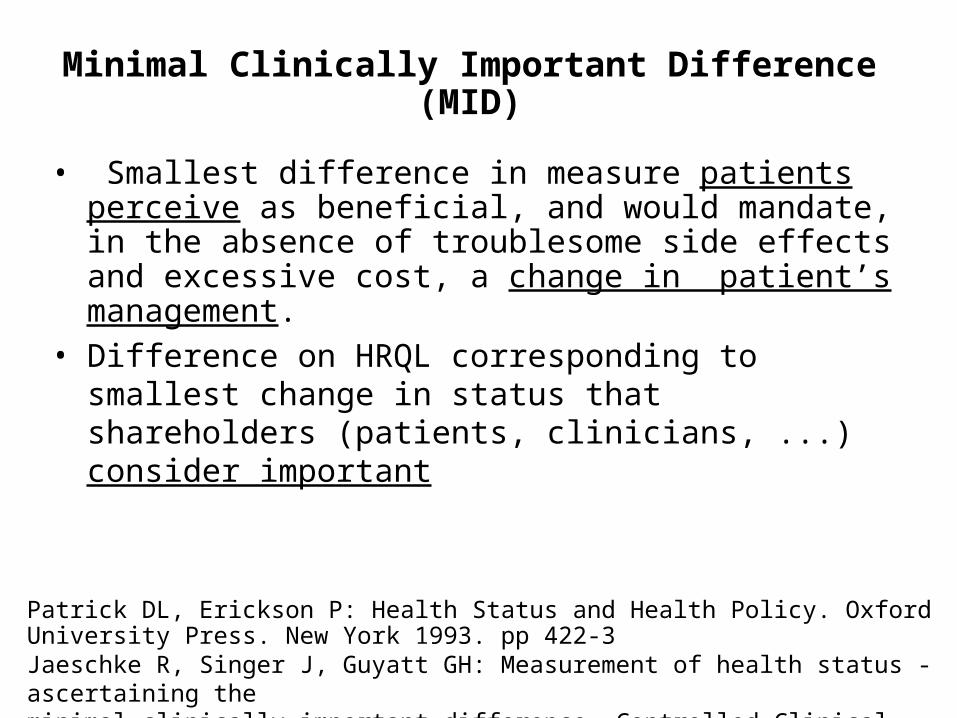
Minimal Clinically Important Difference (MID)
• Smallest difference in measure patients perceive as beneficial, and would mandate, in the absence of troublesome side effects and excessive cost, a change in patient’s management.
• Difference on HRQL corresponding to smallest change in status that shareholders (patients, clinicians, ...) consider important
Patrick DL, Erickson P: Health Status and Health Policy. Oxford University Press. New York 1993. pp 422-3Jaeschke R, Singer J, Guyatt GH: Measurement of health status - ascertaining the minimal clinically important difference. Controlled Clinical Trials. 1989; 10:407:415
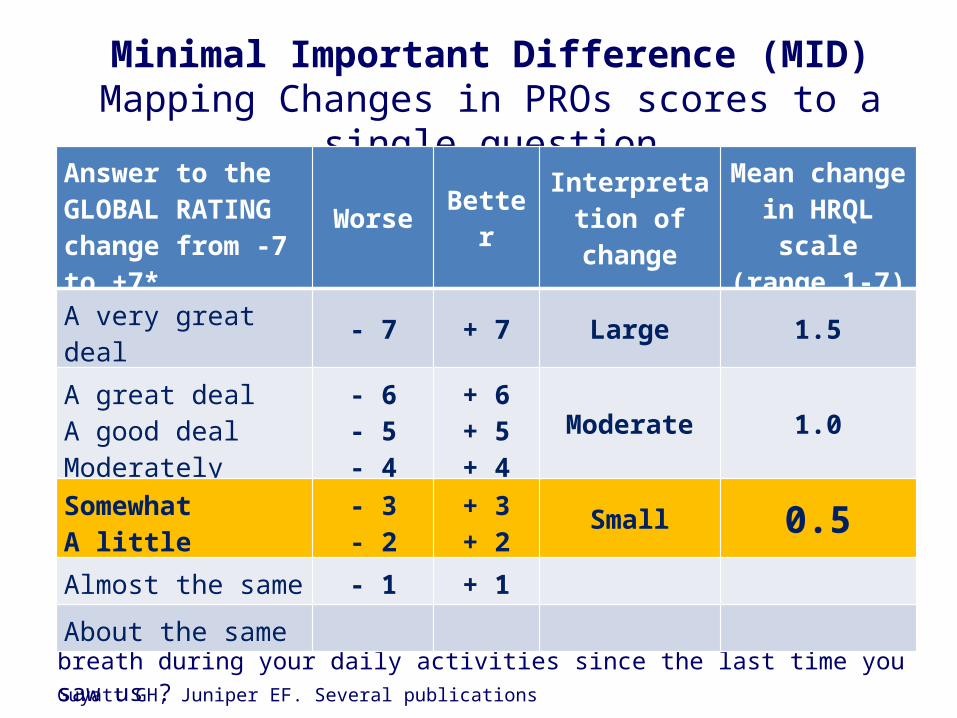
Minimal Important Difference (MID)Mapping Changes in PROs scores to a single question
Guyatt GH, Juniper EF. Several publications
* Overall, has there been any change in your shortness of breath during your daily activities since the last time you saw us ?
Answer to the GLOBAL RATING change from -7 to +7*
Worse Better Interpretation of change
Mean change in HRQL scale (range 1-7)
A very great deal - 7 + 7 Large 1.5
A great dealA good dealModerately
- 6- 5- 4
+ 6+ 5+ 4
Moderate 1.0
SomewhatA little
- 3- 2
+ 3+ 2 Small 0.5
Almost the same - 1 + 1
About the same
23
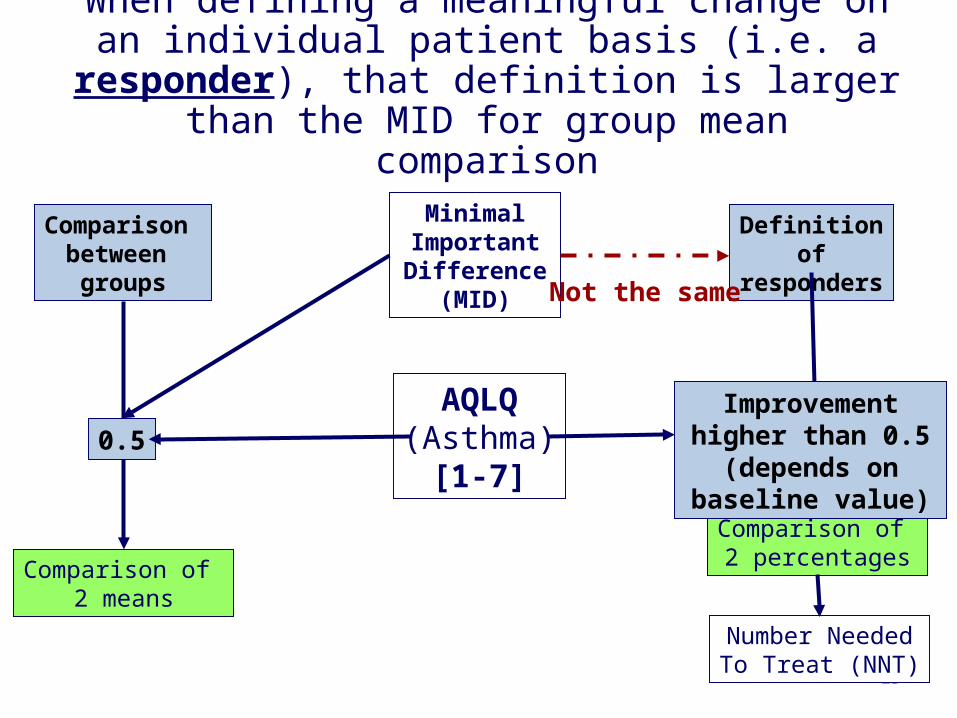
Minimal Important Difference
(MID)
Comparison between
groups
Definition of responders
Comparison of 2 means
Comparison of 2 percentages
AQLQ(Asthma)
[1-7]0.5
Improvement higher than 0.5 (depends on
baseline value)
Number NeededTo Treat (NNT)
When defining a meaningful change on an individual patient basis (i.e. a responder), that definition is larger
than the MID for group mean comparison
Not the same
24
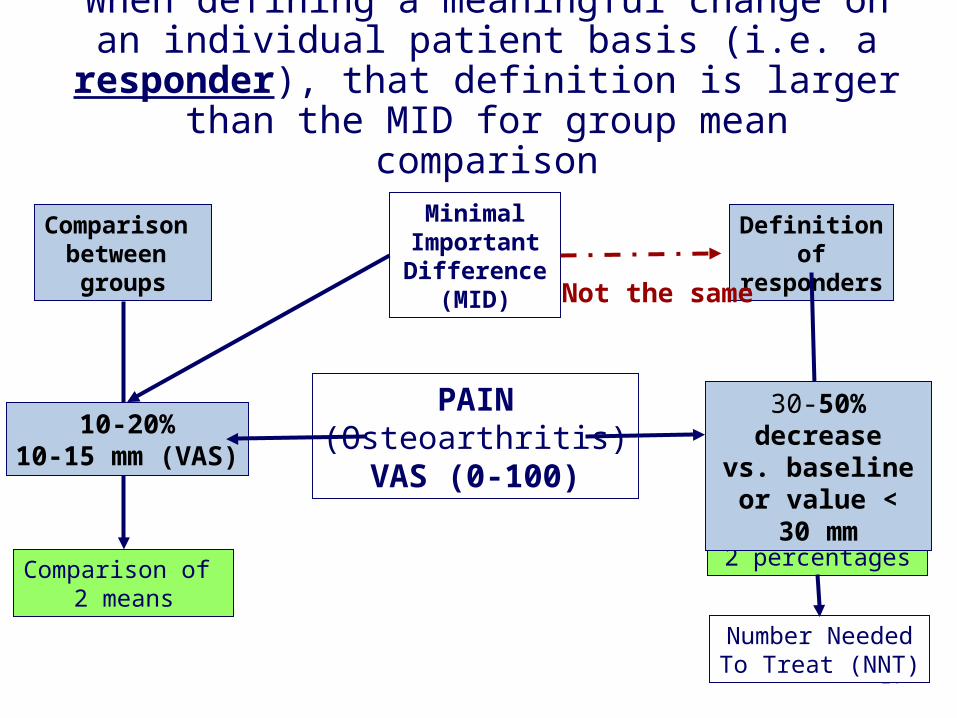
Minimal Important Difference
(MID)
Comparison between
groups
Definition of responders
Comparison of 2 means
Comparison of 2 percentages
PAIN(Osteoarthritis)
VAS (0-100)
10-20%10-15 mm (VAS)
30-50% decreasevs. baseline or value < 30 mm
Number NeededTo Treat (NNT)
When defining a meaningful change on an individual patient basis (i.e. a responder), that definition is larger
than the MID for group mean comparison
Not the same
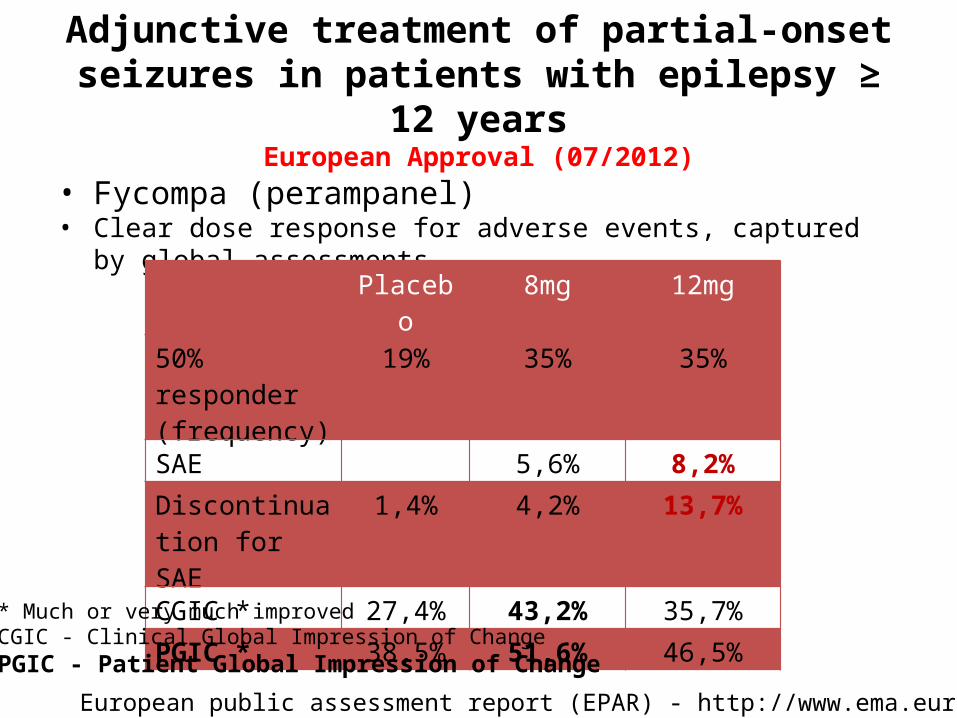
Adjunctive treatment of partial-onset seizures in patients with epilepsy ≥ 12 years
European Approval (07/2012)
• Fycompa (perampanel)• Clear dose response for adverse events, captured by global assessments
European public assessment report (EPAR) - http://www.ema.europa.eu
Placebo 8mg 12mg
50% responder (frequency)
19% 35% 35%
SAE 5,6% 8,2%
Discontinuation for SAE
1,4% 4,2% 13,7%
CGIC * 27,4% 43,2% 35,7%
PGIC * 38,5% 51,6% 46,5%
* Much or very much improved CGIC - Clinical Global Impression of Change PGIC - Patient Global Impression of Change
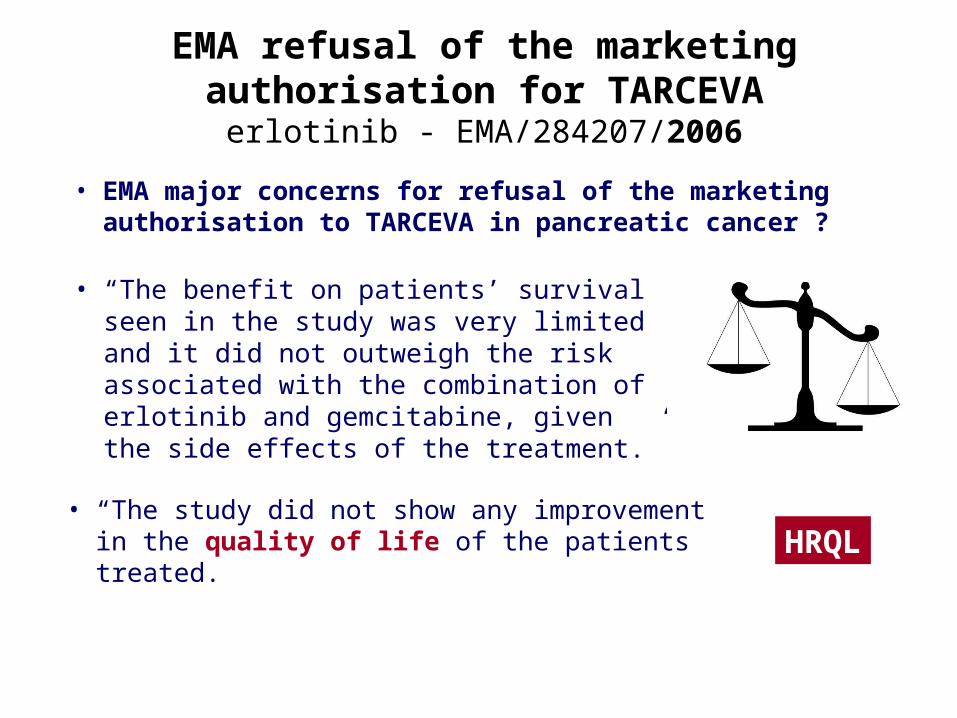
• “The benefit on patients’ survival seen in the study was very limited and it did not outweigh the risk associated with the combination of erlotinib and gemcitabine, given the side effects of the treatment.”
EMA refusal of the marketing authorisation for TARCEVAerlotinib - EMA/284207/2006
HRQL• “The study did not show any improvement in
the quality of life of the patients treated.
• EMA major concerns for refusal of the marketing authorisation to TARCEVA in pancreatic cancer ?
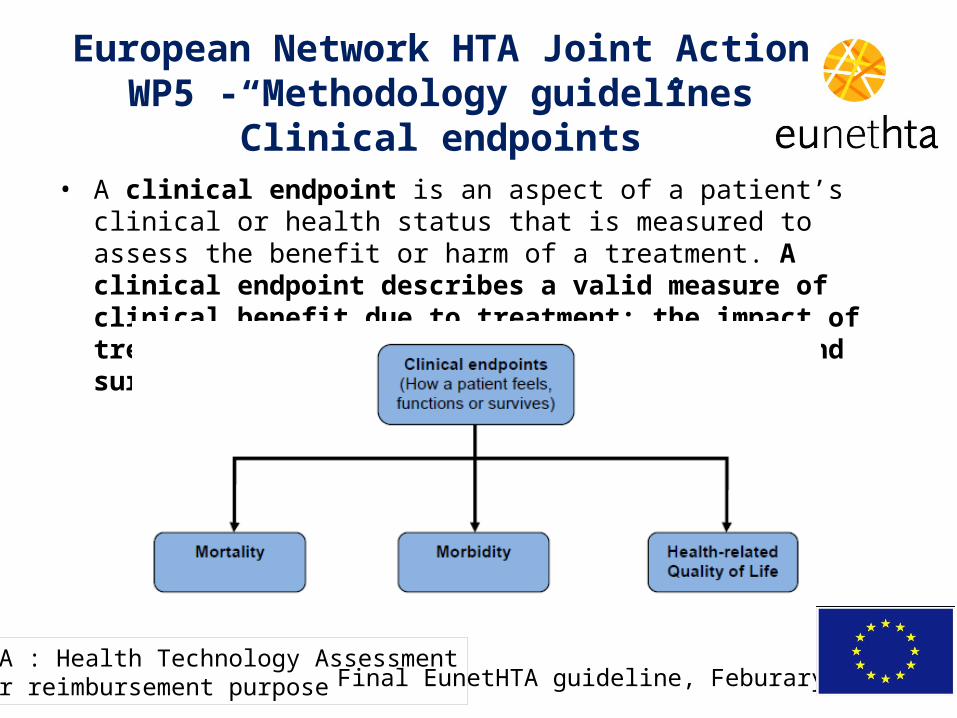
• A clinical endpoint is an aspect of a patient’s clinical or health status that is measured to assess the benefit or harm of a treatment. A clinical endpoint describes a valid measure of clinical benefit due to treatment: the impact of treatment on how a patient feels, functions and survives.
Final EunetHTA guideline, Feburary 2013
European Network HTA Joint ActionWP5 - Methodology guidelines
”Clinical endpoints”
HTA : Health Technology AssessmentFor reimbursement purpose
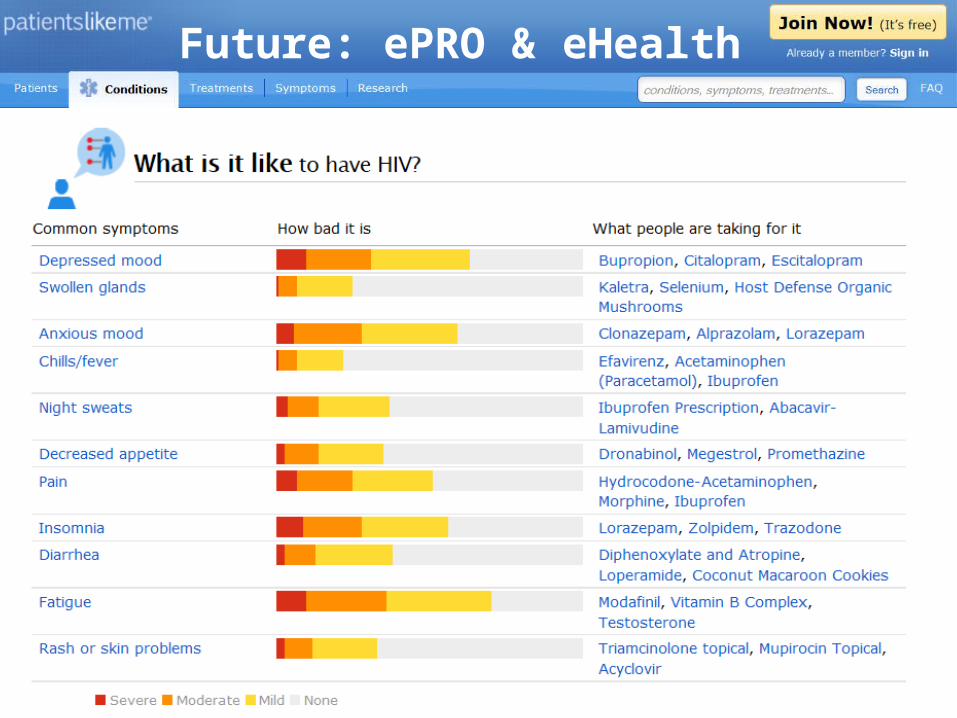
Future: ePRO & eHealth