Embed Size (px)
Citation preview

IB BIOLOGY HIGHER LEVEL Extended Essay
An analysis on the mode of inheritance and role of fungiform papillae in the bitter taste perception of Brassica Genus plants and Phenylthiocarbamide
(PTC) strips
“How can bitter taste perception be explained in terms of fungiform
papillae density and Mendelian genetics, and is the gene frequency of bitter
taste perception in Hardy-Weinberg equilibrium?”
Wordcount: 3,965

1
Table of contents Introduction 2
Background knowledge 2Significance and worthiness of experiment (Personal engagement) 4Research question 4
Investigation 4Aim of experiment 4Materials 5Experimental method 5Diagram of procedure for counting fungiform papillae density 6Risk assessment 6Hypothesis 7
Variables 7Independent variable 7Dependent variable 7Controlled variables 8
Results 9Correlation between density and bitter taste rating 10Demonstrating classic Mendelian manner 12
Statistical test: Chi-Square test to confirm Mendel’s law 13Hardy-Weinberg principle 15
Statistical test: Investigating Hardy-Weinberg within families 19Pedigree charts: Bitter taste inheritance among families 20
Conclusion 25Evaluation of procedure 27References: 30
Appendix I: Bitter taste rating scale 31Appendix II: Consent form volunteers 32Appendix III: Consent forms for families 33

2
Introduction
Background knowledge
It is said there are five major taste modalities that most humans are able to taste; bitter, sweet,
sour, salty and umami. Taste perception is an essential trait for the survival in the interplay
between organisms and the environment, to help detect chemical substances contained in
food, bitter taste sensitivity has also been shown to be important in food selection affecting
individual’s metabolism and physiology (Ruqaiya Hussain, 2014). It is thought to guard
against consumption of toxins, many of which are bitter to humans (Melis and Tomassini
Barbarossa, I., 2017). Almost 90 years ago, scientist A.L Fox poured a powdered form of
phenylthiocarbamide (PTC) into a bottle when some of the powder accidentally blew into the
air and another occupant of the laboratory complained of a bitter taste sensation. Curious to
understand why they tasted this chemical substance differently a number of studies were
conducted on families and different population samples.
Bitterness is a taste sensation that arises when precise chemical substances come into contact
with specific receptors in specialized cells found on the human tongue (Smail, 2019).
Fungiform papillae are raised lingual structures located on the anterior two-thirds of the
tongue, which play a vital role in human taste perception. These small bumps are made of
several receptor cells all responsible for sensing a single flavor, the number of bumps present
can vary from person to person. Geneticists have found inherent components that determine
how people taste bitterness, it has been suggested that the ability to taste chemicals such as
PTC is inherited in a classic Mendelian recessive manner. Alleles in the taste receptor
membrane TASR38 is located on chromosome 7, this gene encodes for seven-transmembrane
G protein-coupled receptors controlling for the ability to taste glucosinolates a family of

3
bitter tasting compounds found in Brassica Genus plants, phenylthiocarbamide and 6-n-
propylthiouracil (PROP) (TASR38 taste 2 receptor membrane 38 - Gene - GTR - NCBI,
2020). Although several allelic forms of the TASR38 gene have been identified geneticists
have discovered that there are two predominant forms responsible for expressing this
homozygous recessive phenotype T and t, where T is the dominant tasting allele and t the
recessive non-tasting allele.
Since the TASR38 taster gene is said to be dominant, an individual can still have the ability
to taste prop-like chemicals, whether they carry two copies of the dominant gene or one. This
explains the large variation in bitter taste intensity and perception among individuals, where
some have the ability to taste glucosinolates, a family of bitter tasting compounds found in
brassica genus plants and PTC. This ability to taste bitterness in certain chemicals like PTC is
often referred to as the supertaster phenomenon. Supertasters are said to be more sensitive to
certain flavors than the rest of us. This concept was first described by A.L Fox in 1932, when
it was noted that PTC was tasteless to some individuals including himself, yet intensely bitter
to others.

4
Significance and worthiness of experiment (Personal engagement)
Genetics has been an interest of mine ever since we began studying this as part of my IB
Biology course. From the sight of articles and literature reviews on the topic of genetics and
bitter taste perception, I was quickly determined to further investigate this phenomenon. I
wanted to investigate the role of fungiform papillae density on bitter taste sensitivity
determining whether there is a correlation between bitter taste intensity and fungiform
papillae density. I also wanted to investigate the mode of inheritance of this phenotype
confirming or rejecting a classic Mendelian manner, i.e. seeing whether it follows the 3:1
ratio, as well as determining whether my tested population followed the Hardy-Weinberg
equilibrium principle.
Research question
“How can bitter taste perception be explained in terms of fungiform papillae density,
Mendelian genetics, and is the gene frequency of bitter taste perception in Hardy-Weinberg
equilibrium?”
Investigation
Aim of experiment
To answer the research, question the following aims have been set:
● Determine the relationship between fungiform papillae density and bitter taste
sensitivity of different chemical substances (PTC and brassica genus plants)
● Conduct Chi-square tests to confirm or reject whether this bitter tasting phenotype
follows a classic Mendelian ratio of 3:1. Further construct pedigree charts and Punnett
squares to predict possible bitter tasting alleles in offspring within families.

5
● Calculating the gene frequencies of the tested population to determine whether they
follow the Hardy-Weinberg equilibrium
Materials
● Brassica Genus plants (broccoli and Brussel sprouts)
● Phenylthiocarbamide strips (PTC)
● Blue food coloring (For staining tongue to allow clear counting of fungiform papillae)
● Cotton q-tips (for applying food coloring)
● Camera/phone for (For taking photos of tongue receptors)
● Hole punched paper (3.5 cm)
● Bitter taste rating scale (Refer to appendix I)
● Signed consent forms (Refer to appendix II and III)
● 8 families and 23 volunteers (ages 17-18)
Experimental method
1. Participants were provided with the required materials; they were then instructed to
taste the PTC strips and rate the bitterness on a given scale from 1-5 (Refer to
appendix I)
2. They were then asked to wait for a short period of time before trying the brassica
genus plants (broccoli and Brussel sprouts) to avoid any interfering tastes. Similarly,
they were instructed to rate the bitter taste intensity
3. After tasting all substances, they were instructed to stain their tongues with blue food
coloring using a q-tip. This would allow the color to slide off the prominent pink
fungiform papillae and allow for easier counting. With the 3.5 cm hole punched paper
they were instructed to place the paper on either the left or right counterpart of their

6
tongue (ensuring that every participant placed the paper around the same area of their
tongue). A photo of their tongue was then taken to allow for fungiform papillae
counting.
Similar procedure was used when assessing families, however the families only tasted PTC
strips and I did not look into their fungiform papillae density, therefore step 2 or 3 was not
followed. The results collected from families would allow me to further formulate and check
the same principle only using PTC strips.
Diagram of procedure for counting fungiform papillae density
Method of calculating fungiform papillae density:
● Fungiform papillae were counted within the 3.5 cm area hole
● Formula used for calculating the density: (𝑵𝒖𝒎𝒃𝒆𝒓𝒐𝒇𝒄𝒐𝒖𝒏𝒕𝒆𝒅𝒇𝒖𝒏𝒈𝒊𝒇𝒐𝒓𝒎𝒑𝒂𝒑𝒊𝒍𝒍𝒂𝒆) ÷ 𝝅(𝟑. 𝟓𝒄𝒎 ÷ 𝟐)𝟐
Risk assessment
All chemicals used had no potential harm towards the participants, however it was important
to ensure that no one was allergic to any of the substances before conducting the experiment.

7
Further, health concerns were considered during the experimental procedure due to Covid-19.
The experiments were carefully conducted by each participant individually, they were all
given instructions regarding the experiments as well as video and picture demonstrations. I
was in no contact with any of the individuals during this process.
Hypothesis
We expect to see a strong correlation between the fungiform papillae density and bitter taste
sensitivity rating of the different substances tasted. The larger the fungiform papillae density
the higher the bitter taste intensity will be. It is also expected that the genotypic frequency
follows a classic Mendelian manner showing a calculated ratio of 3:1. Lastly, it is expected
that the population's genotype frequencies will be in Hardy-Weinberg equilibrium.
Variables
Independent variable
Source of bitter taste: The brassica genus plants (broccoli and Brussel sprouts) and
Phenylthiocarbamide (PTC) strips
Dependent variable
The bitter taste intensity of each individual/family member (marked on indicated scale from
1-5)
8
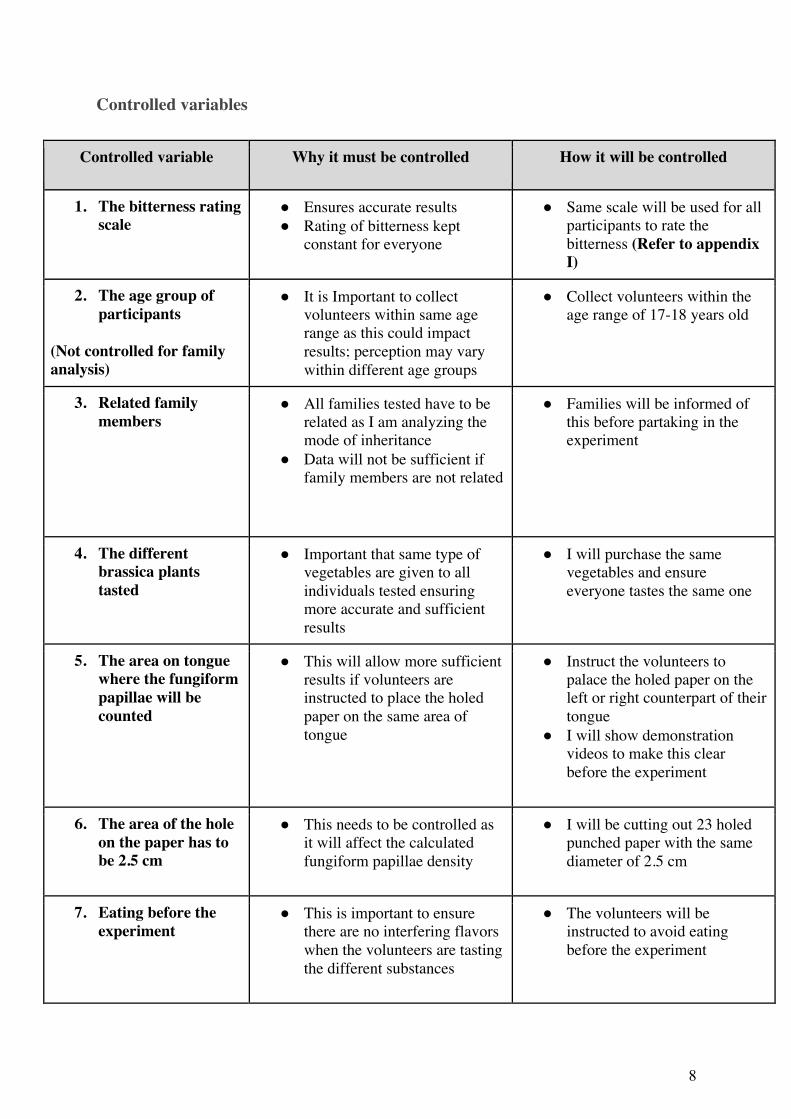
Controlled variables
Controlled variable Why it must be controlled How it will be controlled
1. The bitterness rating scale
● Ensures accurate results ● Rating of bitterness kept
constant for everyone
● Same scale will be used for all participants to rate the bitterness (Refer to appendix I)
2. The age group of participants
(Not controlled for family analysis)
● It is Important to collect volunteers within same age range as this could impact results; perception may vary within different age groups
● Collect volunteers within the age range of 17-18 years old
3. Related family members
● All families tested have to be related as I am analyzing the mode of inheritance
● Data will not be sufficient if family members are not related
● Families will be informed of this before partaking in the experiment
4. The different brassica plants tasted
● Important that same type of vegetables are given to all individuals tested ensuring more accurate and sufficient results
● I will purchase the same vegetables and ensure everyone tastes the same one
5. The area on tongue where the fungiform papillae will be counted
● This will allow more sufficient results if volunteers are instructed to place the holed paper on the same area of tongue
● Instruct the volunteers to palace the holed paper on the left or right counterpart of their tongue
● I will show demonstration videos to make this clear before the experiment
6. The area of the hole on the paper has to be 2.5 cm
● This needs to be controlled as it will affect the calculated fungiform papillae density
● I will be cutting out 23 holed punched paper with the same diameter of 2.5 cm
7. Eating before the experiment
● This is important to ensure there are no interfering flavors when the volunteers are tasting the different substances
● The volunteers will be instructed to avoid eating before the experiment

9
Results
Figure I. Raw data table of collected results from volunteers
Participant Number of counted fungiform papillae
Calculated density of fungiform papillae
(𝒑𝒆𝒓𝒄𝒎𝟐)
PTC srips (Bitterness
rating)
Broccoli (Bitterness
rating)
Brussel sprouts (bitterness
rating)
1 89 9,80 4 3 2
2 55 6,06 4 3 3
3 116 12,78 5 4 3
4 51 5,62 3 2 2
5 114 12,56 5 3 3
6 72 7,93 4 3 3
7 48 5,29 3 2 2
8 60 6,61 4 3 2
9 44 4,85 2 1 1
10 61 6,72 4 2 2
11 95 10,46 4 3 3
12 55 6,06 3 2 2
13 105 11,56 4 5 3
14 38 4,19 1 2 1
15 35 3,85 1 1 1
16 49 5,40 3 3 2
17 56 6,17 3 2 2
18 98 10,79 5 4 2
19 101 11,12 4 2 2
20 53 5,84 4 3 2
21 121 13,33 5 4 3
22 40 4,41 2 3 2
23 55 6,06 4 4 3

10
Correlation between density and bitter taste rating
1. PTC Strips Figure II. Linear graph displaying the relationship between bitter taste rating and average
tongue papillae density for PTC strips
2. Broccoli Figure III. Linear graph displaying the relationship between bitter taste rating and average
tongue papillae density for broccoli

11
3. Brussel sprout Figure IV. Linear graph displaying the relationship between bitter taste rating and average
tongue papillae density for Brussel sprouts
Discussion/analysis
Referring to all the plotted linear graphs above displaying the relationship between fungiform
papillae density and bitter taste rating for each substance, we can conclude that there is a
strong correlation between bitter taste rating and fungiform papillae density. All calculated R-
values are close to 1, indicating a good fit. Thus, supporting our hypothesis that higher fungi
papillae density leads to higher bitter taste sensitivity. Further, the calculated linear functions
for both PTC strips (y = 2.029x +0.901) and broccoli (y = 2.1158x +2.297) suggests that
there is approximately a 2 𝑐𝑚2increase in papillae density related to one level higher in the
bitter taste rating. However, the linear function for brussel sprouts (y = 3.819x + 0.9113)
suggests that the bitter taste rating of 1 relates to approximately 4𝑐𝑚2(3.8 as seen in the
calculated linear function).

12
Demonstrating classic Mendelian manner
Figure V. Cumulative frequency graph displaying the bitter taste rating of all chemicals tasted
Discussion/analysis
If the results follow a classic Mendelian ratio, 3:1 there should be 25% non-tasters within the
population. For Brussel sprouts we conclude that the 25% lowest bitterness rating was lower
than 1,2. For broccoli the 25% lowest bitterness rating was below 1,5 and for the PTC the
25% lowest bitterness rating was as high as 2,5. This is indicating that if my population were
to follow a 3:1 ratio, the non-tasters have rated the bitterness to be higher than 1.

13
Statistical test: Chi-Square test to confirm Mendel’s law A chi-square test was conducted on every tested variable (broccoli, Brussel sprouts and PTC)
to confirm Mendel's law checking whether the results follow a classic monohybrid
inheritance with a ratio of 3:1.
Possible alleles assuming it follows a classic monohybrid
inheritance:
TT (homozygous dominant)
Tt (heterozygous)
tt (homozygous recessive)
The results of the Punnett square shows a ratio of:
3:1 where 75% = tasters and 25% = non-tasters
Null hypothesis: It is expected that the results will follow a 3:1 ratio
Alternative hypothesis: Bitter tasting perception does not follow monohybrid cross 3:1 ratio.
In these tests we have assumed that non-tasters rated 1, thus:
KEY: Rating 1 = non-taster
Ratings 2-5 = tasters
1. Chi-square test for PTC strips and Broccoli (same results)
PTC strips
Phenotype Observed Expected (E) (O-E) (O-E)^2 (O-E)^2 / E
Taster 21 17.25 3.75 14.06 0.82
Non-taster 2 5.75 -3.75 3.06 2.44
χ2 = 3.26

14
Observations:
D.f. = 2-1= 1
Our calculated p-value is P(χ2 ≥3.26) = 7% (calculated on Excel)
From the table the critical value is 3.84 for 5% probability.
Our χ2 is lower than the critical value (calculated to be 7%), therefore we cannot reject the null
hypothesis. While the chi-square value is close the null hypothesis, we cannot be rejected at
5% probability, or confidence level.
2. Chi-square test for Brussel sprouts
Brussel sprouts
Phenotype Observed Expected (E) (O-E) (O-E)^2
(O-E)^2 /
E
Taster 20 17.25 2.75 7.56 0.44
Non-taster 3 5.75 -2.75 7.56 1.32
χ2 = 1.76
Observations:
D.f. = 2-1 = 1
Our calculated p-value is P(χ2 ≥1.75) = 18.5% (calculated on Excel)
From the table the critical value is 3.84 for 5% probability.
Our χ2 is lower than the critical value (calculated to be 18.5%), therefore we cannot reject the
null hypothesis.

15
Hardy-Weinberg principle
The Hardy-Weinberg method was used to determine whether the gene frequencies of the
tested population were in equilibrium. The Hardy-Weinberg principle states that genetic
variation in a population will remain constant from one generation to the next in absence of
disturbing factors such as: mutations, natural selection, non-random mating, genetic drift and
gene flow (Hardy-Weinberg equilibrium | Learn science at Scitable, 2014). We should
assume that the gene for bitter tasting ability is not evolving and that the allele frequency
stays constant across generations.
The Hardy-Weinberg principle states that if there are two alleles in a population then:
𝑝2 + 2𝑝𝑞 + 𝑞2 = 1 *p is the homozygous dominant genotype; q is the homozygous recessive genotype and
2pq the frequency of the heterozygous genotype
I am assuming that all the non-tasters are homozygous recessive non-tasters (tt). With this
basis I can calculate the percentage homozygous dominant (TT) supertasters and
heterozygous (Tt) moderate tasters.
Calculations: Assuming the homozygous recessive non-taster allele frequency only
Assuming that the non-tasters rated 1, 8% of my sample population from the PTC and
broccoli cases, are homozygous recessive non-tasters. Calculations can be made to determine
the percentage of heterozygous moderate tasters and homozygous dominant supertasters
within the population.

16
tt = 8% or 0.08
t = √𝟎. 𝟎𝟖= 0.28
Therefore:
T = 0.72 (knowing that T + t = 1)
Assuming alleles based on indicated bitter taste ratings:
KEY: TT = Homozygous dominant super taster allele (4,5)
Tt = Heterozygots moderate tasting allele (2,3)
tt = Homozygous Recessive non-taster allele (1)
1. PTC Strips
Calculations: Assuming that the dominant TT allele has a rating of 4 and 5, I
calculated:
P = frequency of TT + ½ of frequency of Tt
𝑷 = 𝟎. 𝟔𝟏 + 𝟏/𝟐 × 𝟎. 𝟑𝟎 = 𝟎. 𝟗𝟏𝟓
q = 1 - P
𝒒 = 𝟏 − 𝟎. 𝟗𝟏𝟓 = 𝟎. 𝟎𝟖𝟓
𝑝# = 0.915# = 0.837
𝑞# = 0.085# = 0.007
2𝑝𝑞 = 2 × (0.085 × 0.915) = 0.155
𝒑𝟐 + 𝟐𝒑𝒒 + 𝒒𝟐 = 𝟎. 𝟖𝟑𝟕 + 𝟎. 𝟏𝟓𝟓 + 𝟎. 𝟎𝟖𝟓 = 𝟏. 𝟎𝟕
Observations:
Based on my assumptions, I cannot conclude that the ability to taste PTC strips follow the
Hardy-Weinberg principle with a calculated result of 1.07. The calculations for the genotypic
the genotypic frequencies seen in the table above assumes that the majority of the population
are supertasters (TT homozygous dominant). However, we can conclude that some of the
individuals who rated the bitterness at 4 or 5 might actually have been heterozygous (Tt).

17
2. Broccoli
P = frequency of TT + ½ of frequency of Tt
𝑃 = 0.22 + 1/2 × 0.70 = 0.57
q = 1 - P
𝑞 = 1 − 0.57 = 0.43
𝑝# = 0.57# = 0.325
𝑞# = 0.43 = 0.185
2pq = 2 × (0.57 × 0.43 = 0.490
𝒑𝟐 + 𝟐𝒑𝒒 + 𝒒𝟐 = 𝟎. 𝟑𝟐𝟓 + 𝟎. 𝟒𝟗𝟎 + 𝟎. 𝟒𝟑 = 𝟏. 𝟐𝟓
Observations:
Similarly, we cannot conclude that the bitter tasting sensation of broccoli follows the Hardy-
Weinberg Equilibrium principle with a calculated result of 1.25. Assuming the homozygous
dominant supertasters (TT) rated 4 and 5, 0.22 were supertasters, and 0.70 were
heterozygous moderate tasters (Tt). Based on my results, many of the individuals within
the population who have given a bitter rating between 2,3 might actually have been
supertasters.
3. Brussel sprouts
P = frequency of TT + ½ of frequency of Tt
𝑷 = 𝟎 + 𝟏/𝟐 × 𝟐𝟎 = 𝟏𝟎
q = 1 - P
𝒒 = 𝟏 − 𝟏𝟎 = −𝟗
𝑝2 = 102 = 100
𝑞2 = −92 = 81
2𝑝𝑞 = 2 × (10 × −9) = −180
𝒑𝟐 + 𝟐𝒑𝒒 + 𝒒𝟐 = 𝟏𝟎𝟎 +−𝟏𝟖𝟎 + 𝟖𝟏 = 𝟏

18
Observations:
Based on the calculations above, we can conclude that the bitter tasting sensation for Brussel
sprouts follows the Hardy-Weinberg equilibrium principle with a calculated result of 1.
However, looking at the genotypic frequencies calculated, no one claimed to be supertasters
for Brussel sprouts, with no rating above 3. Consequently, these results may be inaccurate.
Considering the generally lower rating for the Brussel sprouts, this could indicate that the
results were unreliable. It should also be noted that the Brussel sprouts were frozen, which
could have impacted the bitterness rating.
A Hardy-Weinberg test was also conducted on the bitter taste ratings of PTC from the family
population combined with the original population which had tested bitterness of PTC, giving
us a larger test population.
Calculations:
P = frequency of TT + ½ of frequency of Tt
P = 0.51 + 1/2 × 0.37 = 0.695
q = 1 - P
𝑞 = 1 − 0.695 = 0.305
𝑝# = 0.695# = 0.483
𝑞# = 0.305# = 0.093
2𝑝𝑞 = 2 × (0.305 × 0.695) = 0.424
𝒑𝟐 + 𝟐𝒑𝒒 + 𝒒𝟐 = 𝟎. 𝟒𝟖𝟑 + 𝟎. 𝟒𝟐𝟒 + 𝟎. 𝟎𝟗𝟑 = 𝟏. 𝟎𝟎
Observations:
Referring to the calculations, we can conclude that as a whole population the ability to taste
PTC strips, follows the Hardy-Weinberg equilibrium principle with a calculated result of
exactly 1. This means that the phenotype for bitter taste perception of PTC strips will be the
same from one generation to another.

19
Statistical test: Investigating Hardy-Weinberg within families A chi-square test was also conducted on the 7 families to determine whether there is a
difference among the phenotypic frequencies between the parent and the children generation.
Null hypothesis: The offspring will have the same phenotypic frequency as their parents.
Alternative hypothesis: The offspring will have a different phenotypic frequency compared
to their parents
In this test we also included the moderate tasters, and have assumed:
KEY:
1 - Non-taster
2-3 - Moderate taster
4-5 - Supertaster
Expected for child Phenotype Observed Expected (E) (O-E) (O-E)^2 (O-E)^2 / E
Supertaster 8 4 4 16 4
Moderate taster 5 7 -2 4 0.57
Non-taster 1 3 -2 4 1.33
χ2 = 1.90
Observations:
D.f. = 3 - 1 = 2
Our calculated p-value is P(χ2 ≥1.90) = 38.6% (calculated on excel)
This means that there is approximately a 38.6% chance of getting my collected results.
From the table the critical value is 5.99 for 5% probability. Therefore, we cannot reject the
null hypothesis.

20
Pedigree charts: Bitter taste inheritance among families Pedigree charts were constructed displaying the inheritance of bitter taste perception in PTC
among families studied for my investigation.
KEY:
1 - Non-taster (Blue)
2-3 - Moderate taster (Green)
4-5 - Super taster (Red)
Square - male Circle – female
1. Family 1
Mom Dad Daughter 1 Daughter 2
Bitterness of PTC 3 3 4 5
Observations:
Both parents are moderate tasters. Assuming that they are both carriers of the heterozygous
moderate tasting allele (Tt), there is a 75% chance that all offspring will have the ability to
taste bitterness in PTC; with a 25% chance of the offspring being moderate tasters or
supertasters. Referring to the pedigree chart, we see that both daughters are supertasters. This
is only possible if both parents were carriers were carriers of at least one dominant tasing
allele.

21
2. Family 2
Mom Dad Daughter 1
Bitterness of PTC 5 1 3
Observations:
The father is a non-taster (tt) and the mother is a super taster (TT). Assuming the mother is a
carrier of the homozygous dominant tasting allele (TT) there is a 100% chance that all
offspring produced within this family will have the ability to taste bitterness in PTC. There is
no way of producing a non-taster within this family, the super tasting allele will be expressed
while the effect of the other recessive allele will be masked.
3. Family 3
Mom Dad Daughter 1 Daughter 2

22
Bitterness of PTC 1 2 2 1
Observations:
The mother is a non-taster gene (tt) while the father has the ability to taste bitterness in PTC
(Tt). One of their daughters is a taster while the other is a non-taster. The only way two
parents could produce an offspring unable to taste PTC is for the dad to carry one of the taser
alleles (Tt). The father must therefore be heterozygous. Any offspring within this family
would have equal chance (50%) of being able to or unable to taste PTC.
4. Family 4
Mom Dad Daughter 1 Son 1
Bitterness of PTC 4 3 3 4
Observations:

23
In this family the father is a moderate taster and the mother a supertaster. Assuming that the
mother is a carrier of the homozygous dominant tasting allele (TT) and the father a carrier
of the heterozygous moderate tasting allele (Tt), there is a 100% chance that the offspring
will be tasters of PTC. As one of their daughters is a moderate taster, she must have inherited
the recessive t allele from her father. Since the son is heterozygous dominant (TT) he must
have inherited two copies of the dominant alleles from both parents.
5. Family 5
Mom Dad Daughter 1 Daughter 2
Bitterness of PTC 5 4 4 4
Observations:
In this family both parents are homozygous dominant (TT) for the bitter tasting allele. This
means that any offspring produced within this family will have a 100% chance of being
supertasters. There is no way of producing offspring without the ability to taste PTC strips.

24
6. Family 6
Mom Dad Daughter 1 Son 1 Son 2
Bitterness of PTC 3 2 5 4 4
Observations:
In this family both parents are heterozygous (Tt) for the bitter tasting allele. This means that
any offspring produced will have a 25% chance of being a carrier of the non-taster allele, 25%
chance of being dominant homozygous (TT) supertasters and 50% chance of being
heterozygous (Tt) for the tasting allele. As we can see in this family all offspring produced
are supertasters. This means that they have all inherited a dominant tasting allele T from each
parent.

25
7. Family 7
Mom Dad Son 1 Son 2
Bitterness of PTC 1 2 3 3
Observations:
The father is heterozygous (Tt) and the mother is heterozygous recessive (tt). Any offspring
produced will have a 50% chance of being able to taste PTC strips being heterozygous (Tt)
and a 50% chance of not being able to taste PTC homozygous recessive (tt). All children
within this family are moderate tasters and carriers of the heterozygous tasting allele. This
means each child has inherited a dominant allele from their father and a recessive allele from
their mother.
Conclusion
The results collected are generally in line with my proposed hypothesis. I was able to
conclude that fungiform papillae density plays a significant role in bitter taste sensitivity
among individuals. I found a strong correlation between bitter taste sensitivity rating and
fungiform papillae density. My results are also supported by my literature reviews. An
experiment closely related to mine, is a study conducted by Hayes and Bratoshuk and Duffy

26
(Duffy et. al 2008). They also examined the connection between bitter taste sensitivity and
fungiform papillae on individuals’ tongues. Individuals oral sensory phenotype was assessed
by counting the number of fungiform papillae in a circular area of 6-mm in diameter on the
anterior blue stained tongue surface. By using a scale participant reported bitter taste intensity
of different PROP-like substances. They were concluded that the number of fungiform
papillae strongly correlated with an individual’s bitter taste intensity in homozygotes but not
heterozygotes (Duffy et. al 2008). The findings further showed that 24% of the 198 subjects
were non-tasters, 54% tasters and 22% supertasters. This study along with several others
shows how bitter taste perception among individuals could depend on more than just the
TASR38 gene.
Further, chi-square tests were conducted allowing me to check my hypothesis that bitter
tasting ability follows a classic Mendelian ratio of 3:1. While my test sample did not replicate
the 25%, 50% and 25% expected ratio of supertaster, moderate tasters and non-tasters (refer
to Figure V), none of the results for the substances tested allowed me to reject the Mendelian
hypothesis. I was further able to support my findings by conducting a similar experiment on
families, giving me a larger population sample. As seen in all pedigree charts and Punnett
grids above, all families follow a 3:1 ratio where bitter taste sensitivity is inherited in a
classic Mendelian manner.
A Hardy-Weinberg statistical test was also conducted, within my population an estimated 8%
of the population compared to 25% of the population considering the classic Mendelian ratio
of 3:1 were non-tasters (tt). Considering my estimated number of non-tasters, I was able to
determine whether my test population was following the Hardy-Weinberg equilibrium. The
results indicated that most substances were not in equilibrium. While many were close to 1, I

27
was not able to accept that the population sample was following the Hardy-Weinberg
principle. However, the results collected from Brussel sprouts seemed to be in line with the
Hardy-Weinberg principle with a calculated value of 1. There were however several
limitations regarding the Brussel sprout test, as many individuals seemed to rate very low
bitter taste intensity for this substance. It is therefore difficult to make a valid conclusion with
respect to the Hardy-Weinberg principle. Additionally, the Hardy-Weinberg principal was
tested on a larger population, combining the PTC bitterness rating tested within the families
and the rest of my test population. The results gathered allowed me to conclude that in this
larger test group (population) the ability to taste PTC follows the Hardy-Weinberg principle.
With a calculated result of 1, indicating that the phenotype for tasting PTC strip is stable and
will not change throughout generations. This conclusion was further supported by an
additional Chi-square test confirming consistency in bitterness ratings between the parents
and the children generation.
Evaluation of procedure
There were several limitations to my experiment that could have been modified in order to
provide more optimal results. Firstly, I was limited to the sample size, my experiment was
conducted on a rather small population providing me with limited data. If there were more
participants in my tests it would provide me with further analysis and more optimal results.
This was clearly demonstrated when I combined the family and original test population for
PTC bitterness, resulting in more optimal and consistent results.
Another challenge was to define the representative number of homozygous recessive (tt)
tasters. Initially, I tried to determine the 25% of the population which had rated the lowest on
bitterness, referring to the cumulative frequency graph in Figure V. We found that the

28
bitterness taste ratings varied significantly for the different substances tasted. A better
assumption was therefore to label only those who had rated a bitterness of 1 as the non-
tasters. Thus, in my sample the number of non-tasters was significantly lower than the
predicted 25%. This could also be linked to the small sample size in my test.
Furthermore, there were several limitations to my experimental method. Due to the first
experiment requiring individuals to taste 3 different substances, it is unknown whether they
had any interfering flavors in their mouth or whether they had eaten before the experiment
though they were instructed not to, this could have influenced their bitter taste rating;
additionally there may have been some confirmation bias in the ratings given as individuals
may have influenced each other sharing opinions on the bitter taste intensities. In order to
allow for more optimal results, some variables should have been controlled better. Though
the experiment was conducted by all participants themselves they were still conducted within
small groups of people. In order to avoid confirmation biases the experiment could have been
conducted individually without any other volunteers present. Furthermore, as seen throughout
my analysis of results it is evident that the bitter taste rating collected for the Brussel sprouts
were all relatively low. This could have been due to the fact that the Brussel sprouts were
frozen and not fresh vegetables, they also seemed to be sweetened. This was another
limitation to my results, as I was not able to purchase them fresh. Therefore, the data
collected for Brussel sprouts were not optimal results making it difficult to draw conclusions.
Furthermore, as seen in the statistical Hardy-Weinberg test conducted, it was evident that
grouping individuals into allelic groups based on their indicated bitter taste ratings is a very
subjective method of gathering data. It is difficult to assume that the results are accurate and
representative of each individual's alleles, an individual could be a carrier of the dominant

29
homozygous super tasting allele (TT) yet rate the bitterness much lower, such as the
Brussel sprouts. Lastly, the participants’ health was not taken into consideration for the
experiment. Health factors and lifestyle may have affected the bitter taste intensity of each
individual. Furthermore, taste and senses are said to change throughout age, this could have
impacted my data collected especially when testing families. An individual could be a smoker
which also contributes to bitter taste sensitivity (Da Ré et al., 2020).

30
References: Fareed, M., Shah, A., Hussain, R. and Afzal, M., 2020. Genetic Study Of Phenylthiocarbamide (PTC) Taste Perception Among Six Human Populations Of Jammu And Kashmir (India). [Accessed 20 September 2020]. Griffiths, A., Gelbart, W., Miller, J. and Lewontin, R., 2020. Human Pedigree Analysis. [online] Ncbi.nlm.nih.gov. Available at: <https://www.ncbi.nlm.nih.gov/books/NBK21257/> [Accessed 20 September 2020]. Khan, A., Ali, S., Jameela, R., Muhamood, M. and Haqh, M., 2020. Impact Of Fungiform <Em>Papillae</Em> Count On Taste Perception And Different Methods Of Taste Assessment And Their Clinical Applications: A Comprehensive Review. [Accessed 20 September 2020]. Melis, M. and Barbarossa, I., 2017. [online] NCBI. Available at: https://www.ncbi.nlm.nih.gov/pmc/articles/PMC5490520/ [Accessed 20 september 2020]. Nature.com. 2020. The Variety Of Genes In The Gene Pool Can Be Quantified Within A Population | Learn Science At Scitable. [online] Available at: <https://www.nature.com/scitable/topicpage/the-variety-of-genes-in-the-gene-6526291/> [Accessed 20 September 2020]. NIDCD. 2020. Global Variation In Sensitivity To Bitter-Tasting Substances (PTC Or PROP). [online] Available at: <https://www.nidcd.nih.gov/health/statistics/global-variation-sensitivity-bitter-tasting-substances-ptc-or-prop> [Accessed 20 September 2020]. Othman Smail, H., 2020. The Roles Of Genes In The Bitter Taste. [Accessed 20 September 2020]
Ruqaiya HUSSAIN, M., 2014. Prevalence And Genetic Analysis Of Bitter Taste Perception For Phenylthiocarbamide (PTC) Among Some Muslim Populations Of Uttar Pradesh, India. [online] PubMed Central (PMC). Available at: <https://www.ncbi.nlm.nih.gov/pmc/articles/PMC4433725/> [Accessed 20 September 2020]. Reference, G., 2020. TAS2R38 Gene. [online] Genetics Home Reference. Available at: <https://ghr.nlm.nih.gov/gene/TAS2R38> [Accessed 20 September 2020]. UK, K. and D, D., 2004. Singapore: Clinical genetics. [Accessed 20 September 2020] Wiley online library. 2020. Effect Of Physiological Factors, Pathologies, And Acquired Habits On The Sweet Taste Threshold: A Systematic Review And Meta-Analysis. [Accessed 20 September 2020]

31
APPENDICES
Appendix I: Bitter taste rating scale

32
Appendix II: Consent form volunteers

33
Appendix III: Consent forms for families