Embed Size (px)
Citation preview
WWW.IBISWORLD.COM Soda Production in the US November 2013 1
IBISWorld Industry Report 31211aSoda Production in the USNovember 2013 Hester Jeon
Fizzling out: Soda producers will refresh product lines to decelerate falling demand
2 About this Industry2 Industry Definition
2 Main Activities
2 Similar Industries
2 Additional Resources
3 Industry at a Glance
4 Industry Performance4 Executive Summary
4 Key External Drivers
6 Current Performance
8 Industry Outlook
10 Industry Life Cycle
12 Products & Markets12 Supply Chain
12 Products & Services
13 Demand Determinants
14 Major Markets
15 International Trade
17 Business Locations
19 Competitive Landscape19 Market Share Concentration
19 Key Success Factors
19 Cost Structure Benchmarks
22 Basis of Competition
23 Barriers to Entry
24 Industry Globalization
25 Major Companies25 The Coca-Cola Company
26 PepsiCo Inc.
27 Dr Pepper Snapple Group Inc.
29 Operating Conditions29 Capital Intensity
30 Technology & Systems
30 Revenue Volatility
31 Regulation & Policy
31 Industry Assistance
33 Key Statistics33 Industry Data
33 Annual Change
33 Key Ratios
34 Jargon & Glossary
www.ibisworld.com | 1-800-330-3772 | [email protected]
WWW.IBISWORLD.COM Soda Production in the US November 2013 2
Firms in the Soda Production industry manufacture soft drinks by blending various ingredients with artificially carbonated water. Producers of
naturally carbonated water, functional beverages like energy drinks and ice manufacturers are excluded from this industry.
The primary activities of this industry areCarbonated beverage manufacturing
Brand promotion
Research and development
31131 Sugar Processing in the USCompanies in this industry manufacture raw sugar, liquid sugar and refined sugar from sugarcane, raw cane sugar and sugar beets.
31193 Syrup & Flavoring Production in the USThis industry includes companies that manufacture flavoring syrup drink concentrates and related products for soda fountain use or for manufacturing soft drinks.
31199 Baking Mix & Prepared Food Production in the USCompanies in this industry manufacture food, including mixing purchased dried or dehydrated ingredients for foods such as soup mixes and bouillon.
31211b Bottled Water Production in the USThis industry includes companies that purify and bottle still and carbonated water for resale.
31211c Juice Production in the USCompanies in this industry produce still beverages, such as fruit juice, functional beverages or ready-to-drink tea and coffee.
Industry Definition
Main Activities
Similar Industries
Additional Resources
About this Industry
For additional information on this industrywww.ameribev.org American Beverage Association
www.beverageworld.com Beverage World
www.beverage-digest.com Beverage-Digest
The major products and services in this industry areDiet Carbonated Soft Drinks
Regular Carbonated Soft Drinks
Sparkling Water
WWW.IBISWORLD.COM Soda Production in the US November 2013 3
Gal
lons
48
36
38
40
42
44
46
1804 06 08 10 12 14 16Year
Per capita soft drink consumption
SOURCE: WWW.IBISWORLD.COM
% c
hang
e
8
!12
!8
!4
0
4
1905 07 09 11 13 15 17Year
Revenue Employment
Revenue vs. employment growth
Products and services segmentation (2013)
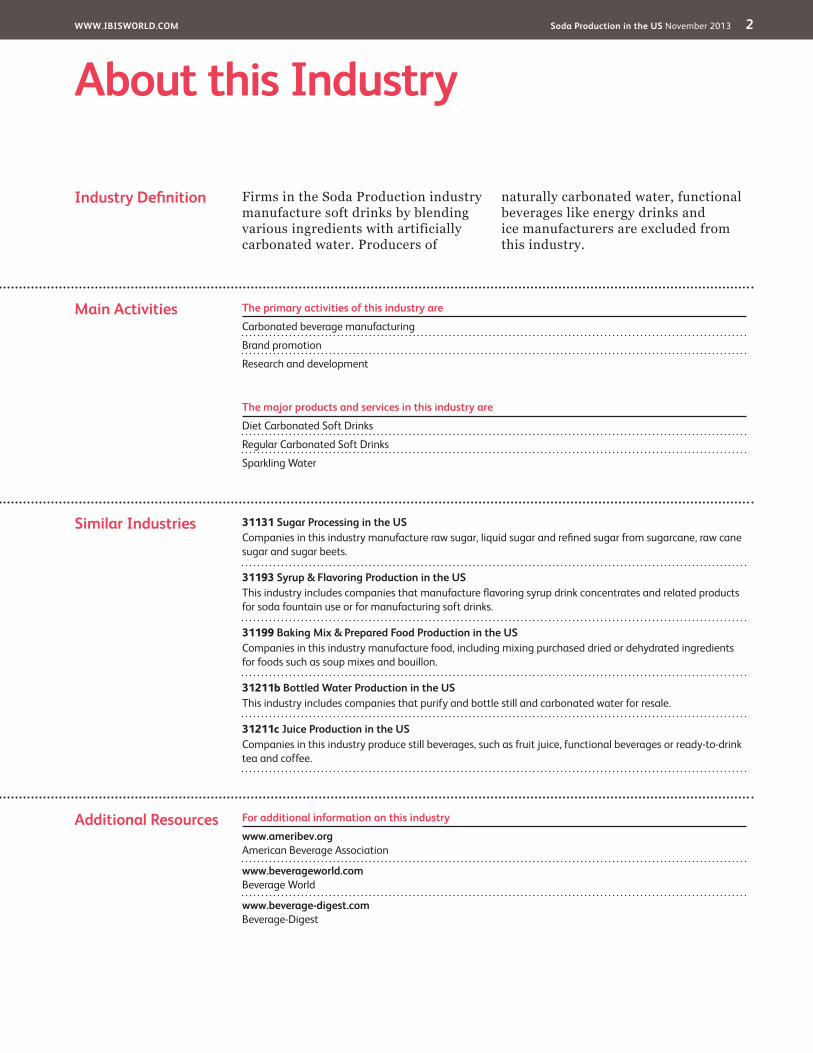
68.6%Regular Carbonated Soft Drinks
26.3%Diet Carbonated Soft Drinks
5.1%Sparkling Water
SOURCE: WWW.IBISWORLD.COM
Key Statistics Snapshot
Industry at a GlanceSoda Production in 2013
Industry Structure Life Cycle Stage Decline
Revenue Volatility Medium
Capital Intensity High
Industry Assistance Low
Concentration Level High
Regulation Level Medium
Technology Change Medium
Barriers to Entry High
Industry Globalization High
Competition Level High
Revenue
$19.7bnProfit
$807.6mExports
$623.9mBusinesses
194
Annual Growth 13-18
-1.0%Annual Growth 08-13
-1.3%
Key External DriversPer capita soft drink consumptionDemand from supermarkets and grocery storesExternal competition for the Soda Production industryPrice of cornHealthy eating index
Market ShareThe Coca-Cola Company 41.9%PepsiCo Inc. 30.3%Dr Pepper Snapple Group Inc. 14.8%
p. 25
p. 4
FOR ADDITIONAL STATISTICS AND TIME SERIES SEE THE APPENDIX ON PAGE 33
SOURCE: WWW.IBISWORLD.COM
WWW.IBISWORLD.COM Soda Production in the US November 2013 4
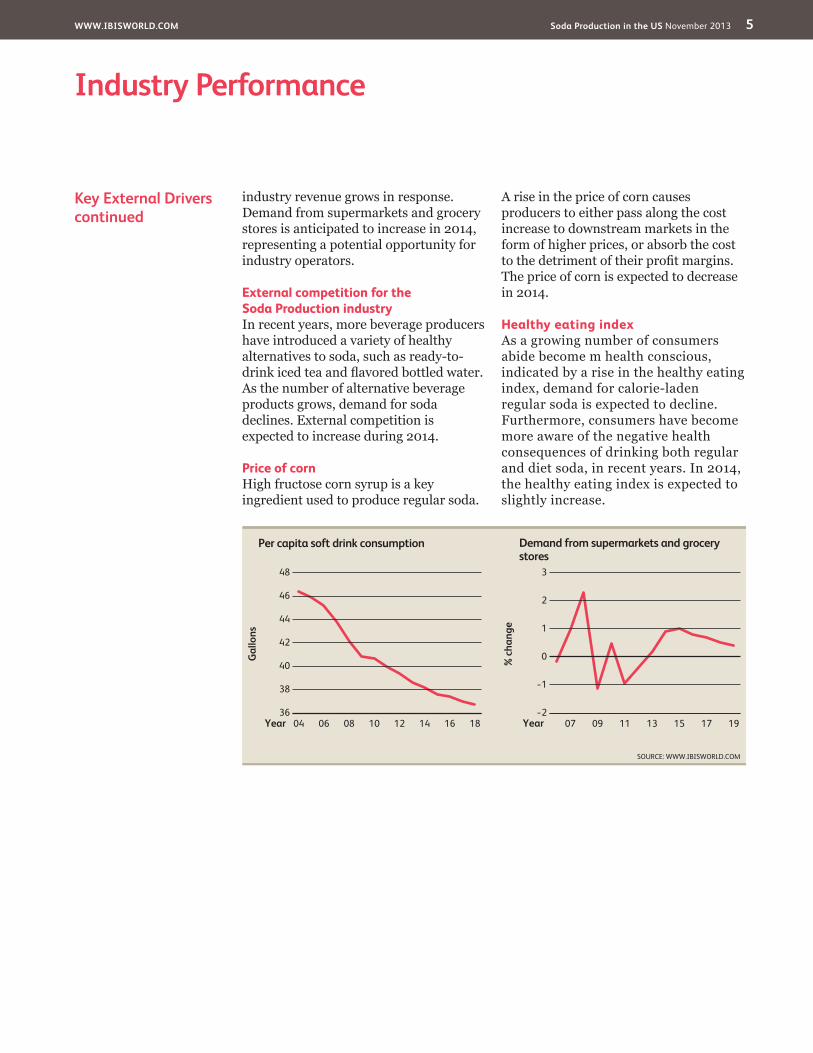
Key External Drivers Per capita soft drink consumptionAs per capita soft drink consumption declines, demand from downstream markets, such as wholesalers and retailers, will decline and negatively impact industry revenue. Furthermore, price-based competition intensifies in response to weakened demand, which can negatively affect producers’ revenue and profitability. Per capita soft drink consumption is expected to
decrease in 2014, representing a threat to industry operators.
Demand from supermarkets and grocery storesSupermarkets and grocery stores represent the largest downstream market for soda producers, making the demand from this market a strong indicator of industry performance. Moreover, as demand from grocery stores increases,
Executive Summary
Falling per capita soft drink consumption and increasing health awareness have placed downward pressure on the Soda Production industry’s revenue over the
2009 when lower disposable income levels caused Americans to reduce spending on discretionary items like soft
substitutes such as tap and bottled water. Additionally, the introduction of innovative substitutes such as ready-to-
contributed to the decline of soda. In
2013, the average American is anticipated
representing a decline from 42.1 gallons per capita in 2008. Consequently, industry revenue is estimated to decline an annualized 1.3% to $19.7 billion over
To mitigate the losses from a decline in consumption volume, major soda producers have introduced new soda products and consolidated their operations. Two of the leading soda producers, PepsiCo and Dr Pepper Snapple Group, launched new mid-
calorie soda products that appeal to consumers who dislike the taste of diet soda but do not want to consume the calories in regular soda. Furthermore, The Coca-Cola Company and PepsiCo integrated independent bottling companies into their business in 2010, helping boost industry revenue by 7.1% in 2011. As industry operators faced
demand and higher input costs, larger producers passed on some of the cost increases to downstream markets in the form of higher prices. Smaller producers that were unable to increase their product prices exited the industry as their
environment, as government campaigns promoting healthier drinking habits cause consumers to purchase less soda despite improving disposable income
introduce healthier soda products, volume consumption is anticipated to further decline as more soda taxes and bans are implemented at the state and city levels of government. Also, growing imports, particularly from Mexico, is also expected to dampen demand for industry products. As a result, IBISWorld forecasts industry revenue to decrease at an average annual rate of 1.0% to $18.7
Industry PerformanceExecutive Summary | Key External Drivers | Current Performance Industry Outlook | Life Cycle Stage
Soda producers have introduced new products to mitigate losses
WWW.IBISWORLD.COM Soda Production in the US November 2013 5
Industry Performance
Key External Driverscontinued
industry revenue grows in response. Demand from supermarkets and grocery stores is anticipated to increase in 2014, representing a potential opportunity for industry operators.
External competition for the Soda Production industryIn recent years, more beverage producers have introduced a variety of healthy alternatives to soda, such as ready-to-
As the number of alternative beverage products grows, demand for soda declines. External competition is expected to increase during 2014.
Price of cornHigh fructose corn syrup is a key ingredient used to produce regular soda.
A rise in the price of corn causes producers to either pass along the cost increase to downstream markets in the form of higher prices, or absorb the cost
The price of corn is expected to decrease in 2014.
Healthy eating indexAs a growing number of consumers abide become m health conscious, indicated by a rise in the healthy eating index, demand for calorie-laden regular soda is expected to decline. Furthermore, consumers have become more aware of the negative health consequences of drinking both regular and diet soda, in recent years. In 2014, the healthy eating index is expected to slightly increase.
% c
hang
e
3
!2
!1
0
1
2
1907 09 11 13 15 17Year
Demand from supermarkets and grocery stores
SOURCE: WWW.IBISWORLD.COM
Gal
lons
48
36
38
40
42
44
46
1804 06 08 10 12 14 16Year
Per capita soft drink consumption
WWW.IBISWORLD.COM Soda Production in the US November 2013 6
Industry Performance
Contracting profit Demand for carbonated soft drinks
years, as consumers have become more
drinking soda. The government, media and even soft drink producers themselves have vocalized the consequences of
soda and how drinking large volumes of regular soda can lead to obesity. The idea of implementing a tax on soda products
in 1994 and has since been applied by 33 states. More recently, Mayor Michael Bloomberg championed a soda ban that would prohibit the sale of sweetened
fast-food restaurants, full-service restaurants, delis, movie theaters, sports stadiums and food carts throughout New
York City. While this ban has not been passed yet, laws that prohibit the sale of large servings of sugary beverages can significantly dampen the demand for soda in such cities and cause other major cities to pass similar regulations. Meanwhile, leading soda producer TCCC launched an advertising campaign in the first half of 2013 that clearly communicates the calorie content of a regular can of Coca-Cola. Such initiatives launched by manufacturers and the government have contributed to declining demand for soda in recent years.
Soda producers have struggled to
years, as the cost of inputs continued to rise while the demand for both regular and diet soda dwindled. A number of the
Current Performance
The Soda Production industry has been negatively impacted by growing health concerns and the pervasiveness of diet-related diseases like diabetes. Consequently, many consumers have begun to substitute soda for healthier
and sports drinks, while others have eliminated soda from their diets altogether. However, strong brand loyalty to the leading soda brands has allowed major producers to maintain growth by charging higher prices for these products.
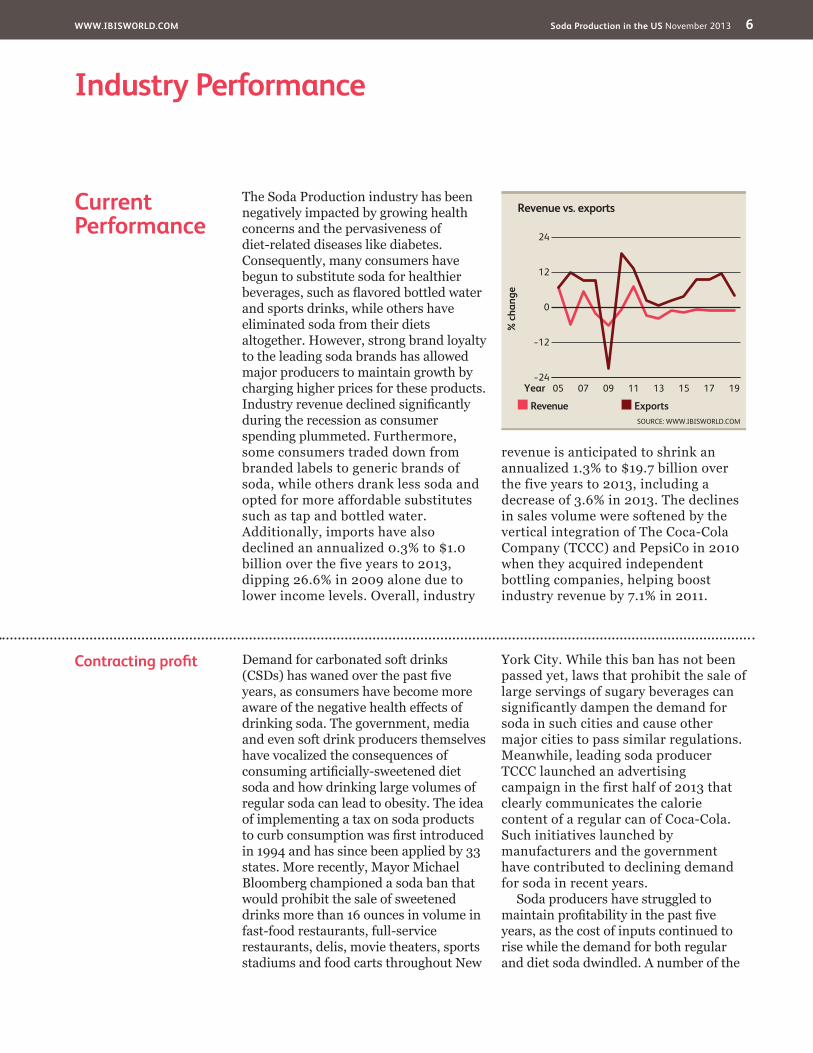
during the recession as consumer spending plummeted. Furthermore, some consumers traded down from branded labels to generic brands of soda, while others drank less soda and opted for more affordable substitutes such as tap and bottled water. Additionally, imports have also declined an annualized 0.3% to $1.0 billion over the five years to 2013,
lower income levels. Overall, industry
revenue is anticipated to shrink an annualized 1.3% to $19.7 billion over the five years to 2013, including a
in sales volume were softened by the vertical integration of The Coca-Cola Company (TCCC) and PepsiCo in 2010 when they acquired independent bottling companies, helping boost industry revenue by 7.1% in 2011.
% c
hang
e
24
!24
!12
0
12
1905 07 09 11 13 15 17Year
Revenue Exports
Revenue vs. exports
SOURCE: WWW.IBISWORLD.COM
WWW.IBISWORLD.COM Soda Production in the US November 2013 7
Industry Performance
Contracting profitcontinued
key inputs for soda production, such as corn, sugar and plastic, experienced drastic price increases. For instance, the price of corn is anticipated to rise at an
years to 2013, including a growth of 58.0% in 2011. In the same period, CSD prices are estimated to have grown at an average rate of 3.5% per year. As the cost of inputs rose faster than the price that soda producers charged downstream
have declined from 5.9% of revenue in 2008 to 4.1% in 2013. Due to slimming
the industry, causing enterprises to decline an annualized 0.4% to 194 over
workers employed in this industry decreased even faster, at an average
Despite a decline in industry
margins. Moreover, these corporations
increasing product prices after the recession, albeit at a conservative rate, in response to declining demand. Companies like PepsiCo and TCCC also invested heavily in advertising, spending on average $3.5 million to $4.0 million for thirty-second advertisement spots during the 2012 Super Bowl alone, according to Kapitall Inc. Advertising, which further strengthened brand loyalty among consumers and allowed producers to charge a premium for their products. Finally, major companies produce soda at a lower per-unit cost than smaller companies due to economies of scale, and the vertical integration of independent bottling partners into TCCC and PepsiCo further contributed to their bottom lines.
Competition and innovation
As more consumers sought cost savings in the grocery store during the recession, the demand for generic soda products rose slightly in 2009. As competition
brands increased while overall demand for soda continued to decline, major companies such as Dr Pepper Snapple Group (DPS) and PepsiCo took several proactive steps to entice consumers to purchase their products. For instance, the leading soda producers expanded the availability of their products, particularly regional soda brands, in multiple channels including fast-food restaurants and convenience stores.
New soda products were also introduced by the leading soda
themselves from generic soda brands. For example, PepsiCo and DPS both introduced low-calorie soda products to appeal to a consumer group that dislikes
the taste of diet soda but is wary of consuming the calories in regular soda. Dr Pepper Ten, which has only ten calories per serving, was launched in 2011 and helped boost the company’s
PepsiCo also launched Pepsi Next, a mid-calorie soda containing 30% less sugar than regular Pepsi, in 2012. While the growth of these new products has not
new varieties have helped decelerate declining demand for industry products. Additionally, while soda exports only account for an estimated 3.2% of industry
The industry will continue to innovate to present consumers with healthier drink options
WWW.IBISWORLD.COM Soda Production in the US November 2013 8
Industry Performance
Health concerns and product innovation
Demand for regular and diet CSDs is anticipated to decline further in the next
concerns. Many state and local
further limit the sale of CSDs in the upcoming years. For instance, more states will implement a soda tax to discourage consumers from purchasing soda frequently. According to a study conducted by the American Journal of
the price of regular CSDs can lower the sales of regular soft drinks and cause some people to turn to substitute beverages. Additionally, the possible passage of the soda ban in New York City will dampen demand for soda in one of the largest cities in the United States. The passage of such a law can also spur on similar regulations in other cities and
towns throughout the country, which would further lower the demand for soda in the upcoming years. Finally, initiatives such as Michelle Obama’s recent “Drink Up!” campaign will encourage Americans to drink more water and purifying
drinks like soda.In order to combat declining demand,
producers will continue to introduce new products that satisfy the health and nutrition needs of consumers. In particular, leading companies like PepsiCo are expected to create new low- and zero-calorie soda products that are sweetened with only natural
sweeteners or a combination of natural
products that are branded as all natural will help boost demand and slow the
Industry Outlook
Industry revenue is anticipated to follow its downward trend as consumers continue to turn away from sugar- and artificially-sweetened beverages. Demand from downstream markets is expected to stagnate as state and local governments continue to push for the passage of additional taxes on soda. Also, growing health consciousness will cause some consumers to drink substitute beverages that are considered healthier than carbonated soft drinks (CSDs). Over the five years to 2018, IBISWorld forecasts industry revenue to decrease at an average annual rate of 1.0% to $18.7 billion, which is a slower decline than the
previous five-year period. In 2014, revenue is anticipated to moderately decline by 1.0%, as macroeconomic conditions continue to recover but more consumers commit to healthier eating and drinking habits. Producers will gradually lower the price they charge downstream markets to entice consumers to purchase their products.
Competition and innovationcontinued
revenue in 2013, exports are anticipated United States. Exports have historically remained very low due to the high transport costs associated with ready-to-drink CSDs.
Increasingly health-conscious consumers will buy fewer soft drinks, denting revenue
WWW.IBISWORLD.COM Soda Production in the US November 2013 9
Industry Performance
Health concerns and product innovationcontinued
decline of the overall beverage category. All-natural soda brands such as Dry Soda have been in the market for years, but as major producers move into the all-natural soda business, demand for this
Another factor that is anticipated to dampen the demand for industry goods is the growth of imported soda. Although
imports are only expected to account for 5.0% of domestic demand in 2013, imported soda is projected to grow an annualized 7.8% to $1.5 billion in 2018. As the Mexican immigrant population continues to rise, demand for imported CSDs from Mexico will contribute to the growth of imports, increasing the competition for domestic producers.
Steady profit Competition in the Soda Production industry will remain intense, stimulating industry consolidation. Major companies are expected to continue streamlining operations for cost savings. For instance, TCCC plans to further integrate bottling operations around the country to obtain greater control of its bottling and distributing processes and boost
corn, a key ingredient used to produce soda, is anticipated to decline an
2018, helping producers maintain their
like TCCC and PepsiCo acquire smaller regional or specialty soda brands to expand their market reach, the number of enterprises is anticipated to decline at an average annual rate of 1.5% to 180 during this time period. The number of industry employees is expected to drop
2018, as the industry consolidates and
Cost savings will allow producers to lower the prices they charge downstream markets in order to boost demand for
anticipated to remain unchanged from 2008, accounting for 4.1% of industry
remain stable due to lower costs, revenue will decline as demand for soda continues to dwindle. However, exports will help slow the decline of industry revenue, as exports are anticipated to grow an annualized 7.5% to $894.7 million over
Growth in prices for inputs like sugar will slow
WWW.IBISWORLD.COM Soda Production in the US November 2013 10
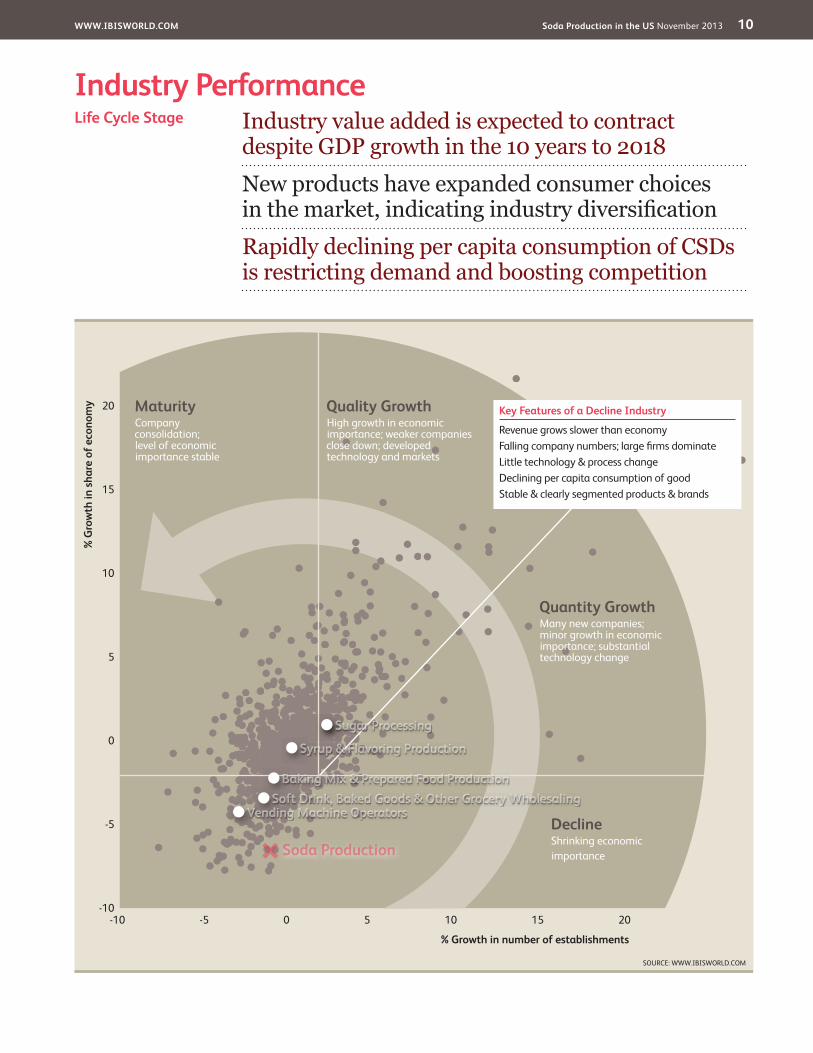
Industry PerformanceIndustry value added is expected to contract despite GDP growth in the 10 years to 2018New products have expanded consumer choices
is restricting demand and boosting competition
Life Cycle Stage
SOURCE: WWW.IBISWORLD.COM
20
15
10
5
0
-5
-10
% G
row
th in
shar
e of
eco
nom
y
% Growth in number of establishments
-10 -5 0 5 10 15 20
DeclineShrinking economicimportance
Quality GrowthHigh growth in economic importance; weaker companies close down; developed technology and markets
MaturityCompany consolidation;level of economic importance stable
Quantity GrowthMany new companies; minor growth in economic importance; substantial technology change
Key Features of a Decline Industry
Revenue grows slower than economyFalling company numbers; large fi rms dominateLittle technology & process changeDeclining per capita consumption of goodStable & clearly segmented products & brands
Sugar Processing
Soft Drink, Baked Goods & Other Grocery Wholesaling
Syrup & Flavoring Production
Vending Machine Operators
Baking Mix & Prepared Food Production
Soda Production
WWW.IBISWORLD.COM Soda Production in the US November 2013 11
Industry Performance
Industry Life Cycle The Soda Production industry is in the declining stage of its life cycle. Over the 10 years to 2018, industry value added (IVA), which measures an industry’s contribution to the economy, is forecast to decrease an annualized 2.7%. In comparison, GDP is projected to grow 2.1% per year on average over the same period. IVA is anticipated to decline every year during this period, excluding an increase in 2011 when industry revenue boosted due to PepsiCo’s and The Coca-Cola Company’s vertical integration of independent bottling companies into their businesses.
Heightened consumer awareness of
both regular and diet soda has contributed to the decline of demand for industry products. There have been successful new product introductions in
either zero- or low-calorie products. However, the two distinct product segments in this industry, regular and diet soft drinks, have both experienced volume sales declines. While new, all-natural soda brands, like Dry Soda, have enticed consumers seeking healthier alternatives, they have not been able to slow the decline of the overall beverage category. Furthermore, the number of establishments is anticipated to decline at an average annual rate of 0.4% to 328 over the 10 years to 2018 as smaller
the industry. The number of enterprises is expected to decline at an even faster rate per year over the same period as larger producers acquire smaller regional operators and their bottling operations to
This industry is Declining
WWW.IBISWORLD.COM Soda Production in the US November 2013 12
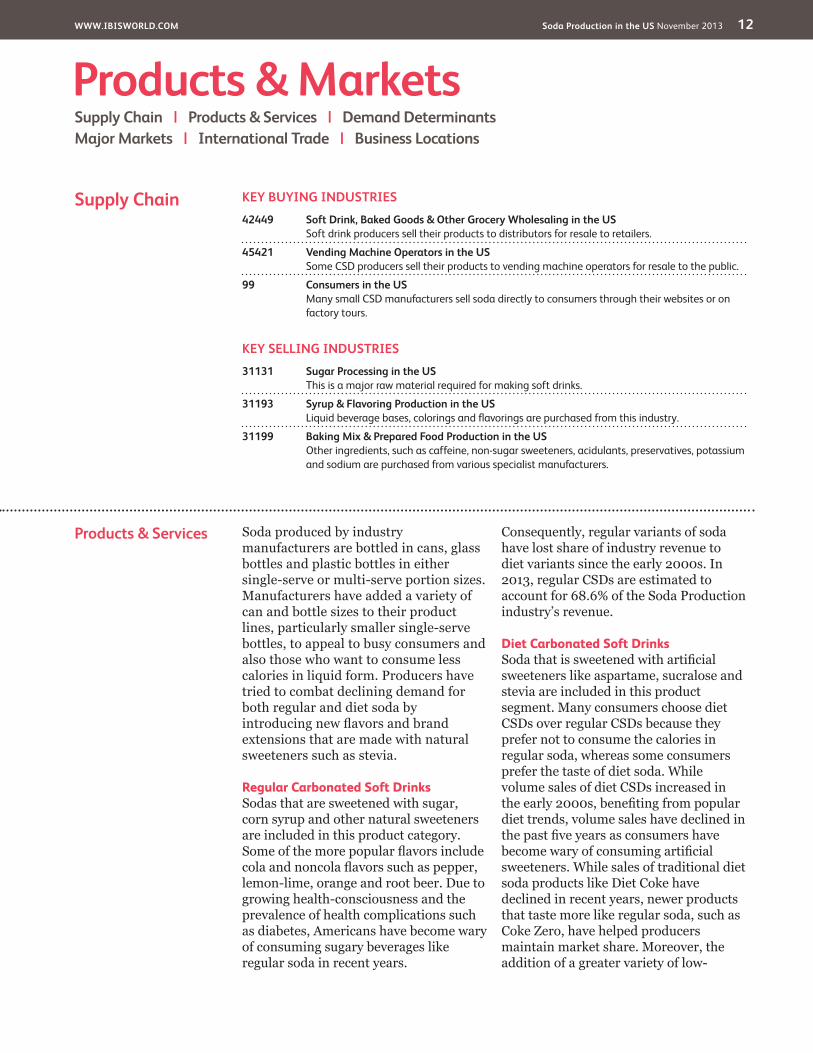
Products & Services Soda produced by industry manufacturers are bottled in cans, glass bottles and plastic bottles in either single-serve or multi-serve portion sizes. Manufacturers have added a variety of can and bottle sizes to their product lines, particularly smaller single-serve bottles, to appeal to busy consumers and also those who want to consume less calories in liquid form. Producers have tried to combat declining demand for both regular and diet soda by
extensions that are made with natural sweeteners such as stevia.
Regular Carbonated Soft DrinksSodas that are sweetened with sugar, corn syrup and other natural sweeteners are included in this product category.
lemon-lime, orange and root beer. Due to growing health-consciousness and the prevalence of health complications such as diabetes, Americans have become wary of consuming sugary beverages like regular soda in recent years.
Consequently, regular variants of soda have lost share of industry revenue to diet variants since the early 2000s. In 2013, regular CSDs are estimated to
industry’s revenue.
Diet Carbonated Soft Drinks
sweeteners like aspartame, sucralose and stevia are included in this product segment. Many consumers choose diet CSDs over regular CSDs because they prefer not to consume the calories in regular soda, whereas some consumers prefer the taste of diet soda. While volume sales of diet CSDs increased in
diet trends, volume sales have declined in
sweeteners. While sales of traditional diet soda products like Diet Coke have declined in recent years, newer products that taste more like regular soda, such as Coke Zero, have helped producers maintain market share. Moreover, the addition of a greater variety of low-
Products & MarketsSupply Chain | Products & Services | Demand Determinants Major Markets | International Trade | Business Locations
KEY BUYING INDUSTRIES42449 Soft Drink, Baked Goods & Other Grocery Wholesaling in the US
Soft drink producers sell their products to distributors for resale to retailers.
45421 Vending Machine Operators in the US Some CSD producers sell their products to vending machine operators for resale to the public.
99 Consumers in the US Many small CSD manufacturers sell soda directly to consumers through their websites or on factory tours.
KEY SELLING INDUSTRIES31131 Sugar Processing in the US
This is a major raw material required for making soft drinks.
31193 Syrup & Flavoring Production in the US Liquid beverage bases, colorings and flavorings are purchased from this industry.
31199 Baking Mix & Prepared Food Production in the US Other ingredients, such as caffeine, non-sugar sweeteners, acidulants, preservatives, potassium and sodium are purchased from various specialist manufacturers.
Supply Chain
WWW.IBISWORLD.COM Soda Production in the US November 2013 13
Products & Markets
DemandDeterminants
Demand for industry products depends on a number of factors including price levels, consumers’ health concerns and product innovation. Generally, higher prices for soda will place downward pressure on all varieties of CSDs. Due to the homogeneous characteristic of soda, when the price of branded products increases at the retail level, many
branded products or trade down to generic brands. However, many soda drinkers are also very brand-loyal and will purchase their favorite brand despite price increases. Additionally, higher per capita disposable income can allow consumers to purchase more soda,
whereas a dip in disposable income levels will deter consumers from purchasing industry goods. Furthermore, when disposable income levels dropped during the recession, demand from food service establishments declined as consumers dined out at restaurants less frequently than before.
Growing health and nutrition concerns have negatively impacted demand for soda in recent years. Although producers introduced a greater variety of low-calorie and naturally sweetened soda, Americans still perceive CSDs as unhealthy when compared with bottled water, iced tea and functional beverages. In response to changing lifestyles,
Products & Servicescontinued
calorie products such as Dr Pepper Ten and Pepsi Next have decelerated the decline of diet soda products. Altogether, the diet CSD segment is
industry revenue in 2013.
Sparkling WaterSales of sparkling water, including plain and flavored varieties, have grown over the past five years, accounting for a greater share of industry revenue.
Despite a decline of volume sales during the recession, demand has grown rapidly as many consumers have substituted sugary regular soda and unhealthy diet soda products for carbonated sparkling water. Also, the introduction of new flavors such as peach nectarine and crisp apple have helped boost this product segment’s revenue. As such, sparkling water is anticipated to account for 5.1% of industry revenue in 2013.
Products and services segmentation (2013)
Total $19.7bn
68.6%Regular Carbonated Soft Drinks
26.3%Diet Carbonated Soft Drinks
5.1%Sparkling Water
SOURCE: WWW.IBISWORLD.COM
WWW.IBISWORLD.COM Soda Production in the US November 2013 14
Products & Markets
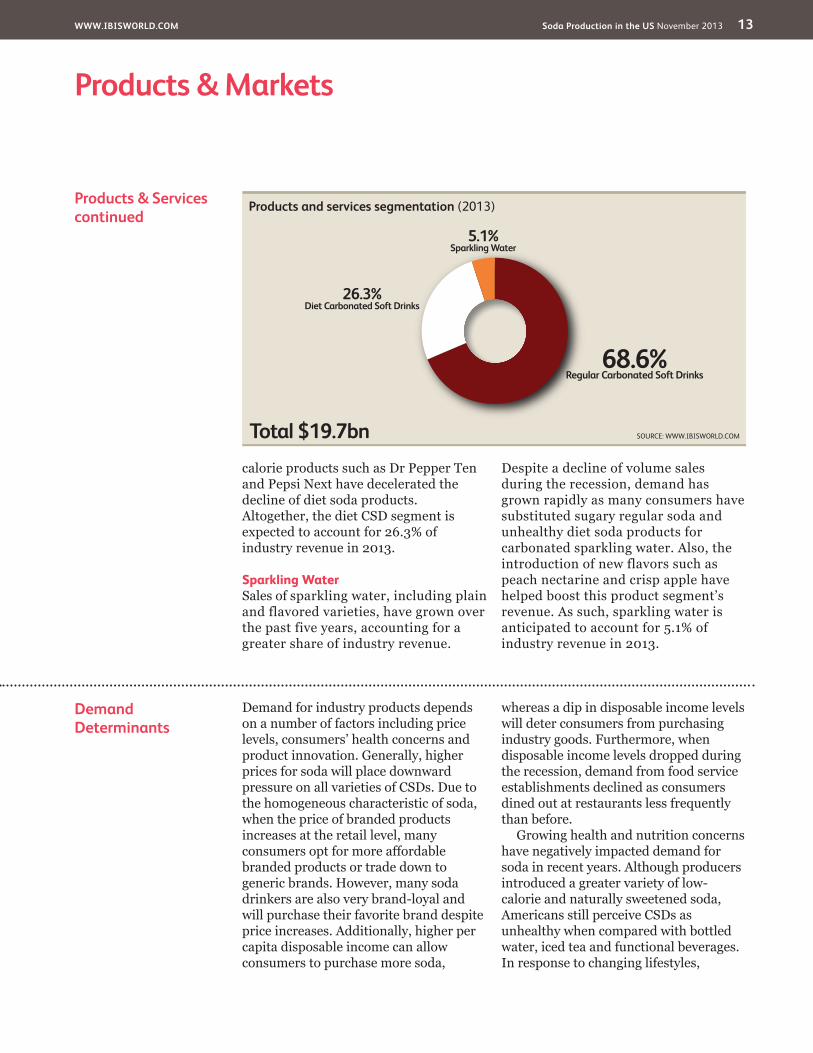
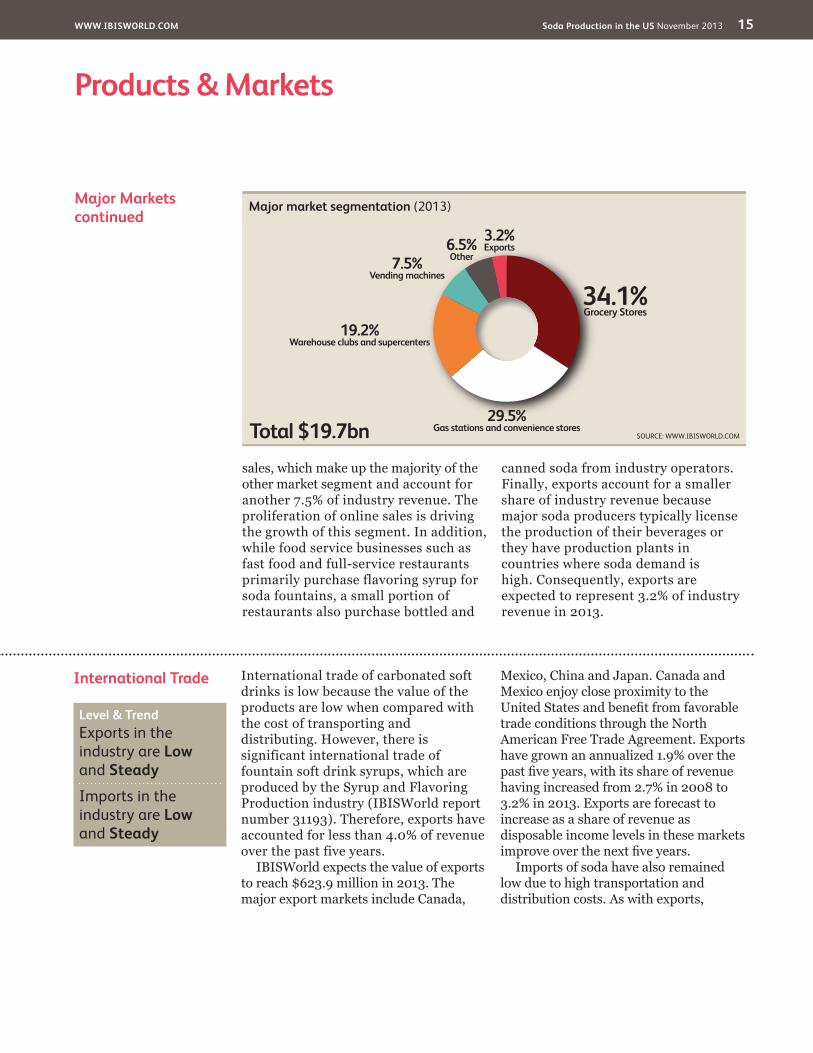
Major Markets Supermarkets and grocery storesGrocery stores represent the largest single market soda producers. This market segment is a reliable source of sales for soft drink manufacturers and is the most important retail channel for consumers. Due to growing health consciousness in recent years, consumers have purchased less soda from this retail channel than in prior years. Despite a decline in demand from supermarkets, this market segment’s share of industry revenue has remained
demand from other retail channels have declined at a faster rate. In 2013, supermarkets are anticipated to account for about 39.9% of revenue.
Gas stations and convenience storesGas stations and convenience stores constitute a key market for soda manufacturers, especially because they are often open 24 hours per day, making them an ideal location for impulse purchases of beverages and snacks. Their share of industry revenue has increased steadily
growing need for convenience. This segment includes standalone convenience stores, as well as stores attached to gas stations and generates about 29.5% of industry revenue.
Warehouse clubs and supercentersThe next largest market includes warehouse clubs and supercenters. Since
the 2008 economic downturn, more people have been regularly buying soda in bulk, which increased the sale of CSDs in this retail channel. Additionally, major retailers in this channel, such as Walmart, have allocated more space within their stores to food and beverages in recent years. Consequently, more consumers have begun to rely on this retail channel to purchase groceries. Finally, many food service businesses also purchase soda in bulk from this retail segment, which is estimated to account for about 19.2% of industry revenue in 2013.
Vending machine operatorsVending machines and individual vendors are convenient outlets for consumers, placed in locations such as rail and bus stations where no alternative vendors exist. Thus, they represent an important market for impulse purchases of soda. This segment
account for about 7.5% of revenue in 2013. Many consumers consciously cut down on impulse sales during this period due to low disposable income. Also, soda has been eliminated from most vending machines in public schools due to growing childhood obesity in the United States.
OtherOther domestic retailers include pharmacies, liquor stores and online
DemandDeterminantscontinued
producers introduced a greater variety of soda bottle sizes in recent years. For
ounce bottle and 7.5 ounce “mini” can in 2010 which was followed by the introduction of its 12.5 ounce bottle in 2011. Smaller serving sizes appeal to consumers who are wary of consuming calories in liquid form and those who
are sensitive to prices because these products are more affordable than larger serving sizes. Despite the influx of new products, the introduction of new noncarbonated beverages such as bottled iced tea, bottled iced coffee and sparkling fruit drinks has also placed downward pressure on the demand for soda.
WWW.IBISWORLD.COM Soda Production in the US November 2013 15
Products & Markets
International Trade International trade of carbonated soft drinks is low because the value of the products are low when compared with the cost of transporting and distributing. However, there is significant international trade of fountain soft drink syrups, which are produced by the Syrup and Flavoring Production industry (IBISWorld report number 31193). Therefore, exports have accounted for less than 4.0% of revenue over the past five years.
IBISWorld expects the value of exports
major export markets include Canada,
Mexico, China and Japan. Canada and Mexico enjoy close proximity to the
trade conditions through the North American Free Trade Agreement. Exports have grown an annualized 1.9% over the
having increased from 2.7% in 2008 to 3.2% in 2013. Exports are forecast to increase as a share of revenue as disposable income levels in these markets
Imports of soda have also remained low due to high transportation and distribution costs. As with exports,
Major Marketscontinued
sales, which make up the majority of the other market segment and account for another 7.5% of industry revenue. The proliferation of online sales is driving the growth of this segment. In addition, while food service businesses such as fast food and full-service restaurants primarily purchase flavoring syrup for soda fountains, a small portion of restaurants also purchase bottled and
canned soda from industry operators. Finally, exports account for a smaller share of industry revenue because major soda producers typically license the production of their beverages or they have production plants in countries where soda demand is high. Consequently, exports are expected to represent 3.2% of industry revenue in 2013.
Major market segmentation (2013)
Total $19.7bn
34.1%Grocery Stores
3.2%Exports
29.5%Gas stations and convenience stores
19.2%Warehouse clubs and supercenters
7.5%Vending machines
6.5%Other
SOURCE: WWW.IBISWORLD.COM
Level & Trend Exports in the industry are Low and Steady Imports in the industry are Low and Steady
WWW.IBISWORLD.COM Soda Production in the US November 2013 16
Products & Markets
International Tradecontinued
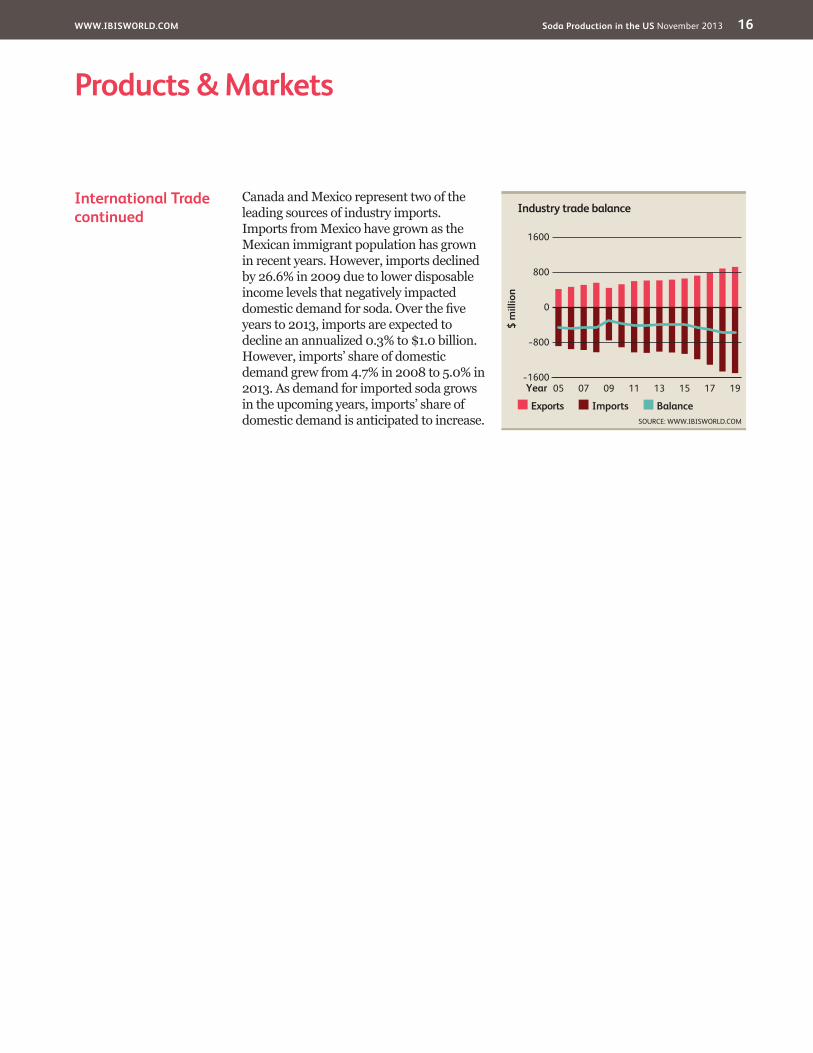
Canada and Mexico represent two of the leading sources of industry imports. Imports from Mexico have grown as the Mexican immigrant population has grown in recent years. However, imports declined
income levels that negatively impacted
years to 2013, imports are expected to decline an annualized 0.3% to $1.0 billion. However, imports’ share of domestic demand grew from 4.7% in 2008 to 5.0% in 2013. As demand for imported soda grows in the upcoming years, imports’ share of domestic demand is anticipated to increase.
$ m
illio
n
1600
!1600
!800
0
800
1905 07 09 11 13 15 17Year
Exports Imports Balance
Industry trade balance
SOURCE: WWW.IBISWORLD.COM
WWW.IBISWORLD.COM Soda Production in the US November 2013 17
Products & Markets
Business Locations 2013
MO1.8
West
West
West
Rocky Mountains Plains
Southwest
Southeast
New England
VT0.4
MA1.8
RI0.8
NJ2.6
DE0.4
NH0.8
CT1.4
MD1.3
DC0.3
1
5
3
7
2
6
4
8 9
Additional States (as marked on map)
AZ0.2
CA8.4
NV1.0
OR2.3
WA2.4
MT1.1
NE0.9
MN1.5
IA0.9
OH3.1 VA
2.4
FL4.7
KS1.2
CO2.2
UT1.1
ID1.1
TX6.5
OK1.8
NC3.4
AK0.2
WY0.3
TN2.4
KY1.4
GA3.3
IL3.9
ME0.8
ND0.3
WI2.2 MI
3.7 PA4.6
WV0.8
SD0.4
NM0.8
AR1.5
MS1.8
AL1.8
SC1.2
LA2.0
HI0.3
IN2.2
NY5.9 5
67
8
321
4
9
SOURCE: WWW.IBISWORLD.COM
Mid- Atlantic
Establishments (%)
Less than 3% 3% to less than 10% 10% to less than 20% 20% or more
Great Lakes
WWW.IBISWORLD.COM Soda Production in the US November 2013 18
Products & Markets
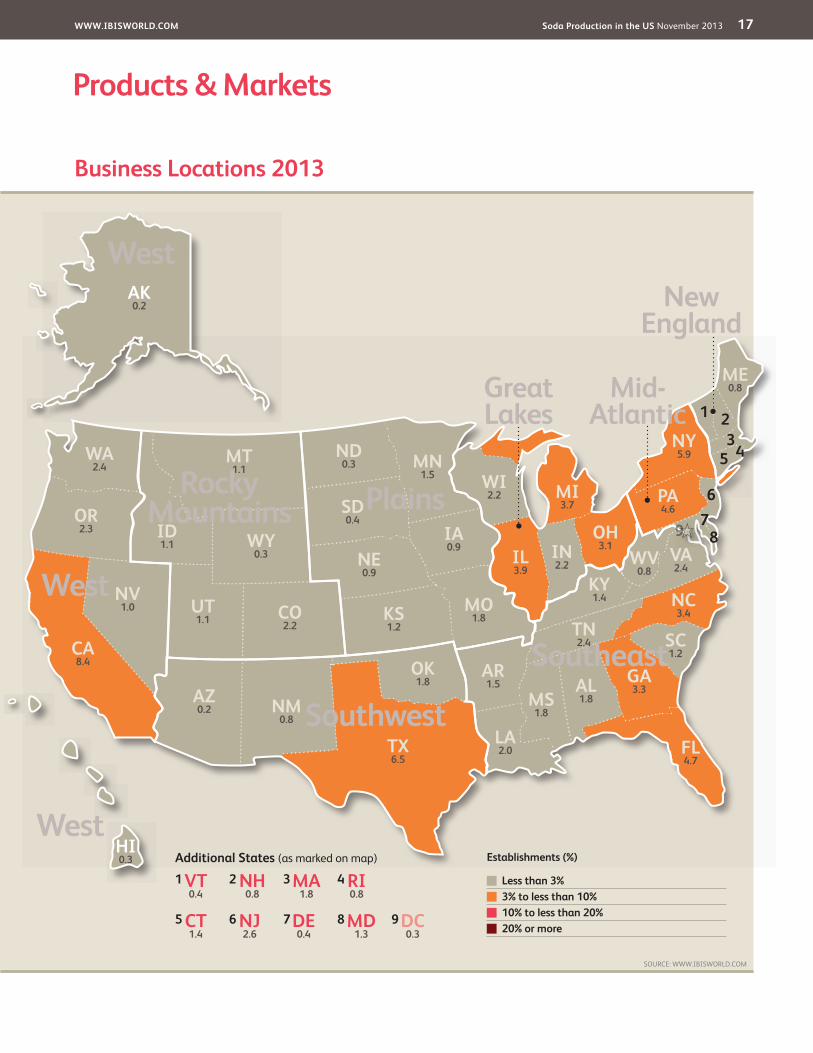
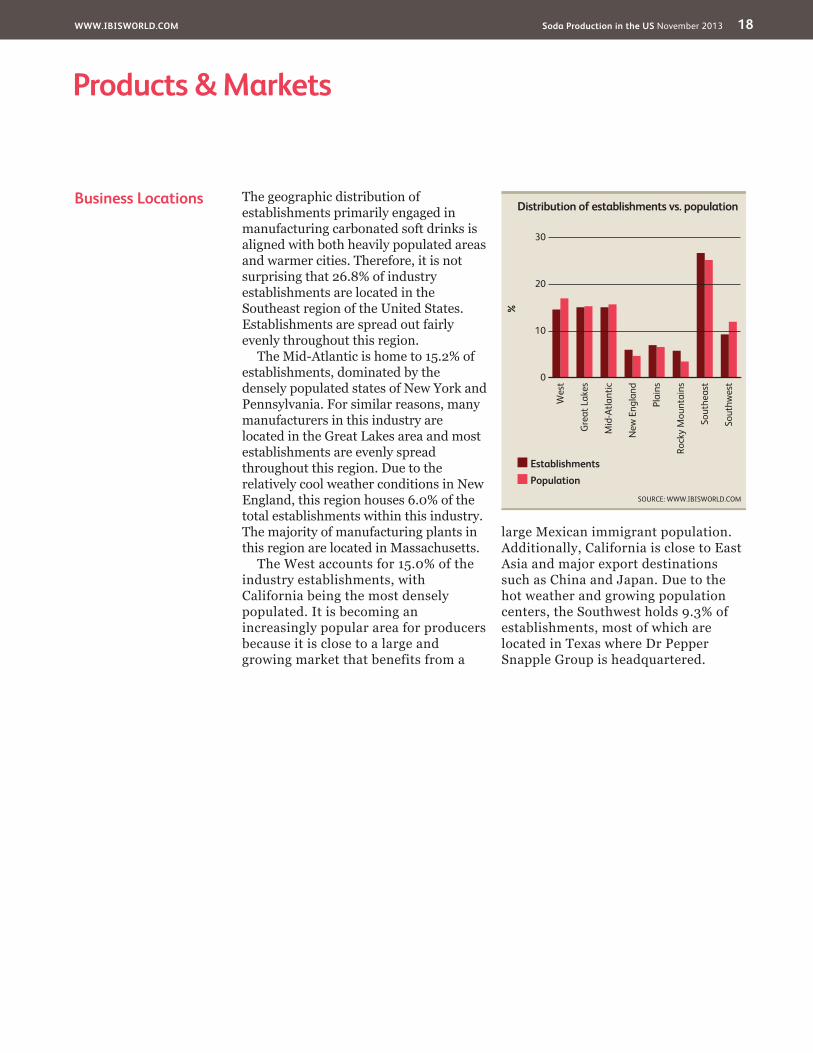
Business Locations The geographic distribution of establishments primarily engaged in manufacturing carbonated soft drinks is aligned with both heavily populated areas and warmer cities. Therefore, it is not
establishments are located in the Southeast region of the United States. Establishments are spread out fairly evenly throughout this region.
The Mid-Atlantic is home to 15.2% of establishments, dominated by the densely populated states of New York and Pennsylvania. For similar reasons, many manufacturers in this industry are located in the Great Lakes area and most establishments are evenly spread throughout this region. Due to the relatively cool weather conditions in New
total establishments within this industry. The majority of manufacturing plants in this region are located in Massachusetts.
The West accounts for 15.0% of the industry establishments, with California being the most densely populated. It is becoming an increasingly popular area for producers because it is close to a large and growing market that benefits from a
large Mexican immigrant population. Additionally, California is close to East Asia and major export destinations such as China and Japan. Due to the hot weather and growing population centers, the Southwest holds 9.3% of establishments, most of which are located in Texas where Dr Pepper Snapple Group is headquartered.
%
30
0
10
20
Sout
hwes
t
Wes
t
Gre
at L
akes
Mid
-Atla
ntic
New
Eng
land
Plai
ns
Rock
y M
ount
ains
Sout
heas
t
EstablishmentsPopulation
Distribution of establishments vs. population
SOURCE: WWW.IBISWORLD.COM
WWW.IBISWORLD.COM Soda Production in the US November 2013 19
Cost Structure Benchmarks
The industry’s cost structure is based on estimates for total enterprises, and thus, primary costs such as purchases and wages will vary from producer to producer. While changes in demand can
with greater resources are able to adjust quickly to market conditions.
Profit
earnings before interest and taxes,
accounted for an estimated 4.1% of
represents a decline from 5.9% in 2008.
producers in this industry are much higher than the average, regional soft drink and private label producers who are unable to charge higher prices for
many producers were pressured to lower the prices they charge downstream
Key Success Factors Control of distribution arrangements
channels are critical in this industry to minimize logistical costs and maximize sales at retail stores.
Aggressive marketing – given the high level of competitionDue to the high level of competition that exists among soda brands, the leading competitors heavily invest in advertising and promotions to drive demand for their products.
Economies of ScaleOperators that produce a greater number
Economies of scope
carbonated soft drinks allows manufacturers to appeal to a wider consumer group and enjoy lower production costs.
Ability to manage external contractsOutsourcing noncore functions can reduce costs and allow companies to focus on marketing and innovation.
Production of goods currently favored by the marketSuccessful producers must respond to consumers’ growing health concerns and shifting tastes by introducing new products that satisfy their needs.
Market Share Concentration
The Soda Production industry exhibits a high level of concentration. IBISWorld estimates that the four largest players account for a combined 89.9% of industry revenue. Market share has
The Coca Cola Company and PepsiCo, have undergone major structural changes. These companies previously partnered with a number of bottlers to
brand names but have recently acquired these bottling operations to obtain greater control of the production process.
and brand promotion activities in order to generate brand loyalty. Finally, the leading soda manufacturers have historically purchased regional brands to expand their presence in the market and diversify their product portfolios, which has raised the level of concentration in this industry.
Competitive LandscapeMarket Share Concentration | Key Success Factors | Cost Structure Benchmarks Basis of Competition | Barriers to Entry | Industry Globalization
Level Concentration in this industry is High
IBISWorld identifies 250 Key Success Factors for a business. The most important for this industry are:
WWW.IBISWORLD.COM Soda Production in the US November 2013 20
Competitive Landscape
Cost Structure Benchmarkscontinued
markets while investing in advertising and promotional campaigns. Therefore, a decline in revenue and increase in expenditures placed downward pressure on industry profit. Over the next five-year period, profitability is anticipated to remain steady as the leading producers benefit from lower costs achieved through consolidation and efficiency gains.
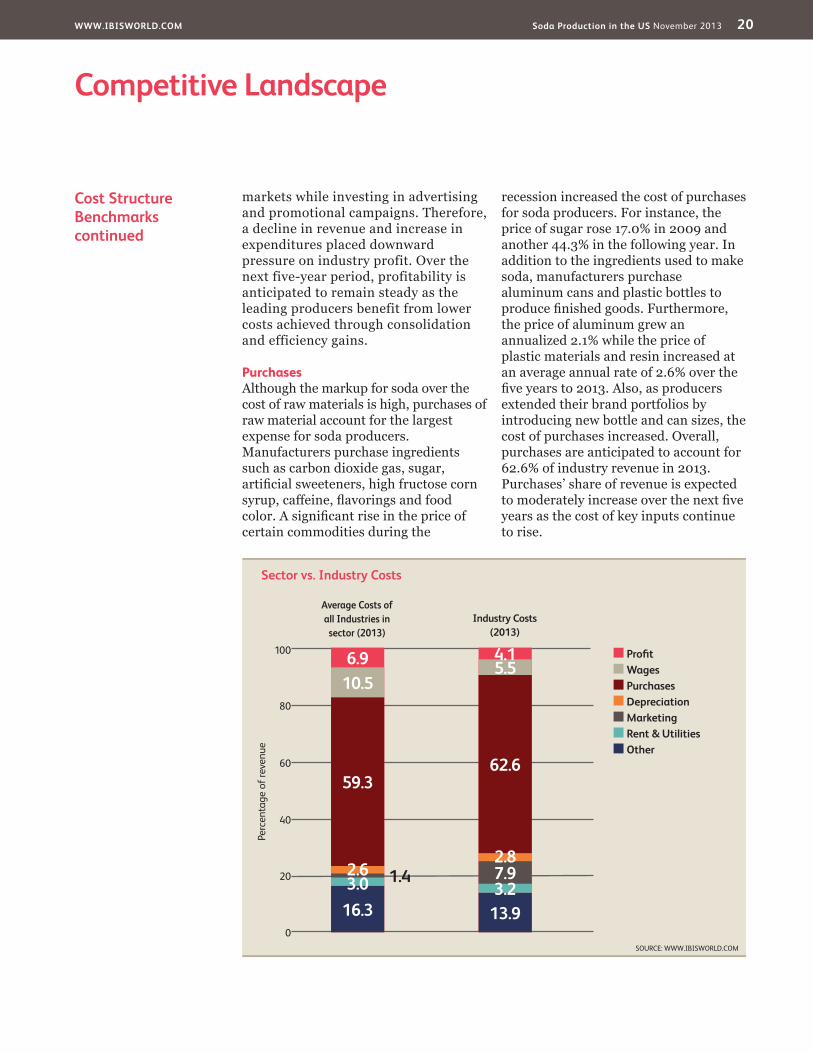
PurchasesAlthough the markup for soda over the cost of raw materials is high, purchases of raw material account for the largest expense for soda producers. Manufacturers purchase ingredients such as carbon dioxide gas, sugar,
certain commodities during the
recession increased the cost of purchases for soda producers. For instance, the price of sugar rose 17.0% in 2009 and another 44.3% in the following year. In addition to the ingredients used to make soda, manufacturers purchase aluminum cans and plastic bottles to
the price of aluminum grew an annualized 2.1% while the price of plastic materials and resin increased at
extended their brand portfolios by introducing new bottle and can sizes, the cost of purchases increased. Overall, purchases are anticipated to account for
Purchases’ share of revenue is expected
years as the cost of key inputs continue to rise.
Sector vs. Industry Costs
Profi t Wages Purchases Depreciation Marketing Rent & Utilities Other
Average Costs of all Industries in sector (2013)
Industry Costs (2013)
0
20
40
60
Perc
enta
ge o
f rev
enue
80
100 6.9
16.33.0 1.42.6
59.3
10.54.1
13.93.27.92.8
62.6
5.5
SOURCE: WWW.IBISWORLD.COM
WWW.IBISWORLD.COM Soda Production in the US November 2013 21
Competitive Landscape
Cost Structure Benchmarkscontinued
WagesLabor costs comprise about 5.5% of revenue, which is close the average for all beverage manufacturing industries. This
2008. The decline in wage costs can be attributed to fairly stagnant wage growth in manufacturing combined with
anticipated to decline at an average
years to 2013, as operators face declining demand for soda. This trend is anticipated to continue through 2018 as producers continue to cut costs in order
MarketingMarketing expenditure is expected to account for 7.9% of industry revenue. Advertising and promotions are a much higher proportion of industry costs in 2013 than in 2008 because of Coke and Pepsi’s integration with bottlers. Previously, these companies were solely
for the majority of brand marketing outside of the scope of the Soda Production industry. Marketing expenses accounted for only 4.3% of industry revenue before the acquisitions. Historically, soda producers have invested heavily in marketing compared with other manufacturing industries due to the high degree of competition that exists among soda brands.
Distribution
and rising proportion of industry revenue at 5.5%. Companies generally account for this expenditure as a part of selling and
administrative expenses. Producers ship
various markets. These activities are done in-house by larger producers but are outsourced by smaller producers, often to this industry’s larger competitors who operate extensive distribution routes. Producers also turn to wholesalers and
regions and retail channels.
OtherDepreciation comprises about 2.8% of revenue. It has risen slightly due to a rise in mechanization within the industry. Other expenditures make up 13.9% of revenue and include legal and administrative costs. Utility costs include electricity, gas and water expenses and represent 3.2% of revenue. Finally, rent accounts for 3.5% of industry revenue because of the large facilities in urban areas that are necessary to supply products at low distribution costs.
(see IBISWorld report 31193, Syrup and Flavoring Production). Because of the high degree of interdependence between
producers, the cost structure of this
drink producers. In particular, marketing
producers generates brand loyalty among consumers. This has become relevant particularly after the vertical integration of The Coca-Cola Company and PepsiCo they continue to sell syrup to smaller distributors in various regional markets throughout the country.
WWW.IBISWORLD.COM Soda Production in the US November 2013 22
Competitive Landscape
Basis of Competition Soda producers compete based on a number of factors including price levels,
innovation and marketing. While soda is a low ticket item for consumers, price levels became more important during the recession when per capita disposable
demand for industry goods declined due to lower consumer spending and growing health concerns, producers temporarily slashed the prices they charged downstream markets to boost demand. Additionally, the growth of
price competition among manufacturers.While price levels are important, many
brands and are willing to pay a premium for their brand of choice. The leading soda producers invest heavily in marketing and promotions to further drive brand loyalty among consumers. Due to shifting consumer tastes and growing health concerns, producers have introduced a variety of brand extensions that are made with healthier sweeteners and contain less calories. To capitalize on the growing popularity of natural zero-calorie sweeteners and low-calorie beverages, soda producers competed in
alternative low-calorie soda beverages.The range of products that a
manufacturer produces is also an important basis of competition. Industry operators produce a variety of soda
types, container sizes and caloric content.
producers a competitive advantage when dealing with retailers, boosts brand loyalty among consumers and allows producers to tap into new markets and consumer groups. Additionally, wholesalers and large retailers prefer to source a variety of goods from one producer rather than several producers to reduce their transaction costs, further
incentivizing producers to expand their product portfolios.
Finally, industry operators also compete for favorable contracts with retailers. While large retailers, such as Walmart and Safeway, possess abundant
brands, smaller downstream markets usually carry a limited number of products. Many convenience stores, vending machines and food service
manufacturer. For instance, many vending machines only carry Pepsi products or Coca-Cola products, which
competitors to win contracts with downstream markets.
External competitionCompetition with producers of other
growth of the Bottled Water industry (IBISWorld report 31211b) and Juice Production industry (IBISWorld report 31211c) have hampered revenue growth for soda producers. Products that are manufactured by juice producers such as
energy drinks and sparkling fruit drinks have all grown in recent years. While larger manufacturers like PepsiCo and The Coca-Cola Company also produce noncarbonated beverages, the emergence of companies that specialize in these smaller beverage categories continue to threaten the position of the major soda producers. Additionally, external competition has grown as consumers have become more health-conscious, seeking healthier alternatives to soda.
Operators in other beverage industries also compete with soda producers, albeit less directly. People may substitute soda
Snack Shop industry (IBISWorld report
Level & Trend Competition in this industry is High and the trend is Steady
WWW.IBISWORLD.COM Soda Production in the US November 2013 23
Competitive Landscape
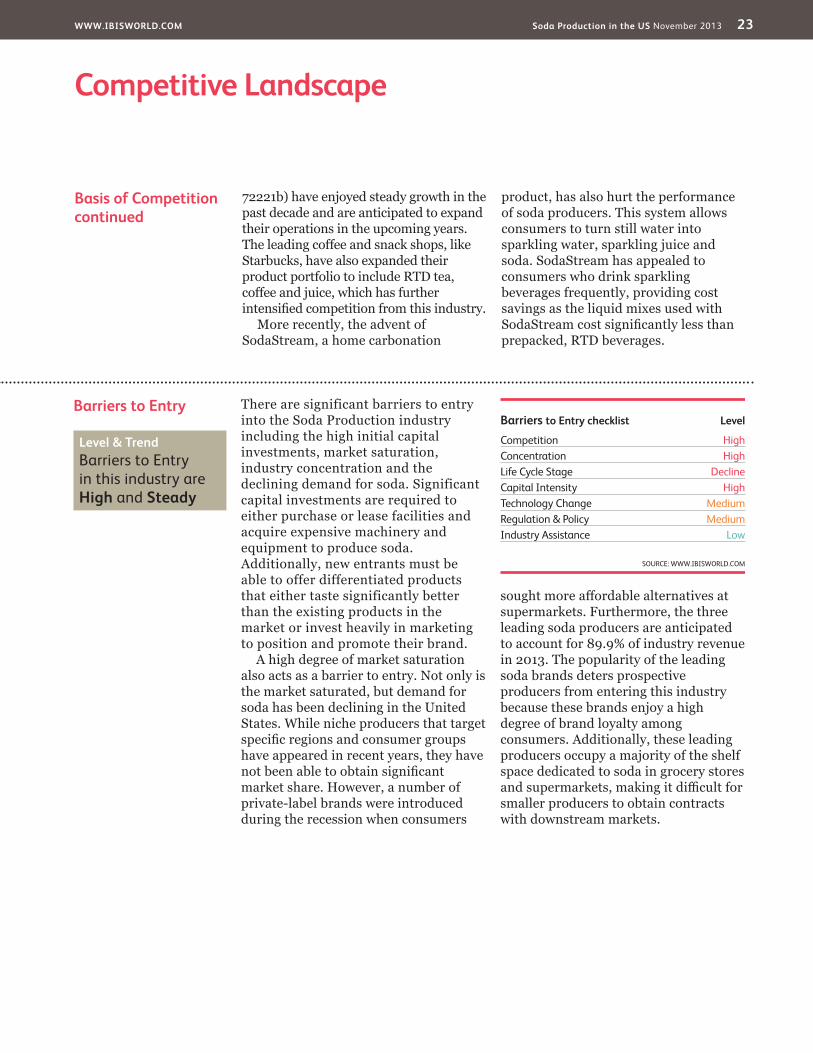
Barriers to Entry There are significant barriers to entry into the Soda Production industry including the high initial capital investments, market saturation, industry concentration and the declining demand for soda. Significant capital investments are required to either purchase or lease facilities and acquire expensive machinery and equipment to produce soda. Additionally, new entrants must be able to offer differentiated products that either taste significantly better than the existing products in the market or invest heavily in marketing to position and promote their brand.
A high degree of market saturation also acts as a barrier to entry. Not only is the market saturated, but demand for soda has been declining in the United States. While niche producers that target
have appeared in recent years, they have
market share. However, a number of private-label brands were introduced during the recession when consumers
supermarkets. Furthermore, the three leading soda producers are anticipated to account for 89.9% of industry revenue in 2013. The popularity of the leading soda brands deters prospective producers from entering this industry because these brands enjoy a high degree of brand loyalty among consumers. Additionally, these leading producers occupy a majority of the shelf space dedicated to soda in grocery stores
smaller producers to obtain contracts with downstream markets.
Basis of Competitioncontinued
72221b) have enjoyed steady growth in the past decade and are anticipated to expand their operations in the upcoming years.
Starbucks, have also expanded their
More recently, the advent of SodaStream, a home carbonation
product, has also hurt the performance of soda producers. This system allows consumers to turn still water into sparkling water, sparkling juice and soda. SodaStream has appealed to consumers who drink sparkling beverages frequently, providing cost savings as the liquid mixes used with
Barriers to Entry checklist Level
Competition HighConcentration HighLife Cycle Stage DeclineCapital Intensity HighTechnology Change MediumRegulation & Policy MediumIndustry Assistance Low
SOURCE: WWW.IBISWORLD.COM
Level & Trend Barriers to Entry in this industry are High and Steady
WWW.IBISWORLD.COM Soda Production in the US November 2013 24
Competitive Landscape
SOURCE: WWW.IBISWORLD.COM
Trade Globalization Going Global: Soda Production 2000-2013
Expo
rts/
Reve
nue
Expo
rts/
Reve
nue
200
150
100
50
0
200
150
100
50
0
Imports/Domestic Demand Imports/Domestic Demand0 040 4080 80120 120160 160
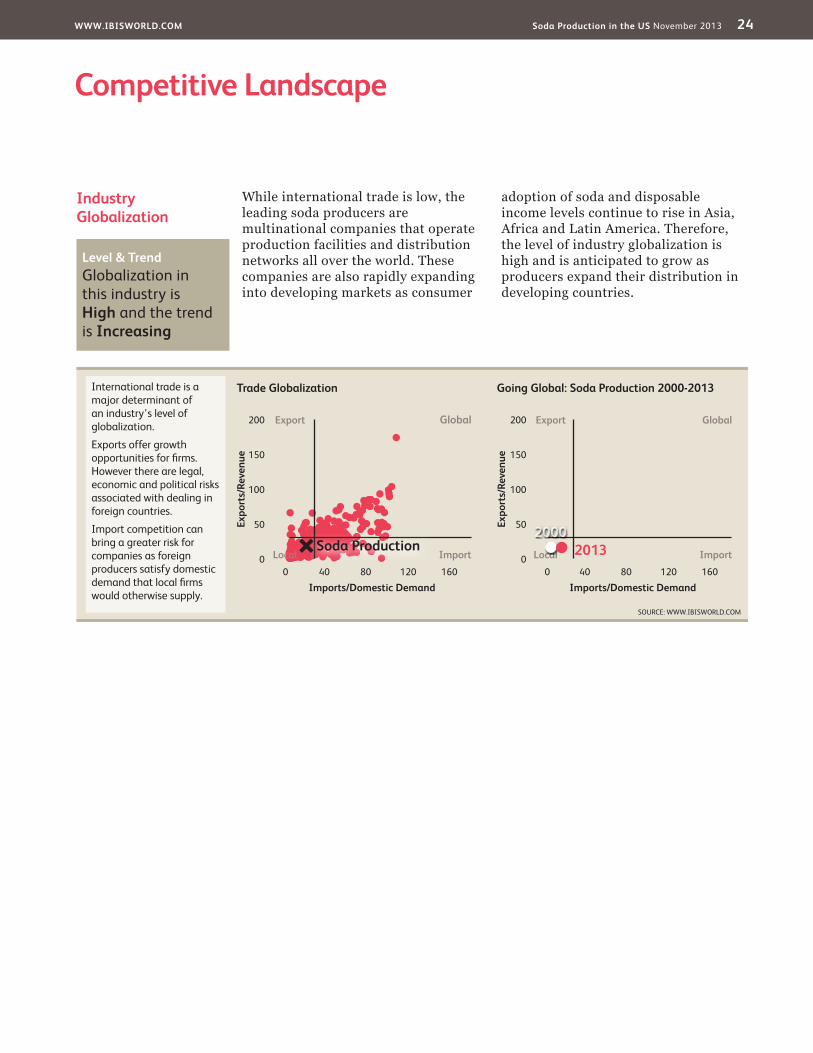
International trade is a major determinant of an industry’s level of globalization.Exports offer growth opportunities for fi rms. However there are legal, economic and political risks associated with dealing in foreign countries.Import competition can bring a greater risk for companies as foreign producers satisfy domestic demand that local fi rms would otherwise supply.
Export ExportGlobal Global
ImportLocal ImportLocalSoda Production
20002013
Industry Globalization
While international trade is low, the leading soda producers are multinational companies that operate production facilities and distribution networks all over the world. These companies are also rapidly expanding into developing markets as consumer
adoption of soda and disposable income levels continue to rise in Asia, Africa and Latin America. Therefore, the level of industry globalization is high and is anticipated to grow as producers expand their distribution in developing countries.
Level & Trend Globalization in this industry is High and the trend is Increasing
WWW.IBISWORLD.COM Soda Production in the US November 2013 25
Player Performance The Coca-Cola Company is the world’s largest beverage manufacturing company, with more than 500 brands of refreshments sold in over 200 countries. The company was originally founded in
drink. Coca-Cola has seven operating segments: Eurasia and Africa, Europe,
Bottling Investments and Corporate. Some of the most popular beverage brands produced by the company include Coca-Cola, Sprite, Dasani and Monster. Coca-Cola has also acquired a variety of
to diversify the business and reduce its dependence on carbonated soft drinks. Consequently, the industry leader earned total revenue of $48.0 billion in 2012.
Coca-Cola sold rights to mix and bottle its trademark beverages for more than a
century. However, the company acquired Coca-Cola Enterprises’ (CCE) North America division through a noncash transaction in 2010, which boosted the North America segment’s revenue
creation of a subdivision called Coca-Cola
the company’s national fountain, juice, distribution, marketing and other bottling operations with those of CCE.
Financial performance In recent years, the company’s still beverage category, which is excluded from this industry, has grown. However, consumption of its carbonated beverage products declined due to growing health concerns among consumers. Despite declining soda consumption, the company’s Coca-Cola and Fanta brands
Major CompaniesThe Coca-Cola Company | PepsiCo Inc.Dr Pepper Snapple Group Inc. | Other Companies
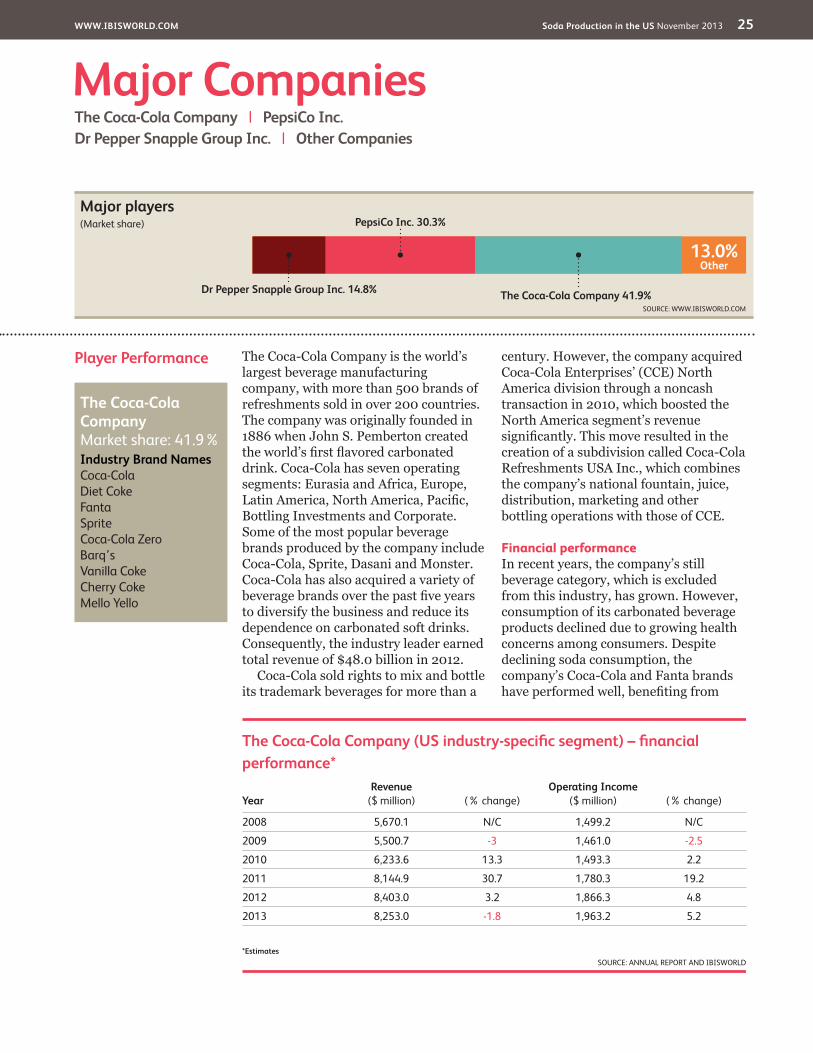
13.0%Other
The Coca-Cola Company 41.9%
PepsiCo Inc. 30.3%
Dr Pepper Snapple Group Inc. 14.8%SOURCE: WWW.IBISWORLD.COM
Major players(Market share)
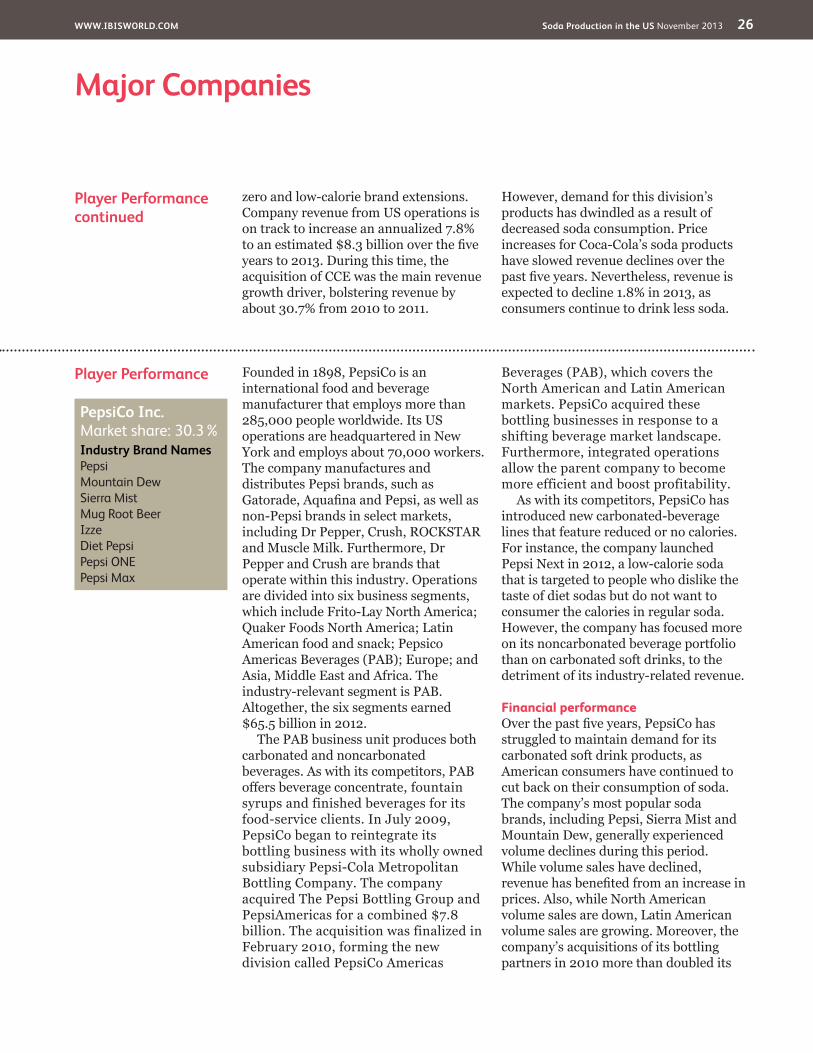
The Coca-Cola Company (US industry-specifi c segment) – fi nancial performance*
YearRevenue
($ million) (% change)Operating Income
($ million) (% change)
2008 5,670.1 N/C 1,499.2 N/C
2009 5,500.7 -3 1,461.0 -2.5
2010 6,233.6 13.3 1,493.3 2.2
2011 8,144.9 30.7 1,780.3 19.2
2012 8,403.0 3.2 1,866.3 4.8
2013 8,253.0 -1.8 1,963.2 5.2
*EstimatesSOURCE: ANNUAL REPORT AND IBISWORLD
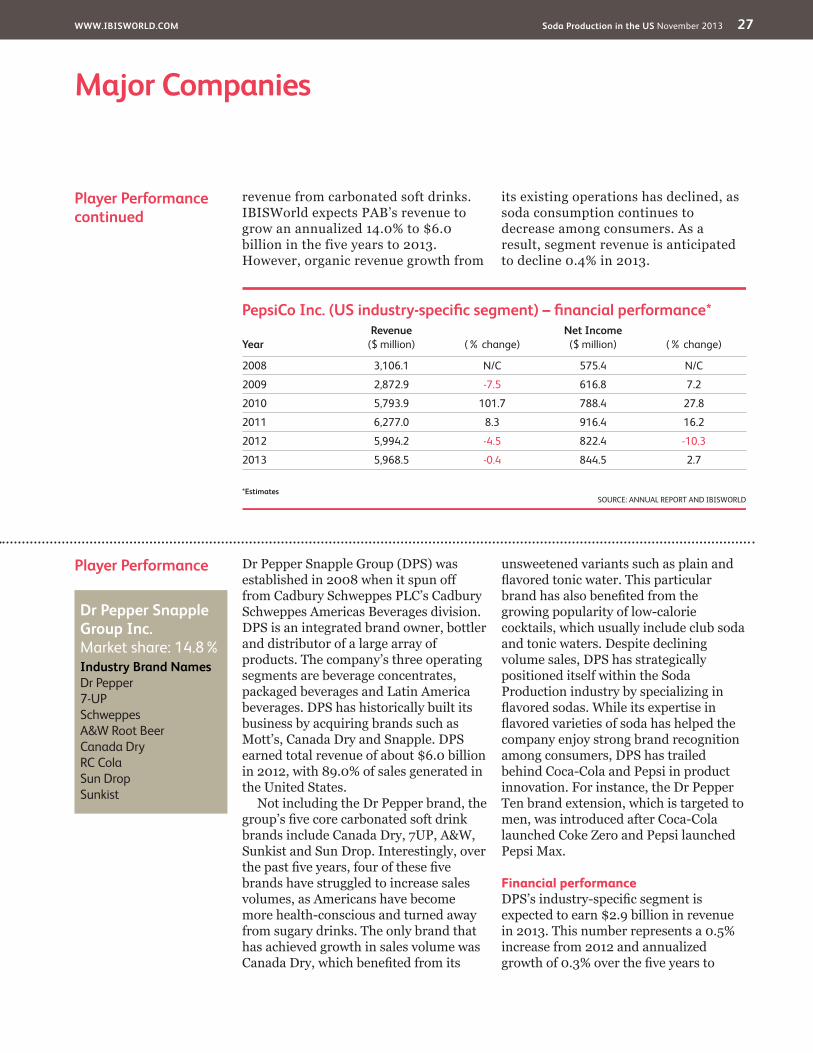
The Coca-Cola Company Market share: 41.9% Industry Brand Names Coca-Cola Diet Coke Fanta Sprite Coca-Cola Zero Barq’s Vanilla Coke Cherry Coke Mello Yello
WWW.IBISWORLD.COM Soda Production in the US November 2013 26
Major Companies
Player Performance Founded in 1898, PepsiCo is an international food and beverage manufacturer that employs more than 285,000 people worldwide. Its US operations are headquartered in New York and employs about 70,000 workers. The company manufactures and distributes Pepsi brands, such as
non-Pepsi brands in select markets,
and Muscle Milk. Furthermore, Dr Pepper and Crush are brands that operate within this industry. Operations are divided into six business segments, which include Frito-Lay North America; Quaker Foods North America; Latin American food and snack; Pepsico Americas Beverages (PAB); Europe; and Asia, Middle East and Africa. The industry-relevant segment is PAB. Altogether, the six segments earned
The PAB business unit produces both carbonated and noncarbonated beverages. As with its competitors, PAB
syrups and finished beverages for its food-service clients. In July 2009, PepsiCo began to reintegrate its bottling business with its wholly owned subsidiary Pepsi-Cola Metropolitan Bottling Company. The company acquired The Pepsi Bottling Group and PepsiAmericas for a combined $7.8 billion. The acquisition was finalized in February 2010, forming the new division called PepsiCo Americas
Beverages (PAB), which covers the North American and Latin American markets. PepsiCo acquired these bottling businesses in response to a shifting beverage market landscape. Furthermore, integrated operations allow the parent company to become more efficient and boost profitability.
As with its competitors, PepsiCo has introduced new carbonated-beverage lines that feature reduced or no calories. For instance, the company launched Pepsi Next in 2012, a low-calorie soda that is targeted to people who dislike the taste of diet sodas but do not want to consumer the calories in regular soda. However, the company has focused more on its noncarbonated beverage portfolio than on carbonated soft drinks, to the detriment of its industry-related revenue.
Financial performance
struggled to maintain demand for its carbonated soft drink products, as American consumers have continued to cut back on their consumption of soda. The company’s most popular soda brands, including Pepsi, Sierra Mist and Mountain Dew, generally experienced volume declines during this period. While volume sales have declined,
prices. Also, while North American volume sales are down, Latin American volume sales are growing. Moreover, the company’s acquisitions of its bottling partners in 2010 more than doubled its
Player Performancecontinued
zero and low-calorie brand extensions. Company revenue from US operations is on track to increase an annualized 7.8%
years to 2013. During this time, the acquisition of CCE was the main revenue growth driver, bolstering revenue by about 30.7% from 2010 to 2011.
However, demand for this division’s products has dwindled as a result of decreased soda consumption. Price increases for Coca-Cola’s soda products have slowed revenue declines over the
expected to decline 1.8% in 2013, as consumers continue to drink less soda.
PepsiCo Inc. Market share: 30.3% Industry Brand Names Pepsi Mountain Dew Sierra Mist Mug Root Beer Izze Diet Pepsi Pepsi ONE Pepsi Max
WWW.IBISWORLD.COM Soda Production in the US November 2013 27
Major Companies
Player Performance Dr Pepper Snapple Group (DPS) was
from Cadbury Schweppes PLC’s Cadbury Schweppes Americas Beverages division. DPS is an integrated brand owner, bottler and distributor of a large array of products. The company’s three operating segments are beverage concentrates, packaged beverages and Latin America beverages. DPS has historically built its business by acquiring brands such as Mott’s, Canada Dry and Snapple. DPS
in 2012, with 89.0% of sales generated in the United States.
Not including the Dr Pepper brand, the
brands include Canada Dry, 7UP, A&W, Sunkist and Sun Drop. Interestingly, over
brands have struggled to increase sales volumes, as Americans have become more health-conscious and turned away from sugary drinks. The only brand that has achieved growth in sales volume was
unsweetened variants such as plain and
growing popularity of low-calorie cocktails, which usually include club soda and tonic waters. Despite declining volume sales, DPS has strategically positioned itself within the Soda Production industry by specializing in
company enjoy strong brand recognition among consumers, DPS has trailed behind Coca-Cola and Pepsi in product innovation. For instance, the Dr Pepper Ten brand extension, which is targeted to men, was introduced after Coca-Cola launched Coke Zero and Pepsi launched Pepsi Max.
Financial performance
expected to earn $2.9 billion in revenue in 2013. This number represents a 0.5% increase from 2012 and annualized
Player Performancecontinued
revenue from carbonated soft drinks. IBISWorld expects PAB’s revenue to
billion in the five years to 2013. However, organic revenue growth from
its existing operations has declined, as soda consumption continues to decrease among consumers. As a result, segment revenue is anticipated to decline 0.4% in 2013.
PepsiCo Inc. (US industry-specifi c segment) – fi nancial performance*
YearRevenue
($ million) (% change)Net Income
($ million) (% change)
2008 3,106.1 N/C 575.4 N/C
2009 2,872.9 -7.5 616.8 7.2
2010 5,793.9 101.7 788.4 27.8
2011 6,277.0 8.3 916.4 16.2
2012 5,994.2 -4.5 822.4 -10.3
2013 5,968.5 -0.4 844.5 2.7
*EstimatesSOURCE: ANNUAL REPORT AND IBISWORLD
Dr Pepper Snapple Group Inc. Market share: 14.8% Industry Brand Names Dr Pepper 7-UP Schweppes A&W Root Beer Canada Dry RC Cola Sun Drop Sunkist
WWW.IBISWORLD.COM Soda Production in the US November 2013 28
Major Companies
Other Companies Cott CorporationEstimated market share: 2.9%Toronto-based Cott Corporation is the world’s largest manufacturer of private-label soft drinks and the fourth-largest soft drink maker in the world. In addition to carbonated soft drinks, the company produces shelf-stable juices, energy drinks, sports drinks and ready-to-drink iced tea, among other beverage products. The company sells its products to Safeway and J Sainsbury, which label the beverages with their respective store brands. The company’s top 10 customers generate more than 50.0% of its US revenue, which
revenue. In 2012, soda sales accounted for 39.1% of Cott’s sales. IBISWorld expects
that Cott will earn about $570.1 million in 2013 from US carbonated-soda sales, representing a 3.5% decline from 2012.
Cott was able to carve a niche in the Canadian drinks manufacturing market by lowering production costs, while maintaining quality and improving packaging design. This move allowed expansion into the US market, largely via acquisitions. Cott announced that it would
label beverage producer, in the third quarter of 2010 for $500.0 million, diversifying Cott’s US product line and providing the company with an additional revenue stream. As a result of this acquisition, Cott’s revenue increased by 29.5% in 2011.
Player Performancecontinued
2013. In 2010, the company received a $715.0-million, one-time payment from TCCC and another $900.0-million payment from PepsiCo for the rights to bottle and distribute DPS brands over the next 20 and 25 years, respectively. This
declines in revenue that year. Although health consciousness has placed downward pressure on the demand for the company’s soda brands, new products
such as Dr Pepper Ten and increased distribution of Sun Drop boosted industry-relevant revenue in 2011. Dr Pepper is expected to grow in 2013, as it introduces additional Ten products under the 7UP, A&W, Sunkist, Canada Dry and
expanding the distribution of its regional
will further boost revenue in the upcoming years.
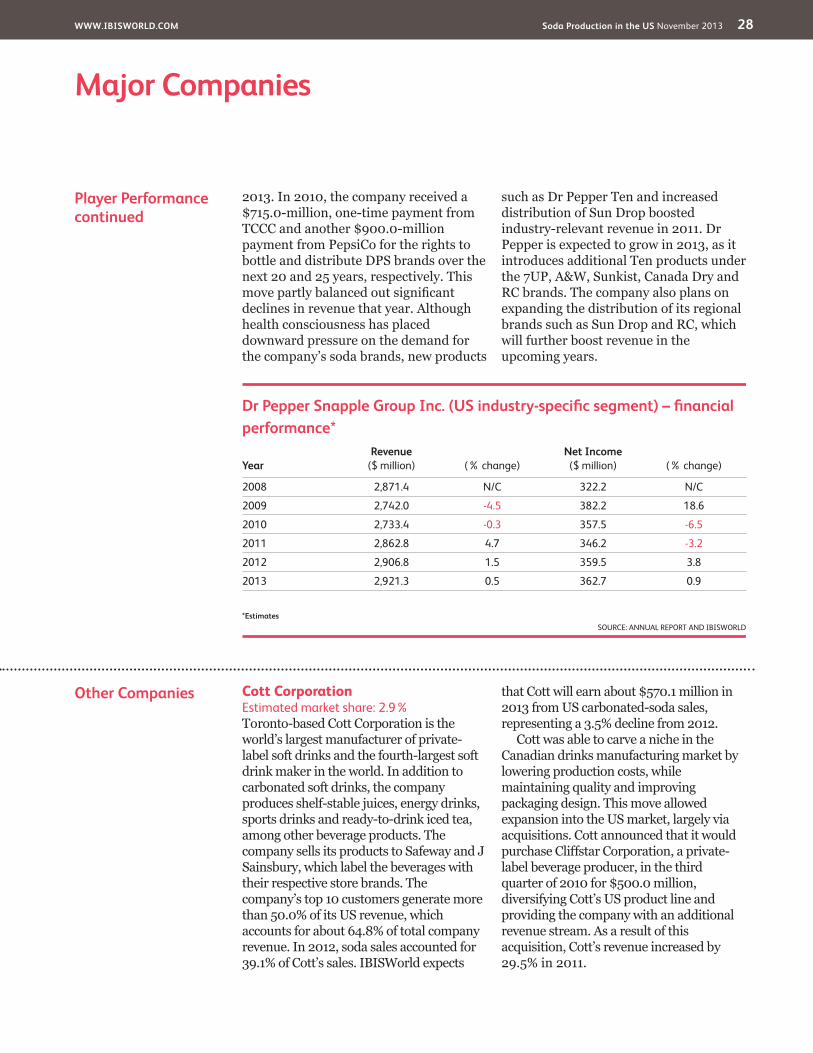
Dr Pepper Snapple Group Inc. (US industry-specifi c segment) – fi nancial performance*
YearRevenue
($ million) (% change)Net Income
($ million) (% change)
2008 2,871.4 N/C 322.2 N/C
2009 2,742.0 -4.5 382.2 18.6
2010 2,733.4 -0.3 357.5 -6.5
2011 2,862.8 4.7 346.2 -3.2
2012 2,906.8 1.5 359.5 3.8
2013 2,921.3 0.5 362.7 0.9
*EstimatesSOURCE: ANNUAL REPORT AND IBISWORLD
WWW.IBISWORLD.COM Soda Production in the US November 2013 29
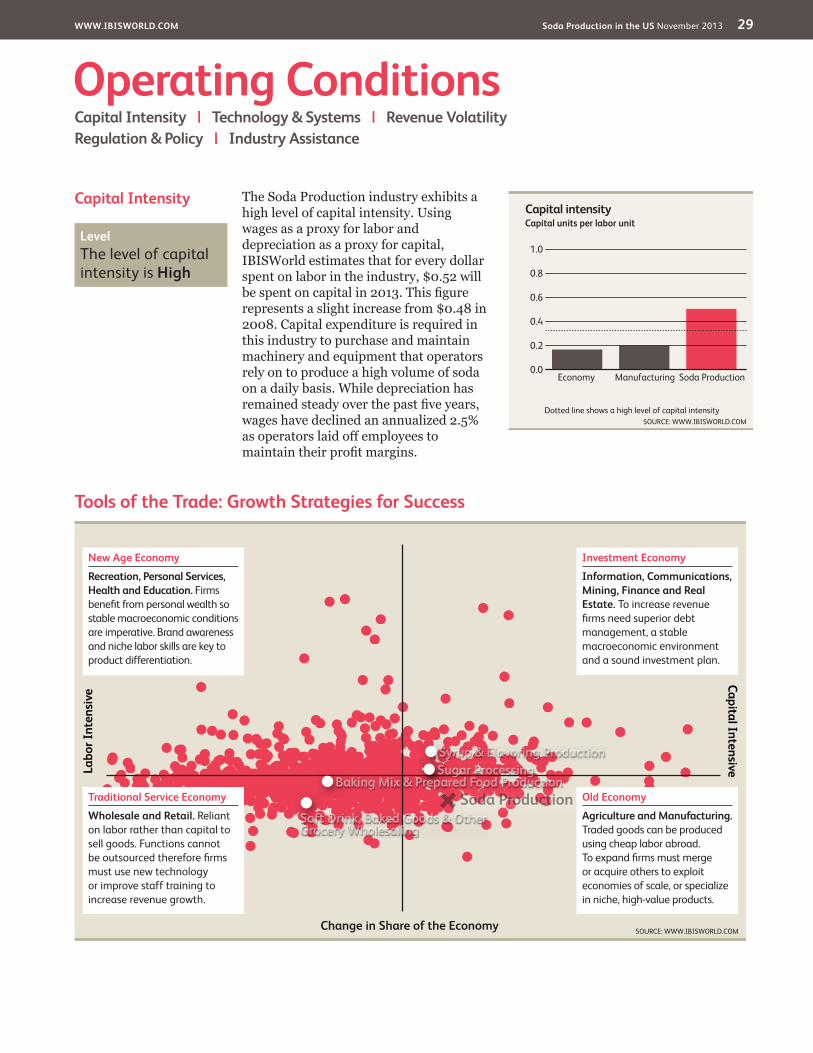
Capital Intensity The Soda Production industry exhibits a high level of capital intensity. Using wages as a proxy for labor and depreciation as a proxy for capital, IBISWorld estimates that for every dollar spent on labor in the industry, $0.52 will
represents a slight increase from $0.48 in 2008. Capital expenditure is required in this industry to purchase and maintain machinery and equipment that operators rely on to produce a high volume of soda on a daily basis. While depreciation has
wages have declined an annualized 2.5%
Operating ConditionsCapital Intensity | Technology & Systems | Revenue VolatilityRegulation & Policy | Industry Assistance
Tools of the Trade: Growth Strategies for Success
SOURCE: WWW.IBISWORLD.COM
Labo
r Int
ensiv
eCapital Intensive
Change in Share of the Economy
New Age EconomyRecreation, Personal Services, Health and Education. Firms benefi t from personal wealth so stable macroeconomic conditions are imperative. Brand awareness and niche labor skills are key to product differentiation.
Traditional Service EconomyWholesale and Retail. Reliant on labor rather than capital to sell goods. Functions cannot be outsourced therefore fi rms must use new technology or improve staff training to increase revenue growth.
Old EconomyAgriculture and Manufacturing. Traded goods can be produced using cheap labor abroad. To expand fi rms must merge or acquire others to exploit economies of scale, or specialize in niche, high-value products.
Investment EconomyInformation, Communications, Mining, Finance and Real Estate. To increase revenue fi rms need superior debt management, a stable macroeconomic environment and a sound investment plan.
Sugar Processing
Soft Drink, Baked Goods & Other Grocery Wholesaling
Syrup & Flavoring Production
Baking Mix & Prepared Food ProductionSoda Production
Capital intensity
1.0
0.0
0.2
0.4
0.6
0.8
SOURCE: WWW.IBISWORLD.COMDotted line shows a high level of capital intensity
Capital units per labor unit
Soda ProductionManufacturingEconomy
Level The level of capital intensity is High
WWW.IBISWORLD.COM Soda Production in the US November 2013 30
Operating Conditions
Revenue Volatility
Technology& Systems
The process for manufacturing soft drinks involves many steps and the use of technologically advanced machines and equipment. The steps involved in producing soda include combining different ingredients with water, carbonating the mix and bottling. While the process has generally remained the same for decades, automated machines have made the process faster and much more efficient over the years. Additionally, advanced software is used to track distribution networks, monitor the level of supply and demand in different retail channels and manage inventory.
and technology for the advent of alternative sweeteners in recent years. Due to the growing health concerns among Americans, soda producers have tried to reformulate their products and introduce products that are made with natural sweeteners. For instance, Zevia is a brand of soda that is made with the natural, zero-calorie sweetener from the stevia plant. Operators
to analyze the taste of new products to ensure that they provide exactly what consumers are looking for.
One of the technological advancements implemented with regards to packaging is hybrid palletizing, which uses a robotic interface to adjust a machine’s
pallets, or those that have reduced energy and air consumption. An example of a high-speed palletizer is the P45 which packs two pallets at a time at 70,000 bottles per hour for six packs of 1.5-liter bottles. Additionally, many major companies are transitioning to use biodegradable plastic bottles.
Companies are also decreasing water usage in order to cut costs and as the world supply of natural water declines. For instance, Coca Cola Enterprises decreased its water usage by 3.0% in the past year. TCCC also opened a facility in Oregon that uses only 1.2 liters of water for every liter produced. This amount is low compared to the industry average of about 2 liters of water usage per liter produced. Furthermore, producers have benefited from desalination technology including Multi-Stage Flash, Multi-Effect
Desalination is a process that removes salt from saline water.
Level The level of Technology Change is Medium
SOURCE: WWW.IBISWORLD.COM
Volatility vs Growth
Reve
nue
vola
tility
* (%
)
1000
100
10
1
0.1
Five year annualized revenue growth (%)–30 –10 10 30 50 70
Hazardous
Stagnant
Rollercoaster
Blue Chip
* Axis is in logarithmic scale
Soda Production
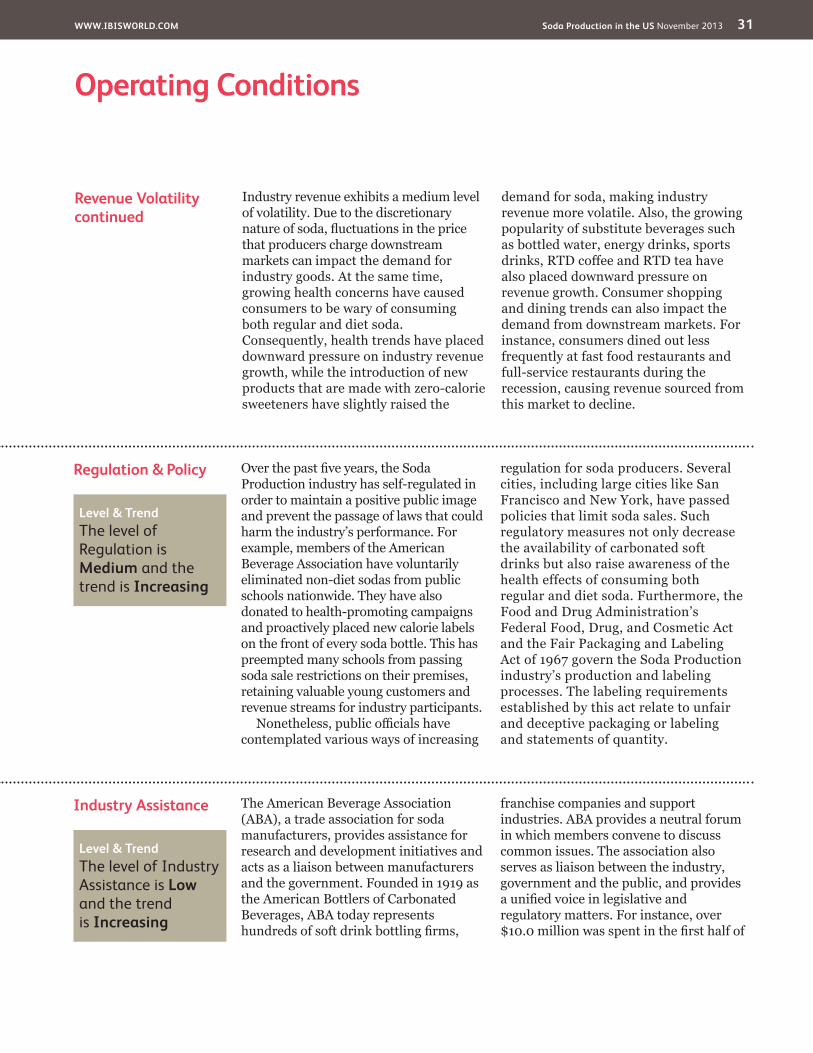
A higher level of revenue volatility implies greater industry risk. Volatility can negatively affect long-term strategic decisions, such as the time frame for capital investment.
When a fi rm makes poor investment decisions it may face underutilized capacity if demand suddenly falls, or capacity constraints if it rises quickly.
Level The level of Volatility is Medium
WWW.IBISWORLD.COM Soda Production in the US November 2013 31
Operating Conditions
Industry Assistance The American Beverage Association (ABA), a trade association for soda manufacturers, provides assistance for research and development initiatives and acts as a liaison between manufacturers and the government. Founded in 1919 as the American Bottlers of Carbonated Beverages, ABA today represents
franchise companies and support industries. ABA provides a neutral forum in which members convene to discuss common issues. The association also serves as liaison between the industry, government and the public, and provides
regulatory matters. For instance, over
Regulation & PolicyProduction industry has self-regulated in order to maintain a positive public image and prevent the passage of laws that could harm the industry’s performance. For example, members of the American Beverage Association have voluntarily eliminated non-diet sodas from public schools nationwide. They have also donated to health-promoting campaigns and proactively placed new calorie labels on the front of every soda bottle. This has preempted many schools from passing soda sale restrictions on their premises, retaining valuable young customers and revenue streams for industry participants.
contemplated various ways of increasing
regulation for soda producers. Several cities, including large cities like San Francisco and New York, have passed policies that limit soda sales. Such regulatory measures not only decrease the availability of carbonated soft drinks but also raise awareness of the health effects of consuming both regular and diet soda. Furthermore, the Food and Drug Administration’s Federal Food, Drug, and Cosmetic Act and the Fair Packaging and Labeling
industry’s production and labeling processes. The labeling requirements established by this act relate to unfair and deceptive packaging or labeling and statements of quantity.
Revenue Volatilitycontinued
Industry revenue exhibits a medium level of volatility. Due to the discretionary
that producers charge downstream markets can impact the demand for industry goods. At the same time, growing health concerns have caused consumers to be wary of consuming both regular and diet soda. Consequently, health trends have placed downward pressure on industry revenue growth, while the introduction of new products that are made with zero-calorie sweeteners have slightly raised the
demand for soda, making industry revenue more volatile. Also, the growing popularity of substitute beverages such as bottled water, energy drinks, sports
also placed downward pressure on revenue growth. Consumer shopping and dining trends can also impact the demand from downstream markets. For instance, consumers dined out less frequently at fast food restaurants and full-service restaurants during the recession, causing revenue sourced from this market to decline.
Level & Trend The level of Regulation is Medium and the trend is Increasing
Level & Trend The level of Industry Assistance is Low and the trend is Increasing
WWW.IBISWORLD.COM Soda Production in the US November 2013 32
Operating Conditions
Industry Assistancecontinued
2010 battling soda taxes in various states and preventing a soda tax from becoming part of Obama’s health reform, the Patient Protection and
TaxesA sales tax applies to soft drinks in most states. Through the ABA, the industry has successfully lobbied to prevent a soda tax from being included in the national health reform legislation. Soft drink producers are now battling states attempting to pass soda taxes, which tax
drinks that contain high levels of sugar
have been able to successfully oppose the federal taxes through 2012. Washington state was an exception, and legislators approved a two-cent tax on every 12 ounces of soft drinks sold.
because of the price-sensitive nature of the drinks and the high level of competition within the industry. Several states, including New York and California, have debated passing a soda tax for several years.
WWW.IBISWORLD.COM Soda Production in the US November 2013 33
Key StatisticsRevenue
($m)
Industry Value Added
($m)Establish-
ments Enterprises EmploymentExports
($m)Imports
($m)Wages ($m)
Domestic Demand
Price of Sugar (Cents per
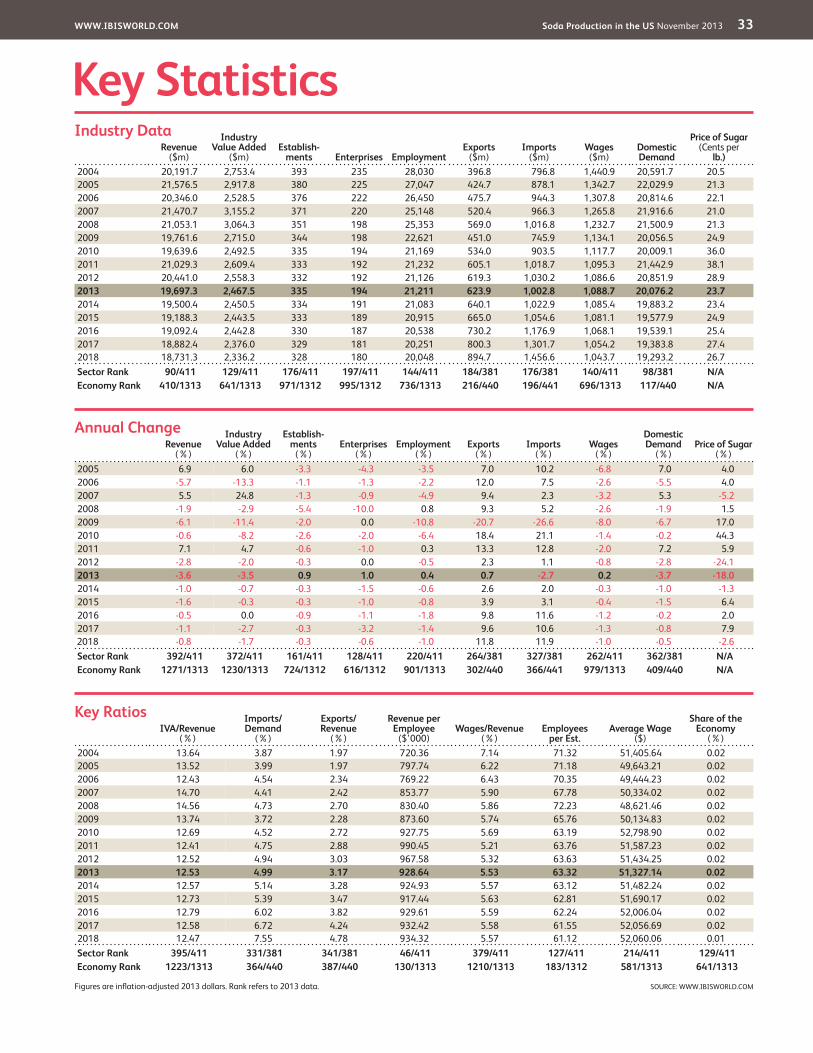
lb.)2004 20,191.7 2,753.4 393 235 28,030 396.8 796.8 1,440.9 20,591.7 20.52005 21,576.5 2,917.8 380 225 27,047 424.7 878.1 1,342.7 22,029.9 21.32006 20,346.0 2,528.5 376 222 26,450 475.7 944.3 1,307.8 20,814.6 22.12007 21,470.7 3,155.2 371 220 25,148 520.4 966.3 1,265.8 21,916.6 21.02008 21,053.1 3,064.3 351 198 25,353 569.0 1,016.8 1,232.7 21,500.9 21.32009 19,761.6 2,715.0 344 198 22,621 451.0 745.9 1,134.1 20,056.5 24.92010 19,639.6 2,492.5 335 194 21,169 534.0 903.5 1,117.7 20,009.1 36.02011 21,029.3 2,609.4 333 192 21,232 605.1 1,018.7 1,095.3 21,442.9 38.12012 20,441.0 2,558.3 332 192 21,126 619.3 1,030.2 1,086.6 20,851.9 28.92013 19,697.3 2,467.5 335 194 21,211 623.9 1,002.8 1,088.7 20,076.2 23.72014 19,500.4 2,450.5 334 191 21,083 640.1 1,022.9 1,085.4 19,883.2 23.42015 19,188.3 2,443.5 333 189 20,915 665.0 1,054.6 1,081.1 19,577.9 24.92016 19,092.4 2,442.8 330 187 20,538 730.2 1,176.9 1,068.1 19,539.1 25.42017 18,882.4 2,376.0 329 181 20,251 800.3 1,301.7 1,054.2 19,383.8 27.42018 18,731.3 2,336.2 328 180 20,048 894.7 1,456.6 1,043.7 19,293.2 26.7Sector Rank 90/411 129/411 176/411 197/411 144/411 184/381 176/381 140/411 98/381 N/AEconomy Rank 410/1313 641/1313 971/1312 995/1312 736/1313 216/440 196/441 696/1313 117/440 N/A
IVA/Revenue (%)
Imports/Demand
(%)
Exports/Revenue
(%)
Revenue per Employee
($’000)Wages/Revenue
(%)Employees
per Est.Average Wage
($)
Share of the Economy
(%)2004 13.64 3.87 1.97 720.36 7.14 71.32 51,405.64 0.022005 13.52 3.99 1.97 797.74 6.22 71.18 49,643.21 0.022006 12.43 4.54 2.34 769.22 6.43 70.35 49,444.23 0.022007 14.70 4.41 2.42 853.77 5.90 67.78 50,334.02 0.022008 14.56 4.73 2.70 830.40 5.86 72.23 48,621.46 0.022009 13.74 3.72 2.28 873.60 5.74 65.76 50,134.83 0.022010 12.69 4.52 2.72 927.75 5.69 63.19 52,798.90 0.022011 12.41 4.75 2.88 990.45 5.21 63.76 51,587.23 0.022012 12.52 4.94 3.03 967.58 5.32 63.63 51,434.25 0.022013 12.53 4.99 3.17 928.64 5.53 63.32 51,327.14 0.022014 12.57 5.14 3.28 924.93 5.57 63.12 51,482.24 0.022015 12.73 5.39 3.47 917.44 5.63 62.81 51,690.17 0.022016 12.79 6.02 3.82 929.61 5.59 62.24 52,006.04 0.022017 12.58 6.72 4.24 932.42 5.58 61.55 52,056.69 0.022018 12.47 7.55 4.78 934.32 5.57 61.12 52,060.06 0.01Sector Rank 395/411 331/381 341/381 46/411 379/411 127/411 214/411 129/411Economy Rank 1223/1313 364/440 387/440 130/1313 1210/1313 183/1312 581/1313 641/1313
Figures are inflation-adjusted 2013 dollars. Rank refers to 2013 data.
Revenue (%)
Industry Value Added
(%)
Establish-ments
(%)Enterprises
(%)Employment
(%)Exports
(%)Imports
(%)Wages
(%)
Domestic Demand
(%)Price of Sugar
(%)2005 6.9 6.0 -3.3 -4.3 -3.5 7.0 10.2 -6.8 7.0 4.02006 -5.7 -13.3 -1.1 -1.3 -2.2 12.0 7.5 -2.6 -5.5 4.02007 5.5 24.8 -1.3 -0.9 -4.9 9.4 2.3 -3.2 5.3 -5.22008 -1.9 -2.9 -5.4 -10.0 0.8 9.3 5.2 -2.6 -1.9 1.52009 -6.1 -11.4 -2.0 0.0 -10.8 -20.7 -26.6 -8.0 -6.7 17.02010 -0.6 -8.2 -2.6 -2.0 -6.4 18.4 21.1 -1.4 -0.2 44.32011 7.1 4.7 -0.6 -1.0 0.3 13.3 12.8 -2.0 7.2 5.92012 -2.8 -2.0 -0.3 0.0 -0.5 2.3 1.1 -0.8 -2.8 -24.12013 -3.6 -3.5 0.9 1.0 0.4 0.7 -2.7 0.2 -3.7 -18.02014 -1.0 -0.7 -0.3 -1.5 -0.6 2.6 2.0 -0.3 -1.0 -1.32015 -1.6 -0.3 -0.3 -1.0 -0.8 3.9 3.1 -0.4 -1.5 6.42016 -0.5 0.0 -0.9 -1.1 -1.8 9.8 11.6 -1.2 -0.2 2.02017 -1.1 -2.7 -0.3 -3.2 -1.4 9.6 10.6 -1.3 -0.8 7.9
2018 -0.8 -1.7 -0.3 -0.6 -1.0 11.8 11.9 -1.0 -0.5 -2.6Sector Rank 392/411 372/411 161/411 128/411 220/411 264/381 327/381 262/411 362/381 N/AEconomy Rank 1271/1313 1230/1313 724/1312 616/1312 901/1313 302/440 366/441 979/1313 409/440 N/A
Annual Change
Key Ratios
Industry Data
SOURCE: WWW.IBISWORLD.COM
WWW.IBISWORLD.COM Soda Production in the US November 2013 34
Jargon & Glossary
BARRIERS TO ENTRY High barriers to entry mean that new companies struggle to enter an industry, while low barriers mean it is easy for new companies to enter an industry.CAPITAL INTENSITY Compares the amount of money spent on capital (plant, machinery and equipment) with that spent on labor. IBISWorld uses the ratio of depreciation to wages as a proxy for capital intensity. High capital intensity is more than $0.333 of capital to $1 of labor; medium is $0.125 to $0.333 of capital to $1 of labor; low is less than $0.125 of capital for every $1 of labor.CONSTANT PRICES The dollar figures in the Key Statistics table, including forecasts, are adjusted for inflation using the current year (i.e. year published) as the base year. This removes the impact of changes in the purchasing power of the dollar, leaving only the “real” growth or decline in industry metrics. The inflation adjustments in IBISWorld’s reports are made using the US Bureau of Economic Analysis’ implicit GDP price deflator.DOMESTIC DEMAND Spending on industry goods and services within the United States, regardless of their country of origin. It is derived by adding imports to industry revenue, and then subtracting exports.EMPLOYMENT The number of permanent, part-time, temporary and seasonal employees, working proprietors, partners, managers and executives within the industry.ENTERPRISE A division that is separately managed and keeps management accounts. Each enterprise consists of one or more establishments that are under common ownership or control.ESTABLISHMENT The smallest type of accounting unit within an enterprise, an establishment is a single physical location where business is conducted or where services or industrial operations are performed. Multiple establishments under common control make up an enterprise.EXPORTS Total value of industry goods and services sold by US companies to customers abroad.
IMPORTS Total value of industry goods and services brought in from foreign countries to be sold in the United States.INDUSTRY CONCENTRATION An indicator of the dominance of the top four players in an industry. Concentration is considered high if the top players account for more than 70% of industry revenue. Medium is 40% to 70% of industry revenue. Low is less than 40%.INDUSTRY REVENUE The total sales of industry goods and services (exclusive of excise and sales tax); subsidies on production; all other operating income from outside the firm (such as commission income, repair and service income, and rent, leasing and hiring income); and capital work done by rental or lease. Receipts from interest royalties, dividends and the sale of fixed tangible assets are excluded.INDUSTRY VALUE ADDED (IVA) The market value of goods and services produced by the industry minus the cost of goods and services used in production. IVA is also described as the industry’s contribution to GDP, or profit plus wages and depreciation.INTERNATIONAL TRADE The level of international trade is determined by ratios of exports to revenue and imports to domestic demand. For exports/revenue: low is less than 5%, medium is 5% to 20%, and high is more than 20%. Imports/domestic demand: low is less than 5%, medium is 5% to 35%, and high is more than 35%.LIFE CYCLE All industries go through periods of growth, maturity and decline. IBISWorld determines an industry’s life cycle by considering its growth rate (measured by IVA) compared with GDP; the growth rate of the number of establishments; the amount of change the industry’s products are undergoing; the rate of technological change; and the level of customer acceptance of industry products and services.NONEMPLOYING ESTABLISHMENT Businesses with no paid employment or payroll, also known as nonemployers. These are mostly set up by self-employed individuals.
Industry Jargon
IBISWorld Glossary
CARBONATED SOFT DRINK (CSD) A nonalcoholic beverage that contains carbonation and generally some form of sweetener or flavor.PRIVATE LABEL Products sold as the house brand of a particular supermarket or retail chain, rather than the specific manufacturer.READY-TO-DRINK A beverage produced and packaged for immediate consumption.SPARKLING BEVERAGE A nonalcoholic beverage with carbonation, including energy drinks, waters and flavored waters.
STILL BEVERAGE A nonalcoholic beverage without carbonation, including juices, juice drinks, teas, coffees, sports drinks, waters and flavored waters.VERTICAL INTEGRATION Owning different parts of the supply chain, either in the form of forward integration (owning upstream suppliers) or backward integration (owning downstream buyers).
WWW.IBISWORLD.COM Soda Production in the US November 2013 35
Jargon & Glossary
PROFIT IBISWorld uses earnings before interest and tax (EBIT) as an indicator of a company’s profitability. It is calculated as revenue minus expenses, excluding interest and tax.VOLATILITY The level of volatility is determined by averaging the absolute change in revenue in each of the past five years. Volatility levels: very high is more than ±20%; high volatility is ±10% to ±20%; moderate volatility is ±3% to ±10%; and low volatility is less than ±3%.
WAGES The gross total wages and salaries of all employees in the industry. The cost of benefits is also included in this figure.
IBISWorld Glossarycontinued
Disclaimer
This product has been supplied by IBISWorld Inc. (‘IBISWorld’) solely for use by its authorized licensees strictly in accordance with their license agreements with IBISWorld. IBISWorld makes no representation to any other person with regard to the completeness or accuracy of the data or information contained herein, and it accepts no responsibility and disclaims all liability (save for liability which cannot be lawfully disclaimed) for loss or damage whatsoever suffered or incurred by any other person resulting from
the use of, or reliance upon, the data or information contained herein. Copyright in this publication is owned by IBISWorld Inc. The publication is sold on the basis that the purchaser agrees not to copy the material contained within it for other than the purchasers own purposes. In the event that the purchaser uses or quotes from the material in this publication – in papers, reports, or opinions prepared for any other person – it is agreed that it will be sourced to: IBISWorld Inc.
At IBISWorld we know that industry intelligence is more than assembling factsIt is combining data with analysis to answer the questions that successful businesses askIdentify high growth, emerging & shrinking marketsArm yourself with the latest industry intelligenceAssess competitive threats from existing & new entrantsBenchmark your performance against the competitionMake speedy market-ready, profit-maximizing decisions
Who is IBISWorld?We are strategists, analysts, researchers, and marketers. We provide answers to information-hungry, time-poor businesses. Our goal is to provide real world answers that matter to your business in our 700 US industry reports. When tough strategic, budget, sales and marketing decisions need to be made, our suite of Industry and Risk intelligence products give you deeply-researched answers quickly.
IBISWorld MembershipIBISWorld offers tailored membership packages to meet your needs.
Copyright 2013 IBISWorld Inc
www.ibisworld.com | 1-800-330-3772 | [email protected]