Embed Size (px)
DESCRIPTION
An annual report for IBM
Citation preview

WHAT IF WE COULD
SOLVE THE WORLD'S
PROBLEMS, ONE
PERSON AT A TIME?
IBM 2011 ANNUAL REPORT

SOFTWARE to EMPOWER PATIENTS Our connected home health solution, based on IBM WebSphere Sensor Events, collects and correlates data and events from all types of medical devices, providing a platform to aggregate, analyze and visualize events. That data can be integrated into existing electronic medical record systems and disease management applications for management of diabetes, congestive heart failure, and other chronic diseases or medical conditions.
The solution is based on Continua, Integrated Healthcare Enterprise (IHE), Health Level 7 (HL7) and service oriented architecture (SOA) standards. In addition, IBM offers analytics and portal software for trending, scorecarding and visualization of the data collected from home medical devices. IBM Healthcare Accelerator combines with IBM WebSphere Portal software to help empower patients via an online patient portal.
WHAT IF YOU COULD
VISIT YOUR DOCTOR
WITHOUT EVER LEAVING
YOUR HOME?
THROUGH IBM'S ADVANCED INTEGRATED HOME HEALTH SYSTEMS, YOU CAN BE A
MODEL PATIENT WITHOUT LEAVING THE COMFORT OF YOUR HOME.

IBM 2011 ANNUAL REPORT
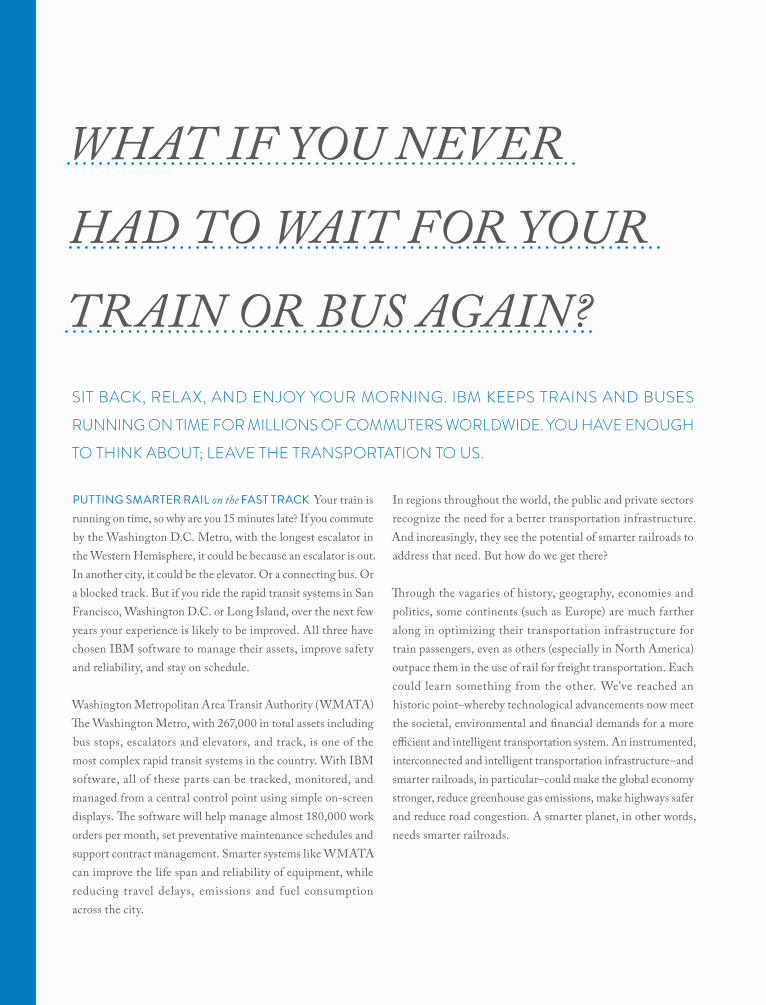
PUTTING SMARTER RAIL on the FAST TRACK Your train is running on time, so why are you 15 minutes late? If you commute by the Washington D.C. Metro, with the longest escalator in the Western Hemisphere, it could be because an escalator is out. In another city, it could be the elevator. Or a connecting bus. Or a blocked track. But if you ride the rapid transit systems in San Francisco, Washington D.C. or Long Island, over the next few years your experience is likely to be improved. All three have chosen IBM software to manage their assets, improve safety and reliability, and stay on schedule.
Washington Metropolitan Area Transit Authority (WMATA)The Washington Metro, with 267,000 in total assets including bus stops, escalators and elevators, and track, is one of the most complex rapid transit systems in the country. With IBM software, all of these parts can be tracked, monitored, and managed from a central control point using simple on-screen displays. The software will help manage almost 180,000 work orders per month, set preventative maintenance schedules and support contract management. Smarter systems like WMATA can improve the life span and reliability of equipment, while reducing travel delays, emissions and fuel consumption across the city.
In regions throughout the world, the public and private sectors recognize the need for a better transportation infrastructure. And increasingly, they see the potential of smarter railroads to address that need. But how do we get there?
Through the vagaries of history, geography, economies and politics, some continents (such as Europe) are much farther along in optimizing their transportation infrastructure for train passengers, even as others (especially in North America) outpace them in the use of rail for freight transportation. Each could learn something from the other. We've reached an historic point–whereby technological advancements now meet the societal, environmental and financial demands for a more efficient and intelligent transportation system. An instrumented, interconnected and intelligent transportation infrastructure–and smarter railroads, in particular–could make the global economy stronger, reduce greenhouse gas emissions, make highways safer and reduce road congestion. A smarter planet, in other words, needs smarter railroads.
WHAT IF YOU NEVER
HAD TO WAIT FOR YOUR
TRAIN OR BUS AGAIN?SIT BACK, RELAX, AND ENJOY YOUR MORNING. IBM KEEPS TRAINS AND BUSES
RUNNING ON TIME FOR MILLIONS OF COMMUTERS WORLDWIDE. YOU HAVE ENOUGH
TO THINK ABOUT; LEAVE THE TRANSPORTATION TO US.

IBM 2011 ANNUAL REPORT

HELPING AGRICULTURE GROW through IP Severe weather, fluctuating prices for crops and supplies, government regulations–they're all part of life for the contemporary farmer. Increasingly farmers and other entities in the agricultural sector are looking to sophisticated solutions such as analytics and software models to help them survive and prosper. IBM has a rich harvest of technology assets ready to help with modern agriculture.
Take, for example, Deep Thunder. A weather forecasting service, Deep Thunder provides highly localized (2 km resolution) and timely (one to two days ahead of time) forecasts so that businesses can plan with more accuracy. Another asset, a sophisticated water flow model, can use forecasting information to predict potential flooding, surface flow, and even watershed quality.
Farmers with limited or no access to the Internet and social networking can f ind reliable advice with a mobile phone application. Faced with a problem in his field, a farmer, even one who cannot read, takes a picture of the crop then launches the application. The program provides access to user-generated or published content. It uses social computing features (such as reputation, social networking and social bookmarking) to build on existing trust networks and encourage viral spread. This application can operate on a range of mobile devices; smart phones are not required.
Other IBM IP assets can help manage commodity pricing or use massive data analytics to analyze the impact of various government regulations.
RELIABLE, ALWAYS WITHIN REACH AND COMPLETELY UTILITARIAN, IBM IS FAST
BECOMING AN ESSENTIAL TOOL FOR FARMERS.
WHAT IF YOUR FARM
COULD GROW FROM THE
PALM OF YOUR HAND?

IBM 2011 ANNUAL REPORT
OVER THE PAST DECADE,
WE HAVE INCREASINGLY
SOUGHT TO ADDRESS
THE WORLD’S BIGGEST
PROBLEMS, DRIVEN BY
THE IDEA OF BUILDING
A SMARTER PLANET.
WITHOUT QUESTION, WE DO THIS IN PURSUIT OF LARGE NEW PROFIT OPPORTUNITIES.
BUT IT IS MORE THAN THAT. IT REPRESENTS THE FUSION OF IBM’S BUSINESS AND
CITIZENSHIP GOALS. AND THAT SHOWS UP NOT ONLY IN OUR BROAD STRATEGIES,
BUT IN HOW WE WORK AS INDIVIDUALS AROUND THE WORLD.
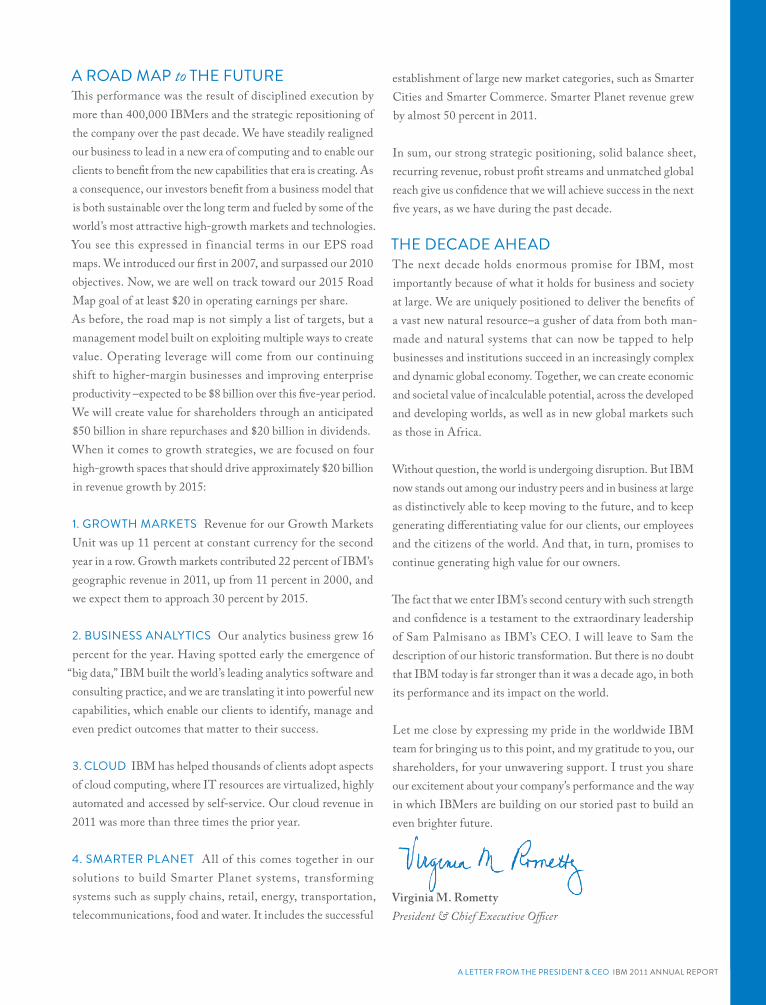
REVENUE and INCOME: Our revenue in 2011 was $107 billion, up 7 percent. We grew operating pre-tax income by 9 percent, to $21.6 billion, our highest ever.
MARGINS: IBM’s operating pre-tax income margin rose for the ninth consecutive year–to 20.2 percent, up 10 points since 2000. We achieved this by continuing to shift our business mix to more profitable segments and by driving productivity. More than 90 percent of our segment profit in 2011 was from software, services and financing.
EARNINGS PER SHARE: We have continued to achieve strong EPS growth. Last year was another record, with diluted operating earnings per share of $13.44, up 15 percent. This marked nine straight years of double-digit EPS growth.
CASH FLOW: IBM has consistently generated strong cash flow, a key indicator of real business performance. In 2011 our free cash flow was $16.6 billion. We have improved our free cash flow by nearly $10 billion over the past decade. We ended 2011 with $11.9 billion of cash and marketable securities.
INVESTMENT and RETURN to SHAREHOLDERS: Our cash flow has enabled us to invest in the business and to generate substantial returns to investors, while spending $6.3 billion on R&D. In 2011 we invested $1.8 billion for five acquisitions in key areas of software and $4.1 billion in net capital expenditures. We were able to return $18.5 billion to you–$15 billion through share repurchases and $3.5 billion through dividends. Last year’s dividend increase was 15 percent, marking the 16th year in a row in which we have raised our dividend, and the 96th consecutive year in which we have paid one.
I AM PLEASED TO REPORT THAT IBM HAD ANOTHER STRONG YEAR IN 2011. YOUR
COMPANY CONTINUED TO OUTPERFORM OUR INDUSTRY AND THE MARKET AT LARGE.
WE CAPPED IBM’S FIRST CENTURY BY ACHIEVING RECORD REVENUE, PROFIT, FREE
CASH FLOW AND EARNINGS PER SHARE. AT THE SAME TIME, WE CONTINUED TO
DELIVER SUPERIOR RETURNS TO YOU, AND WE ARE WELL POSITIONED FOR FUTURE
GROWTH IN A GLOBALLY INTEGRATING ECONOMY.
A LETTER from the PRESIDENT and CEOVirginia M. Rometty
establishment of large new market categories, such as Smarter Cities and Smarter Commerce. Smarter Planet revenue grew by almost 50 percent in 2011.
In sum, our strong strategic positioning, solid balance sheet, recurring revenue, robust profit streams and unmatched global reach give us confidence that we will achieve success in the next five years, as we have during the past decade.
THE DECADE AHEADThe next decade holds enormous promise for IBM, most importantly because of what it holds for business and society at large. We are uniquely positioned to deliver the benefits of a vast new natural resource–a gusher of data from both man-made and natural systems that can now be tapped to help businesses and institutions succeed in an increasingly complex and dynamic global economy. Together, we can create economic and societal value of incalculable potential, across the developed and developing worlds, as well as in new global markets such as those in Africa.
Without question, the world is undergoing disruption. But IBM now stands out among our industry peers and in business at large as distinctively able to keep moving to the future, and to keep generating differentiating value for our clients, our employees and the citizens of the world. And that, in turn, promises to continue generating high value for our owners.
The fact that we enter IBM’s second century with such strength and confidence is a testament to the extraordinary leadership of Sam Palmisano as IBM’s CEO. I will leave to Sam the description of our historic transformation. But there is no doubt that IBM today is far stronger than it was a decade ago, in both its performance and its impact on the world.
Let me close by expressing my pride in the worldwide IBM team for bringing us to this point, and my gratitude to you, our shareholders, for your unwavering support. I trust you share our excitement about your company’s performance and the way in which IBMers are building on our storied past to build an even brighter future.
Virginia M. RomettyPresident & Chief Executive Officer
A ROAD MAP to THE FUTUREThis performance was the result of disciplined execution by more than 400,000 IBMers and the strategic repositioning of the company over the past decade. We have steadily realigned our business to lead in a new era of computing and to enable our clients to benefit from the new capabilities that era is creating. As a consequence, our investors benefit from a business model that is both sustainable over the long term and fueled by some of the world’s most attractive high-growth markets and technologies.You see this expressed in financial terms in our EPS road maps. We introduced our first in 2007, and surpassed our 2010 objectives. Now, we are well on track toward our 2015 Road Map goal of at least $20 in operating earnings per share.As before, the road map is not simply a list of targets, but a management model built on exploiting multiple ways to create value. Operating leverage will come from our continuing shift to higher-margin businesses and improving enterprise productivity –expected to be $8 billion over this five-year period. We will create value for shareholders through an anticipated $50 billion in share repurchases and $20 billion in dividends.When it comes to growth strategies, we are focused on four high-growth spaces that should drive approximately $20 billion in revenue growth by 2015:
1. GROWTH MARKETS Revenue for our Growth Markets Unit was up 11 percent at constant currency for the second year in a row. Growth markets contributed 22 percent of IBM’s geographic revenue in 2011, up from 11 percent in 2000, and we expect them to approach 30 percent by 2015.
2. BUSINESS ANALYTICS Our analytics business grew 16 percent for the year. Having spotted early the emergence of
“big data,” IBM built the world’s leading analytics software and consulting practice, and we are translating it into powerful new capabilities, which enable our clients to identify, manage and even predict outcomes that matter to their success.
3. CLOUD IBM has helped thousands of clients adopt aspects of cloud computing, where IT resources are virtualized, highly automated and accessed by self-service. Our cloud revenue in 2011 was more than three times the prior year.
4. SMARTER PLANET All of this comes together in our solutions to build Smarter Planet systems, transforming systems such as supply chains, retail, energy, transportation, telecommunications, food and water. It includes the successful
A LETTER FROM THE PRESIDENT & CEO IBM 2011 ANNUAL REPORT
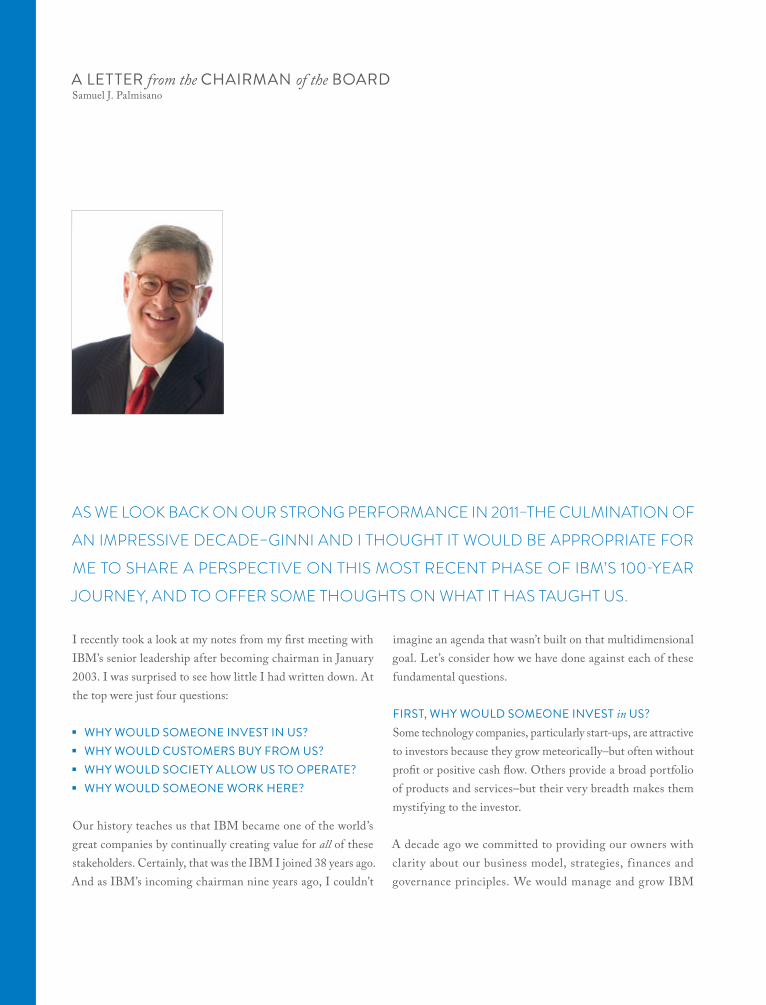
I recently took a look at my notes from my first meeting with IBM’s senior leadership after becoming chairman in January 2003. I was surprised to see how little I had written down. At the top were just four questions:
� WHY WOULD SOMEONE INVEST IN US? � WHY WOULD CUSTOMERS BUY FROM US? � WHY WOULD SOCIETY ALLOW US TO OPERATE? � WHY WOULD SOMEONE WORK HERE?
Our history teaches us that IBM became one of the world’s great companies by continually creating value for all of these stakeholders. Certainly, that was the IBM I joined 38 years ago. And as IBM’s incoming chairman nine years ago, I couldn’t
imagine an agenda that wasn’t built on that multidimensional goal. Let’s consider how we have done against each of these fundamental questions.
FIRST, WHY WOULD SOMEONE INVEST in US?Some technology companies, particularly start-ups, are attractive to investors because they grow meteorically–but often without profit or positive cash flow. Others provide a broad portfolio of products and services–but their very breadth makes them mystifying to the investor.
A decade ago we committed to providing our owners with clarity about our business model, strategies, f inances and governance principles. We would manage and grow IBM
AS WE LOOK BACK ON OUR STRONG PERFORMANCE IN 2011–THE CULMINATION OF
AN IMPRESSIVE DECADE–GINNI AND I THOUGHT IT WOULD BE APPROPRIATE FOR
ME TO SHARE A PERSPECTIVE ON THIS MOST RECENT PHASE OF IBM’S 100-YEAR
JOURNEY, AND TO OFFER SOME THOUGHTS ON WHAT IT HAS TAUGHT US.
A LETTER from the CHAIRMAN of the BOARDSamuel J. Palmisano
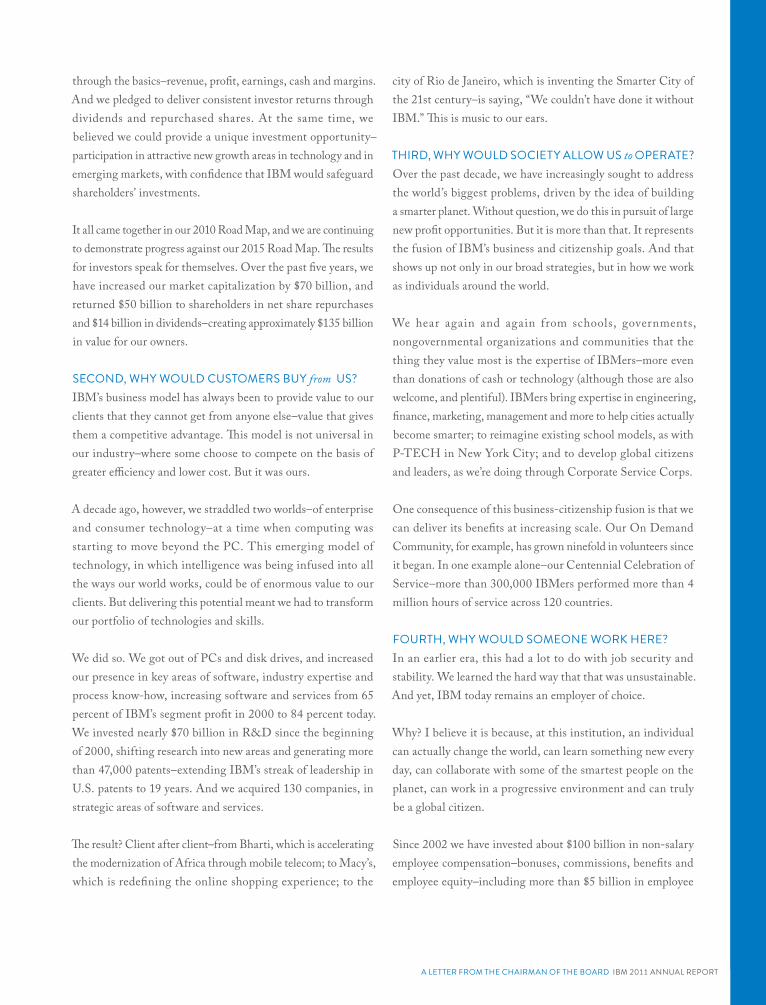
city of Rio de Janeiro, which is inventing the Smarter City of the 21st century–is saying, “We couldn’t have done it without IBM.” This is music to our ears.
THIRD, WHY WOULD SOCIETY ALLOW US to OPERATE?Over the past decade, we have increasingly sought to address the world’s biggest problems, driven by the idea of building a smarter planet. Without question, we do this in pursuit of large new profit opportunities. But it is more than that. It represents the fusion of IBM’s business and citizenship goals. And that shows up not only in our broad strategies, but in how we work as individuals around the world.
We hear again and again from schools, governments, nongovernmental organizations and communities that the thing they value most is the expertise of IBMers–more even than donations of cash or technology (although those are also welcome, and plentiful). IBMers bring expertise in engineering, finance, marketing, management and more to help cities actually become smarter; to reimagine existing school models, as with P-TECH in New York City; and to develop global citizens and leaders, as we’re doing through Corporate Service Corps.
One consequence of this business-citizenship fusion is that we can deliver its benefits at increasing scale. Our On Demand Community, for example, has grown ninefold in volunteers since it began. In one example alone–our Centennial Celebration of Service–more than 300,000 IBMers performed more than 4 million hours of service across 120 countries.
FOURTH, WHY WOULD SOMEONE WORK HERE?In an earlier era, this had a lot to do with job security and stability. We learned the hard way that that was unsustainable. And yet, IBM today remains an employer of choice.
Why? I believe it is because, at this institution, an individual can actually change the world, can learn something new every day, can collaborate with some of the smartest people on the planet, can work in a progressive environment and can truly be a global citizen.
Since 2002 we have invested about $100 billion in non-salary employee compensation–bonuses, commissions, benefits and employee equity–including more than $5 billion in employee
through the basics–revenue, profit, earnings, cash and margins. And we pledged to deliver consistent investor returns through dividends and repurchased shares. At the same time, we believed we could provide a unique investment opportunity–participation in attractive new growth areas in technology and in emerging markets, with confidence that IBM would safeguard shareholders’ investments.
It all came together in our 2010 Road Map, and we are continuing to demonstrate progress against our 2015 Road Map. The results for investors speak for themselves. Over the past five years, we have increased our market capitalization by $70 billion, and returned $50 billion to shareholders in net share repurchases and $14 billion in dividends–creating approximately $135 billion in value for our owners.
SECOND, WHY WOULD CUSTOMERS BUY from US?IBM’s business model has always been to provide value to our clients that they cannot get from anyone else–value that gives them a competitive advantage. This model is not universal in our industry–where some choose to compete on the basis of greater efficiency and lower cost. But it was ours.
A decade ago, however, we straddled two worlds–of enterprise and consumer technology–at a time when computing was starting to move beyond the PC. This emerging model of technology, in which intelligence was being infused into all the ways our world works, could be of enormous value to our clients. But delivering this potential meant we had to transform our portfolio of technologies and skills.
We did so. We got out of PCs and disk drives, and increased our presence in key areas of software, industry expertise and process know-how, increasing software and services from 65 percent of IBM’s segment profit in 2000 to 84 percent today. We invested nearly $70 billion in R&D since the beginning of 2000, shifting research into new areas and generating more than 47,000 patents–extending IBM’s streak of leadership in U.S. patents to 19 years. And we acquired 130 companies, in strategic areas of software and services.
The result? Client after client–from Bharti, which is accelerating the modernization of Africa through mobile telecom; to Macy’s, which is redefining the online shopping experience; to the
A LETTER FROM THE CHAIRMAN OF THE BOARD IBM 2011 ANNUAL REPORT
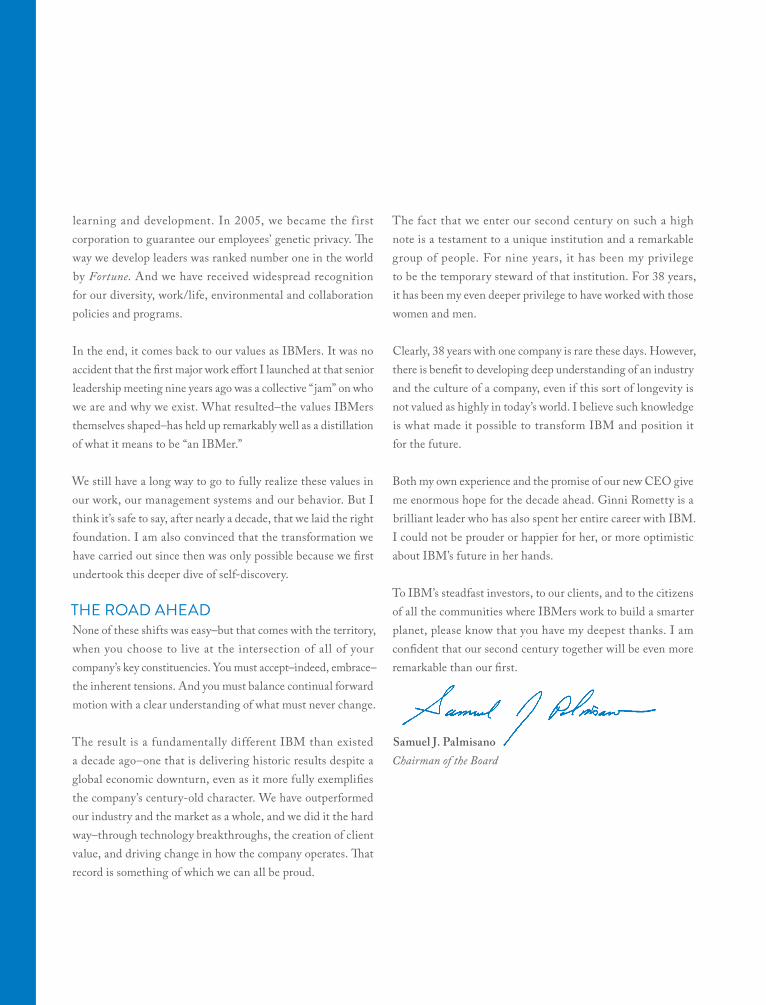
The fact that we enter our second century on such a high note is a testament to a unique institution and a remarkable group of people. For nine years, it has been my privilege to be the temporary steward of that institution. For 38 years, it has been my even deeper privilege to have worked with those women and men.
Clearly, 38 years with one company is rare these days. However, there is benefit to developing deep understanding of an industry and the culture of a company, even if this sort of longevity is not valued as highly in today’s world. I believe such knowledge is what made it possible to transform IBM and position it for the future.
Both my own experience and the promise of our new CEO give me enormous hope for the decade ahead. Ginni Rometty is a brilliant leader who has also spent her entire career with IBM. I could not be prouder or happier for her, or more optimistic about IBM’s future in her hands.
To IBM’s steadfast investors, to our clients, and to the citizens of all the communities where IBMers work to build a smarter planet, please know that you have my deepest thanks. I am confident that our second century together will be even more remarkable than our first.
Samuel J. PalmisanoChairman of the Board
learning and development. In 2005, we became the f irst corporation to guarantee our employees’ genetic privacy. The way we develop leaders was ranked number one in the world by Fortune. And we have received widespread recognition for our diversity, work/life, environmental and collaboration policies and programs.
In the end, it comes back to our values as IBMers. It was no accident that the first major work effort I launched at that senior leadership meeting nine years ago was a collective “ jam” on who we are and why we exist. What resulted–the values IBMers themselves shaped–has held up remarkably well as a distillation of what it means to be “an IBMer.”
We still have a long way to go to fully realize these values in our work, our management systems and our behavior. But I think it’s safe to say, after nearly a decade, that we laid the right foundation. I am also convinced that the transformation we have carried out since then was only possible because we first undertook this deeper dive of self-discovery.
THE ROAD AHEADNone of these shifts was easy–but that comes with the territory, when you choose to live at the intersection of all of your company’s key constituencies. You must accept–indeed, embrace–the inherent tensions. And you must balance continual forward motion with a clear understanding of what must never change.
The result is a fundamentally different IBM than existed a decade ago–one that is delivering historic results despite a global economic downturn, even as it more fully exemplifies the company’s century-old character. We have outperformed our industry and the market as a whole, and we did it the hard way–through technology breakthroughs, the creation of client value, and driving change in how the company operates. That record is something of which we can all be proud.
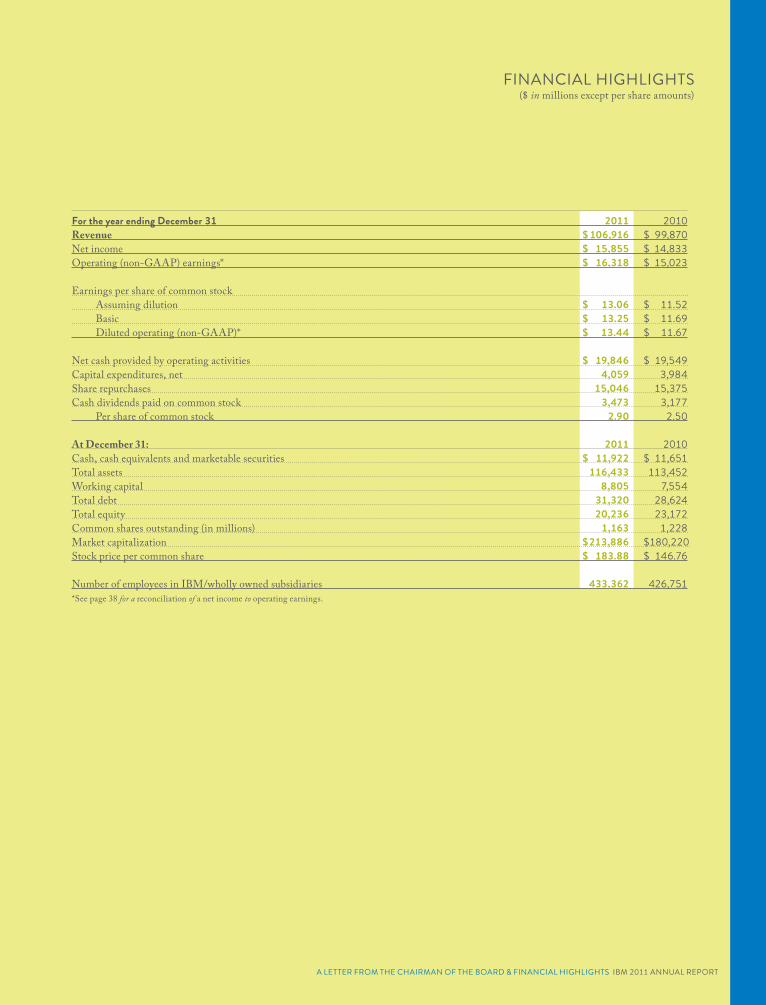
FINANCIAL HIGHLIGHTS($ in millions except per share amounts)
For the year ending December 31 2011 2010Revenue $ 106,916 $ 99,870Net income $ 15,855 $ 14,833Operating (non-GAAP) earnings* $ 16,318 $ 15,023
Earnings per share of common stock Assuming dilution $ 13.06 $ 11.52 Basic $ 13.25 $ 11.69 Diluted operating (non-GAAP)* $ 13.44 $ 11.67
Net cash provided by operating activities $ 19,846 $ 19,549Capital expenditures, net 4,059 3,984Share repurchases 15,046 15,375Cash dividends paid on common stock 3,473 3,177 Per share of common stock 2.90 2.50
At December 31: 2011 2010Cash, cash equivalents and marketable securities $ 11,922 $ 11,651Total assets 116,433 113,452Working capital 8,805 7,554Total debt 31,320 28,624Total equity 20,236 23,172Common shares outstanding (in millions) 1,163 1,228Market capitalization $ 213,886 $ 180,220Stock price per common share $ 183.88 $ 146.76
Number of employees in IBM/wholly owned subsidiaries 433,362 426,751*See page 38 for a reconciliation of a net income to operating earnings.
A LETTER FROM THE CHAIRMAN OF THE BOARD & FINANCIAL HIGHLIGHTS IBM 2011 ANNUAL REPORT

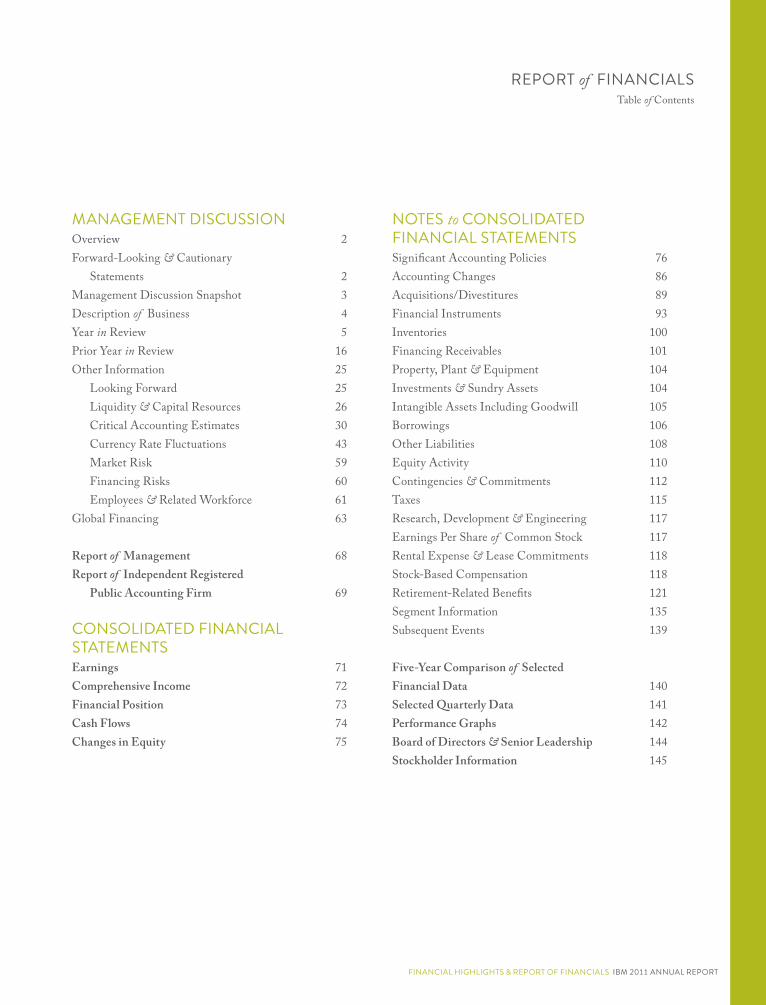
MANAGEMENT DISCUSSIONOverview 2Forward-Looking & Cautionary Statements 2Management Discussion Snapshot 3Description of Business 4Year in Review 5Prior Year in Review 16Other Information 25 Looking Forward 25 Liquidity & Capital Resources 26 Critical Accounting Estimates 30 Currency Rate Fluctuations 43 Market Risk 59 Financing Risks 60 Employees & Related Workforce 61Global Financing 63
Report of Management 68Report of Independent Registered Public Accounting Firm 69
CONSOLIDATED FINANCIAL STATEMENTSEarnings 71Comprehensive Income 72Financial Position 73Cash Flows 74Changes in Equity 75
NOTES to CONSOLIDATED FINANCIAL STATEMENTSSignificant Accounting Policies 76Accounting Changes 86Acquisitions/Divestitures 89Financial Instruments 93Inventories 100Financing Receivables 101Property, Plant & Equipment 104Investments & Sundry Assets 104Intangible Assets Including Goodwill 105Borrowings 106Other Liabilities 108Equity Activity 110Contingencies & Commitments 112Taxes 115Research, Development & Engineering 117Earnings Per Share of Common Stock 117Rental Expense & Lease Commitments 118Stock-Based Compensation 118Retirement-Related Benefits 121Segment Information 135Subsequent Events 139
Five-Year Comparison of SelectedFinancial Data 140Selected Quarterly Data 141Performance Graphs 142Board of Directors & Senior Leadership 144Stockholder Information 145
REPORT of FINANCIALSTable of Contents
FINANCIAL HIGHLIGHTS & REPORT OF FINANCIALS IBM 2011 ANNUAL REPORT
OVERVIEWThe f inancial section of the International Business Machines Corporation (IBM or the company) 2011 Annual Report includes the Management Discussion, the Consolidated Financial Statements and the Notes to the Consolidated Financial Statements. This Overview is designed to provide the reader with some perspective regarding the information contained in the financial section.
ORGANIZATION of INFORMATION � The Management Discussion is designed to provide readers with an
overview of the business and a narrative on the company’s financial results and certain factors that may affect its future prospects from the perspective of the company’s management. The “Management Discussion Snapshot” on pages 19 and 20, presents an overview of the key performance drivers in 2011.
� Beginning with the “YeaTr in Review” on page 26, the Management Discussion contains the results of operations for each reportable segment of the business and a discussion of the company’s financial position and cash flows. Other key sections within the Management Discussion include: “Looking Forward” on page 55, and “Liquidity and Capital Resources” on pages 56 to 58. It is useful to read the Management Discussion in conjunction with note T, “Segment Information,” on pages 135 to 139.
� Global Financing is a reportable segment that is measured as a stand-alone entity. A separate “Global Financing” section is included beginning on page 63.
� The Consolidated Financial Statements are presented on pages 70 through 75. These statements provide an overview of the company’s income and cash flow performance and its financial position.
� The Notes follow the Consolidated Financial Statements. Among other items, the Notes contain the company’s accounting policies (pages 76 to 86), acquisitions and divestitures (pages 89 to 93), detailed information on specific items within the financial statements, certain contingencies and commitments (pages 112 to 115) and retirement-related benefits information (pages 121 to 135).
� The Consolidated Financial Statements and the Notes have been prepared in accordance with accounting principles generally accepted in the United States (GAAP).
� The references to “adjusted for currency” or “at constant currency” in the Management Discussion do not include operational impacts that could result from fluctuations in foreign currency rates. Certain financial results are adjusted based on a simple mathematical model that translates current period results in local currency using the comparable prior year period’s currency conversion rate. This approach is used for countries where the functional currency is the local country currency. This information is provided so that certain f inancial results can be viewed without the impact of fluctuations in foreign currency rates, thereby facilitating period-to-period comparisons of business performance. See “Currency Rate Fluctuations” on page 61 for additional information.
� Within the financial statements and tables in this Annual Report, certain columns and rows may not add due to the use of rounded numbers for disclosure purposes. Percentages reported are calculated from the underlying whole-dollar numbers.
OPERATING (NON-GAAP) EARNINGSIn an effort to provide better transparency into the operational results of the business, the company separated business results into operating and non-operating categories beginning January 1, 2011. Operating earnings is a non-GAAP measure that excludes the effects of certain acquisition-related charges and retirement-related costs, and their related tax impacts. For acquisitions, operating earnings exclude the amortization of purchased intangible assets and acquisition-related charges such as in-process research and development, transaction costs, applicable restructuring and related expenses and tax charges related to acquisition integration. For retirement-related costs, the company has characterized certain items as operating and others as non-operating. The company includes defined benefit plan and nonpension postretirement benefit plan service cost, amortization of prior service cost and the cost of defined contribution plans in operating earnings. Non-operating retirement-related cost includes defined benefit plan and nonpension postretirement benefit plan interest cost, expected return on plan assets, amortized actuarial gains/losses, the impacts of any plan curtailments/settlements and multi-employer plan costs, pension insolvency costs and other costs. Non-operating costs are primarily related to changes in pension plan assets and liabilities which are tied to financial market performance and the company considers these costs to be outside the operational performance of the business.
Overall, the company believes that providing investors with a view of operating earnings as described above provides increased transparency and clarity into both the operational results of the business and the performance of the company’s pension plans; improves visibility to management decisions and their impacts on operational performance; enables better comparison to peer companies; and allows the company to provide a long-term strategic view of the business going forward. For its 2015 earnings per share Road Map, the company is utilizing an operating view to establish its objectives and track its progress. Effective January 1, 2011, the company’s segment financial results and performance reflect operating earnings, consistent with the company’s management and measurement system. The 2010 and 2009 financial results in this Annual Report have been reclassif ied to conform with the 2011 presentation of business results into operating and non-operating categories.
FORWARD-LOOKING & CAUTIONARY STATEMENTSCertain statements contained in this Annual Report may constitute forward-looking statements within the meaning of the Private Securities Litigation Reform Act of 1995. Any forward-looking statement in this Annual Report speaks only as of the date on which it is made;
MANAGEMENT DISCUSSION
002
the company assumes no obligation to update or revise any such statements. Forward-looking statements are based on the company’s current assumptions regarding future business and f inancial performance; these statements by their nature address matters that are uncertain to different degrees. Forward-looking statements involve a number of risks, uncertainties and other factors that could cause actual results to be materially different, as discussed more fully elsewhere in this Annual Report and in the company’s filings with the Securities and Exchange Commission (SEC), including the company’s 2011 Form 10-K filed on February 28, 2012.
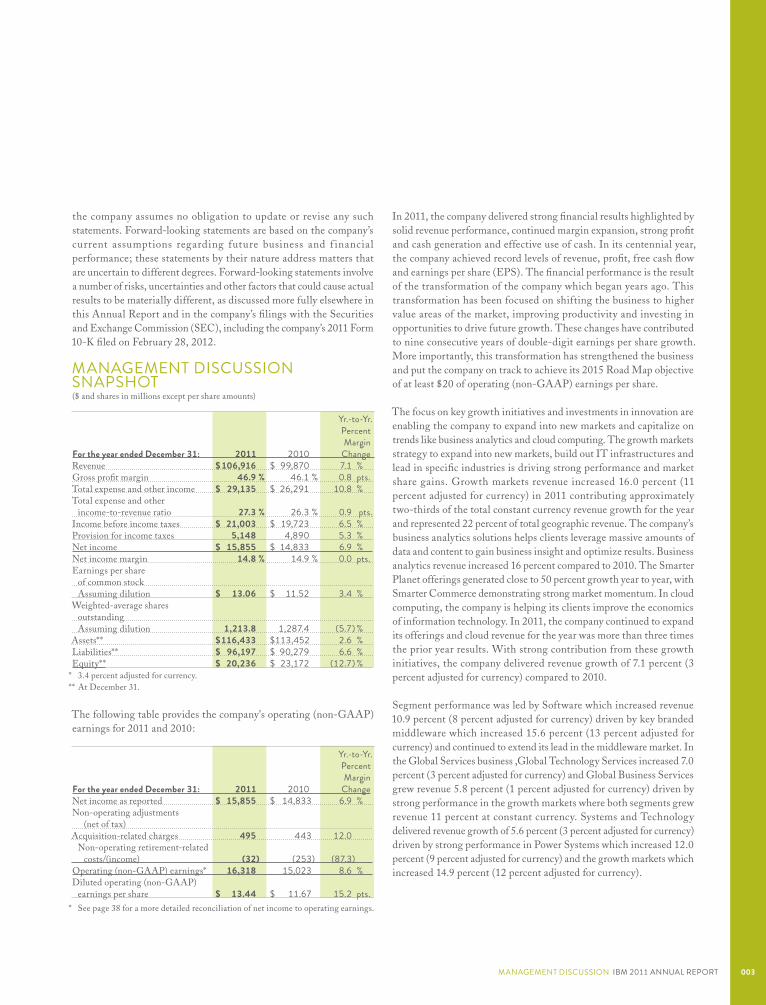
MANAGEMENT DISCUSSION SNAPSHOT($ and shares in millions except per share amounts)
Yr.-to-Yr. Percent MarginFor the year ended December 31: 2011 2010 Change Revenue $ 106,916 $ 99,870 7.1 % Gross profit margin 46.9 % 46.1 % 0.8 pts. Total expense and other income $ 29,135 $ 26,291 10.8 % Total expense and other income-to-revenue ratio 27.3 % 26.3 % 0.9 pts. Income before income taxes $ 21,003 $ 19,723 6.5 % Provision for income taxes 5,148 4,890 5.3 % Net income $ 15,855 $ 14,833 6.9 % Net income margin 14.8 % 14.9 % 0.0 pts. Earnings per share of common stock Assuming dilution $ 13.06 $ 11.52 3.4 % Weighted-average shares outstanding Assuming dilution 1,213.8 1,287.4 (5.7) % Assets** $ 116,433 $ 113,452 2.6 % Liabilities** $ 96,197 $ 90,279 6.6 % Equity** $ 20,236 $ 23,172 (12.7) %
* 3.4 percent adjusted for currency.** At December 31.
The following table provides the company's operating (non-GAAP) earnings for 2011 and 2010:
Yr.-to-Yr. Percent MarginFor the year ended December 31: 2011 2010 ChangeNet income as reported $ 15,855 $ 14,833 6.9 % Non-operating adjustments (net of tax) Acquisition-related charges 495 443 12.0 Non-operating retirement-related costs/(income) (32) (253) (87.3) Operating (non-GAAP) earnings* 16,318 15,023 8.6 % Diluted operating (non-GAAP) earnings per share $ 13.44 $ 11.67 15.2 pts.
* See page 38 for a more detailed reconciliation of net income to operating earnings.
In 2011, the company delivered strong financial results highlighted by solid revenue performance, continued margin expansion, strong profit and cash generation and effective use of cash. In its centennial year, the company achieved record levels of revenue, profit, free cash flow and earnings per share (EPS). The financial performance is the result of the transformation of the company which began years ago. This transformation has been focused on shifting the business to higher value areas of the market, improving productivity and investing in opportunities to drive future growth. These changes have contributed to nine consecutive years of double-digit earnings per share growth. More importantly, this transformation has strengthened the business and put the company on track to achieve its 2015 Road Map objective of at least $20 of operating (non-GAAP) earnings per share.
The focus on key growth initiatives and investments in innovation are enabling the company to expand into new markets and capitalize on trends like business analytics and cloud computing. The growth markets strategy to expand into new markets, build out IT infrastructures and lead in specific industries is driving strong performance and market share gains. Growth markets revenue increased 16.0 percent (11 percent adjusted for currency) in 2011 contributing approximately two-thirds of the total constant currency revenue growth for the year and represented 22 percent of total geographic revenue. The company’s business analytics solutions helps clients leverage massive amounts of data and content to gain business insight and optimize results. Business analytics revenue increased 16 percent compared to 2010. The Smarter Planet offerings generated close to 50 percent growth year to year, with Smarter Commerce demonstrating strong market momentum. In cloud computing, the company is helping its clients improve the economics of information technology. In 2011, the company continued to expand its offerings and cloud revenue for the year was more than three times the prior year results. With strong contribution from these growth initiatives, the company delivered revenue growth of 7.1 percent (3 percent adjusted for currency) compared to 2010.
Segment performance was led by Software which increased revenue 10.9 percent (8 percent adjusted for currency) driven by key branded middleware which increased 15.6 percent (13 percent adjusted for currency) and continued to extend its lead in the middleware market. In the Global Services business ,Global Technology Services increased 7.0 percent (3 percent adjusted for currency) and Global Business Services grew revenue 5.8 percent (1 percent adjusted for currency) driven by strong performance in the growth markets where both segments grew revenue 11 percent at constant currency. Systems and Technology delivered revenue growth of 5.6 percent (3 percent adjusted for currency) driven by strong performance in Power Systems which increased 12.0 percent (9 percent adjusted for currency) and the growth markets which increased 14.9 percent (12 percent adjusted for currency).
MANAGEMENT DISCUSSION IBM 2011 ANNUAL REPORT 003
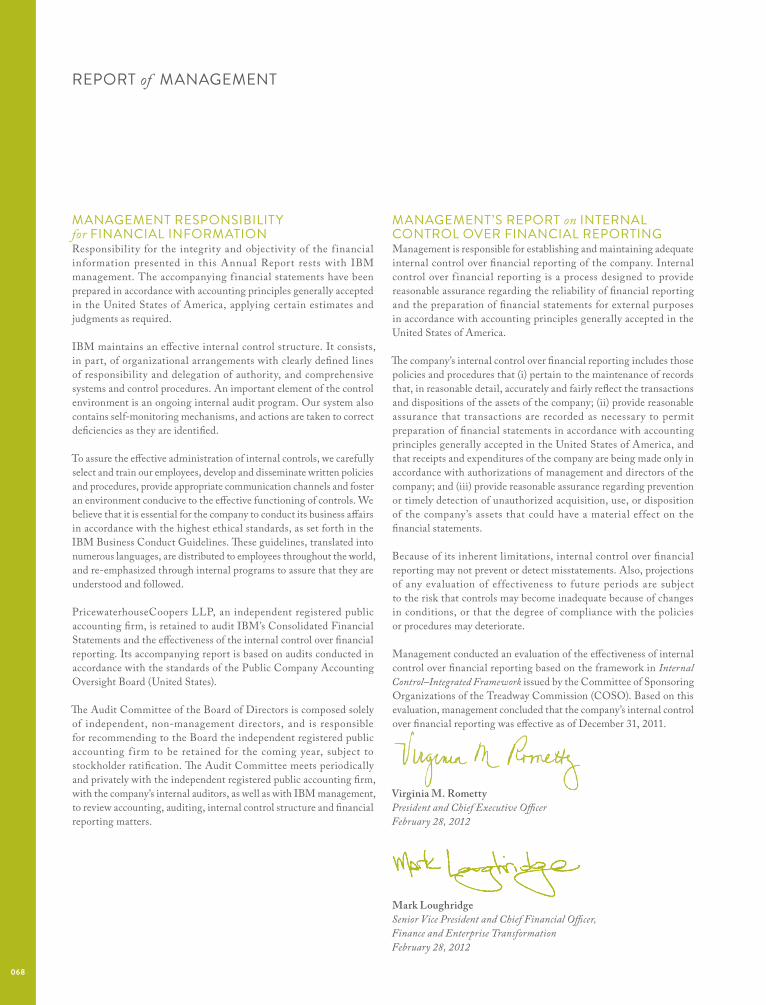
MANAGEMENT RESPONSIBILITY for FINANCIAL INFORMATION Responsibility for the integrity and objectivity of the f inancial information presented in this Annual Report rests with IBM management. The accompanying f inancial statements have been prepared in accordance with accounting principles generally accepted in the United States of America, applying certain estimates and judgments as required.
IBM maintains an effective internal control structure. It consists, in part, of organizational arrangements with clearly defined lines of responsibility and delegation of authority, and comprehensive systems and control procedures. An important element of the control environment is an ongoing internal audit program. Our system also contains self-monitoring mechanisms, and actions are taken to correct deficiencies as they are identified.
To assure the effective administration of internal controls, we carefully select and train our employees, develop and disseminate written policies and procedures, provide appropriate communication channels and foster an environment conducive to the effective functioning of controls. We believe that it is essential for the company to conduct its business affairs in accordance with the highest ethical standards, as set forth in the IBM Business Conduct Guidelines. These guidelines, translated into numerous languages, are distributed to employees throughout the world, and re-emphasized through internal programs to assure that they are understood and followed.
PricewaterhouseCoopers LLP, an independent registered public accounting firm, is retained to audit IBM’s Consolidated Financial Statements and the effectiveness of the internal control over financial reporting. Its accompanying report is based on audits conducted in accordance with the standards of the Public Company Accounting Oversight Board (United States).
The Audit Committee of the Board of Directors is composed solely of independent, non-management directors, and is responsible for recommending to the Board the independent registered public accounting f irm to be retained for the coming year, subject to stockholder ratification. The Audit Committee meets periodically and privately with the independent registered public accounting firm, with the company’s internal auditors, as well as with IBM management, to review accounting, auditing, internal control structure and financial reporting matters.
REPORT of MANAGEMENT
MANAGEMENT’S REPORT on INTERNAL CONTROL OVER FINANCIAL REPORTING Management is responsible for establishing and maintaining adequate internal control over financial reporting of the company. Internal control over f inancial reporting is a process designed to provide reasonable assurance regarding the reliability of financial reporting and the preparation of financial statements for external purposes in accordance with accounting principles generally accepted in the United States of America.
The company’s internal control over financial reporting includes those policies and procedures that (i) pertain to the maintenance of records that, in reasonable detail, accurately and fairly reflect the transactions and dispositions of the assets of the company; (ii) provide reasonable assurance that transactions are recorded as necessary to permit preparation of financial statements in accordance with accounting principles generally accepted in the United States of America, and that receipts and expenditures of the company are being made only in accordance with authorizations of management and directors of the company; and (iii) provide reasonable assurance regarding prevention or timely detection of unauthorized acquisition, use, or disposition of the company’s assets that could have a material effect on the financial statements.
Because of its inherent limitations, internal control over financial reporting may not prevent or detect misstatements. Also, projections of any evaluation of effectiveness to future periods are subject to the risk that controls may become inadequate because of changes in conditions, or that the degree of compliance with the policies or procedures may deteriorate.
Management conducted an evaluation of the effectiveness of internal control over financial reporting based on the framework in Internal Control–Integrated Framework issued by the Committee of Sponsoring Organizations of the Treadway Commission (COSO). Based on this evaluation, management concluded that the company’s internal control over financial reporting was effective as of December 31, 2011.
Virginia M. RomettyPresident and Chief Executive Officer February 28, 2012
Mark LoughridgeSenior Vice President and Chief Financial Officer, Finance and Enterprise Transformation February 28, 2012
068
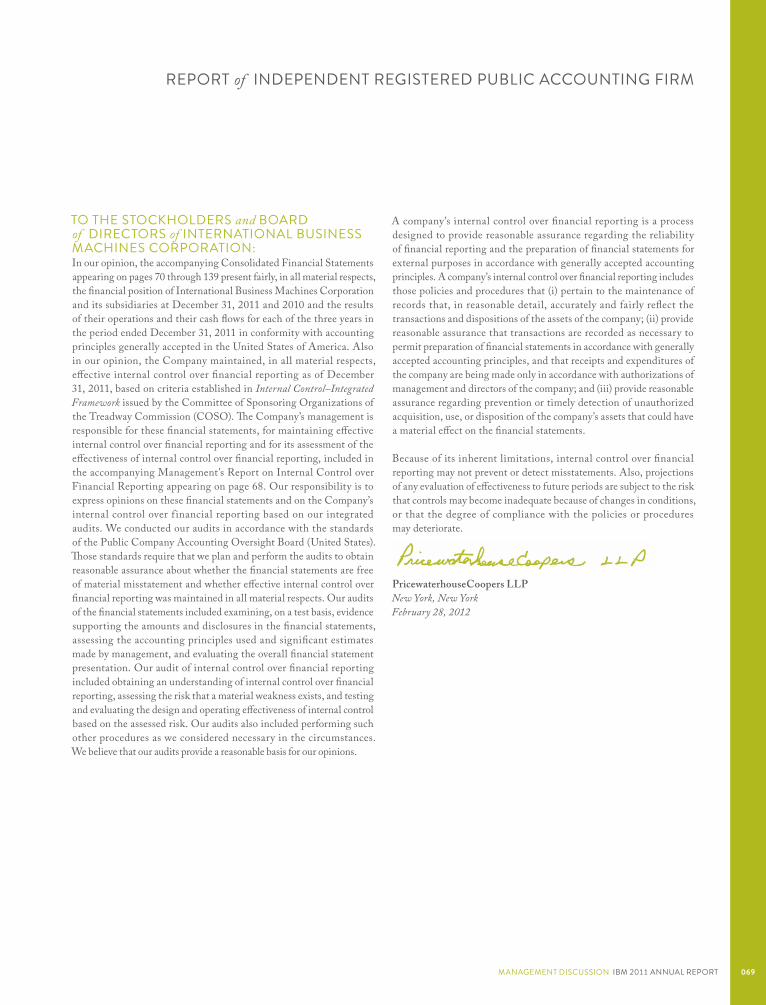
A company’s internal control over financial reporting is a process designed to provide reasonable assurance regarding the reliability of financial reporting and the preparation of financial statements for external purposes in accordance with generally accepted accounting principles. A company’s internal control over financial reporting includes those policies and procedures that (i) pertain to the maintenance of records that, in reasonable detail, accurately and fairly reflect the transactions and dispositions of the assets of the company; (ii) provide reasonable assurance that transactions are recorded as necessary to permit preparation of financial statements in accordance with generally accepted accounting principles, and that receipts and expenditures of the company are being made only in accordance with authorizations of management and directors of the company; and (iii) provide reasonable assurance regarding prevention or timely detection of unauthorized acquisition, use, or disposition of the company’s assets that could have a material effect on the financial statements.
Because of its inherent limitations, internal control over financial reporting may not prevent or detect misstatements. Also, projections of any evaluation of effectiveness to future periods are subject to the risk that controls may become inadequate because of changes in conditions, or that the degree of compliance with the policies or procedures may deteriorate.
PricewaterhouseCoopers LLPNew York, New York February 28, 2012
TO THE STOCKHOLDERS and BOARD of DIRECTORS of INTERNATIONAL BUSINESS MACHINES CORPORATION: In our opinion, the accompanying Consolidated Financial Statements appearing on pages 70 through 139 present fairly, in all material respects, the financial position of International Business Machines Corporation and its subsidiaries at December 31, 2011 and 2010 and the results of their operations and their cash flows for each of the three years in the period ended December 31, 2011 in conformity with accounting principles generally accepted in the United States of America. Also in our opinion, the Company maintained, in all material respects, effective internal control over financial reporting as of December 31, 2011, based on criteria established in Internal Control–Integrated Framework issued by the Committee of Sponsoring Organizations of the Treadway Commission (COSO). The Company’s management is responsible for these financial statements, for maintaining effective internal control over financial reporting and for its assessment of the effectiveness of internal control over financial reporting, included in the accompanying Management’s Report on Internal Control over Financial Reporting appearing on page 68. Our responsibility is to express opinions on these financial statements and on the Company’s internal control over f inancial reporting based on our integrated audits. We conducted our audits in accordance with the standards of the Public Company Accounting Oversight Board (United States). Those standards require that we plan and perform the audits to obtain reasonable assurance about whether the financial statements are free of material misstatement and whether effective internal control over financial reporting was maintained in all material respects. Our audits of the financial statements included examining, on a test basis, evidence supporting the amounts and disclosures in the financial statements, assessing the accounting principles used and significant estimates made by management, and evaluating the overall financial statement presentation. Our audit of internal control over financial reporting included obtaining an understanding of internal control over financial reporting, assessing the risk that a material weakness exists, and testing and evaluating the design and operating effectiveness of internal control based on the assessed risk. Our audits also included performing such other procedures as we considered necessary in the circumstances. We believe that our audits provide a reasonable basis for our opinions.
REPORT of INDEPENDENT REGISTERED PUBLIC ACCOUNTING FIRM
MANAGEMENT DISCUSSION IBM 2011 ANNUAL REPORT 069
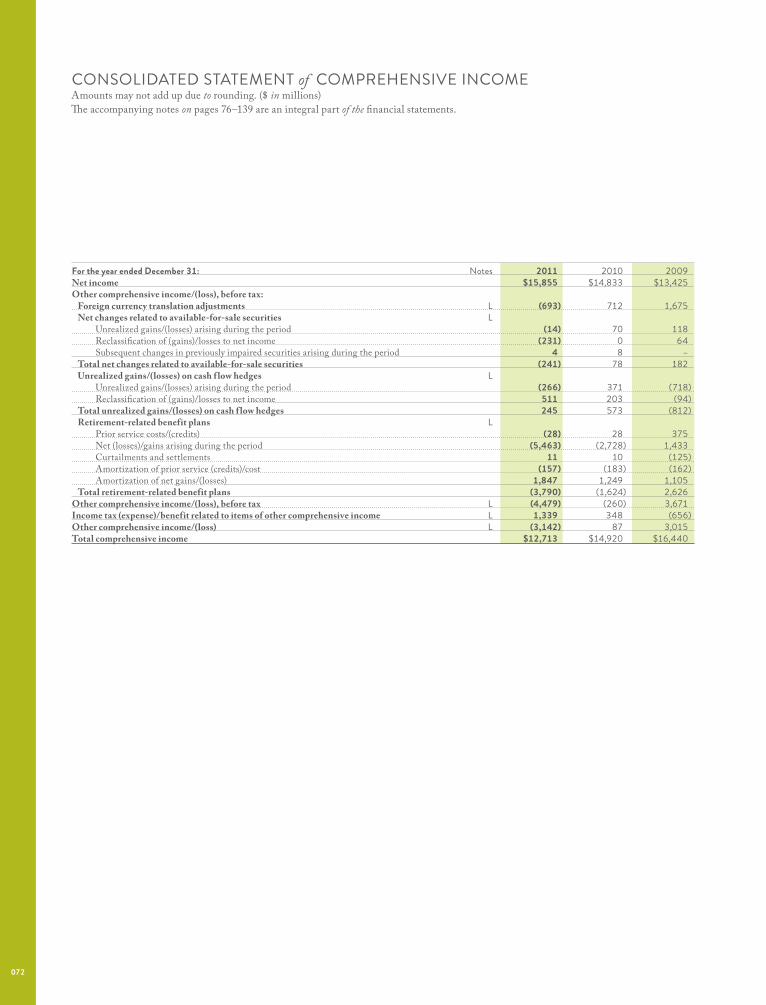
CONSOLIDATED STATEMENT of COMPREHENSIVE INCOMEAmounts may not add up due to rounding. ($ in millions) The accompanying notes on pages 76–139 are an integral part of the financial statements.
For the year ended December 31: Notes 2011 2010 2009 Net income $15,855 $14,833 $13,425 Other comprehensive income/(loss), before tax: Foreign currency translation adjustments L (693) 712 1,675 Net changes related to available-for-sale securities L Unrealized gains/(losses) arising during the period (14) 70 118 Reclassification of (gains)/losses to net income (231) 0 64 Subsequent changes in previously impaired securities arising during the period 4 8 – Total net changes related to available-for-sale securities (241) 78 182 Unrealized gains/(losses) on cash f low hedges L Unrealized gains/(losses) arising during the period (266) 371 (718) Reclassification of (gains)/losses to net income 511 203 (94) Total unrealized gains/(losses) on cash f low hedges 245 573 (812) Retirement-related benefit plans L Prior service costs/(credits) (28) 28 375 Net (losses)/gains arising during the period (5,463) (2,728) 1,433 Curtailments and settlements 11 10 (125) Amortization of prior service (credits)/cost (157) (183) (162) Amortization of net gains/(losses) 1,847 1,249 1,105 Total retirement-related benefit plans (3,790) (1,624) 2,626 Other comprehensive income/(loss), before tax L (4,479) (260) 3,671 Income tax (expense)/benefit related to items of other comprehensive income L 1,339 348 (656) Other comprehensive income/(loss) L (3,142) 87 3,015 Total comprehensive income $12,713 $14,920 $16,440
072
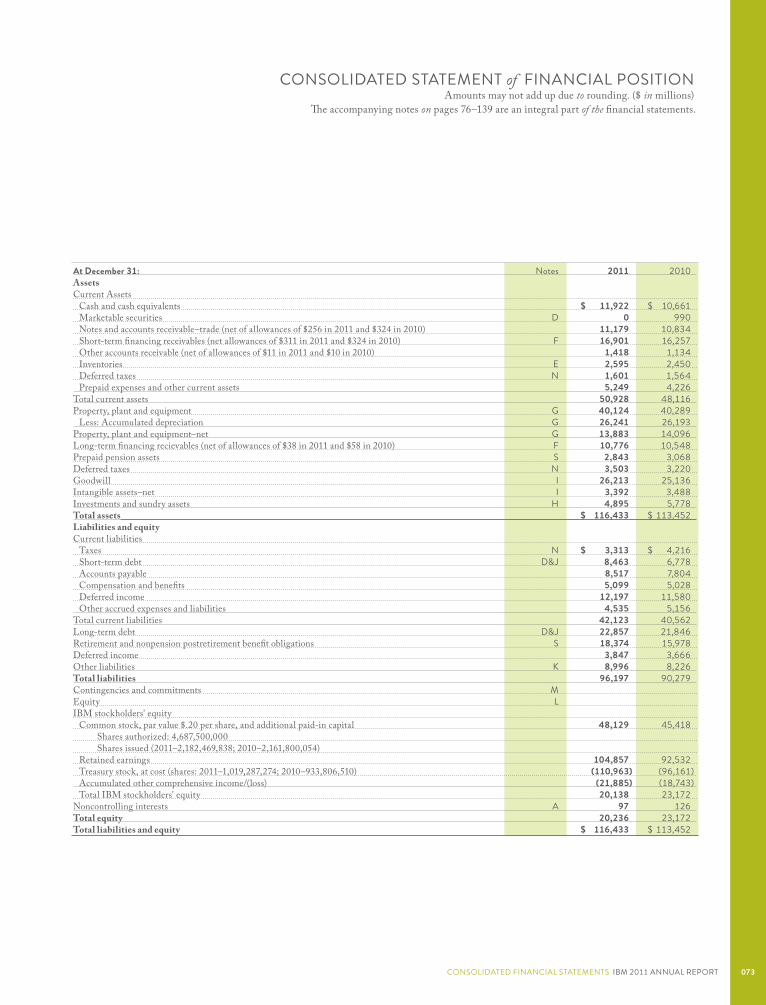
At December 31: Notes 2011 2010 AssetsCurrent Assets Cash and cash equivalents $ 11,922 $ 10,661 Marketable securities D 0 990 Notes and accounts receivable–trade (net of allowances of $256 in 2011 and $324 in 2010) 11,179 10,834 Short-term financing receivables (net allowances of $311 in 2011 and $324 in 2010) F 16,901 16,257 Other accounts receivable (net of allowances of $11 in 2011 and $10 in 2010) 1,418 1,134 Inventories E 2,595 2,450 Deferred taxes N 1,601 1,564 Prepaid expenses and other current assets 5,249 4,226 Total current assets 50,928 48,116 Property, plant and equipment G 40,124 40,289 Less: Accumulated depreciation G 26,241 26,193 Property, plant and equipment–net G 13,883 14,096 Long-term financing recievables (net of allowances of $38 in 2011 and $58 in 2010) F 10,776 10,548 Prepaid pension assets S 2,843 3,068 Deferred taxes N 3,503 3,220 Goodwill I 26,213 25,136 Intangible assets–net I 3,392 3,488 Investments and sundry assets H 4,895 5,778 Total assets $ 116,433 $ 113,452 Liabilities and equityCurrent liabilities Taxes N $ 3,313 $ 4,216 Short-term debt D&J 8,463 6,778 Accounts payable 8,517 7,804 Compensation and benefits 5,099 5,028 Deferred income 12,197 11,580 Other accrued expenses and liabilities 4,535 5,156 Total current liabilities 42,123 40,562 Long-term debt D&J 22,857 21,846 Retirement and nonpension postretirement benefit obligations S 18,374 15,978 Deferred income 3,847 3,666 Other liabilities K 8,996 8,226 Total liabilities 96,197 90,279 Contingencies and commitments M Equity L IBM stockholders' equity Common stock, par value $.20 per share, and additional paid-in capital 48,129 45,418 Shares authorized: 4,687,500,000 Shares issued (2011–2,182,469,838; 2010–2,161,800,054) Retained earnings 104,857 92,532 Treasury stock, at cost (shares: 2011–1,019,287,274; 2010–933,806,510) (110,963) (96,161) Accumulated other comprehensive income/(loss) (21,885) (18,743) Total IBM stockholders' equity 20,138 23,172 Noncontrolling interests A 97 126 Total equity 20,236 23,172 Total liabilities and equity $ 116,433 $ 113,452
CONSOLIDATED STATEMENT of FINANCIAL POSITIONAmounts may not add up due to rounding. ($ in millions)
The accompanying notes on pages 76–139 are an integral part of the financial statements.
CONSOLIDATED FINANCIAL STATEMENTS IBM 2011 ANNUAL REPORT 073
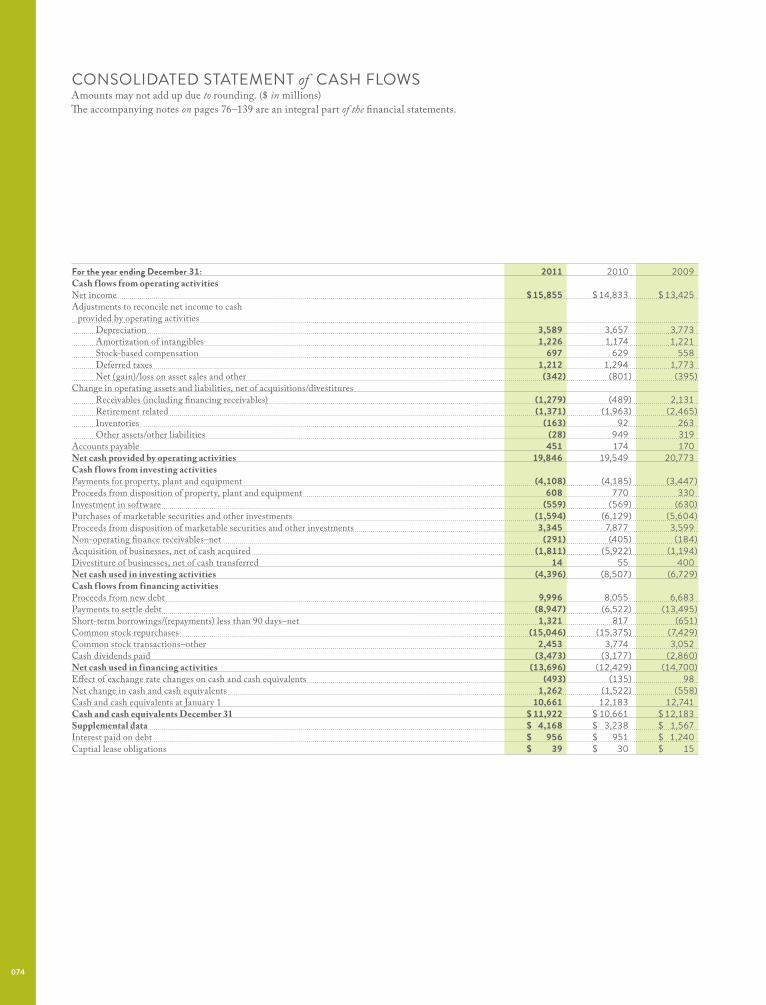
For the year ending December 31: 2011 2010 2009 Cash f lows from operating activities Net income $ 15,855 $ 14,833 $ 13,425 Adjustments to reconcile net income to cash provided by operating activities Depreciation 3,589 3,657 3,773 Amortization of intangibles 1,226 1,174 1,221 Stock-based compensation 697 629 558 Deferred taxes 1,212 1,294 1,773 Net (gain)/loss on asset sales and other (342) (801) (395)Change in operating assets and liabilities, net of acquisitions/divestitures Receivables (including financing receivables) (1,279) (489) 2,131 Retirement related (1,371) (1,963) (2,465) Inventories (163) 92 263 Other assets/other liabilities (28) 949 319 Accounts payable 451 174 170 Net cash provided by operating activities 19,846 19,549 20,773 Cash f lows from investing activitiesPayments for property, plant and equipment (4,108) (4,185) (3,447)Proceeds from disposition of property, plant and equipment 608 770 330 Investment in software (559) (569) (630)Purchases of marketable securities and other investments (1,594) (6,129) (5,604)Proceeds from disposition of marketable securities and other investments 3,345 7,877 3,599 Non-operating finance receivables–net (291) (405) (184)Acquisition of businesses, net of cash acquired (1,811) (5,922) (1,194)Divestiture of businesses, net of cash transferred 14 55 400 Net cash used in investing activities (4,396) (8,507) (6,729)Cash f lows from financing activitiesProceeds from new debt 9,996 8,055 6,683 Payments to settle debt (8,947) (6,522) (13,495)Short-term borrowings/(repayments) less than 90 days–net 1,321 817 (651)Common stock repurchases (15,046) (15,375) (7,429)Common stock transactions–other 2,453 3,774 3,052 Cash dividends paid (3,473) (3,177) (2,860)Net cash used in financing activities (13,696) (12,429) (14,700)Effect of exchange rate changes on cash and cash equivalents (493) (135) 98 Net change in cash and cash equivalents 1,262 (1,522) (558)Cash and cash equivalents at January 1 10,661 12,183 12,741 Cash and cash equivalents December 31 $ 11,922 $ 10,661 $ 12,183 Supplemental data $ 4,168 $ 3,238 $ 1,567 Interest paid on debt $ 956 $ 951 $ 1,240 Captial lease obligations $ 39 $ 30 $ 15
CONSOLIDATED STATEMENT of CASH FLOWSAmounts may not add up due to rounding. ($ in millions) The accompanying notes on pages 76–139 are an integral part of the financial statements.
074
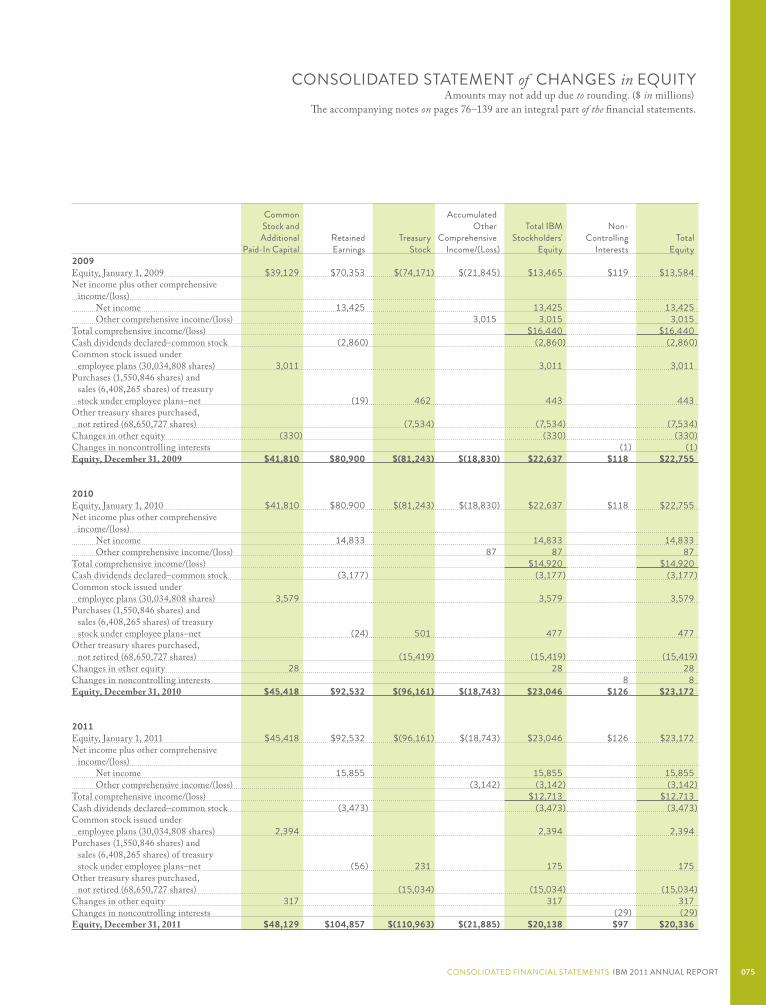
CONSOLIDATED STATEMENT of CHANGES in EQUITYAmounts may not add up due to rounding. ($ in millions)
The accompanying notes on pages 76–139 are an integral part of the financial statements.
Common Accumulated Stock and Other Total IBM Non- Additional Retained Treasury Comprehensive Stockholders' Controlling Total Paid-In Capital Earnings Stock Income/(Loss) Equity Interests Equity2009Equity, January 1, 2009 $39,129 $70,353 $(74,171) $(21,845) $13,465 $119 $13,584 Net income plus other comprehensive income/(loss) Net income 13,425 13,425 13,425 Other comprehensive income/(loss) 3,015 3,015 3,015 Total comprehensive income/(loss) $16,440 $16,440 Cash dividends declared–common stock (2,860) (2,860) (2,860)Common stock issued under employee plans (30,034,808 shares) 3,011 3,011 3,011 Purchases (1,550,846 shares) and sales (6,408,265 shares) of treasury stock under employee plans–net (19) 462 443 443 Other treasury shares purchased, not retired (68,650,727 shares) (7,534) (7,534) (7,534)Changes in other equity (330) (330) (330)Changes in noncontrolling interests (1) (1)Equity, December 31, 2009 $41,810 $80,900 $(81,243) $(18,830) $22,637 $118 $22,755
2010Equity, January 1, 2010 $41,810 $80,900 $(81,243) $(18,830) $22,637 $118 $22,755 Net income plus other comprehensive income/(loss) Net income 14,833 14,833 14,833 Other comprehensive income/(loss) 87 87 87Total comprehensive income/(loss) $14,920 $14,920 Cash dividends declared–common stock (3,177) (3,177) (3,177)Common stock issued under employee plans (30,034,808 shares) 3,579 3,579 3,579 Purchases (1,550,846 shares) and sales (6,408,265 shares) of treasury stock under employee plans–net (24) 501 477 477 Other treasury shares purchased, not retired (68,650,727 shares) (15,419) (15,419) (15,419)Changes in other equity 28 28 28 Changes in noncontrolling interests 8 8 Equity, December 31, 2010 $45,418 $92,532 $(96,161) $(18,743) $23,046 $126 $23,172
2011Equity, January 1, 2011 $45,418 $92,532 $(96,161) $(18,743) $23,046 $126 $23,172 Net income plus other comprehensive income/(loss) Net income 15,855 15,855 15,855 Other comprehensive income/(loss) (3,142) (3,142) (3,142)Total comprehensive income/(loss) $12,713 $12,713Cash dividends declared–common stock (3,473) (3,473) (3,473)Common stock issued under employee plans (30,034,808 shares) 2,394 2,394 2,394 Purchases (1,550,846 shares) and sales (6,408,265 shares) of treasury stock under employee plans–net (56) 231 175 175 Other treasury shares purchased, not retired (68,650,727 shares) (15,034) (15,034) (15,034)Changes in other equity 317 317 317 Changes in noncontrolling interests (29) (29)Equity, December 31, 2011 $48,129 $104,857 $(110,963) $(21,885) $20,138 $97 $20,336
CONSOLIDATED FINANCIAL STATEMENTS IBM 2011 ANNUAL REPORT 075
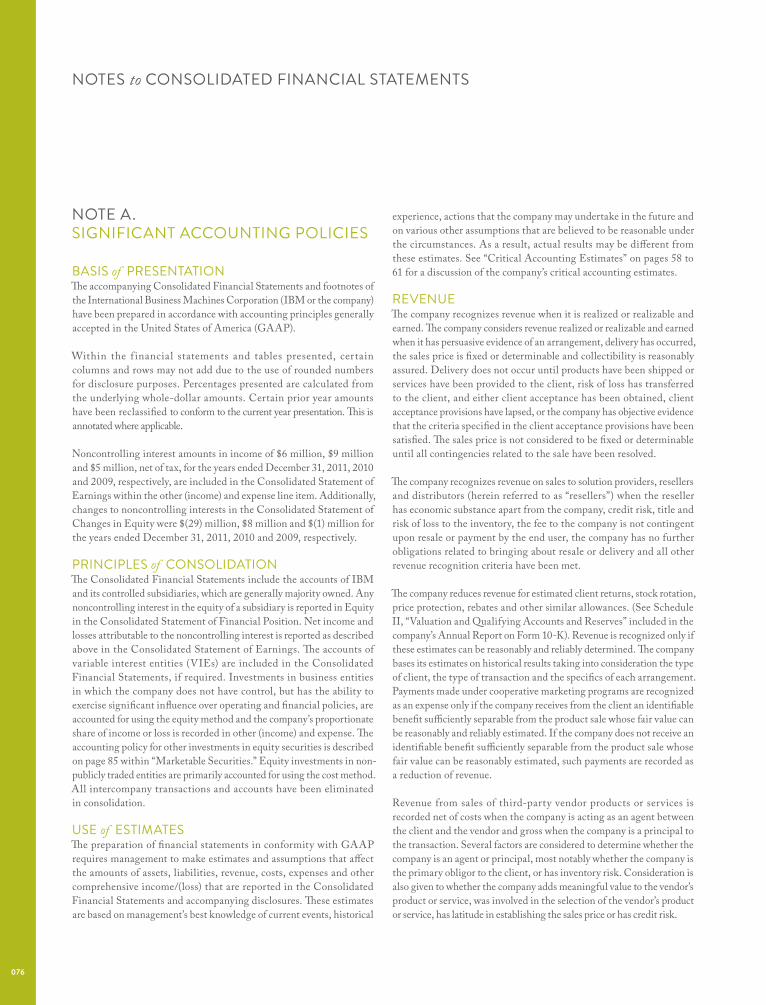
NOTE A.SIGNIFICANT ACCOUNTING POLICIES
BASIS of PRESENTATIONThe accompanying Consolidated Financial Statements and footnotes of the International Business Machines Corporation (IBM or the company) have been prepared in accordance with accounting principles generally accepted in the United States of America (GAAP).
Within the f inancial statements and tables presented, certain columns and rows may not add due to the use of rounded numbers for disclosure purposes. Percentages presented are calculated from the underlying whole-dollar amounts. Certain prior year amounts have been reclassified to conform to the current year presentation. This is annotated where applicable.
Noncontrolling interest amounts in income of $6 million, $9 million and $5 million, net of tax, for the years ended December 31, 2011, 2010 and 2009, respectively, are included in the Consolidated Statement of Earnings within the other (income) and expense line item. Additionally, changes to noncontrolling interests in the Consolidated Statement of Changes in Equity were $(29) million, $8 million and $(1) million for the years ended December 31, 2011, 2010 and 2009, respectively.
PRINCIPLES of CONSOLIDATIONThe Consolidated Financial Statements include the accounts of IBM and its controlled subsidiaries, which are generally majority owned. Any noncontrolling interest in the equity of a subsidiary is reported in Equity in the Consolidated Statement of Financial Position. Net income and losses attributable to the noncontrolling interest is reported as described above in the Consolidated Statement of Earnings. The accounts of variable interest entities (VIEs) are included in the Consolidated Financial Statements, if required. Investments in business entities in which the company does not have control, but has the ability to exercise significant influence over operating and financial policies, are accounted for using the equity method and the company’s proportionate share of income or loss is recorded in other (income) and expense. The accounting policy for other investments in equity securities is described on page 85 within “Marketable Securities.” Equity investments in non-publicly traded entities are primarily accounted for using the cost method. All intercompany transactions and accounts have been eliminated in consolidation.
USE of ESTIMATESThe preparation of financial statements in conformity with GAAP requires management to make estimates and assumptions that affect the amounts of assets, liabilities, revenue, costs, expenses and other comprehensive income/(loss) that are reported in the Consolidated Financial Statements and accompanying disclosures. These estimates are based on management’s best knowledge of current events, historical
NOTES to CONSOLIDATED FINANCIAL STATEMENTS
experience, actions that the company may undertake in the future and on various other assumptions that are believed to be reasonable under the circumstances. As a result, actual results may be different from these estimates. See “Critical Accounting Estimates” on pages 58 to 61 for a discussion of the company’s critical accounting estimates.
REVENUEThe company recognizes revenue when it is realized or realizable and earned. The company considers revenue realized or realizable and earned when it has persuasive evidence of an arrangement, delivery has occurred, the sales price is fixed or determinable and collectibility is reasonably assured. Delivery does not occur until products have been shipped or services have been provided to the client, risk of loss has transferred to the client, and either client acceptance has been obtained, client acceptance provisions have lapsed, or the company has objective evidence that the criteria specified in the client acceptance provisions have been satisfied. The sales price is not considered to be fixed or determinable until all contingencies related to the sale have been resolved.
The company recognizes revenue on sales to solution providers, resellers and distributors (herein referred to as “resellers”) when the reseller has economic substance apart from the company, credit risk, title and risk of loss to the inventory, the fee to the company is not contingent upon resale or payment by the end user, the company has no further obligations related to bringing about resale or delivery and all other revenue recognition criteria have been met.
The company reduces revenue for estimated client returns, stock rotation, price protection, rebates and other similar allowances. (See Schedule II, “Valuation and Qualifying Accounts and Reserves” included in the company’s Annual Report on Form 10-K). Revenue is recognized only if these estimates can be reasonably and reliably determined. The company bases its estimates on historical results taking into consideration the type of client, the type of transaction and the specifics of each arrangement. Payments made under cooperative marketing programs are recognized as an expense only if the company receives from the client an identifiable benefit sufficiently separable from the product sale whose fair value can be reasonably and reliably estimated. If the company does not receive an identifiable benefit sufficiently separable from the product sale whose fair value can be reasonably estimated, such payments are recorded as a reduction of revenue.
Revenue from sales of third-party vendor products or services is recorded net of costs when the company is acting as an agent between the client and the vendor and gross when the company is a principal to the transaction. Several factors are considered to determine whether the company is an agent or principal, most notably whether the company is the primary obligor to the client, or has inventory risk. Consideration is also given to whether the company adds meaningful value to the vendor’s product or service, was involved in the selection of the vendor’s product or service, has latitude in establishing the sales price or has credit risk.
076
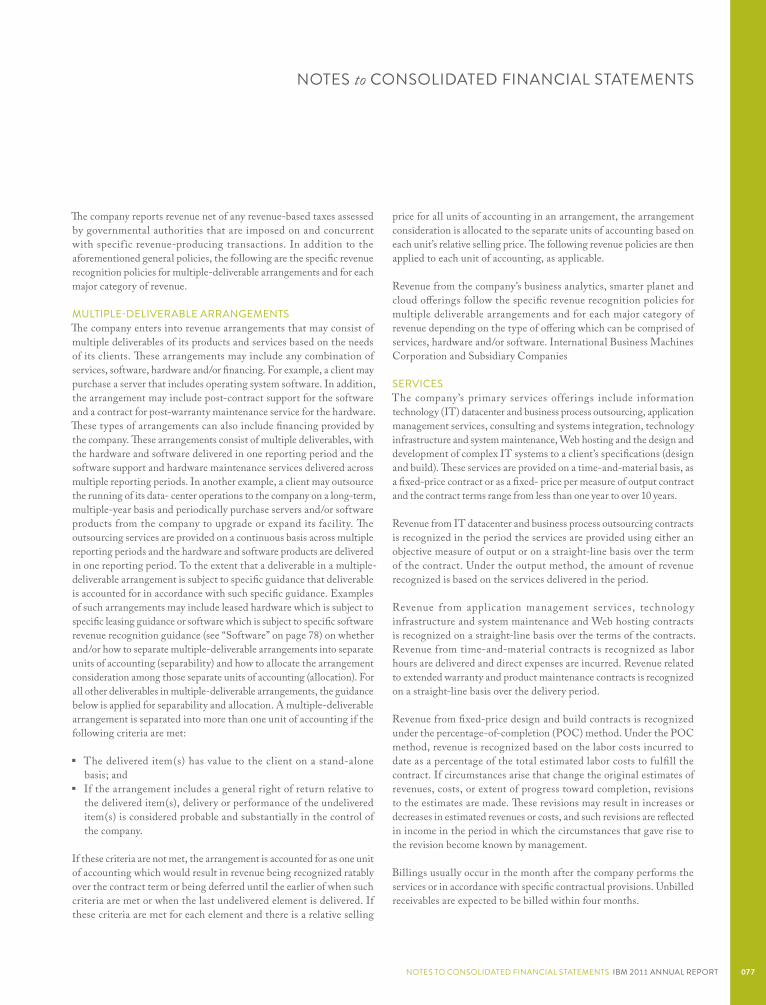
price for all units of accounting in an arrangement, the arrangement consideration is allocated to the separate units of accounting based on each unit’s relative selling price. The following revenue policies are then applied to each unit of accounting, as applicable.
Revenue from the company’s business analytics, smarter planet and cloud offerings follow the specific revenue recognition policies for multiple deliverable arrangements and for each major category of revenue depending on the type of offering which can be comprised of services, hardware and/or software. International Business Machines Corporation and Subsidiary Companies
SERVICESThe company’s primary services offerings include information technology (IT) datacenter and business process outsourcing, application management services, consulting and systems integration, technology infrastructure and system maintenance, Web hosting and the design and development of complex IT systems to a client’s specifications (design and build). These services are provided on a time-and-material basis, as a fixed-price contract or as a fixed- price per measure of output contract and the contract terms range from less than one year to over 10 years.
Revenue from IT datacenter and business process outsourcing contracts is recognized in the period the services are provided using either an objective measure of output or on a straight-line basis over the term of the contract. Under the output method, the amount of revenue recognized is based on the services delivered in the period.
Revenue from application management services, technology infrastructure and system maintenance and Web hosting contracts is recognized on a straight-line basis over the terms of the contracts. Revenue from time-and-material contracts is recognized as labor hours are delivered and direct expenses are incurred. Revenue related to extended warranty and product maintenance contracts is recognized on a straight-line basis over the delivery period.
Revenue from fixed-price design and build contracts is recognized under the percentage-of-completion (POC) method. Under the POC method, revenue is recognized based on the labor costs incurred to date as a percentage of the total estimated labor costs to fulfill the contract. If circumstances arise that change the original estimates of revenues, costs, or extent of progress toward completion, revisions to the estimates are made. These revisions may result in increases or decreases in estimated revenues or costs, and such revisions are reflected in income in the period in which the circumstances that gave rise to the revision become known by management.
Billings usually occur in the month after the company performs the services or in accordance with specific contractual provisions. Unbilled receivables are expected to be billed within four months.
The company reports revenue net of any revenue-based taxes assessed by governmental authorities that are imposed on and concurrent with specif ic revenue-producing transactions. In addition to the aforementioned general policies, the following are the specific revenue recognition policies for multiple-deliverable arrangements and for each major category of revenue.
MULTIPLE-DELIVERABLE ARRANGEMENTSThe company enters into revenue arrangements that may consist of multiple deliverables of its products and services based on the needs of its clients. These arrangements may include any combination of services, software, hardware and/or financing. For example, a client may purchase a server that includes operating system software. In addition, the arrangement may include post-contract support for the software and a contract for post-warranty maintenance service for the hardware. These types of arrangements can also include financing provided by the company. These arrangements consist of multiple deliverables, with the hardware and software delivered in one reporting period and the software support and hardware maintenance services delivered across multiple reporting periods. In another example, a client may outsource the running of its data- center operations to the company on a long-term, multiple-year basis and periodically purchase servers and/or software products from the company to upgrade or expand its facility. The outsourcing services are provided on a continuous basis across multiple reporting periods and the hardware and software products are delivered in one reporting period. To the extent that a deliverable in a multiple-deliverable arrangement is subject to specific guidance that deliverable is accounted for in accordance with such specific guidance. Examples of such arrangements may include leased hardware which is subject to specific leasing guidance or software which is subject to specific software revenue recognition guidance (see “Software” on page 78) on whether and/or how to separate multiple-deliverable arrangements into separate units of accounting (separability) and how to allocate the arrangement consideration among those separate units of accounting (allocation). For all other deliverables in multiple-deliverable arrangements, the guidance below is applied for separability and allocation. A multiple-deliverable arrangement is separated into more than one unit of accounting if the following criteria are met:
� The delivered item(s) has value to the client on a stand-alone basis; and
� If the arrangement includes a general right of return relative to the delivered item(s), delivery or performance of the undelivered item(s) is considered probable and substantially in the control of the company.
If these criteria are not met, the arrangement is accounted for as one unit of accounting which would result in revenue being recognized ratably over the contract term or being deferred until the earlier of when such criteria are met or when the last undelivered element is delivered. If these criteria are met for each element and there is a relative selling
NOTES to CONSOLIDATED FINANCIAL STATEMENTS
NOTES TO CONSOLIDATED FINANCIAL STATEMENTS IBM 2011 ANNUAL REPORT 077
BOARD of DIRECTORS: ALAIN J.P. BELDAManaging DirectorWarburg Pincus
WILLIAM R. BRODYPresidentSalk Institute for Biological Studies
KENNETH I. CHENAULTChairman and CEOAmerican Express Company
MICHAEL L. ESKEWRetired Chairman and CEOUnited Parcel Service, Inc
DAVID N. FARRChairman and CEOEmerson Electric Co.
SHIRLEY ANN JACKSONPresidentRensselaer Polytechnic Institute
ANDREW N. LIVERISChairman, President and CEOThe Dow Chemical Company
W. JAMES MCNERNEY, JR.Chairman, President and CEOThe Boeing Company
JAMES W. OWENSRetired Chairman and CEOCaterpillar Inc.
SAMUEL J. PALMISANOChairman of the BoardIBM
VIRGINIA M. ROMETTYPresident and CEOIBM
JOAN E. SPEROAdjunct Senior Research ScholarColumbia University School of International and Public Affairs
SIDNEY TAURELSenior AdvisorCapital Royalty L.P.
LORENZO H. ZAMBRANOChairman and CEOCEMEX, S.A.B. de C.V.
SENIOR LEADERSHIP: RODNEY C. ADKINSSenior Vice PresidentSystems and Technology Group
COLLEEN F. ARNOLDSenior Vice PresidentApplication Management Services
JAMES P. BRAMANTESenior Vice PresidentGrowth Markets
MICHELLE H. BROWDYVice President, Assistant General Council and Secretary
ENRICH CLEMENTISenior Vice PresidentGlobal Technology Services
MICHAEL E. DANIELSSenior Vice President and Group ExecutiveServices
ROBERT F. DEL BENEVice President and Treasurer
BRUNO V. DI LEO ALLENSenior Vice PresidentSales and Distribution
JON C. IWATASenior Vice PresidentMarketing and Communications
JAMES J. KAVANAUGHVice President and Controller
JOHN E. KELLY IIISenior Vice President and DirectorResearch
ROBERT J. LEBLANCSenior Vice PresidentMiddleware Software Group
MARK LOUGHRIDGESenior Vice President and CEOFinance and Enterprise Transformation
J. RANDALL MACDONALDSenior Vice PresidentHuman Resources
STEVEN A. MILLSSenior Vice President and Group ExecutiveSoftware and Systems
SAMUEL J. PALMISANOChairman of the Board
MICHAEL D. RHODINSenior Vice PresidentSoftware Solutions Group
VIRGINIA M. ROMETTYPresident and CEO
LINDA S. SANFORDSenior Vice PresidentEnterprise Transformation
TIMOTHY S. SHAUGHNESSYSenior Vice PresidentGTS Services Delivery
BRIDGET A. VAN KRALINGENSenior Vice President Global Business Services
ROBERT C. WEBERSenior Vice PresidentLegal and Regulatory Affairs,and General Counsel
BOARD of DIRECTORS and SENIOR LEADERSHIP
STOCKHOLDER INFORMATION
International Business Machines Corporation, a component of the Dow 30, is a worldwide supplier of advanced information technology, communications systems, services, and program products. During its over 100-year history, it has both pioneered new information technologies and also has had to adapt to new technologies and changes in the ways customers used and purchased information technology.
IBM INVESTOR SERVICES PROGRAM The Investor Services Program brochure outlines a number of services provided for IBM stockholders and potential IBM investors, including the reinvestment of dividends, direct purchase and the deposit of IBM stock certificates for safekeeping. Call (888) IBM-6700 for a copy of the brochure. Investors residing outside the United States, Canada and Puerto Rico should call (781) 575-2727.
Investors with other requests may write to: IBM Stockholder Relations, New Orchard Road, Armonk, New York 10504
IBM STOCK IBM common stock is listed on the New York Stock Exchange, the Chicago Stock Exchange, and outside the United States.
STOCKHOLDER COMMUNICATIONS Stockholders in the United States and Canada can get quarterly financial results, a summary of the Annual Meeting remarks, and voting results from the meeting by calling (800) IBM-7800. Stockholders residing outside the United States, Canada and Puerto Rico should call (402) 573-9861.
ANNUAL MEETING The IBM Annual Meeting of Stockholders will be held on Tuesday, April 24, 2012, at 10 a.m. in the Charleston Area Convention Center, North Charleston, South Carolina.
GENERAL INFORMATION Stockholders of record can receive online account information and answers to frequently asked questions regarding stockholder accounts via the Internet (http://www.ibm.com/investor). Stockholders of record can also consent to receive future IBM Annual Reports and Proxy Statements online through the Internet at this site.
For answers to general questions about IBM from within the continental United States, call (800) IBM-4YOU. From outside the United States, Canada and Puerto Rico, call (914) 499-1900.
International Business Machines Corporation New Orchard Road, Armonk, NY 10504 (914) 499-1900 www.ibm.com

HOW CAN WE HELP
IMPROVE YOUR LIFE,
STARTING TODAY?
Concept & Design by Olivia J DuVal / Photography by Brett Falcon (except of Virginia Rometty & Samuel Palmisano)
All type set in Adobe Caslon Pro & Brandon Grotesque in Adobe InDesign CS5Cover: Red River 60lb. Polar Matte®
Interior Narrative: Red River 45lb. Zeppelin Semi-Gloss®Short Sheets: Canson® Infinity Rag Photographique 210gsm
Financials: French Paper Co. Dur-O-Tone Newsprint White 50lb. Text
Printed on an Epson Stylus Photo 1400 Inkjet Printer & Hand-BoundOctober 2012