Embed Size (px)
Citation preview
© 2009 IBM Corporation
IBM Content Based Copy Detection System for TRECVID 2009
Speaker: Matt Hill
On behalf of:Jane Chang, Michele Merler, Paul Natsev, John R. Smith
© 2009 IBM CorporationIBM Research
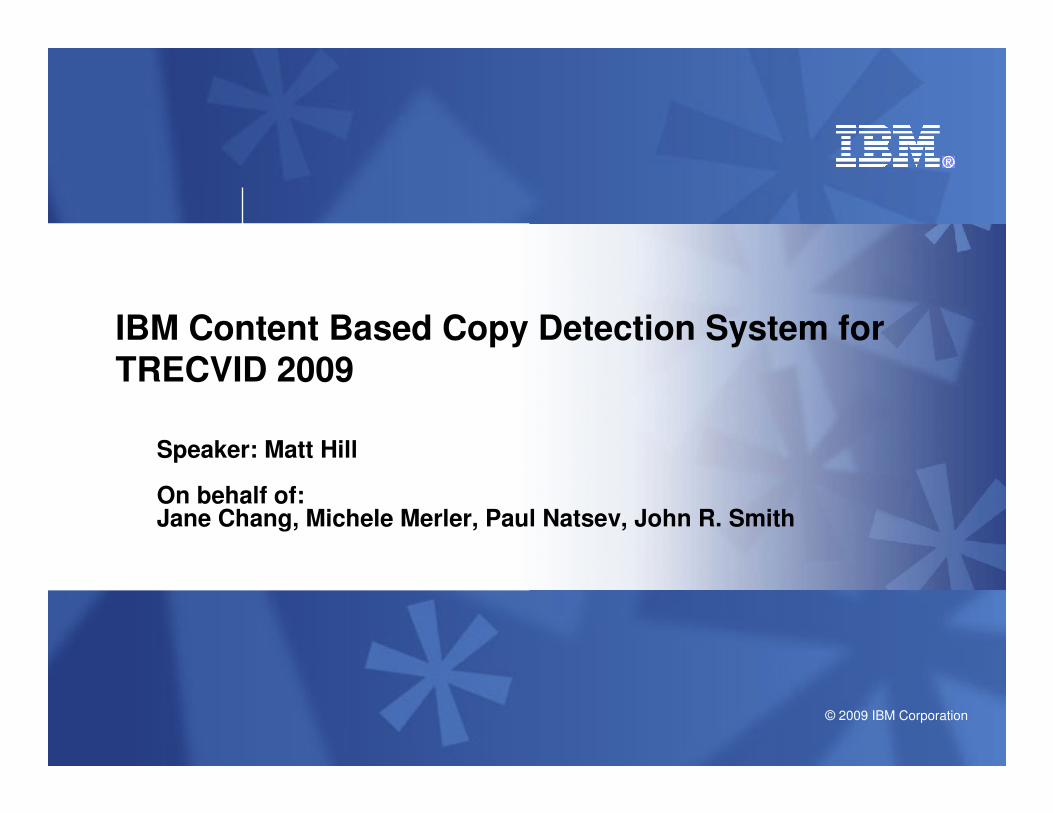
� We explored 4 complementary approaches for video fingerprinting:
– Two frame-based visual fingerprints (color correlogram and SIFTogram)
– Two temporal sequence-based fingerprints (audio & motion activity)
� Key question: How far can we go with coarse-grain fingerprints?
– Focus on common real-world transforms typical for video piracy detection
– Focus on speed, space efficiency, lack of false alarms
System Overview
VideosVideos
Seg
men
t-b
ased
Fin
gerp
rin
ts
Seg
men
t-b
ased
Fin
gerp
rin
ts
Motion activityMotion activity
Audio activityAudio activity
SIFTogramSIFTogram
Color correlogramColor correlogram
Fra
me-b
ased
Fin
gerp
rin
ts
Fra
me-b
ased
Fin
gerp
rin
ts
Fingerprints Fusion
Mean-Normalized Video-Only Run
Mean-Normalized Video-Only Run
Median-Normalized Video-Only Run
Median-Normalized Video-Only Run
Mean-Normalized Audio-Video run
Mean-Normalized Audio-Video run
Median-Normalized Audio-Video Run
Median-Normalized Audio-Video Run

© 2009 IBM CorporationIBM Research
We focused on CBCD transforms that represent typical video piracy scenarios (i.e., ignore PIP and post-production edits)
� T2: Picture in picture Type 1 (The original video is inserted in front)
� T3: Insertions of pattern
� T4: Strong re-encoding
� T5: Change of gamma
� T6: Decrease in quality -- This includes choosing randomly 3 transformations from the following: Blur, change of gamma, framedropping, contrast, compression, ratio, white noise
� T8: Post production -- This includes choosing randomly 3 transformations from the following: Crop, Shift, Contrast, caption (text insertion), flip (mirroring), Insertion of pattern, Picture in Picture type 2 (the original video is in the background)
� T10: change to randomly choose 1 transformation from each of the 3 main categories.
We focused on these 4 transforms

© 2009 IBM CorporationIBM Research
Visual Fingerprint Extraction for Frame-Based Methods
� Sample 1 frame per second for visual feature extraction
� Throw out bad frames, normalize appearance of remaining frames
� Extract the relevant feature, i.e. color correlogram or SIFTogram
� Add reference content to the database for indexing
Sample Frames
De-border/
Normalize
Frames
Detect/remove
“junk” frames
Extract Frame-
Based Features
VideoFrames
VisualFingerprints
ReferenceFingerprints
“Good”Frames
NormalizedFrames

© 2009 IBM CorporationIBM Research
Color Correlogram-based Fingerprints
� A color correlogram expresses how the spatial correlation of colors changes within a local region neighborhood
– Captures color and local structure, some invariability to view point changes
– We use a “cross” formulation which also captures global layout & emphasizes the center of the image, while being invariant to flips
� Informally, a correlogram for an image is a table indexed by color pairs, where the d-th entry for row (i,j) specifies the probability of finding a pixel of color j at a distance d from a pixel of color i in this image
– We use simplified auto-correlogram formulation, which captures conditional probability of seeing given color within a certain distance of same color pixel
� We compute the auto-correlogram in a 166-dimensional quantized HSV color space, resulting in a 332-dimensional cross-CC feature vector
� Pros/cons for correlogram fingerprints:
– Robust w.r.t. brightness changes, aspect ratio, small crops, flipping, compression
– Cons: non-linear intensity transforms (e.g., gamma), changes in hue, saturation

© 2009 IBM CorporationIBM Research
Visual Word-based Fingerprints (SIFTograms)
� Histogram of SIFT-based Codewords
– We use U. of Amsterdam’s tools to detect interest points and extract SIFT descriptors
– We build a codebook of visual words using k-means clustering to quantize the SIFT features
• Harris-Laplace, SIFT descriptor, soft assignment
– We then compute a histogram of the quantized SIFT features (SIFTogram), making a global feature for each frame sampled at 1fps
– The # of codewords is the dimensionality of the feature vector, in our case, 1000
� “SIFTogram” is robust w.r.t. gamma, color, rotation, scale, blur, borders and some overlaid graphics
� Cons: compute intensive, space inefficient, does not handle compression well
Figure: C.W. Ngo

© 2009 IBM CorporationIBM Research
Temporal Fingerprint Extraction for Segment-Based Methods
� We apply this method to describe overall audio or motion activity
� We scan the audio/video as a time series of audio/visual features and detect “interesting points” along the feature trajectory (e.g., valleys, peaks, flat regions)
� We form overlapping segments covering multiple “events” on the trajectory, normalize the segments, and represent each with a compact fixed dimensionality descriptor based on uniform re-sampling of the segment (64-bytes)
� This process results in many overlapping fingerprint sequences of varying lengths, based on min/max segment duration constraints
� Robust w.r.t. color transforms, blur, noise, compression and geometric transforms
� Doesn’t works well for short copied segments, or segments with little activity
Extract
Frame-based
Features
ExtractEvents
Extract
Segment-basedTime Series
Extract
Segment-basedFeatures
VideoFrames
Visual Features
Events Segments
Visual Features
TemporalSegmentFingerprints Reference
Fingerprints

© 2009 IBM CorporationIBM Research
Fingerprint Matching
� For each test segment, find matching reference segments / frames
� For each reference video, collect all matching segments / frames and find the subset of matching segments that produces the best linear fit
� For each reference video, compute an overall matching score based on the matched segments / frames conforming with the computed linear fit params
� Determine copy / no copy status based on overall score threshold
ReferenceFingerprints
(Segments/Frames)
Linear
Fit
Analysis
Matching
Prints
Test
Fingerprint
Filtered
MatchingPrintsFingerprint
Search and
Comparison
Matched
Video
Scoring
ReferenceMatch?
Match score
Yes
No

© 2009 IBM CorporationIBM Research
Indexing for Fast Nearest Neighbor Lookup
� We use FLANN (Fast Library for Approximate Nearest Neighbor) open source library to enable fast lookups of the fingerprints
– Authors: Marius Muja and David G. Lowe, Univ. of British Columbia
– http://www.cs.ubc.ca/~mariusm/index.php/FLANN/FLANN
� Given the set to index, FLANN can auto-select algorithms (kd-tree, hierarchical k-means, hybrid) and parameters
� Speed gains of 50x compared to linear scan with color feature method enabled us to tune matching params for better performance
� SIFTogram lookup relies on indexing even more

© 2009 IBM CorporationIBM Research
Performance Analysis
� We use NOFA profile as BALANCED profile turns out to be very similar:
– NDCR = Pmiss + β · RFA where β = CFA / (Cmiss · Rtarget) = 2 for BALANCED profile
– RFA = FP / Tqueries where Tqueries ≈ 7.3 hours for the 2009 dataset (201 queries)
– Therefore, NDCR ≈ Pmiss + 0.28 FP, or each false alarm increases NDCR by 0.28!
– Note that we can obtain trivial NDCR = 1.0 by submitting empty result set
– Therefore, BALANCED profile is essentially a “3-false-alarm profile”
� Our performance analysis is focused on:
– NOFA profile
– Optimal NDCR rather than actual NDCR (since most runs had actual NDCR>1)
– Transforms T3-T6 (typical for video piracy, esp. T6)
– In some cases, we report aggregate performance over multiple transforms
• To compute meaningful optimal NDCR scores when aggregating across transforms, we
modify the ground truth to map multiple transforms to a single virtual transform
• This forces evaluation script to use the same optimal threshold across all transforms
© 2009 IBM CorporationIBM Research
Actual Threshold NDCR for Video-Only Task
0.1
1
10
100
1000
10000
ibm
.v.n
ofa.
medi
anN
OFA
ibm
.v.n
ofa.m
eanN
OFA
TU
BIT
AK
_UZAY
.v.n
ofa
.NO
FAU
NIB
S.v
.nofa
.DIR
EC
TA
TTLabs
.v.n
ofa.1
MC
G-IC
T-C
AS
.v.n
ofa.IC
TN
FO
PT
UN
IBS
.v.n
ofa
.VS
T
asa
hik
ase
i.v.n
ofa
.bas
elin
eN
II.v.
nofa
.Em
bed0
2C
RIM
.v.n
ofa
.Run
1NO
FA
VIV
Ala
b-uO
ttaw
a.v
.nofa
.noI
nsert
Fud
anV
ID.v
.nof
a.fu
dan09L
o2
Submission
Av
era
ge
ND
CR
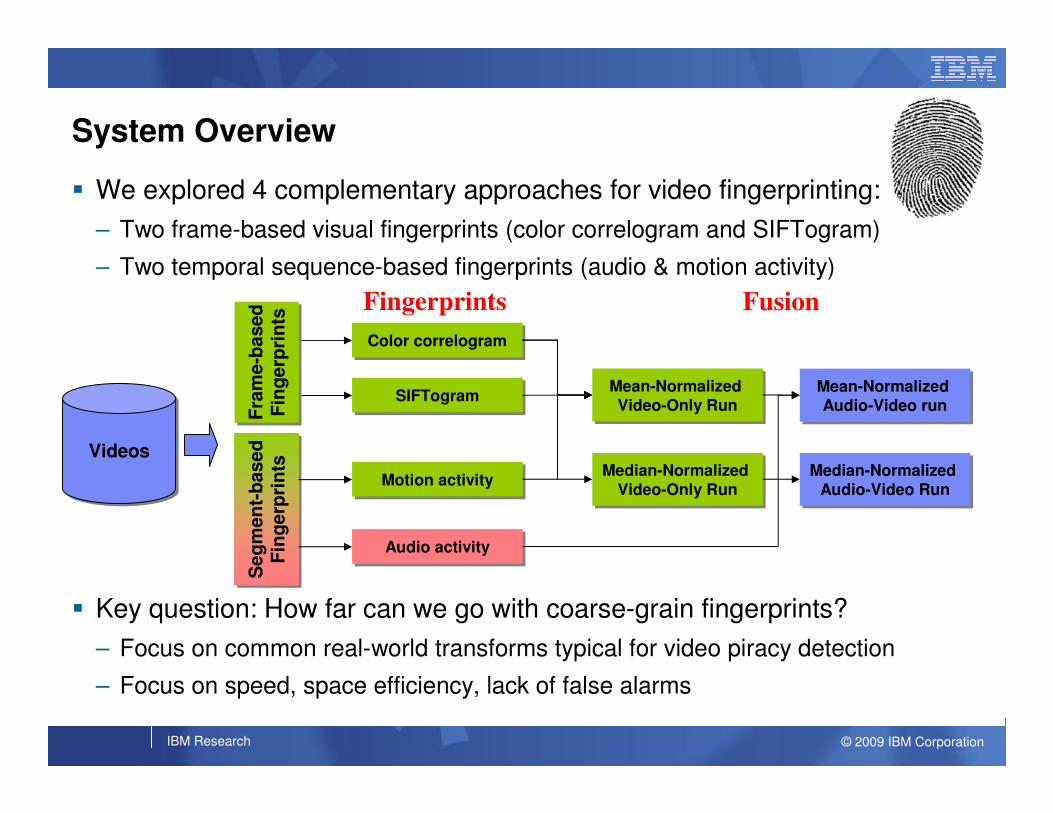
Why we use optimal NDCR rather than actual NDCR?
� NOFA penalty resulted in very high costs on actual threshold measure
– “balanced” profile also allows very few false alarms
� Ours are the only runs with scores less than the trivial NDCR score of 1!
IBM runs

© 2009 IBM CorporationIBM Research
Comparison of Fingerprinting Approaches on CBCD 2008 Data
� Multimodal fusion approach consistently outperforms all constituent runs
� 2009 approaches dramatically improve over 2008 runs (2-3x improvement)
Performance on Video-Only TRECVID 2008 Data
0.000
0.200
0.400
0.600
0.800
1.000
1.200
1.400
PIP Logo Transcode Gamma Unintended Post-Prod Combined
No
rma
lize
d D
ete
cti
on
Co
st
Ra
te (
ND
CR
)
2008 Temporal-Baseline
2008 Visual-Global
2008 Multimodal
2009 Visual-Cross
2009 SIFTogram
2009 Multimodal

© 2009 IBM CorporationIBM Research
Component Runs Compared with Fused Runs on 2009 Data
2009 NOFA Video-Only and Audio-Only Runs
0
0.2
0.4
0.6
0.8
1
1.2
PIP Pattern Reencode Gamma Quality PostProd 3-rand
Opt_
ND
CR
nullMP3
MB Compand
BWLimit,C
omp
Speech
Spch,Comp
Spch,Comp,Filt
Temporal
Visual-Cross
SIFTogram
medianVisTemp
medianVT-SIFT
AudioTemporal
� Performance on re-encoding worse than on 2008 data, all other transforms improve
� SIFTogram performs much better on 2009 than 2008, outperforms all else
� Fusion did not generalize (likely due to SIFTogram performance change)
� Overall, excellent performance on 3 of 4 target transforms

© 2009 IBM CorporationIBM Research
For 2009, SIFTogram outperformed our fusion run on A+V task
2009 A+V Performance Across All Transforms
0.537
0.541
0.791
0.719
0.706
0 0.1 0.2 0.3 0.4 0.5 0.6 0.7 0.8 0.9
tunedFuseSIFTVisTemp
SIFTogram
medFuseSIFTAudio
medFuseVisTempSift
medFuseVisTempSiftAudio
Optimal NDCR
“Tuned” fusion, with knowledge of results, only slightly improves on our SIFTogram
Our submitted run

© 2009 IBM CorporationIBM Research
Average NDCR over Transforms T3 -- T6
0
0.2
0.4
0.6
0.8
1
1.2
IBM
.v.N
OF
A.s
ifto
gra
mA
TT
Labs.v
.nofa
.1N
II.v
.nofa
.Em
bed
02
TU
BIT
AK
_U
ZA
Y.v
.nofa
.NO
FA
MP
AM
.v.n
ofa
.MP
AM
ibm
.v.n
ofa
.media
nN
OF
AM
ES
H.v
.nofa
.xco
rrT
ime
ME
SH
.v.n
ofa
.xco
rr
CR
IM.v
.nofa
.Ru
n1N
OF
Aib
m.v
.nofa
.meanN
OF
AN
JU
.v.n
ofa
.1
ME
SH
.v.n
ofa
.sift
No
Tim
e
asahik
ase
i.v.n
ofa
.base
line
ME
SH
.v.n
ofa
.sift
Fuda
nV
ID.v
.nofa
.fud
an09
Lo2
VIV
Ala
b-u
Ottaw
a.v
.no...
VIV
Ala
b-u
Ottaw
a.v
.nofa
.In
sert
UN
IBS
.v.n
ofa
.VS
TU
NIB
S.v
.nofa
.DIR
EC
TT
NO
.v.n
ofa
.12
4n
MC
G-I
CT
-CA
S.v
.nofa
.IC
TN
FO
PT
JR
S.v
.nofa
.124n
ITU
_M
SP
R.v
.nofa
.IT
UM
SP
R1
IMG
.v.n
ofa
.CN
Op
tim
al
ND
CR
Aggregated Performance on T3-T6 Target Transforms for Video-Only Task
An “unofficial run” – 0.274 NDCR

© 2009 IBM CorporationIBM Research
A+V: Average NDCR over Transforms 3-6
0
0.2
0.4
0.6
0.8
1
1.2
CR
IM.m
.nofa
.NN
22
para
CR
IM.m
.nofa
.EnN
N2pa
ss
IBM
.m.N
OF
A.s
ifto
gra
mN
II.m
.nofa
.BO
NII
.m.n
ofa
.NO
ibm
.m.n
ofa
.medF
use
NII
.m.n
ofa
.BA
NII
.m.n
ofa
.NA
ibm
.m.n
ofa
.mean
Fuse
NJU
.m.n
ofa
.1
asahik
ase
i.m.n
ofa
.bas...
TU
BIT
AK
_U
ZA
Y.m
.no..
.
XJT
U.m
.nofa
.baselin
e
VIV
Ala
b-u
Ottaw
a.m
.no..
.
VIV
Ala
b-u
Ottaw
a.m
.no..
.V
IRE
O.m
.nofa
.he
UN
IBS
.m.n
ofa
.VS
T
UN
IBS
.m.n
ofa
.DIR
EC
T
ME
SH
.m.n
ofa
.mu
ltim
oda
l
MC
G-I
CT
-CA
S.m
.nofa
...
IMG
.m.n
ofa
.NO
FA
Op
tim
al
ND
CR
Results for A+V Task on IBM’s Targeted Transforms T3-T6

© 2009 IBM CorporationIBM Research
IBM had the best performance on T6 in the A+V task
Optimal Average NDCR for T6-related AV Transforms
0
0.2
0.4
0.6
0.8
1
1.2
ibm
.m.n
ofa.m
edFuse
CR
IM.m
.nof
a.EnN
N2p
ass
CR
IM.m
.nof
a.NN
22pa
raN
JU.m
.nof
a.1
ibm
.m.n
ofa.m
eanFus
eN
II.m
.nof
a.N
ON
II.m
.nof
a.BO
TUB
ITAK
_UZAY
.m.n
ofa.
NO
FAN
II.m
.nof
a.BA
NII.
m.n
ofa.
NA
VIV
Ala
b-uO
ttaw
a.m
.nof
a.nO
VE
RLA
P
VIV
Ala
b-uO
ttaw
a.m
.nof
a.no
faH
I
asah
ikas
ei.m.n
ofa.
base
line
XJT
U.m
.nof
a.ba
selin
e
IMG
.m.n
ofa.
NO
FA
MC
G-IC
T-CA
S.m
.nof
a.IC
TAVN
OFA
ME
SH.m
.nof
a.m
ultim
odal
UN
IBS
.m.n
ofa.
DIR
EC
T
UN
IBS
.m.n
ofa.
VST
VIR
EO.m
.nof
a.he
ND
CR
Each T6 query had 3 of the following types of transforms: blur, change of gamma, frame dropping, contrast, compression, aspect ratio, white noise
NDCR = .007

© 2009 IBM CorporationIBM Research
Query Processing Time vs NDCR Over all A+V Queries
0.0 0.1 1.0 10.0 100.0 1000.0 10000.0
Avg Query Time (seconds, log scale)
Op
tim
al
ND
CR
Our Solution Provides a Good Trade-off Between Speed and Accuracy
CRIM
NII
NII
NII – (nice job!!!)
IBM
1.0
.8
.6
.4
.2

© 2009 IBM CorporationIBM Research
Conclusions
� Coarse-grain fingerprinting methods provide timely and highly accurate results on transforms commonly seen “in the wild”
– Perfect detection with 0 false alarms on most typical transforms (e.g., T6)
– Good trade-off between speed, storage, and accuracy
� Fusion methods that worked well on the 2008 test set did not transfer directly to 2009 data
– “Past results not necessarily an indicator of future performance”
– Need to consider early fusion methods
� It’s difficult to pick operating thresholds
– In deployment, they may have to be adjusted online, “in-situ”
� Using a toolbox of independent methods can be parallelized, but combining results for optimal detection is non-trivial