Embed Size (px)
Citation preview

IBM DB2 Web Query for IBM iVersion 2 Release 2

Active Technologies, EDA, EDA/SQL, FIDEL, FOCUS, Information Builders, the Information Builders logo, iWay, iWay Software,Parlay, PC/FOCUS, RStat, Table Talk, Web390, WebFOCUS, WebFOCUS Active Technologies, and WebFOCUS Magnify areregistered trademarks, and DataMigrator and Hyperstage are trademarks of Information Builders, Inc.
Adobe, the Adobe logo, Acrobat, Adobe Reader, Flash, Adobe Flash Builder, Flex, and PostScript are either registeredtrademarks or trademarks of Adobe Systems Incorporated in the United States and/or other countries.
Due to the nature of this material, this document refers to numerous hardware and software products by their trademarks.In most, if not all cases, these designations are claimed as trademarks or registered trademarks by their respective companies.It is not this publisher's intent to use any of these names generically. The reader is therefore cautioned to investigate allclaimed trademark rights before using any of these names other than to refer to the product described.
Copyright © 2015, by Information Builders, Inc. and iWay Software. All rights reserved. Patent Pending. This manual, or partsthereof, may not be reproduced in any form without the written permission of Information Builders, Inc.

Contents
Preface . . . . . . . . . . . . . . . . . . . . . . . . . . . . . . . . . . . . . . . . . . . . . . . . . . . . . . . . . . . . . . . . . . . . . . . . . 7Documentation Conventions . . . . . . . . . . . . . . . . . . . . . . . . . . . . . . . . . . . . . . . . . . . . . . . . . . . . . . . . . . . 7
1. Building Dashboards and Applications in InfoAssist . . . . . . . . . . . . . . . . . . . . . . . . . . . . . 9Creating HOLD Files . . . . . . . . . . . . . . . . . . . . . . . . . . . . . . . . . . . . . . . . . . . . . . . . . . . . . . . . . . . . . . . . . . 9
Valuable Applications of HOLD Files. . . . . . . . . . . . . . . . . . . . . . . . . . . . . . . . . . . . . . . . . . . . . . . . 9
Storing HOLD Files. . . . . . . . . . . . . . . . . . . . . . . . . . . . . . . . . . . . . . . . . . . . . . . . . . . . . . . . . . . . . . 10
Output Formats for Reports and Charts. . . . . . . . . . . . . . . . . . . . . . . . . . . . . . . . . . . . . . . . . . . . 10
Creating Hold Files. . . . . . . . . . . . . . . . . . . . . . . . . . . . . . . . . . . . . . . . . . . . . . . . . . . . . . . . . . . . . . 10
Procedure: How to Create Multiple Components in a Document From a HOLD
File. . . . . . . . . . . . . . . . . . . . . . . . . . . . . . . . . . . . . . . . . . . . . . . . . . . . . . . . . . . . . . . . . . . 11
Procedure: How to Create a Tabular Report From a HOLD File. . . . . . . . . . . . . . . . . . . . 11
Procedure: How to Create a HOLD File for a Subquery. . . . . . . . . . . . . . . . . . . . . . . . . . 14
Procedure: How to Rearrange HOLD File Components. . . . . . . . . . . . . . . . . . . . . . . . . . 26
FOCUS Format Index Fields. . . . . . . . . . . . . . . . . . . . . . . . . . . . . . . . . . . . . . . . . . . . . . . . . 34
Creating a Subquery Filter Using a HOLD File. . . . . . . . . . . . . . . . . . . . . . . . . . . . . . . . . . . . . . . 34
Procedure: How to Create a Subquery Filter Using a HOLD File. . . . . . . . . . . . . . . . . . . 34
Document Mode. . . . . . . . . . . . . . . . . . . . . . . . . . . . . . . . . . . . . . . . . . . . . . . . . . . . . . . . . . . . . . . . 39
Creating Multi-page Documents and Dashboards . . . . . . . . . . . . . . . . . . . . . . . . . . . . . . . . . . . . . . . . 39
Creating Multi-page Documents. . . . . . . . . . . . . . . . . . . . . . . . . . . . . . . . . . . . . . . . . . . . . . . . . . . 40
Procedure: How to Create a Multi-page Document. . . . . . . . . . . . . . . . . . . . . . . . . . . . . . 40
Creating a Multi-page Active Technologies Dashboard. . . . . . . . . . . . . . . . . . . . . . . . . . . . . . . . 42
Procedure: How to Create a Multi-page Active Technologies Dashboard. . . . . . . . . . . 42
Navigating the Page Menu. . . . . . . . . . . . . . . . . . . . . . . . . . . . . . . . . . . . . . . . . . . . . . . . . . . . . . . 43
Using the Active Cache Option. . . . . . . . . . . . . . . . . . . . . . . . . . . . . . . . . . . . . . . . . . . . . . . . . . . . 45
Enabling Active Cache Through InfoAssist. . . . . . . . . . . . . . . . . . . . . . . . . . . . . . . . . . . . . . . . . . 45
Creating Active Technologies Components With InfoAssist . . . . . . . . . . . . . . . . . . . . . . . . . . . . . . . . 46
Creating an Active Technologies Report. . . . . . . . . . . . . . . . . . . . . . . . . . . . . . . . . . . . . . . . . . . . 47
Procedure: How to Create an Active Technologies Report. . . . . . . . . . . . . . . . . . . . . . . . 47
Active Technologies Report Menu Options. . . . . . . . . . . . . . . . . . . . . . . . . . . . . . . . . . . . 48
Configuring Active Technologies Report Options. . . . . . . . . . . . . . . . . . . . . . . . . . . . . . . . 52
General Tab. . . . . . . . . . . . . . . . . . . . . . . . . . . . . . . . . . . . . . . . . . . . . . . . . . . . . . . . . 53
Menu Options Tab. . . . . . . . . . . . . . . . . . . . . . . . . . . . . . . . . . . . . . . . . . . . . . . . . . . . 56
Colors Tab. . . . . . . . . . . . . . . . . . . . . . . . . . . . . . . . . . . . . . . . . . . . . . . . . . . . . . . . . . 58
IBM DB2 Web Query for IBM i 3

Advanced Tab. . . . . . . . . . . . . . . . . . . . . . . . . . . . . . . . . . . . . . . . . . . . . . . . . . . . . . . 60
Creating an Active Technologies Chart. . . . . . . . . . . . . . . . . . . . . . . . . . . . . . . . . . . . . . . . . . . . . 61
Procedure: How to Create an Active Technologies Chart. . . . . . . . . . . . . . . . . . . . . . . . . 61
Active Technologies Options for Charts. . . . . . . . . . . . . . . . . . . . . . . . . . . . . . . . . . . . . . . 62
Creating an Active Technologies Dashboard. . . . . . . . . . . . . . . . . . . . . . . . . . . . . . . . . . . . . . . . 63
Active Technologies Dashboard Prompts. . . . . . . . . . . . . . . . . . . . . . . . . . . . . . . . . . . . . . 64
Target Reports. . . . . . . . . . . . . . . . . . . . . . . . . . . . . . . . . . . . . . . . . . . . . . . . . . . . . . . . . . . . 64
Procedure: How to Add an Active Technologies Dashboard Prompt to a
Dashboard. . . . . . . . . . . . . . . . . . . . . . . . . . . . . . . . . . . . . . . . . . . . . . . . . . . . . . . . . . . . 65
Using Multiple Reports as Targets and Sources. . . . . . . . . . . . . . . . . . . . . . . . . . . . . . . . 68
Procedure: How to Build a Dashboard With Multiple Reports as Targets and
Sources. . . . . . . . . . . . . . . . . . . . . . . . . . . . . . . . . . . . . . . . . . . . . . . . . . . . . . . . . . 68
Procedure: How to Change the Field. . . . . . . . . . . . . . . . . . . . . . . . . . . . . . . . . . . . 80
Procedure: How to Change the Filter Condition. . . . . . . . . . . . . . . . . . . . . . . . . . . . . . . . . 82
Procedure: How to Add Multiple Prompts to a Dashboard. . . . . . . . . . . . . . . . . . . . . . . 82
Procedure: How to Cascade Prompts. . . . . . . . . . . . . . . . . . . . . . . . . . . . . . . . . . . . . . . . . 85
Using Slicers . . . . . . . . . . . . . . . . . . . . . . . . . . . . . . . . . . . . . . . . . . . . . . . . . . . . . . . . . . . . . . . . . . . . . . . 90
Creating Slicers. . . . . . . . . . . . . . . . . . . . . . . . . . . . . . . . . . . . . . . . . . . . . . . . . . . . . . . . . . . . . . . . 90
Procedure: How to Create a Slicer. . . . . . . . . . . . . . . . . . . . . . . . . . . . . . . . . . . . . . . . . . . 91
Procedure: How to Add a Field to an Existing Slicer Group. . . . . . . . . . . . . . . . . . . . . . . 93
Procedure: How to Add a Hierarchy as a Slicer Group. . . . . . . . . . . . . . . . . . . . . . . . . . . 94
Filtering With Slicers. . . . . . . . . . . . . . . . . . . . . . . . . . . . . . . . . . . . . . . . . . . . . . . . . . . . . . . . . . . . 94
Procedure: How to Change the Relationship Operator in a Slicer. . . . . . . . . . . . . . . . . 95
How Slicers Cascade Together. . . . . . . . . . . . . . . . . . . . . . . . . . . . . . . . . . . . . . . . . . . . . . 96
Procedure: How to Cascade Slicers. . . . . . . . . . . . . . . . . . . . . . . . . . . . . . . . . . . . . 97
Edit Slicers Dialog Box. . . . . . . . . . . . . . . . . . . . . . . . . . . . . . . . . . . . . . . . . . . . . . . . . . . . . . . . . 101
General Tab. . . . . . . . . . . . . . . . . . . . . . . . . . . . . . . . . . . . . . . . . . . . . . . . . . . . . . . . . . . . . 102
Record Limit Tab. . . . . . . . . . . . . . . . . . . . . . . . . . . . . . . . . . . . . . . . . . . . . . . . . . . . . . . . . 103
Group Tab. . . . . . . . . . . . . . . . . . . . . . . . . . . . . . . . . . . . . . . . . . . . . . . . . . . . . . . . . . . . . . . 105
Building InfoMini Applications . . . . . . . . . . . . . . . . . . . . . . . . . . . . . . . . . . . . . . . . . . . . . . . . . . . . . . . . 106
Understanding InfoMini Applications. . . . . . . . . . . . . . . . . . . . . . . . . . . . . . . . . . . . . . . . . . . . . 106
Using the InfoMini Button. . . . . . . . . . . . . . . . . . . . . . . . . . . . . . . . . . . . . . . . . . . . . . . . . 106
Interactive Mode. . . . . . . . . . . . . . . . . . . . . . . . . . . . . . . . . . . . . . . . . . . . . . . . . . . . 107
Creating an InfoMini Application. . . . . . . . . . . . . . . . . . . . . . . . . . . . . . . . . . . . . . . . . . . . . . . . . 108
Procedure: How to Activate InfoMini. . . . . . . . . . . . . . . . . . . . . . . . . . . . . . . . . . . . . . . . . 108
4 IBM
Contents

Procedure: How to Enable and Disable InfoMini Application Options. . . . . . . . . . . . . 109
Procedure: How to Test an InfoMini Application. . . . . . . . . . . . . . . . . . . . . . . . . . . . . . . 109
Procedure: How to Interact With an InfoMini Application. . . . . . . . . . . . . . . . . . . . . . . 109
Glossary . . . . . . . . . . . . . . . . . . . . . . . . . . . . . . . . . . . . . . . . . . . . . . . . . . . . . . . . . . . . . . . . . . . . . . . . . . 113
IBM DB2 Web Query for IBM i 5
Contents

6 IBM
Contents

Preface
This documentation describes the functions that are available for IBM DB2 Web Query for IBMi.
How This Manual Is Organized
This manual includes the following chapters:
ContentsChapter/Appendix
Building Dashboards andApplications in InfoAssist
1
Documentation Conventions
The following table lists and describes the conventions that apply in this manual.
DescriptionConvention
Denotes syntax that you must enter exactly as shown.THIS TYPEFACE
or
this typeface
Represents a placeholder (or variable), a cross-reference, or animportant term.
this typeface
Indicates a default setting.underscore
Highlights a file name or command. It may also indicate a button,menu item, or dialog box option you can click or select.
this typeface
Indicates keys that you must press simultaneously.Key + Key
Indicates two or three choices; type one of them, not the braces.{ }
Indicates a group of optional parameters. None is required, but youmay select one of them. Type only the parameter in the brackets, notthe brackets.
[ ]
IBM DB2 Web Query for IBM i 7

DescriptionConvention
Separates mutually exclusive choices in syntax. Type one of them,not the symbol.
|
Indicates that you can enter a parameter multiple times. Type onlythe parameter, not the ellipsis points (...).
...
Indicates that there are (or could be) intervening or additionalcommands.
.
.
.
8 IBM
Documentation Conventions

Building Dashboards and Applications inInfoAssist
1Chapter
You can use InfoAssist to create HOLD files, build dashboards, and applications.
In this chapter:
Creating HOLD Files
Creating Multi-page Documents and Dashboards
Creating Active Technologies Components With InfoAssist
Using Slicers
Building InfoMini Applications
Glossary
Creating HOLD FilesDescribes how to create a HOLD file for use in a report, chart, document, and dashboard, andhow to use a HOLD file in a subquery filter.
A HOLD file is the output of a report request stored in a file that you can use as input to anotherWeb Query procedure.
You can then create new report requests that extract data from the HOLD file, resulting in multi-step report.
HOLD files can be created to use in a report, chart, document, or dashboard.
Valuable Applications of HOLD Files
A HOLD file is valuable when you want to do the following:
Extract fields from a large data source for faster and more efficient retrieval in subsequentrequests.
Store virtual field values or summary values calculated in one request for further processingin another request.
IBM DB2 Web Query for IBM i 9

Storing HOLD Files
HOLD files can be created for immediate use and saved temporarily or they can be stored forfuture and repeated use.
Output Formats for Reports and Charts
You can save a HOLD file for a report in the following formats:
Binary (*.ftm)
FOCUS (*.foc). For more information, see FOCUS Format Index Fields on page 34.
Comma Delimited with Titles (*.csv)
Plain Text (*.ftm)
Tab Delimited (*.tab)
Tab Delimited with Titles (*.tab)
Database Table (*.sql)
Note: The Database Table output is only available when working against an SQL database.
SQL Script (*.sql)
Hyperstage (*.bht)
Note: The Hyperstage output is only available when the reporting server has a Hyperstageadapter configuration.
XML (*.xml)
You can save a HOLD file for a chart in the following formats:
PNG (*.png)
GIF (*.gif)
SVG (*.svg)
JPEG (*.jpg)
Creating Hold Files
This section contains examples of how you would use a HOLD file.
10 IBM
Creating HOLD Files

Note: Across fields are not allowed in HOLD files.
How to Create Multiple Components in a Document From a HOLD FileProcedure:
This procedure describes how to extract fields into a HOLD file and then create multiplecomponents in a document from the HOLD file.
1. Select a data source.
2. Add fields that need to be extracted for use in subsequent requests.
3. On the Home tab, in the Format group, click File & Printer.
4. Click the Destination drop down list and select File.
5. Click the Browse button to open the Temporary dialog box.
6. In the Temporary dialog box, name the file, choose the format of the Hold file from the formatdrop-down list, and click Save.
Note: The default is to create a temporary Hold file, which is deleted after the report orchart is run. Alternatively, you can create a permanent Hold file by selecting an applicationpath folder location. This file will remain in this location after the procedure is run forfuture use.
7. Select Create Document.
8. On the Insert tab, in the Reports group, click Chart.
9. Add fields to the chart.
10. Insert another chart.
11. Add fields to that chart.
12. On the Format tab, in the Chart Types group, click Pie.
13. On the Insert tab, in the Reports group, click Report.
14. Add fields to the report.
15. Add as many reports and charts as you want to complete your document.
How to Create a Tabular Report From a HOLD FileProcedure:
To create a tabular report from a HOLD file, begin by creating a report.
1. In the Open dialog box, select the WF_RETAIL Master File.
2. Add the following measure fields to the report:
IBM DB2 Web Query for IBM i 11
1. Building Dashboards and Applications in InfoAssist

Cost of Goods
Discount
Gross Profit
Quantity,Sold
Revenue
3. Add the following dimension fields to the report:
Product Category
Product,SubCategory
Sale,Year
4. On the Home tab, in the Format group, click File.
The Temporary dialog box opens.
5. In the Temporary dialog box, name the HOLD file, keep the default file type, Binary (*.ftm),and click Save.
6. At the bottom of the canvas, click Create Report.
The custom database structure displays in the Resources panel. The canvas is returned toa default blank state, enabling the development of a new report using the HOLD file.
7. From the HOLD file, drag Quantity,Sold to the canvas.
8. On the canvas, select the Quantity,Sold column heading.
9. On the Field tab, in the Display group, click Aggregation and then click First Value.
Note: The heading changes to FST Quantity Sold.
10. Select the FST Quantity Sold heading.
11. On the Field tab, in the Display group, click Hide Field to hide Quantity,Sold, as it will be usedin a subsequent calculation.
12. On the Data tab, in the Calculation group, click Summary (Compute).
13. In the Summary Field (COMPUTE) dialog box, do the following:
In the Format field, type D8.2%.
Double-click the Quantity,Sold field to add it to the formula box.
12 IBM
Creating HOLD Files

Add / 100 after the Quantity Sold field to calculate the percentage.
The following image is an example of the Summary Field (COMPUTE) dialog.
14. Click OK to close the dialog box.
15. Drag Product,Category to the By Query field container.
16. In the Query pane, select the Product,Category field.
17. On the Field tab, in the Break group, select Subtotal to create Subtotals on Product,Category.
18. Drag Product, Subcategory to the By Query field container.
19. Drag Sale,Year to Across.
20. On the Home tab, in the Report group, click Row Totals.
IBM DB2 Web Query for IBM i 13
1. Building Dashboards and Applications in InfoAssist
The final report displays, as shown in the following image.
How to Create a HOLD File for a SubqueryProcedure:
The following procedure describes how to create a HOLD file for use in a subquery.
1. Create a new report with at least one filter condition set.
14 IBM
Creating HOLD Files

For example, the report shown in the following image lists Customer IDs with Gender equalto Female.
IBM DB2 Web Query for IBM i 15
1. Building Dashboards and Applications in InfoAssist
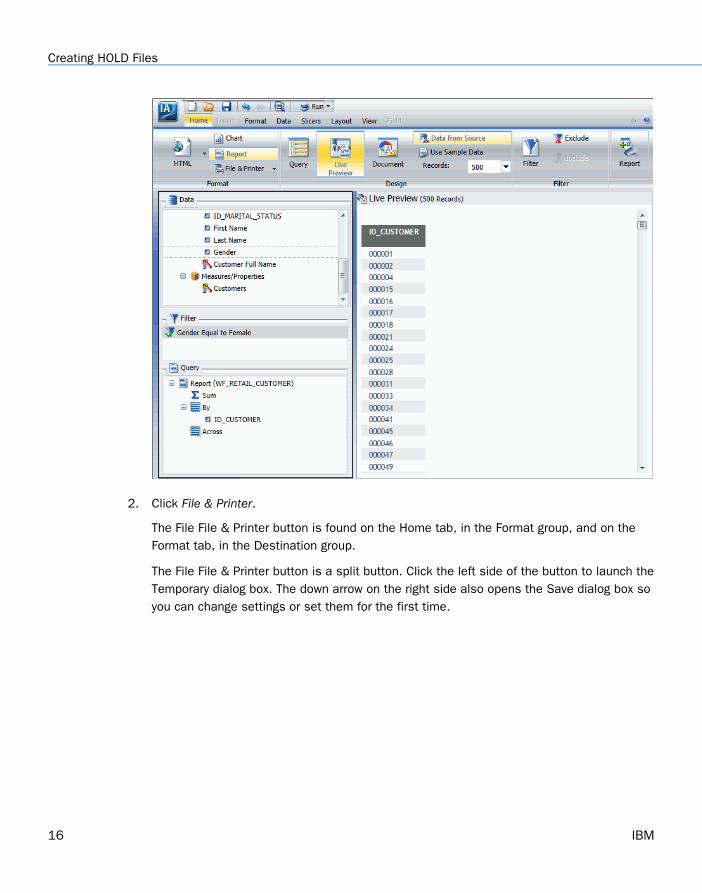
2. Click File & Printer.
The File File & Printer button is found on the Home tab, in the Format group, and on theFormat tab, in the Destination group.
The File File & Printer button is a split button. Click the left side of the button to launch theTemporary dialog box. The down arrow on the right side also opens the Save dialog box soyou can change settings or set them for the first time.
16 IBM
Creating HOLD Files

An example of the File File & Printer button and the associated ToolTip are shown in thefollowing image.
IBM DB2 Web Query for IBM i 17
1. Building Dashboards and Applications in InfoAssist

18 IBM
Creating HOLD Files

The Select a location and format Temporary dialog box opens, as shown in the followingimage.
Note: The label Temporary appears at the top of the dialog box. When you select a folder,the label changes to Select a location and format, as shown in the following image.
The File & Printer Options dialog box opens, as shown in the following image.
3. Click the Destination drop down list and select File, then click the Browse button.
4. In the Select a location and format dialog box, provide the following:
a. In the File name text box, type a file name.
The default file name is File1.
IBM DB2 Web Query for IBM i 19
1. Building Dashboards and Applications in InfoAssist

b. From the list menu, select SQL Script (*.sql) as the file format.
c. Select a location for the HOLD file.
The location is either Temporary, which is the default, or a writable server applicationfolder.
Note: If the HOLD file name already exists in the specified location, it will beoverwritten without warning, when you click Save.
5. Click Save.
20 IBM
Creating HOLD Files

The Create Report button appears on the bottom of the InfoAssist Live Preview applicationwindow, as shown in the following image.
IBM DB2 Web Query for IBM i 21
1. Building Dashboards and Applications in InfoAssist

6. Repeat steps 2 - 4 to create as many HOLD files as you need.
22 IBM
Creating HOLD Files

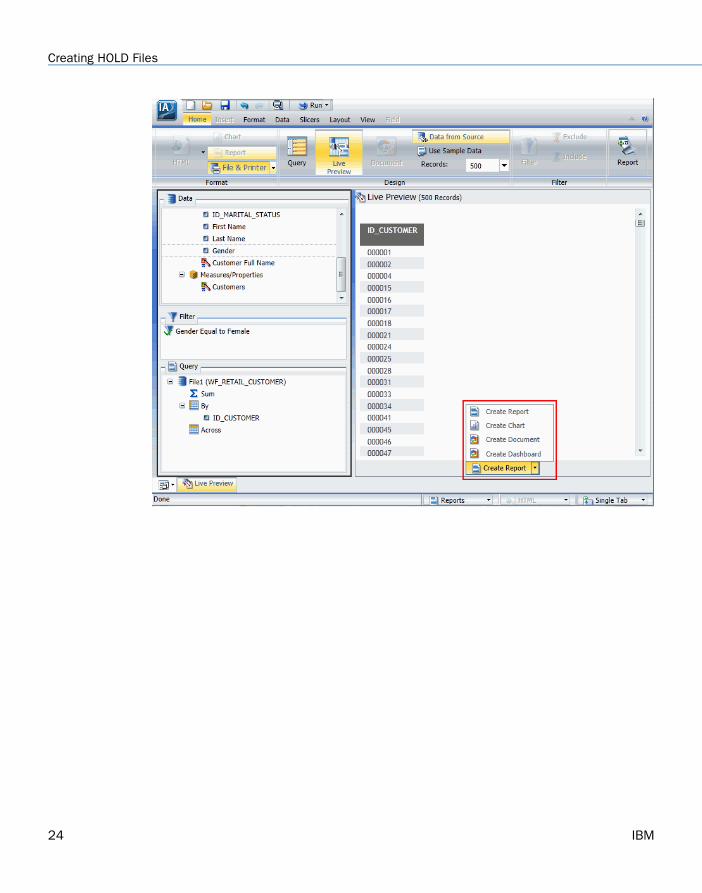
7. To use the HOLD file right away, select the corresponding option, as shown in the followingimage.
IBM DB2 Web Query for IBM i 23
1. Building Dashboards and Applications in InfoAssist
24 IBM
Creating HOLD Files

The following image is an example of the Live Preview application window when Create Reportis selected.
IBM DB2 Web Query for IBM i 25
1. Building Dashboards and Applications in InfoAssist

Note: When you are working with a report created from a HOLD file, if you try to switchdata sources, or add data sources to the report, you are presented with warning messages.
How to Rearrange HOLD File ComponentsProcedure:
The following procedure describes how to rearrange file components in a HOLD file.
Note: This procedure creates a binary HOLD file and a subquery to illustrate how to rearrangeHOLD files. It also shows the result of this rearrangement.
1. Create a new document in InfoAssist, using the wf_retail Master File for the data source.
2. On the Insert tab, in the Reports group, click Report. Populate the report with the followingfields from the Data pane:
Gross Profit
Quantity,Sold
Revenue
26 IBM
Creating HOLD Files

Product,Category
Product,Subcategory
The report is shown in the following image.
3. On the Home tab, in the Format group, click File to create a HOLD file.
IBM DB2 Web Query for IBM i 27
1. Building Dashboards and Applications in InfoAssist

In the Temporary dialog box, enter a name for the file. For example, File1_binary, as shownin the following image.
4. Click Save.
28 IBM
Creating HOLD Files

5. Create a report using the HOLD file, specifying Product,Category, Product,Subcategory, andQuantity,Sold, as shown in the following image.
6. Next, using the following steps, add a subquery SQL script for use as a filter on the firstreport.
a. On the Data tab, in the Data Source group, click Switch.
Select the original master file (wf_retail.mas).
b. Locate and double-click the Product,Category dimension field.
This creates a second report, which you can drag and resize as needed on the Documentcanvas.
IBM DB2 Web Query for IBM i 29
1. Building Dashboards and Applications in InfoAssist

c. Create a filter on Product,Category, where the product category is equal to Televisions,as shown in the following image.
7. With the new component selected, click the Home tab and in the Format group, click File.
In the File name field, enter File2_subquery and select the SQL Script (*.sql) format fromthe file types menu.
8. Click Save.
9. Rearrange the order of the HOLD files so that the File2_subquery is positioned above theFile1_binary HOLD file using the following steps:
30 IBM
Creating HOLD Files

Right-click Files in the Query pane and click Arrange Files, as shown in the followingimage.
a.
The Arrange Files dialog box opens.
IBM DB2 Web Query for IBM i 31
1. Building Dashboards and Applications in InfoAssist

b. Using the Arrange Files dialog box that displays, select File2_subquery (wf_retail) andclick Move Up to move the file above File1_binary (wf_retail), as shown in the followingimage.
c. Click OK.
32 IBM
Creating HOLD Files

10. Edit the first report and create a filter using the subquery, as shown in the following image.
11. Click OK to exit the Create a filtering condition dialog box.
Your report is refreshed to reflect the filtering you have applied, as shown in the followingimage.
IBM DB2 Web Query for IBM i 33
1. Building Dashboards and Applications in InfoAssist

FOCUS Format Index Fields
FOCUS is the only format that supports an index field. The maximum number of fields to indexis four. If the file format is FOCUS, then Index appears on the Query pane, as shown in thefollowing image.
Creating a Subquery Filter Using a HOLD File
In InfoAssist, you can create a subquery using a HOLD file. A subquery is a nested query that isadded to the Where clause of an SQL statement. A subquery is valuable because it is highlyreusable.
How to Create a Subquery Filter Using a HOLD FileProcedure:
This procedure describes how to create a subquery filter using a HOLD file created in the previousprocedure.
1. Build a report.
34 IBM
Creating HOLD Files
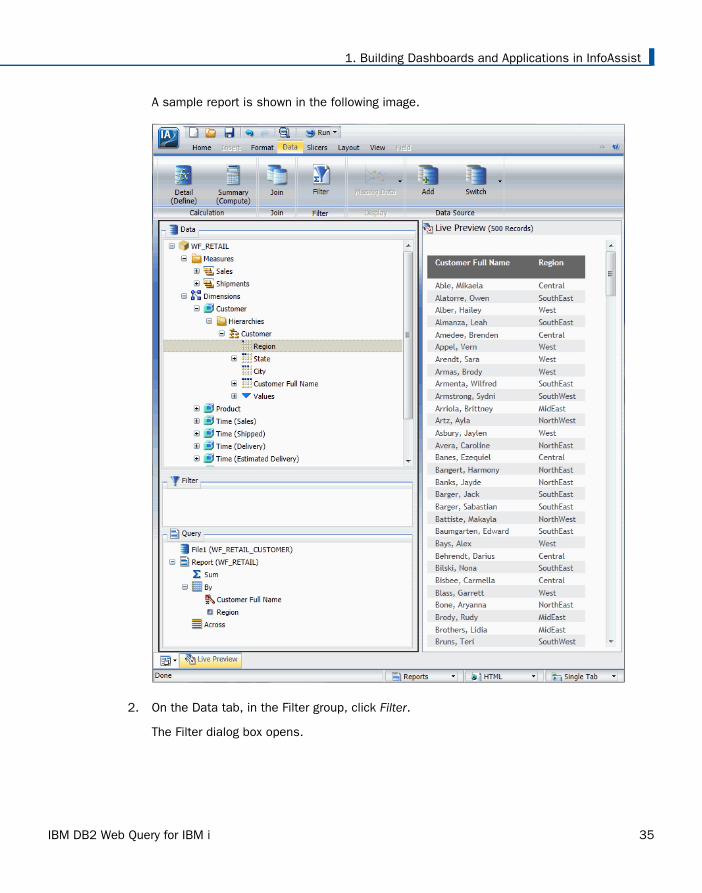
A sample report is shown in the following image.
2. On the Data tab, in the Filter group, click Filter.
The Filter dialog box opens.
IBM DB2 Web Query for IBM i 35
1. Building Dashboards and Applications in InfoAssist

3. In the Filter dialog box, from the Type drop-down menu, select Subquery as the filter type forthe left-most part of the expression, as shown in the following image.
36 IBM
Creating HOLD Files

4. From the Subquery drop-down menu, select In list as the comparison operator, as shown inthe following image.
5. From the list of subqueries, select the subquery that was created (in this example, File1) forthe right-most part of the expression.
IBM DB2 Web Query for IBM i 37
1. Building Dashboards and Applications in InfoAssist

The Subquery drop-down menu with the File1 Subquery is shown in the following image.
6. Click OK.
The report is filtered by the subquery that you created.
38 IBM
Creating HOLD Files

An example of the report filtered by female customers is shown in the following image.
Note: To view the SQL statements generated by the request, go to the Quick AccessToolbar, open the Run drop-down menu, and select SQL Trace.
Document Mode
To create a HOLD file from a report included in a document, select the report and click File &Printer or right-click the report and select Convert to File from the menu. Then follow the stepsfor creating a HOLD file as described in How to Create a HOLD File for a Subquery on page 14.
Creating Multi-page Documents and DashboardsDescribes how to create multi-page documents and active technologies dashboards and how toenable active cache through InfoAssist.
In Document mode, content can be created on multiple pages. The available output formats are:PDF, HTML, active report, PowerPoint (pptx), Excel (xlsx), Excel Formula (xlsx), active PDF, andactive Flash.
IBM DB2 Web Query for IBM i 39
1. Building Dashboards and Applications in InfoAssist

Note: Microsoft Excel 2007 and Microsoft PowerPoint 2007 are enabled by default in theAdministration Console. To enable or disable formats, you must do so in the AdministrationConsole.
The active report and active Flash output formats combine multiple reports and charts intoone document, resulting in a tabbed active dashboard.
Excel combines multiple reports as different sheets in a workbook.
PowerPoint combines multiple reports and charts in a single slide.
Creating Multi-page Documents
You can create multi-page documents using InfoAssist.
How to Create a Multi-page DocumentProcedure:
1. Create a new document.
Page 1 appears on the canvas title bar, as shown in the following image.
2. Add content, such as a new or existing report, chart, text, and images to Page 1.
3. To add another page, do one of the following:
On the Insert tab, in the Pages group, click Page.
On the canvas title bar, click the page icon. From the Page menu that opens, select NewPage.
40 IBM
Creating Multi-page Documents and Dashboards

A new page, for example, Page 2, is inserted after the current page, and appears on thecanvas, as shown in the following image.
Each new page that you add is named Page n, where n is a unique number increasing by anincrement of 1.
4. Add content to Page 2.
5. Repeat steps 3 - 4 until your document is complete.
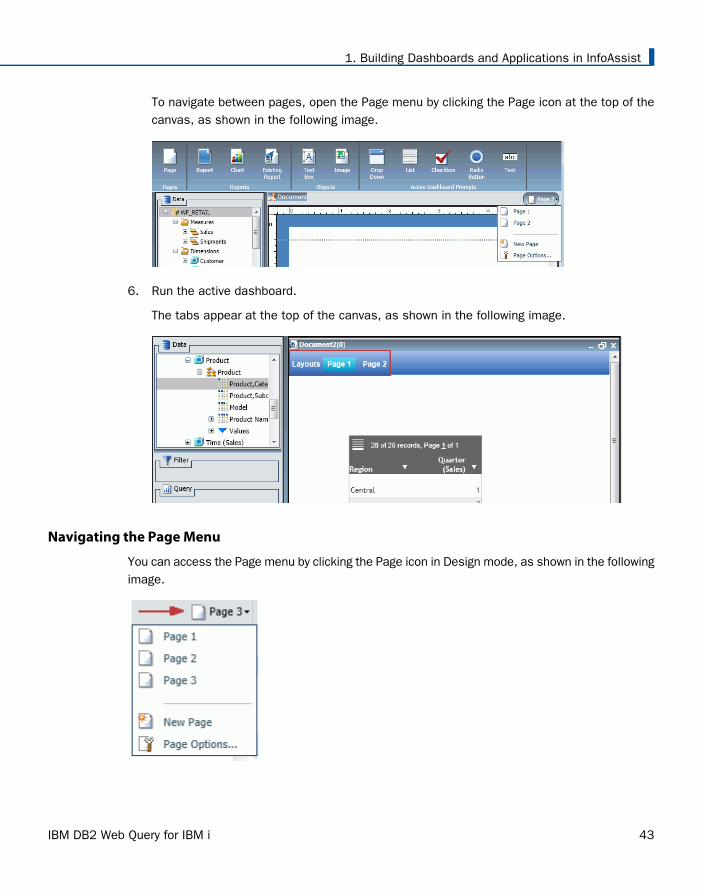
To navigate between pages, open the Page menu by clicking the Page icon at the top of thecanvas, as shown in the following image.
IBM DB2 Web Query for IBM i 41
1. Building Dashboards and Applications in InfoAssist

Creating a Multi-page Active Technologies Dashboard
You can create a multi-page active technologies dashboard using InfoAssist.
How to Create a Multi-page Active Technologies DashboardProcedure:
1. Create a new active dashboard.
Page 1 appears on the canvas title bar, as shown in the following image.
2. Add content, such as a new or existing report, chart, text, images, and active dashboardprompts to Page 1.
3. To add another page, do one of the following:
On the Insert tab, in the Pages group, click Page.
On the canvas title bar, click the page icon. From the Page menu that opens, select NewPage.
A new page, for example, Page 2, is inserted after the current page, and appears on thecanvas, as shown in the following image.
Each new page that you add is named Page n, where n is a unique number increasing by anincrement of 1.
4. Add content to Page 2.
5. Repeat steps 3 - 4 until your dashboard is complete.
42 IBM
Creating Multi-page Documents and Dashboards
To navigate between pages, open the Page menu by clicking the Page icon at the top of thecanvas, as shown in the following image.
6. Run the active dashboard.
The tabs appear at the top of the canvas, as shown in the following image.
Navigating the Page Menu
You can access the Page menu by clicking the Page icon in Design mode, as shown in the followingimage.
IBM DB2 Web Query for IBM i 43
1. Building Dashboards and Applications in InfoAssist

The Page menu lists the pages in the order in which you created them. You can rearrange thepages using drag-and-drop functionality. You can also select multiple pages and delete them.
In addition, the Page menu contains the New Page option to add a new page to the document.
The Page menu also contains Page Options which you can click to launch a dialog box of thefollowing options:
Rename Page
Move Page Up
Move Page Down
Delete
The Page Options dialog box is shown in the following image.
When you select a page, the Rename, Move Up, Move Down, and Delete options become activein the menu bar at the top of the dialog box. Also, when you right-click a page, a context menuof these same options opens.
The position of the page that you have selected determines which directional options are available.For example, Move Up would not be an option for Page 1. Move Down would not be an option forthe last page.
To close the dialog box, click OK.
44 IBM
Creating Multi-page Documents and Dashboards

Using the Active Cache Option
Because all post-retrieval processing is performed in the memory of the web browser, an activereport has a processing limit of approximately 5,000 records or 100 pages of output. The activecache option enables you to send only the first page of active report output to the browser andretrieve subsequent pages from a temporary cache on the Reporting Server.
Tip: It is recommended that you set the number of rows retrieved five times greater than thenumber of lines retrieved per page (as indicated in SET LINES). The minimum number of rowsretrieved is 100.
Enabling Active Cache Through InfoAssist
In InfoAssist, active cache is enabled when you select active report as the output type (Formattab, Output Types group) and the Pages on Demand button (Format tab, Navigation group) isenabled. The Pages on Demand button is shown in the following image.
IBM DB2 Web Query for IBM i 45
1. Building Dashboards and Applications in InfoAssist

In InfoAssist, the Advanced tab on the active report options dialog box contains the Rows Retrieveddrop-down list. Use this setting to establish the increments in which the cached data stored ina binary file is returned to the output window. The default is 100. The Advanced tab is shown inthe following image.
Note: In a multi-page document, active cache must be enabled per component. It is not globallyset. Therefore, when creating a document in AHTML format, you must select each componentseparately to enable active cache. When you do so, the Pages on Demand button is activated.
Creating Active Technologies Components With InfoAssistDescribes how to create a report, chart, or dashboard that is enabled for Active Technologiesusing InfoAssist.
46 IBM
Creating Active Technologies Components With InfoAssist

This topic describes how to create a report, chart, or dashboard that is enabled for ActiveTechnologies using InfoAssist.
These reports, charts, and dashboards use the full capabilities of Active Technologies. They arealso referred to as active reports, charts, and dashboards.
Creating an Active Technologies Report
An active report is a self-contained report that is designed for offline analysis, meaning it containsall the data and JavaScript within the output file. Using an active report, you can:
Interact with the data, using analysis options similar to those found in an Excel workbook,without any connection to a server. Analysis options include filtering, sorting, charting, andmuch more.
Work offline without any additional plug-ins or programs. An active report is a self-containedreport, meaning it contains all of the data and JavaScript within the HTML output file. Packagingthe data and the interactive functions in the HTML file also makes the output highlycompressible for email and transparent to security systems.
Save the report on a local machine with active report functionality. Since no connection to aserver is required to view the data or use the analysis options, a user can save and use thereport anywhere.
An active report using Adobe® Flex® includes most of the capabilities available in the HTMLversion of active reports in a user-friendly report format. An active report delivered as a self-contained Adobe Flash file (.SWF files that are Adobe® Flash® Player compatible) allows for fasteranalysis of large data sets and interaction with the active report.
How to Create an Active Technologies ReportProcedure:
1. With InfoAssist open in Report view, on the Format tab, in the Output Types group, clickactive report.
2. Create a report.
3. Run the report.
IBM DB2 Web Query for IBM i 47
1. Building Dashboards and Applications in InfoAssist

The following image shows an active report with the available menu options for the ProductCategory column.
Active Technologies Report Menu Options
Menu options for an active report are described in the following table.
DefinitionOption
Sorts the column in ascending order.Sort Ascending
Sorts the column in descending order.Sort Descending
48 IBM
Creating Active Technologies Components With InfoAssist

DefinitionOption
Filters the data. Options are:
Equals
Not equal
Greater than
Greater than or equal to
Less than
Less than or equal to
Between
Contains
Contains (match case)
Omits
Omits (match case)
Filter
Calculation types that you can apply to the column:
Clear
Clear all
Count
Count distinct, which counts the number of distinct values withina field.
For numeric fields, you can also apply:
Sum
Avg
Min
Max
% of Total
Calculate
IBM DB2 Web Query for IBM i 49
1. Building Dashboards and Applications in InfoAssist

DefinitionOption
Creates a chart from the report. Options are Pie, Line, Bar, andScatter.
Chart
Lists the fields available to create a Rollup table.Rollup
Lists the fields available to create a Pivot table.Pivot (Cross Tab)
Adds or removes visualization bars to the selected column. TheVisualize option is available for numeric data columns.
Visualize
Suppresses the display of the selected column in the report.Hide Column
Lists the names of the columns that are hidden in the report, allowingyou to individually restore a column.
Select the name of a specific column in the hidden columns list torestore that column to the report.
Show Columns
Freezes the report at a particular point so that columns to the leftof the freeze point remain in view while the user scrolls through theother report columns.
Note: If the report can be fully viewed in the browser window,freeze is not applied. The Freeze column option is not availablefor expandable report (Accordion) views.
Freeze Column
Unfreezes the columns.Unfreeze All
Opens the Grid Tool which you can use to change the column order,select multiple columns to sort ascending or descending, hide andshow columns, add a calculation result to a column, and addsubtotals in the active report.
Grid Tool
Opens the Chart/Rollup Tool which you can use to select multiplegroup fields to generate the chart or rollup table. The Chart/RollupTool contains a list of columns available in the active report to addto Group By and Measure fields. Drag the columns into the field thatyou want.
Chart/Rollup Tool
50 IBM
Creating Active Technologies Components With InfoAssist

DefinitionOption
Opens the Pivot Tool, which you can use to select multiple groupfields to generate the chart or pivot table. The Pivot Tool contains alist of columns available in the active report to add to Group By,Across, and Measure fields. Drag the columns into the field that youwant.
Pivot Tool
Opens the Show Records menu option to list the number of recordsavailable for display per page in the report. Select a number (forexample, 10) to display, per page. Default displays the number ofrecords (lines) per page that is specified in the report procedure.
Show Records
Options to display comments under cells or hide indicators forcomments in the active report output.
Comments
Sends report as email.
Note: To use this feature, you must have ActiveX enabled in yourbrowser security settings.
This feature is only supported in Internet Explorer.
Send as E-mail
Saves changes.
Note: To use this feature, you must have ActiveX enabled in yourbrowser security settings.
This feature is only supported in Internet Explorer.
Save Changes
Exports all records or filtered only records to HTML, CSV, or XML.
Note: To use this feature, you must have ActiveX enabled in yourbrowser security settings.
Export
Prints all records or filtered only records.Print
Displays reports in a cascade or separate tabs.Window
Restores the active report to its default state specified in the reportprocedure.
Restore Original
IBM DB2 Web Query for IBM i 51
1. Building Dashboards and Applications in InfoAssist

Configuring Active Technologies Report Options
You can configure active report options, including menu options, based on user role through theactive report options dialog box.
You access the dialog box on the Format tab, in the Features group, by clicking the active reportoptions button. The button is available when active report, active Flash, or active PDF is selectedas the output type.
The active report options dialog box contains the following tabs:
General
Menu Options
Colors
Advanced
52 IBM
Creating Active Technologies Components With InfoAssist

General Tab
Use the General tab to set common properties specific to active reports. The General tab isshown in the following image.
The General tab contains the following options:
Display. This area contains options to set the window to cascade or tabs, and options to freezecolumns.
Window. Select the window setting. The options are Cascade and Tabs.
IBM DB2 Web Query for IBM i 53
1. Building Dashboards and Applications in InfoAssist

Freeze Columns. Select the columns you would like to freeze. You can also select None.
Page Options. This area contains options to set the number of records per page, enable thedisplay of page information, edit the alignment, and set the location of the page information.
Records Per Page. Select or type the number of records that you would like to display perpage. The default value is 57. The options are:
All
10
20
30
40
50
Display Page Information. Select this option to display page information. Clear this optionto disable the display of page information.
Alignment. Click the appropriate button to set the alignment of the page information. Optionsare Left, Center, and Right.
Location. Select the location for the page information. The options are Top Row and BottomRow.
Chart Options. This area contains options that pertain to charts.
Chart Engine. Select the chart engine to determine the set of charts that you can create.The options are:
Standard. Uses the Active Technologies default chart engine. This option is available foroutput format types AHTML, FLEX, and APDF.
Flash. This setting is the default for the output format types AHTML and FLEX. For AHTML,this uses the current Flash charts by default on browsers with Flash Player that might notsupport the functionality in the new JavaScript charts, such as older releases of InternetExplorer. These charts automatically switch to the new JavaScript charts on browsers thatdo not support Flash, such as Safari® on the iPad.
HTML5. Uses the new JavaScript charts for the output format type AHTML. These chartswork in both connected and disconnected mode. The current AHTML default four JavaScriptcharts will not be available at run time.
54 IBM
Creating Active Technologies Components With InfoAssist

Flex. Uses the default four Adobe Flex charts when output format is FLEX or APDF. Theseare the existing charts that work in both connected and disconnected mode. No additionalchart types will be available at run time.
Legend (check box). Select this option to collapse the legend if necessary. Clear this optionif you do not want the legend to collapse. This is for active Flash and active PDF only.
Legend (menu). Select the location for the legend. This is for active Flash and active PDFonly. The options are:
Bottom Left
Bottom Center
Bottom Right
IBM DB2 Web Query for IBM i 55
1. Building Dashboards and Applications in InfoAssist

Menu Options Tab
Use the Menu Options tab to select a user type and select which options to display in the menu.The Menu Options tab is shown in the following image.
The Menu Options tab contains the following options:
User Type. The options are Power, Analyst, Basic, and Custom.
Power. This is the default user type and enables all functionality.
Analyst. This user type has the following functionality: Show Records, Freeze, Hide/Unhide,Export, Sorting, Pivot, Filter, Calculations, Chart, Visualize, Restore Original, Save Changes,and Accordion.
56 IBM
Creating Active Technologies Components With InfoAssist

Basic. This user type has the following functionality: Show Records, Freeze, Hide/Unhide,Sorting, Filter, Calculations, Visualize, and Restore Original.
Custom. If you select a combination of options that does not match one of the existinguser types (Power, Analyst, Basic), the User level name that appears in the User Type fieldis Custom. This is not a default user type or a selectable user type. It is used to showthat options for this user do not match any of the existing user types.
Show Records. Shows all records or specific numbers of records.
Freeze. Freezes and unfreezes columns.
Hide/Unhide. Hides and shows columns.
Export. Exports data as HTML, .CSV, or Excel (XML) formats.
Sorting. Sorts data in ascending and descending order.
Pivot. Pivots data.
Window Type. Shows windows as cascade or tabs.
Send as Email. Sends reports as email.
Print. Prints all records or filtered-only records.
Advanced Tools. Accesses the Chart/Rollup, Pivot, and Grid Tools.
Filter. Opens the Filter Selection dialog box.
Calculations. Performs the following calculations: Sum, Avg, Min, Max, Count, Distinct, %of Total.
Chart. Converts report to pie, line, bar, or scatter charts.
Visualize. Adds data visualization bars to report.
Rollup. Performs rollup on data.
Comments. Adds comments.
Restore Original. Restores original data.
Save Changes. Saves changes.
Accordion. Produces accordion reports.
Grid Tool. Opens the Grid Tool dialog box.
IBM DB2 Web Query for IBM i 57
1. Building Dashboards and Applications in InfoAssist

Colors Tab
Use the Colors tab to select colors for various objects on the report. The Colors tab is shown inthe following image.
The Colors tab contains the following options:
Page. This area contains options to set the colors for the font and background for the page text.
Font. Opens the Color dialog box, where you can select the font color.
Background. Opens the Color dialog box, where you can select the background color for thepage text.
58 IBM
Creating Active Technologies Components With InfoAssist

Row Selection. This area contains options to set the colors that appear when you point to orselect a row on the report.
Hover. Opens the Color dialog box, where you can select the color that the row becomeswhen you hold the mouse over the row.
Selected. Opens the Color dialog box, where you can select the highlight color that the rowbecomes when you use the highlight option.
Visual. This area contains options to set the colors for the data visualization bars.
Positive. Opens the Color dialog box, where you can select the color for a positive datavisualization bar.
Negative. Opens the Color dialog box, where you can select the color for a negative datavisualization bar.
Calculations. This area contains options to set the colors for values in a calculation.
Font. Opens the Color dialog box, where you can select the font color for the calculation.
Background. Opens the Color dialog box, where you can select the background color for thecalculation.
Menu. This area contains options to change the color of the menu.
Normal
Font. Opens the Color dialog box, where you can select the color for the text of the optionson the column menus.
Background. Opens the Color dialog box, where you can select the background color forthe column menus.
Border. Opens the Color dialog box, where you can select the color for the border of thecolumn menus.
Hover
Font. Opens the Color dialog box, where you can select the color for the text of the optionson the column menus when you point to them.
Background. Opens the Color dialog box, where you can select the background color thatappears behind options on the column menus when you point to them.
IBM DB2 Web Query for IBM i 59
1. Building Dashboards and Applications in InfoAssist

Advanced Tab
Use the Advanced tab to control the number of rows retrieved from active cache and to makesecurity settings.
Note: active cache is enabled when you select active report as the output type on the Formattab, in the Output Types group, and click Pages on Demand on the Format tab, in the Navigationgroup.
The Advanced tab is shown in the following image.
The Advanced tab contains the following options:
active cache. Enables reports to cache the data in a binary file and return the data to the outputwindow in pre-set increments.
Rows Retrieved. Select the number of rows retrieved in the output. The options are:
100 (default)
500
1000
2000
60 IBM
Creating Active Technologies Components With InfoAssist

3000
4000
5000
Security. This area allows you to set a password to access the report and enable expiration bydate or by days.
Note: When setting security options for active reports, be aware that security options can beset for each individual component on the canvas, but only one password can be set for theentire document.
Creating an Active Technologies Chart
An active report is a report that is designed for offline analysis. For more information, see Creatingan Active Technologies Report on page 47 .
How to Create an Active Technologies ChartProcedure:
1. Create a chart.
2. On the Format tab, in the Output Types group, click active report, active Flash, or active PDF.
3. Generate the chart.
IBM DB2 Web Query for IBM i 61
1. Building Dashboards and Applications in InfoAssist
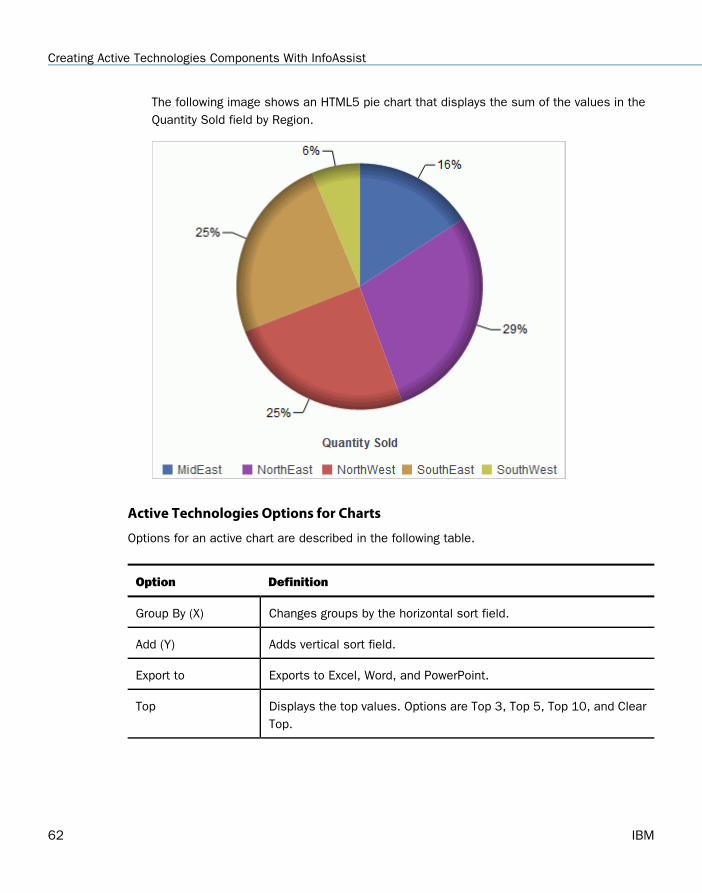
The following image shows an HTML5 pie chart that displays the sum of the values in theQuantity Sold field by Region.
Active Technologies Options for Charts
Options for an active chart are described in the following table.
DefinitionOption
Changes groups by the horizontal sort field.Group By (X)
Adds vertical sort field.Add (Y)
Exports to Excel, Word, and PowerPoint.Export to
Displays the top values. Options are Top 3, Top 5, Top 10, and ClearTop.
Top
62 IBM
Creating Active Technologies Components With InfoAssist

DefinitionOption
Opens the Chart/Rollup Tool which you can use to select multiplegroup fields in the chart or rollup table generated. The Chart/RollupTool contains a list of columns available in the active report and GroupBy and Measure sort fields. Drag the columns into the desired sortfield.
Chart/Rollup Tool
Views data as a pie chart.Pie
Views data as a bar chart.Bar
Views data as a line chart.Line
Views data as a scatter chart.Scatter
Opens the Chart/Rollup Tool.Advanced Chart
Restores the active chart to the chart type specified in the reportprocedure.
Original Chart
Applies the following options to the Measure field: Sum, Avg, Min,Max, Count, and Distinct.
Sum
Creating an Active Technologies Dashboard
You can create an active dashboard by inserting active dashboard prompts into a document toact as filters on the reports of the dashboard. You can also cascade (chain) prompts to populatebased on the selections of the previous prompts. The output format of the active dashboardmust be active report, active Flash, or active PDF in order to add active dashboard prompts.
IBM DB2 Web Query for IBM i 63
1. Building Dashboards and Applications in InfoAssist

Active Technologies Dashboard Prompts
The Active Dashboard Prompts group contains buttons to click to insert active dashboard promptsinto your dashboard. This group is only visible when the output format of the dashboard is setto active report, active PDF, or active Flash. You can access the active dashboard prompts onthe Format tab, in the Output Types group. The Active Dashboard Prompts group is shown in thefollowing image.
The following are the types of active dashboard prompts that you can use to apply filters to anactive dashboard:
Drop Down. Inserts a drop down prompt placeholder in the upper-left corner of the canvas.
List. Inserts a list prompt placeholder in the upper-left corner of the canvas.
Checkbox. Inserts a check box prompt placeholder in the upper-left corner of the canvas.
Radio Button. Inserts a radio button prompt placeholder in the upper-left corner of the canvas.
Text. Inserts a text area prompt placeholder in the upper-left corner of the canvas.
Note: The display of values populated in active dashboard prompts is dependent on the datasetting. For example, if sample data is turned on, then active dashboard prompts will showsample data, such as:
WF_RETAIL1WF_RETAIL2WF_RETAIL3
Target Reports
When you bind a field to an active dashboard prompt, the default target report is the report fromwhich you dragged the field. You can add or remove target reports from an active dashboardprompt through the active dashboard properties dialog box. For more information on using theactive dashboard properties dialog box, see Using Multiple Reports as Targets and Sources onpage 68.
64 IBM
Creating Active Technologies Components With InfoAssist

A report must meet one of the following requirements to be a target report:
The report contains a field with the same name as the source field (actual field name or ASname).
The Master File of the report has a field with the same name as the source field.
If a report is eligible to be a target report because the field has the same user-entered title andthe title is changed, the report is automatically removed as a target.
How to Add an Active Technologies Dashboard Prompt to a DashboardProcedure:
This procedure describes how to begin to create a dashboard by creating one report and bindinga single prompt to one of the fields of the report.
1. Open InfoAssist in Document view.
2. On the Format tab, in the Output Types group, select an active output type (active report,active Flash, active PDF).
3. On the Insert tab, in the Reports group, click Report.
A placeholder appears on the canvas.
4. Drag fields onto the canvas, or into the Query pane, to create the report and start buildingthe dashboard.
5. On the Insert tab, in the active dashboard prompts group, select a dashboard prompt toinsert into the document.
For example, the following image shows a radio button prompt added to the dashboard.
IBM DB2 Web Query for IBM i 65
1. Building Dashboards and Applications in InfoAssist

An active dashboard prompt appears in the upper-left corner of the canvas. If you have leftthe report in the upper-left corner of the canvas, then you will have to drag the prompt offthe report, as shown in the following image.
66 IBM
Creating Active Technologies Components With InfoAssist

6. Select the report and bind one of its data source fields to the prompt in one of the followingways:
Query pane: Select the report. From the Query pane, drag the field that you want to bindonto the prompt.
Report on the canvas: Right-click the report and click Edit Report. The report becomeseditable. Highlight the column that contains the data that you want and drag it on theprompt.
Once you have bound the field to the prompt, the values of the field appear in the prompt.
Note: Once an active dashboard prompt is added to the canvas, the document is lockedin an active output format. You cannot change out of active report, active Flash, or activePDF format if there are prompts present on the canvas. To switch to a non-active outputformat, all prompts must be removed.
The following image shows an active dashboard in which the Product Category field of thereport has been bound to a radio button prompt.
The following image shows an example of a dashboard at run time. The active report has aradio button prompt bound to the Product Category field. Since it is a radio button, andTelevisions is selected, only Regions that have sold televisions appear on the report.
IBM DB2 Web Query for IBM i 67
1. Building Dashboards and Applications in InfoAssist

Using Multiple Reports as Targets and Sources
You can add multiple reports and charts to a dashboard. Each report can have multiple promptsassociated with it.
How to Build a Dashboard With Multiple Reports as Targets and SourcesProcedure:
The following procedure describes how to set up active dashboard prompts for two reports on adashboard. In the example that is used, the first report contains information about the categoriesof electronics products sold in various regions. The Region field will be bound to a group of radiobuttons. Each radio button will represent a particular region in which the electronics are sold.When you select a radio button for a region, for example, NorthEast, the report will be filtered byyour selection.
The second report contains information about the gender and age group of electronics consumers.The Gender field will be bound to a drop-down list. The list will display the values, male andfemale. When you select a gender from the drop-down list, the report will be filtered by yourselection.
1. With InfoAssist open in Document view, and at least two reports on the canvas, add twoactive dashboard prompts, as described in How to Add an Active Technologies DashboardPrompt to a Dashboard on page 65.
68 IBM
Creating Active Technologies Components With InfoAssist

The following image shows a dashboard with the region report and the gender report describedin the introduction. Next to the region report is a radio box. Next to the gender report is adrop-down list prompt. The prompts are not yet bound to any report fields.
2. Right-click the active dashboard prompt you want to bind a field to and click Properties.
IBM DB2 Web Query for IBM i 69
1. Building Dashboards and Applications in InfoAssist
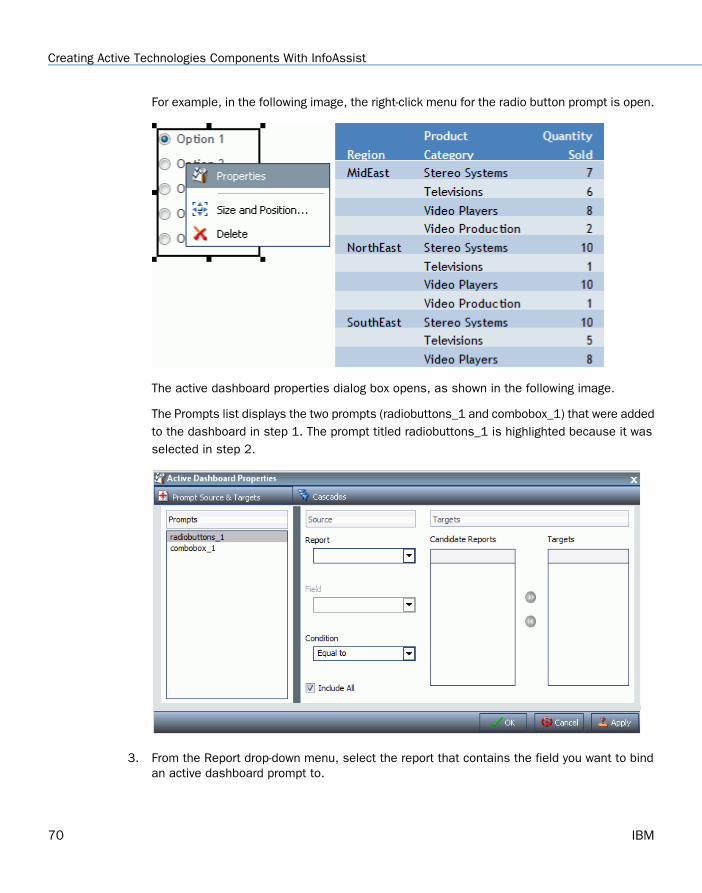
For example, in the following image, the right-click menu for the radio button prompt is open.
The active dashboard properties dialog box opens, as shown in the following image.
The Prompts list displays the two prompts (radiobuttons_1 and combobox_1) that were addedto the dashboard in step 1. The prompt titled radiobuttons_1 is highlighted because it wasselected in step 2.
3. From the Report drop-down menu, select the report that contains the field you want to bindan active dashboard prompt to.
70 IBM
Creating Active Technologies Components With InfoAssist

In this example, shown in the following image, the radio buttons list (radiobuttons_1) hasbeen selected as the prompt for the region report (table_1).
The next step describes how to bind the Region field from the region report to the radiobuttons list to filter that report.
4. From the Field drop-down menu, select the field to which you want to bind the active dashboardprompt.
IBM DB2 Web Query for IBM i 71
1. Building Dashboards and Applications in InfoAssist

In this example, the Region field has been selected for the radio buttons list (radiobuttons_1),as shown in the following image.
The following image shows Region as the selected field for the radio buttons list. The regionreport (table_1) is a target report because it is the one from which you selected the field. Inaddition, table_2, the gender report, now appears in the Candidate Reports list.
5. Click OK.
72 IBM
Creating Active Technologies Components With InfoAssist

The prompt is now bound to the field on the dashboard.
In the following image, the radio buttons list is bound to the Region field. It displays allregions by which a user can filter the report.
IBM DB2 Web Query for IBM i 73
1. Building Dashboards and Applications in InfoAssist

The following steps describe how to bind the Gender field in the gender report (table_2) tothe drop-down list prompt.
6. Right-click the next active dashboard prompt to which you want to bind a field and clickProperties.
74 IBM
Creating Active Technologies Components With InfoAssist

For example, in the following image, the drop-down list prompt on the gender report isselected.
IBM DB2 Web Query for IBM i 75
1. Building Dashboards and Applications in InfoAssist

The active dashboard properties dialog box opens again, as shown in the following image.
Notice that combobox_1, the prompt selected on the dashboard, is selected in the Promptslist.
7. From the Report drop-down menu, select the report that contains the field you want to bindan active dashboard prompt to.
76 IBM
Creating Active Technologies Components With InfoAssist
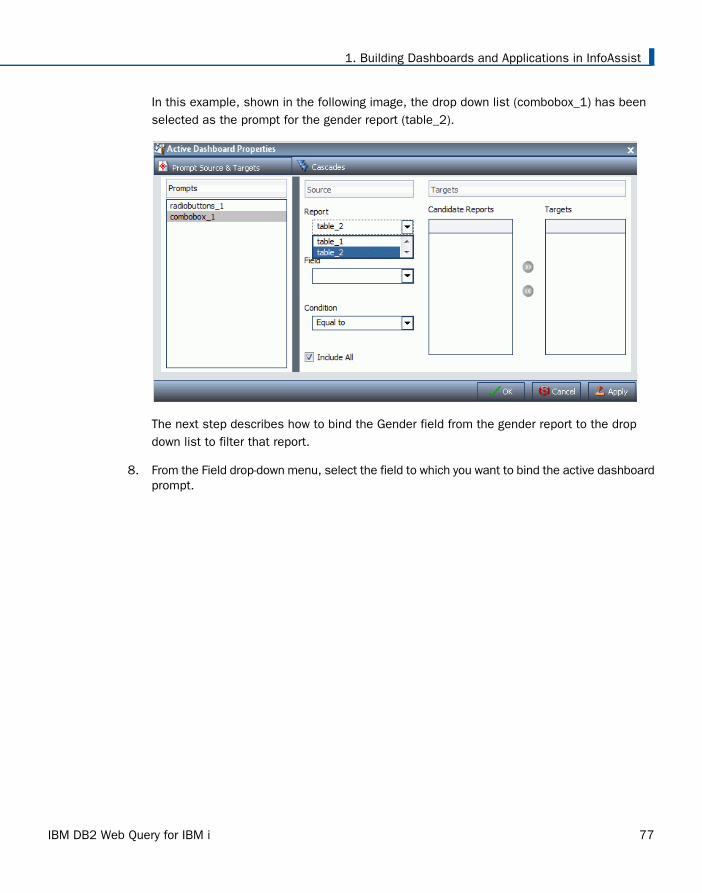
In this example, shown in the following image, the drop down list (combobox_1) has beenselected as the prompt for the gender report (table_2).
The next step describes how to bind the Gender field from the gender report to the dropdown list to filter that report.
8. From the Field drop-down menu, select the field to which you want to bind the active dashboardprompt.
IBM DB2 Web Query for IBM i 77
1. Building Dashboards and Applications in InfoAssist

In this example, the Gender field has been selected for the drop-down list (combobox_1), asshown in the following image.
Once the Gender field has been selected, table_2 (gender report) appears in the Target listand table_1 (region report) appears in the Candidate Reports list.
78 IBM
Creating Active Technologies Components With InfoAssist

Note: To move a report from the Candidate Reports list box to the Targets list box, selectit and click the Add to List arrow. To remove a report from the Targets list box, select itand click the Remove from List arrow. You can select multiple reports by holding downthe Ctrl key and clicking each one.
9. Click OK.
The prompt is now bound to the field on the dashboard.
In this example, the drop-down list is bound to the Gender field. A user could filter the genderreport by male or female.
The following image shows the final dashboard with two reports and two prompts.
IBM DB2 Web Query for IBM i 79
1. Building Dashboards and Applications in InfoAssist

In this example, the region report has been filtered by the NorthEast region and the genderreport has been filtered by Female.
How to Change the FieldProcedure:
You can change the field to which the active prompt is bound.
1. With InfoAssist open in Document view, bind an active prompt to a field, as described inUsing Multiple Reports as Targets and Sources on page 68.
2. Right-click the active dashboard prompt that you want to configure, and click Properties.
The active dashboard properties dialog box opens.
80 IBM
Creating Active Technologies Components With InfoAssist

3. From the Field menu, select a different field, as shown in the following image.
A warning message alerts you that changing the source field for the prompt will remove theexisting prompt and any children prompts from the cascades. The warning message is shownin the following image.
4. Click OK to close the warning.
5. Click OK to close the active dashboard properties dialog box.
The active dashboard prompt is updated with the new source field.
IBM DB2 Web Query for IBM i 81
1. Building Dashboards and Applications in InfoAssist

In the following example, the check box prompt is updated with electronics products, asshown in the following image.
How to Change the Filter ConditionProcedure:
1. With InfoAssist open in Document view, bind an active dashboard prompt to a field, asdescribed in How to Add an Active Technologies Dashboard Prompt to a Dashboard on page65.
2. Right-click the active dashboard prompt that you want to work with, and from the right-clickmenu, select Properties.
The active dashboard properties dialog box opens.
3. From the Condition drop-down menu, select the filter condition for the active dashboardprompt. The options are Equal to, Not equal to, Less than, Less than or equal to, Greaterthan, and Greater than or equal to.
4. Click OK.
The filter condition is applied to the active dashboard prompt.
How to Add Multiple Prompts to a DashboardProcedure:
1. With InfoAssist open in Document view, and at least one report on the canvas, add at leasttwo active dashboard prompts, as described in How to Add an Active Technologies DashboardPrompt to a Dashboard on page 65.
82 IBM
Creating Active Technologies Components With InfoAssist

The following image shows a dashboard with a list prompt and a radio button prompt.
2. Bind the fields to prompts that you have added, as described in How to Add an ActiveTechnologies Dashboard Prompt to a Dashboard on page 65.
IBM DB2 Web Query for IBM i 83
1. Building Dashboards and Applications in InfoAssist

In the following image, the list prompt has been bound to the Product Category field and theradio button prompt has been bound to the Region field. The two prompts work independentlyof each other to filter the dashboard in different ways.
84 IBM
Creating Active Technologies Components With InfoAssist

The following image shows the dashboard indicating the quantity of stereo systems sold forall regions.
The following image shows the dashboard indicating the electronics products sold in theNorthEast region.
How to Cascade PromptsProcedure:
When you have more than one prompt on the canvas, you can cascade prompts to populatebased on the selections of the previous prompts. Cascading prompts have a parent-childrelationship, in which the parent filters the available options of the child.
An active prompt can be the parent of more than one other prompt, but cannot be a child of morethan one prompt.
IBM DB2 Web Query for IBM i 85
1. Building Dashboards and Applications in InfoAssist

1. With InfoAssist open in Document view, bind at least two active prompts to fields, as describedin Using Multiple Reports as Targets and Sources on page 68.
In the following image, a report has been created to show the quantity of electronics soldby states within a region. Two prompts, a radio button to select the region, and a check boxto select the state, have been added to the report. The objective is to be able to select aregion, and then cascade down to the state level.
2. Right-click the active dashboard prompt that you want to configure, and click Properties.
The active dashboard properties dialog box opens.
86 IBM
Creating Active Technologies Components With InfoAssist

3. Click Cascades.
By default, a cascade named Cascade1 appears in the Cascades section of the activedashboard Properties dialog box.
You can click the Create a new cascade button to create a new cascade.
You can click the Delete selected cascade button to delete the selected cascade.
The following image shows that the Region field is associated with the radio button promptand the State Code field is associated with the check box in the Available Prompts list.
4. Select the cascade to which you want to add prompts.
5. From the Available Prompts list box, select the prompt that you want to add.
IBM DB2 Web Query for IBM i 87
1. Building Dashboards and Applications in InfoAssist

6. Click the Add to List arrow to move the selected prompt to the Selected Prompts list box, asshown in the following image.
Note: You can remove prompts from the Selected Prompts list box by selecting them andclicking the Remove from List arrow.
7. Add any additional prompts you want to be part of the cascade by repeating steps 5 and 6.
By default, the hierarchy of the prompts is determined by the order in which they are addedto the Selected Prompts list. The cascade of the prompts is from top to bottom. The promptsthat come first in the Selected Prompts list are the parents of the lower prompts.
8. You can change the hierarchy of the prompts by selecting a prompt in the Selected Promptlist box and clicking the Move Up and Move Down arrows, as shown in the following image.
88 IBM
Creating Active Technologies Components With InfoAssist

9. Click OK.
The cascade is created.
10. Run the report.
The following image shows the report with the region radio box and the state check box.
IBM DB2 Web Query for IBM i 89
1. Building Dashboards and Applications in InfoAssist

The following image shows the dashboard output with the region prompt cascading down tothe state level.
Note: If you set up more than one cascade, the cascade that you interact with last is theone that filters the report.
Using SlicersDescribes the functionality of slicers, the dynamic selection criteria available from the Slicerstab.
You can use InfoAssist to create slicers, dynamic filters that you can use with reports, charts,dashboards, and documents.
Creating Slicers
You can create slicers by dragging fields to the Slicers tab or through the context menu of a field.When you create a slicer group, it appears on the Slicers tab, as shown in the following image.
You can use slicers to dynamically filter reports at design time in InfoAssist.
90 IBM
Using Slicers

You can dynamically filter reports at run time when they are included in an InfoMini application.For more information on InfoMini, see Building InfoMini Applications.
How to Create a SlicerProcedure:
1. Click the Slicers tab.
2. Create a new slicer by using one of the following methods:
Click the New Group button to create a new slicer group.
Select a field from the Data pane and drag it onto the Drag Fields Here to Create Slicerstext on the Slicers tab.
Note: You cannot drag parent-child hierarchies onto the Slicers tab.
The field is added to the new group.
or
Right-click a field in the Data pane, point to Slicers, and then click New Group, as shownin the following image.
IBM DB2 Web Query for IBM i 91
1. Building Dashboards and Applications in InfoAssist

The field is added to the new group, as shown in the following image.
If you are creating a slicer on a full date field, a calendar icon displays adjacent to thefield, as shown in the following image. You can use this icon to select a date using acalendar control.
92 IBM
Using Slicers

How to Add a Field to an Existing Slicer GroupProcedure:
1. Click the Slicers tab.
2. Add a field to an existing slicer group using one of the following methods:
Select a field from the Data pane and drag it onto an existing slicer group.
or
Right-click a field in the Data pane, point to Slicers, and then click Existing Group, asshown in the following image.
Select an existing group from the menu, as shown in the following image, and then clickOK.
The field is added to the existing group.
IBM DB2 Web Query for IBM i 93
1. Building Dashboards and Applications in InfoAssist

How to Add a Hierarchy as a Slicer GroupProcedure:
Note: You cannot drag parent-child hierarchies onto the Slicers tab.
1. Click the Slicers tab.
2. Add a hierarchy as a slicer group using one of the following methods:
Select a hierarchy from the Data pane and drag it onto an existing slicer group.
The hierarchy is added as a new group, not as a slicer in the existing group. The newgroup is given the same name as the hierarchy.
or
Click the New Group button to create a new slicer group.
Select a hierarchy from the Data pane and drag it onto the Drag Fields Here to CreateSlicers text of the Slicers tab.
The hierarchy is added to the new group, as shown in the following image. The name ofthe new group changes to the name of the hierarchy automatically.
Note: Hierarchies cannot be added to existing slicer groups. If a hierarchy is draggedonto an existing slicer group, a new group is created automatically.
There is no right-click context menu for hierarchies. To add a hierarchy as a slicer group, youmust drag it into a new slicer group.
Filtering With Slicers
Once you add slicers to an InfoAssist report, you can use them to filter the report. You can selectvalues from the slicers menus, change the number of records that appear, create new slicergroups, clear existing slicer groups, and update the report preview.
94 IBM
Using Slicers
Slicers that are not selected have their values filtered by the selected slicers. Only values thatmeet the criteria for previously selected slicers will appear in the menu for the next slicer. Slicersare not filtered in the order they appear in the slicer group, but by the order they are selected.Cascading of slicers is only valid for hierarchies.
How to Change the Relationship Operator in a SlicerProcedure:
For alpha fields, the available operators are:
equal to
not equal to
For numeric and date fields, the available operators are:
equal to
not equal to
in range
not in range
greater than
less than
greater than or equal to
less than or equal to
1. With at least one slicer added to the report, click the Slicers tab.
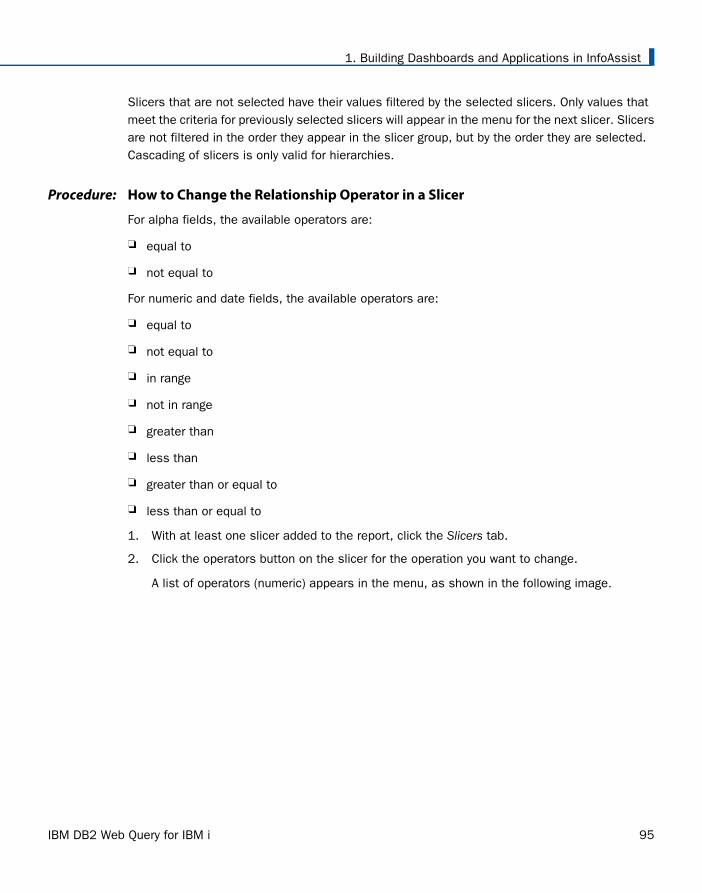
2. Click the operators button on the slicer for the operation you want to change.
A list of operators (numeric) appears in the menu, as shown in the following image.
IBM DB2 Web Query for IBM i 95
1. Building Dashboards and Applications in InfoAssist

Note: Alpha fields just flip between equal and not equal.
3. Select the operator that you want from the menu. You can rest the mouse on an operatorto display a tooltip describing the operation, as shown in the following image.
How Slicers Cascade Together
Slicers cascade within a hierarchy (cube or dimension builder-based), rather than in the order ofuser interaction, eliminating potential performance issues.
96 IBM
Using Slicers

How to Cascade SlicersProcedure:
Controls with fields from the same hierarchy are cascaded together. In the following example, areport has been created that shows the quantity of products, by category, sold each year.
1. Create a report.
2. Create multiple slicer groups, as described in How to Create a Slicer on page 91.
IBM DB2 Web Query for IBM i 97
1. Building Dashboards and Applications in InfoAssist

In the following example, two groups have been created for this report: Product and Time(Sales). Both are from hierarchies, so they will cascade.
In the next example, Televisions is selected as the first control for the Product group.
98 IBM
Using Slicers

Once you click OK, the new control appears in the drop-down menu, as shown in the followingimage.
The 1 prior to the decimal point indicates that this is the first cascade you have interactedwith. The 1 after the decimal point indicates that it is the first control in that cascade.
In the next example, Flat Panel TV is selected as the second control for the Product group,as shown in the following image. This is filtered to only show subcategories for Televisions.
IBM DB2 Web Query for IBM i 99
1. Building Dashboards and Applications in InfoAssist

Flat Panel TV appears in the Product Subcategory drop-down menu, as shown in the followingimage.
The number 1.2 indicates that this is the second control for the first cascade.
Now, a second group, Time (Sales) is created. It has two controls: the first is Year (Sales)and the second is Quarter (Sales), as shown in the following image.
3. Filter the report using the controls in the slicer groups that you created.
In the following example, the report has been filtered to show the number of flat paneltelevisions that were sold in the first quarter of 2007.
Note: The order of a cascade is dynamic. For example, if you selected Camcorder fromProduct Subcategory first, then the Product Category control would have a value of VideoProduction.
100 IBM
Using Slicers

Edit Slicers Dialog Box
You can access the Edit Slicers dialog box by clicking the edit button next to the group labels onthe Slicers tab, as shown in the following image.
The Edit Slicers dialog box contains the following tabs:
General
Record Limit
Group # (tab for each slicer group)
IBM DB2 Web Query for IBM i 101
1. Building Dashboards and Applications in InfoAssist

General Tab
Use the General tab to show or hide the Options group and to automatically update the Interactivepreview. You can also reorder or delete existing groups on this tab. The General tab is shown inthe following image.
The General tab contains the following options:
Show Options group. Select this option to display the Options group on the Slicers tab. TheOptions group is shown in the following image.
The Options group contains the following options:
New Group. Adds a new slicers group to the Slicers tab.
102 IBM
Using Slicers

Clear Slicers. Clears all selected values from existing slicers.
Update Preview. Updates the design time canvas with any changes that have been made.
Auto Update Preview. Enables auto updating of the canvas.
Edit Group Order. Select a group, then use the up and down arrows to change its position.
Hide & Exclude. Select a group, then select this option to delete the group.
Record Limit Tab
Use the Record Limit tab to show or hide the Record Limit group, the Preview control, and theRun Time control, as shown in the following image. You can also use this tab to select the numberof preview and run-time records that will be shown.
The Record Limit tab contains the following options:
IBM DB2 Web Query for IBM i 103
1. Building Dashboards and Applications in InfoAssist

Show Record Limit group. Select this option to display the Record Limit group on the Slicerstab. The Record Limit group is shown in the following image.
The Record Limit group contains the following menus:
Preview. Use this menu to control how many records are displayed in the design-timepreview.
Run Time. Use this menu to control how many records are displayed at run time.
Show Preview control. Select this option to display the Preview menu in the Show RecordLimit group on the Slicers tab. You can set the default number of records to be shown atdesign time with the Records menu in the Preview section.
Show Run Time control. Select this option to display the Run Time menu in the Show RecordLimit group on the Slicers tab. You can set the default number of records to be shown at runtime with the Records menu in the Run Time section.
104 IBM
Using Slicers

Group Tab
Use the Group tab, shown in the following image, to change the name of the group, change theorder of the slicers in the group, and set a required option for slicers. Selecting a slicer andclicking the Remove from List button deletes the slicer.
The Group tab contains the following options:
Group Name. Use this field to enter or edit the name of a Slicer group.
Edit Slicer Order. Select a slicer, then use the up and down arrows to change its position.
Required. Select this option to set a slicer to be required. A slicer that is set to requiredmust have a value selected before the report can run. A required slicer is indicated by anasterisk (*), as shown in the following image.
IBM DB2 Web Query for IBM i 105
1. Building Dashboards and Applications in InfoAssist

Building InfoMini ApplicationsDescribes how to create InfoMini applications that have embedded analysis functionality that isavailable at run time.
InfoMini applications are built from an InfoAssist report and contain a subset of InfoAssistfunctionality available at run time.
You can build an InfoMini application and provide the run-time user with the option to interactwith and edit the report.
Understanding InfoMini Applications
When you create a report in InfoAssist, you have the option to activate InfoMini. You can run areport with InfoMini activated, which creates an InfoMini application. An InfoMini applicationcontains a subset of the functionality available in a full InfoAssist report. You can limit or expandthe functionality that is available to the user at run time when you build the report in InfoAssist.
An InfoMini application opens in its own browser window when it is run from within InfoAssist totest. An InfoMini application does not open in its own browser window in the Business Intelligence(BI) Portal or in any other application that you build yourself.
An InfoMini application has many of the components an InfoAssist report has, with the followingexceptions:
The main menu is not accessible.
The New, Open, and View code buttons on the Quick Access Toolbar are not available.
Certain tabs and groups are unavailable or limited.
The status bar is not accessible.
The navigation taskbar is not accessible.
InfoMini does not support referencing existing procedures and Reporting Objects.
For more information on the available components and their functionality, see Components ofthe InfoAssist Application Window.
Using the InfoMini Button
The InfoMini button can be found on the Format tab, in the Destination group. You can click theInfoMini button to activate the InfoMini option. With the InfoMini button active, you can run areport to open the InfoMini application.
To deactivate the InfoMini option, click the InfoMini button again. There must be at least oneoption selected from the InfoMini button menu for InfoMini to be activated.
106 IBM
Building InfoMini Applications

You can set the options available to the user at run time from the menu on the InfoMini button.If you select an option from the menu when the InfoMini button is inactive, the InfoMini optionis activated. The options are:
Format tab
Slicers tab
When you select an option from the menu, a check mark appears next to the option. The checkmark indicates the option is available for the user at run time within the InfoMini application. Ifyou select a checked option to clear it, the check mark disappears, and the option is no longeravailable through the InfoMini application. If you clear all of the options from the menu, InfoMiniis deactivated.
The Run Immediately option is set by default. It enables reports to run immediately when InfoMinifirst launches. You might want to clear this option so that the user can choose a format and pickslicers before running a report.
Interactive Mode
Interactive mode is the default mode when an InfoMini application runs. You can access Interactivemode from the Quick Access Toolbar of an InfoMini application. The Resources panel is notavailable in Interactive mode. If no options are selected from the InfoMini button when theapplication runs, the tool still opens in Interactive mode with no ribbon options available.
The following options can be activated in Interactive mode:
Format tab
Slicers tab
From the Format tab, you can access the Output Types group, with the following exceptions:
The Destination, Navigation, and Features groups, which are on the Format tab in InfoAssist,are not available in an InfoMini application.
The Other button, which is on the Format tab, in the Chart Types group in InfoAssist, is notavailable in an InfoMini application.
The InfoMini button, which is on the Format tab, in the Destination group in InfoAssist, is notavailable in an InfoMini application.
For more information on the functionality of the available groups on the Format tab, see Usingthe Format Tab.
From the Slicers tab, you can access the Options, Record Limit, and Slicer Group groups, withthe following exceptions:
IBM DB2 Web Query for IBM i 107
1. Building Dashboards and Applications in InfoAssist

The New Group option, which is on the Slicers tab, in the Options group in InfoAssist, is notavailable in the Interactive mode of an InfoMini application.
Note: The New Group option is available on the Slicers tab, in the Options group in anInfoMini application in Edit mode.
The Update Preview option, which is on Slicers tab, in the Options group in InfoAssist, is notavailable in an InfoMini application.
The Preview list, which is on the Slicers tab, in the Record Limit group in InfoAssist, is notavailable in an InfoMini application. It only appears in Edit mode in a document.
For more information on the functionality of the available groups on the Slicers tab, see UsingSlicers.
Creating an InfoMini Application
To create an InfoMini application in InfoAssist, build a report as you normally would, then activateInfoMini and add the functionality you want the user to have available to them at run time. Formore information on what functionality is available to InfoMini applications, see UnderstandingInfoMini Applications on page 106.
How to Activate InfoMiniProcedure:
1. With an InfoAssist report open, click the Format tab.
2. To activate InfoMini, do one of the following:
In the Destination group, click InfoMini, as shown in the following image.
Note: At least one option from the InfoMini menu must be selected in order to activateInfoMini. By default, the Format tab, Slicers tab, and Save option are selected on themenu when you activate InfoMini in a new report. For more information on enablingInfoMini options, see How to Enable and Disable InfoMini Application Options on page109.
108 IBM
Building InfoMini Applications

In the Destination group, on the InfoMini menu, click one of the following options:
Format tab
Slicers tab
The InfoMini button is highlighted and the InfoMini mode is activated. For more informationabout running an InfoMini application, see How to Test an InfoMini Application on page 109.
How to Enable and Disable InfoMini Application OptionsProcedure:
You can choose which options will be available at run time in an InfoMini application. By default,the Format tab, Slicers tab, and Save option are selected on the menu when you activate InfoMiniin a new report. For more information about the functionality of each option, see UnderstandingInfoMini Applications on page 106.
1. With an InfoAssist report open, click the Format tab.
2. Click the InfoMini button and select the options you want available from the menu.
InfoMini does not have to be active for you to access the menu. When you select an optionfrom the menu, InfoMini is activated.
How to Test an InfoMini ApplicationProcedure:
1. With an InfoAssist report open, activate InfoMini as described in How to Activate InfoMini onpage 108.
2. Enable the options that you want, as described in How to Enable and Disable InfoMiniApplication Options on page 109.
3. Run the report.
An InfoMini application opens in a new window.
How to Interact With an InfoMini ApplicationProcedure:
You have the ability to alter the InfoMini application at run time using the Interactive mode.Changes to the application are not reflected on the canvas dynamically and you must run thereport to see the updates.
1. Run a report with InfoMini activated, as described in How to Test an InfoMini Application onpage 109.
An InfoMini application opens in a new window.
IBM DB2 Web Query for IBM i 109
1. Building Dashboards and Applications in InfoAssist

2. By default, the ribbon is hidden in an InfoMini application. To display the ribbon, do one ofthe following:
Click one of the tabs, as shown in the following image.
Click the Show Ribbon button, as shown in the following image.
110 IBM
Building InfoMini Applications

The tabs that are enabled appear on the ribbon.
For example, in the preceding image, the Format, and Slicers tab were enabled in InfoMiniand appear on the ribbon. The available options on these tabs provide the samefunctionality as they do in InfoAssist. You can use this embedded functionality to changethe report at run time.
For example, in the following image, active report has been selected as the output formatfor the report.
IBM DB2 Web Query for IBM i 111
1. Building Dashboards and Applications in InfoAssist

The following image shows the active report at run time.
3. After making your changes, click Run to see an updated version of the report.
112 IBM
Building InfoMini Applications

For example, the following image shows the report run with Region as the slicer in the InfoMiniapplication.
4. Click Save to save the application.
You can reopen a saved InfoMini application in InfoMini or, if you have access, open thereport in InfoAssist.
GlossaryDescribes key concepts in this manual.
3D Effect
A customized charting feature that sets the three-dimensional view to be on or off.
Accessibility
A specialized reporting feature that allows a title to be added to a report, chart, or documentthat is Section 508 compliant. This option is only available for reports and charts when theoutput type is HTML or PDF.
Accordion
A specialized reporting feature in which expandable views of data are created for each verticalsort field. This option displays data values only for the first vertical sort field when the userfirst views the output. The view can be expanded manually to expose the data values of lower-level sort fields.
IBM DB2 Web Query for IBM i 113
1. Building Dashboards and Applications in InfoAssist

accordion report
Report output that is expandable for each vertical sort field.
active chart
A chart that uses the full capabilities of Active Technologies.
active dashboard
A dashboard that uses the full capabilities of Active Technologies.
active dashboard prompts
Controls from Active Technologies that act as filters on the reports of the document, suchas text box, image, drop down, list, check box, radio button, and text field.
active dashboard properties dialog
A dialog box of options to add active form controls to reports in a document.
active Flash
An output format available for reports, charts, documents, and dashboards.
active PDF
An output format available for reports, charts, documents, and dashboards. Requires Adobe®
Reader® 9.0 or later.
active report
A report that uses the full capabilities of Active Technologies.
active report Options
A customized charting feature. Opens the active report options dialog box where you canconfigure your active report options, such as menu items, graph engine, and colors. Thisoption is only available when the output type is set to active report, active Flash, or activePDF.
Aggregation
A report custom feature in which the user can display numeric measure data using a varietyof aggregation options other than the default of Sum.
aggregation value
A value assigned to a numeric measure field in a report.
Annotate
A customized charting feature that allows the user to add an annotation and position it on achart.
114 IBM
Glossary

annotation
Explanatory note or comment.
application button
A button on the InfoAssist Application window that provides access to the application menuof procedure-related commands.
axis
A reference line drawn on a chart.
axis labels
Labels generated automatically based upon the scale of the axis. They appear along the axis.
axis title
Descriptive text that provides meaningful information about the data measured by an axis.
background
The area that appears behind the frame of a chart.
cascade
An output view option in which multiple output windows are cascaded diagonally across theResults panel.
cascade controls
Controls that have a parent-child relationship, in which the parent filters the available optionsof the child. An active form control can be the parent of more than one other control, butcannot be a child of more than one control.
cell padding
The amount of space inserted between rows and columns in a report.
color bands
Basic design elements of a chart. Color bands come in a pair, with each band uniquelycolored. They appear in a continually repeating pattern behind a series on a chart. The contrastof colors is designed to make a chart easier to read.
color mode
The mode that controls how color is applied to a series (measure field) on a chart. Thepossible settings are By Series (default) and By Group.
data bars
A report custom feature in which data visualization bars are added to numeric data.
IBM DB2 Web Query for IBM i 115
1. Building Dashboards and Applications in InfoAssist

data labels
Descriptive names that identify specific data points within a series.
Data tab
A tab on the ribbon that contains data manipulation and data display options in the Calculation,Join, Filter, Display, and Data Source groups.
dimension filtering
An option to display dimension filters at the top of a report.
document theme
A theme selected by the user to distinctly style reports and charts.
Environment and Styling
Area of the InfoAssist Options window that contains settings to select an application themefor the user interface or a document theme to apply styling to reports and charts.
feeler line
A line that connects the data label to a chart.
Field tab
A tab on the ribbon that appears when the user selects a data source field in the QueryDesign pane of Layout canvas. The options available in the Field tab are specific to the datatype that is selected. The options available for numeric fields are different from the optionsavailable for non-numeric and date fields. The Field tab provides access to the Filter, Sort,Break, Style, Format, Display, and Links groups.
Format Grid Lines dialog box
A dialog box of options to format horizontal and vertical gridlines, color bands, and frameson a chart.
Format Axis dialog box
A dialog box of options for formatting for both vertical and horizontal axes.
Format Gauge dialog box
A dialog box of options for formatting a gauge chart. Such options include setting and stylinga title for the gauge chart, setting tick marks, and color bands, as well as advanced settings,such as setting the gauge start and stop angle.
Format Labels dialog box
A dialog box that contains options for editing data labels.
116 IBM
Glossary

Format Series dialog box
A dialog box that contains options to format the fill and border of each series on a chart.
Format tab
A tab on the ribbon that contains different options for selecting output formats and otherreporting features, depending on whether you are creating a report. For reports, the Formattab provides access to the Output Types, Destination, Navigation, and Feature groups.
frame
The area of a chart that contains all of the basic chart elements, such as the plot points,gridlines, legend, and chart title. The frame appears as a rectangle.
Frame & Background
A customized charting feature. Through the Frame & Background dialog box, the user canset frame and background options specific to the chart type selected.
Freeze
A custom report output format that allows the user to view output with column titles thatfreeze (remain in view) when the user scrolls through pages of the report output.
gauges
A customized charting feature. Through the Gauge dialog box the user can set options specificto a gauge chart.
grid
A customized charting feature that allows the user to set options for horizontal and verticalgridlines.
gridlines
Lines that run horizontally and vertically to enhance the readability of a chart. Gridlines canbe major or minor.
Home tab
A tab on the ribbon that contains the most commonly-used commands and options from theFormat, Design, Filter, and Report groups.
InfoMini
An application built from an InfoAssist report that contains a subset of InfoAssist functionalityat run time.
IBM DB2 Web Query for IBM i 117
1. Building Dashboards and Applications in InfoAssist

Insert tab
A tab on the ribbon that contains options to add reports, charts, existing reports, text, images,and active form control (for active report, active PDF, and active Flash outputs only) to acanvas in Document view.
Interface theme
A theme selected by the user to style all menus and dialog boxes.
Layout canvas
A component of the InfoAssist application window. The Layout canvas displays a preview ofthe report being created or modified in the Results panel when the user is in Live Preview(default). The Layout canvas is always fully maximized (within the Results panel) and cannotbe minimized, cascaded, or tiled. A blank canvas opens when there is no report.
Layout tab
A tab on the ribbon that provides access to page display and layout options from the Pagesetup, Size & Arrange, and Report groups.
legend
A chart element that displays each series that appears on a chart.
Lightweight Mapping
The Lightweight Mapping functionality offers the ability to view data that is bound to a geo-location. Using a powerful HTML5 map viewer, you can view data using a variety of popularformats, such as bubble markers and heat filled polygons (also known as choropleths). TheHTML5 map viewer contains zoom, pan, and scale controls. You can use this functionalityto visualize patterns, trends, and relationships related to the location information in data.
limit
A report custom feature in which the number of unique variables in a column is limited.
markers
Visual elements found on line charts that represent data points on a chart.
Navigation taskbar
A component of the InfoAssist Application window that displays groups and icons that providesdifferent views and quick access to all active reports and report access.
Page Breaks
A custom report Pages on Demand feature in which a new page is started in the output whenthe primary sort field changes.
118 IBM
Glossary

Pages On Demand
A custom report output format that allows the user to view output, one page at a time, andto use a menu bar at the bottom of the report output, from which the user can view a specificpage.
Personal InfoAssist
A self-service version of InfoAssist.
Pop-up Title
A report custom feature in which pop-up titles are added to a report and appear when themouse pointer hovers over a column title.
quadrant lines
Horizontal and vertical lines that cross to divide a chart into four sections.
Query Design pane
A component of the InfoAssist application window that contains the Filter and Query (fieldcontainer) area. It appears below the Data pane, except when the user selects Query designview, which expands the size of the pane and displays it in the Results panel.
Quick Access Toolbar
A toolbar on the InfoAssist Application window that displays frequently used commands, suchas New, Open, save, Undo, Redo, View code, Run, and Preview.
Rank
A report custom feature in which a ranking column is inserted for By and Measure fields ina report.
Recompute
A report custom feature in which the result of a Compute command is recalculated.
Reference
A customized charting feature that allows the user to add a reference line to the Y-axis anda reference line to the X-axis.
reference line
A line designed to draw attention to specific data locations on a chart. A maximum of threehorizontal (X axis) and three vertical (Y axis) reference lines can be added to a chart.
IBM DB2 Web Query for IBM i 119
1. Building Dashboards and Applications in InfoAssist

Repeat Sort Values
A report custom feature in which all repeated sort values appear instead of blanks after thefirst instance of a new sort value appears in the report.
Resources panel
A component of the InfoAssist Application window that displays the fields from the selecteddata source in the Data pane. Also displays the Query design pane below the Data pane,except in Query Design view.
Results panel
A component of the InfoAssist Application window that displays the Query Design pane, Layoutcanvas, or Output window.
ribbon
A component of the InfoAssist Application window that displays commands needed to createreports, charts, documents, and dashboards.
ring label
Descriptive name for a concentric ring found on a ring chart.
Rotate
A customized charting feature that allows the user to toggle between a vertical or horizontaldisplay of a chart.
Row Totals
A report custom feature in which a grand total column is inserted to the right side of thereport to sum numeric data in each row.
series
A group of data points that are plotted on a chart
Series tab
A tab on the ribbon that only appears when the user is working with charts. It provides accessto chart options through the Select, Properties, Line, Pie, and Display groups.
slicers
Dynamic filters that you can use with reports, charts, documents, and dashboards.
Slicers tab
A tab on the ribbon that provides the ability to create and edit slicers.
120 IBM
Glossary

Smart Positioning
Of data labels on a pie chart. If a pie chart has so many slices that a data label could becomeillegible, InfoAssist moves the data label outside of the pie, but connects it to the slice witha feeler line.
Stack Measures
An option to stack all measure fields on a report.
splash screen
A screen of available Getting Started and Help options that opens when a user clicks Newon the InfoAssist application main menu.
Status bar
A component of the InfoAssist Application window that contains an output button that theuser clicks to see the selected format and an output target button that the user clicks toview the selected option for displaying new output windows or tabs.
Sub Footer
A report custom feature, in which a subfooting is added at the end of the data on each pageof the report output when the primary sort field changes.
Sub Header
A report custom feature in which a subheading added just below the column titles in thereport output when the primary sort field changes.
Subtotal
A report custom feature in which a subtotal is inserted in the output for all numeric fieldswhen the primary sort field changes.
switch output
An output view option in which a drop-down menu opens, where the user can select any activereport to view the output.
Table of Contents
A custom report output format that allows the user to view output for individual values of thefirst sort (By) field, one value at a time.
tile horizontally
An output view option in which multiple output windows are tiled horizontally, one aboveanother, across the Results panel.
IBM DB2 Web Query for IBM i 121
1. Building Dashboards and Applications in InfoAssist

tile vertically
An output view option in which multiple output windows are tiled vertically, side by side,across the Results panel.
Title Popup
A specialized reporting feature in which a pop-up title appears when the mouse pointer hoversover a column title in the report output.
traffic light conditional styling
Color styling applied to data for a selected measure field. By default a report displays thevalues that satisfy the first condition in green, and the values that satisfy the second conditionin red.
trendline
A line drawn between any two points on a data series that shows the direction that the valuesof the data series are going in.
View
Area of the InfoAssist Options window that provides settings for establishing the design viewin which the user will work, the type of data that the user will use when previewing output,the limit that needs to be set on record input, how data and query panels will look, and theoutput target that will be used.
View tab
A tab on the ribbon that provides access to report design viewing options in the Design,Show/Hide, Data Panel, Query Panel, Output Window, and Reports groups.
Within
Functionality that allows you to use specific aggregation tasks at different report levels. Youcan use the Within phrase to manipulate display field values as they are aggregated withina sort group rather than a report column.
122 IBM
Glossary

IndexA
active cache 45, 46enabling 45enabling by component 46rows retrieved 45
active dashboards 63
active report Options dialog box 52, 53, 56, 58, 60Advanced tab 60Colors tab 58General tab 53Menu Options tab 56
Active Technologiesfor charts 61
C
chartsusing Active Technologies 61
D
documentsassociating a field with a prompt 68cascading prompts 85changing the filter condition 80setting target reports 64
E
Edit Slicers dialog box 101
F
filtering with slicers 94
FOCUS format index files 34
H
HOLD filesDocument mode 39
M
multi-pagedashboards 39
multi-page dashboardcreating 42
multi-page documentcreating 40
multi-page documents 39
multipage documents and dashboardsPage menu 43
P
Page Options dialog box 44
R
reportscreating an Active Technologies report 47
S
slicersEdit Slicers dialog box 101filtering with 94using 90
subquery filter 34
IBM DB2 Web Query for IBM i 123

124 IBM
Index