Embed Size (px)
Citation preview

RC24821 (W0906-124) June 29, 2009Computer Science
IBM Research Report
Quality Monitoring and Composition in Information-RichServices Supply Chains
Sai Zeng1, Jakka Sairamesh2, Mitch Cohen1, B. J. Steele3
1IBM Research DivisionThomas J. Watson Research Center
P.O. Box 704Yorktown Heights, NY 10598
2360Fresh, Inc.
3IBM Supply ChainPoughkeepsie, NY 10532
Research DivisionAlmaden - Austin - Beijing - Cambridge - Haifa - India - T. J. Watson - Tokyo - Zurich
LIMITED DISTRIBUTION NOTICE: This report has been submitted for publication outside of IBM and will probably be copyrighted if accepted for publication. It has been issued as a ResearchReport for early dissemination of its contents. In view of the transfer of copyright to the outside publisher, its distribution outside of IBM prior to publication should be limited to peer communications and specificrequests. After outside publication, requests should be filled only by reprints or legally obtained copies of the article (e.g. , payment of royalties). Copies may be requested from IBM T. J. Watson Research Center , P.O. Box 218, Yorktown Heights, NY 10598 USA (email: [email protected]). Some reports are available on the internet at http://domino.watson.ibm.com/library/CyberDig.nsf/home .

Quality Monitoring and Composition in Information-
Rich Services Supply Chains
Dr. Sai Zeng
IBM, T. J. Watson Research Center
Hawthorne, NY, 10532
Dr. Jakka Sairamesh
360Fresh, Inc
Mitch Cohen
IBM, T. J. Watson Research Center
Hawthorne, NY, 10532
B. J. Steele
IBM Supply Chain
Poughkeepsie, NY, 10532
Abstract. In this paper we describe design methods and algorithms for
service quality monitoring and improvement in dynamic service
networks where business decision-making on product performance is
dependent on the quality of services and information shared between
the providers in the service network. We also present a methodology
for composition based on diverse criteria and risk factors for continuous
monitoring and improvement of the service network quality. The
scenarios and results presented in this paper are based out of real
industry engagements from diverse manufacturing supply-chains, where
the primary manufacturer is increasingly dependent on the supply-chain
for production, manufacturing and service delivery.
Keywords: Composite Services, Service Networks, Information
Services, Decision-making, Matching, Supply-Chains, Optimization
and Web Services
1 Introduction
This paper describes business composition strategies in a service network consisting
of multiple suppliers to drive collaborative decision-making on purchasing and

performance measurements on manufacturing products. A service network implies a
network of businesses in a supply-chain sharing services to design, build and improve
upon products. Most of the literature in the academic and industry research groups
[1][2][3][4][5][6][8][9] so far focuses on Web application driven services for
accessing and composing heterogeneous applications managed by a single entity.
Lately some research on business process services has been discussed [4][5][9][11]
across multiple businesses.
Very limited work [12] has been done in understanding the role of a network of
“services” [8][10][11] for decision-making (e.g. supply-chain purchasing), and not
much technology has been developed to compose these diverse services based on
business or technical (IT) needs to enable complex decision-making (e.g. improved
purchasing or product redesign or product monitoring). We present scenarios from a
real-life case-study based on supply-chain collaboration for product improvement,
where information being shared is private and sensitive. The products being discussed
are automotive vehicles or electronic products, where multiple suppliers can be
selected and composed (e.g. Web Services composition) during system design time or
runtime to enable purchasing parts or components or services in a supply-chain. This
paper illustrates the need for distributed monitoring and composition of services and
products from suppliers, and feedback to revise compositions. By service composition
we mean combining business and IT services offered by the suppliers in the network
to satisfy the business need.
1.1 Challenges
Over the last decade, large enterprises have witnessed tremendous increases in
production and quality issues due to increased product complexity, dependency on the
supply-chain, information disaggregation, and process disconnections with existing
legacy applications. For example in Electronics and Automotive industries, hundreds
of suppliers and thousands of dealers form the value chain for design, production and
delivery of complex products and services to end customers. If a product fails, then
identifying what went wrong, gathering and sharing evidence, determining the
responsible party, purchasing new parts, and correcting future purchasing decisions
are challenging. Mistakes made in selecting the product components from the wrong
suppliers can be costly with further risk. In the Automotive Industry alone, due to part
and subsystem failures in vehicles (in use), the costs of Warranty have risen to over
30 Billion Euros per year across the globe. This overall cost will continue to rise till
manufacturers and their partners find a way to leverage services online and
collaborate to fix the product quality issues as quickly as possible and take preventive
actions. We outline challenges in designing a dynamic composite service based on the
services offered by two or more suppliers in the service network.
The first challenge: Understanding the nature of business relationships (e.g.
contracts or SLAs - Service Level Agreements between suppliers and manufacturers),
service and IT integration capabilities in the service network is vital in decision-
making. The challenge lies in indentifying the right network partners (e.g. suppliers)
and their products based on multiple criteria, which include costs, delivery
performance, non-conformance rates, taxes, reliability, performance, supplier value,
financial stability and others.

The second challenge that needs to be addressed in the service networks is
measuring, monitoring and correlating business events related to service failures from
the supply-chain and feeding them back into new purchasing decisions. The challenge
is to collect and correlate data from the network entities across multiple time-periods.
The third challenge: Various criteria need to be used to dynamically compose
information and applications during design and runtime across multiple service
network entities (e.g. suppliers given) that those entities have registered their services
through a Third-party registry or directly with the manufacturer. Suppliers can change
their service signatures or interfaces and this can result in costly design-time
composition.
2 Case-Study Details
This section describes a case-study of a service network from the automotive
industry; this example will be used throughout this paper. The automotive service
network contains three main types of businesses: (1) the manufacturer (OEM), (2) the
dealers, and (3) the suppliers; their purpose is to create, sell, and service vehicles (e.g.
cars or trucks or small vehicles). The manufacturer (in Figure 1) sells multiple
products through dealers, who are responsible for selling the vehicles to consumers
and handling repairs. The manufacturer procures subsystems and parts from a multi-
tiered supply-chain as shown in Figure 1. Each vehicle is assumed to consist of
subsystems, which contain parts (belonging to commodities). Purchasing is done by
the manufacturer and local plants based on several criteria. Each local plant makes
their decisions on purchases based on delivery costs, quality, reliability and others.
The goals of the manufacturer are to enable better purchasing decisions based on
historical information, product failures and high costs of recovery.
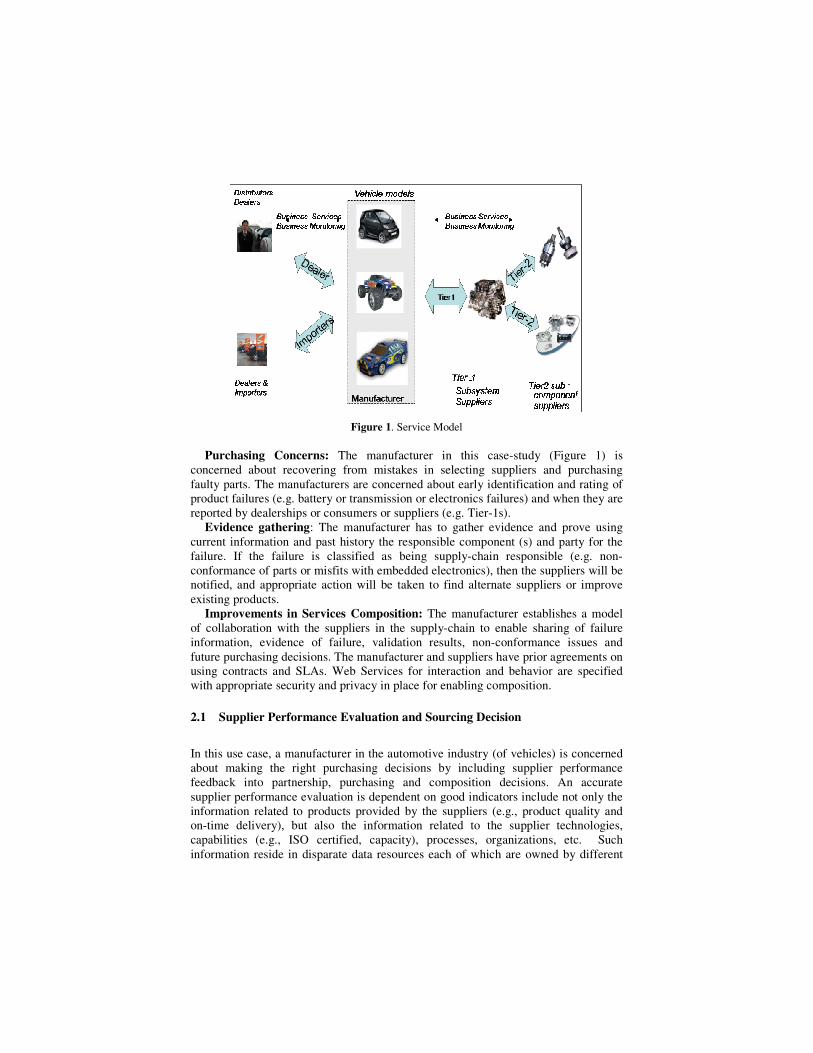
Figure 1. Service Model
Purchasing Concerns: The manufacturer in this case-study (Figure 1) is
concerned about recovering from mistakes in selecting suppliers and purchasing
faulty parts. The manufacturers are concerned about early identification and rating of
product failures (e.g. battery or transmission or electronics failures) and when they are
reported by dealerships or consumers or suppliers (e.g. Tier-1s).
Evidence gathering: The manufacturer has to gather evidence and prove using
current information and past history the responsible component (s) and party for the
failure. If the failure is classified as being supply-chain responsible (e.g. non-
conformance of parts or misfits with embedded electronics), then the suppliers will be
notified, and appropriate action will be taken to find alternate suppliers or improve
existing products.
Improvements in Services Composition: The manufacturer establishes a model
of collaboration with the suppliers in the supply-chain to enable sharing of failure
information, evidence of failure, validation results, non-conformance issues and
future purchasing decisions. The manufacturer and suppliers have prior agreements on
using contracts and SLAs. Web Services for interaction and behavior are specified
with appropriate security and privacy in place for enabling composition.
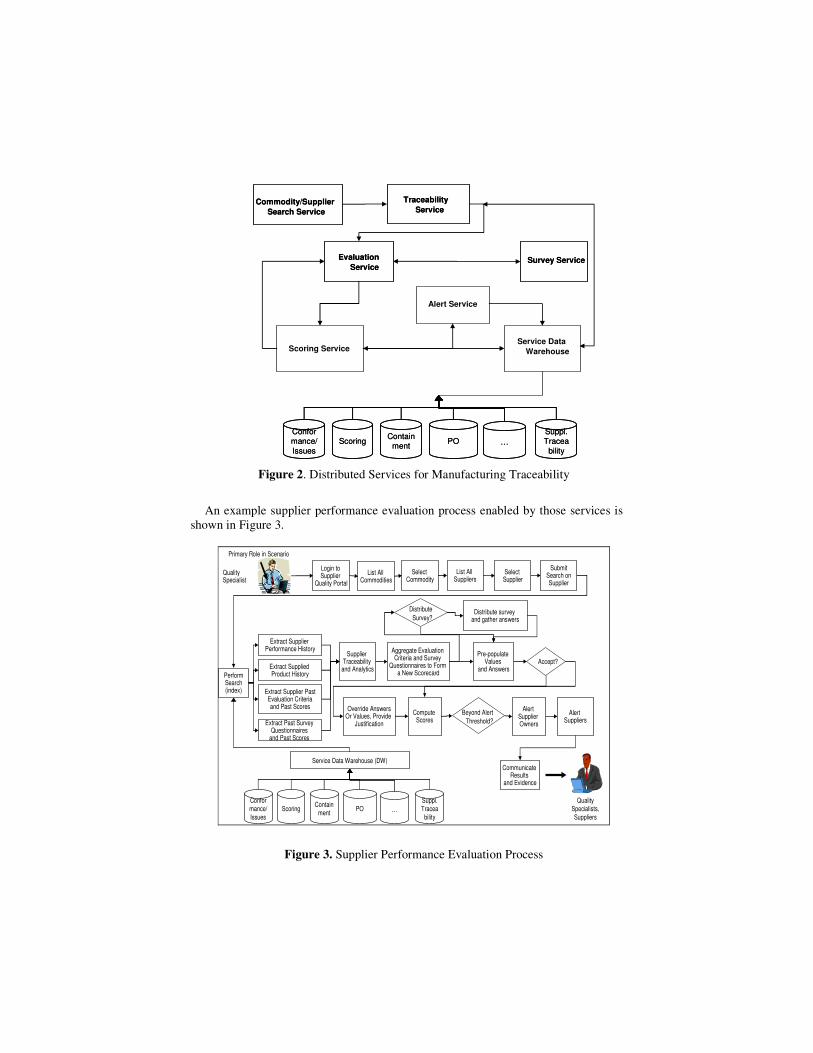
2.1 Supplier Performance Evaluation and Sourcing Decision
In this use case, a manufacturer in the automotive industry (of vehicles) is concerned
about making the right purchasing decisions by including supplier performance
feedback into partnership, purchasing and composition decisions. An accurate
supplier performance evaluation is dependent on good indicators include not only the
information related to products provided by the suppliers (e.g., product quality and
on-time delivery), but also the information related to the supplier technologies,
capabilities (e.g., ISO certified, capacity), processes, organizations, etc. Such
information reside in disparate data resources each of which are owned by different

organization branches within the OEM such as procurement, quality, plant, design,
warranty, owned by suppliers and sub tier suppliers, and owned by third parties such
as auditors and dealers. In Figure 2 we show a supplier performance evaluation
system which includes a network of services. This providers a capability to allow
stakeholders to search for a particular commodity, all parts under a particular
commodity, a particular supplier, suppliers associated with a particular commodity or
part, or all commodities or parts supplied by a particular supplier.
Distributed Services
We consider a distributed collection of services in the network of suppliers as shown
in Figure 2. A traceability service allows a part at any stage of the lifecycle to linked
to the equivalent and related entities in other stages of the lifecycle. For example, this
service allows identification of parts and their owners, parts and their suppliers by
product lot numbers, revisions to be identified to confirm effectiveness of supplier
changes, parts and associated products (for instance, Vehicle Identification Numbers,
VINs, on a car), and the parts and the suppliers in a given product. With this service,
it is easy to find both the right root cause and the responsible party for a quality
problem. The quality containment process is implemented in a faster more effective
manor with a tighter control of costs. For example, an expensive massive recall is
avoided and replaced by a selective recall on a set of carefully selected vehicles
The evaluation service is used to prepare inputs for the scoring system after all the
necessary information is gathered from the various systems. The input includes
objective and subjective information from supply chain processes, manufacturing
processes, and warranty and service processes. This set of information represents
current and past facts.
A survey service is used to gather input from stakeholders and customers on
supplier performance. The data gathered is often called the “soft” or subjective
metrics. Subjective metrics are typically those that measure intangibles like trust,
confidence, attitudes and satisfaction against supplier quality, technology competence,
process capability and so on.
The scoring service is the core component in support of this particular use case. It
aims to identify the best suppliers for specific parts and/or commodities. The
identification is based on the scores computed from multi-level criteria.
The alert service designed to monitor business events warning stakeholders of
abnormal behaviors. This system uses rules to monitor business events, setup
threshold or boundaries for abnormal behaviors (e.g., threshold on number of failures
for a specific part during a particular duration). The awareness of abnormal behavior
goes through two stages, a warning stage and the alert stage.
Finally, at the backend of the system, a service data warehouse consolidates
supplier performance data sources throughout the product life cycle. Example data
sources are systems measuring conformance, issue management, containment,
purchase orders (PO), and warranty spanning supply chain processes and
manufacturing processes. These are the example data sources we have consolidated,
but it by no means represents all data sources for performance evaluation. These
sources provide a good reference on what type of information an OEM should
consider for the evaluation process.
…ScoringConformance/
Issues
Containment
POSuppl. Tracea
bility…Scoring
Conformance/
Issues
Containment
POSuppl. Tracea
bility
Commodity/Supplier
Search Service
Commodity/Supplier
Search Service
Traceability
Service
Traceability
Service
Evaluation
Service
Evaluation
ServiceSurvey ServiceSurvey Service
Service Data
WarehouseScoring Service
Alert Service
Figure 2. Distributed Services for Manufacturing Traceability
An example supplier performance evaluation process enabled by those services is
shown in Figure 3.
Login to Supplier
Quality Portal
SubmitSearch onSupplier
PerformSearch(index)
Extract Supplier Performance History
Alert Suppliers
QualitySpecialist
Service Data Warehouse (DW)
Primary Role in Scenario
Extract Supplied Product History
Extract Supplier PastEvaluation Criteria and Past Scores
Extract Past Survey Questionnaires
and Past Scores
Supplier Traceability and Analytics
Alert Supplier Owners
Compute Scores
Select Commodity
Communicate Results
and Evidence
Aggregate Evaluation Criteria and Survey
Questionnaires to Form a New Scorecard
Pre-populate Values
and Answers
Quality Specialists,
Suppliers…Scoring
Conformance/
Issues
Containment
POSuppl. Tracea
bility
List All Suppliers
Select Supplier
List All Commodities
Accept?
Override AnswersOr Values, Provide
Justification
Beyond Alert
Threshold?
Distribute survey and gather answers
Distribute
Survey?
Figure 3. Supplier Performance Evaluation Process
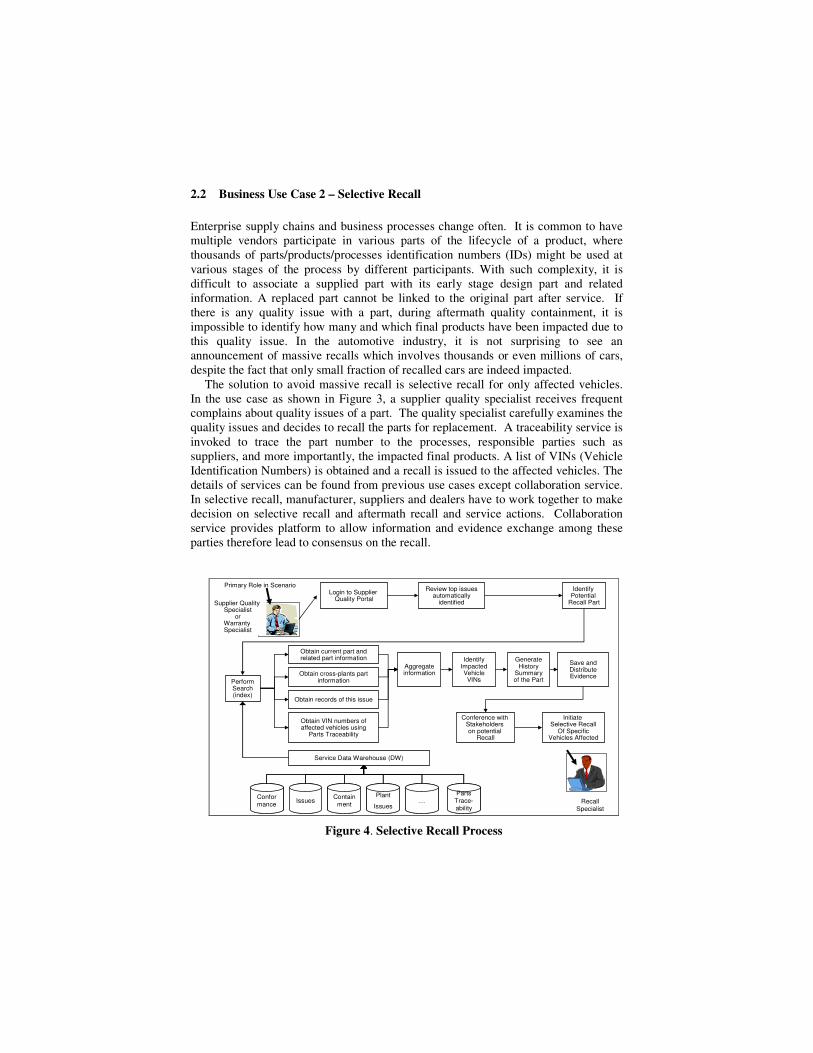
2.2 Business Use Case 2 – Selective Recall
Enterprise supply chains and business processes change often. It is common to have
multiple vendors participate in various parts of the lifecycle of a product, where
thousands of parts/products/processes identification numbers (IDs) might be used at
various stages of the process by different participants. With such complexity, it is
difficult to associate a supplied part with its early stage design part and related
information. A replaced part cannot be linked to the original part after service. If
there is any quality issue with a part, during aftermath quality containment, it is
impossible to identify how many and which final products have been impacted due to
this quality issue. In the automotive industry, it is not surprising to see an
announcement of massive recalls which involves thousands or even millions of cars,
despite the fact that only small fraction of recalled cars are indeed impacted.
The solution to avoid massive recall is selective recall for only affected vehicles.
In the use case as shown in Figure 3, a supplier quality specialist receives frequent
complains about quality issues of a part. The quality specialist carefully examines the
quality issues and decides to recall the parts for replacement. A traceability service is
invoked to trace the part number to the processes, responsible parties such as
suppliers, and more importantly, the impacted final products. A list of VINs (Vehicle
Identification Numbers) is obtained and a recall is issued to the affected vehicles. The
details of services can be found from previous use cases except collaboration service.
In selective recall, manufacturer, suppliers and dealers have to work together to make
decision on selective recall and aftermath recall and service actions. Collaboration
service provides platform to allow information and evidence exchange among these
parties therefore lead to consensus on the recall.
Login to Supplier Quality Portal
PerformSearch(index)
Obtain current part and related part information
Supplier Quality Specialist
orWarranty Specialist
Service Data Warehouse (DW)
Primary Role in Scenario
Confor
manceIssues
Contain
ment
Plant
Issues…
Parts
Trace-
ability
Confor
manceIssues
Contain
ment
Plant
Issues…
Parts
Trace-
ability
Obtain cross-plants part information
Obtain records of this issue
Obtain VIN numbers of affected vehicles using
Parts Traceability
Aggregateinformation
Review top issues automatically
identified
Save and Distribute Evidence
Recall
Specialist
Identify Potential
Recall Part
Initiate Selective Recall
Of SpecificVehicles Affected
Conference with Stakeholders on potential
Recall
Identify Impacted Vehicle VINs
Generate History
Summary of the Part
Figure 4. Selective Recall Process

3 Service Quality System
In this section we present the Service Quality system implemented for real
engagements for doing services selection, integration and composition in order to
improve manufacturing product performance and supplier quality. The service
system monitors both the business services and IT services offered by the suppliers
over the Internet. In Figures 5, 6 and 9 we show screen shots of the real functioning
service quality systems connecting information from multiple suppliers within a large
data warehouse system.
3.1 Services for Composition
Manufacturer requires a system to compose purchasing applications across multiple
suppliers (as shown Figure 1). The expected technology and service requirements
include the following:
� The early identification of potential safety issues by looking into information
across multiple sources from multiple entities (e.g. suppliers and consumers).
Information can be shared as services across the supply-chains.
� Composition of Supplier Web Services during design-time and runtime based on
SLAs and other contract terms and conditions. The composition is not just based
on the SLA values, but also based on business service state, previous failures,
recovery state and improvements.
� Composition is based on criteria such as performance of services by suppliers,
supplier scores, costs and others. In Figure 8, we show the composition process
for enabling a new business service across the service network of suppliers.
3.2 Alert and event Services
The manufacturer does analysis of product failure alerts generated by a detection
system that integrates information from multiple information sources within the
business and across the supply-chain of suppliers. For each part-failure the
manufacturer identifies the source of the failure and begins an investigation into
which supply-chain supplier (s) contributed to the faulty part. The analysis requires
information about the part history, failure history, supplier history and analysis of
similar failures. The alerts (Figure 5) enable future purchasing decisions to be based
on current failures and past issues on parts and supplier performance.

Figure 5: Alert service for monitoring products and suppliers
3.3 Product information services
An internet or web-driven service collaboration is set up between the experts in the
manufacturing company and engineers at the suppliers on the specifics of the part
defects and the corresponding impact. The collaboration enables sharing of failure
information from the manufacturer to the suppliers from the Bill of Material and
product data systems. Information (Figure 6) about the design and part quality
processes is shared between suppliers and manufacturer based on the specification
provided.
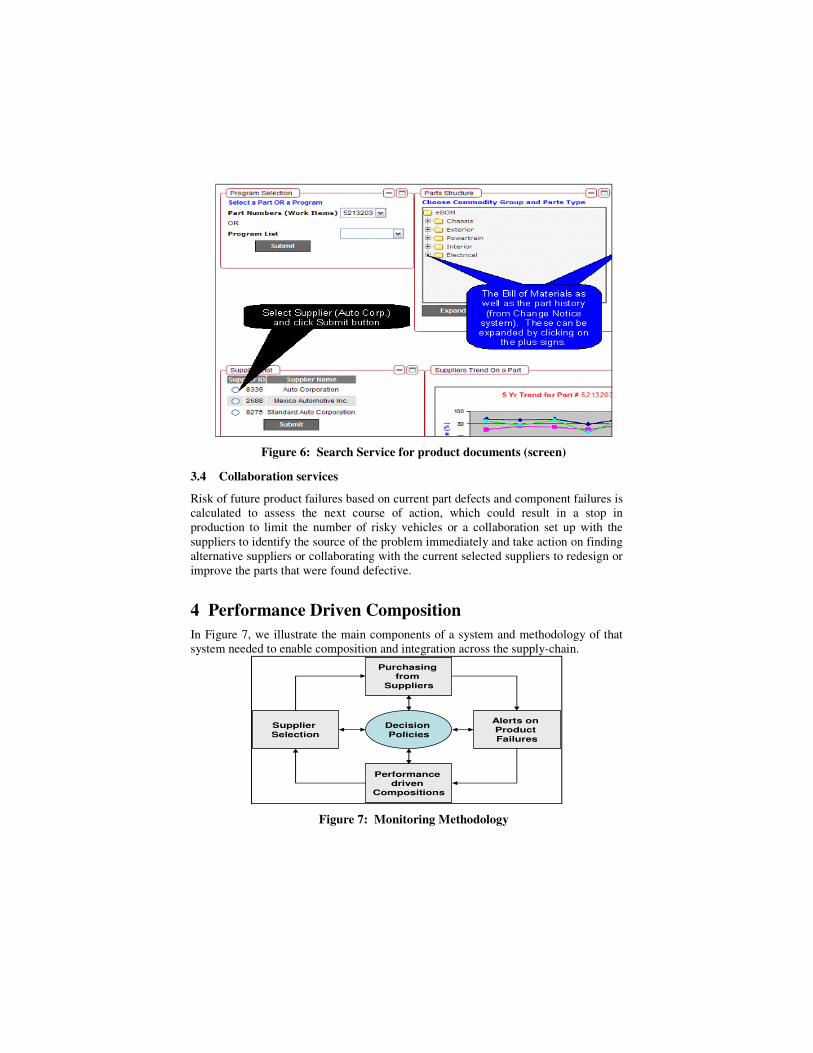
Figure 6: Search Service for product documents (screen)
3.4 Collaboration services
Risk of future product failures based on current part defects and component failures is
calculated to assess the next course of action, which could result in a stop in
production to limit the number of risky vehicles or a collaboration set up with the
suppliers to identify the source of the problem immediately and take action on finding
alternative suppliers or collaborating with the current selected suppliers to redesign or
improve the parts that were found defective.
4 Performance Driven Composition
In Figure 7, we illustrate the main components of a system and methodology of that
system needed to enable composition and integration across the supply-chain.
Purchasing from
Suppliers
Supplier
Selection
Alerts on Product
Failures
Performance driven
Compositions
Decision
Policies
Figure 7: Monitoring Methodology

The methodology illustrates four major service components within the service
network. These components can be implemented physically across multiple
businesses in the service network or multiple divisions within a business or a
combination.
Selection process:, which needs to be done across the enterprise (across supply-
chains and value-chains) at a coarse and fine-grained level.
Purchasing composition: modeled as new service by itself to enable alerts from
multiple sources within and across the Enterprise. Across the Enterprise alerts can
arrive from dealerships (e.g. Automotive) on product failures or consumers or
suppliers.
Alert assessment: to analyze current cost, future cost and risk to profitability of the
company based on bad decisions.
Revised composition: based on performance metrics, new service composition is
done with new or alternate suppliers. All of these components are inter-connected by
the manufacturer as a composed application for monitoring, measurement, analysis
and corrective action.
Figure 8: Composition Process
4.1 Design of methods for criteria and optimization
In Figure 8 we illustrate the decision-making criteria on creating a new composition
on services (both Web services and Business Services) is based on several
performance driven criteria and parameters. Some of the criteria are the following
� Risk and cost of selecting the service from the network of suppliers

� Delivery performance of the service (from past history)
� IT services reliability of the supplier
� Lead time requirements
� Cost of labor and facilities
� Taxes and transfer pricing
In the box below we show an XML representation of the service performance
definition (as offered by the suppliers). A data warehouse of the service performance
is maintained at a central location (e.g. Manufacturer) for evaluation and selection.
The performance of the suppliers and services offered are continuously monitored and
analyzed for future compositions of services offered by the suppliers.
The selection criteria, weights, the targets and expected values are listed Table 1
below. The selection criteria include the IT criteria as well, which are driven by the
SLAs in terms of performance of the service when requests are sent by the
manufacturer to the supplier on delivery dates for products or product specification of
product performance numbers. The column on weights specifies the criticality of the
criteria in the selection process (Figure 9). The reliability of the IT services becomes
an important parameter in future selection of the supplier from the Service Network.
Business and
IT Criteria
Weights (scale
of 1-10)
Target Values
Cost High Threshold (< 80% of
previous cost)
70% below current cost
Reliability High Threshold (< 0.01 % failure
probability)
Less than 0.01 percentage
Failure rates High Threshold on failure count
per 1000 components
Less than 2 per thousand
failures
Financial
stability
High Threshold (over 20% of
sales)
Profit over sales
percentages
<ServiceCriteria>
<ServiceRef> SJUY0913435 </ServiceRef>
<ServiceName> SHJFH8934 </ServiceName>
<ServiceProvider> Parts Supplier </ServiceProvider>
<ServiceStart> 09-06-2008 <ServiceStart>
<ServiceMode> Daily </ServiceMode>
<SecurityLevel> High </SecurityLevel>
<AutomationLevel> Medium </AutomationLevel>
<SLACode> SLA:3445KJDJLK </SLACode>
<SLAType> PayPerTransaction </SLAType>
<InformationSource> ERP System</InformationSource>
<Reliability> Tolerance 1 failure per 10,000 transactions</Reliability>
</ServiceCriteria>

Overall
Performance
High Performance score
Over 99 (scale of 100)
Scorecard score (over 99)
IT reliability Medium Reliability over 98% in
service uptime
Downtime risk or 1% of
the time (per month or per
year)
IT
performance
High System performance
(multiple users)
System values (over 200
simultaneous users)
Table 1. Examples of Selection Criterias
Figure 9: Scoring criteria and performance screen
5 Monitoring Services
5.1 Event Services
As described before, the goal of the system is to enable modeling and monitoring of
critical events. Figure 10 illustrates a functional view of the monitoring and
composition engines. The main modules are: (1) Decision Engine, (2) Monitoring
System, and (3) Composition engine. The decision engine is responsible for
integrating event information, running analytical models and providing the best
suggestions on decisions for composition.

Figure 10: Remote performance monitoring
The Monitoring System is a distributed system with components running in each
business in the service network. These components are continuously monitoring and
measuring the performance of physical product and the IT service offered by the
service network businesses. The main role of the monitoring engine is to execute both
qualitative and quantitative types of analyses on behalf of the stakeholder and send
the results to a decision-making entity. In this case, the decision-making entity will be
a purchasing manager of the manufacturer who is looking to use feedback from the
products in use on whether to improve or correct the purchasing decisions.
5.2 Monitoring Services
Figure 10, shows the structure of the overlay network across businesses (enterprises)
for monitoring and measurement at coarse and fine-grained levels.
The first layer (remote site) is corresponding to enterprises that are involved into a
service network, and each node represents one enterprise (for example, a manufacture
company) or a division within an enterprise. At the second layer (service quality
system), each node corresponds to a capability group such as process within an
enterprise. Monitors can be deployed at each of the providers. Each monitor that is
deployed at lead level captures the real-time behavior of each unit in the service
network. The monitoring results for all the nodes are transferred to the data
warehouse as shown in Figure 10 for further processing and improvements in
composition.

5.3 Composite Alert and Analysis Services
In Figure 8, we illustrate a workflow and composition model based on the case-study
in Section 2. The services are offered by multiple divisions within an organization or
enterprise to enable failure identification and corresponding decision-making to
improve purchasing. The alert, event and notification services are done in a
distributed fashion as critical alerts and corresponding data (as shown towards the left
of Figure 8) can come from dealers, consumers, suppliers, sensors and other
specialists in the ecosystem for triggering a new investigation into the failure, and
subsequent collaboration on identifying product failures. In the Figure 8, the
functional representation of the Event and Alert services is shown, but in reality these
services are distributed across a collection of business entities.
The alert, event and notification services are done in a distributed fashion as
critical alerts and corresponding data (as shown towards the left of figure 6) can come
from dealers, consumers, suppliers, sensors and other specialists in the ecosystem for
triggering a new investigation into the failure, and subsequent collaboration on
identifying product failures. Once the events and alerts are processed by the
manufacturer, the corresponding decision-processes are triggered manually to correct
the issues and recover from the failures.
6 Conclusion
In this paper we presented a structured methodology on performance based service
composition in a dynamic service network consisting of manufacturers, suppliers,
third-party service enablers and dealers. We presented scenarios from a real-life case
study based on past client engagements on improving purchasing decisions based on
feedback and alerts from a network of suppliers. We outlined a list of criteria for
enabling both design-time and runtime compositions of business and IT services
based on costs, reliability, quality, delivery and others. We also illustrated a
methodology and algorithm for doing service monitoring and composition across
multiple suppliers in a service network, where a supplier can be selected or deselected
from a composed application. The algorithms were implemented as a part of a real-
solution for validation. We deployed a working service quality system to measure,
monitor and improve upon compositions for manufacturing procurement.
7 References
[1] Component Business Model, IBM Service Management Volume 46, Number 3,
2007.
[2] Web Services Standards, OASIS.org.
[3] Business Process Standards and Services, OMG.org.
[4] J. Sairamesh, et. al., ‘‘Dealer Collaboration: Transforming the Value Chain
through Integration and Relationships,’’ Proceedings of the 2004 IEEE
International Conference on E-Commerce Technology (CEC’04), pp. 325–329
(2004).
[5] Service-Oriented Architecture, IBM Systems Journal, Volume 44, Number 4,
2005
[6] Cummings T. G. and Worley C. G. (1997), Organization Development and
Change, 6th
Edition, Cincinatti, OH, South-Western Publishing
[7] Pitsis T. S., Kornberger M., and Clegg S. (2004), The Art of managing
Relationships in Inter-organizational Collaborations, Management, 7(3):47-67.
[8] Parolini C. (1999), The Value Net: a Tool for Competitive Strategy. West Sussex:
john Wiley & Sons Ltd., ISBN 0-471-98719-0.
[9] Michael P. Papazoglou, Paolo Traverso, Schahram Dustdar and Frank Leymann ,
“Service-Oriented Computing: State of the Art and Research Challenges,”
November 2007 Computer, Volume 40, Issue 11.
[10] Mao Chen, Anca-Andreea Ivan and Jakka Sairamesh: Deep Visibility in
Enterprise Value Networks: Knowledge Models, Real-Time Monitoring and E-
Commerce., in proceedings of CEC & EEE 2006.
[11] N. S. Caswell, C. Nikolaou, J. Sairamesh, M. Bitsaki, G. D. Koutras, and G.
Iacovidis, "Estimating value in service systems: A case study of a repair service
system," IBM systems Journal, Service Science, Management, and Engineering
Volume 47, Number 1, 2008
[12] Sai Zeng et. al., “Supplier Scoring and Collaboration,” in the proceedings of
ICEBE, 2008, China.


![IBM Research Reportdomino.research.ibm.com/library/cyberdig.nsf/papers/58073EF405C… · et al. 2001], to serve as a platform for research into application programming patterns for](https://img.pdfslide.net/doc/110x75/5eab3f2e6b50f17d5106a725/ibm-research-et-al-2001-to-serve-as-a-platform-for-research-into-application.jpg)