Embed Size (px)
Citation preview
Ibrutinib: Analysis of Pivotal Data
Richard R. Furman, MDCLL Research Center
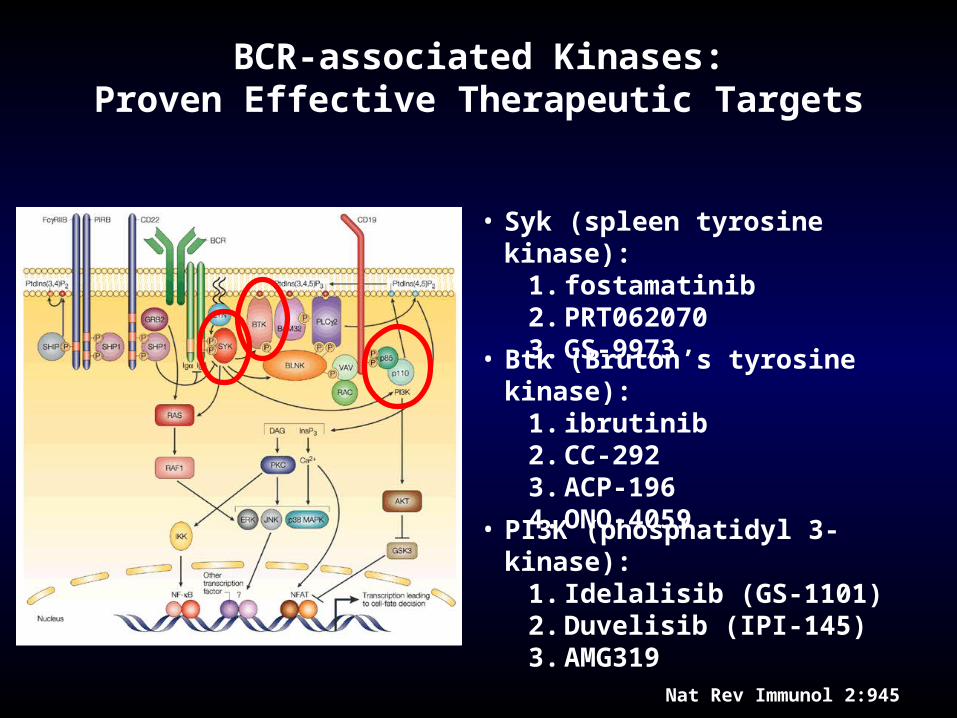
BCR-associated Kinases:Proven Effective Therapeutic Targets
Nat Rev Immunol 2:945
• Syk (spleen tyrosine kinase):1. fostamatinib2. PRT0620703. GS-9973
• Btk (Bruton’s tyrosine kinase):1. ibrutinib 2. CC-2923. ACP-1964. ONO-4059
• PI3K (phosphatidyl 3-kinase):1. Idelalisib (GS-1101)2. Duvelisib (IPI-145)3. AMG319
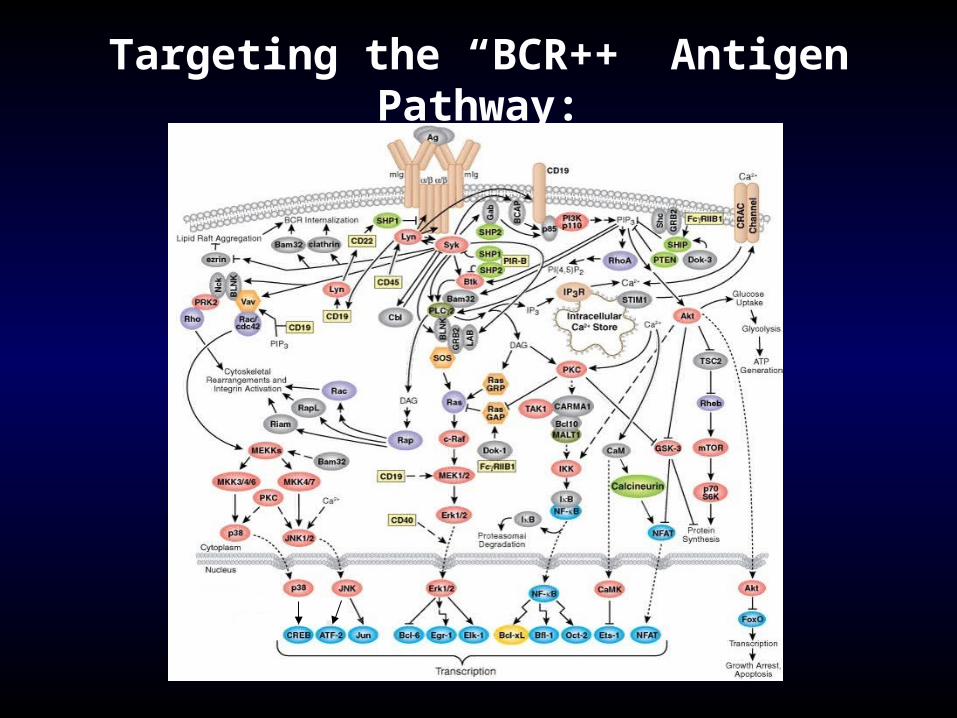
Targeting the “BCR++” Antigen Pathway:

Issues with Novel Agents
• Response Criteria– Redefine clinical endpoints– Evolution of response over time
• Dosing:– No more MTD dosing– Threshold dosing– Fixed dosing / wide therapeutic window
• Re-evaluation of Prognostic Markers• Re-evaluation of MRD
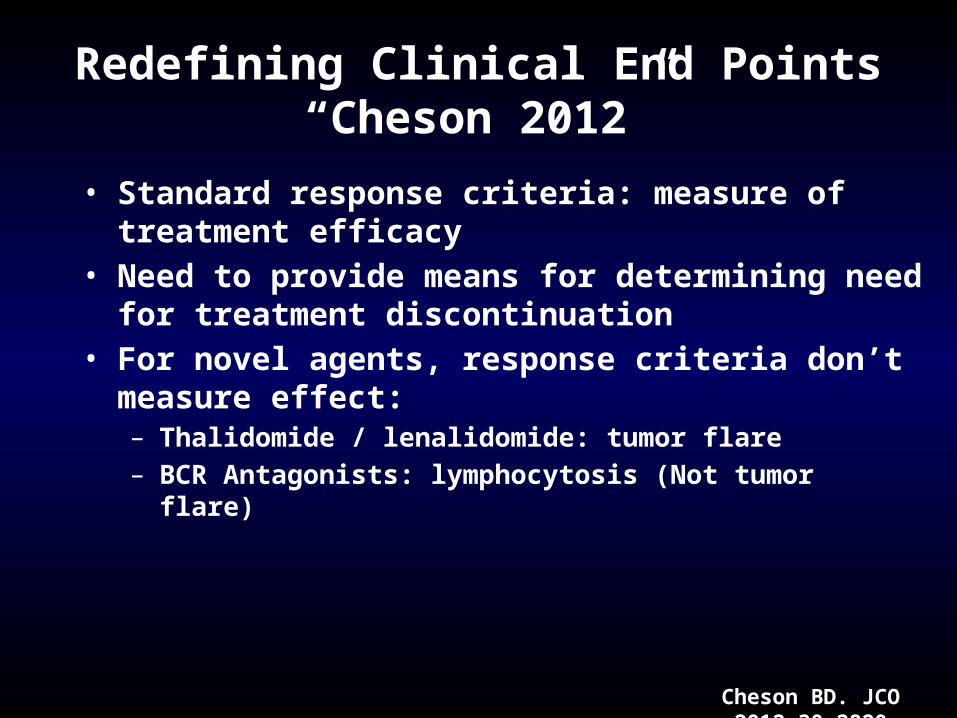
Redefining Clinical End Points“Cheson 2012”
• Standard response criteria: measure of treatment efficacy• Need to provide means for determining need for treatment
discontinuation• For novel agents, response criteria don’t measure effect:
– Thalidomide / lenalidomide: tumor flare– BCR Antagonists: lymphocytosis (Not tumor flare)
Cheson BD. JCO 2012;30:2820.
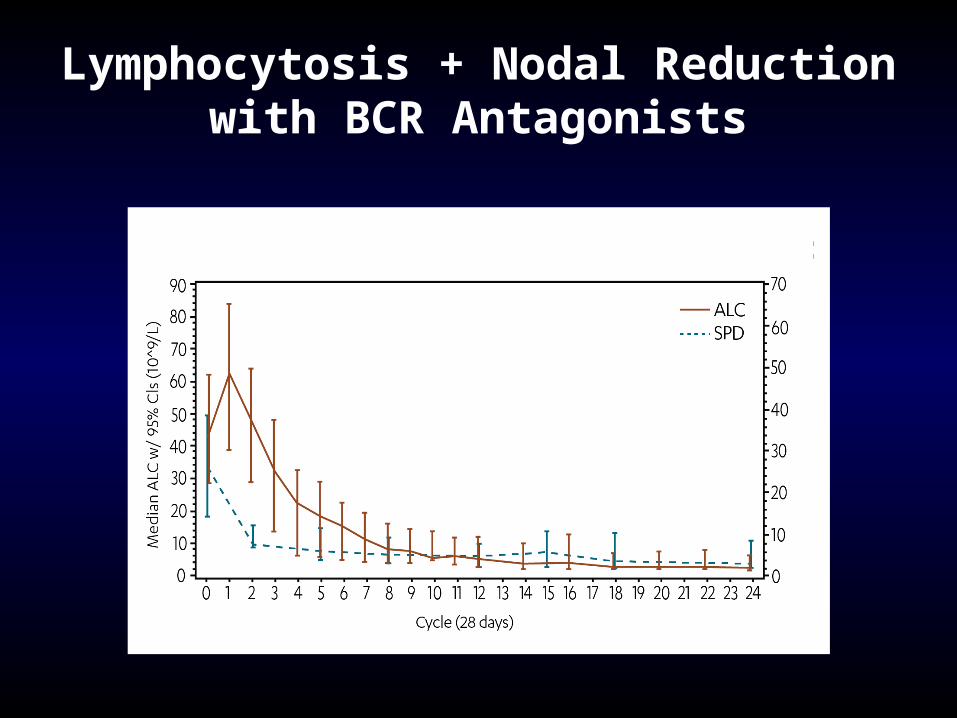
Lymphocytosis + Nodal Reductionwith BCR Antagonists
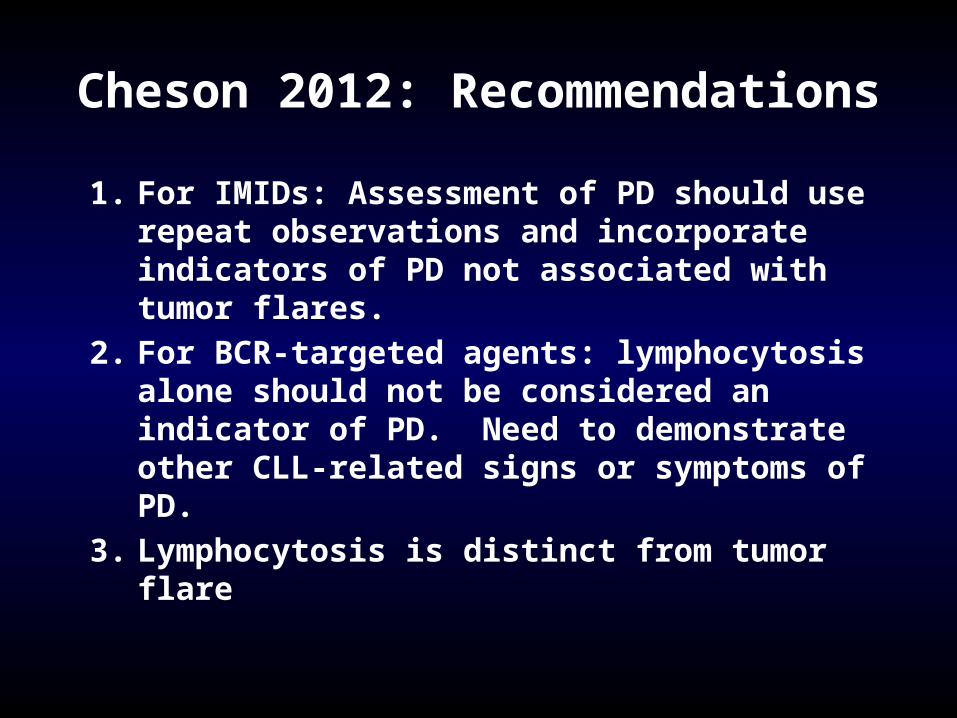
Cheson 2012: Recommendations
1. For IMIDs: Assessment of PD should use repeat observations and incorporate indicators of PD not associated with tumor flares.
2. For BCR-targeted agents: lymphocytosis alone should not be considered an indicator of PD. Need to demonstrate other CLL-related signs or symptoms of PD.
3. Lymphocytosis is distinct from tumor flare
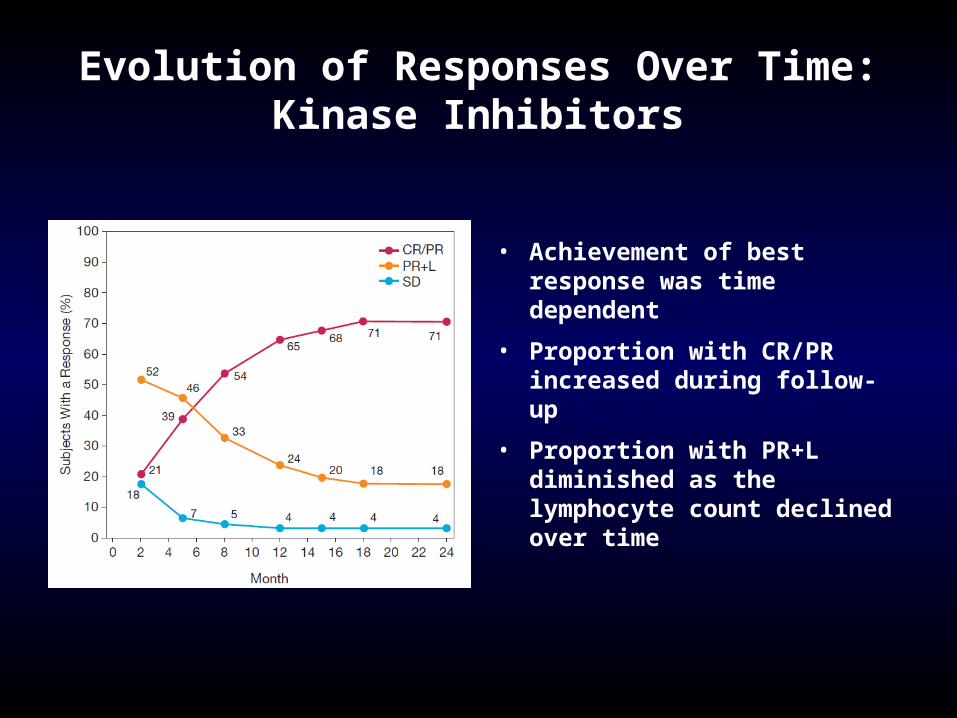
Evolution of Responses Over Time:Kinase Inhibitors
• Achievement of best response was time dependent
• Proportion with CR/PR increased during follow-up
• Proportion with PR+L diminished as the lymphocyte count declined over time
Issues with Novel Agents
• Response Criteria– Redefine clinical endpoints– Evolution of response over time
• Dosing:– No more MTD dosing– Threshold dosing– Fixed dosing / wide therapeutic window
• Re-evaluation of Prognostic Markers• Re-evaluation of MRD
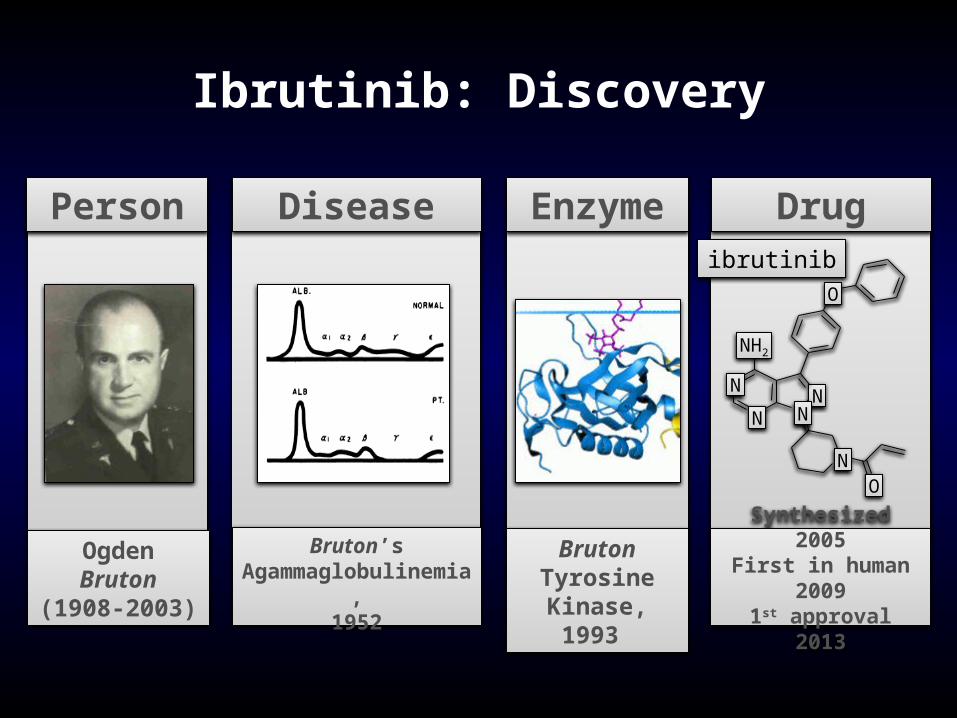
Ibrutinib: Discovery
Ogden Bruton (1908-2003)
Person
Bruton’s Agammaglobulinemia,
1952
Disease
Bruton Tyrosine
Kinase, 1993
Enzyme
Synthesized 2005First in human 2009
1st approval 2013
Drug
N
ibrutinib
NO
N
N N
NH2
O
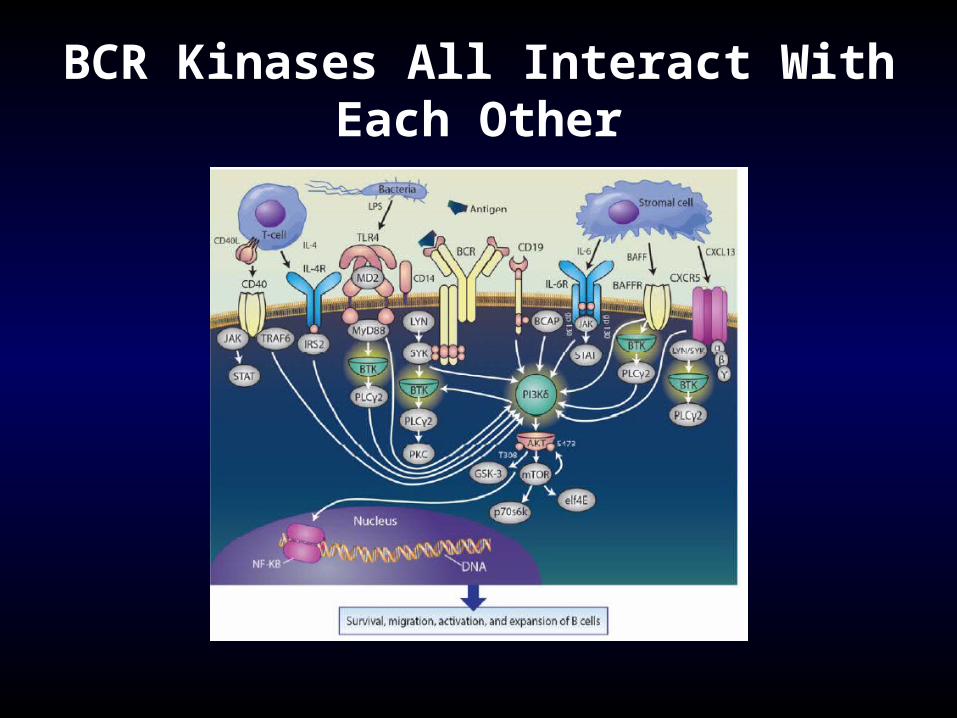
BCR Kinases All Interact With Each Other
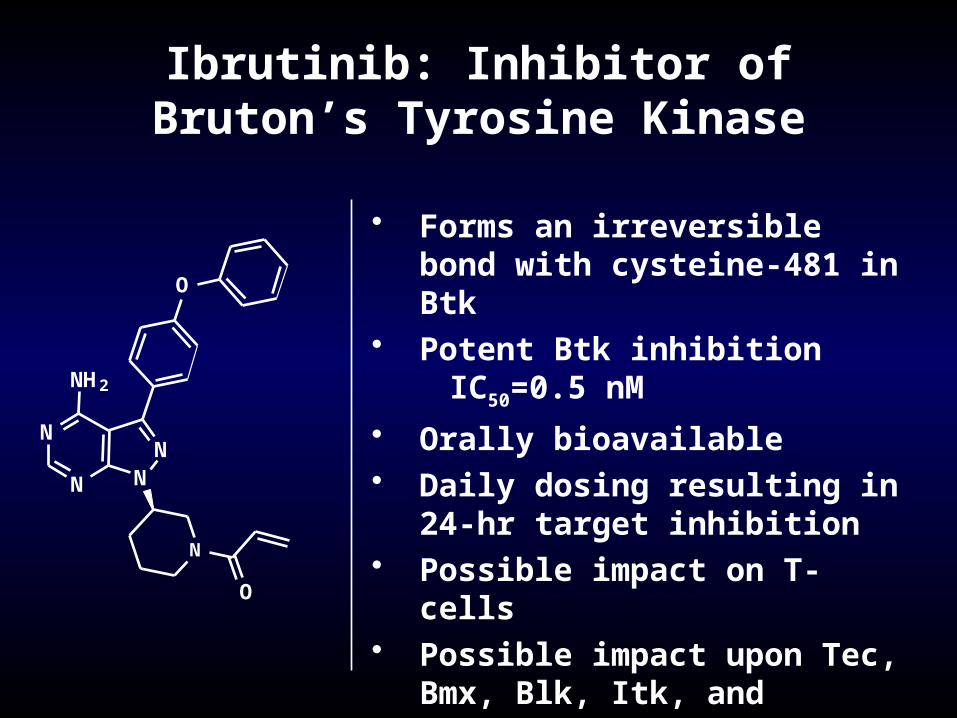
Ibrutinib: Inhibitor of Bruton’s Tyrosine Kinase
• Forms an irreversible bond with cysteine-481 in Btk
• Potent Btk inhibitionIC50=0.5 nM
• Orally bioavailable• Daily dosing resulting in 24-hr target
inhibition• Possible impact on T-cells• Possible impact upon Tec, Bmx, Blk,
Itk, and platelets
N
N
NN
NH2
O
N
O
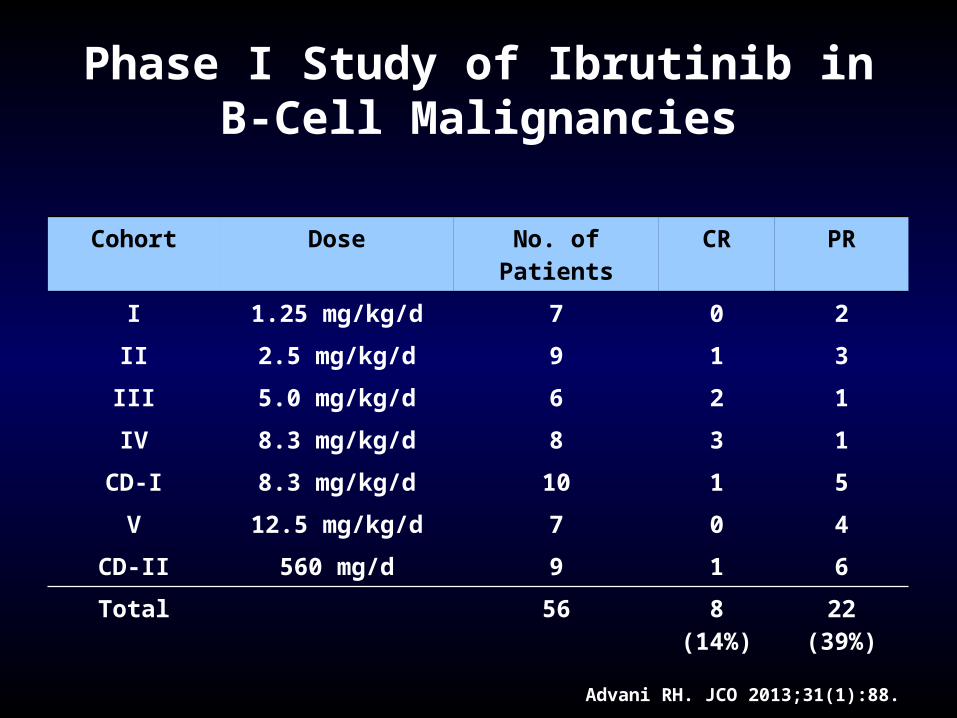
Phase I Study of Ibrutinib inB-Cell Malignancies
Advani RH. JCO 2013;31(1):88.
Cohort Dose No. of Patients CR PR
I 1.25 mg/kg/d 7 0 2
II 2.5 mg/kg/d 9 1 3
III 5.0 mg/kg/d 6 2 1
IV 8.3 mg/kg/d 8 3 1
CD-I 8.3 mg/kg/d 10 1 5
V 12.5 mg/kg/d 7 0 4
CD-II 560 mg/d 9 1 6
Total 56 8 (14%) 22 (39%)
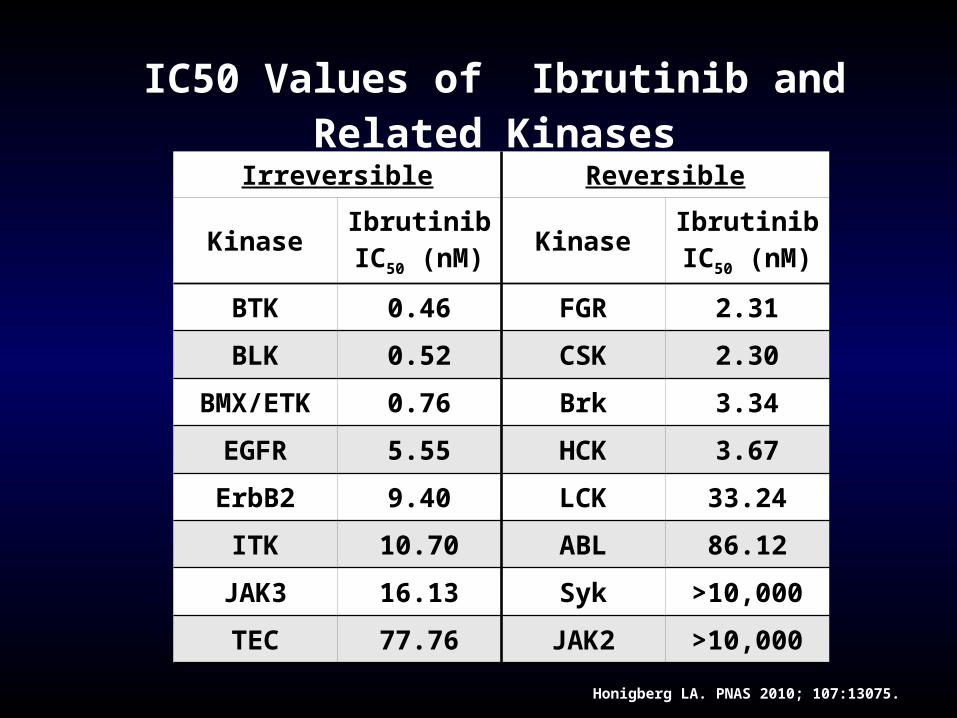
Honigberg LA. PNAS 2010; 107:13075.
IC50 Values of Ibrutinib and Related KinasesIrreversible Reversible
Kinase IbrutinibIC50 (nM) Kinase Ibrutinib
IC50 (nM)
BTK 0.46 FGR 2.31
BLK 0.52 CSK 2.30
BMX/ETK 0.76 Brk 3.34
EGFR 5.55 HCK 3.67
ErbB2 9.40 LCK 33.24
ITK 10.70 ABL 86.12
JAK3 16.13 Syk >10,000
TEC 77.76 JAK2 >10,000
0 4 8 12 16 20 24 280
10
20
30
40
50
60
70
0%
10%
20%
30%
40%
50%
60%
70%
80%
90%
100%
Plasma Conc
% Active-Site Occupancy
Time Post-dose (h)
Pla
sm
a C
on
ce
ntr
ati
on
(ng
/mL
)
BT
K A
cti
ve
-Sit
e O
cc
up
an
cy
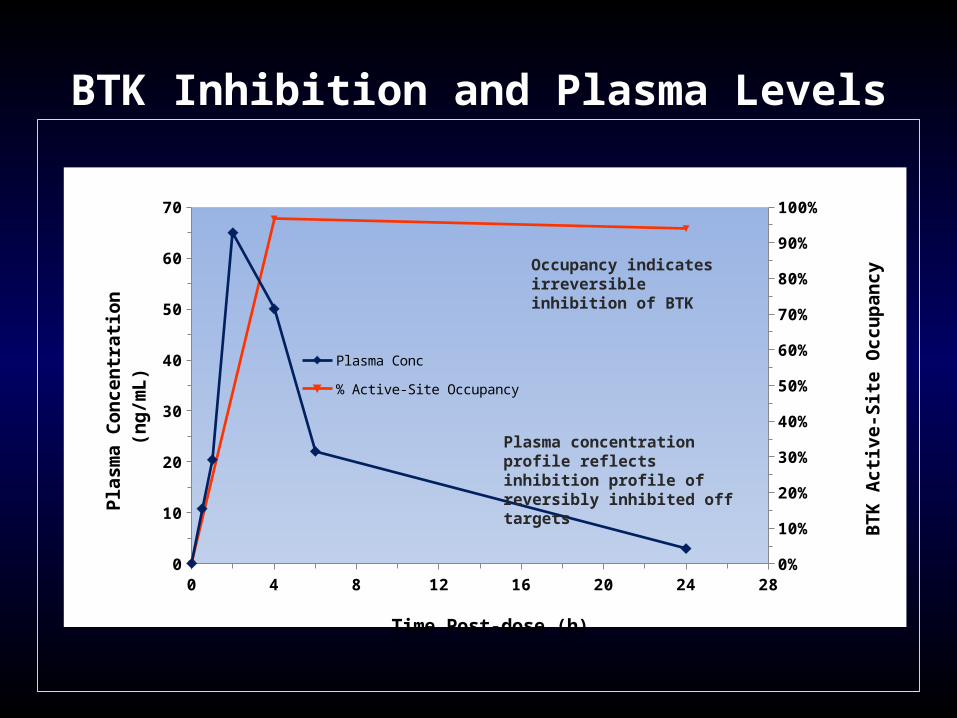
BTK Inhibition and Plasma Levels
Plasma concentration profile reflects inhibition profile of reversibly inhibited off targets
Occupancy indicates irreversible inhibition of BTK
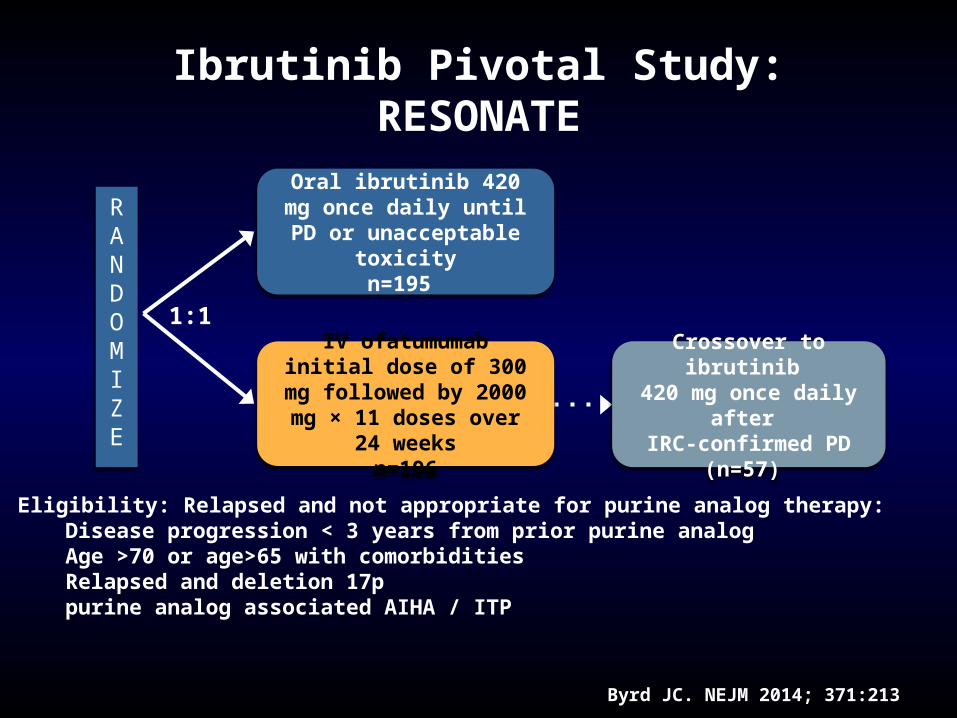
Ibrutinib Pivotal Study: RESONATE
Byrd JC. NEJM 2014; 371:213
RANDOMIZE
Oral ibrutinib 420 mg once daily until PD or unacceptable
toxicityn=195
IV ofatumumab initial dose of 300 mg followed by 2000 mg
× 11 doses over 24 weeksn=196
1:1
Crossover to ibrutinib 420 mg once daily after IRC-confirmed PD (n=57)
Eligibility: Relapsed and not appropriate for purine analog therapy:Disease progression < 3 years from prior purine analogAge >70 or age>65 with comorbiditiesRelapsed and deletion 17ppurine analog associated AIHA / ITP
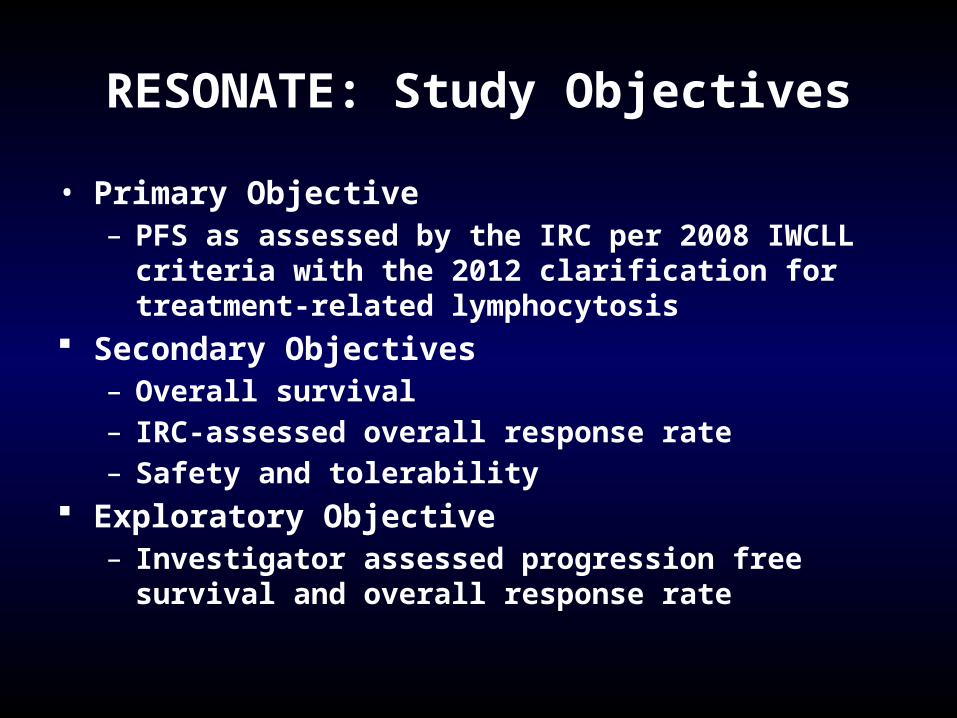
RESONATE: Study Objectives
• Primary Objective– PFS as assessed by the IRC per 2008 IWCLL criteria with the
2012 clarification for treatment-related lymphocytosis Secondary Objectives
– Overall survival – IRC-assessed overall response rate– Safety and tolerability
Exploratory Objective– Investigator assessed progression free survival and overall
response rate
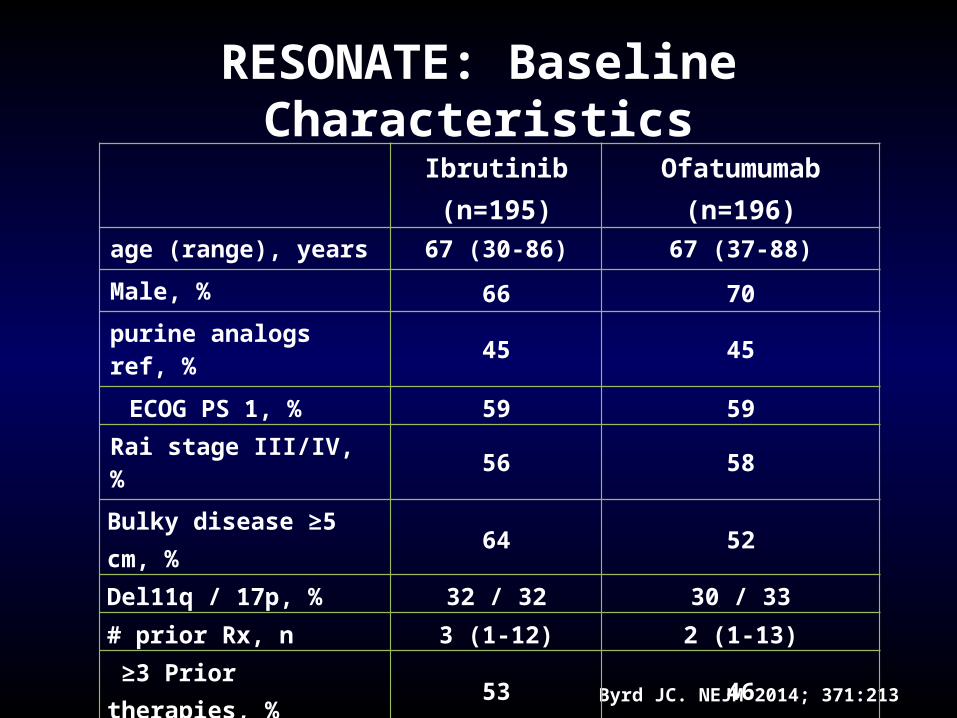
RESONATE: Baseline Characteristics
Byrd JC. NEJM 2014; 371:213
Ibrutinib (n=195) Ofatumumab (n=196)age (range), years 67 (30-86) 67 (37-88)
Male, % 66 70purine analogs ref, % 45 45
ECOG PS 1, % 59 59Rai stage III/IV, % 56 58
Bulky disease ≥5 cm, % 64 52
Del11q / 17p, % 32 / 32 30 / 33
# prior Rx, n 3 (1-12) 2 (1-13)
≥3 Prior therapies, % 53 46 Prior therapy, % Alkylator Bendamustine Purine analog Anti-CD20
93438594
88377790
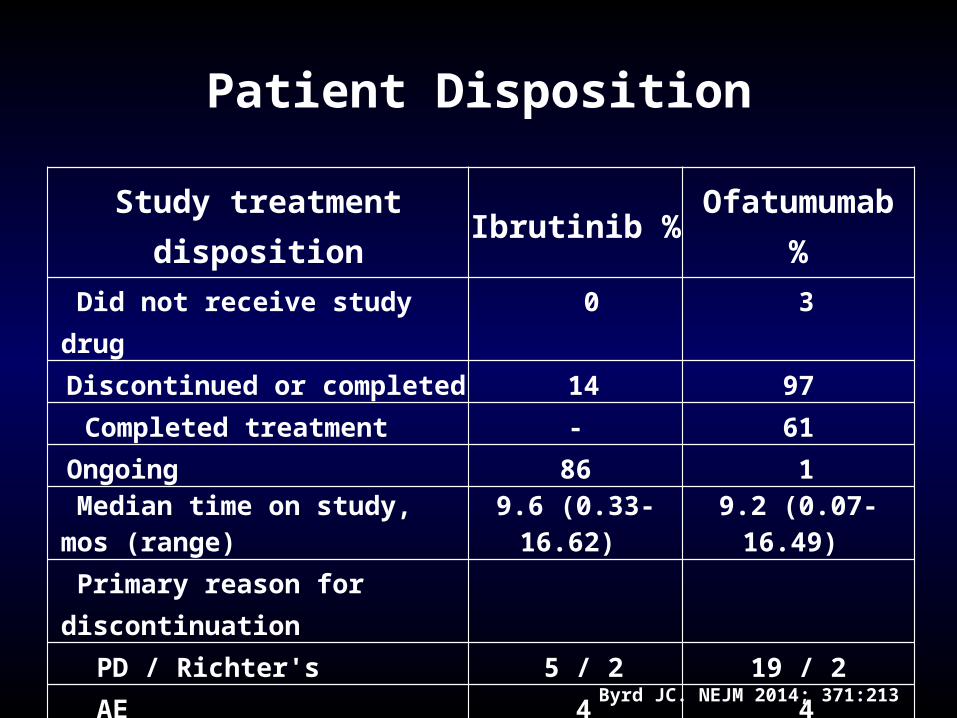
Patient Disposition
Byrd JC. NEJM 2014; 371:213
Study treatment disposition Ibrutinib % Ofatumumab % Did not receive study drug 0 3Discontinued or completed 14 97
Completed treatment - 61Ongoing 86 1 Median time on study, mos (range) 9.6 (0.33-16.62) 9.2 (0.07-16.49)
Primary reason for discontinuation PD / Richter's 5 / 2 19 / 2AE 4 4Patient withdrawal 1 3Deaths 4 5Investigator decision 1 6
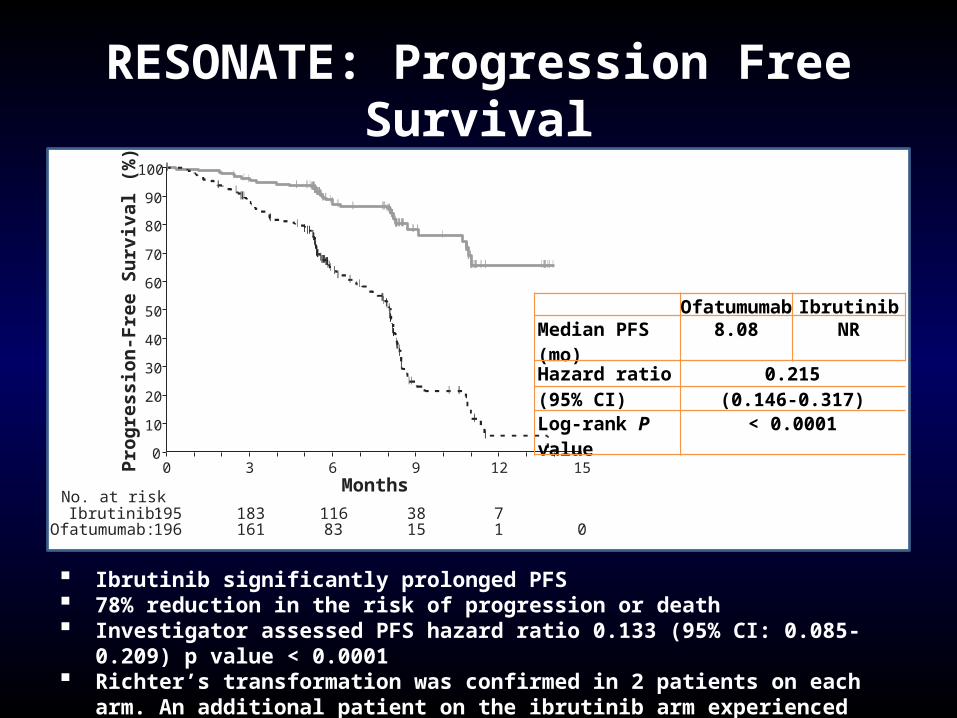
RESONATE: Progression Free Survival
0 3 6 9 12
195 183 116 38 7196 161 83 15 1 0
150
10
20
30
40
50
60
70
80
90
100
Prog
ress
ion-
Free
Sur
viva
l (%
)
No. at riskIbrutinib:
Ofatumumab:
Months
Ofatumumab IbrutinibMedian PFS (mo) 8.08 NRHazard ratio 0.215(95% CI) (0.146-0.317)Log-rank P value < 0.0001
Ibrutinib significantly prolonged PFS 78% reduction in the risk of progression or death Investigator assessed PFS hazard ratio 0.133 (95% CI: 0.085-0.209) p value < 0.0001 Richter’s transformation was confirmed in 2 patients on each arm. An additional patient on
the ibrutinib arm experienced disease transformation to prolymphocytic leukemia
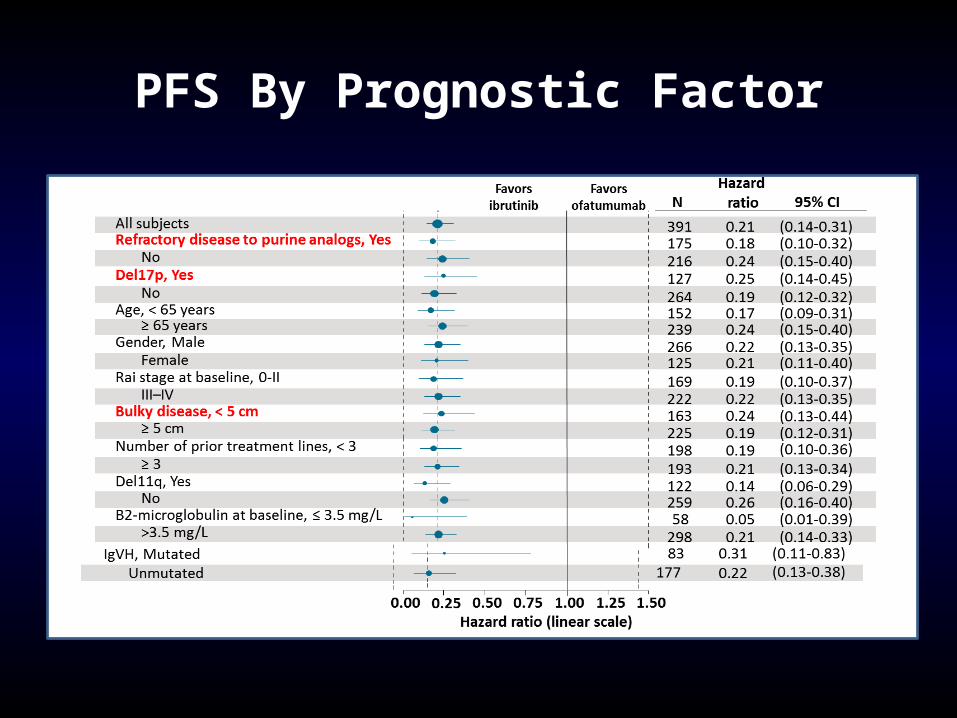
PFS By Prognostic Factor
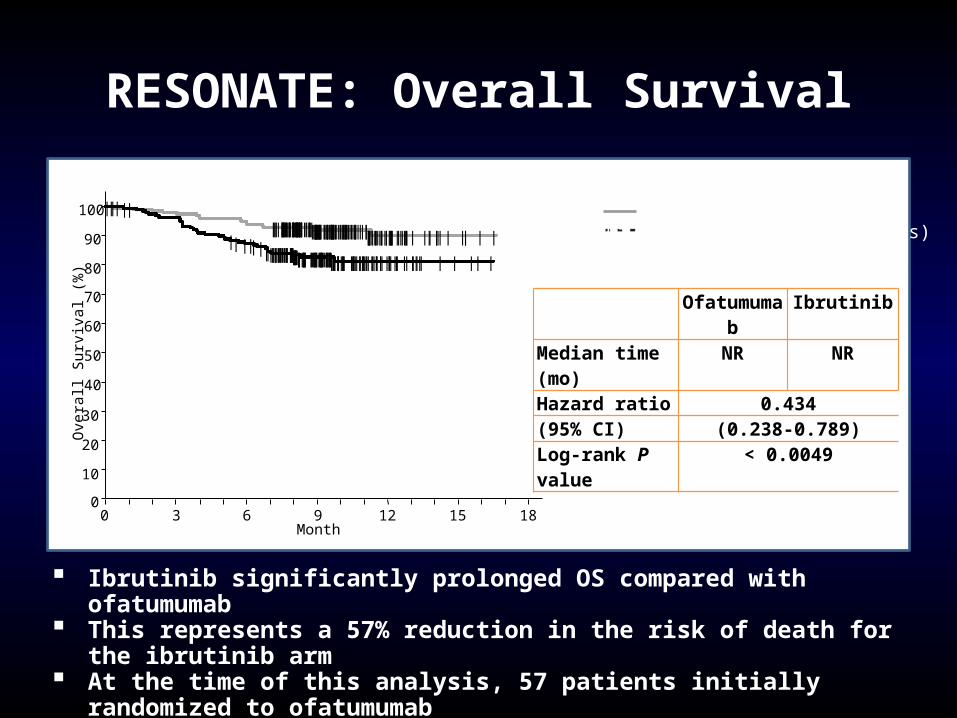
RESONATE: Overall Survival
Ofatumumab IbrutinibMedian time (mo) NR NRHazard ratio 0.434(95% CI) (0.238-0.789)Log-rank P value < 0.0049
Ibrutinib (n=195, 16 events)Ofatumumab (n=196, 33 events)
Ibrutinib significantly prolonged OS compared with ofatumumab This represents a 57% reduction in the risk of death for the ibrutinib arm At the time of this analysis, 57 patients initially randomized to ofatumumab
were crossed over to receive ibrutinib following IRC-confirmed PD
Ove
rall
Sur
viva
l (%
)
40
50
60
70
80
90
100
|
|
||||
||
|
||
|||||||||
||
||||
|
||
|
||||
|||||
|
||
|
||
|
|||
||
| ||
|
|
||
|||
|
||
||
|
|
||
|| |||
|
|
|
|
||||
|
|
|
|
||
||
|
|
||
|
||
|| ||||
||
||
||
||
|
||
|
|
|
|
|
|
||
||
||
||
|
|||
|
||
|||||
|||||
|| ||
|
||
|
|
|
| |
|
||
|
||
|||
|||
|
|||||
||
|
|
||
||
|
|
||
|
||
|
|
||
||
|
||
||
|
|
|
|
|
|
||
|
|| | |
|
|
||
|||||| |||
| |
|| |
|
|
| |
|
| | |
||
|
||
|
|
|
||||
||
|
|
|
|
||
|| ||
|
|| |||
|
| |
|
|
|| ||
|
|
||
||
|
|| |
|||
|||
|
|
|
| ||||
|||
||
|
||
|
||
||
||
|||
|
|
||
|
|||
|||
|
|
||||
|
||
0
10
20
30
0 3 6 9 12 15 18Month
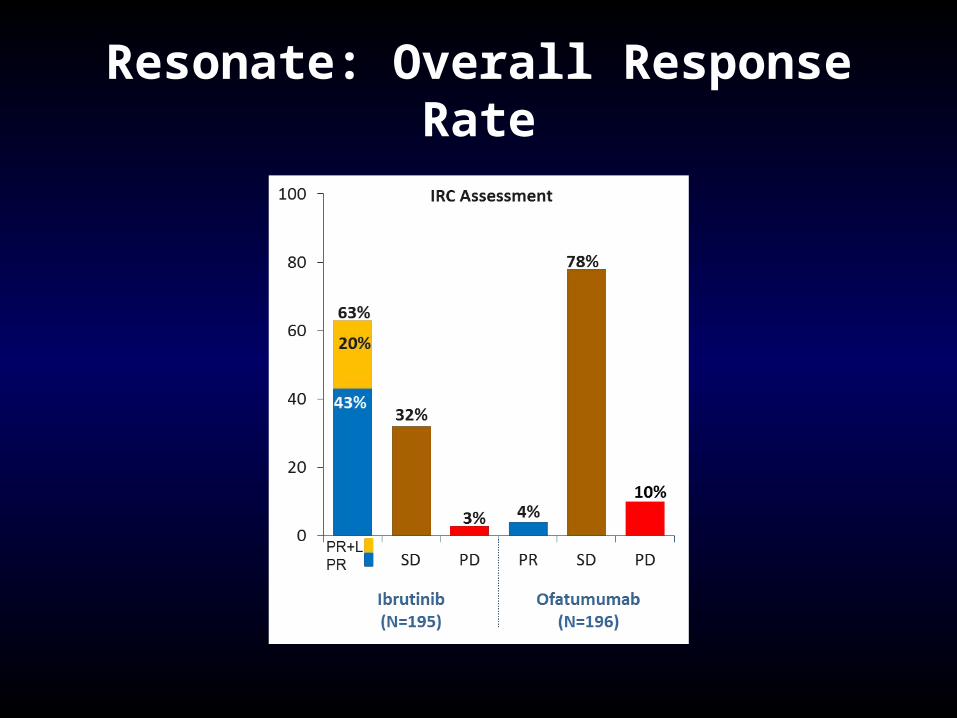
Resonate: Overall Response Rate
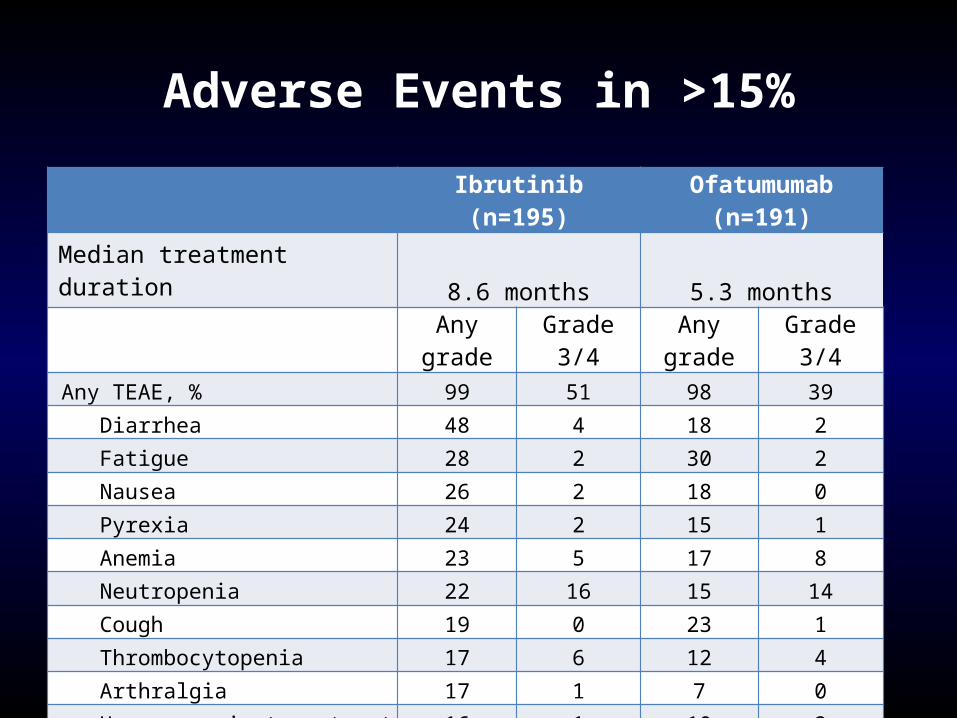
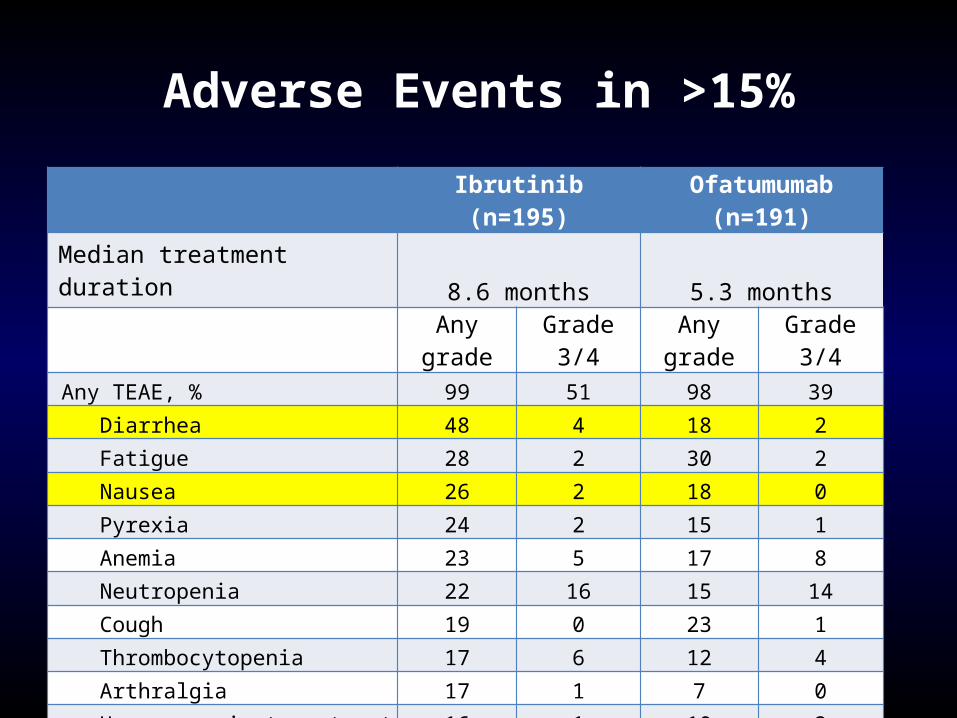
Adverse Events in >15%
Ibrutinib (n=195) Ofatumumab (n=191)Median treatment duration 8.6 months 5.3 months
Any grade Grade 3/4 Any grade Grade 3/4 Any TEAE, % 99 51 98 39 Diarrhea 48 4 18 2 Fatigue 28 2 30 2 Nausea 26 2 18 0 Pyrexia 24 2 15 1 Anemia 23 5 17 8 Neutropenia 22 16 15 14 Cough 19 0 23 1 Thrombocytopenia 17 6 12 4 Arthralgia 17 1 7 0 Upper respiratory tract infection 16 1 10 2 Constipation 15 0 9 0
Infusion-related reaction 0 0 28 3
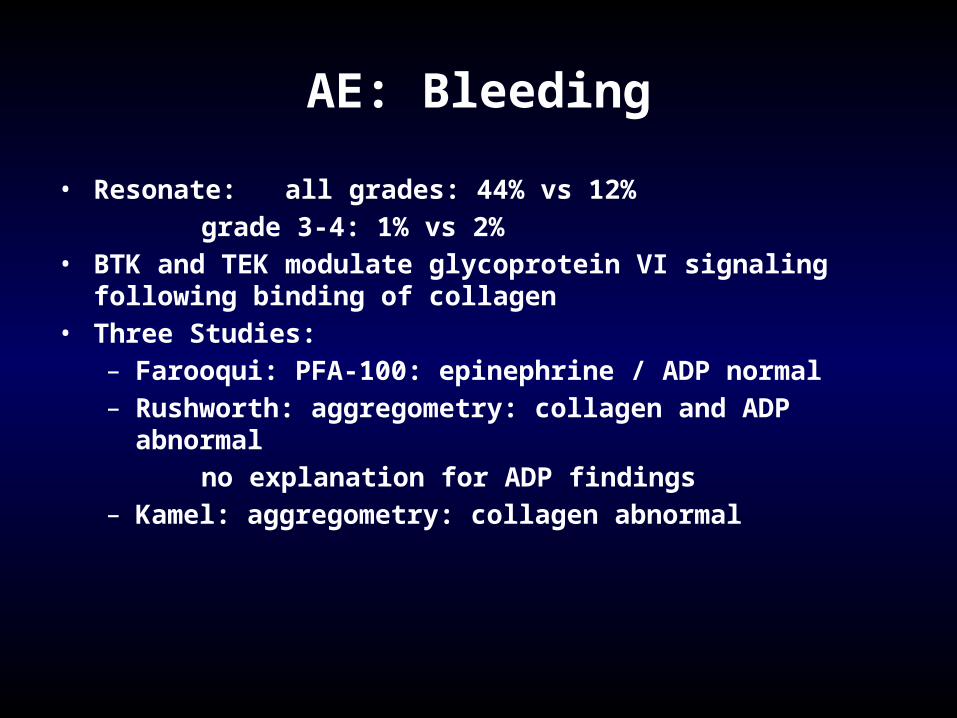
AE: Bleeding
• Resonate: all grades: 44% vs 12%
grade 3-4: 1% vs 2%• BTK and TEK modulate glycoprotein VI signaling following
binding of collagen• Three Studies:
– Farooqui: PFA-100: epinephrine / ADP normal– Rushworth: aggregometry: collagen and ADP abnormal
no explanation for ADP findings– Kamel: aggregometry: collagen abnormal
AE: Diarrhea
• Possibily mediated by EGFR inhibition• Reversible• Only symptomatic with food in GI tract
• Take medication prior to bedtime
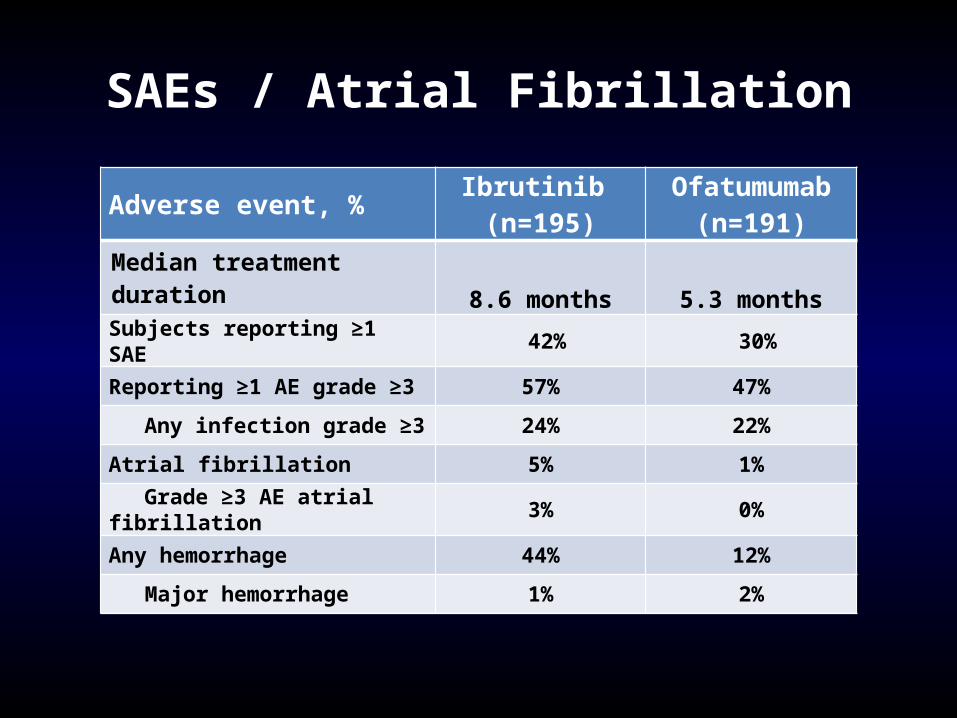
SAEs / Atrial Fibrillation
Adverse event, % Ibrutinib (n=195)
Ofatumumab (n=191)
Median treatment duration 8.6 months 5.3 monthsSubjects reporting ≥1 SAE 42% 30%
Reporting ≥1 AE grade ≥3 57% 47%
Any infection grade ≥3 24% 22%
Atrial fibrillation 5% 1%
Grade ≥3 AE atrial fibrillation 3% 0%
Any hemorrhage 44% 12%
Major hemorrhage 1% 2%
Conclusion
• Ibrutinib initially approved based upon phase II data for relapsed CLL patients who have received at least one prior therapy
• Based upon the RESONATE data, ibrutinib’s approval updated to include deletion 17p at any line of therapy
• Phase III data provided new insights into adverse events: atrial fibrillation
• Responses will evolve over time: STAY TUNED!