Embed Size (px)
Citation preview

INACTIVE AND ABANDONEDMINE LANDS—
Queen Seal Mine,Cedar Canyon Mining District,Stevens County, Washington
by Fritz E. Wolff,Donald T. McKay, Jr.,and David K. Norman
WASHINGTON
DIVISION OF GEOLOGY
AND EARTH RESOURCES
Information Circular 104March 2007
NA
TU
RA
LR
ES
OU
RC
ES
Stevens Countysitelocation

INACTIVE AND ABANDONEDMINE LANDS—
Queen Seal Mine,Cedar Canyon Mining District,Stevens County, Washington
by Fritz E. Wolff,Donald T. McKay, Jr.,and David K. Norman
WASHINGTON
DIVISION OF GEOLOGY
AND EARTH RESOURCES
Information Circular 104March 2007

DISCLAIMER
Neither the State of Washington, nor any agency thereof, nor any of their em-ployees, makes any warranty, express or implied, or assumes any legal liabilityor responsibility for the accuracy, completeness, or usefulness of any informa-tion, apparatus, product, or process disclosed, or represents that its use wouldnot infringe privately owned rights. Reference herein to any specific commercialproduct, process, or service by trade name, trademark, manufacturer, or other-wise, does not necessarily constitute or imply its endorsement, recommendation,or favoring by the State of Washington or any agency thereof. The views andopinions of authors expressed herein do not necessarily state or reflect those ofthe State of Washington or any agency thereof.
WASHINGTON DEPARTMENT OF NATURAL RESOURCES
Doug Sutherland—Commissioner of Public Lands
DIVISION OF GEOLOGY AND EARTH RESOURCES
Ron Teissere—State GeologistDavid K. Norman—Assistant State GeologistJohn P. Bromley—Assistant State Geologist
Washington Department of Natural ResourcesDivision of Geology and Earth ResourcesPO Box 47007Olympia, WA 98504-7007Phone: 360-902-1450Fax: 360-902-1785E-mail: [email protected]: http://www.dnr.wa.gov/geology/
Published in the United States of America
iv

Contents
Introduction . . . . . . . . . . . . . . . . . . . . . . . . . . . . . . . . . . . . . . . . . . . . . 1
Summary . . . . . . . . . . . . . . . . . . . . . . . . . . . . . . . . . . . . . . . . . . . . . . 1
Ownership . . . . . . . . . . . . . . . . . . . . . . . . . . . . . . . . . . . . . . . . . . . . . 2
History . . . . . . . . . . . . . . . . . . . . . . . . . . . . . . . . . . . . . . . . . . . . . . . 3
Geologic setting . . . . . . . . . . . . . . . . . . . . . . . . . . . . . . . . . . . . . . . . . . 3
Openings . . . . . . . . . . . . . . . . . . . . . . . . . . . . . . . . . . . . . . . . . . . . . . 4
Materials and structures . . . . . . . . . . . . . . . . . . . . . . . . . . . . . . . . . . . . . . 4
Water . . . . . . . . . . . . . . . . . . . . . . . . . . . . . . . . . . . . . . . . . . . . . . . . 5
Milling operations . . . . . . . . . . . . . . . . . . . . . . . . . . . . . . . . . . . . . . . . . 5
Waste rock dumps and tailings . . . . . . . . . . . . . . . . . . . . . . . . . . . . . . . . . . . 5
General information . . . . . . . . . . . . . . . . . . . . . . . . . . . . . . . . . . . . . . . . 5
Mine operations data . . . . . . . . . . . . . . . . . . . . . . . . . . . . . . . . . . . . . . . . 6
Physical attributes . . . . . . . . . . . . . . . . . . . . . . . . . . . . . . . . . . . . . . . . . 6
Vegetation . . . . . . . . . . . . . . . . . . . . . . . . . . . . . . . . . . . . . . . . . . . . . 6
Wildlife . . . . . . . . . . . . . . . . . . . . . . . . . . . . . . . . . . . . . . . . . . . . . . . 6
Water quality . . . . . . . . . . . . . . . . . . . . . . . . . . . . . . . . . . . . . . . . . . . . 6
Acknowledgments . . . . . . . . . . . . . . . . . . . . . . . . . . . . . . . . . . . . . . . . . 6
References cited . . . . . . . . . . . . . . . . . . . . . . . . . . . . . . . . . . . . . . . . . . 7
Appendix A. Methods and field equipment . . . . . . . . . . . . . . . . . . . . . . . . . . . . 8
Appendix B. Water quality standards for hardness dependent metals . . . . . . . . . . . . . . 9
Appendix C. Mining companies associated with the Queen Seal mine . . . . . . . . . . . . . 10
FIGURES
Figure 1. Map showing the location of the Queen Seal mine in Stevens Countyand an air photo of the mine site . . . . . . . . . . . . . . . . . . . . . . . . . . . . 1
Figure 2. Photo showing Seal shaft location . . . . . . . . . . . . . . . . . . . . . . . . . . . 2
Figure 3. Photo showing waste rock dumps at West adit and Seal shaft . . . . . . . . . . . . . 2
Figure 4. Photo showing North adit portal . . . . . . . . . . . . . . . . . . . . . . . . . . . . 3
Figure 5. Photo showing area surrounding North adit portal . . . . . . . . . . . . . . . . . . . 3
Figure 6. Photo showing trailer-mounted circa-1970 mill equipment with sodium carbonate . . 4
Figure 7. Photo showing Queen Seal Mining Company’s 1937 mill building . . . . . . . . . . 4
Figure 8. Photo showing sump located near the South adit portal . . . . . . . . . . . . . . . . 5
TABLES
Table 1. Location and map information . . . . . . . . . . . . . . . . . . . . . . . . . . . . . 5
Table 2. Mine features . . . . . . . . . . . . . . . . . . . . . . . . . . . . . . . . . . . . . . 6
Table 3. Soil analysis . . . . . . . . . . . . . . . . . . . . . . . . . . . . . . . . . . . . . . . 6
Table 4. Soil quality standards for unrestricted land use. . . . . . . . . . . . . . . . . . . . 6
Table 5. Surface water field data . . . . . . . . . . . . . . . . . . . . . . . . . . . . . . . . 6
Table 6. Surface water analysis and applicableWashington State Water Quality Standards . . . . . . . . . . . . . . . . . . . . . . 7
v

vi
Inactive and Abandoned Mine Lands—Queen Seal Mine, Cedar Canyon Mining District,Stevens County, Washington
Fritz E. Wolff, Donald T. McKay, Jr., and David K. Norman
Washington Division of Geology and Earth Resources
PO Box 47007; Olympia, WA 98504-7007
INTRODUCTION
The Washington State Department of Natural Resources (DNR),Division of Geology and Earth Resources (DGER), is building adatabase and geographic information system (GIS) coverage ofmajor mines in the state. Site characterization was initiated in1999 (Norman, 2000). Work is funded through interagencygrants from the U.S. Forest Service (USFS), Region 6. Otheragencies sharing in the project are the U.S. Bureau of Land Man-agement (BLM), the U.S. Environmental Protection Agency(EPA), and the Washington Department of Ecology (DOE).
More than 3800 mineral properties have been located in thestate during the last 100 years (Huntting, 1956). Many are unde-veloped prospects of little economic importance. Therefore,in considering the population to include in the Inactive andAbandoned Mine Lands (IAML) inventory, we have identifiedapproximately 60 sites that meet one of the following criteria: (a)more than 2000 feet of underground development, (b) more than10,000 tons of production, (c) location of a known mill site orsmelter. This subset of sites includes only metal mines no longerin operation.
We have chosen to use the term inactive in the project’s titlein addition to the term abandoned because it more precisely de-scribes the land-use situation regarding mining and avoids anypolitical or legal implications of surrendering an interest to aproperty that may re-open with changes in economics, technol-ogy, or commodity importance.
The IAML database focuses onphysical characteristics and hazards(openings, structures, materials, andwaste) and water-related issues (acidmine drainage and/or metals trans-port). Accurate location, currentownership, and land status informa-tion are also included. Acquisition ofthis information is a critical first stepin any systematic approach to deter-mine if remedial or reclamationactivities are warranted at a particularmine. Reports such as this one pro-vide documentation on mines orgroups of mines within specific min-ing districts or counties. The IAMLdatabase may be viewed by contact-ing Fritz Wolff (360-902-1468).IAML reports are posted online athttp://www.dnr.wa.gov/geology/pubs/.
SUMMARY
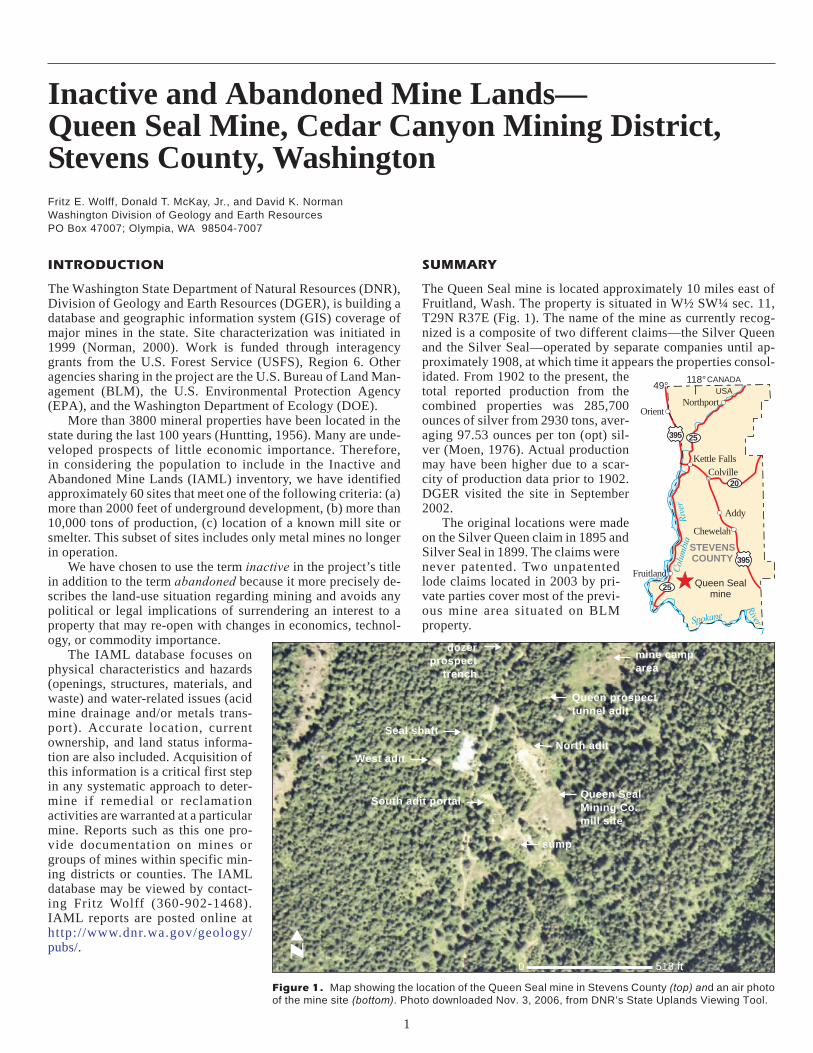
The Queen Seal mine is located approximately 10 miles east ofFruitland, Wash. The property is situated in W½ SW¼ sec. 11,T29N R37E (Fig. 1). The name of the mine as currently recog-nized is a composite of two different claims—the Silver Queenand the Silver Seal—operated by separate companies until ap-proximately 1908, at which time it appears the properties consol-idated. From 1902 to the present, thetotal reported production from thecombined properties was 285,700ounces of silver from 2930 tons, aver-aging 97.53 ounces per ton (opt) sil-ver (Moen, 1976). Actual productionmay have been higher due to a scar-city of production data prior to 1902.DGER visited the site in September2002.
The original locations were madeon the Silver Queen claim in 1895 andSilver Seal in 1899. The claims werenever patented. Two unpatentedlode claims located in 2003 by pri-vate parties cover most of the previ-ous mine area situated on BLMproperty.
1
Figure 1. Map showing the location of the Queen Seal mine in Stevens County (top) and an air photo
of the mine site (bottom). Photo downloaded Nov. 3, 2006, from DNR’s State Uplands Viewing Tool.
dozer
prospect
trench
West adit
North adit
Queen Seal
Mining Co.
mill site
sump
mine camp
area
�0 518 ft
Seal shaft
South adit portal
Queen prospect
tunnel adit
20
Spokane
River
Col
umbi
aR
iver
Chewelah
Addy
Colville
Kettle Falls
Northport
118°49°
STEVENSCOUNTY
CANADA
USA
25
Queen Sealmine
25
Fruitland
395
395
Orient
At least eight mining companies operated themine in widely spaced periods of activity overthe past century. The last production for all prac-tical purposes occurred prior to World War II inthe period from 1937 to 1940. The beginning ofeach production era required significant renova-tion of the drifts, adits, and shafts after beingflooded during the intervening years.
Ore occurs as lenses of high-grade silver min-eralization in a quartz fissure vein, 1 to 3 feetthick, striking N25°–35°E and dipping 75°NW.The mineralization includes silver sulfides, sil-ver chloride, native silver, galena, sphalerite,tetrahedrite, and minor amounts of malachite andazurite. One smelter return assayed 0.15 percentWO3.
The deposit occurs in the Deer Trail group ofPrecambrian metasediments, consisting of inter-bedded quartzite, argillite, dolomite, and lime-stone. It is probably genetically related to the al-most identical mineralization at the Deer Trailmine by the right-lateral displacement of a post-mineralization fault. The Loon Lake graniticbatholith crops out ¼ mile on either side of theQueen Seal mine and is considered to be thesource for ore deposition.
Water discharged from a 6-inch pipe into asump southeast of the mine dump at the rate ofabout 5 gallons per minute (gpm) in 2002. A sam-ple from this source exceeded standards for cad-mium and lead shown in WAC 173-201A (sur-face water) and for lead shown in WAC 246-290(ground water). We observed no water discharg-ing anywhere else on the property.
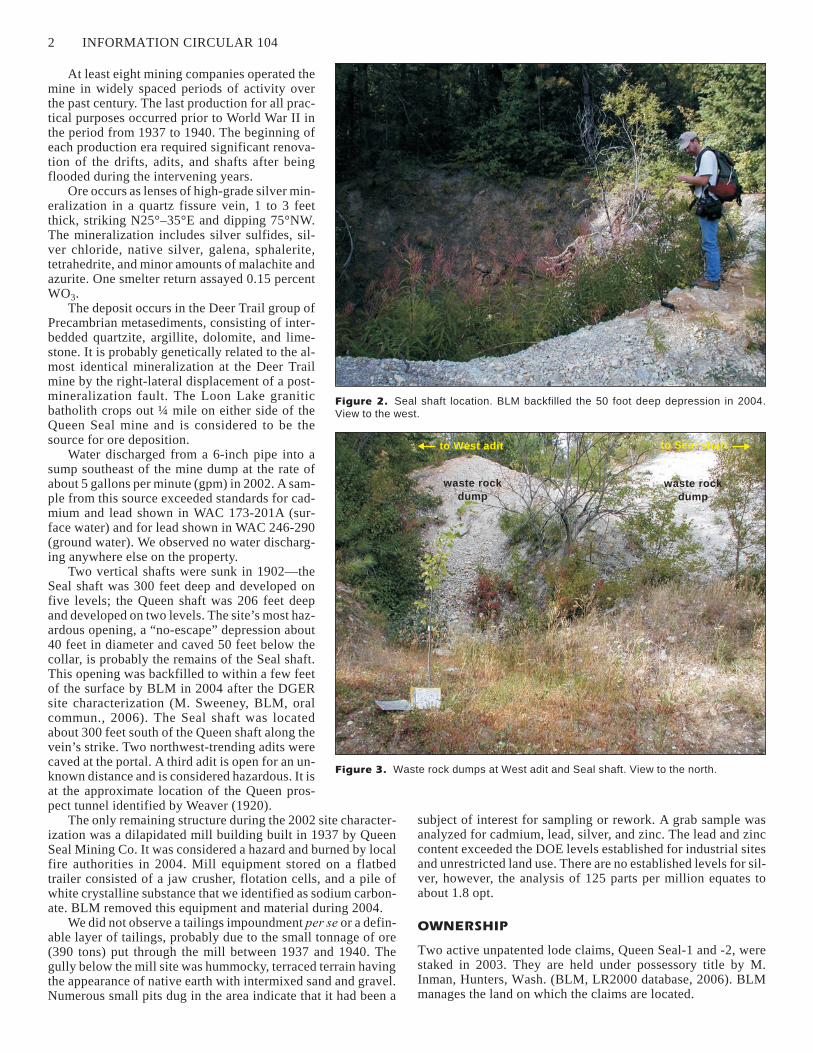
Two vertical shafts were sunk in 1902—theSeal shaft was 300 feet deep and developed onfive levels; the Queen shaft was 206 feet deepand developed on two levels. The site’s most haz-ardous opening, a “no-escape” depression about40 feet in diameter and caved 50 feet below thecollar, is probably the remains of the Seal shaft.This opening was backfilled to within a few feetof the surface by BLM in 2004 after the DGERsite characterization (M. Sweeney, BLM, oralcommun., 2006). The Seal shaft was locatedabout 300 feet south of the Queen shaft along thevein’s strike. Two northwest-trending adits werecaved at the portal. A third adit is open for an un-known distance and is considered hazardous. It isat the approximate location of the Queen pros-pect tunnel identified by Weaver (1920).
The only remaining structure during the 2002 site character-ization was a dilapidated mill building built in 1937 by QueenSeal Mining Co. It was considered a hazard and burned by localfire authorities in 2004. Mill equipment stored on a flatbedtrailer consisted of a jaw crusher, flotation cells, and a pile ofwhite crystalline substance that we identified as sodium carbon-ate. BLM removed this equipment and material during 2004.
We did not observe a tailings impoundment per se or a defin-able layer of tailings, probably due to the small tonnage of ore(390 tons) put through the mill between 1937 and 1940. Thegully below the mill site was hummocky, terraced terrain havingthe appearance of native earth with intermixed sand and gravel.Numerous small pits dug in the area indicate that it had been a
subject of interest for sampling or rework. A grab sample wasanalyzed for cadmium, lead, silver, and zinc. The lead and zinccontent exceeded the DOE levels established for industrial sitesand unrestricted land use. There are no established levels for sil-ver, however, the analysis of 125 parts per million equates toabout 1.8 opt.
OWNERSHIP
Two active unpatented lode claims, Queen Seal-1 and -2, werestaked in 2003. They are held under possessory title by M.Inman, Hunters, Wash. (BLM, LR2000 database, 2006). BLMmanages the land on which the claims are located.
2 INFORMATION CIRCULAR 104
Figure 2. Seal shaft location. BLM backfilled the 50 foot deep depression in 2004.
View to the west.
Figure 3. Waste rock dumps at West adit and Seal shaft. View to the north.
to West adit to Seal shaft
waste rock
dump
waste rock
dump

HISTORY
The Van Horn brothers and W. Johnson discovered high-gradesilver mineralization at the Queen Seal site in 1895, shortly afterthe nearby Deer Trail claims were staked. Fulkerson and King-ston (1958) attribute most production from the Silver Seal Frac-tion claim to the Silver Seal Mining Co. and most productionfrom the Queen claim to the Silver Basin Mining Co. It is un-clear if these two companies combined operating agreements.As discussed below and in Appendix C, at least eight companieshave been involved in the property since discovery to presenttime with various permutations of the name(s). The registrationin 1908 of the Silver Seal and Queen Consolidated Mining Co.may mark the date at which the mines were operated as oneentity.
Fulkerson and Kingston (1958) reported 1075 tons of oreaveraging 210 opt silver from production at the Silver Seal Frac-tion between 1902 and 1908. No further production is reportedfrom this claim until 1928 and 1929, at which time CommodoreMines Development Co. Inc. shipped a total of 65 tons of rawore. The mine apparently made a considerable quantity of water,as repeated flooding is a recurrent theme in the literature:Weaver (1920) stated, “The other levels [of the Seal shaft] wereinaccessible at the time of the examination as the shaft wasflooded up to the tunnel level.” In December 1937, Queen SealMining reported, “The Seal shaft has been dewatered to the thirdlevel,” and that water in the shaft had regained a point below thesecond level four months later (Mining Journal, Dec. 30, 1937,and April 15, 1938). In June 1938, an article reported that theSeal shaft had been dewatered to the fifth level (Mining Journal,June 30, 1938). A. W. Tyler, President of Queen Seal Mining, re-ported that the work of reopening the mine many years after ithad flooded involved transporting “. . . 900 ore cars of muckfrom 1500 feet of drifts” and clearing andretimbering parts of the shaft. He stated that millfeed at the time averaged 47.6 opt silver (Spo-kane Daily Chronicle, April 1938, day un-known).
Early production from the Queen claim in theyears leading up to 1903 is unreported in USBMMinerals Yearbook statistics. However, Norman(1918) reported that by 1917, Silver Basin hadshipped an estimated 7500 tons of raw ore, andthat the physical plant included steam power forrunning a 3-ton hoist, air compressor, and pump.Fulkerson and Kingston (1958) reported produc-tion from 1917 to 1928 of only 367 tons of oreyielding 18,305 ounces silver at an average gradeof 50 opt silver. In 1935, the Queen Seal MiningCo. acquired the consolidated properties andconstructed the first mill—a 40 ton per day (tpd)flotation and gravity operation. The companymilled 390 tons of ore between 1937 and 1938yielding 5500 ounces of silver. In addition to sil-ver, the concentrate averaged about 6 percentlead, 2 percent copper, and 0.15 percent tungstenoxide (Northwest Mining, Feb. 3, 1938).
The price of silver averaged about $1.00 per ounce duringthe mines’ production years up to 1940, making the combinedvalue of production a minimum of ~$285,000, and it may rangeupwards of $500,000, depending on the accuracy of productionfigures. Moen (1976) reported a small-scale mining operation of“less than 100 tons” at the combined properties in 1960. Aside
from the 2003 claim relocations, exploration and other activityat the Queen Seal since 1976 is unknown.
GEOLOGIC SETTING
The ore deposit at the Queen Seal mine is similar in many waysto hydrothermal mineralization at the Deer Trail mine and may
IAML—QUEEN SEAL MINE, STEVENS COUNTY, WASHINGTON 3
Figure 4. North adit portal. View to the northwest.
Figure 5. Area surrounding North adit portal. View to the northwest.
North adit
portal
tom
ill site
Queen Prospect
tunnel (hidden)

be genetically related to it due to the right-lateraldisplacement of the post-mineralization DeerTrail fault (Fluet, 1985). Ore occurs as high-grade silver mineralization in a quartz fissurevein 1 to 3 feet thick striking N25°–35°E and dip-ping 75°NW. Reported ore minerals are: argen-tite, cerargyrite, native silver, galena, sphalerite,tetrahedrite, and minor amounts of malachite andazurite (Moen, 1976).
The host formation is the Deer Trail group ofPrecambrian Belt Supergroup metasediments.Locally, the deposit is located in the Edna Dolo-mite, consisting of interbedded quartzite,argillite, dolomite, and limestone (Fluet, 1985).Weaver (1920) reported that the vein’s hangingwall was persistent and very clearly defined inthe dolomite, but was less well defined and ex-hibited less mineralization where it wanderedeast into contact with argillite. The dolomitewithin the mine is locally brecciated and silici-fied (Jenkins, 1924). Granitic rocks of the LoonLake batholith crop out ¼ mile east and west ofthe mine, undoubtedly underlie the metasedi-ments, and are considered the source for preciousmetal deposition.
OPENINGS
Most descriptions of the property are consistent in reporting twovertical shafts. The depth of the Seal shaft is 300 feet and that ofthe Queen shaft is 206 feet (Weaver, 1920). A 40-foot-wide and50-foot-deep depression with vertical walls (Fig. 2) is the prob-able location of the Seal shaft because of the significant wasterock dump (Fig. 3) and reported development on five levels(DGER mine file). The bottom was bridged-over with wallslough. This opening was partially backfilled by BLM in 2004after the DGER site characterization (M. Sweeney, BLM, oralcommun., 2006). DGER was unable to locate the Queen shaft,which Weaver reported as situated 500 feet north along strikefrom the Seal shaft. The only reported development in theQueen shaft was one station cut on the 75-foot level. Both shaftsare connected at the 75-foot level by a crosscut.
Four adits totaling about 1400 feet, according to Moen’s es-timate, have been driven to intersect the vein at various points(Moen, 1976). We found three primary adits. The west adit is lo-cated about 200 feet southwest of the Seal shaft. It bears duewest into the dolomite and has a large adjacent dump (Fig. 3).The south and north adits shown in Figure 1 are approximately75 feet lower in elevation than the shaft collar and probablyserved as haulage ways and drainage tunnels. The north aditbears N45°W at the end of a long surface cut leading to the millsite (Figs. 4 and 5). Drifts and raises account for an additional1500 feet of development (Moen, 1976). One additional tunneldiscovered near the former mine camp area may be the “Queenprospect tunnel” identified by Weaver (1920) as strikingN45°W for 125 feet. Conditions inside are unknown but the por-tal is open and should not be entered.
MATERIALS AND STRUCTURES
The original bunkhouse, office, blacksmith shop, steam powerplant, and accessory buildings have been destroyed. All theequipment has been removed. In September 2002, a jaw crusherand flotation cells on a semi-truck trailer were discovered in a
collapsed temporary shelter, probably dating to the 1960s (Fig.6). We identified the white granular substance as sodium car-bonate. This equipment was removed in a 2004 BLM action (M.
4 INFORMATION CIRCULAR 104
Figure 6. Trailer-mounted circa-1970 mill equipment. The white crystalline material is
sodium carbonate. (BLM removed this in 2004.)
Figure 7. Queen Seal Mining Company’s 1937 mill building. The con-
crete foundations are out of view in back of the structure. View to the
south. The structure was burned in 2004 remediation action.

Sweeney, BLM, oral commun., 2006). QueenSeal Mining’s 1937 mill (Fig. 7) was burned bylocal fire authorities because of its hazardouscondition.
WATER
A buried 6-inch plastic pipe discharged less than5 gpm into a sump containing a hard-wired sub-mersible pump. The pipe is in a direct line withthe South adit and may serve as a drainage con-duit (Fig. 8). The water was clear, and the un-stained streambed contained aquatic plants. Weanalyzed a sample from this source for cadmium,lead, and zinc. A sample from this source ex-ceeded standards for cadmium and lead shown inWAC 173-201A (surface water) and for leadshown in WAC 246-290 (ground water)(see Ta-ble 6). In October 2000, Dave Norman (DGER)and Robert Raforth (DOE) observed a 35 to 40gpm flow from this pipe and a seep emanatingfrom the North adit (DGER mine file).
We detected no acid mine drainage. Field pa-rameters for pH and conductivity ranged from6.6 to 7.55 and 600 to 672 �ohm/cm respectively.These values agree with observations reportedby Raforth and others (2002).
MILLING OPERATIONS
Reports on the property prior to 1937 indicatethat smelter shipments consisted of run-of-mine,hand-sorted ore. The Queen Seal Mining Co.took control of the combined properties in 1935 and placed a 40-tpd mill in operation on New Year’s Day 1937 (Northwest Min-ing, March, 4, 1937). Later that year, an article in the MiningJournal (Dec. 30, 1937) reported: “The Queen Seal Mining Co.is now operating its concentration mill at the Queen and Sealmines near Fruitland, Wash. Crushing is done by ball mill andrecovery is by flotation and Wilfley tables. Power is supplied bytwo 50 h.p. diesel engines.”
It is difficult to estimate the total volume of tailings this millproduced. Fulkerson and Kingston (1958) report only 390 tonsof raw ore production from the mine at this time, but the start-upmill feed came from an unknown quantity of “. . . dump materialleft by early operators” (Mining Journal, March 30, 1937).There are no reports of the mill operating after the mine was ac-quired by a different group of investors in 1940, who mined a to-tal of 12 tons.
WASTE ROCK DUMPS AND TAILINGS
We did not observe a defined tailings impoundment or any iden-tifiable concentrations of tailings-appearing material. The gullybelow the mill site was hummocky, terraced terrain having theappearance of native earth with intermixed sand and gravel. Nu-merous small pits dug in the area indicate that it had been a sub-ject of interest for reworking. A grab sample of sandy materialwas analyzed for cadmium, lead, silver, and zinc. The lead andzinc content (see Table 3) exceeded the DOE levels for indus-trial or commercial sites and for unrestricted land use (see Table4). There are no established levels for silver, however, the anal-ysis of 125 parts per million equates to about 1.8 opt.
The white dolomitic waste rock material adjacent to the Sealshaft appeared unmineralized and was not sampled.
GENERAL INFORMATION
Names: Queen Seal, Queen, Seal, Silver Queen, Silver Seal
MAS/MILS sequence number: 0530650365
Access: four-wheel drive
Status of mining activity: none
Claim status: two active claims—Queen Seal-1 and QueenSeal-2
Current ownership: M. Inman, Hunters, Wash.
Surrounding land status: Bureau of Land Management andprivate timberland
Location and map information: Table 1
Directions: The Queen Seal mine is located 2.2 airline milessouthwest of the Deer Trail mill site. From Fruitland on StateRoute (SR) 25, take the paved “Valley Road” east to the settle-ment of Turk, a distance of approximately 5 miles. From Turk,follow a dirt road about 3.7 miles east and then south alongSouth Fork Alder Creek past the Deer Trail mill site and tailingsimpoundments. Turn left where a road leading uphill enters at asharp angle and continue due west across the ridge in the centerof sec. 12, T29N R37E. Follow the road downhill approximately1 mile from a four-way crossing at the headwaters of O-Ra-Pak-En Creek. The access road bisects the mine property. The wasterock dump and shafts are clearly visible west of the road. The lo-cation is well marked on the Adams Mountain USGS 7.5-minutequadrangle.
IAML—QUEEN SEAL MINE, STEVENS COUNTY, WASHINGTON 5
Figure 8. Sump located near the South adit portal.
Mine
property County Location
Decimal
latitude
Decimal
longitude
1:24,000
quad.
1:100,000
quad.
Queen Seal Stevens W½SW¼ T29NR37E
48.02621 118.12184 AdamsMountain
Nespelem
Table 1. Location and map information.
submersible
pump outflow
inflow 6�
PVC pipe

MINE OPERATIONS DATA
Type of mine: underground
Commodities mined: silver; minor lead,copper, and zinc
Ore minerals: acanthite (argentite), Ag2S;cerargyrite, AgCl; sphalerite, ZnS; galena, PbS;native silver, Ag; tetrahedrite, (Cu,Fe)12Sb4S13; malachite and azurite,Cux(CO3)y(OH)z (Moen, 1976)
Non-ore minerals: quartz, pyrite
Host rock: Deer Trail group of Precambrianmetasediments consisting of interbeddedquartzite, argillite, dolomite, and limestone
Period of production: 1895–1908, 1917–1918,1921–1922, 1928–1929, 1937–1940
Development: 3400 feet of total development,including stopes, raises, sublevels, and twoshafts (Moen, 1976)
Production: >$285,000 at historic metalprices
Mill data: flotation, tabling mill (1937)
PHYSICAL ATTRIBUTES
Features: Table 2
Materials: ~100 pounds of sodium carbonate(removed 2004)
Machinery: truck-mounted mill equipment (removed 2004)
Structures: dilapidated mill building (burned 2004)
Waste rock dumps, tailings impoundments, highwalls, orpit walls: <90 tons of tailings
Analysis of waste rock dumps: none
Waste rock, tailings, or dumps in excess of 500 cubicyards: two
Reclamation activity: safety issues addressed in BLM action2004
Analysis of tailings: Tables 3 and 4
VEGETATION
Naturally occurring arid upland reforestation—grasses,shrubs, thistles, knapweed, fir, and larch (�10 inches indiameter), aspen.
WILDLIFE
No bats observed. Deer, elk reported; pika observed.
WATER QUALITY
Surface waters observed: pipe-fed sump and spring
Proximity to surface waters: 0 feet to overflow from sump;1500 feet to O-Ra-Pak-En Creek
Domestic use: none
Acid mine drainage or staining: none
Water field data: Tables 5 and 6
Surface water migration: none
6 INFORMATION CIRCULAR 104
Description Condition
Fenced
(yes/no)
Length
(feet)
Width
(feet)
Height/depth
(feet)
True
bearing
Elev.
(feet)
Decimal
latitude
Decimal
longitude
50-foot-deep depression(Seal shaft?)
caved no 40 40 50 (originaldepth 300 feet)
N/A 3890 48.02621 118.12184
West adit open (interior unknown) no – – – 5 7 W 3860 48.02690 118.11930
South adit caved no – – – – – – – – – N40°W 3815 48.02538 118.12156
North adit caved no – – – – – – – – – N35°W 3820 48.02592 118.12095
dozer prospect trench open no 150 40 20 N 4040 48.02715 118.12096
mill site ruins no 30 25 – – – N/A 3800 48.02459 118.12031
Queen prospect tunnel? open (interior unknown) no 125** 5 7 N45°W 3890 48.02711 118.11876
Table 2. Mine features. – – –, no data; **, data from DGER mine map file.
Sample location Arsenic Cadmium Copper Lead Zinc Silver
mill site tailings – – – 13 – – – 960 1240 125
Table 3. Soil analysis. Metal concentrations are in milligrams/kilogram (mg/kg); – – –,
no data. Analyses in bold indicate levels which exceed one or more standard shown in
Table 4.
Metals Arsenic III Cadmium Copper Lead Zinc Silver
unrestricted land use 20 25 100 220 270 no std.
industrial or commercial use 20 36 550 220 570 no std.
Table 4. Soil quality standards for unrestricted land use. WAC 173-340-900, Model
Toxics Control Act, Table 749-2: Priority contaminants of ecological concern for sites
that qualify for the simplified terrestrial ecological evaluation procedure (partial data).
Concentrations are in mg/kg. Levels for silver, gold, and iron are not specified.
Description
Flow
(gpm)
Conductivity
(�S/cm)
Temp.
(F°) pH Bed color
Water
color
sump <5 600 49 6.6 natural clear
Queen Seal mill [sump]drainage, low flow*
30–40 607 45 7.55 natural clear
Queen Seal adit drainage,low flow*
<2 672 47 7.43 natural clear
Table 5. Surface water field data. *, data collected by Robert L. Raforth (low flow, Oct.
2000; Raforth and others, 2002).

ACKNOWLEDGMENTS
The authors thank our editors Jari Roloff and Karen Meyers forhelpful suggestions on the layout and content of this report.Thomas M. Sweeney of the BLM provided helpful informationon that agency’s remedial activity at the mine in 2004.
REFERENCES CITED
Fluet, D. W., 1986, Genesis of the Deer Trail Zn-Pb-Ag vein deposit,Washington, U.S.A.: University of Alberta Master of Science the-sis, 129 p.
Fulkerson, F. B.; Kingston, G. A., 1958, Mine production of gold, sil-ver, copper, lead, and zinc in Pend Oreille and Stevens Counties,Wash., 1902–56; Annual totals by mines, districts, and counties:U.S. Bureau of Mines Information Circular 7872, 51 p.
Jenkins, O. P., 1924, Lead deposits of Pend Oreille and Stevens Coun-ties, Washington: Washington Division of Geology Bulletin 31,153 p.
Huntting, M. T., 1956, Inventory of Washington minerals; Part II—Metallic minerals: Washington Division of Mines and GeologyBulletin 37, Part II, 2 v.
Moen, W. S., 1976, Silver occurrences of Washington: WashingtonDivision of Geology and Earth Resources Bulletin 69, 188 p.
Norman, D. K., 2000, Washington’s inactive and abandoned metalmine inventory and database: Washington Geology, v. 28, no. 1/2, p. 16-18.
Norman, Sidney, 1918, Northwest mines handbook: [Privately pub-lished by the author, Spokane, Wash.], v. 1, 366 p.
Raforth, R. L.; Norman, D. K.; Johnson, Art, 2002, Second screeninginvestigation of water and sediment quality of creeks in ten Wash-ington mining districts, with emphasis on metals: WashingtonDepartment of Ecology Publication 02-03-024, 126 p.
Weaver, C. E., 1920, The mineral resources of Stevens County:Washington Geological Survey Bulletin 20, 350 p., 1 plate. �
IAML—QUEEN SEAL MINE, STEVENS COUNTY, WASHINGTON 7
PART 1: ANALYSIS BY USEPA METHOD 6020, INDUCTIVELY COUPLED PLASMA/MASS SPECTROMETRY
Sample location Arsenic Cadmium** Copper** Iron Lead** Mercury Zinc** Hardness
Queen Seal sump 5.54 7.06 – – – – – – 60.3 – – – 214 360
PART 2: APPLICABLE WASHINGTON STATE WATER QUALITY STANDARDS
Type of standards
(applicable Washington Administrative Code) Arsenic Cadmium Copper Iron Lead Mercury Zinc Hardness
Surface water standards (WAC 173-201A, Standardfor aquatic life in surface freshwater, chronic levelmaximums at 100 mg/L hardness)
190 ** ** none ** 0.012 ** 100
Ground water standards (WAC 246-290,Washington State Department of Health, standardsfor ground water, domestic consumption)
50.0 none 1300 300(cosmetic
only)
15 2.0 5000 – – –
Table 6. Surface water analysis. Metal concentrations are in micrograms/liter (�g/L); hardness is in milligrams/liter (mg/L); USEPA, U.S. Environ-
mental Protection Agency; – – –, no data; **, standards for these metals are hardness dependent; Conversion formulae are shown in http://
www.ecy.wa.gov/pubs/wac173201a.pdf. Standards calculated for hardness values specific to Part 1 below are shown in Appendix B. Metals which
exceed one or more of the standards in Part 2 are shown in bold.

Appendix A. Methods and field equipment
METHODS
We recorded observations and measurements in the field. Lon-gitude and latitude were recorded with a global positioning sys-tem (GPS) unit in NAD83 decimal degree format. Literature re-search provided data on underground development, which wasverified in the field when possible.
Soil samples from dumps or tailings were taken fromsubsurface material and double bagged in polyethylene. Chainof custody was maintained.
Soil samples were analyzed for the metals listed in this re-port by inductively coupled plasma/mass spectrometry (ICP/MS) following USEPA Method 6010. Holding times for themetals of interest were observed.
Instrument calibration was performed before each analyticalrun and checked by standards and blanks. Matrix spike and ma-trix spike duplicates were performed with each set.
FIELD EQUIPMENT
barometric altimeterbinocularsdigital cameraflashlightGarmin GPS III+, handheld GPS unitHanna Instruments DiST WP-3 digital conductivity meter
and calibration solutionOakton digital pH meterOakton digital electrical conductivity meterTaylor model 9841 digital thermometer
8
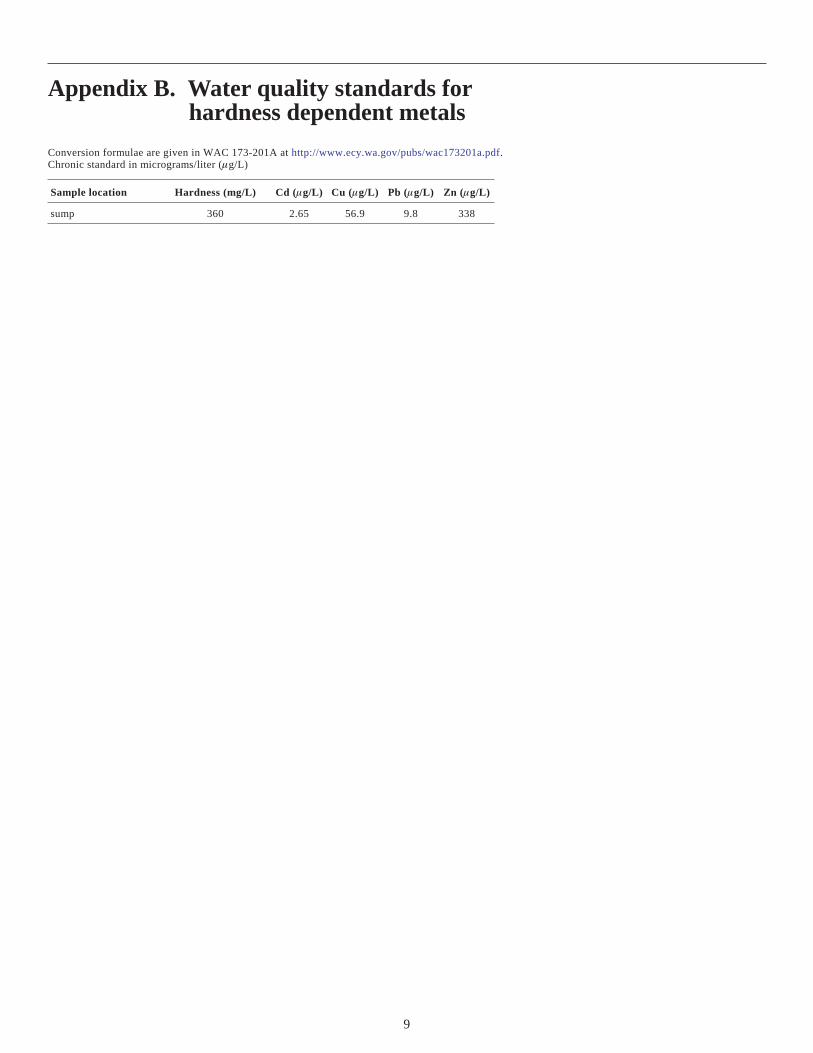
Appendix B. Water quality standards forhardness dependent metals
Conversion formulae are given in WAC 173-201A at http://www.ecy.wa.gov/pubs/wac173201a.pdf.Chronic standard in micrograms/liter (�g/L)
Sample location Hardness (mg/L) Cd (�g/L) Cu (�g/L) Pb (�g/L) Zn (�g/L)
sump 360 2.65 56.9 9.8 338
9
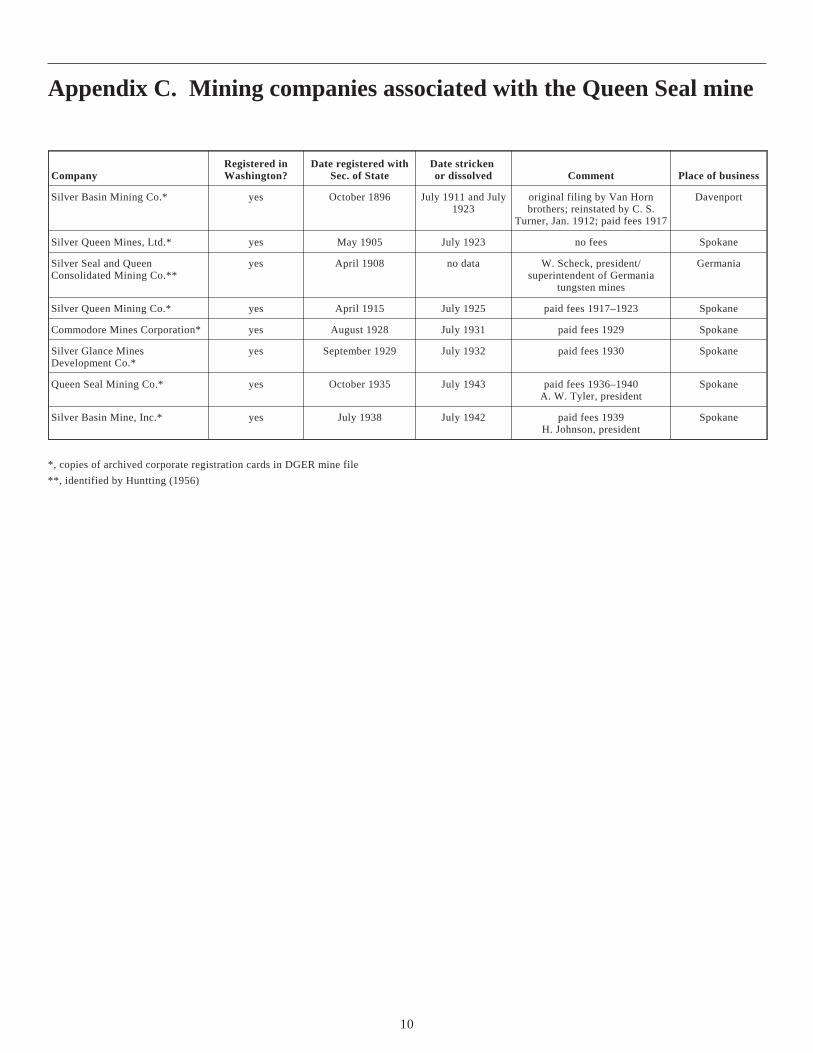
Appendix C. Mining companies associated with the Queen Seal mine
Company
Registered in
Washington?
Date registered with
Sec. of State
Date stricken
or dissolved Comment Place of business
Silver Basin Mining Co.* yes October 1896 July 1911 and July1923
original filing by Van Hornbrothers; reinstated by C. S.
Turner, Jan. 1912; paid fees 1917
Davenport
Silver Queen Mines, Ltd.* yes May 1905 July 1923 no fees Spokane
Silver Seal and QueenConsolidated Mining Co.**
yes April 1908 no data W. Scheck, president/superintendent of Germania
tungsten mines
Germania
Silver Queen Mining Co.* yes April 1915 July 1925 paid fees 1917–1923 Spokane
Commodore Mines Corporation* yes August 1928 July 1931 paid fees 1929 Spokane
Silver Glance MinesDevelopment Co.*
yes September 1929 July 1932 paid fees 1930 Spokane
Queen Seal Mining Co.* yes October 1935 July 1943 paid fees 1936–1940A. W. Tyler, president
Spokane
Silver Basin Mine, Inc.* yes July 1938 July 1942 paid fees 1939H. Johnson, president
Spokane
*, copies of archived corporate registration cards in DGER mine file
**, identified by Huntting (1956)
10