Embed Size (px)
Citation preview
1
IC-7600 User Evaluation & Test Report
By Adam Farson VA7OJ/AB4OJ Iss. 4, November 30, 2011. Tests 11 (DR3 & IP3) and 19a (CW keying envelope) added. Replaces Iss.3, April 2. 2009.
Introduction: This report describes the evaluation of IC-7600 S/N 0201203 from a user
perspective. Appendix 1 presents results of an RF lab test suite performed on the radio. I
was able to spend a number of days with the IC-7600 in my ham-shack, and thus had the
opportunity to exercise the radio’s principal features and evaluate its on-air behavior.
1. Physical “feel” of the IC-7600: Owners of IC-756Pro-series transceivers should find
the IC-7600 very familiar, and will immediately feel comfortable with it. The front-panel
layout is quite similar to that of the IC-756Pro3, except that the larger TFT display now
takes up the space vacated by the removal of the analog meter. The learning curve will be
minimal also for IC-7700 or IC-7800 owners.
The main tuning knob has a knurled Neoprene ring similar to that of the IC-7700; it turns
very smoothly without side-play. The major rotary controls are identical to those of the
IC-756Pro3, although the BAL/NR and AF/RF-SQL controls are in a vertical line, rather
than side-by-side. The larger screen accommodates 6 softkeys and 6 mode keys, as
compared to 5 on the Pro3; the new RTTY/PSK key is to the right of the CW key.
The IC-7600 is solidly constructed and superbly finished. It conveys a tight, smooth, and
precise overall feel (as did its predecessors). The sheet-steel case is finished in an
attractive black crinkle coating and fitted with a handle on the left side. The case
retaining screws are located in recesses in the case covers. The front panel has a smooth,
matte surface (not textured as in the IC-756Pro3.)
The diecast, compartmented chassis is very similar to that of the Pro3, but has an
attractive new feature: all jacks and connectors are individually marked. The 7600 is
fitted with the new 4-pin DC power socket. Switchable RX OUT and RX IN jacks are
fitted, allowing the connection of an external preamplifier, RF filter or preselector (or a
receiving antenna). Both the case and the rear panel are well-ventilated. The front case
feet are solid and extensible, allowing the front of the IC-7600 to be angled upwards.
The 7 softkeys at the left edge of the screen are now black, and almost flush with the
panel. A triangular index mark is molded into each key; I would have liked to see these
marks filled in white for easier operation in low light.
2. Control knob/key functions and menus: Apart from minor differences in placement,
the IC-7600’s control knobs will be very familiar to 756Pro-series users. The menus are
more akin to those in the IC-7700, as the IC-7600’s feature set is very similar to that of
the 7700 but with Dual Watch added. I found the set-up process fairly intuitive after a
consulting the relevant user-manual sections in cases of doubt (e.g. the COMP menu.) As
in the IC-7700, the SPAN, PREAMP and ATT selections can be returned to default by
pressing and holding their respective softkeys.
2
The filter selection and adjustment procedure is similar to that on other Icom DSP radios.
Press and hold the FILTER key for 1 sec. to adjust the filter bandwidth, select CW/SSB
Sharp/Soft shape factors and match the desired roofing filter to each IF filter and mode.
All IF filters are continuously adjustable.
Being a current IC-7700 owner and former 756Pro-series owner, I found that the IC-
7600’s controls and menus fell readily to hand. A user familiar with a radio such as the
IC-756Pro3 or IC-7700 should find the IC-7600’s learning curve minimal. The IC-7600’s
default settings are very usable, allowing the radio to be placed in service with minimal
initial set-up.
Due to space constraints, compression level is now set via a menu. Pressing and holding
the COMP key displays the COMP adjustment menu, a peak reading COMP meter scale
and a TBW selection menu (WIDE/MID/NAR).
The IC-7600 also has a Drive Gain adjustment menu (absent from the IC-756Pro series);
this is accessible via the LEVEL menu. The 50% default value for Drive Gain places the
ALC reading just below 50%, as recommended in the user manual.
.
3. LCD display screen: The 5.8 inch diagonal QVGA TFT color screen has 400 X 240
pixel resolution. The display is very bright and crisp, and presents all radio parameters.
The display layout is very similar to that of the IC-7700. The DSP-based spectrum scope
has the same capabilities and adjustment range as the IC-7700 scope. The DISP menu is
very similar to that of the IC-7700, allowing flexible color adjustment etc. The display is
backlit by white LED’s. Gone are the CCFL (cold-cathode fluorescent lamp) and its
DC/DC converter.
The Notch (MN) and APF keys open pop-ups which can be used to select notch width
and APF bandwidth respectively.
4. Spectrum Scope. As in the IC-7700, the IC-7600 scope offers CENTER and FIX
modes. The CENTER mode has selectable spans from ±2.5 to ±250 kHz, selectable
sweep speeds and variable resolution-bandwidth (RBW) in the range 100 Hz to 4 kHz.
The optimum RBW value is automatically selected for each span and sweep speed
setting. At ±2.5 kHz span and SLOW sweep speed, the minimum RBW is selected. This
allows a clear display of IMD products and AM sidebands, for example. At the narrower
RBW settings, the "grass" level in the absence of signals is at or near baseline. Weak-
signal spikes are thus clearly visible.
The IC-7600 spectrum scope also provides a very useful spectral-content display of the
transmitted signal at the ± 2.5 kHz span and SLOW sweep settings. One can use this
display as an aid when setting up the transmit audio. (Scope during TX ON in Scope Set
menu.) Pressing and holding the MAIN/SUB key opens the “mini-scope” display, as in
the IC-756Pro3. In FIX mode, the spectrum scope presents a sweep of a defined range
(typically an amateur band, with upper and lower limits configurable via menu). The
current receive and transmit frequencies are shown as movable marker lines, giving the
effect of a “slide-rule dial”.
3
5. USB interfaces: The IC-7600 is equipped with a front-panel USB “A” port and a rear-
panel USB “B” port. The “A” port accepts a thumb drive for storage and loading of
configuration settings, RTTY/PSK31 traffic and sound (.wav) files. The radio can be
directly connected via the “B” port to a laptop or other PC via a standard USB “A-B”
cable. This is without doubt one of the IC-7600’s strongest features. The USB port
transports not only CI-V data, but also TX and RX PCM baseband between the IC-7600
and the computer. As a result, the USB cable is the only radio/PC connection required.
Gone forever is the mess of cables, level converters and interface boxes! I believe that
this feature will be standard on all future Icom HF radios.
6. Filter selections and Twin PBT: As do the other Icom DSP transceivers, the IC-7600
offers fully configurable RX IF selectivity filters for all modes. Three default filter
selections are available for each mode, with continuously variable bandwidth via the
FILTER menu. In addition, there are selectable Sharp and Soft shape factors for SSB and
CW. The IC-7600 is fitted with 15, 6 and 3 kHz MCF roofing filters at the 64.455 MHz
1st IF. The filter menu allows association of any one of the 3 roofing filters with each of
the 3 IF filter selections.
The Twin PBT controls and PBT CLR key operate in exactly the same manner as on the
IC-756Pro series, as does the BPF filter configuration feature (for filter bandwidths of
500 Hz or less.)
The APF/TPF key selects the Audio Peak Filter (APF) in CW mode, and the Twin Peak
Filter (TPF) in RTTY mode. The APF offers Sharp and Soft shape factors, and 3
bandwidth selections. When APF is selected, a pop-up icon is displayed, allowing
selection of WIDE, MID or NAR BW by pressing and holding the key.
7. BPF vs. non-BPF filters: As in other Icom IF-DSP radios, the IC-7600 allows the user
to select two additional shapes for 500 Hz or narrower filters, in addition to SHARP and
SOFT. These are BPF (steeper skirts) and non-BPF (softer skirts).
To configure a BPF filter, select a 500 Hz or narrower CW, RTTY or SSB-D filter with
Twin PBT neutral. To set up a non-BPF filter, select a filter with BW > 500 Hz, and
narrow the filter to 500 Hz or less by rotating the Twin PBT controls. Numerical and
diagrammatic bandwidth displays and a “BPF Indicator” icon facilitate use of this
feature. Examples of BPF and non-BPF filter passbands are illustrated in Figs. 3 & 4
(Page 8).
8. Notch Filters: The tunable manual notch filter (MN) is inside the AGC loop, and is
extremely effective. The MN has 3 width settings (WIDE, MID and NAR); its stopband
attenuation is at least 70 dB. The manual notch suppresses an interfering carrier before it
can stimulate AGC action; it thus prevents swamping. The auto notch filter (AN) is post-
AGC. It suppresses single and multiple tones, but strong undesired signals can still cause
AGC action and swamp the receiver. MN and AN are mutually exclusive, and ANF is
inoperative in CW mode. The NOTCH key toggles OFF – AN – MN. When MN is
selected, a pop-up icon is displayed, allowing selection of WIDE, MID or NAR (narrow)
notch by pressing and holding the key. Operation of the NOTCH key is identical to that
in the IC-7700.
4
9. Auto-Tune: As in the IC-7700, this feature is a form of AFC which at the push of a
button correctly tunes CW signals to the pitch set via the CW PITCH control and AM
signals to carrier at passband center. Auto-Tune is effective even on fairly weak signals.
10. NR (noise reduction): The DSP NR functionality is comparable to that of the IC-
7700, and works very well. In SSB mode, the maximum noise reduction occurs at an NR
control setting of 60%. As NR level is increased, there is a slight loss of “highs” in the
received audio; this is as expected. The measured SINAD increase in SSB mode was
about 10 dB.
11. NB (noise blanker): The IF-level DSP-based noise blanker is arguably one of the IC-
7600’s strongest features. I found it to be extremely effective in suppressing fast-rising
impulsive RF events before they can stimulate AGC action within the DSP algorithm.
The NB completely blanks noise impulses which would otherwise cause AGC clamping.
I found its performance comparable to that of the IC-7700’s NB. The NB menu
(threshold, depth and width) is accessed by pressing and holding the NB key. The NB
works very effectively in conjunction with NR.
12. AGC system: The IC-7600 has dual AGC loops. The primary loop uses an analog
AGC detector at the output of the 2nd
IF amplifier (36 kHz). This loop limits the IF signal
power applied to the ADC input, thereby preventing ADC over-ranging even in the
presence of extremely strong signals. The digital AGC detector for the secondary loop is
within the DSP algorithm. Level indications from both detectors are processed in the DSP
for AGC management. This architecture prevents strong adjacent signals from swamping
the AGC, and allows full exploitation of the ADC’s dynamic range. The AGC menu is
similar to that of the IC-756Pro3. The Slow, Mid and Fast AGC settings are customizable
via menu for each mode.
13. Receive and transmit audio menu: The IC-7600 LEVEL menu offers the same
generous selection of audio configuration parameters as that of the IC-7700: TBW (low
and high cutoff frequencies), RX and TX Bass/Treble EQ, RX HPF and LPF, transmit
compression, etc. Pressing and holding the COMP softkey opens a menu allowing
independent selection of compression on/off, TBW (WIDE/MID/NAR) and compression
level.
14. Metering: As in the IC-7700, an on-screen emulation replaces the traditional
moving-coil meter. An item in the DISP menu allows selection of a standard, edgewise
or bar-graph meter display. Pressing the METER softkey toggles among VD (PA drain
supply voltage), ID (PA drain current), PO, SWR, ALC and COMP. Pressing and holding
the METER softkey displays a multi-function bar-graph meter group, including VD and a
relative TEMP (internal temperature) scale. A rear-panel METER jack allows connection
of an external meter. The meter parameters are configurable via the ACC menu.
15. Dual Watch: This feature operates exactly as in the IC-756Pro3. With the BAL
control fully clockwise, the spectrum scope “grass” level rises 6 dB, as the PIN diode
balance attenuator leaves the “A” 1st mixer IF output unterminated at maximum
attenuation.. This increases the IF signal power at the scope sampling point by 6 dB.
5
16. Brief “on-air” report: Prior to starting the test suite, I installed the IC-7600 in my
shack and connected it to my solid-state 1 kW amplifier and multi-band vertical antenna.
The interface was straightforward – RF drive, PTT, ALC and carrier request (for
amplifier auto-tuning). Once I had set up the ALC for 1 kW output, I was 100% QRV.
a) SSB: I made several 20m and 17m SSB QSO’s with friends who are familiar with my
voice and the sound of my signal. Distant stations reported that the audio quality of my
transmissions was "clean and natural" when using the Heil ProSet Plus headset and GM-5
hand mic with the HC-5 element. Two stations I worked on 20m SSB assisted me in
optimizing transmit audio settings for the HM-36 hand mic supplied with the IC-7600. It
was noted that higher COMP settings caused slight distortion on voice peaks when using
the HM-36. (Note that the area of the rear panel behind the PA Unit became quite warm
after a few hours’ “rag-chew” SSB operation at 65 – 70W PEP output.)
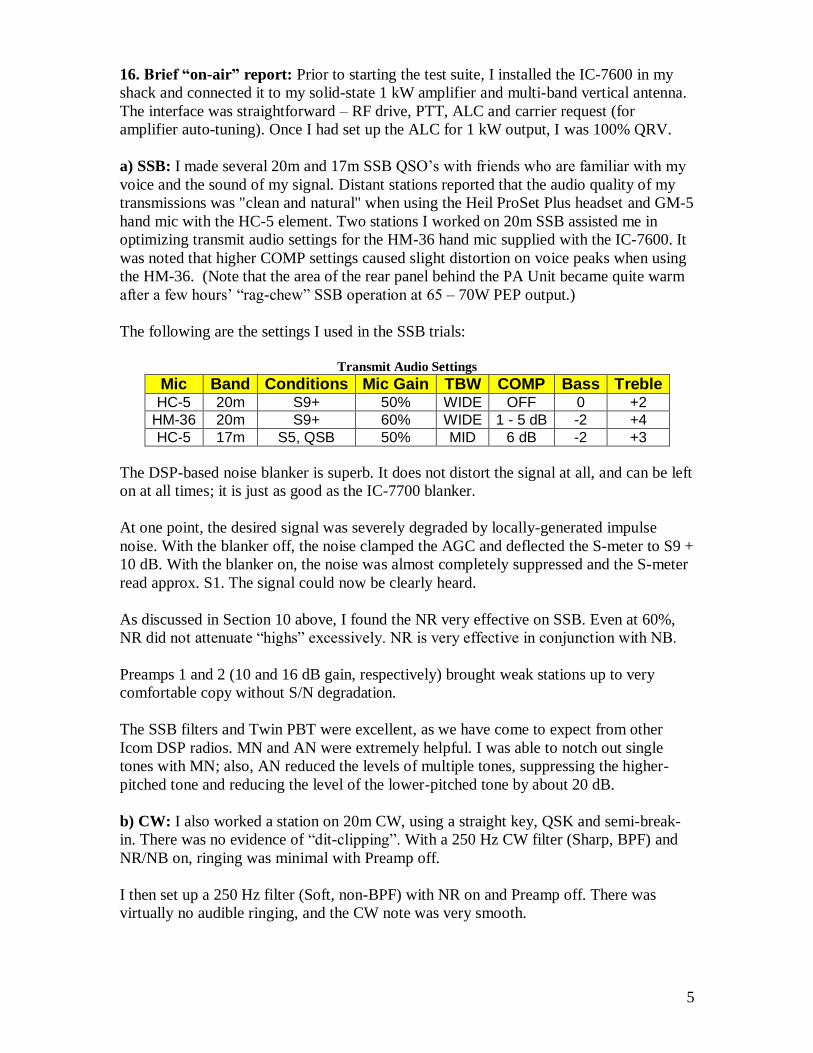
The following are the settings I used in the SSB trials:
Transmit Audio Settings
Mic Band Conditions Mic Gain TBW COMP Bass Treble HC-5 20m S9+ 50% WIDE OFF 0 +2
HM-36 20m S9+ 60% WIDE 1 - 5 dB -2 +4
HC-5 17m S5, QSB 50% MID 6 dB -2 +3
The DSP-based noise blanker is superb. It does not distort the signal at all, and can be left
on at all times; it is just as good as the IC-7700 blanker.
At one point, the desired signal was severely degraded by locally-generated impulse
noise. With the blanker off, the noise clamped the AGC and deflected the S-meter to S9 +
10 dB. With the blanker on, the noise was almost completely suppressed and the S-meter
read approx. S1. The signal could now be clearly heard.
As discussed in Section 10 above, I found the NR very effective on SSB. Even at 60%,
NR did not attenuate “highs” excessively. NR is very effective in conjunction with NB.
Preamps 1 and 2 (10 and 16 dB gain, respectively) brought weak stations up to very
comfortable copy without S/N degradation.
The SSB filters and Twin PBT were excellent, as we have come to expect from other
Icom DSP radios. MN and AN were extremely helpful. I was able to notch out single
tones with MN; also, AN reduced the levels of multiple tones, suppressing the higher-
pitched tone and reducing the level of the lower-pitched tone by about 20 dB.
b) CW: I also worked a station on 20m CW, using a straight key, QSK and semi-break-
in. There was no evidence of “dit-clipping”. With a 250 Hz CW filter (Sharp, BPF) and
NR/NB on, ringing was minimal with Preamp off.
I then set up a 250 Hz filter (Soft, non-BPF) with NR on and Preamp off. There was
virtually no audible ringing, and the CW note was very smooth.
6
Activating Preamp 1 or 2 raised the noise level, causing some ringing which was
especially noticeable in the absence of signals.
By narrowing receive audio bandwidth, the APF improved the S/N of the recovered audio
and yielded a slightly smoother CW note; this was especially evident with APF set to
Soft/NAR.
Auto-Tune “pulled in” CW signals to the preset pitch value effectively, even at low
signal levels (S1 – S2).
c) AM: In a quick check of AM reception, I listened to various MF and HF broadcast
stations. A local station on 690 kHz and a music broadcast on 6910 kHz sounded good on
the IC-7600’s internal speaker, but much clearer (as one would expect) on my SP-20 or
on the headset.
The 9 kHz AM filter offered the best frequency response, but the 6 kHz setting sounded
somewhat “smoother” and 3 kHz cut the “highs” excessively. The IC-7600’s Twin PBT
is fully functional in this mode. Mid AGC was fine under average to good signal
conditions, but I found Fast AGC quite useful in dealing with rapid selective fading.
NR was quite effective in improving the S/N ratio of weak AM signals. Some band-noise
hiss was evident on AM with NR off, but NR effectively eliminated it. The NR did not
cause distortion even at it maximum setting (60%). Above 60%, the NR control has no
further effect. (Note that the AM bass and treble EQ settings were both 0 dB, with HPF
off.)
Some distortion was observed on AM at NB > 50%; this became unacceptable at NB >
75%. I found that NB + NR caused less distortion than NB alone. AN was effective in
suppressing unwanted tones and heterodynes, but MN caused some distortion when tuned
across the signal. The reason for this is that MN suppresses the carrier in a manner
similar to selective fading.
Auto-Tune also worked very well in AM mode, “pulling in” AM signals within 1 sec.
Note also that unlike the IC-756Pro3, the IC-7600 does not insert a pad in the RF/IF
signal path for f < 1.6 kHz.
d) PSK31 is simplicity itself with the IC-7600's PSK mode. The vector diagram, FFT
scope, AFC menu and waterfall display to the right of the encode/decode text field
greatly facilitate correct tuning. With a keyboard plugged into the front-panel USB port,
the IC-7600 becomes a self-contained HF/6m PSK31 and RTTY terminal. The IC-7600
decoded weak (S1 – S2) 20m PSK31 signals reliably, with a few errors due to QSB. I
plan to conduct a PSK31 QSO when band conditions allow.
e) RTTY: I successfully tuned in and decoded even weak and noisy RTTY signals. The
familiar tuning-bar display, together with the FFT scope and waterfall display to the right
of the encode/decode text field, make correct tuning very easy. The squelch can be set to
mute the audio in the absence of a received signal; this is especially useful when using
the Twin Peak Filter (TPF).
7
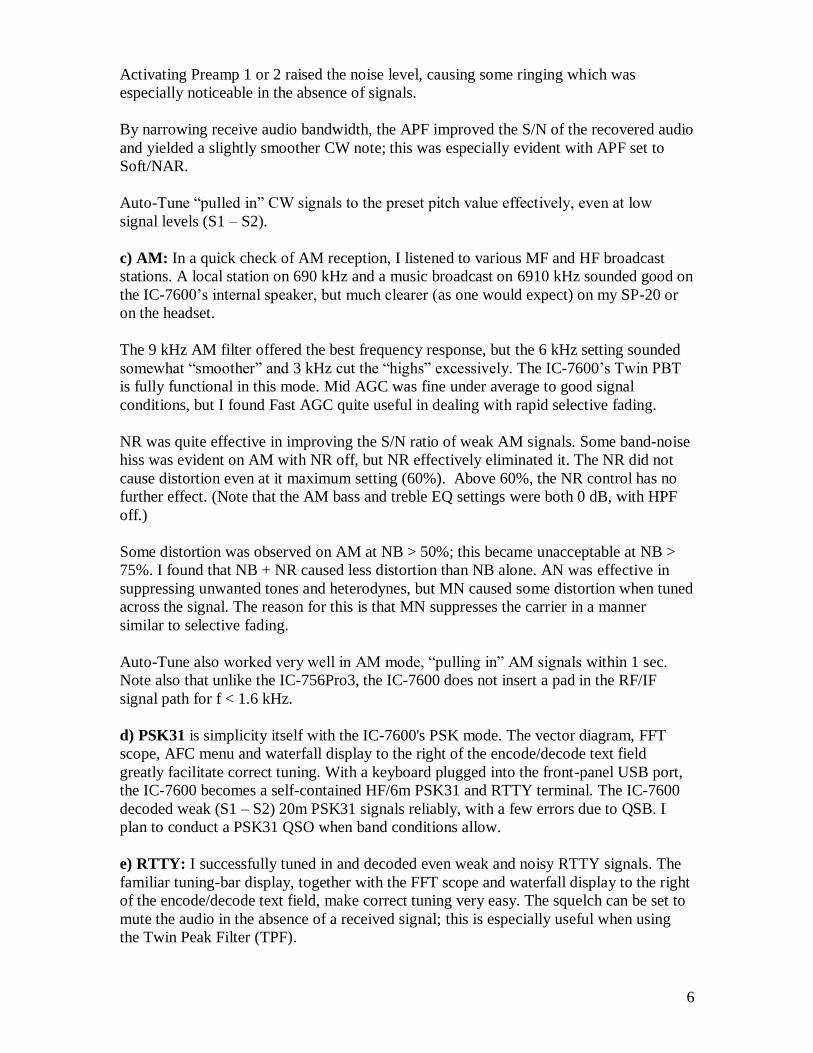
17. Test for EMC and Baseband Levels: No EMC issues of any sort
were observed when using a headset plugged into the IC-7600’s
PHONES jack or an external speaker connected to the radios EXT-SP
jack. Tests were conducted at 1 kW on 40, 20, 17, 15, 12 and 10m and
at 500W on 6m.
I measured the RX baseband output levels at the USB port using
DM780*, and at ACC(1) Pin 5 (AF) with a true RMS DVM. With a
10.000 MHz S9 + 10 dB test signal offset 1 kHz to yield a 1 kHz test
tone, DM780 read 76% of full scale and the level at ACC(1) Pin 5 was
213 mV RMS (well within the 100 – 300 mV spec.)
18. Interfacing with Ham Radio Deluxe (HRD): Simon Brown HB9DRV and I have
done some preliminary work to interface his well-known software suite to the IC-7600.
The single USB interconnection greatly facilitated this task. I installed the Icom USB
drivers (downloadable from the Icom Japan world-wide support site) and HRD on my
laptop. The IC-7600 showed up in the computer as “USB Audio Codec”. Once I had set
the levels correctly, HRD started working, and was displaying PSK31 and RTTY traffic
and waterfalls. *DM780 is a component of HRD.
Simon and I plan to verify HRD/IC-7600 inter-operation more exhaustively next month.
19. USB Thumb Drive: I did not upload firmware to the IC-7600, but successfully saved
and loaded SETTINGS and VOICE files to and from a 1 GB USB thumb drive inserted
in the front-panel USB socket.
20. Conclusion: After several days’ worth of “cockpit time” on the IC-7600, I am very
favorably impressed by its solid, refined construction, attractive and informative display,
easy familiarization experience, smooth operating “feel”, impressive array of features and
excellent on-air performance. This radio offers most of the functionality and performance
of the IC-7700 in a Pro3-sized package, and in a price class between the Pro3 and the IC-
7700. Icom have again scored a coup with the straightforward USB computer interface.
21. Acknowledgements: I would like to thank Ray Novak N9JA at Icom America, and
Paul Veel VE7PVL and Jim Backeland VE7JMB at Icom Canada for making an IC-7600
available to me for testing and evaluation. I would also like to thank Simon Brown
HB9DRV for his assistance in verifying HRD operation with the IC-7600.
Adam Farson, VA7OJ/AB4OJ
e-mail: [email protected]
http://www.ab4oj.com/
April 2, 2009.
Revised: November 30, 2011.
Copyright © 2009 A. Farson VA7OJ/AB4OJ. All rights reserved.
8
Appendix 1: Performance Tests on IC-7600 S/N 0201203 As performed in my home RF lab, March 17 – 23, 2009.
A. Receiver Tests
1: MDS (Minimum Discernible Signal) is a measure of ultimate receiver sensitivity. In
this test, MDS is defined as the RF input power which yields a 3 dB increase in the
receiver noise floor, as measured at the audio output.
Test conditions: ATT off, NR off, NB off. Levels in dBm. 6 kHz roofing filter.
(Note: MDS is unaffected when the 15 or 3 kHz roofing filter is selected.)
3.6 MHz 14.1 MHz 50.1 MHz
Preamp SSB 2.4 kHz CW 500 Hz SSB 2.4 kHz CW 500 Hz SSB 2.4 kHz CW 500 Hz
off -125.5 -132.5 -125 -131 -125 -133
1 -133.5 -140 -131.5 -140 -134 -141
2 -134.5 -142 -133.5 -142 -136 -142.5
1a: AM Sensitivity. Here, an AM test signal with 30% modulation at 1 kHz is applied to
the RF input. The RF input power which yields 10 dB (S+N)/N is recorded.
Test conditions: ATT off, NR off, NB off, Wide (9 kHz) filter. Levels in dBm.
Preamp 0.9 MHz 3.9 MHz 14.1 MHz
off -105 -107 -105
1 -113.5 -114 -113
2 -116 -116 -115 Note: No RF attenuation below 1.6 MHz
2: Reciprocal Mixing Noise occurs in a superheterodyne receiver when the noise
sidebands of the local oscillator (LO) mix with strong signals close in frequency to the
wanted signal, producing unwanted noise products at the IF and degrading the receiver
sensitivity. Reciprocal mixing noise is a measure of LO spectral purity.
In this test, a strong "undesired" signal is injected into the receiver's RF input at a fixed
offset from the operating frequency. The RF input power is increased until the receiver
noise floor increases by 3 dB, as measured at the audio output. Reciprocal mixing noise,
expressed as a figure of merit, is the difference between this RF input power and
measured MDS. The test is run with preamp off. The higher the value, the better.
Test conditions: SSB mode, 2.4 kHz filter, preamp off, ATT off, NR off,
NB off. Reciprocal mixing in dB = input power – MDS (both in dBm).
Offset kHz 3.6 MHz LSB 14.1 MHz USB
Roof Fltr 15 6 3 15 6 3
2 82 80.5 82 78 79 78
3 84.5 84.5 85 81 81 81
5 86.5 87.5 88.5 86.5 83.5 86
10 92.5 93.5 94 92 92.5 93.5
9
3: IF filter shape factor (-6/-60 dB). This is the ratio of the -60 dB bandwidth to the -6
dB bandwidth, which is a figure of merit for the filter’s adjacent-channel’s rejection. The
lower the shape factor, the “tighter” the filter.
In this test, an approximate method is used. An RF test signal is applied at a power level
approx. 60 dB above the level where the S-meter just drops from S1 to S0. The
bandwidths at -6 and -60 dB relative to the input power are determined by tuning the
signal generator across the passband and observing the S-meter. Reciprocal mixing noise
limits the level range to 60 dB or less.
Test conditions: 10.000 MHz, SSB/CW modes, preamp off, AGC MID, ATT off, NR
off, NB off.
Filter Sharp Soft
2.4 kHz SSB 1.46 1.63
500 Hz CW 1.38 1.77
250 Hz CW 1.44 1.93
4: SSB filter roll-off. An RF test signal is applied at a level 6 dB below AGC threshold,
with AGC off. The signal is offset 1 kHz from the receive frequency to produce a test
tone. While tuning the signal generator across the IF passband, the frequency and audio
level are noted at several points on the filter flank.
Test conditions: 10.000 MHz, SSB 2.4 kHz filter, 6 kHz roofing filter, preamp off, AGC
off, ATT off, NR off, NB off. Input signal level -99 dBm (6 dB below measured
-93 dBm AGC threshold.) Roll-off in dB.
Offset Hz Sharp Soft
250 -3 -6.5
300 -3 -5.5
400 0 -4.5
500 0 -3
750 0 -1
1000 0 0
2000 -1.5 -1.2
2500 -2.5 -5.5
2700 -3 -7.5
10
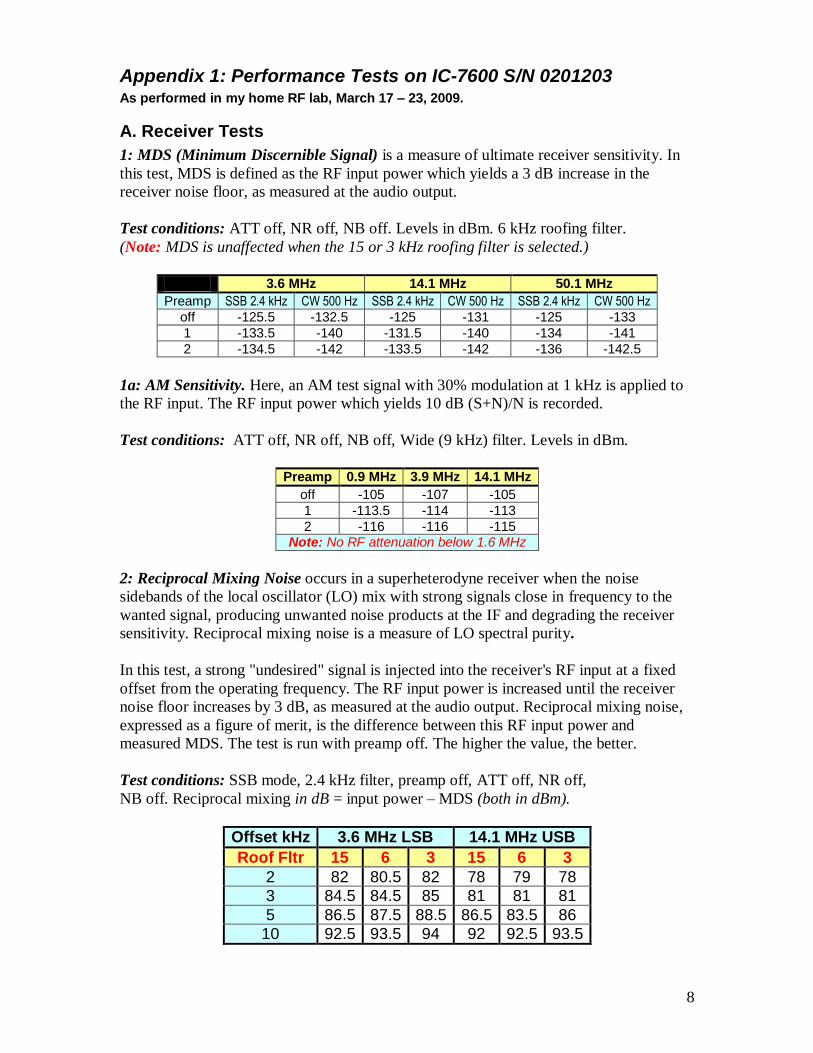
Fig. 1: 2.4 kHz SSB filter (Sharp)
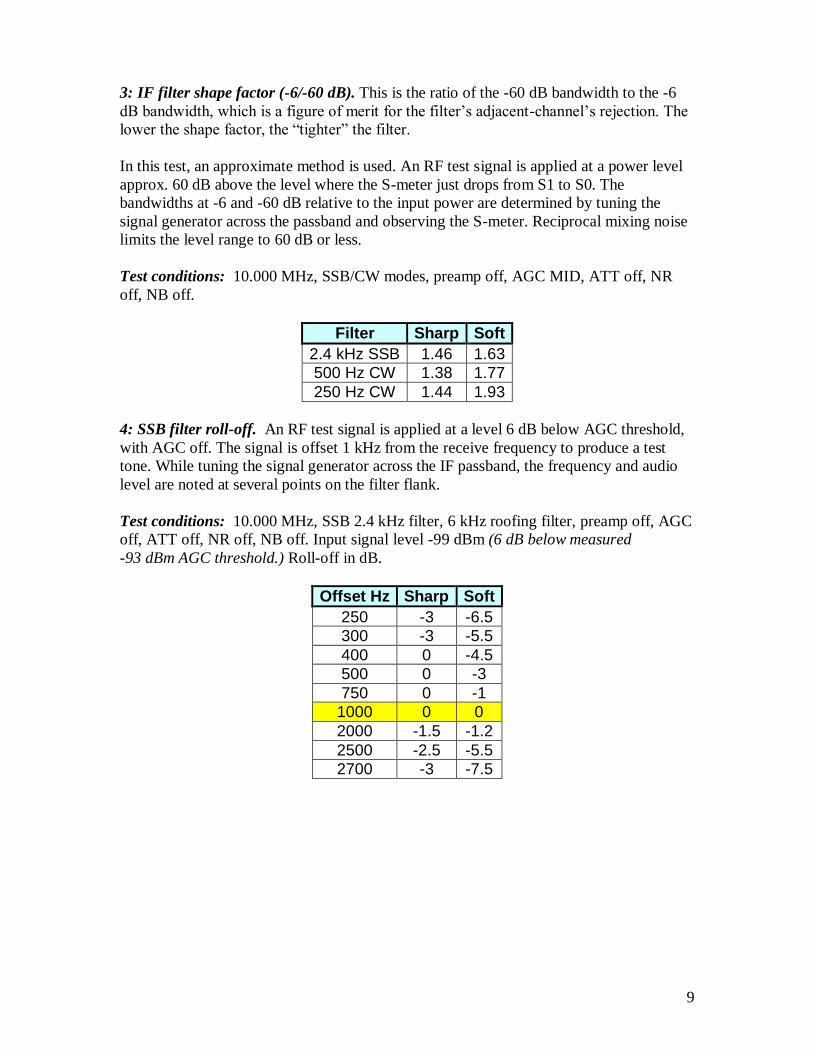
Fig. 2: 2.4 kHz SSB filter (Soft)
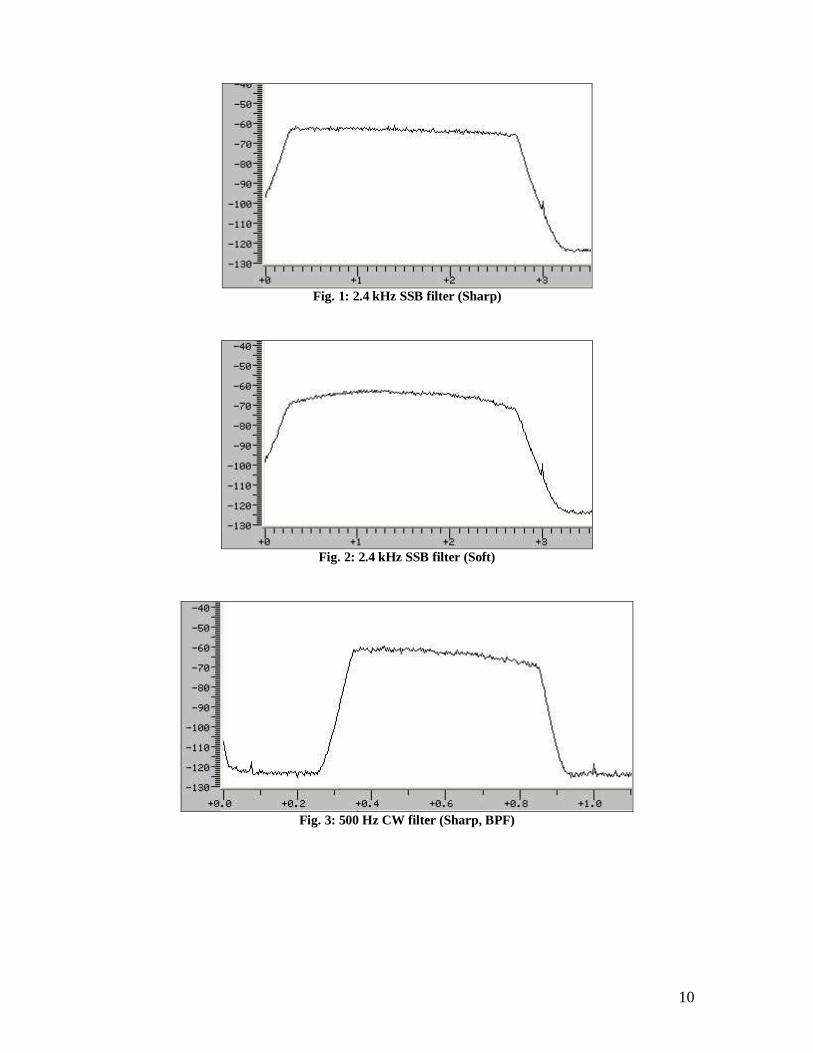
Fig. 3: 500 Hz CW filter (Sharp, BPF)
11
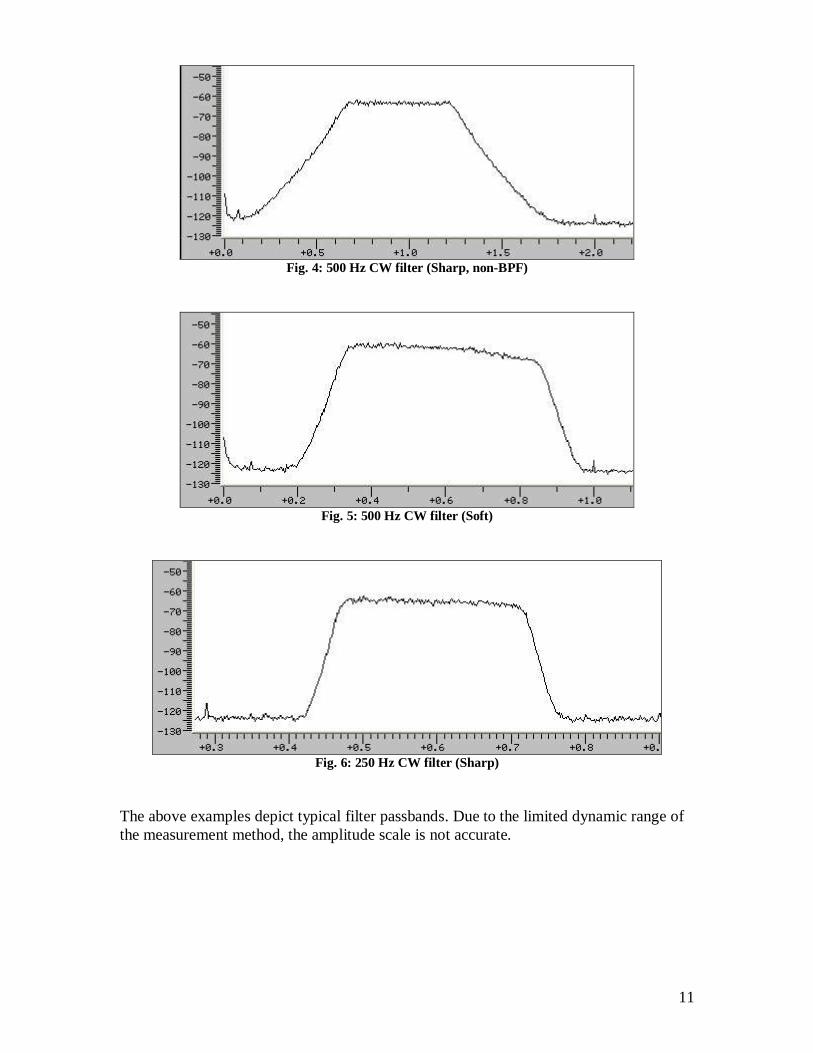
Fig. 4: 500 Hz CW filter (Sharp, non-BPF)
Fig. 5: 500 Hz CW filter (Soft)
Fig. 6: 250 Hz CW filter (Sharp)
The above examples depict typical filter passbands. Due to the limited dynamic range of
the measurement method, the amplitude scale is not accurate.
12
5: NR noise reduction, measured as SINAD. This test is intended to measure noise
reduction on SSB signals close to the noise level.
The test signal is offset 1 kHz from the receive frequency to produce a test tone, and RF
input power is adjusted for a 6 dB SINAD reading (-120 dBm). NR is then turned on, and
SINAD read at 30%, 50% and 60% (max.) NR settings.
Test conditions: 10.000 MHz LSB, 2.4 kHz Sharp, AGC MID, preamp off, ATT off, NR
off, NB off, Twin PBT neutral.
NR % SINAD dB
0 6
30 8
50 14
60 16(max.)
This shows an S/N improvement of 10 dB with NR at maximum for an SSB signal
roughly 5 dB above noise level. This is an approximate measurement, as the amount of
noise reduction is dependent on the original signal-to-noise ratio.
6: Manual Notch Filter (MNF) stopband attenuation and bandwidth. In this test, an RF
signal is applied at a level slightly more than 70 dB above MDS. The test signal is offset
1 kHz from the receive frequency to produce a test tone. The MNF is carefully tuned to
null out the tone completely at the receiver audio output. The stopband attenuation is
equal to the difference between the test signal power and MDS.
Test conditions: 14.100 MHz USB at -70 dBm (S9), 2.4 kHz Sharp, AGC MID, preamp
off, ATT = 0 dB, NR off, NB off, MNF on, Twin PBT neutral.
Results: MNF nulls out signal completely. Measured MDS was -125.5 dBm per Test 1. A
-50 dBm test signal was applied.
Thus, stopband attenuation ≈ 75dB (= -125 – {-50})
The receive frequency is now offset on either side of the null. The frequencies at which
the audio output rises by 6 dB are noted. The -6 dB bandwidth is the difference between
these two frequencies.
MNF -6 dB BW
Wide 139 Hz
Mid 100 Hz
Narrow 63 Hz
13
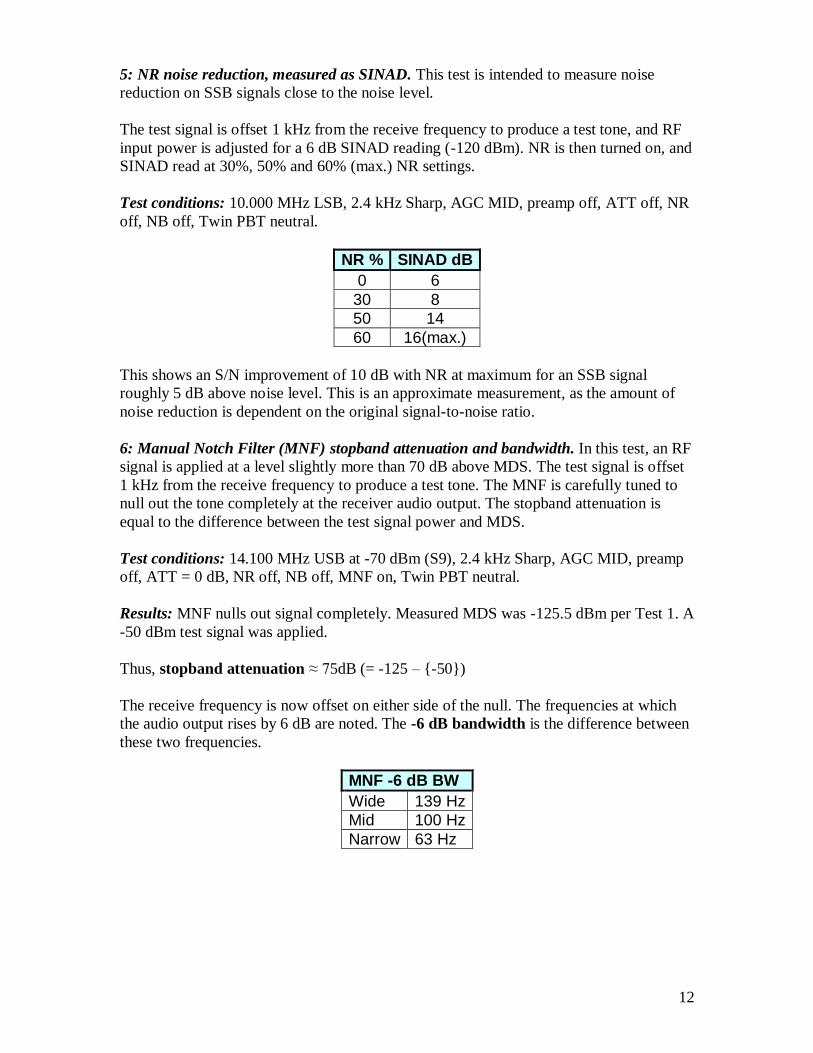
Fig. 7: Manual Notch Filter (WIDE).
Fig. 8: Manual Notch Filter (MID).
Fig. 9: Manual Notch Filter (NAR).
The above figures depict the Manual Notch Filter stopband for Wide, Mid and Narrow
settings. Due to the limited dynamic range of the measurement method, the amplitude
scale is not accurate.
14
7: AGC impulse response. The purpose of this test is to determine the IC-7600's AGC
response in the presence of fast-rising impulsive RF events. Two types of event are
applied to the receiver input; RF bursts with a fast-rising wavefront, and pulse trains with
short rise times.
Test conditions: 14.100 MHz USB for 7a (10.000 MHz for 7b), 2.4 kHz SSB filter
(Sharp), NR off, NB off, Preamp off for 7a (Preamp 2 for 7b), AGC Fast, with decay
time set to 0.1 sec.
7a: RF bursts. A pulse generator applies a pulse train to the modulation input of the RF
signal generator. The test is performed at two steady-state RF power levels: -20 dBm (S9
+ 50 dB) and -7 dBm (S9 + 60 dB) at 14.100 MHz. The pulse generator is adjusted to
generate RF bursts of 1.2 µS duration. Burst rise time (to -3 dBr) is 200 nS. Pulse period
is 600 mS. The IC-7600 is tuned to 14.099 MHz to produce a 1 kHz test tone at the audio
output.
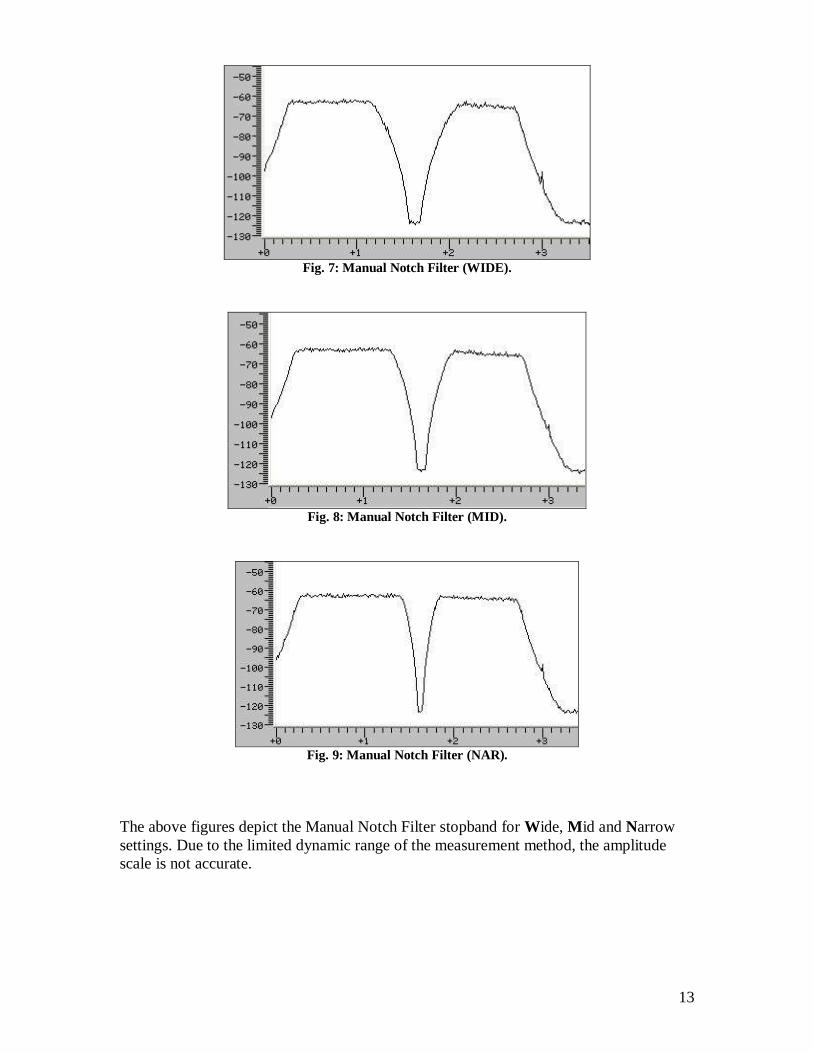
At -7 dBm, the S-meter peaks to S9 + 20 dB. The result for -20 dBm is similar. The AGC
recovers completely in ≈ 100 mS. There is no evidence of AGC clamping. In Fig. 10, the
dark blue bars are the inter-pulse intervals, and the light blue bars are the AGC recovery
intervals.
Fig. 10: AGC response for RF bursts at -10 dBm.
15
7b: Test with pulse trains. Here, the pulse generator is coupled to the IC-7600 RF input
via the pick-off port of a line sampler. The sampler's main port is terminated in 50Ω. The
IC-7600 is tuned to 10 MHz, as the RF spectral distribution of the test pulse train has a
strong peak in that band. AGC Fast (0.1 sec) is selected as before, but Preamp 2 is
selected.
The pulse rise time (to 70% of peak amplitude) is 10 nS. Three pulse durations are used:
30, 50 and 100 nS. In all cases, pulse period is 600 mS. Pulse amplitude is 16Vpk (e.m.f.)
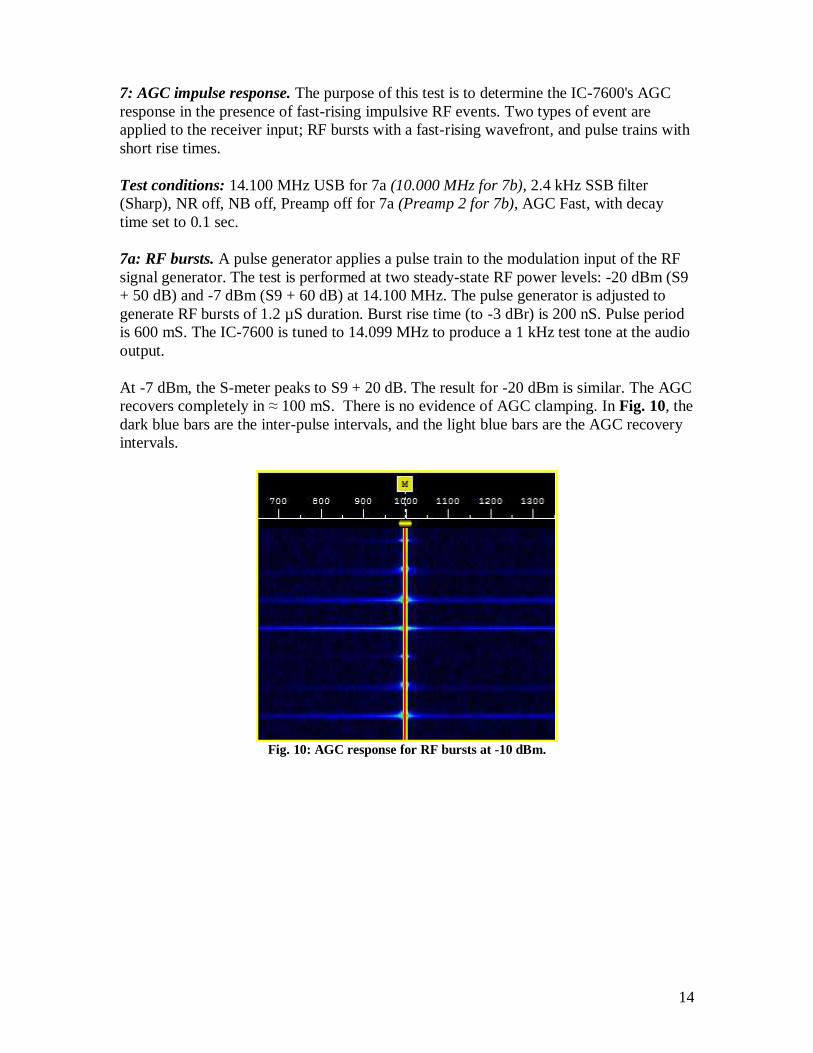
As in Test 7a, the AGC recovers completely; there is no evidence of clamping.
Pulse duration nS AGC recovery mS S-meter reading
30 ≈ 100 (no clamping) S6
50 ≈ 100 (no clamping) S8
100 ≈ 100 (no clamping) S8
Fig. 11: AGC response for pulse trains. (30 nS duration).
8: Noise blanker (NB) impulse response. As the IC-7600's noise blanker is a DSP
process "upstream" of the AGC derivation point, the NB should be very effective in
suppressing impulsive RF events before they can stimulate the AGC. To verify this, the
NB is turned on during Test 7b (above). NB Level is adjusted for best suppression of the
test pulses.
At 30 nS pulse duration, the S-meter deflection is completely suppressed, showing that
the impulsive events never reach the AGC derivation point. At NB Level = 80%, Depth
8*, Width 50*, slight ticks are heard. At Width 100, the pulse ticks are almost inaudible;
a very faint “chuff” sound is heard for each pulse. Signals and/or band noise would mask
this completely.
Next, NR is activated. With NR at 50% and NB on, the ticks are completely inaudible.
*default values
16
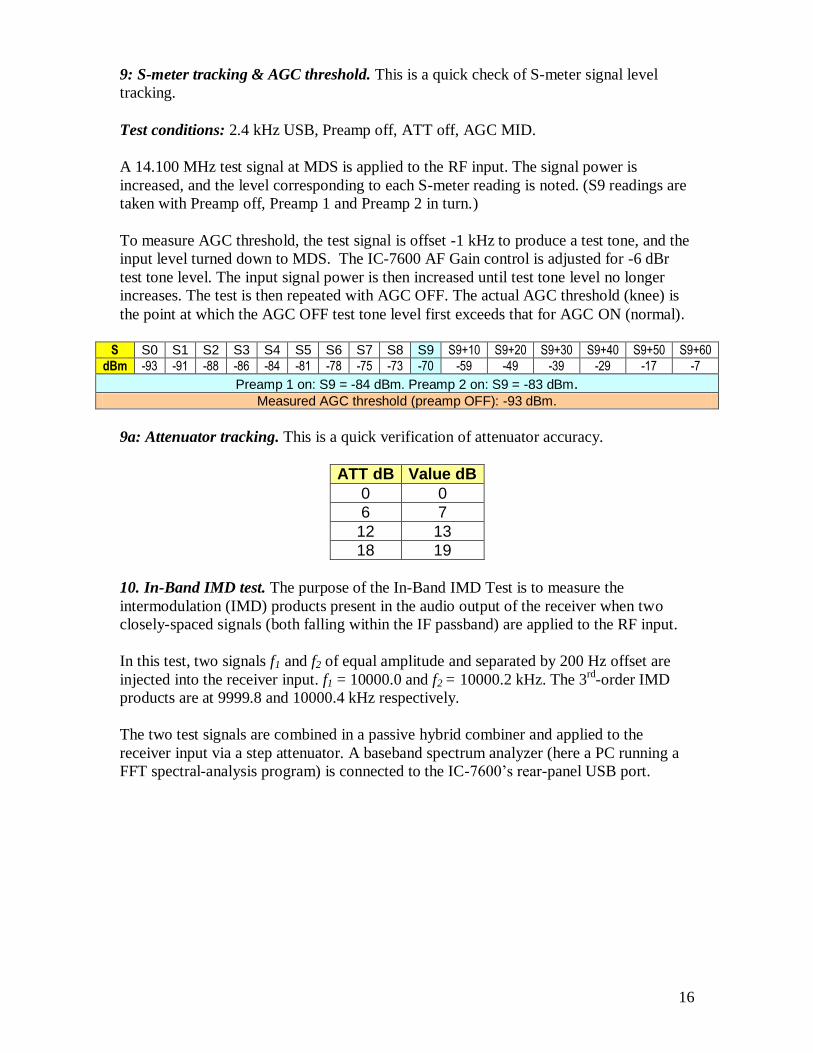
9: S-meter tracking & AGC threshold. This is a quick check of S-meter signal level
tracking.
Test conditions: 2.4 kHz USB, Preamp off, ATT off, AGC MID.
A 14.100 MHz test signal at MDS is applied to the RF input. The signal power is
increased, and the level corresponding to each S-meter reading is noted. (S9 readings are
taken with Preamp off, Preamp 1 and Preamp 2 in turn.)
To measure AGC threshold, the test signal is offset -1 kHz to produce a test tone, and the
input level turned down to MDS. The IC-7600 AF Gain control is adjusted for -6 dBr
test tone level. The input signal power is then increased until test tone level no longer
increases. The test is then repeated with AGC OFF. The actual AGC threshold (knee) is
the point at which the AGC OFF test tone level first exceeds that for AGC ON (normal).
S S0 S1 S2 S3 S4 S5 S6 S7 S8 S9 S9+10 S9+20 S9+30 S9+40 S9+50 S9+60
dBm -93 -91 -88 -86 -84 -81 -78 -75 -73 -70 -59 -49 -39 -29 -17 -7
Preamp 1 on: S9 = -84 dBm. Preamp 2 on: S9 = -83 dBm. Measured AGC threshold (preamp OFF): -93 dBm.
9a: Attenuator tracking. This is a quick verification of attenuator accuracy.
ATT dB Value dB
0 0
6 7
12 13
18 19
10. In-Band IMD test. The purpose of the In-Band IMD Test is to measure the
intermodulation (IMD) products present in the audio output of the receiver when two
closely-spaced signals (both falling within the IF passband) are applied to the RF input.
In this test, two signals f1 and f2 of equal amplitude and separated by 200 Hz offset are
injected into the receiver input. f1 = 10000.0 and f2 = 10000.2 kHz. The 3rd
-order IMD
products are at 9999.8 and 10000.4 kHz respectively.
The two test signals are combined in a passive hybrid combiner and applied to the
receiver input via a step attenuator. A baseband spectrum analyzer (here a PC running a
FFT spectral-analysis program) is connected to the IC-7600’s rear-panel USB port.
17
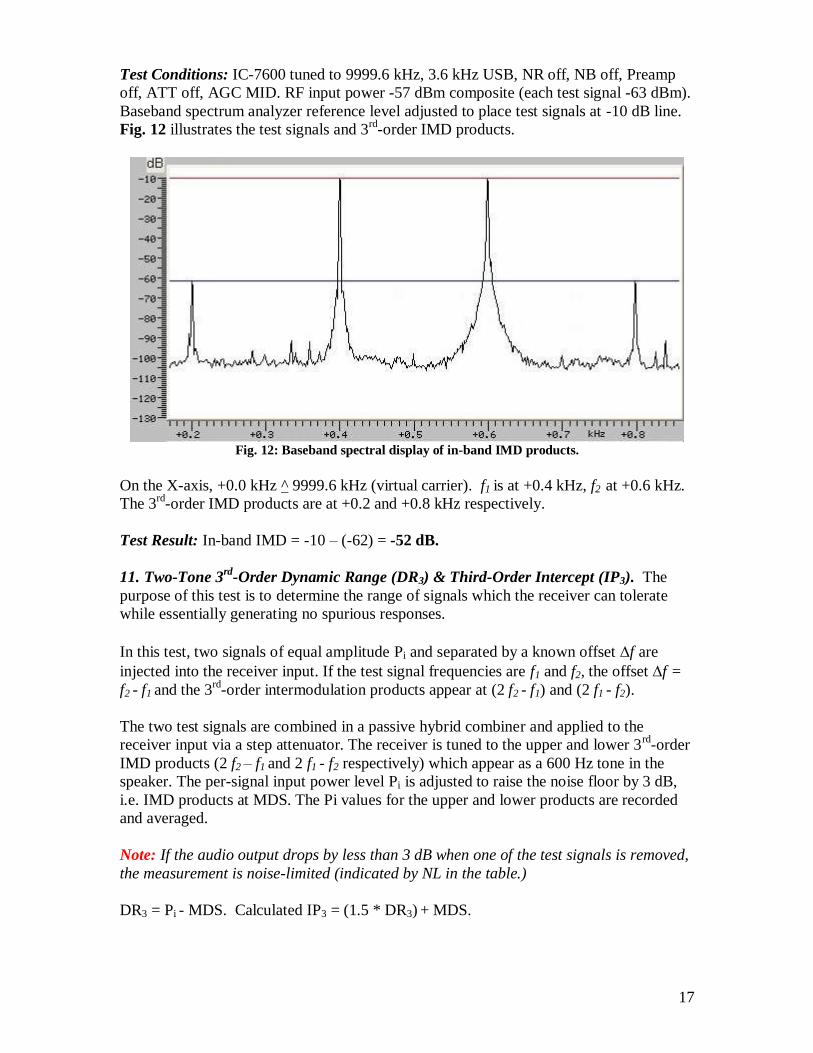
Test Conditions: IC-7600 tuned to 9999.6 kHz, 3.6 kHz USB, NR off, NB off, Preamp
off, ATT off, AGC MID. RF input power -57 dBm composite (each test signal -63 dBm).
Baseband spectrum analyzer reference level adjusted to place test signals at -10 dB line.
Fig. 12 illustrates the test signals and 3rd
-order IMD products.
Fig. 12: Baseband spectral display of in-band IMD products.
On the X-axis, +0.0 kHz ^ 9999.6 kHz (virtual carrier). f1 is at +0.4 kHz, f2 at +0.6 kHz.
The 3rd
-order IMD products are at +0.2 and +0.8 kHz respectively.
Test Result: In-band IMD = -10 – (-62) = -52 dB.
11. Two-Tone 3rd
-Order Dynamic Range (DR3) & Third-Order Intercept (IP3). The
purpose of this test is to determine the range of signals which the receiver can tolerate
while essentially generating no spurious responses.
In this test, two signals of equal amplitude Pi and separated by a known offset f are
injected into the receiver input. If the test signal frequencies are f1 and f2, the offset f =
f2 - f1 and the 3rd
-order intermodulation products appear at (2 f2 - f1) and (2 f1 - f2).
The two test signals are combined in a passive hybrid combiner and applied to the
receiver input via a step attenuator. The receiver is tuned to the upper and lower 3rd
-order
IMD products (2 f2 – f1 and 2 f1 - f2 respectively) which appear as a 600 Hz tone in the
speaker. The per-signal input power level Pi is adjusted to raise the noise floor by 3 dB,
i.e. IMD products at MDS. The Pi values for the upper and lower products are recorded
and averaged.
Note: If the audio output drops by less than 3 dB when one of the test signals is removed,
the measurement is noise-limited (indicated by NL in the table.)
DR3 = Pi - MDS. Calculated IP3 = (1.5 * DR3) + MDS.
18
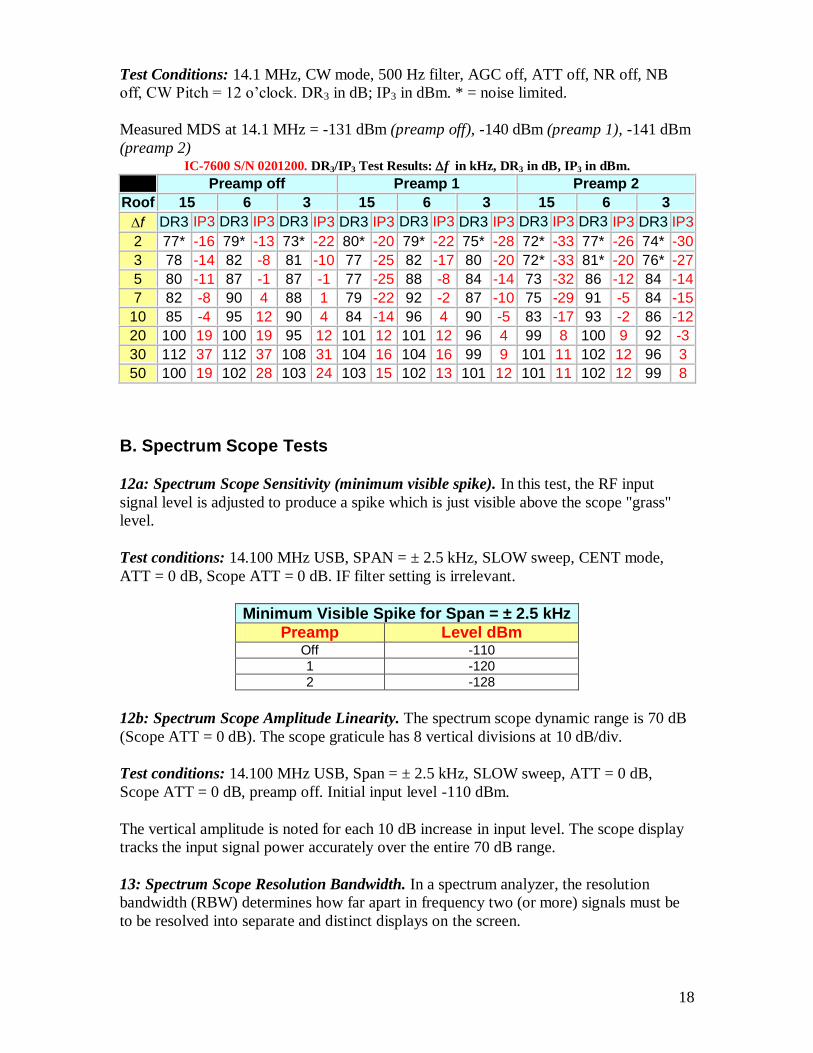
Test Conditions: 14.1 MHz, CW mode, 500 Hz filter, AGC off, ATT off, NR off, NB
off, CW Pitch = 12 o’clock. DR3 in dB; IP3 in dBm. * = noise limited.
Measured MDS at 14.1 MHz = -131 dBm (preamp off), -140 dBm (preamp 1), -141 dBm
(preamp 2) IC-7600 S/N 0201200. DR3/IP3 Test Results:f in kHz, DR3 in dB, IP3 in dBm.
Preamp off Preamp 1 Preamp 2
Roof 15 6 3 15 6 3 15 6 3
f DR3 IP3 DR3 IP3 DR3 IP3 DR3 IP3 DR3 IP3 DR3 IP3 DR3 IP3 DR3 IP3 DR3 IP3
2 77* -16 79* -13 73* -22 80* -20 79* -22 75* -28 72* -33 77* -26 74* -30
3 78 -14 82 -8 81 -10 77 -25 82 -17 80 -20 72* -33 81* -20 76* -27
5 80 -11 87 -1 87 -1 77 -25 88 -8 84 -14 73 -32 86 -12 84 -14
7 82 -8 90 4 88 1 79 -22 92 -2 87 -10 75 -29 91 -5 84 -15
10 85 -4 95 12 90 4 84 -14 96 4 90 -5 83 -17 93 -2 86 -12
20 100 19 100 19 95 12 101 12 101 12 96 4 99 8 100 9 92 -3
30 112 37 112 37 108 31 104 16 104 16 99 9 101 11 102 12 96 3
50 100 19 102 28 103 24 103 15 102 13 101 12 101 11 102 12 99 8
B. Spectrum Scope Tests
12a: Spectrum Scope Sensitivity (minimum visible spike). In this test, the RF input
signal level is adjusted to produce a spike which is just visible above the scope "grass"
level.
Test conditions: 14.100 MHz USB, SPAN = ± 2.5 kHz, SLOW sweep, CENT mode,
ATT = 0 dB, Scope ATT = 0 dB. IF filter setting is irrelevant.
Minimum Visible Spike for Span = ± 2.5 kHz
Preamp Level dBm Off -110 1 -120
2 -128
12b: Spectrum Scope Amplitude Linearity. The spectrum scope dynamic range is 70 dB
(Scope ATT = 0 dB). The scope graticule has 8 vertical divisions at 10 dB/div.
Test conditions: 14.100 MHz USB, Span = ± 2.5 kHz, SLOW sweep, ATT = 0 dB,
Scope ATT = 0 dB, preamp off. Initial input level -110 dBm.
The vertical amplitude is noted for each 10 dB increase in input level. The scope display
tracks the input signal power accurately over the entire 70 dB range.
13: Spectrum Scope Resolution Bandwidth. In a spectrum analyzer, the resolution
bandwidth (RBW) determines how far apart in frequency two (or more) signals must be
to be resolved into separate and distinct displays on the screen.
19
Test conditions: Span = ± 2.5 kHz, SLOW sweep, ATT = 0 dB, Scope ATT = 0 dB,
preamp off. Calibration Marker is on.
To measure RBW, a test signal is injected into the antenna input at a level sufficient to
produce a spike whose vertical amplitude is equal to that of the Calibration Marker.
Initially, the test signal is approx. 10 kHz above the selected Marker spike. (Example:
Marker at 14100 kHz; test signal at 14110 kHz.). To ensure an accurate amplitude
display, sweep speed is set to SLOW for all SPAN settings. For each SPAN value, the
test signal is moved closer to the Marker spike until two distinct spikes are just
observable.
Span ± kHz RBW Hz
2.5 100
5 200
10 500
25 1k
50 1k
100 2.5k
250 4k
C. Transmitter Tests
13: CW Power Output. In this test, the RF power output into a 50Ω load is measured at
14.00 MHz in CW or RTTY mode, at a primary DC supply voltage of +13.8V and with
Drive set at 50% (default).
RF Power % Po Meter % Power Output W
Freq. MHz 3.6 14.1 50.1
70 75 102 100 63
100 100 137 135 100
13a. Transverter Jack Power Output. The RF output into a 50Ω load is measured at
14.00 MHz in RTTY mode at the X-VERTER jack.
RF Power Min. 50% Max.
Meas. dBm -15 -5 -1
20
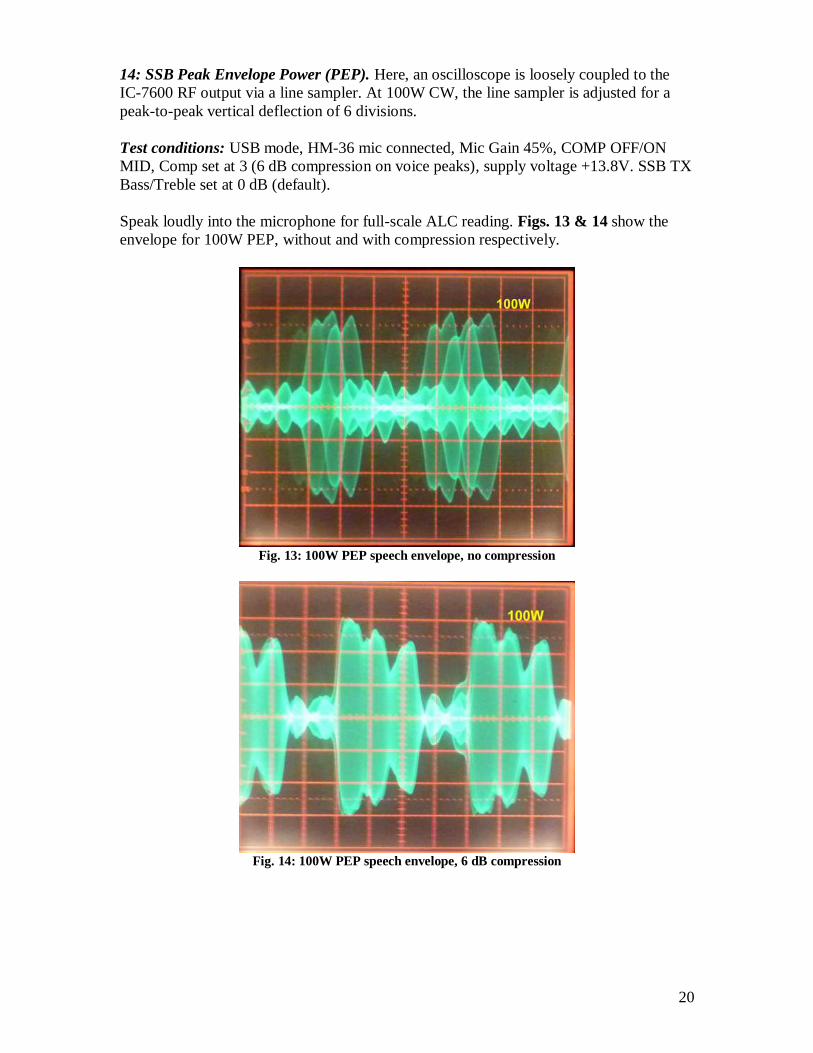
14: SSB Peak Envelope Power (PEP). Here, an oscilloscope is loosely coupled to the
IC-7600 RF output via a line sampler. At 100W CW, the line sampler is adjusted for a
peak-to-peak vertical deflection of 6 divisions.
Test conditions: USB mode, HM-36 mic connected, Mic Gain 45%, COMP OFF/ON
MID, Comp set at 3 (6 dB compression on voice peaks), supply voltage +13.8V. SSB TX
Bass/Treble set at 0 dB (default).
Speak loudly into the microphone for full-scale ALC reading. Figs. 13 & 14 show the
envelope for 100W PEP, without and with compression respectively.
Fig. 13: 100W PEP speech envelope, no compression
Fig. 14: 100W PEP speech envelope, 6 dB compression
21
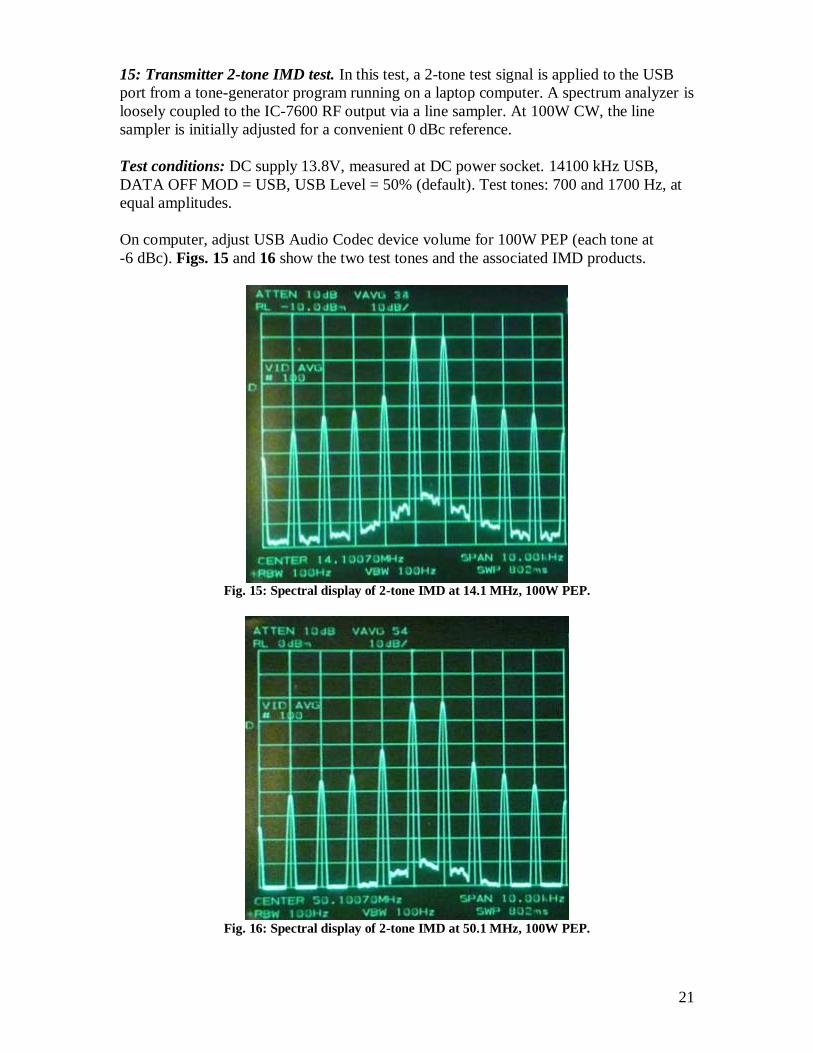
15: Transmitter 2-tone IMD test. In this test, a 2-tone test signal is applied to the USB
port from a tone-generator program running on a laptop computer. A spectrum analyzer is
loosely coupled to the IC-7600 RF output via a line sampler. At 100W CW, the line
sampler is initially adjusted for a convenient 0 dBc reference.
Test conditions: DC supply 13.8V, measured at DC power socket. 14100 kHz USB,
DATA OFF MOD = USB, USB Level = 50% (default). Test tones: 700 and 1700 Hz, at
equal amplitudes.
On computer, adjust USB Audio Codec device volume for 100W PEP (each tone at
-6 dBc). Figs. 15 and 16 show the two test tones and the associated IMD products.
Fig. 15: Spectral display of 2-tone IMD at 14.1 MHz, 100W PEP.
Fig. 16: Spectral display of 2-tone IMD at 50.1 MHz, 100W PEP.
22
2-tone IMD Products at 100W PEP
IMD Products Relative level (0 dBc = 2-tone PEP)
14.1 MHz 50.1 MHz
IMD3 (3rd-order) -31 dBc -27 dBc
IMD5 (5th-order) -38 dBc -37 dBc
IMD7 (7th-order) -40 dBc -39 dBc
IMD9 (9th-order) -47 dBc -44 dBc
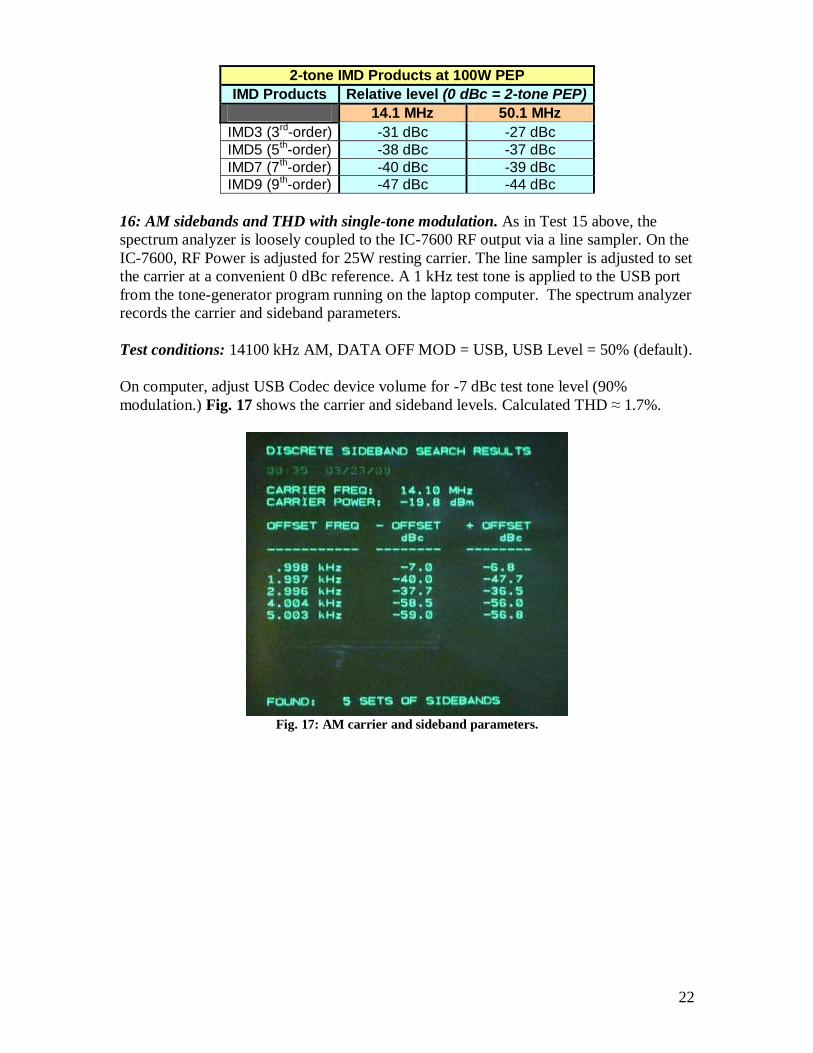
16: AM sidebands and THD with single-tone modulation. As in Test 15 above, the
spectrum analyzer is loosely coupled to the IC-7600 RF output via a line sampler. On the
IC-7600, RF Power is adjusted for 25W resting carrier. The line sampler is adjusted to set
the carrier at a convenient 0 dBc reference. A 1 kHz test tone is applied to the USB port
from the tone-generator program running on the laptop computer. The spectrum analyzer
records the carrier and sideband parameters.
Test conditions: 14100 kHz AM, DATA OFF MOD = USB, USB Level = 50% (default).
On computer, adjust USB Codec device volume for -7 dBc test tone level (90%
modulation.) Fig. 17 shows the carrier and sideband levels. Calculated THD ≈ 1.7%.
Fig. 17: AM carrier and sideband parameters.
23
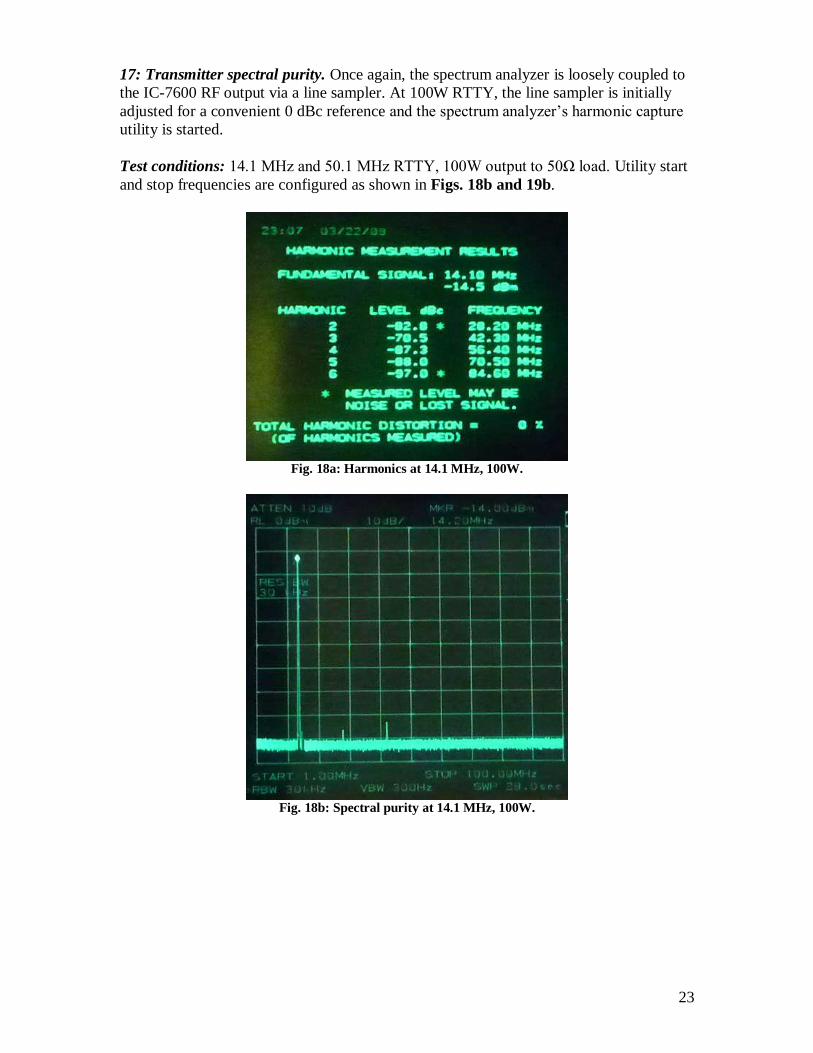
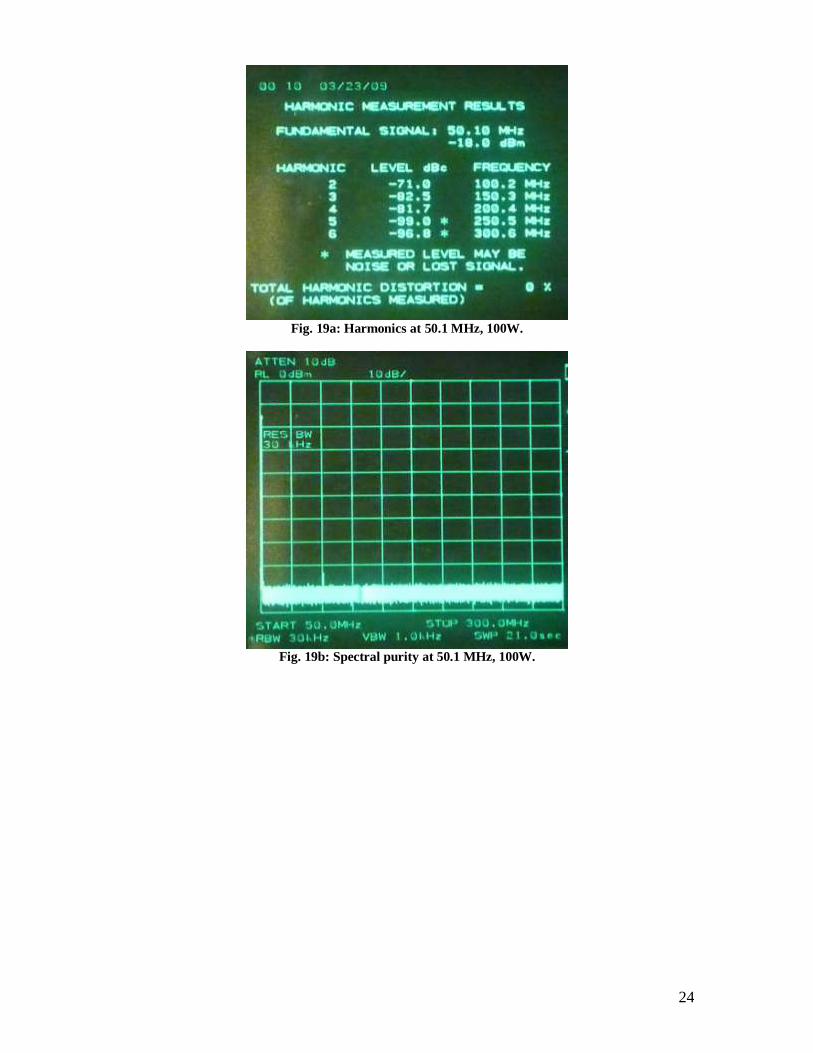
17: Transmitter spectral purity. Once again, the spectrum analyzer is loosely coupled to
the IC-7600 RF output via a line sampler. At 100W RTTY, the line sampler is initially
adjusted for a convenient 0 dBc reference and the spectrum analyzer’s harmonic capture
utility is started.
Test conditions: 14.1 MHz and 50.1 MHz RTTY, 100W output to 50Ω load. Utility start
and stop frequencies are configured as shown in Figs. 18b and 19b.
Fig. 18a: Harmonics at 14.1 MHz, 100W.
Fig. 18b: Spectral purity at 14.1 MHz, 100W.
24
Fig. 19a: Harmonics at 50.1 MHz, 100W.
Fig. 19b: Spectral purity at 50.1 MHz, 100W.
25
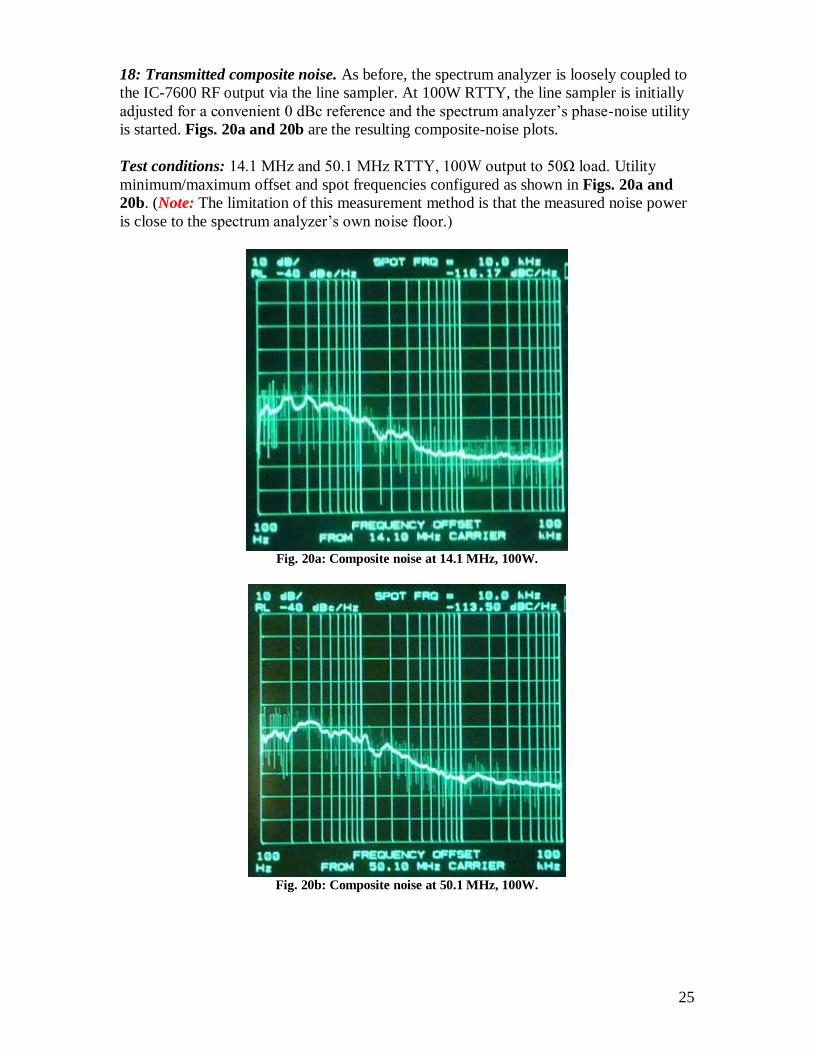
18: Transmitted composite noise. As before, the spectrum analyzer is loosely coupled to
the IC-7600 RF output via the line sampler. At 100W RTTY, the line sampler is initially
adjusted for a convenient 0 dBc reference and the spectrum analyzer’s phase-noise utility
is started. Figs. 20a and 20b are the resulting composite-noise plots.
Test conditions: 14.1 MHz and 50.1 MHz RTTY, 100W output to 50Ω load. Utility
minimum/maximum offset and spot frequencies configured as shown in Figs. 20a and
20b. (Note: The limitation of this measurement method is that the measured noise power
is close to the spectrum analyzer’s own noise floor.)
Fig. 20a: Composite noise at 14.1 MHz, 100W.
Fig. 20b: Composite noise at 50.1 MHz, 100W.
26
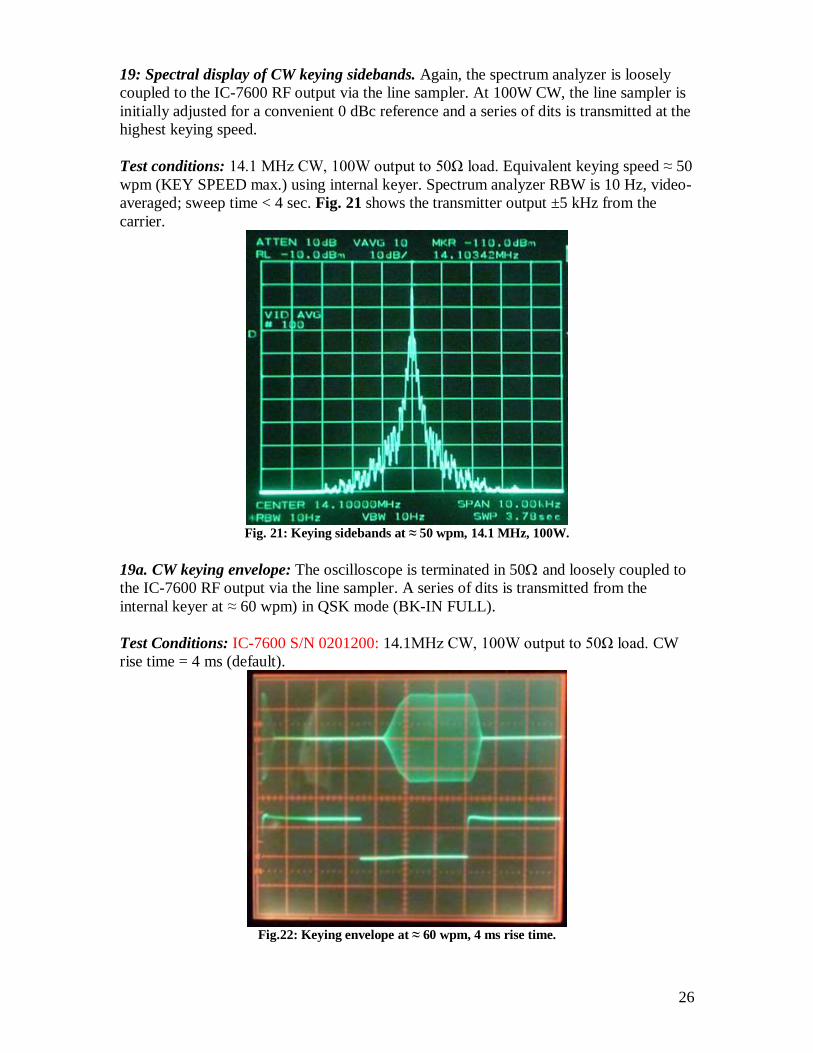
19: Spectral display of CW keying sidebands. Again, the spectrum analyzer is loosely
coupled to the IC-7600 RF output via the line sampler. At 100W CW, the line sampler is
initially adjusted for a convenient 0 dBc reference and a series of dits is transmitted at the
highest keying speed.
Test conditions: 14.1 MHz CW, 100W output to 50Ω load. Equivalent keying speed ≈ 50
wpm (KEY SPEED max.) using internal keyer. Spectrum analyzer RBW is 10 Hz, video-
averaged; sweep time < 4 sec. Fig. 21 shows the transmitter output ±5 kHz from the
carrier.
Fig. 21: Keying sidebands at ≈ 50 wpm, 14.1 MHz, 100W.
19a. CW keying envelope: The oscilloscope is terminated in 50 and loosely coupled to
the IC-7600 RF output via the line sampler. A series of dits is transmitted from the
internal keyer at ≈ 60 wpm) in QSK mode (BK-IN FULL).
Test Conditions: IC-7600 S/N 0201200: 14.1MHz CW, 100W output to 50Ω load. CW
rise time = 4 ms (default).
Fig.22: Keying envelope at ≈ 60 wpm, 4 ms rise time.
27
20: ACC (1) Pin 4 (analog baseband input) level for 100W output. A test tone is
injected into ACC (1) Pin 4, and the input voltage required for 100W RF output is noted.
Test conditions: 14100 kHz USB, DATA OFF MOD = ACC, DATA-1 MOD = ACC,
test tone 1 kHz.
Adjust test tone level for 100W output in USB and USB-D1 modes. The required input
levels were 56 mV rms for USB, and 81 mV rms for USB-D1.
21: Autotuner (ATU) insertion loss. In this test, the transmitter is set for 100W output
(P1) on various bands. On each band, the ATU is activated and tuned, and the output (P2)
measured and noted. ATU insertion loss = 10 log10 (P2/P1).
Test conditions: RTTY mode, 3.6, 14.1 and 50.1 MHz successively, P1 = 100W, RF
power meter and 50 resistive load connected to ANT1.
Freq. MHz P1 (ATU out) P2 (ATU out) ATU insertion loss
3.6 100 91 0.4
14.1 100 89 0.5
50.1 100 85 0.7
21a: Autotuner “hunting” check. In this test, the ATU is activated and tuned at 100W
output on each band in turn. On each band, a brief SSB transmission is made, during
which the tester checks aurally for ATU sounds and visually for random SWR “flutter”
above 1:1.
Test conditions: 1: RTTY mode, midband frequency on each band in turn, Po = 100W,
RF power meter and 50 resistive load connected to ANT1. 2: Brief voice transmission
in SSB mode.
No audible or visible evidence of ATU “hunting” was observed on any band.
21b: SWR scale accuracy. The SWR scale is read with 50and 100 resistive loads
connected in turn to ANT1. To minimize the effect of line lengths on measurement
accuracy, this test is run at 1.8 MHz. The RF POWER setting remains unchanged when
switching loads.
Test conditions: 1.81 MHz RTTY. Po = 10W into 50load.
Nominal Load DC Resistance SWR Reading
50 50.1 1.0:1
100 100.9 ≈ 2:1
Note that with 100 load, the SWR reading is dependent on Po.
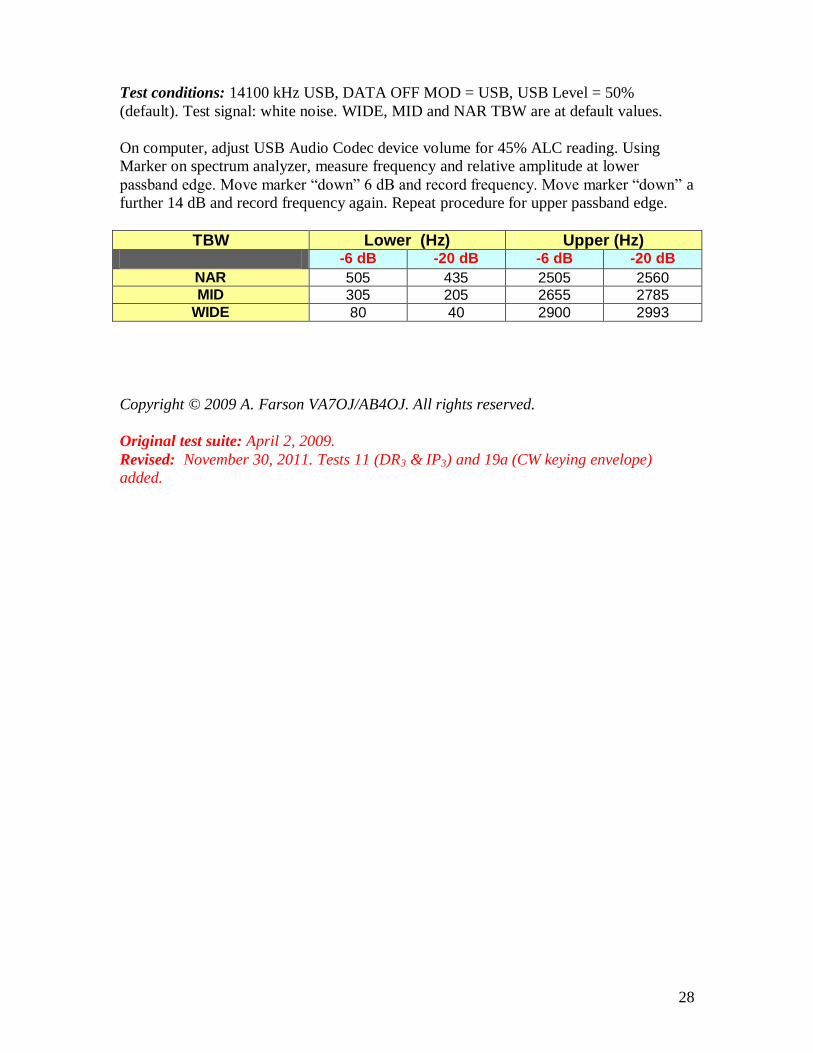
22: SSB transmit audio-frequency response. In this test, a white-noise baseband is
applied to the USB port from a tone-generator program running on a laptop computer.
The spectrum analyzer is loosely coupled to the IC-7600 RF output via the line sampler.
At 100W CW, the line sampler is initially adjusted for a convenient 0 dBc reference.
28
Test conditions: 14100 kHz USB, DATA OFF MOD = USB, USB Level = 50%
(default). Test signal: white noise. WIDE, MID and NAR TBW are at default values.
On computer, adjust USB Audio Codec device volume for 45% ALC reading. Using
Marker on spectrum analyzer, measure frequency and relative amplitude at lower
passband edge. Move marker “down” 6 dB and record frequency. Move marker “down” a
further 14 dB and record frequency again. Repeat procedure for upper passband edge.
TBW Lower (Hz) Upper (Hz)
-6 dB -20 dB -6 dB -20 dB
NAR 505 435 2505 2560 MID 305 205 2655 2785
WIDE 80 40 2900 2993
Copyright © 2009 A. Farson VA7OJ/AB4OJ. All rights reserved.
Original test suite: April 2, 2009.
Revised: November 30, 2011. Tests 11 (DR3 & IP3) and 19a (CW keying envelope)
added.


![41 Projects Using IC 741 OP-AMP[1]](https://img.pdfslide.net/doc/110x75/5695cfa41a28ab9b028eedd3/41-projects-using-ic-741-op-amp1.jpg)