Embed Size (px)
Citation preview

August 4, 2016
Icahn Enterprises L.P.
Q2 2016 Earnings Presentation

Safe Harbor Statement
Forward-Looking Statements and Non-GAAP Financial Measures
The Private Securities Litigation Reform Act of 1995 provides a "safe harbor" for forward-
looking statements we make in this presentation, including statements regarding our future
performance and plans for our businesses and potential acquisitions. These forward-
looking statements involve risks and uncertainties that are discussed in our filings with the
Securities and Exchange Commission, including economic, competitive, legal and other
factors. Accordingly, there is no assurance that our expectations will be realized. We
assume no obligation to update or revise any forward-looking statements should
circumstances change, except as otherwise required by law. This presentation also
includes certain non-GAAP financial measures.
2

Q2 2016 Highlights and Recent Developments
Board declared $1.50 quarterly dividend payable in either cash or additional units
Net loss attributable to Icahn Enterprises for Q2 2016 was $69 million, compared to net
income of $212 million for Q2 2015
On April 1, 2016, CVR Partners completed its acquisition of CVR Nitrogen, LP (formerly
known as East Dubuque Nitrogen Partners) and began consolidating their results under our
Energy Segment
On June 17, 2016, IEP issued a revised proposal to the board of directors of Federal-Mogul to
purchase the remaining shares of Federal-Mogul common stock not owned by IEP from $7.00
per share to $8.00 per share
3

Consolidated Results
4
Consolidated Results
($ millions) 2016 2015 2016 2015
Select Income Statement Data:
Revenues $4,350 $4,984 $7,477 $9,495
Expenses 4,585 4,330 9,305 8,370
(Loss) income before income tax expense (235) 654 (1,828) 1,125
Income tax expense (50) (113) (66) (162)
Net (loss) income (285) 541 (1,894) 963
Less: net loss (income) attributable to non controlling interests 216 (329) 988 (590)
Net (loss) income attributable to Icahn Enterprises ($69) $212 ($906) $373
Three Months Ended
June 30,
Six Months Ended
June 30,

Financial Performance
Adjusted EBITDA Attributable to Icahn Enterprises Net Income Attributable to Icahn Enterprises
5
($69)
$212
($906)
$373
Q2 2016 Q2 2015 YTD 2016 YTD 2015
$307
$622
$227 $1,200
Q2 2016 Q2 2015 YTD 2016 YTD 2015
($ in millions) 2016 2015 2016 2015 ($ in millions) 2016 2015 2016 2015
Investment ($94) $238 ($511) $482 Investment ($107) $176 ($557) $360
Automotive 197 153 368 266 Automotive 35 25 56 7
Energy 55 127 87 268 Energy 22 88 (331) 131
Metals (1) (3) (7) (12) Metals (1) (5) (7) (14)
Railcar 102 83 199 151 Railcar 44 36 80 63
Gaming 24 23 46 43 Gaming 6 6 9 11
Mining 2 (1) (3) (1) Mining (4) (4) (14) (4)
Food Packaging 10 13 18 23 Food Packaging 2 4 5 4
Real Estate 11 12 20 22 Real Estate 5 8 9 31
Home Fashion 1 1 3 3 Home Fashion (2) (1) (2) (2)
Holding Company - (24) 7 (45) Holding Company (69) (121) (154) (214)
$307 $622 $227 $1,200 ($69) $212 ($906) $373
Three Months Ended June 30, Six Months Ended June 30, Three Months Ended June 30, Six Months Ended June 30,
Adjusted EBITDA attributable to Icahn Enterprises Net (loss) income attributable to Icahn Enterprises
Net (loss) income attributable to Icahn
Enterprises
Adjusted EBITDA attributable to Icahn
Enterprises

Highlights and Recent Developments
Returns of -6.0% for Q2 2016
From inception in November 2004, the Funds' gross return is 122%, representing
an annualized rate of return of approximately 7% through June 30, 2016
Significant Holdings
As of June 30, 2016 (1)
Company
Mkt. Value
($mm)(2)
%
Ownership(3)
$2,414 4.1%
$1,238 2.8%
$1,227 13.9%
$1,159 8.3%
$995 18.3%
Segment: Investment
Company Description
IEP invests its proprietary capital through various
private investment funds (the “Funds”) managed
by the Investment segment
Fair value of IEP’s interest in the Funds was
approximately $1.7 billion as of June 30, 2016
Summary Segment Financial Results
6
(1) Aggregate ownership held directly by the Funds, as well as Carl Icahn and his affiliates. Based on most recent 13F
Holdings Reports, 13D flings or other public filings.
(2) Based on closing share price as of specified date.
(3) Total shares owned as a percentage of common shares issued and outstanding.
Investment Segment
($ millions) 2016 2015 2016 2015
Select Income Statement Data:
Total revenues ($287) $653 ($1,195) $1,272
Adjusted EBITDA (306) 523 (1,202) 1,042
Net (loss) income (351) 382 (1,334) 778
Adjusted EBITDA attrib. to IEP ($94) $238 ($511) $482
Net (loss) income attrib. to IEP (107) 176 (557) 360
Returns -6.0% 3.9% -18.0% 8.4%
Three Months Ended
June 30,
Six Months Ended
June 30,

Highlights and Recent Developments
CVR Energy Q2 2016 Highlights
─ Announced Q2 2016 cash dividend of $0.50 per share, bringing the
cumulative cash dividends paid or declared for the first six months of 2016 to
$1.00 per share
CVR Refining Q2 2016 Results
─ Operating results were negatively affected by weak crack spreads and
escalating RIN costs
─ Adjusted EBITDA of $85 million compared to $194 million in Q2 2015(1)
─ No Q2 2016 distribution was declared
CVR Partners Q2 2016 Results
─ Adjusted EBITDA of $29 million compared to $36 million in Q2 2015(2)
─ Average realized plant gate prices for UAN was $199 per ton, compared to
$269 per ton for the same period in 2015
─ Q2 2016 distribution declared of $0.17 per common unit, bringing the
cumulative cash distributions paid or declared for the first six months of 2016
to $0.44 per common unit
─ On April 1, 2016, CVR Partners completed its acquisition of CVR Nitrogen,
LP (formerly known as East Dubuque Nitrogen Partners)
Segment: Energy
Company Description
CVR Energy, Inc. (NYSE:CVI) operates as a holding
company that owns majority interests in two
separate operating subsidiaries: CVR Refining, LP
(NYSE:CVRR) and CVR Partners, LP (NYSE:UAN)
─ CVR Refining is an independent petroleum refiner
and marketer of high-value transportation fuels in
the mid-continent of the United States
─ CVR Partners is a manufacturer of ammonia and
urea ammonium nitrate solution fertilizer products
Summary Segment Financial Results
7 (1) Refer to CVRR 8-K filed 7/28/16 for the Adjusted EBITDA reconciliations.
(2) Refer to UAN 8-K filed 7/28/16 for the Adjusted EBITDA reconciliations.
Energy Segment
($ millions) 2016 2015 2016 2015Select Income Statement Data:
Net Sales $1,283 $1,624 $2,189 $3,013
Adjusted EBITDA 113 230 174 466
Net income (loss) 34 183 (580) 258
Adjusted EBITDA attrib. to IEP $55 $127 $87 $268
Net income (loss) attrib. to IEP 22 88 (331) 131
Capital Expenditures $35 $41 $83 $87
Three Months Ended
June 30,
Six Months Ended
June 30,

Segment: Automotive
Company Description
We conduct our Automotive segment through our majority
ownership in Federal-Mogul Holdings Corporation
(NasdaqGS:FDML) and our wholly owned subsidiaries, Pep
Boys and IEH Auto Parts Holding
Federal-Mogul operates with two end-customer focused
businesses. The Powertrain business focuses on original
equipment powertrain products for automotive applications.
The Motorparts business sells products including brakes,
chassis, wipers, and other vehicle components to the global
aftermarket and to original equipment manufacturers.
Pep Boys is a retailer and distributor of aftermarket auto
products and provider of automotive service.
IEH Auto is a distributor of aftermarket auto parts primarily to
auto service customers and wholesalers.
Summary Segment Financial Results
8
Federal-Mogul
Q2 2016 net sales was $1.9 billion, down 2% compared to the prior year period(1)
Net sales decreases driven largely by lower aftermarket sales and negative impact from
currency exchange rate fluctuations offset by the sales from the acquired valvetrain
business
Q2 2016 Operational EBITDA was $196 million(1), up $14 million or 8% compared to Q2
2015
Pep Boys and IEH Auto Parts Holding LLC
Pep Boys and IEH Auto are being operated together in order to grow their sales to
DIFM distributors and DIFM service professionals, to grow their automotive service
business, and to maintain their DIY customer bases by offering the newest and
broadest product assortment in the automotive aftermarket
Pep Boys and IEH Auto on a standalone basis had Q2 2016 revenue of approximately
$685 million and Adjusted EBITDA of $27 million
Highlights and Recent Developments
During Q1 2016, Icahn Enterprises completed the acquisition of all the outstanding
shares of Pep Boys
On June 17, 2016, IEP issued a revised proposal to the board of directors of Federal-
Mogul to purchase the remaining shares of Federal-Mogul common stock not owned by
IEP from $7.00 per share to $8.00 per share
(1) Refer to FDML 8-K filed 7/27/16
(2) Results include IEH Auto Parts Holding LLC effective June 1, 2015 and Pep Boys effective February 3, 2016
Automotive Segment(2)
($ millions) 2016 2015 2016 2015
Select Income Statement Data:
Total revenues $2,614 $2,044 $5,040 $3,889
Adjusted EBITDA 229 184 437 326
Net income 42 30 70 10
Adjusted EBITDA attrib. to IEP $197 $153 $368 $266
Net income income attrib. to IEP 35 25 56 7
Capital Expenditures $109 $109 $208 $217
Three Months Ended
June 30,
Six Months Ended
June 30,

Highlights and Recent Developments
On February 29, 2016, Icahn Enterprises entered into a contribution agreement
with IRL Holding, LLC, an affiliate of Mr. Icahn, to acquire the remaining 25%
economic interest in ARL
Railcar manufacturing
─ Railcar shipments for the three months ended June 30, 2016 of 1,017
railcars, including approximately 85 railcars to leasing customers
─ 5,601 railcar backlog as of June 30, 2016
Railcar leasing
─ Leasing revenues increased for Q2 2016 as compared to the prior year
period due to an increases in the number of railcars leased and in the
average lease rate
─ Combined ARL and ARI railcar lease fleets grew to 45,336 railcars as of
June 30, 2016 from approximately 45,050 at the end of 2015
ARI declared a quarterly cash dividend of $0.40 per share of common stock for
Q2 2016
Segment: Railcar
Segment Description
American Railcar Industries, Inc. (NASDAQ:ARII)
operates in three business segments:
manufacturing operations, railcar services and
leasing
American Railcar Leasing, LLC (“ARL”), is
engaged in the business of leasing railcars.
Summary Segment Financial Results
. 9
Railcar Segment
($ millions) 2016 2015 2016 2015
Net Sales/Other Revenues From Operations:
Manufacturing $107 $268 $254 $574
Railcar leasing 122 113 244 220
Railcar services 21 20 41 37
Eliminations (20) (191) (53) (401)
Total $230 $210 $486 $430
Gross Margin:
Manufacturing $16 $72 $41 $145
Railcar leasing 71 63 139 124
Railcar services 5 4 10 8
Eliminations 4 (38) 6 (86)
Total $96 $101 $196 $191
Adjusted EBITDA $121 $127 $245 $237
Adjusted EBITDA attrib. to IEP $102 $83 $199 $151
Capital Expenditures $23 $168 $62 $330
Three Months Ended
June 30,
Six Months Ended
June 30,
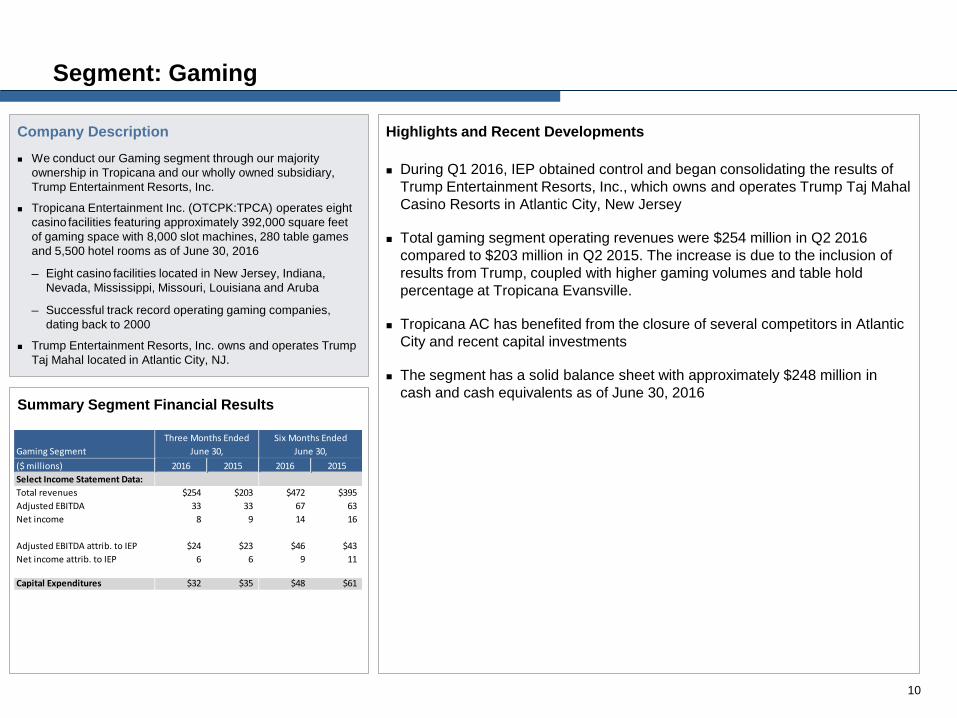
Highlights and Recent Developments
During Q1 2016, IEP obtained control and began consolidating the results of
Trump Entertainment Resorts, Inc., which owns and operates Trump Taj Mahal
Casino Resorts in Atlantic City, New Jersey
Total gaming segment operating revenues were $254 million in Q2 2016
compared to $203 million in Q2 2015. The increase is due to the inclusion of
results from Trump, coupled with higher gaming volumes and table hold
percentage at Tropicana Evansville.
Tropicana AC has benefited from the closure of several competitors in Atlantic
City and recent capital investments
The segment has a solid balance sheet with approximately $248 million in
cash and cash equivalents as of June 30, 2016
Segment: Gaming
Company Description
We conduct our Gaming segment through our majority
ownership in Tropicana and our wholly owned subsidiary,
Trump Entertainment Resorts, Inc.
Tropicana Entertainment Inc. (OTCPK:TPCA) operates eight
casino facilities featuring approximately 392,000 square feet
of gaming space with 8,000 slot machines, 280 table games
and 5,500 hotel rooms as of June 30, 2016
─ Eight casino facilities located in New Jersey, Indiana,
Nevada, Mississippi, Missouri, Louisiana and Aruba
─ Successful track record operating gaming companies,
dating back to 2000
Trump Entertainment Resorts, Inc. owns and operates Trump
Taj Mahal located in Atlantic City, NJ.
Summary Segment Financial Results
10
Gaming Segment
($ millions) 2016 2015 2016 2015
Select Income Statement Data:
Total revenues $254 $203 $472 $395
Adjusted EBITDA 33 33 67 63
Net income 8 9 14 16
Adjusted EBITDA attrib. to IEP $24 $23 $46 $43
Net income attrib. to IEP 6 6 9 11
Capital Expenditures $32 $35 $48 $61
Three Months Ended
June 30,
Six Months Ended
June 30,

Highlights and Recent Developments
Net sales for Q2 2016 were affected by lower sales volume and unfavorable
price and product mix
Consolidated adjusted EBITDA of $15 million in Q2 2016 was down $3 million
from the prior year period. Gross margin as a percentage of net sales was 26%
in Q2 2016 and Q2 2015
Viskase’s cash balance as of June 30, 2016 was $36 million
Segment: Food Packaging
Company Description
Viskase Companies, Inc (OTCPK:VKSC) is a
worldwide leader in the production and sale of
cellulosic, fibrous and plastic casings for the
processed meat and poultry industry
Leading worldwide manufacturer of non-edible
cellulosic casings for small-diameter meats (hot
dogs and sausages)
─ Leading manufacturer of non-edible fibrous
casings for large-diameter meats (sausages,
salami, hams and deli meats)
Summary Segment Financial Results
11
Food Packaging
($ millions) 2016 2015 2016 2015
Select Income Statement Data:
Net Sales $85 $91 $162 $176
Adjusted EBITDA 15 18 25 31
Net income 2 6 6 6
Adjusted EBITDA attrib. to IEP $10 $13 $18 $23
Net income attrib. to IEP 2 4 5 4
Capital Expenditures $3 $5 $6 $9
Three Months Ended
June 30,
Six Months Ended
June 30,

Highlights and Recent Developments
Net sales for Q2 2016 decreased by $27 million, or 26%, compared to the prior
year period
Adjusted EBITDA was a loss of $1 million in Q2 2016 compared to a loss of $3
million in Q2 2015
Committed to improving buying practices to improve materials margins
Segment: Metals
Company Description
PSC Metals, Inc. is one of the largest independent
metal recycling companies in the U.S.
Collects industrial and obsolete scrap metal,
processes it into reusable forms and supplies the
recycled metals to its customers
Strong regional footprint (Upper Midwest, St. Louis
Region and the South)
Summary Segment Financial Results
12
Metals Segment
($ millions) 2016 2015 2016 2015
Select Income Statement Data:
Net Sales $76 $103 $134 $209
Adjusted EBITDA (1) (3) (7) (12)
Net loss (1) (5) (7) (14)
Adjusted EBITDA attrib. to IEP ($1) ($3) ($7) ($12)
Net loss attrib. to IEP (1) (5) (7) (14)
Capital Expenditures $1 $4 $2 $19
Ferrous tons sold (in 000's) 185 233 357 439
Non-ferrous pounds sold (in 000's) 26,113 33,287 50,033 66,681
Three Months Ended
June 30,
Six Months Ended
June 30,

Highlights and Recent Developments
Business strategy is based on long-term investment outlook and operational expertise
Rental Real Estate Operations
Net lease portfolio overview
─ Single tenant (Over $100bn market cap, A- credit) for two large buildings with leases
through 2020 – 2021
─ 13 legacy properties with 2.9 million square feet: 12% Retail, 60% Industrial, 28% Office.
Maximize value of commercial lease portfolio through effective management of existing
properties
─ Seek to sell assets on opportunistic basis
Property Development
New Seabury in Cape Cod, Massachusetts and Grand Harbor in Vero Beach, Florida
include land for future residential development of approximately 239 and 1,128 units,
respectively
Opportunistically acquired Fontainebleau (Las Vegas casino development) in 2009 for $150
million
Club Operations
Club operations in New Seabury, Cape Cod and Grand Harbor, Vero Beach focus on
operating golf club and related activities
Segment: Real Estate
Company Description
Consists of rental real estate, property development
and club operations
Rental real estate consists primarily of retail, office
and industrial properties leased to single corporate
tenants
Property development is focused on the construction
and sale of single and multi-family houses, lots in
subdivisions and planned communities and raw land
for residential development
Club operations focus on operating golf club and
related activities.
Summary Segment Financial Results
13
Real Estate Segment
($ millions) 2016 2015 2016 2015
Select Income Statement Data:
Total revenues $24 $23 $43 $61
Adjusted EBITDA 11 12 20 22
Net income 5 8 9 31
Adjusted EBITDA attrib. to IEP $11 $12 $20 $22
Net income attrib. to IEP 5 8 9 31
Capital Expenditures $0 $1 $0 $1
Three Months Ended
June 30,
Six Months Ended
June 30,

Highlights and Recent Developments
Mining segment has been concentrating on sales in Brazil, where the best
margins are being captured
Iron ore prices have recovered significantly due to increased demand from
China
Segment: Mining
Company Description
IEP acquired a controlling interest in Ferrous
Resources on June 8, 2015
Ferrous Resources has certain rights to iron ore
mineral resources in Brazil and develops mining
operations and related infrastructure to produce
and sell iron ore products to the global steel
industry.
─ Significant iron ore assets in the State of Minas
Gerais, Brazil, known as Viga, Viga Norte,
Esperança, Serrinha and Santanense.
─ Mineral rights near Jacuípe in the State of
Bahia, Brazil.
Summary Segment Financial Results
14 1) Icahn Enterprises acquired majority ownership of Ferrous Resources on June 8, 2015
Mining(1)
($ millions) 2016 2015 2016 2015
Select Income Statement Data:
Net Sales $21 $6 $31 $6
Adjusted EBITDA 3 (1) (4) (1)
Net loss (5) (6) (18) (6)
Adjusted EBITDA attrib. to IEP $2 ($1) ($3) ($1)
Net loss attrib. to IEP (4) (4) (14) (4)
Capital Expenditures $3 $2 $5 $2
Three Months Ended
June 30,
Six Months Ended
June 30,

Highlights and Recent Developments
Q2 2016 net sales increased by $1 million compared to the prior year period
due to higher sales volumes
Adjusted EBITDA was $1 million in Q2 2016, which was consistent with the
prior year period
Streamlined merchandising, sales and customer service divisions
Focus on core profitable customers and product lines. Seeing traction from
developing new brands
Segment: Home Fashion
Company Description
WestPoint Home LLC is engaged in
manufacturing, sourcing, marketing, distributing
and selling home fashion consumer products
WestPoint Home owns many of the most well-
know brands in home textiles including Martex,
Grand Patrician, Luxor and Vellux
WPH also licenses brands such as IZOD, Under
the Canopy, Southern Tide and Hanes
Summary Segment Financial Results
15
Home Fashion Segment
($ millions) 2016 2015 2016 2015
Select Income Statement Data:
Net Sales $53 $52 $103 $99
Adjusted EBITDA 1 1 3 3
Net loss (2) (1) (2) (2)
Adjusted EBITDA attrib. to IEP $1 $1 $3 $3
Net loss income attrib. to IEP (2) (1) (2) (2)
Capital Expenditures $5 $1 $7 $3
Three Months Ended
June 30,
Six Months Ended
June 30,

Financial Performance
16

Liquidity Serves as a Competitive Advantage
The Company and its subsidiaries maintain ample liquidity to take advantage of attractive
opportunities for their respective businesses
($Millions)
(1) Includes liquid investments (excluding Investment in Funds) of $1 million.
17
Liquidity
Liquid Assets:
Hold Co. Cash & Cash Equivalents (1) $212
IEP Interest in Investment Funds 1,699
Subsidiaries Cash & Cash Equivalents 1,709
Total $3,620
Subsidiary Revolver Availability:
Automotive $326
Energy 255
Railcar 203
Gaming 15
Food Packaging 8
Home Fashion 25
Subsidiary Revolver Availability $832
Total Liquidity $4,452
As of 6/30/2016

IEP Summary Financial Information
Significant Valuation demonstrated by market value of IEP’s public subsidiaries and Holding Company interest in Funds and book value
or market comparables of other assets
18
($ Millions)
Note: Indicative net asset value does not purport to reflect a valuation of IEP. The calculated Indicative net asset value does not include any value for our Investment Segment other than the fair market value of our
investment in the Investment Funds. A valuation is a subjective exercise and Indicative net asset value does not necessarily consider all elements or consider in the adequate proportion the elements that could
affect the valuation of IEP. Investors may reasonably differ on what such elements are and their impact on IEP. No representation or assurance, express or implied is made as to the accuracy and correctness of
indicative net asset value as of these dates or with respect to any future indicative or prospective results which may vary.
(1) Represents equity attributable to us as of each respective date.
(2) Based on closing share price on each date and the number of shares owned by the Holding Company as of each respective date.
(3) Amounts based on market comparables due to lack of material trading volume. Tropicana valued at 8.0x Adjusted EBITDA for the twelve months ended June 30, 2015, and 8.5x Adjusted EBITDA for the twelve
months ended September 30, 2015, December 31, 2015, March 31, 2016 and June 30, 2016. Viskase valued at 9.0x Adjusted EBITDA for the twelve months ended June 30, 2015, September 30, 2015, December
31, 2015, March 31, 2016 and June 30, 2016.
(4) ARL value assumes the present value of projected cash flows from leased railcars plus working capital.
(5) Holding Company’s balance as of each respective date.
June 30 Sept 30 Dec 31 March 31 June 30
2015 2015 2015 2016 2016
Market-valued Subsidiaries:
Holding Company interest in Funds (1) $4,646 $4,168 $3,428 $1,820 $1,713
CVR Energy (2) 2,680 2,923 2,802 1,858 1,104
CVR Refining - direct holding (2) 110 115 114 72 47
Federal-Mogul (2) 1,573 947 949 1,369 1,152
American Railcar Industries (2) 577 429 549 484 469
Total market-valued subsidiaries $9,586 $8,581 $7,842 $5,604 $4,483
Other Subsidiaries
Tropicana (3) $613 $739 $794 $844 $811
Viskase (3) 217 206 183 165 143
Real Estate Holdings (1) 692 658 656 649 647
PSC Metals (1) 242 222 182 174 178
WestPoint Home (1) 179 177 176 175 174
ARL (4) 964 979 852 1,024 1,033
Ferrous Resources (1) 241 234 95 85 81
IEH Auto & PepBoys (1) 334 330 249 1,418 1,423
Trump Entertainment (1) - - - 203 208
Total - other subsidiaries $3,482 $3,546 $3,187 $4,736 $4,697
Add: Holding Company cash and cash equivalents (5) 222 182 166 212 211
Less: Holding Company debt (5) (5,488) (5,489) (5,490) (5,487) (5,488)
Add: Other Holding Company net assets (5) 164 261 615 (13) 133
Indicative Net Asset Value $7,966 $7,081 $6,320 $5,052 $4,036
As of

Appendix
Adjusted EBITDA
19

Non-GAAP Financial Measures
20
The Company uses certain non-GAAP financial measures in evaluating its performance. These include non-GAAP EBITDA, Adjusted EBITDA and Adjusted Net Income. EBITDA represents earnings before interest expense, income tax (benefit) expense and depreciation and amortization. We define Adjusted EBITDA as EBITDA excluding the effects of impairment, restructuring costs, certain pension plan expenses, OPEB curtailment gains, purchase accounting inventory adjustments, certain share-based compensation, discontinued operations, gains/losses on extinguishment of debt, major scheduled turnaround expenses, FIFO adjustments and unrealized gains/losses on energy segment derivatives and certain other non-operational charges. We present EBITDA and Adjusted EBITDA a consolidated basis and attributable to Icahn Enterprises net of the effect of non-controlling interests. Adjusted Net Income is GAAP net income adjusted for certain items that management believes can provide useful supplemental information for investors in analyzing period to period comparisons of the company’s results. We conduct substantially all of our operations through subsidiaries. The operating results of our subsidiaries may not be sufficient to make distributions to us. In addition, our subsidiaries are not obligated to make funds available to us for payment of our indebtedness, payment of distributions on our depositary units or otherwise, and distributions and intercompany transfers from our subsidiaries to us may be restricted by applicable law or covenants contained in debt agreements and other agreements to which these subsidiaries currently may be subject or into which they may enter into in the future. The terms of any borrowings of our subsidiaries or other entities in which we own equity may restrict dividends, distributions or loans to us. We believe that providing EBITDA and Adjusted EBITDA to investors has economic substance as these measures provide important supplemental information of our performance to investors and permits investors and management to evaluate the core operating performance of our business without regard to interest, taxes and depreciation and amortization and the effects of impairment, restructuring costs, certain pension plan expenses, OPEB curtailment gains, purchase accounting inventory adjustments, certain share-based compensation, discontinued operations, gains/losses on extinguishment of debt, major scheduled turnaround expenses, FIFO adjustments and unrealized gains/losses on energy segment derivatives and certain other non-operational charges. We believe that providing Adjusted Net Income, which excludes certain items that affect period over period comparisons, also adds important supplemental information of our performance to investors. Additionally, we believe this information is frequently used by securities analysts, investors and other interested parties in the evaluation of companies that have issued debt. Management uses, and believes that investors benefit from referring to these non-GAAP financial measures in assessing our operating results, as well as in planning, forecasting and analyzing future periods. Adjusting earnings for these charges allows investors to evaluate our performance from period to period, as well as our peers, without the effects of certain items that may vary depending on accounting methods and the book value of assets. Additionally, EBITDA, Adjusted EBITDA and Adjusted Net Income present meaningful measures of performance exclusive of our capital structure and the method by which assets were acquired and financed. EBITDA, Adjusted EBITDA and Adjusted Net Income have limitations as analytical tools, and you should not consider them in isolation, or as substitutes for analysis of our results as reported under generally accepted accounting principles in the United States, or U.S. GAAP. For example, EBITDA, Adjusted EBITDA and Adjusted Net Income: • do not reflect our cash expenditures, or future requirements for capital expenditures, or contractual commitments; • do not reflect changes in, or cash requirements for, our working capital needs; and • do not reflect the significant interest expense, or the cash requirements necessary to service interest or principal payments on our debt. Although depreciation and amortization are non-cash charges, the assets being depreciated or amortized often will have to be replaced in the future, and EBITDA and Adjusted EBITDA do not reflect any cash requirements for such replacements. Other companies in the industries in which we operate may calculate EBITDA, Adjusted EBITDA and Adjusted Net Income differently than we do, limiting their usefulness as comparative measures. In addition, EBITDA, Adjusted EBITDA and Adjusted Net Income do not reflect the impact of earnings or charges resulting from matters we consider not to be indicative of our ongoing operations. EBITDA, Adjusted EBITDA and Adjusted Net Income are not measurements of our financial performance under U.S. GAAP and should not be considered as alternatives to net income or any other performance measures derived in accordance with U.S. GAAP or as alternatives to cash flow from operating activities as a measure of our liquidity. Given these limitations, we rely primarily on our U.S. GAAP results and use EBITDA, Adjusted EBITDA and Adjusted Net Income only as a supplemental measure of our financial performance.

Adjusted EBITDA Reconciliation by Segment – Three Months Ended June 30, 2016
($Millions)
21
Investment Automotive Energy Metals Railcar Gaming Mining
Food
Packaging
Real
Estate
Home
Fashion
Holding
Company Consolidated
Adjusted EBITDA:
Net (loss) income ($351) $42 $34 ($1) $52 $8 ($5) $2 $5 ($2) ($69) ($285)Interest expense, net 45 37 19 - 20 3 1 3 - - 71 199 Income tax (benefit) expense - 18 15 (3) 15 4 - 3 - - (2) 50 Depreciation, depletion and amortization - 113 67 5 34 18 - 6 6 2 - 251 EBITDA before non-controlling interests ($306) $210 $135 $1 $121 $33 ($4) $14 $11 $0 $0 $215 Restructuring costs - 6 - - - - - - - - - 6 Non-service cost of U.S. based pension - 3 - - - - - 1 - - - 4 FIFO impact unfavorable - - (46) - - - - - - - - (46)Major scheduled turnaround expense - - 9 - - - - - - - - 9 Net loss on extinguishment of debt - - 5 - - - - - - - - 5 Unrealized loss on certain derivatives - - 9 - - - - - - - - 9 Other - 10 1 (2) - - 7 - - 1 - 17 Adjusted EBITDA before non-controlling interests ($306) $229 $113 ($1) $121 $33 $3 $15 $11 $1 $0 $219
Adjusted EBITDA attributable to IEP:
Net (loss) income ($107) $35 $22 ($1) $44 $6 ($4) $2 $5 ($2) ($69) ($69)Interest expense, net 13 31 4 - 18 2 1 2 - - 71 142 Income tax (benefit) expense - 15 14 (3) 11 3 - 2 - - (2) 40 Depreciation, depletion and amortization - 97 32 5 29 12 - 4 6 2 - 187 EBITDA attributable to Icahn Enterprises ($94) $178 $72 $1 $102 $23 ($3) $10 $11 $0 $0 $300 Restructuring costs - 5 - - - - - - - - - 5 Non-service cost of U.S. based pension - 3 - - - - - - - - - 3 FIFO impact unfavorable - - (27) - - - - - - - - (27)Major scheduled turnaround expense - - 3 - - - - - - - - 3 Net loss on extinguishment of debt - - 1 - - - - - - - - 1 Unrealized loss on certain derivatives - - 5 - - - - - - - - 5 Other - 11 1 (2) - 1 5 - - 1 - 17 Adjusted EBITDA attributable to Icahn Enterprises ($94) $197 $55 ($1) $102 $24 $2 $10 $11 $1 $0 $307

Adjusted EBITDA Reconciliation by Segment – Three Months Ended June 30, 2015
($Millions)
22
Investment Automotive Energy Metals Railcar Gaming Mining
Food
Packaging
Real
Estate
Home
Fashion
Holding
Company Consolidated
Adjusted EBITDA:
Net income (loss) $382 $30 $183 ($5) $56 $9 ($6) $6 $8 ($1) ($121) $541 Interest expense, net 141 32 12 - 21 3 1 3 - - 71 284 Income tax expense (benefit) - 8 52 (4) 18 7 2 4 - - 26 113 Depreciation, depletion and amortization - 85 58 7 32 14 1 4 6 2 - 209 EBITDA before non-controlling interests $523 $155 $305 ($2) $127 $33 ($2) $17 $14 $1 ($24) $1,147 Impairment of assets - 3 - - - - - - - - - 3 Restructuring costs - 27 - - - - - - - - - 27 FIFO impact favorable - - (36) - - - - - - - - (36)Certain share-based compensation expense - - 2 - - - - - - - - 2 Major scheduled turnaround expense - - 2 - - - - - - - - 2 Expenses related to certain acquisitions - 2 - - - - - - - - - 2 Unrealized gain on certain derivatives - - (16) - - - - - - - - (16)Other - (3) (27) (1) - - 1 1 (2) - - (31)Adjusted EBITDA before non-controlling interests $523 $184 $230 ($3) $127 $33 ($1) $18 $12 $1 ($24) $1,100
Adjusted EBITDA attributable to IEP:
Net income (loss) $176 $25 $88 ($5) $36 $6 ($4) $4 $8 ($1) ($121) $212 Interest expense, net 62 27 6 - 16 2 1 2 - - 71 187 Income tax (benefit) expense - 6 44 (4) 9 5 1 3 - - 26 90 Depreciation, depletion and amortization - 71 32 7 22 10 1 3 6 2 - 154 EBITDA attributable to Icahn Enterprises $238 $129 $170 ($2) $83 $23 ($1) $12 $14 $1 ($24) $643 Impairment of assets - 2 - - - - - - - - - 2 Restructuring costs - 22 - - - - - - - - - 22 FIFO impact favorable - - (21) - - - - - - - - (21)Certain share-based compensation expense - - 2 - - - - - - - - 2 Major scheduled turnaround expense - - 1 - - - - - - - - 1 Expenses related to certain acquisitions - 2 - - - - - - - - - 2 Unrealized gain on certain derivatives - - (9) - - - - - - - - (9)Other - (2) (16) (1) - - - 1 (2) - - (20)Adjusted EBITDA attributable to Icahn Enterprises $238 $153 $127 ($3) $83 $23 ($1) $13 $12 $1 ($24) $622

Adjusted EBITDA Reconciliation by Segment – Six Months Ended June 30, 2016
($Millions)
23
Investment Automotive Energy Metals Railcar Gaming Mining
Food
Packaging
Real
Estate
Home
Fashion
Holding
Company Consolidated
Adjusted EBITDA:
Net income (loss) ($1,334) $70 ($580) ($7) $102 $14 ($18) $6 $9 ($2) ($154) ($1,894)Interest expense, net 132 75 30 - 42 6 2 6 1 - 144 438 Income tax expense (benefit) - 21 (13) (7) 33 10 1 4 - - 17 66 Depreciation, depletion and amortization - 217 123 11 68 35 1 11 11 4 - 481 EBITDA before non-controlling interests ($1,202) $383 ($440) ($3) $245 $65 ($14) $27 $21 $2 $7 ($909)Impairment of assets - 3 574 - - - - - - - - 577 Restructuring costs - 21 - - - - - - - - - 21 Non-service cost of U.S. based pension - 6 - - - - - 2 - - - 8 FIFO impact unfavorable - - (37) - - - - - - - - (37)Major scheduled turnaround expense - - 38 - - - - - - - - 38 Net loss on extinguishment of debt - - 5 - - - - - - - - 5 Unrealized gain on certain derivatives - - 32 - - - - - - - - 32 Other - 24 2 (4) - 2 10 (4) (1) 1 - 30 Adjusted EBITDA before non-controlling interests ($1,202) $437 $174 ($7) $245 $67 ($4) $25 $20 $3 $7 ($235)
Adjusted EBITDA attributable to IEP:
Net income (loss) ($557) $56 ($331) ($7) $80 $9 ($14) $5 $9 ($2) ($154) ($906)Interest expense, net 46 62 10 - 38 4 2 4 1 - 144 311 Income tax expense (benefit) - 17 (8) (7) 23 7 1 3 - - 17 53 Depreciation, depletion and amortization - 185 63 11 58 24 1 8 11 4 - 365 EBITDA attributable to Icahn Enterprises ($511) $320 ($266) ($3) $199 $44 ($10) $20 $21 $2 $7 ($177)Impairment of assets - 2 334 - - - - - - - - 336 Restructuring costs - 17 - - - - - - - - - 17 Non-service cost of U.S. based pension - 5 - - - - - 1 - - - 6 FIFO impact unfavorable - - (22) - - - - - - - - (22)Major scheduled turnaround expense - - 20 - - - - - - - - 20 Net loss on extinguishment of debt - - 1 - - - - - - - - 1 Unrealized gain on certain derivatives - - 18 - - - - - - - - 18 Other - 24 2 (4) - 2 7 (3) (1) 1 - 28 Adjusted EBITDA attributable to Icahn Enterprises ($511) $368 $87 ($7) $199 $46 ($3) $18 $20 $3 $7 $227

Adjusted EBITDA Reconciliation by Segment – Six Months Ended June 30, 2015
($Millions)
24
Investment Automotive Energy Metals Railcar Gaming Mining
Food
Packaging
Real
Estate
Home
Fashion
Holding
Company Consolidated
Adjusted EBITDA:
Net income (loss) $778 $10 $258 ($14) $100 $16 ($6) $6 $31 ($2) ($214) $963 Interest expense, net 264 67 23 - 40 6 1 6 1 - 142 550 Income tax expense (benefit) - 23 70 (10) 34 11 2 5 - - 27 162 Depreciation, depletion and amortization - 168 116 14 61 29 1 9 11 4 - 413 EBITDA before non-controlling interests $1,042 $268 $467 ($10) $235 $62 ($2) $26 $43 $2 ($45) $2,088 Impairment of assets - 4 - - - - - - - - - 4 Restructuring costs - 39 - - - - - - - - - 39 Non-service cost of U.S. based pension - - - - - - - 1 - - - 1 FIFO impact unfavorable - - (11) - - - - - - - - (11)Certain share-based compensation expense - (1) 6 - - - - - - - - 5 Major scheduled turnaround expense - - 2 - - - - - - - - 2 Expenses related to certain acquisitions - 6 - - - - - - - - - 6 Net loss on extinguishment of debt - - - - 2 - - - - - - 2 Unrealized gain on certain derivatives - - 29 - - - - - - - - 29 Other - 10 (27) (2) - 1 1 4 (21) 1 - (33)Adjusted EBITDA before non-controlling interests $1,042 $326 $466 ($12) $237 $63 ($1) $31 $22 $3 ($45) $2,132
Adjusted EBITDA attributable to IEP:
Net income (loss) $360 $7 $131 ($14) $63 $11 ($4) $4 $31 ($2) ($214) $373 Interest expense, net 122 55 13 - 29 4 1 4 1 - 142 371 Income tax expense (benefit) - 19 60 (10) 16 7 1 4 - - 27 124 Depreciation, depletion and amortization - 138 64 14 42 20 1 7 11 4 - 301 EBITDA attributable to Icahn Enterprises $482 $219 $268 ($10) $150 $42 ($1) $19 $43 $2 ($45) $1,169 Impairment of assets - 3 - - - - - - - - - 3 Restructuring costs - 32 - - - - - - - - - 32 Non-service cost of U.S. based pension - - - - - - - 1 - - - 1 FIFO impact unfavorable - - (7) - - - - - - - - (7)Certain share-based compensation expense - (1) 5 - - - - - - - - 4 Major scheduled turnaround expense - - 1 - - - - - - - - 1 Expenses related to certain acquisitions - 5 - - - - - - - - - 5 Net loss on extinguishment of debt - - - - 1 - - - - - - 1 Unrealized gain on certain derivatives - - 17 - - - - - - - - 17 Other - 8 (16) (2) - 1 - 3 (21) 1 - (26)Adjusted EBITDA attributable to Icahn Enterprises $482 $266 $268 ($12) $151 $43 ($1) $23 $22 $3 ($45) $1,200