Embed Size (px)
DESCRIPTION
ice
Citation preview
Ice Cover on the Great LakesNATI
ON
AL O
CEANIC AND ATMOSPHERIC ADM
INISTRATIO
N
U.S.DEPARTMENT OF COMMERCE
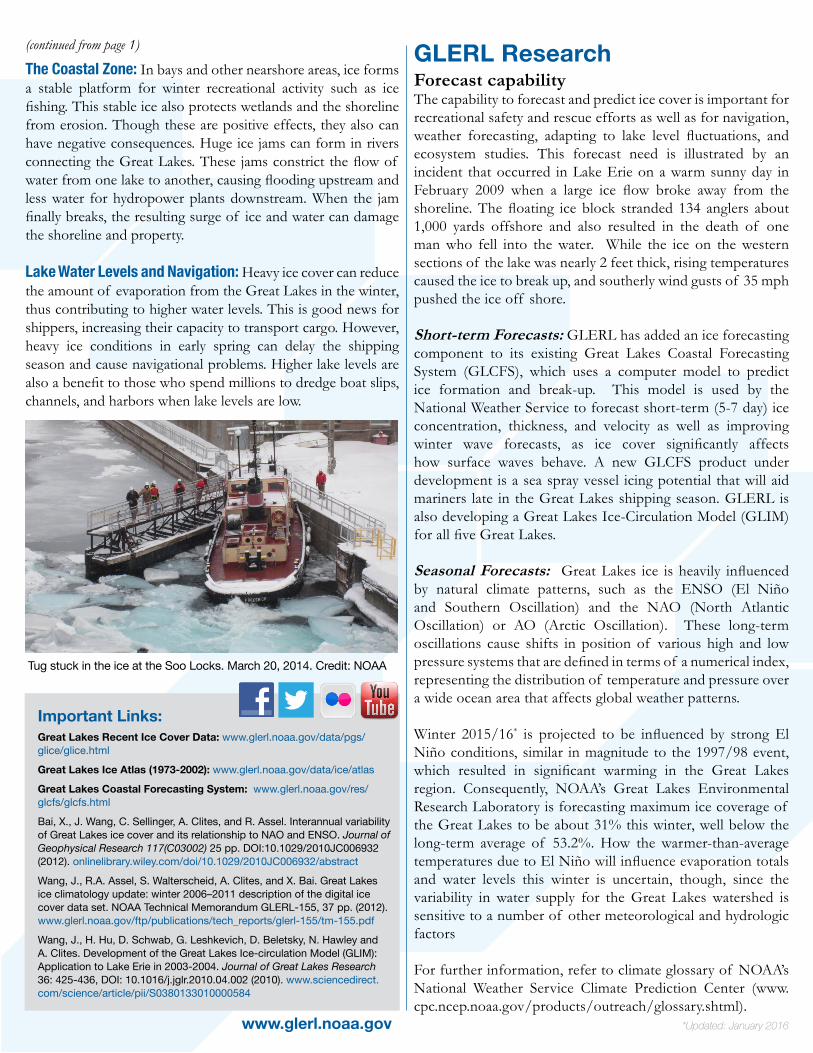
Great Lakes Ice Cover facts since 1973 - 94.7% ice coverage in 1979 is the maximum on
record- 9.5% ice coverage in 2002 is the lowest on record- 11.5% ice coverage in 1998, a strong El Niño year- The extreme ice cover in 2014 (92.5%) and 2015
(88.8%) were the first consecutive high ice cover years since the late 1970’s.
*See next page for links to publications that document these trends.
www.glerl.noaa.gov/data/ice
EFFECT OF ICE ON THE GREAT LAKES REGIONThe Fishing Industry: In the shallow waters where whitefish spawn, ice cover protects their eggs from destructive wind and wave action. Ice cover with little or no snow cover allows light penetration at the surface to promote algae growth. At the base of the foodweb, algae support living organisms in the lakes, including valuable commercial and sportfish species. With $4 billion flowing into the commercial and sport fishing industry each year, ice cover can be a significant factor affecting the region’s economy. (continued on back)
Ice formation on the Great Lakes is a clear signal of winter. Looking back in time, the lakes were formed over several thousands of years as mile-thick layers of glacial ice advanced and retreated, scouring and sculpting the basin. The shape and drainage patterns of the basin were in a constant state of flux resulting from the ebb and flow of glacial meltwater coupled with the rebound of the underlying land as the massive ice sheets retreated.
Ice provides us an important connection to the past and also serves as a measure of the harshness of current day winter weather. Understanding the major effect of ice on the Great Lakes is crucial because it impacts a range of societal benefits provided by the lakes, from hydropower generation to commercial shipping to the fishing industry. The amount of ice cover varies from year to year, as well as how long it remains on the lakes. GLERL scientists are observing long-term changes in ice cover as a result of global warming. Studying, monitoring, and predicting ice coverage on the Great Lakes plays an important role in determining climate patterns, lake water levels, water movement patterns, water temperature structure, and spring plankton blooms.
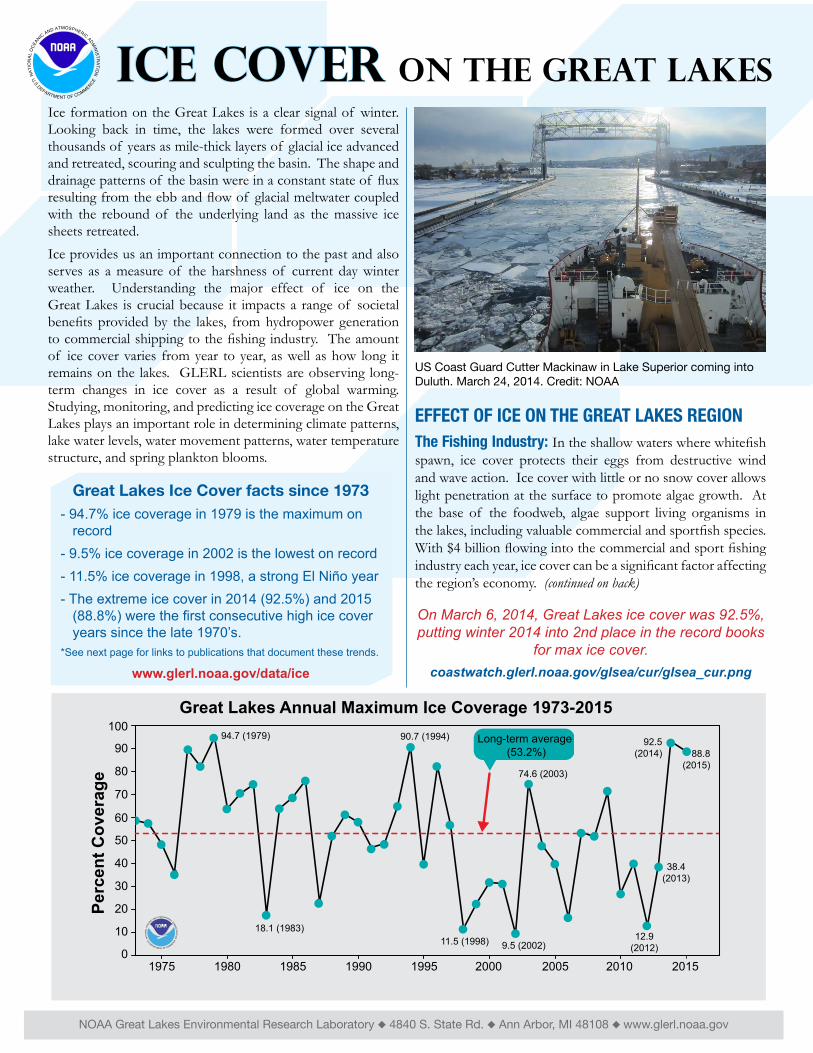
US Coast Guard Cutter Mackinaw in Lake Superior coming into Duluth. March 24, 2014. Credit: NOAA
NOAA Great Lakes Environmental Research Laboratory ◆ 4840 S. State Rd. ◆ Ann Arbor, MI 48108 ◆ www.glerl.noaa.gov
Great Lakes Annual Maximum Ice Coverage 1973-2015
Perc
ent C
over
age
20101975 1980 1985 1990 1995 2000 2005
100
0
90
80
70
60
50
40
30
20
10
Long-term average (53.2%)
2015
94.7 (1979)
38.4 (2013)
18.1 (1983)
90.7 (1994)
9.5 (2002)
74.6 (2003)
12.9(2012)
11.5 (1998)
92.5(2014) 88.8
(2015)
NATI
ON
AL O
CEANIC AND ATMOSPHERIC ADM
INISTRATIO
N
U.S.DEPARTMENT OF COMMERCE
On March 6, 2014, Great Lakes ice cover was 92.5%, putting winter 2014 into 2nd place in the record books
for max ice cover. coastwatch.glerl.noaa.gov/glsea/cur/glsea_cur.png
GLERL ResearchForecast capabilityThe capability to forecast and predict ice cover is important for recreational safety and rescue efforts as well as for navigation, weather forecasting, adapting to lake level fluctuations, and ecosystem studies. This forecast need is illustrated by an incident that occurred in Lake Erie on a warm sunny day in February 2009 when a large ice flow broke away from the shoreline. The floating ice block stranded 134 anglers about 1,000 yards offshore and also resulted in the death of one man who fell into the water. While the ice on the western sections of the lake was nearly 2 feet thick, rising temperatures caused the ice to break up, and southerly wind gusts of 35 mph pushed the ice off shore.
Short-term Forecasts: GLERL has added an ice forecasting component to its existing Great Lakes Coastal Forecasting System (GLCFS), which uses a computer model to predict ice formation and break-up. This model is used by the National Weather Service to forecast short-term (5-7 day) ice concentration, thickness, and velocity as well as improving winter wave forecasts, as ice cover significantly affects how surface waves behave. A new GLCFS product under development is a sea spray vessel icing potential that will aid mariners late in the Great Lakes shipping season. GLERL is also developing a Great Lakes Ice-Circulation Model (GLIM) for all five Great Lakes.
Seasonal Forecasts: Great Lakes ice is heavily influenced by natural climate patterns, such as the ENSO (El Niño and Southern Oscillation) and the NAO (North Atlantic Oscillation) or AO (Arctic Oscillation). These long-term oscillations cause shifts in position of various high and low pressure systems that are defined in terms of a numerical index, representing the distribution of temperature and pressure over a wide ocean area that affects global weather patterns.
Winter 2015/16* is projected to be influenced by strong El Niño conditions, similar in magnitude to the 1997/98 event, which resulted in significant warming in the Great Lakes region. Consequently, NOAA’s Great Lakes Environmental Research Laboratory is forecasting maximum ice coverage of the Great Lakes to be about 31% this winter, well below the long-term average of 53.2%. How the warmer-than-average temperatures due to El Niño will influence evaporation totals and water levels this winter is uncertain, though, since the variability in water supply for the Great Lakes watershed is sensitive to a number of other meteorological and hydrologic factors
For further information, refer to climate glossary of NOAA’s National Weather Service Climate Prediction Center (www.cpc.ncep.noaa.gov/products/outreach/glossary.shtml).
Important Links:Great Lakes Recent Ice Cover Data: www.glerl.noaa.gov/data/pgs/glice/glice.html
Great Lakes Ice Atlas (1973-2002): www.glerl.noaa.gov/data/ice/atlas
Great Lakes Coastal Forecasting System: www.glerl.noaa.gov/res/glcfs/glcfs.html
Bai, X., J. Wang, C. Sellinger, A. Clites, and R. Assel. Interannual variability of Great Lakes ice cover and its relationship to NAO and ENSO. Journal of Geophysical Research 117(C03002) 25 pp. DOI:10.1029/2010JC006932 (2012). onlinelibrary.wiley.com/doi/10.1029/2010JC006932/abstract
Wang, J., R.A. Assel, S. Walterscheid, A. Clites, and X. Bai. Great Lakes ice climatology update: winter 2006–2011 description of the digital ice cover data set. NOAA Technical Memorandum GLERL-155, 37 pp. (2012). www.glerl.noaa.gov/ftp/publications/tech_reports/glerl-155/tm-155.pdf
Wang, J., H. Hu, D. Schwab, G. Leshkevich, D. Beletsky, N. Hawley and A. Clites. Development of the Great Lakes Ice-circulation Model (GLIM): Application to Lake Erie in 2003-2004. Journal of Great Lakes Research 36: 425-436, DOI: 10.1016/j.jglr.2010.04.002 (2010). www.sciencedirect.com/science/article/pii/S0380133010000584
www.glerl.noaa.gov
(continued from page 1)
The Coastal Zone: In bays and other nearshore areas, ice forms a stable platform for winter recreational activity such as ice fishing. This stable ice also protects wetlands and the shoreline from erosion. Though these are positive effects, they also can have negative consequences. Huge ice jams can form in rivers connecting the Great Lakes. These jams constrict the flow of water from one lake to another, causing flooding upstream and less water for hydropower plants downstream. When the jam finally breaks, the resulting surge of ice and water can damage the shoreline and property.
Lake Water Levels and Navigation: Heavy ice cover can reduce the amount of evaporation from the Great Lakes in the winter, thus contributing to higher water levels. This is good news for shippers, increasing their capacity to transport cargo. However, heavy ice conditions in early spring can delay the shipping season and cause navigational problems. Higher lake levels are also a benefit to those who spend millions to dredge boat slips, channels, and harbors when lake levels are low.
Tug stuck in the ice at the Soo Locks. March 20, 2014. Credit: NOAA
*Updated: January 2016