Embed Size (px)
Citation preview

Iceberg Detection and Drift Simulation
W. Dierking1 Christine Wesche1, Armando Marino2
1Alfred Wegener Institute Helmholtz Center for Polar- and Marine Research, Bremerhaven, Germany
2The Open University, Engineering and Innovation
Milton Keynes, United Kingdom

Problems?
- SAR images:
• detection of small icebergs (Titanic: 15-30 m freeboard, 60-120 m length)
• detection of icebergs in deformed sea ice
- Iceberg drift forecasting
Motivation for drift forecasting
• marine safety • limit search area for new iceberg position in
satellite images • reduce ambiguities in identifying particular
bergs
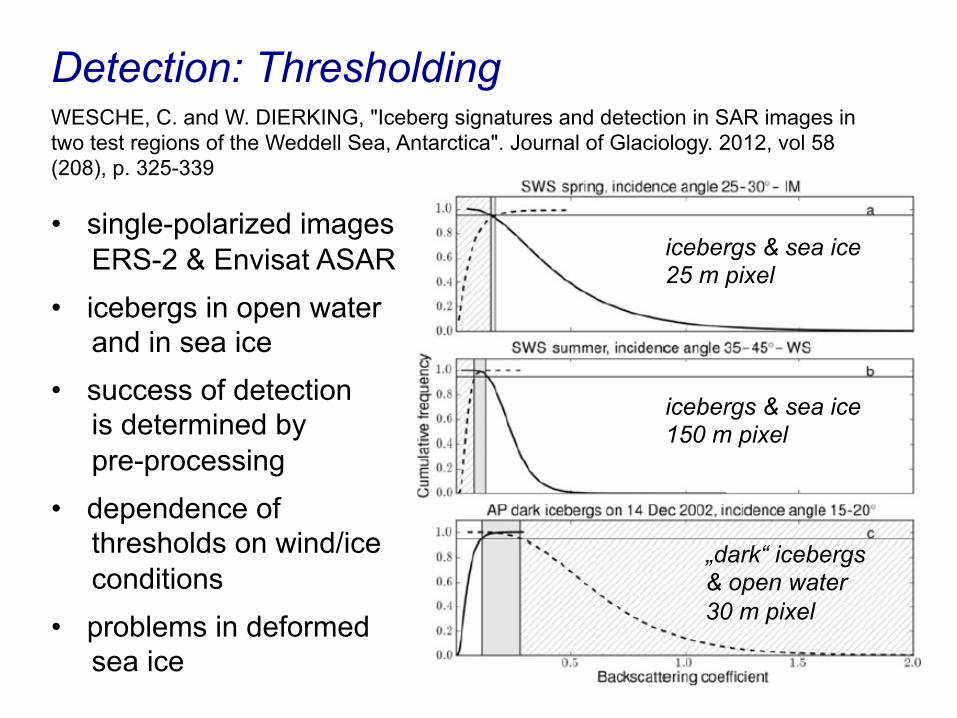
Detection: Thresholding
WESCHE, C. and W. DIERKING, "Iceberg signatures and detection in SAR images in two test regions of the Weddell Sea, Antarctica". Journal of Glaciology. 2012, vol 58(208), p. 325-339 • single-polarized images ERS-2 & Envisat ASAR • icebergs in open water and in sea ice
• success of detection is determined by pre-processing
• dependence of thresholds on wind/ice conditions
• problems in deformed sea ice
icebergs & sea ice 25 m pixel
icebergs & sea ice 150 m pixel
„dark“ icebergs & open water 30 m pixel

Detection: Quad-Pol. Data
Dierking, W., Wesche, C. (2014),”C-Band radar polarimetry – useful for detection of icebergs in sea ice?”, IEEE Transactions on Geoscience and Remote Sensing, Vol. 52, No. 1, 25-37
Use of polarimetric parameters improves discrimination between icebergs and sea ice only in some cases!
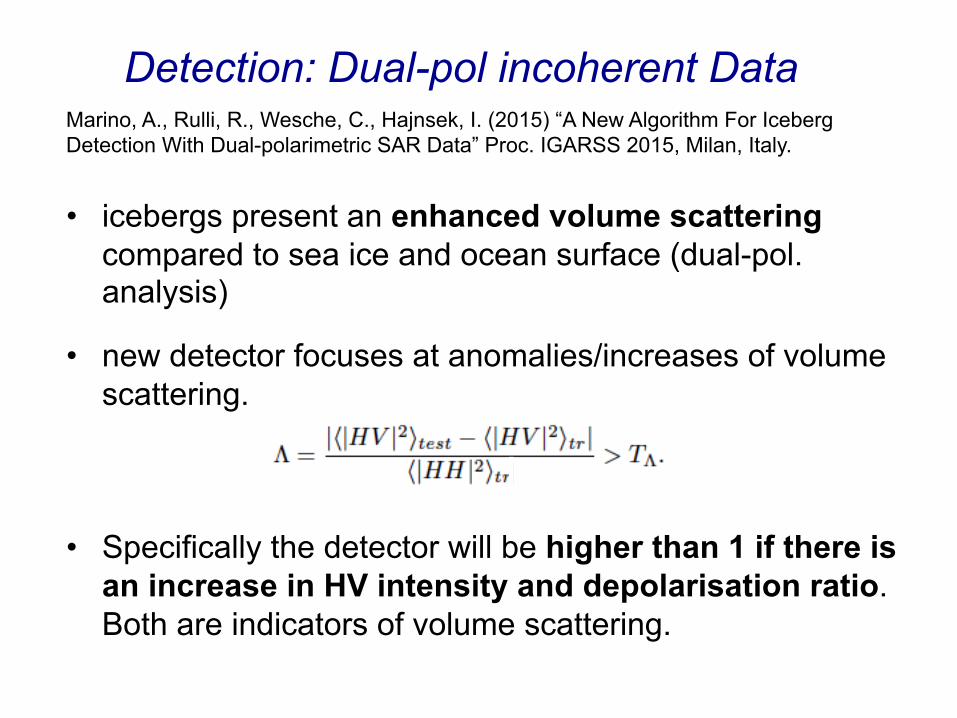
Detection: Dual-pol incoherent Data Marino, A., Rulli, R., Wesche, C., Hajnsek, I. (2015) “A New Algorithm For Iceberg Detection With Dual-polarimetric SAR Data” Proc. IGARSS 2015, Milan, Italy.
• icebergs present an enhanced volume scattering
compared to sea ice and ocean surface (dual-pol. analysis)
• new detector focuses at anomalies/increases of volume scattering.
• Specifically the detector will be higher than 1 if there is
an increase in HV intensity and depolarisation ratio. Both are indicators of volume scattering.

Detection: Dual-pol incoherent Data Sentinel-1 EW HH HV (05/04/2015). East Greenland (Fram Strait) Window used: Test = 3x3; Train = 101x101.
HV Magnitude Volume Anomaly Mask
CA-CFAR HV Enhanced Magnitude

Iceberg Calving: Monitoring Source Locations
Wesche, C., Jansen, D., and Dierking, W. (2013), “Calving fronts of Antarctica: Mapping and Classification”, Remote Sens. 2013, 5 (12) pp. 6305-6322
Ice stream (IS) pattern
Surface structure of calving sites determines dominant iceberg shapes and sizes.

Iceberg Calving: Monitoring Sites Antarctica
three different calving site surface structures: C1 – parallel C2 – orthogonal C3 – IS C4 – no crevasses C5 – grounded ice

• Forces to be considered: air & ocean drag, water pressure gradient, Coriolis force, wave radiation or sea ice stress
• mixed layer: wind drag • layer below: geostrophic => velocity proportional surface slope
Drift Simulation: Test of a simple model
CRÉPON, M., HOUSSAIS, M. N. and SAINT GUILY, B. "The drift of icebergs under wind action". Journal of Geophysical Research. 1988, vol 93(C4), p. 3608-3612.

Drift Simulation: Input Data “literature”, typical values
• densities ice, water, air • drag coefficients: air-water, air-ice, ocean-ice, tangential air-ice + ocean-ice • mixed layer depth • wind speed and direction (NCEP Reanalysis)
“from the field”
• iceberg dimensions (assuming a cuboid) lengths 370 – 7000 m widths 100 – 4000 m heights 116 – 304 m
• iceberg starting position

Drift Observations & Test Sites
Drift patterns were retrieved from position data of GPS-buoys on 11 icebergs in different regions: Southern Weddell Sea SWS (model modifications) SIC ≈ 100%, SIT ≈ 1.0-1.5 m; Weddel Gyre Eastern Weddell Sea EWS SIC < 10%, SIT < 0.5 m; Coastal Current (->west) North Eastern Weddell Sea NEWS SIC = 0%, ACC
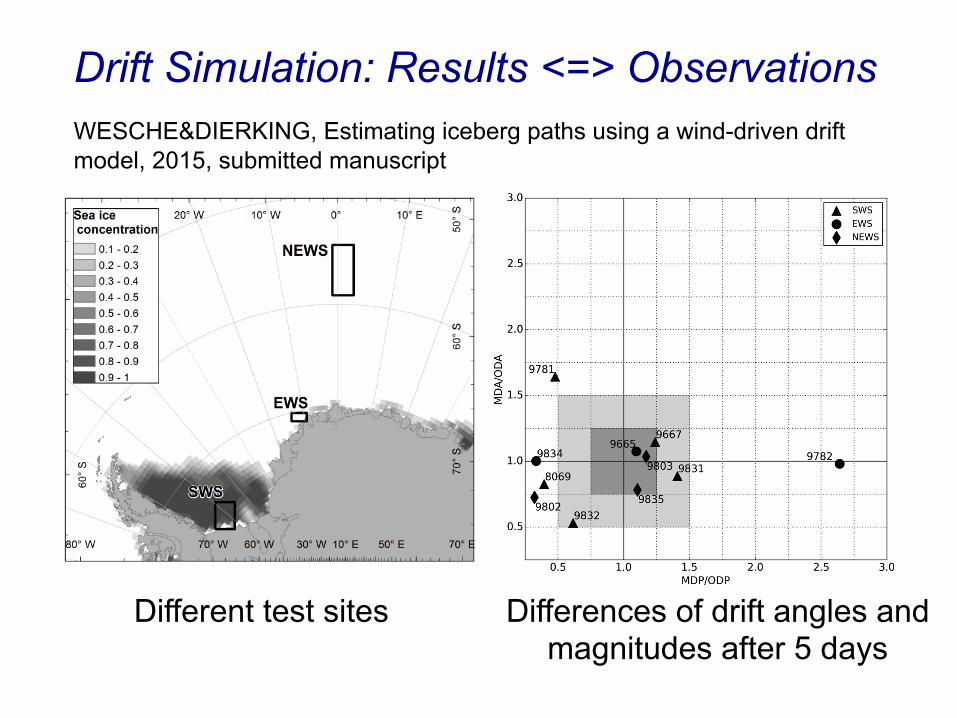
Drift Simulation: Results <=> Observations WESCHE&DIERKING, Estimating iceberg paths using a wind-driven drift model, 2015, submitted manuscript
Different test sites Differences of drift angles and magnitudes after 5 days

Drift Simulation: Results <=> Observations
5-days iceberg paths
“Forecasts” would be acceptable for guiding image positioning (wide-swath scenario)

Drift Simulation: Results <=> Observations
Why differences?
• simplifications of the drift model used (local ocean currents are not considered, idealized mixed layer=> Ekman spiral)
• coarse spatial and temporal resolution of forcing data (example: near-coast: influence of topography on local wind patterns) • influence of iceberg shape not adequately considered
(assumption: iceberg shape = cuboid)
• (tests with more complex models do not reveal significantly better results!)

Interesting study => “operational on-site”
I. D. Turnbull, N. Fournier, M. Stolwijk, T. Fosnaes, D. McGonigal, Operational iceberg drift forecasting in Northwest Greenland, Cold Regions Science and Technology 110, 1-18, 2015
• support of coring campaign, NW Greenland
• operational model, near real-time input of metocean parameters, iceberg drift and size, tidal currents, weather forecast
• estimation of air and water form drag by matching observed and hindcast iceberg trajectories

Conclusions
• Iceberg monitoring over larger regions should include observations of calving sites + drift forecasting
• Iceberg drift models: more complex ones do not necessarily deliver more accurate data!
• Largest problem of forecasts of iceberg drift: in most cases input parameters cannot be provided with required accuracy
• Local (“on-site”) operational monitoring possible with more or less detailed information about input parameters (high logistical effort)