Embed Size (px)
Citation preview

ICES WGMHM REPORT 2010 SCICOM STEERING GROUP ON SUSTAINABLE USE OF ECOSYSTEMS
ICES CM 2010/SSGSUE:01
REF. SCICOM, ACOM
Report of the Working Group on Marine Habitat Mapping (WGMHM)
3–7 May 2010
Calvi, Corsica, France
International Council for the Exploration of the Sea Conseil International pour l’Exploration de la Mer
H. C. Andersens Boulevard 44–46 DK-1553 Copenhagen V Denmark Telephone (+45) 33 38 67 00 Telefax (+45) 33 93 42 15 www.ices.dk [email protected]
Recommended format for purposes of citation:
ICES. 2010. Report of the Working Group on Marine Habitat Mapping (WGMHM), 3–7 May 2010, Calvi, Corsica, France. ICES CM 2010/SSGSUE:01. 86 pp.
For permission to reproduce material from this publication, please apply to the Gen-eral Secretary.
The document is a report of an Expert Group under the auspices of the International Council for the Exploration of the Sea and does not necessarily represent the views of the Council.
© 2010 International Council for the Exploration of the Sea

ICES WGMHM REPORT 2010 | i
Contents
Executive summary ................................................................................................................ 1
1 Opening of the meeting ................................................................................................ 2
2 Adoption of the agenda and appointment of rapporteurs ..................................... 2
3 Progress in international mapping programmes ..................................................... 2
3.1 Habitat mapping and the Marine Strategy Framework Directive ................. 2
3.2 Interreg Atlantic Area Mesh-Atlantic project ................................................... 4
3.3 HELCOM ............................................................................................................... 5
3.3.1 Habitat classification developments ..................................................... 5 3.3.2 HELCOM Initial Holistic Assessment (Baltic Sea
Environmental Proceedings No.122, 2010) ........................................... 6
3.4 EEA Eunis habitat classification ......................................................................... 6
3.5 OSPAR Habitat Mapping Programme .............................................................. 7
3.6 EMODNET (EC DG-MARE) ............................................................................... 7
3.7 PREHAB - Spatial PREdiction of Baltic benthic HABitats .............................. 7
3.8 CHARM 3 (CHannel integrated Approach for marine Resource Management) Interreg IV a Project .................................................................... 8
3.8.1 Collection and standardization of information ................................. 10 3.8.2 Information integration ......................................................................... 11 3.8.3 Tools and communication of information .......................................... 11
3.9 CoralFish: First results on mapping Bay of Biscay deep-waters .................. 12
3.9.1 Compilation of existing data on Bay of Biscay margin ..................... 12 3.9.2 CoralFISH surveys 2008–2009 .............................................................. 12 3.9.3 Perspectives 2010–2011 ......................................................................... 13
3.10 MESMA – Monitoring and Evaluation of Spatially Managed Areas .......... 16
4 National programmes (National Status Report) .................................................... 17
4.1 National programme report for Belgium ........................................................ 17
4.1.1 Habitat mapping activities relate to the following nationally and internationally funded programmes:........................ 17
4.1.2 Study on selecting areas under EC’s Habitat Directive, Belgian part of the North Sea ............................................................... 17
4.1.3 Relevant publications ............................................................................ 18 4.1.4 Relevant reports ..................................................................................... 18
4.2 National programme report for France ........................................................... 19
4.2.1 Historical habitat map ........................................................................... 19 4.2.2 Detailed habitat maps ........................................................................... 20 4.2.3 Priority habitats ...................................................................................... 21 4.2.4 Seabed sediments ................................................................................... 21
4.3 National programme report for Norway ........................................................ 22

ii | ICES WGMHM REPORT 2010
4.3.1 The National Program for Mapping and Monitoring of Marine Biodiversity ............................................................................... 22
4.3.2 MAREANO (Marine AREAdatabase for NOrwegian coast and sea areas) ......................................................................................... 23
4.3.3 Other projects ......................................................................................... 25
4.4 National programme report for Sweden ......................................................... 26
4.4.1 Swedish offshore bank survey ............................................................. 26 4.4.2 Marine Modelling of Östergötland (MMÖG) .................................... 27 4.4.3 Mapping human activities .................................................................... 28
4.5 National programme report for Portugal ........................................................ 28
4.5.1 ACOBIOS and ACOSHELF .................................................................. 29 RENSUB .............................................................................................................. 32 Deep Reefs .......................................................................................................... 32 BIOMARES ......................................................................................................... 32 CONDOR ........................................................................................................... 33 4.5.2 Other international projects .................................................................. 33
4.6 National programme report for UK ................................................................. 34
4.6.1 Survey work 2009–10 ............................................................................. 34 4.6.2 Anton Dohrn Seamount ........................................................................ 35 4.6.3 East Rockall Bank ................................................................................... 36 4.6.4 North-west Anglesey............................................................................. 36 4.6.5 Relevant initiatives ................................................................................ 38
4.7 National programme report for the Netherlands ........................................... 39
4.7.1 Habitat mpping work ............................................................................ 40 4.7.2 Mapping related to coastal conservation, beach and
foreshore nourishments ........................................................................ 41 4.7.3 Related projects ...................................................................................... 43 4.7.4 Techniques .............................................................................................. 44
4.8 National programme for Ireland ...................................................................... 44
4.8.1 National Mapping Programme – INFOMAR .................................... 44 4.8.2 INFOMAR Activities ............................................................................. 45 4.8.3 Habitat maps .......................................................................................... 46 4.8.4 Other Programme Activities ................................................................ 47
4.9 Guidelines for populating the ICES WebGIS .................................................. 48
5 Seabed Habitat Modelling ......................................................................................... 49
5.1 5.1 Spatial predictive modelling, with kelp (Laminaria hyperborea) and eelgrass (Zostera marina) as examples ....................................................... 49
5.2 MAREANO: classification of seabed video observations as a basis to predict biotopes and ecotopes ...................................................................... 50
5.3 EUSeaMap ........................................................................................................... 52
5.4 Modelling light budget for the definition of the infralittoral zone in EUSeaMap ........................................................................................................... 53
5.5 Marine Modelling of Östergötland (MMÖG) ................................................. 54
ICES WGMHM REPORT 2010 | iii
5.6 Process-driven characterization and mapping of sedimentary seabed habitats within the Basque continental shelf (Bay of Biscay) .......... 56
5.6.1 Specific objectives .................................................................................. 56 5.6.2 Post-talk Discussion............................................................................... 57
6 Protocols and standards for habitat mapping ........................................................ 57
6.1 EUNIS Developments for Natura 2000 ............................................................ 57
6.1.1 Littoral soft sediments ........................................................................... 57 6.1.2 Sublittoral soft sediments ..................................................................... 57 6.1.3 Littoral rock ............................................................................................ 58 6.1.4 Sublittoral rock ....................................................................................... 58 6.1.5 Post-talk Discussion............................................................................... 58
6.2 Cold water Coral (CWC) Habitat Categorisation in Habitat Mapping ............................................................................................................... 58
6.3 Progress in positioning in-situ sampling ......................................................... 59
6.3.1 Objective .................................................................................................. 59 6.3.2 Method .................................................................................................... 59 6.3.3 Results/Conclusions .............................................................................. 60 6.3.4 Post-talk Discussion............................................................................... 60
7 Interpretation of survey data ..................................................................................... 61
7.1 Use of Unsupervised Classification and Optimal Allocation Analysis in Ground-Truthing Survey Design ................................................. 61
7.1.1 Objective .................................................................................................. 61 7.1.2 Method .................................................................................................... 61 7.1.3 Results ..................................................................................................... 62 7.1.4 Conclusions............................................................................................. 62 7.1.5 Post-talk Discussion............................................................................... 62
7.2 Identification of Deep sea Flora on Video Imagery ....................................... 63
7.2.1 Camera positioning ............................................................................... 63 7.2.2 Submarine positioning and picture georeferencing: GPS
and track linked with video with time code. GIS visualization logging date, time, Lat, Long and depth ..................... 63
7.2.3 Discussion ............................................................................................... 63
8 Accuracy and confidence in habitat maps - ToR f ................................................. 63
8.1 Assessing Sediment Confidence ....................................................................... 63
8.2 Considerations on assessment of a global modelled map ............................ 65
9 Habitat maps for management .................................................................................. 66
9.1 Swedish Offshore Bank Survey ........................................................................ 66
9.2 Recent Developments in Habitat Mapping in Scottish Waters .................... 67
Annex 1: List of participants............................................................................................... 69
Annex 2: WGMHM terms of reference for the 2010 meeting ....................................... 70
Annex 3: WGMHM 2010 agenda ....................................................................................... 71

iv | ICES WGMHM REPORT 2010
Annex 4: WGMHM 2011 terms of reference .................................................................... 72
Annex 5: Recommendations from WGMHM 2010 ......................................................... 74
Annex 6: Geonetwork for metadata capture .................................................................... 75

ICES WGMHM REPORT 2010 | 1
Executive summary
The Working Group on Marine Habitat Mapping convened from 3–7 May in Calvi, Corsica and was hosted by Ifremer. The meeting was chaired by Jacques Populus and was attended by 17 delegates from eight countries.
Keypoints from the meeting
Marine habitat mapping progresses at a good pace within the ICES region of Europe with a number of international programs to support it. The main two drivers are the extension of Natura 2000 to larger marine areas and the Marine Strategy Framework Directive (MSFD), the latter calling for seabed mapping in the development of two of its indicators of good environment status. Of notable importance is the advent of the Interreg IVa Charm 3 project in the Channel, the Interreg IVb Mesh-Atlantic project under “Atlantic Area” (the latter planning to extend former Mesh’s results to south-western Europe) and also the various DG/MARE Emodnet preparatory actions which urge many European marine mapping actors to get together and produce maps and datasets of our seas (among them the broad scale habitat map underway in the EuSeaMap project). Whereas such large marine areas are in scope, too little is seen as to how the commu-nity is going to mobilize to tackle these issues. At a time when deep-water studies reveal that deeper seabeds are less monotonous than previously thought and occu-pied by patchy key habitats, the gap between global maps and very local observation needs to be bridged. In this regard underwater video is the object of promising de-velopments. The “Optimum allocation analysis” tool, with a view to optimize sam-pling effort, is also of great relevance. In terms of habitat classifications, progress with Eunis is very slow and new issues prompt people to adopt temporary solutions better adapted to mapping outputs. There are issues with the description of the vegetation, with estuaries, with deep-water habitats insufficiently described so far and with specific physical habitat de-scription of the Baltic Sea. Habitat suitability modelling is a very active field of development and there is a need for enhanced collaborations between teams and the comparison of methods. The trend to releasing determinant datasets (bathymetry, substrate), fostered by DG/MARE in particular and more generally the progress in oceanographic knowl-edge (e.g. seabed energy models) gives a thrust to modelling. Modelling tools (Max-ent, GAM, GLM, BTM) are widely used in many modelling approaches, among which those in Sweden and Norway can be mentioned. Comparing potential distri-bution of some habitats (e.g. seagrass, kelp, maerl and others) with recent surveys could lead to assessing their status as required by the MSFD or WFD (Water Frame-work Directive). Among recommendations given by the group, a joint meeting with the BEWG (Ben-thic ecology) is planned at ASC 2010 in Nantes. Equally important is to come closer to the newly formed expert group on marine spatial planning and the aggregate extrac-tion group (respectively WGMSP and WGEXT).

2 | ICES WGMHM REPORT 2010
1 Opening of the meeting
The meeting was held at Stareso, the marine research station near Calvi, Corsica from 3 to 7 May 2010. The meeting was attended by 17 delegates from 8 countries (a pic-ture of the last dinner at Stareso can be seen at the end of the report).
Apologies were received from Roger Coggan, Ulf Bergstrom, Mats Lindegart, Goran Lindblad, David Connor, Dieter Boedeker, Bregje K. van Wesenbeeck, Brigitte Guil-laumont, Lene Buhl Mortensen, Fernando Tempera, Grete Dinesen, Kerstin Geitner, Ibon Galparsoro.
2 Adoption of the agenda and appointment of rapporteurs
The Terms of Reference for the meeting were reviewed and are given in Annex 2. The draft agenda was modified and the final agenda (Annex 3) was adopted by the group.
Rapporteurs were appointed for some of the ToRs, namely:
• ToR b (National programmes): Pol Buhl Mortensen • ToR c: (Habitat modelling): Natalie Coltman • ToR d (Protocols and standards for habitat mapping): James Strong and
Martin Isaeus • ToR e (Interpretation of habitat mapping data): James Strong and Martin
Isaeus • ToR f (Accuracy and confidence in modelled maps): Fergal Mac Grath • ToR g (Use of habitat maps): Jan Van Dalfsen
3 Progress in international mapping programmes
Report on progress in international mapping programmes (including OSPAR and HELCOM Conventions, EuSeaMap, EC and EEA initiatives, CHARM, Prehab, Sesma and Mesh-Atlantic projects) – ToR a
3.1 Habitat mapping and the Marine Strategy Framework Directive
David Connor (JNCC, UK) had sent the group with the following information.
The EU Marine Strategy Framework Directive (MSFD) was adopted in 2008 and sets out a process to develop and deliver assessments, monitoring and programmes of measures in order to achieve Good Environmental Status (GES) in all European wa-ters by 2020. The assessment of GES is to be undertaken at the scale of specified re-gions (e.g. Baltic Sea, Black Sea) and/or subregions (e.g. Greater North Sea, Bay of Biscay and Iberian Coast). This will require the cooperation of relevant Member States and non-Member States in each region/subregion and is to be achieved through the regional seas conventions.
As part of an Initial Assessment by 2012, Member States are required to present maps of habitat types listed in Community legislation (Habitats and Birds Directives) and by international conventions (e.g. those on the OSPAR, HELCOM and BARCOM lists).
ICES WGMHM REPORT 2010 | 3
Additionally there is a requirement for the Initial Assessment to describe the ‘pre-dominant habitat types’ present in Member State’s waters. Here the outcomes of the EUSeaMap project (www.jncc.gov.uk/EUSeaMap
The assessment of GES for the MSFD is to be judged according to a set of eleven ‘de-scriptors’ provided in Annex I of the Directive. Two of these are particularly relevant to habitats, namely Descriptor 1 on biological diversity and Descriptor 6 on seabed integrity. Guidance on criteria, indicators and methods for assessment of these De-scriptors has been prepared for the European Commission by expert Task Groups (Cochrane et al., 2010
) should be helpful as it will pro-vide, by late 2010, broad-scale maps enabling those Member States in the Baltic Sea, Greater North Sea, Celtic Seas and western Mediterranean Sea to use a standardized set of habitat types for these regions.
1, Rice et al., 20102
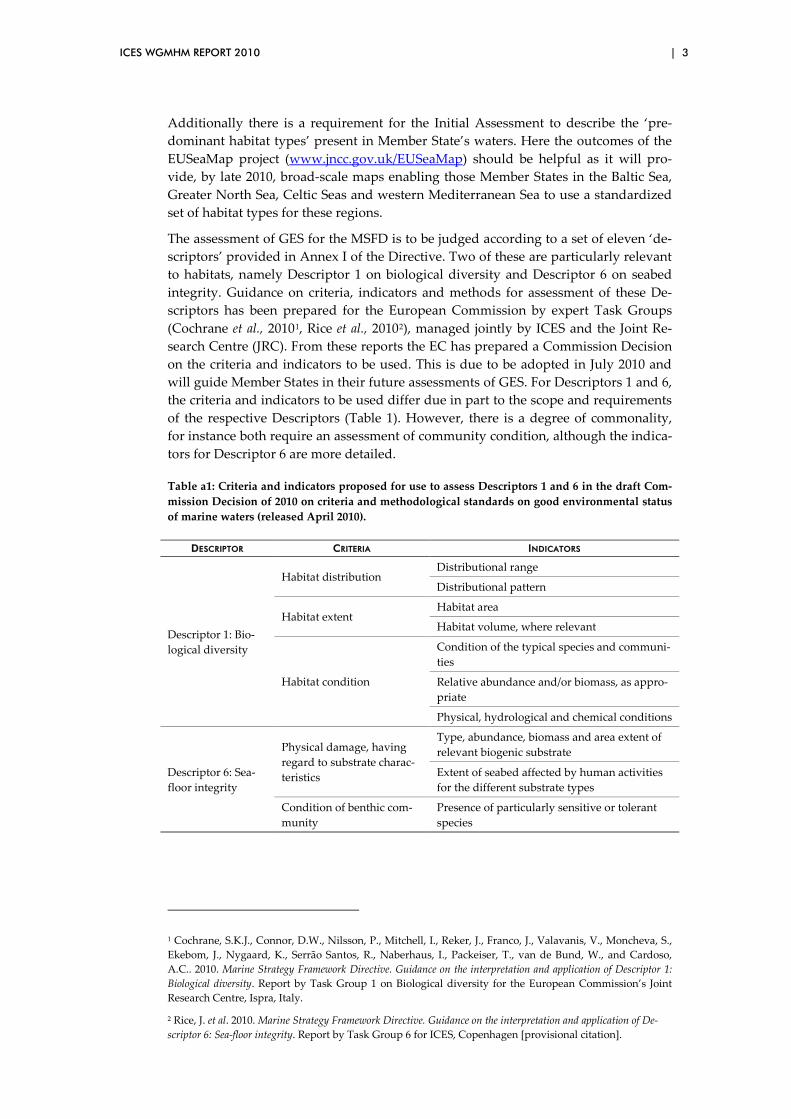
Table a1: Criteria and indicators proposed for use to assess Descriptors 1 and 6 in the draft Com-mission Decision of 2010 on criteria and methodological standards on good environmental status of marine waters (released April 2010).
), managed jointly by ICES and the Joint Re-search Centre (JRC). From these reports the EC has prepared a Commission Decision on the criteria and indicators to be used. This is due to be adopted in July 2010 and will guide Member States in their future assessments of GES. For Descriptors 1 and 6, the criteria and indicators to be used differ due in part to the scope and requirements of the respective Descriptors (Table 1). However, there is a degree of commonality, for instance both require an assessment of community condition, although the indica-tors for Descriptor 6 are more detailed.
DESCRIPTOR CRITERIA INDICATORS
Descriptor 1: Bio-logical diversity
Habitat distribution Distributional range
Distributional pattern
Habitat extent Habitat area
Habitat volume, where relevant
Habitat condition
Condition of the typical species and communi-ties
Relative abundance and/or biomass, as appro-priate
Physical, hydrological and chemical conditions
Descriptor 6: Sea-floor integrity
Physical damage, having regard to substrate charac-teristics
Type, abundance, biomass and area extent of relevant biogenic substrate
Extent of seabed affected by human activities for the different substrate types
Condition of benthic com-munity
Presence of particularly sensitive or tolerant species
1 Cochrane, S.K.J., Connor, D.W., Nilsson, P., Mitchell, I., Reker, J., Franco, J., Valavanis, V., Moncheva, S., Ekebom, J., Nygaard, K., Serrão Santos, R., Naberhaus, I., Packeiser, T., van de Bund, W., and Cardoso, A.C.. 2010. Marine Strategy Framework Directive. Guidance on the interpretation and application of Descriptor 1: Biological diversity. Report by Task Group 1 on Biological diversity for the European Commission’s Joint Research Centre, Ispra, Italy.
2 Rice, J. et al. 2010. Marine Strategy Framework Directive. Guidance on the interpretation and application of De-scriptor 6: Sea-floor integrity. Report by Task Group 6 for ICES, Copenhagen [provisional citation].

4 | ICES WGMHM REPORT 2010
DESCRIPTOR CRITERIA INDICATORS
Multi-metric indexes assessing benthic com-munity condition and functionality, such as species diversity and richness, proportion of opportunistic to sensitive species
Proportion of biomass of number or individu-als above specified length/size
Parameters (slope and intercept) of the size spectrum of the aggregate size composition data
Cochrane et al. (2010) advocate the use of a standardized set of ‘predominant habitat types’ across the regions/subregions of Europe, which would facilitate the setting of targets for GES and the comparison of assessments between Member States and be-tween regions/subregions. The application of such a set of habitat types for Descrip-tor 6 would enable the same data (e.g. on habitat extent, condition and pressures from human activities) and assessments to be used for both Descriptors.
In the period to July 2012, Member States, in cooperation with other states in the re-gion/subregion need to define targets and (more specific) indicators for GES. Consid-eration by OSPAR of how to achieve this for biodiversity issues has indicated that there is a need to:
1 ) Describe the characteristics of habitats (physical, hydrological and chemi-cal features and the composition and relative abundance of typical species) in an unimpacted state
2 ) Describe the gradation of change in these characteristics as a result of in-creasing pressures from human activities on the habitats (physical, chemi-cal and biological pressures)
3 ) Map the distribution and intensity of pressures (assessed cumulatively across the range of human activities yielding each pressure) within a re-gion/subregion
4 ) Establish, where possible, a relationship between the gradation of change (impact) on the habitat and the associated intensity of pressure.
The above information can be used to inform decisions about setting targets for qual-ity of habitats and the extent over which such quality should be achieved in order to meet GES (a quantity target). Additionally it will facilitate the identification of suit-able indicators to assess against a gradation of quality in relation to specific pressures (e.g. physical damage, change in community composition).
3.2 Interreg Atlantic Area Mesh-Atlantic project
Jacques Populus (Ifremer, France) presented the status of the Mesh-Atlantic project. This project is part of priority 2 of Interreg “Atlantic Area” (AA) second call for ten-der (2009). With a budget of 3.5M€ and a three year duration (May 2010 to April 2013), it brings together 11 partners from 4 countries: Portugal, Spain, Ireland and France, under the leadership of Ifremer (Centre de Brest). Mesh-Atlantic mostly in-tends to extend to SW Europe the achievements of the previous Mesh (see www.searchmesh.com) project carried out over the period 2004–2008. It is split in 31 actions under four technical activities as follows: a) Collate and make available his-torical maps, b) carry out new surveys and improve strategies, c) make survey and modelled maps, d) disseminate maps and communicate project’s results.

ICES WGMHM REPORT 2010 | 5
The project will focus geographically on planned MPA (Marine Protected Areas), more specifically on transnational ones where possible. It will maintain a close rela-tionship with MAIA, another AA project that will develop within the same time frame.
Mesh-Atlantic, for the sake of clarity, intends to make further use of the former Mesh webGIS that already contains over a thousand metadata records and over 400 maps, mostly habitat maps but also related seabed maps. One of the key planned achieve-ments is the extension to the Bay of Biscay and Iberian Peninsula of the global mod-elled seabed map underway with DG/MARE Emodnet preparatory action “EuSeaMap” (see below in this report). This particular action will result in a global map being available for most of Atlantic Europe. Mesh-Atlantic kick-off meeting is planned at the end of May 2010 (contact [email protected]).
3.3 HELCOM
3.3.1 Habitat classification developments
David Connor, JNCC, UK
A workshop in Stockholm in March 2008 hosted by the Swedish Environment Protec-tion Agency developed an initial proposal for a Baltic Sea habitat classification that reflected the key characteristics of the region and would be compatible with the EUNIS classification structure. Following this workshop, support for further devel-opment of the proposal was gained from the Helsinki Commission and has now been incorporated into the Commission’s programme to review its Red List of Species and Habitats/Biotopes. As part of this review, HELCOM want a revised habitat classifica-tion by 2011 to underpin the red listing process. A first workshop for biotope experts of the project for reviewing the HELCOM Red List of Species and Habitats/Biotopes was held in Stockholm in March 2010. The workshop considered the short-comings of the current EUNIS classification for Baltic Sea habitats (version 2006 11), the propos-als from the March 2008 workshop and work since then on defining biotopes in dif-ferent parts of the Baltic. It also considered the prospects for a broad-scale map of the Baltic from the EUSeaMap project by autumn 2010, which would build upon the out-comes of the BALANCE broad-scale map (Al-Hamdani and Reker 20073), and how this might help shape the required classification. HELCOM agreed4
1 Al-Hamdani, Z, & Reker, J. (eds) 2007. Towards marine landscapes in the Baltic Sea. BALANCE Interim Report No. 10. Geological Survey of Denmark and Greenland, Copenhagen. 115pp.
to use EUSeaMap as a basis for a revised classification of the Baltic Sea and to further develop the more detailed parts of the classification (biotopes), with a view to proposing the revised classification for inclusion within EUNIS. The outcomes of the EUSeaMap model would need to be reviewed by the Baltic biotope experts and developed into a hierar-chical classification proposal compatible with EUNIS and suitable for further devel-opment of the more detailed biotopes needed for the red list review.
2 Minutes of HELCOM Red List Biotopes 1/2010, Document 7/1 (http://meeting.helcom.fi)

6 | ICES WGMHM REPORT 2010
3.3.2 HELCOM Initial Holistic Assessment (Baltic Sea Environmental Proceedings No.122, 2010)
Cecilia Lindblad, SEPA, Sweden
This initial holistic assessment tool (HOLAS) covers a number of aspects of Good Environmental Status, as described by the qualitative descriptors of Annex III of the MSFD, including eutrophication, contamination by hazardous substances and biodi-versity aspects. It will facilitate the work of the EU Member States of HELCOM in implementing the requirements of the Directive that are related to those descriptors, especially the development of the initial assessment, targets and associated indicators for Good Environmental Status that are due in June 2012. The assessment is based on quality-assured data and expert knowledge gathered between 2003 and 2007.
The results of this Initial Holistic Assessment are based on HELCOM’s thematic as-sessments of the ‘eutrophication status’, the ‘biodiversity status’ and the ‘hazardous substances status’. As an added value, these thematic assessments have been inte-grated to assess the ‘ecosystem health’, thereby setting a baseline for evaluating the effectiveness of the implementation of the HELCOM Baltic Sea Action Plan.
The assessment gives the clear message that none of the open-water basins currently is in a ’good environmental status‘. Most sea areas are affected by eutrophication, hazardous substances or an unfavourable conservation status. The human induced pressures on the Baltic Sea have compromised the health of the Baltic Sea ecosystem, including the human communities linked to it.
3.4 EEA Eunis habitat classification
Update received from David Connor (JNCC, UK)
The European Environment Agency (EEA) and European Topic Centre on Biological Diversity (ETC-BD) are in the process of updating the current habitat classification (version 200611) and expect to release it as version 2008v1. (http://eunis.eea.europa.eu/habitats-code.jsp). For marine habitats, the main changes relate to the addition of a large number of classes for habitats in the Black Sea (Pon-tic), which are sometimes linked to existing ones in the Mediterranean (hence re-titled ‘Mediterranean and Pontic ….’). Additionally, there will be some minor corrections to the remaining marine classification.
Both the EEA and the ETC-BD have been briefed on the ongoing work within the EUSeaMap project5
5 Link to relevant section in WGMHM report.
and, in particular, the expectation that the project will recom-mend revisions to the EUNIS marine classification on the basis of the outcomes of broad-scale modelling of physical and oceanographic parameters across four major regions of European waters. It might be expected, in particular, that the upper levels of EUNIS for the Baltic will be substantially restructured and that, provisionally, it may be appropriate to separate the Atlantic habitats (temperate saline) from the Mediterranean habitats (warm saline). Should this be followed, separation of the Black Sea habitats (reduced salinity) might also be appropriate. The need for a peer review mechanism for new proposals to EUNIS has been raised with the EEA and ETC-BD.
ICES WGMHM REPORT 2010 | 7
3.5 OSPAR Habitat Mapping Programme
Natalie Coltman (JNCC, UK) outlined the OSPAR habitat mapping programme and its progress to date. The OSPAR Commission adopted an initial list of threatened and/or declining species and habitats in 2003, extending the list in 2004 and 2007 to include 16 habitats. For these habitats, JNCC coordinates a habitat mapping pro-gramme to collate existing habitat data in order to identify appropriate conservation measures. Point data are collated for each contracting party by a lead organization in that country, and submitted to JNCC on a yearly cycle (by 31 July) in a specified Data Exchange Format. This programme has some difficulties with data management be-cause contracting parties do not refresh their datasets regularly, and often send sub-sets of data. There are no data for the two most recent habitats added to this list (2007), Coral gardens and Cymodocea meadows. ICES WGMHM representatives were asked to deliver any new data they have for these habitats, or the other 14 OSPAR habitats, to the OSPAR lead in their country. JNCC can provide the contact for each Contracting Party if requested.
3.6 EMODNET (EC DG-MARE)
The current situation of the preparatory actions of the EMODNET project under DG/MARE is given here. This concern two specific lots that have a bearing on the EUSeaMap project reported in ToR c, namely the hydrographic and geology lots. The hydrographic lot plans the delivery of a 400 m resolution depth DTM covering the North and Celtic Seas as well as the Western Mediterranean. The date of delivery is not specified, nor is the specifications of confidence assessment for these dataset. The geology lot led by BGS is well advanced and has already delivered in February 2010 an assemblage covering the three Northern basins (Baltic, North and Celtic). This compilation is made in a simplified Folk classification suitable with the needs of the EUSeaMap project, along with a method derived from the Mesh project to assess the quality of the layer.
Another bid is underway for a lot on ocean physics (closed in July 2010). Further plans at DG/MARE for the 2011–2013 period concern high resolution bathymetry, human activities and also the updating of the existing layers. More information is available at: http://www.emodnet-chemistry.eu/portal/portal/
3.7 PREHAB - Spatial PREdiction of Baltic benthic HABitats
At the end of 2009 the Prehab project reporting preliminary results from its first year. Of particular interest to WGMHM is Work package 2 “Developing methods for spa-tial prediction”, with the following points.
Task 2.2 was a comparison and Baltic-wide synthesis of the performance of different tech-niques formodelling of benthic habitats. Modelling techniques involve a range of ap-proaches, which are used regularly in mapping studies in the marine as well as terrestrial environments. Five habitat modelling methods were selected according to different approaches of calculation and type of response variables, as well as R pack-ages and responsible partners for the scripts of models were indicated: GAM/GLM, CART/boosted regression trees, MARS, Kriging and Maxent. Decisions about com-mon routines for quality control of data and validation of models were made. Collin-earity of predictors will be removed at levels of r>0.7 and all modelling will involve external validation by splitting of the data into test and training sets (with splitting ratio depending on data: 70:30, 75:25, 80:20) for the external validation. Receiver op-erating curves (ROC) will be used for quantifying the success of categorical models
8 | ICES WGMHM REPORT 2010
(measured as AUC) and root mean square error (RMSE) will be used for quantitative response data.
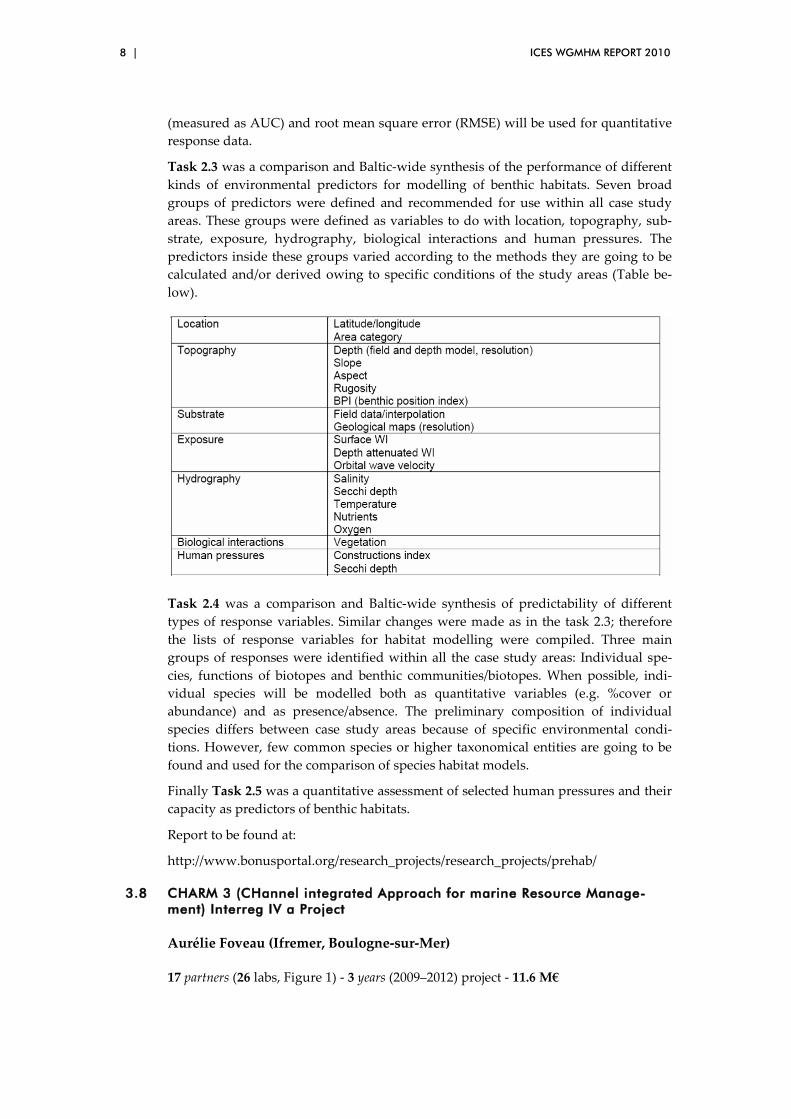
Task 2.3 was a comparison and Baltic-wide synthesis of the performance of different kinds of environmental predictors for modelling of benthic habitats. Seven broad groups of predictors were defined and recommended for use within all case study areas. These groups were defined as variables to do with location, topography, sub-strate, exposure, hydrography, biological interactions and human pressures. The predictors inside these groups varied according to the methods they are going to be calculated and/or derived owing to specific conditions of the study areas (Table be-low).
Task 2.4 was a comparison and Baltic-wide synthesis of predictability of different types of response variables. Similar changes were made as in the task 2.3; therefore the lists of response variables for habitat modelling were compiled. Three main groups of responses were identified within all the case study areas: Individual spe-cies, functions of biotopes and benthic communities/biotopes. When possible, indi-vidual species will be modelled both as quantitative variables (e.g. %cover or abundance) and as presence/absence. The preliminary composition of individual species differs between case study areas because of specific environmental condi-tions. However, few common species or higher taxonomical entities are going to be found and used for the comparison of species habitat models.
Finally Task 2.5 was a quantitative assessment of selected human pressures and their capacity as predictors of benthic habitats.
Report to be found at:
http://www.bonusportal.org/research_projects/research_projects/prehab/
3.8 CHARM 3 (CHannel integrated Approach for marine Resource Manage-ment) Interreg IV a Project
Aurélie Foveau (Ifremer, Boulogne-sur-Mer)
17 partners (26 labs, Figure 1) - 3 years (2009–2012) project - 11.6 M€

ICES WGMHM REPORT 2010 | 9
Figure a1. Partners of the CHARM3 Interreg IV a project.Aim: To develop an atlas as a ”toolbox” to help in decision-making and planning for both sound governance and sustainable management of the Channel (Figure 2) sea’s marine resources and human activities.
Figure a2. Extension of the CHARM3 Interreg IV a project study area.
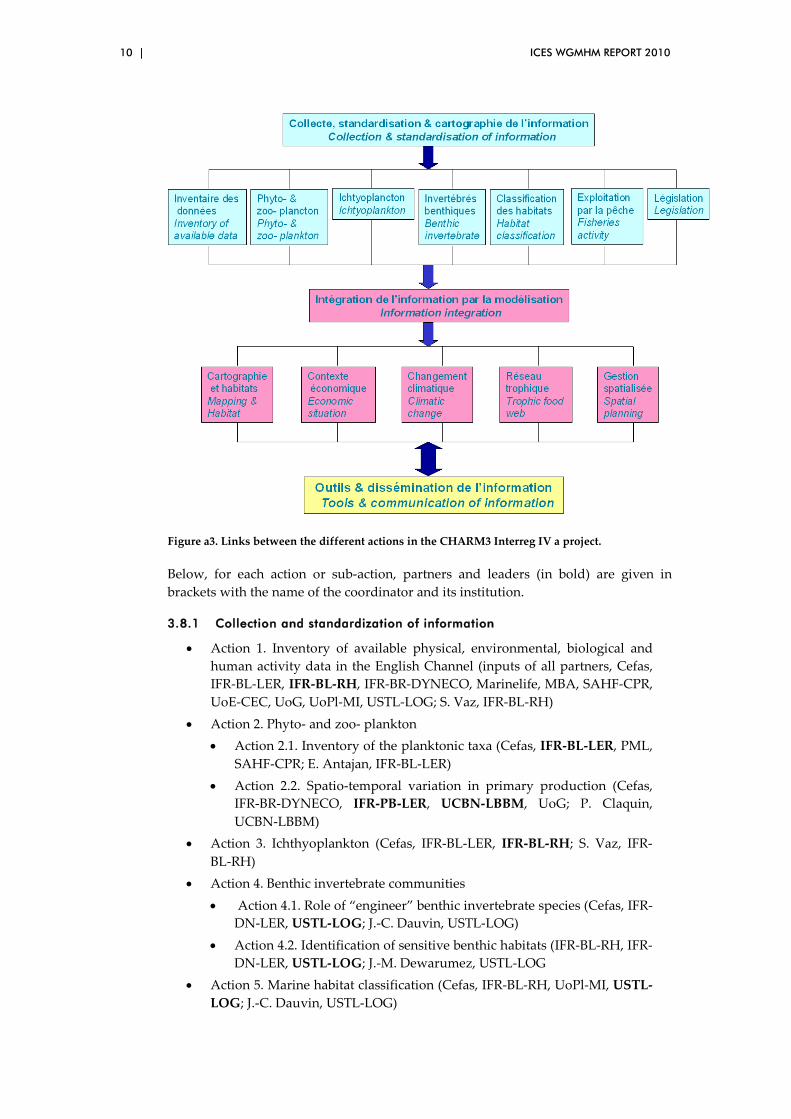
There are three main divisions for the project (Collection and standardization of in-formation, Information integration, Tools and communication of information). Each division has actions and sub-actions (Figure 3). This project started in April 2009. Up to now, most of the effort has been against actions about collection and standardiza-tion of information, and data are now collected. In parallel, the actions concerning the information integration are beginning. Tools and communication of information ac-tions are under development, notably the interactive website.
10 | ICES WGMHM REPORT 2010
Figure a3. Links between the different actions in the CHARM3 Interreg IV a project.
Below, for each action or sub-action, partners and leaders (in bold) are given in brackets with the name of the coordinator and its institution.
3.8.1 Collection and standardization of information
• Action 1. Inventory of available physical, environmental, biological and human activity data in the English Channel (inputs of all partners, Cefas, IFR-BL-LER, IFR-BL-RH, IFR-BR-DYNECO, Marinelife, MBA, SAHF-CPR, UoE-CEC, UoG, UoPl-MI, USTL-LOG; S. Vaz, IFR-BL-RH)
• Action 2. Phyto- and zoo- plankton • Action 2.1. Inventory of the planktonic taxa (Cefas, IFR-BL-LER, PML,
SAHF-CPR; E. Antajan, IFR-BL-LER) • Action 2.2. Spatio-temporal variation in primary production (Cefas,
IFR-BR-DYNECO, IFR-PB-LER, UCBN-LBBM, UoG; P. Claquin, UCBN-LBBM)
• Action 3. Ichthyoplankton (Cefas, IFR-BL-LER, IFR-BL-RH; S. Vaz, IFR-BL-RH)
• Action 4. Benthic invertebrate communities • Action 4.1. Role of “engineer” benthic invertebrate species (Cefas, IFR-
DN-LER, USTL-LOG; J.-C. Dauvin, USTL-LOG) • Action 4.2. Identification of sensitive benthic habitats (IFR-BL-RH, IFR-
DN-LER, USTL-LOG; J.-M. Dewarumez, USTL-LOG • Action 5. Marine habitat classification (Cefas, IFR-BL-RH, UoPl-MI, USTL-
LOG; J.-C. Dauvin, USTL-LOG)

ICES WGMHM REPORT 2010 | 11
• Action 6. Marine fisheries dataAction 6.1. Exploitation data – landings and fishing effort (Cefas, IFR-BL-RH, IFR-BR-IDM, IFR-BR-STH, UoE-CEC; G. Engelhard, Cefas)
• Action 6.2. Fisheries in the English Channel: culture, sense of place and ethical markets – will include some of 14.3's work (UoG; T. Accott, UoG)
• Action 7. Legislation (IFR-BR-IDM, IFR-BR-STH, UoK-DICE, UoPo-CEMARE; S. Harrop, UoK-DICE)
3.8.2 Information integrationAction 8. Cartography and habitat modelling (Al-kante, Cefas, IFR-BL-LER, IFR-BL-RH, IFR-PB-RH, SAHF-CPR, UHB-RESO, UoE-CEC, UoG, UoPl-MI, USTL-LOG; S.Vaz, IFR-BL-RH)
• Action 9. Economic situation • Action 9.1. Dynamics of marine exploited communities and viability of
fisheries (IFR-BL-RH, IFR-BR-DEM, IFR-BR-IDM, IFR-BR-STH, UBO-AMURE, UoPo-CEMARE; B Legallic, UBO-AMURE)
• Action 9.2. Diversification of fisheries activities (AGRO-PH, UBO-AMURE, UoG, UoPo-CEMARE; M. Lesueur, AGRO-PH)
• Action 9.3. Channel economic situation (IFR-BR-DEM ; B. Legallic, UBO-AMURE
• Action 10. Climatic change • Action 10.1. Changes in the composition of benthic communities
(USTL-LOG; G. Beaugrand, USTL-LOG) • Action 10.2. Changes in the distribution of marine fish and their com-
munities (IFR-BL-RH, MBA ; S. Vaz, IFR-BL-RH) • Action 10.3. Changes in marine top predators (Marinelife, SAHF-CPR,
UoE-CEC, UoPl-MI; S. Votier, UoPl-MI) • Action 11. Functional approaches and trophic modelling
• Action 11.1. Consequences of human disturbances on sole Solea solea population (AGRO-PH; O. LePape, AGRO-PH)
• Action 11.2. Functional approach of benthic ecosystems (Cefas, USTL-LOG ; L. Denis, USTL-LOG)
• Action 11.3. Trophic network models in the eastern Channel (AGRO-PH, Cefas, IFR-PB-RH, IFR-BL-RH, UCBN-LBBM, UoPl-MI; C. Villanueva, IFR-BL-RH)
• Action 11.4. Trophic network models of benthic ecosystems (UoPl-MI, USTL-LOG; J.-C. Dauvin, USTL-LOG)
• Action 11.5. Linking upper-trophic level predators with pelagic ecosys-tems (Cefas, SAHF-CPR, UoE-CEC, UoPl-MI, USTL-LOG; B. Godley, UoE-CEC)
• Action 12. Marine spatial planning in the eastern Channel (input from all partners, Cefas, IFR-BL-RH, Marinelife, UoE-CEC, UoG, UoK-DICE, USTL-LOG; B. Smith, UoK-DICE
3.8.3 Tools and communication of information
• Action 14. Development of tools
12 | ICES WGMHM REPORT 2010
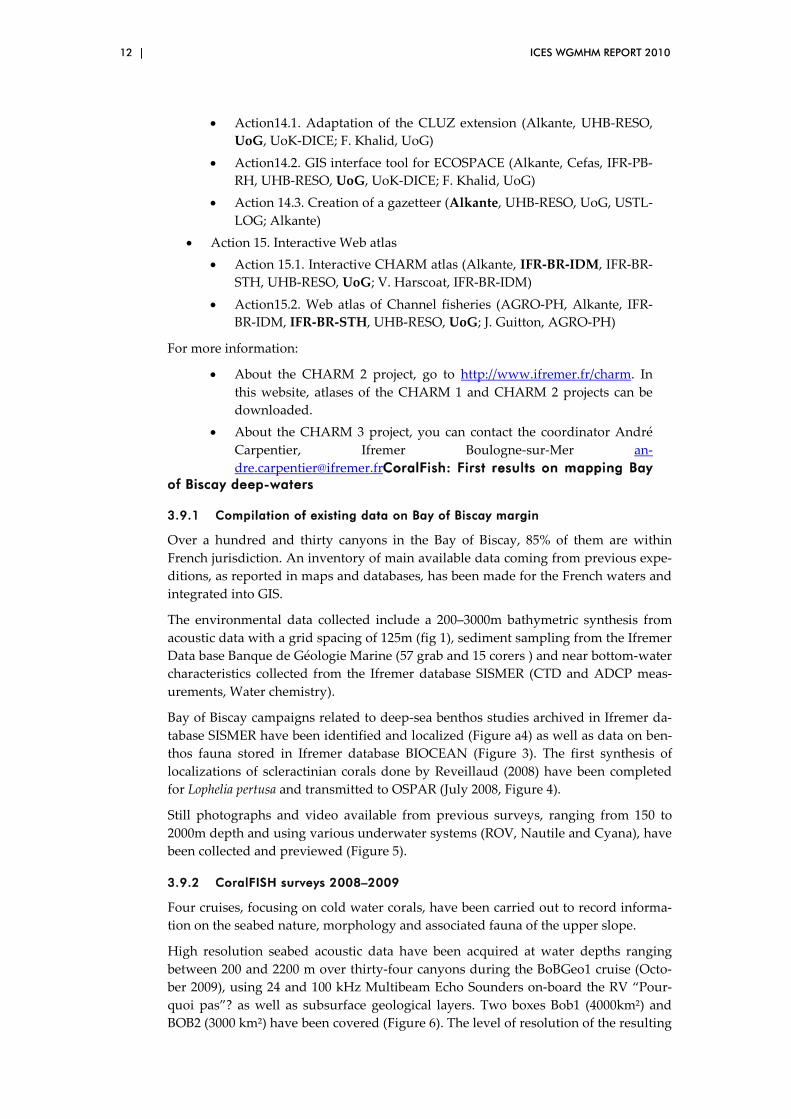
• Action14.1. Adaptation of the CLUZ extension (Alkante, UHB-RESO, UoG, UoK-DICE; F. Khalid, UoG)
• Action14.2. GIS interface tool for ECOSPACE (Alkante, Cefas, IFR-PB-RH, UHB-RESO, UoG, UoK-DICE; F. Khalid, UoG)
• Action 14.3. Creation of a gazetteer (Alkante, UHB-RESO, UoG, USTL-LOG; Alkante)
• Action 15. Interactive Web atlas • Action 15.1. Interactive CHARM atlas (Alkante, IFR-BR-IDM, IFR-BR-
STH, UHB-RESO, UoG; V. Harscoat, IFR-BR-IDM) • Action15.2. Web atlas of Channel fisheries (AGRO-PH, Alkante, IFR-
BR-IDM, IFR-BR-STH, UHB-RESO, UoG; J. Guitton, AGRO-PH)
For more information:
• About the CHARM 2 project, go to http://www.ifremer.fr/charm. In this website, atlases of the CHARM 1 and CHARM 2 projects can be downloaded.
• About the CHARM 3 project, you can contact the coordinator André Carpentier, Ifremer Boulogne-sur-Mer [email protected]: First results on mapping Bay
of Biscay deep-waters
3.9.1 Compilation of existing data on Bay of Biscay margin
Over a hundred and thirty canyons in the Bay of Biscay, 85% of them are within French jurisdiction. An inventory of main available data coming from previous expe-ditions, as reported in maps and databases, has been made for the French waters and integrated into GIS.
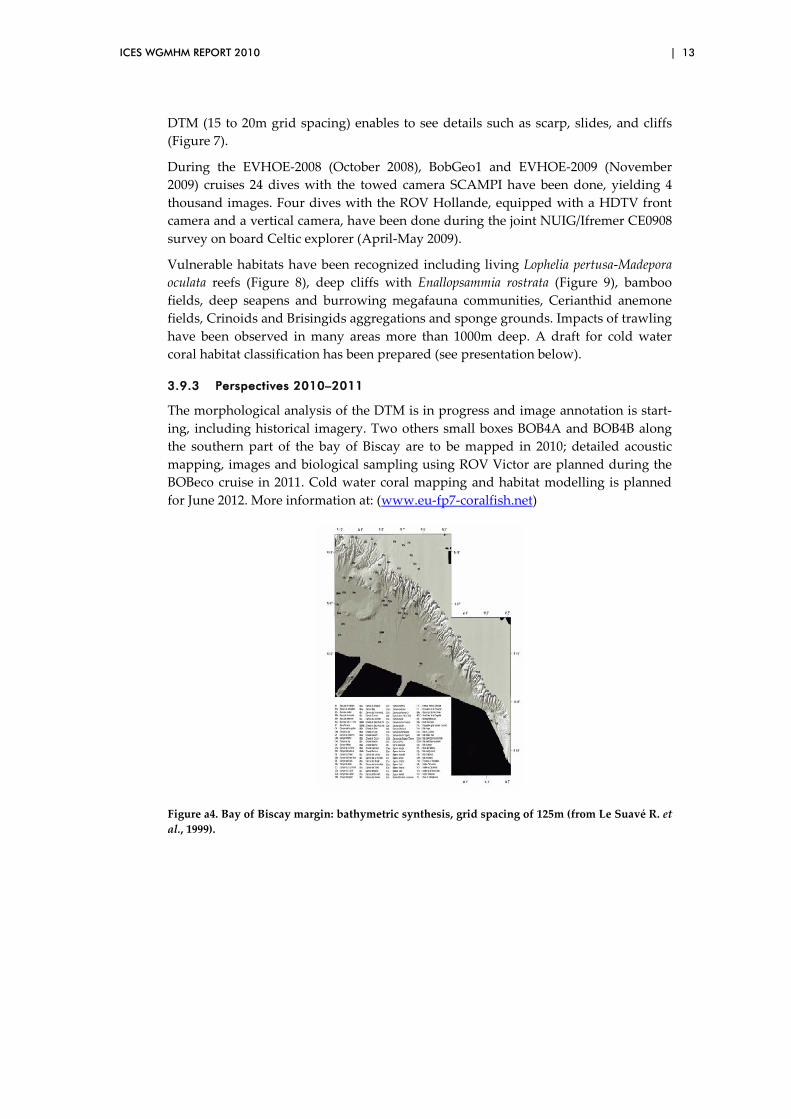
The environmental data collected include a 200–3000m bathymetric synthesis from acoustic data with a grid spacing of 125m (fig 1), sediment sampling from the Ifremer Data base Banque de Géologie Marine (57 grab and 15 corers ) and near bottom-water characteristics collected from the Ifremer database SISMER (CTD and ADCP meas-urements, Water chemistry).
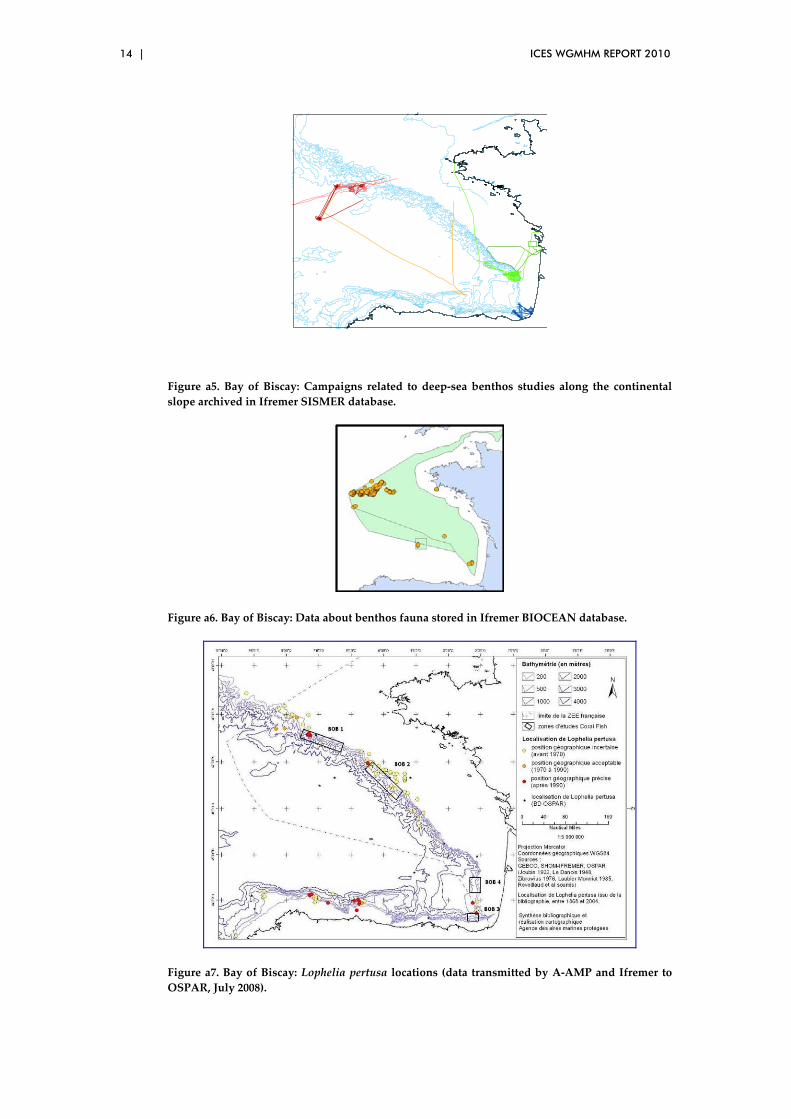
Bay of Biscay campaigns related to deep-sea benthos studies archived in Ifremer da-tabase SISMER have been identified and localized (Figure a4) as well as data on ben-thos fauna stored in Ifremer database BIOCEAN (Figure 3). The first synthesis of localizations of scleractinian corals done by Reveillaud (2008) have been completed for Lophelia pertusa and transmitted to OSPAR (July 2008, Figure 4).
Still photographs and video available from previous surveys, ranging from 150 to 2000m depth and using various underwater systems (ROV, Nautile and Cyana), have been collected and previewed (Figure 5).
3.9.2 CoralFISH surveys 2008–2009
Four cruises, focusing on cold water corals, have been carried out to record informa-tion on the seabed nature, morphology and associated fauna of the upper slope.
High resolution seabed acoustic data have been acquired at water depths ranging between 200 and 2200 m over thirty-four canyons during the BoBGeo1 cruise (Octo-ber 2009), using 24 and 100 kHz Multibeam Echo Sounders on-board the RV “Pour-quoi pas”? as well as subsurface geological layers. Two boxes Bob1 (4000km²) and BOB2 (3000 km²) have been covered (Figure 6). The level of resolution of the resulting
ICES WGMHM REPORT 2010 | 13
DTM (15 to 20m grid spacing) enables to see details such as scarp, slides, and cliffs (Figure 7).
During the EVHOE-2008 (October 2008), BobGeo1 and EVHOE-2009 (November 2009) cruises 24 dives with the towed camera SCAMPI have been done, yielding 4 thousand images. Four dives with the ROV Hollande, equipped with a HDTV front camera and a vertical camera, have been done during the joint NUIG/Ifremer CE0908 survey on board Celtic explorer (April-May 2009).
Vulnerable habitats have been recognized including living Lophelia pertusa-Madepora oculata reefs (Figure 8), deep cliffs with Enallopsammia rostrata (Figure 9), bamboo fields, deep seapens and burrowing megafauna communities, Cerianthid anemone fields, Crinoids and Brisingids aggregations and sponge grounds. Impacts of trawling have been observed in many areas more than 1000m deep. A draft for cold water coral habitat classification has been prepared (see presentation below).
3.9.3 Perspectives 2010–2011
The morphological analysis of the DTM is in progress and image annotation is start-ing, including historical imagery. Two others small boxes BOB4A and BOB4B along the southern part of the bay of Biscay are to be mapped in 2010; detailed acoustic mapping, images and biological sampling using ROV Victor are planned during the BOBeco cruise in 2011. Cold water coral mapping and habitat modelling is planned for June 2012. More information at: (www.eu-fp7-coralfish.net)
Figure a4. Bay of Biscay margin: bathymetric synthesis, grid spacing of 125m (from Le Suavé R. et al., 1999).
14 | ICES WGMHM REPORT 2010
Figure a5. Bay of Biscay: Campaigns related to deep‐sea benthos studies along the continental
slope archived in Ifremer SISMER database.
Figure a6. Bay of Biscay: Data about benthos fauna stored in Ifremer BIOCEAN database.
Figure a7. Bay of Biscay: Lophelia pertusa locations (data transmitted by A‐AMP and Ifremer to
OSPAR, July 2008).

ICES WGMHM REPORT 2010 | 15
Figure a8. Bay of Biscay: location of still photographs and video transects from previous surveys.
Figure a9. Bay of Biscay: Location of areas to be focused on during the new surveys (deep-sea submarine systems from Bourillet J-F. et al., 2006).

16 | ICES WGMHM REPORT 2010
Figure a10. Comparison between the previous DTM (resolution of 125m) and the new one (resolu-tion 20m) ©Ifremer.
Figure a 11. Lophelia pertusa reef, Guilvinec canyon (CEO9O8 cruise) ©NUIG and deep cliff with scleractinians (E. rostrata), Le Croisic canyon (CE0908 cruise) ©NUIG.
3.10 MESMA – Monitoring and Evaluation of Spatially Managed Areas
The MESMA (Monitoring and Evaluation of Spatially Managed Areas) project is an 8.4 M Euro project funded under 7th EU Framework Program. MESMA has 18 part-ners from 12 EU countries. MESMA focuses on marine spatial planning and aims to produce integrated management tools (concepts, models and guidelines) for monitor-ing, evaluation and implementation of Spatially Managed Areas (SMAs). The project will support the formalization and implementation of EC policy and will also support integrated management plans for designated or proposed sites with assessment methods based on European collaboration. The project started 1 November 2009 and at present existing information and data are compiled in WP 1. The project will need information on present and future habitat mapping activities and other information such as guidelines on mapping and applications for habitat maps. Some partners in the MESMA project are involved in the WGEXT and will play an important role in the transfer of information of the WG into the project.

ICES WGMHM REPORT 2010 | 17
4 National programmes (National Status Report)
Present and review national habitat mapping activity during the preceding year, providing National Status Report updates according to the standard re-porting format, an overview map, and focusing on particular issues of rele-vance to the rest of the meeting (ToR b).
4.1 National programme report for Belgium
Vera Van Lancker, Steven Degraer and Alain Norro (RBins, Mumm, Belgium)
4.1.1 Habitat mapping activities relate to the following nationally and interna-tionally funded programmes:
QUEST4D: Quantification of Erosion/Sedimentation patterns to trace the natural vs. anthropogenic sediment dynamics (http://www.vliz.be/projects/quest4D/)
Belgian Science Policy Research Programme Science for a Sustainable Development (2006–2011)
Within the project, observations and modelling combine to reconstruct ecosystem evolution along the Belgian part of the North Sea over the last 100 years, both natu-rally and anthropogenically induced. The sediment and sediment transport system is targeted, as also its contribution towards the prediction of the occurrence of macro-benthos. One of the results indicates that changes in the amount of suspended par-ticulate matter, through time, caused shifts in the occurrence and characteristics of macrobenthic communities. Furthermore, aggregations of the tubeworm and ecosys-tem engineer O. fusiformis were mapped with very-high resolution multibeam (RV “Belgica”, Kongsberg Simrad EM3002, 300 kHz). From the imagery and sampling, it is hypothesized that those aggregations are able to stabilize sand dunes that normally migrate 12 m a year. Further biogeomorphological modelling is attempted.
EnSIS: Ecosystem sensitivity to invasive species
Belgian Science Policy Targeted Action Science for a Sustainable Development (2009–2011)
The introduction of invasive species is considered a major problem to marine ecosys-tems. The American jackknife clam Ensis directus represents a well-investigated and -documented example of such invasion in North-West European coastal waters. Apart from extensive sampling of the species, its habitat has been acoustically characterized in areas where high densities prevail. Very-high resolution multibeam was acquired during 3 periods (RV “Belgica”, Kongsberg Simrad EM3002, 300 kHz) and will allow to characterize the habitat in detail (< 2 m resolution). The measurements relate to the depth and the backscatter of the acoustic signal. Full-coverage recordings were ob-tained to situate the occurrence of E. directus in its broader spatial environment. Sea-bed samples were taken for validation. Results will assist in the set-up of habitat suitability modelling of the species.
4.1.2 Study on selecting areas under EC’s Habitat Directive, Belgian part of the North Sea
FPS Environment. Department of Marine Environment (2008–2009)
Apart from habitat suitability modelling, habitat mapping related to a revision of a seabed map of gravel occurrences, based on acoustic imagery, sampling, video and diver observations.

18 | ICES WGMHM REPORT 2010
Geo-Seas: Pan-European Infrastructure for management of marine and ocean geo-logical and geophysical data (http://www.geoseas.eu/). EU-FP7 Infrastructure (2009–2012)
Within Geo-Seas, one of the subtasks will focus on standardization in seabed habitat mapping (RBINS-MUMM lead). Efforts will focus on sediment and topography parameterization and classification.
EMODNET-Geology: European Marine Observation and Data Network (http://ec.europa.eu/maritimeaffairs/emodnet_en.html) - EU-DG MARE (2009–2012)
Pilot project aiming at delivering geologically related GIS data layers. One of the de-liveries is a continuous seabed substrate map for the Baltic Sea, Greater North Sea and Celtic Sea, on a scale of 1:1 million. The map includes an index map that identi-fies initial data layer patches and provides information on metadata: variation in remote observation, interpretation and ground-truthing methods. The current map is collated from 208 separate seabed substrate maps. The existing substrate classifica-tions were reclassified/translated to a system that is supported by EUNIS. The EMODNET reclassification scheme consists of four substrate classes defined on the basis of the modified Folk triangle (mud to sandy mud; sand to muddy sand; coarse sediment; mixed sediment) and three additional substrate classes (boulder, diamic-ton, rock). This map feeds into EMODNET-Habitat (EUSeaMap).
CALMUL. FPS Economy and Mumm. CALibration of MULtibeam retro-diffused signal.
Within the frame of that project, in 2009, an experiment was setup in order to evalu-ate the accuracy of the localization device used for in-situ sample gathering.
A GAP XSEA usbl acoustic system has been used as reference system to localize the divers with very good accuracy (better than 20 cm). Divers used closed circuit re-breather (CCR) in order to avoid the known interaction between acoustic systems and bubble they generate when using open circuit scuba system. For the inter-calibration experiment, the divers towed the GPS buoy that is used to localize in-situ sample and video images. Comparison was made between the two systems on two transects con-ducted from RV “Belgica” in Belgian North Sea real condition; Conclusion is that the GPS buoy provides localization information with a better accuracy than 10 m.
4.1.3 Relevant publications
Fettweis, M., Houziaux, J.-S., Du Four, I., Van Lancker, V., Baeteman, C., Mathys, M., Van den Eynde, D., Francken, F., Wartel, S. 2009. Long-term influence of maritime access works on the distribution of cohesive sediment: Analysis of historical and recent data from the Bel-gian nearshore area (southern North Sea). Geo-Marine Letters 29, 321–330. doi: 10.1007/s00367–009–0161–7.
Verfaillie, E., Du Four, I., Van Meirvenne, M. and Van Lancker, V. 2009. Geostatistical model-ling of sedimentological parameters using multi-scale terrain variables: application along the Belgian Part of the North Sea. International Journal of Geographical Information Sci-ence 23(2), 135–150.
Verfaillie, E., S. Degraer, K. Schelfaut, W. Willems and V. Van Lancker, 2009. A protocol for classifying ecologically relevant marine landscapes, a statistical approach. Estuarine, Coastal and Shelf Science 83, 175 -185.
4.1.4 Relevant reports
Van Lancker, V., Du Four, I., Degraer, S., Fettweis, M., Francken, F., Van den Eynde, D., De-volder, M., Luyten, P., Monbaliu, J., Toorman, E., Portilla, J., Ullmann, A., Verwaest, T.,

ICES WGMHM REPORT 2010 | 19
Janssens, J., Vanlede, J., Vincx, M., Rabaut, M., Houziaux, J.-S, Mallaerts, T., Vanden-berghe, N., Zeelmaekers, E., and Goffin, A. 2009. QUantification of Erosion/Sedimentation patterns to Trace the natural vs. anthropogenic sediment dynamics (QUEST4D). Final Re-port Phase 1. Brussels: Belgian Science Policy 2009 – 63p + 81p Annexes. (Research Pro-gramme Science for a Sustainable Development) (http://www.belspo.be/belspo/ssd/science/Reports/QUEST4D%20FinRep%20PH%201.DEF.pdf)
Degraer, S., U. Braeckman, J. Haelters, K. Hostens, T. Jacques, F. Kerckhof, B. Merckx, M. Ra-baut, E. Stienen, G. Van Hoey, V. Van Lancker and M. Vincx (2009). /Studie betreffende het opstellen van een lijst van potentiële Habitatrichtlijngebieden in het Belgische deel van de Noordzee/. Final report i.o.v. FOD Leefmilieu, Dienst Marien Milieu. 93 pp.
Degrendele K., Houziaux J.S., Norro A., Roche M. 2009. Intérêt de la plongée scientifique pour la caractérisation de visu et le contrôle des classes acoustiques définies par sondeur Multi-faisceaux. Bilan général des campagnes de mesures 2005–2009. 42 pp Mumm internal re-port.
4.2 National programme report for France
Jacques Populus (Ifremer, France)
4.2.1 Historical habitat map
The collation of historical habitat maps has gone on in 2009, although at a slower pace as all existing French maps are now either fully incorporated or underway. There is still a need to contract authors or experts to translate a few remaining maps to Eunis (maps with larger extension in the figure below). These maps are being digitized, quality checked, translated to the EUNIS classification and their metadata captured. After they have been translated to Eunis they are stitched together where possible to provide continuous coverage (e.g. the large blocks covering the eastern Channel and the Bay of Biscay).

20 | ICES WGMHM REPORT 2010
Figure b1. Historical marine habitat maps from France.
Further to full habitat maps, seven historical seaweeds maps of the coasts of Brittany were available in paper form (not shown here), which it was deemed important to collate and store in digital form to allow future comparisons in future with recent surveys. These maps generally date back to the period from 1975 to 1990.
4.2.2 Detailed habitat maps
Detailed habitat maps were mostly produced in the frame of both Natura 2000 (with emphasis on intertidal zones) and the Rebent network which has been producing habitat maps for the last seven years. This network has been so far limited to Brittany. These maps appear as smaller boxes in the figure above and amount to about). The two programs do overlap in terms of sites; however the former requires mapping habitats according to the Habitat Directive classification, whereas the latter produces maps in the Eunis classification. Three detailed maps were published on the web in 2009.
In total 51 maps either historical or recent with a variety of scales are now available (with about half of them downloadable as shapefiles) at: www.rebent.org.
Marine Natura 2000 has been launched in 2009 by the MPA Agency. This call for tender concerned 60 sites over the whole coast of France (among which 32 in Brit-tany) for a total amount of 6.5 M€. This represents only a small amount for each site. Surveying and mapping is underway, however the specifications in terms of classifi-cation and coverage were far from prescriptive and it is quite difficult to figure out

ICES WGMHM REPORT 2010 | 21
how consistent the output of the operation is going to be. It is believed many of the contractors will do no more than gathering existing proxies and trying to validate some sediment polygons with minimum ground-truthing.
4.2.3 Priority habitats
Two priority habitats are being monitored in the framework of the WFD (Water Framework Directive), namely seagrass beds and maerl beds. The former are rea-sonably well known because the upper limits of seagrass patches are easily detectable on remote sensing imagery whereas their lower limits in many places were either interpreted from acoustic data were available or inferred from other sources (aerial photography, sediment maps, depth maps). In Brittany where the majority of beds are found, a comprehensive atlas was produced in 2007. This atlas is being updated as further bed delineation is updated locally. The status of a selection of beds is moni-tored on a three year basis as part of the WFD requirements.
Maerl beds had never been accurately mapped before and only the presence of maerl has been reported from random samples collected in the frame of historical maps. Maerl being a WFD habitat (and also an OSPAR priority habitat) was deemed impor-tant to closely monitor. In 2009 twelve sites representing in all 65 km² were surveyed with an Edgetech side scan sonar, and their extension is shown in the figure below. This contributes to a better knowledge of our maerl resources, which happened to be considerably overestimated in the past. As a salient example the maerl beds appear-ing between Brittany and Normandy (NE corner of figure below) are most likely to be much smaller than expected.
Figure b2. Maerl beds in Brittany.
4.2.4 Seabed sediments
A few sediment maps are generated locally by projects such as the Rebent project as the first step towards habitat maps, but this production remains very limited to one or two maps per year at the most. The initiative called “G maps” developed by the
22 | ICES WGMHM REPORT 2010
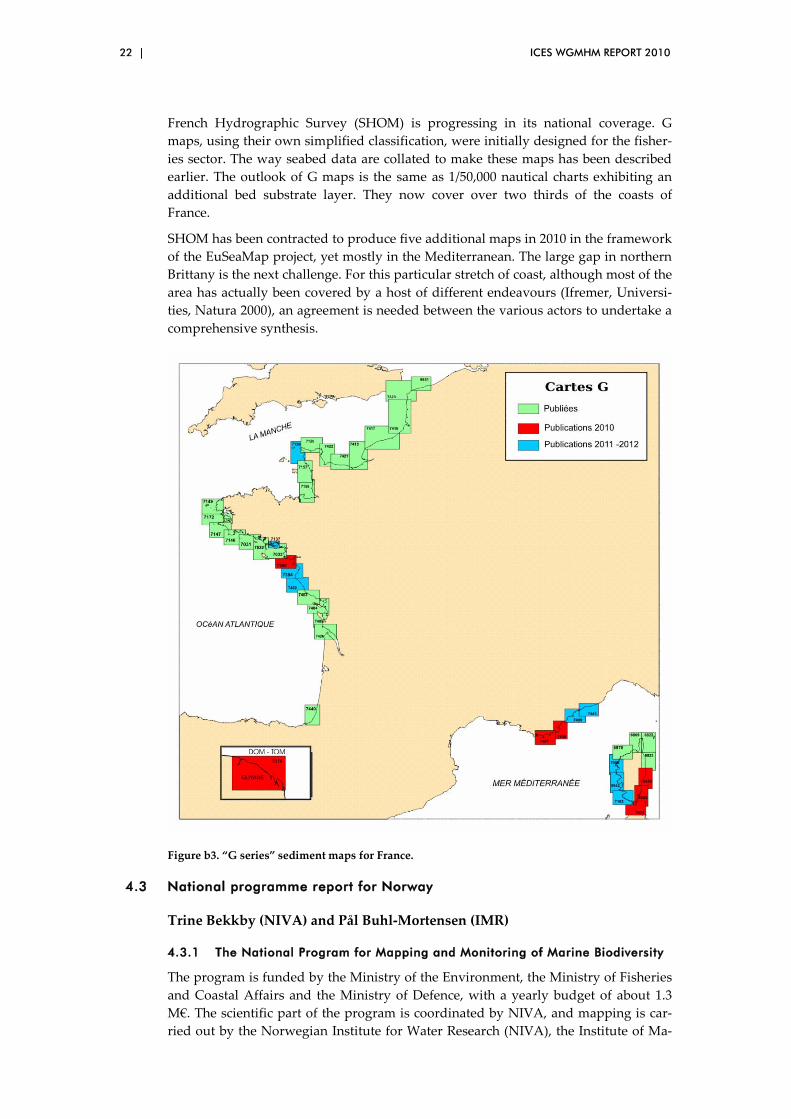
French Hydrographic Survey (SHOM) is progressing in its national coverage. G maps, using their own simplified classification, were initially designed for the fisher-ies sector. The way seabed data are collated to make these maps has been described earlier. The outlook of G maps is the same as 1/50,000 nautical charts exhibiting an additional bed substrate layer. They now cover over two thirds of the coasts of France.
SHOM has been contracted to produce five additional maps in 2010 in the framework of the EuSeaMap project, yet mostly in the Mediterranean. The large gap in northern Brittany is the next challenge. For this particular stretch of coast, although most of the area has actually been covered by a host of different endeavours (Ifremer, Universi-ties, Natura 2000), an agreement is needed between the various actors to undertake a comprehensive synthesis.
Figure b3. “G series” sediment maps for France.
4.3 National programme report for Norway
Trine Bekkby (NIVA) and Pål Buhl-Mortensen (IMR)
4.3.1 The National Program for Mapping and Monitoring of Marine Biodiversity
The program is funded by the Ministry of the Environment, the Ministry of Fisheries and Coastal Affairs and the Ministry of Defence, with a yearly budget of about 1.3 M€. The scientific part of the program is coordinated by NIVA, and mapping is car-ried out by the Norwegian Institute for Water Research (NIVA), the Institute of Ma-

ICES WGMHM REPORT 2010 | 23
rine Research (IMR) and the Geological Survey of Norway (NGU). The pilot period of the program started in 2003 with a discussion of methodology and an integration of data and knowledge. The field mapping and modelling started in 2007. By the end of 2010, about half of the coastal municipalities will be covered. The rest will be mapped in 2011–2015. About 100 000 km2 of the coastal area is covered by this program.
Norway has 83 000 km of complex coastline, containing several habitats. This pro-gram focuses on mapping a selection of these: kelp forests (I01), ice marginal deposits (I07), soft-beds in the coastal zone (I08), loose calcareous algae (I10), eelgrass/seagrass meadows (I11), carbonate sand (I12), oyster areas, dense scallop occurrences and spawning areas.
The different habitats require different methodology for mapping. As the Norwegian coast is so long and complex, modelling is a helpful tool. For field sampling design, analyses of data and modelling, information on depth, terrain, wave exposure and current speed is available. The depth model, DEM (at a spatial resolution of 25 m), is provided by the Hydrographical Service, the terrain variables (slope, curvature, as-pect and light exposure) are derived from the DEM. The wave exposure model was developed by Martin Isæus (Isæus 2004) at AquaBiota Water Research, and ROMS current speed models were available for a few areas. The Hydrographical Service is constantly improving the depth data used in the DEM, and they are, in collaboration with NIVA and IMR, modelling currents at an 800 m resolution (to be finished in 2–3 years).
Kelp forests are mapped using underwater camera, UWC (collecting point data), modelling, field validation and model improvement. The eelgrass meadows were mapped using UWC, the model being used to define the polygon in areas of seagrass presence only. Soft-beds in the coastal zone were modelled and the areas verified using aerial photographs. Information on spawning areas was based on interviews with fishers and verified through field sampling of egg distribution. Carbonate sand is mapped using UWC, multibeam echosound, grab, modelling, field validation and model improvement. Dense scallop occurrences are mapped using UWC and diving, and the development of a first generation model is ongoing. The habitat occurrences (polygons) are given a valuation according to different criteria. The criteria for the valuation are under revision. The plan for 2011–2015 is to cover the rest of the mu-nicipalities.
4.3.2 MAREANO (Marine AREAdatabase for NOrwegian coast and sea areas)
MAREANO is a multidisciplinary seabed mapping programme, focusing on offshore areas in the southern Barents Sea and the northeastern Norwegian Sea (the Norwe-gian Barents Sea management plan area). MAREANO aims to map terrain, sedi-ments, benthic habitats, species diversity and sediments pollutants. It is a multidisciplinary collaboration between the Institute of Marine Research (IMR), the Geological Survey of Norway (NGU), and the Hydrographic Service (SKSD). In addi-tion to collecting new data, the partners collate existing information and present it integrated in the web portal www.mareano.no. The project is financed by the minis-tries of the Environment, Fisheries and Coastal Affairs, Trade and Industry and the Research Council of Norway. The first phase of MAREANO (2005–2010), has focused on providing knowledge to support the implementation of the Norwegian Barents Sea management plan. The goal is to obtain information for the regulation of human activities such as the petroleum industry and fisheries.

24 | ICES WGMHM REPORT 2010
Since MAREANO was launched in 2005, in all 7 cruises have been conducted. To date, 51 000 km2 has been mapped by multibeam surveys (Figure b4), and 48 000 km2 investigated by visual inspection and sampling for geology, biology, and pollutants. For 2010, two cruises (42 days in total) are planned for the area off Lofoten-Vesterålen.
The mapped areas cover different landscapes from shallow banks to the abyssal plains (40–2700m depth) with troughs, ridges, canyons, mega sand waves, cold seeps and coral reef areas. Locations for visual documentation (700 m long video transects) and sampling of fauna and sediments are selected on the background of the distribu-tion of interpreted sediment types, landscapes and landscape elements. The task of mapping seabed substrata, biodiversity and vulnerable biota in a varied seascape is challenging. Not all habitats can be sampled using the same gear, and not all taxo-nomic groups are equally well known. The MAREANO mapping program tries to take this into account by applying a wide set of sampling techniques to provide a best possible documentation of the diversity of bottom fauna. To document infauna, epi-fauna and hyperbenthos, video, grab, beam trawl and epibenthic sled are used. Habi-tat descriptors for prediction are: interpreted sediment type, and multibeam derived values for rugosity, relief, curvature, bathymetric position index, and backscatter.
In 2009 The MAREANO program completed baseline mapping in the areas the “Egga-margin” and in “Nordland VII” off Vesterålen/Lofoten. Altogether, 129 locali-ties were investigated during two three-week long cruises covering 132 video-transects and 26 sampling stations in an area of 16 000 km2. The coverage of video-transects was 8.3/1000 km2 and for sampling stations 1.6/1000 km2. On the northern “Egga-margin” in the northern part of the mapping area, many of the same biotopes as identified earlier by MAREANO in the “Tromsøflaket” area were observed. At 200–500 m depth on the shelf, ”sponge-communities” were common. Here, dense patches of large sponges occurred on a substrate consisting of a matrix of sponge spicules and mud. Trawl-marks were frequent and occurred at 81 of the 115 study sites surveyed in 2009. Another biotope is the morainic shelf break gravel areas with basket stars (Gorgonocephalus eucnemis). These biotopes are intersected by areas with strong currents and large sand waves. Similar sand waves have earlier been docu-mented by MAREANO in the ”Hola” area in the vicinity of 330 Lophelia reefs. In gen-eral the fauna are poor and currents are strong in the sand-wave fields. In deeper water (700–900 m), in the Bjørnøya slide area the gorgonian coral Radicipes was ob-served for the first time in Norwegian waters. This coral occurred in relatively dense stands in a restricted area. On the soft bottom on the lower slope (900–1100 m) on the “Egga-margin” a rich fauna of small crustaceans (Peracarida) were found on stalks and tubes of other organisms (polychaetes, crinoids, hydroids, sponges, etc). In this area the carnivorous sponge Chondrocladia gigantea was much more common than further south in Nordland VII.
The greatest depths were mapped in Nordland VII (2700 m) where the bottom tem-perature is between – 0.5 and -1.1 °C, and the fauna are arctic. The shelf and slope with canyons in the Nordland VII area represent a varied terrain with a strong gradi-ent also in hydrography. In the deepest areas in Nordland VII the environment seemed homogenous with a megafauna common for the deep northern parts of the Atlantic and the Norwegian Sea. This fauna were dominated by the holothurians Elpidia sp. and Kolga hyalina, the stalked crinoid Rhizocrinus lofotensis together with the crustaceans Bythocaris leucopis and Saduria sp. and the sea urchin Pourtalesia cf. jeffreysi. The fauna are not species rich, but specific for the arctic deep-water. The

ICES WGMHM REPORT 2010 | 25
abundance of infauna at these depths was very low and the fauna are clearly richer on the shallower slope.
Figure b4. Areas mapped with multi beam echosounder in the MAREANO area and elsewhere in Northern Norway.
4.3.3 Other projects
Norway is also involved in several EU funded projects, the Hermione, MESMA and CoralFish. MESMA (Monitoring and Evaluation of Spatially Managed Areas, www.mesma.org) focuses on marine spatial planning and aims to supply innovative methods and integrated strategies for governments, local authorities, stakeholders, and other managerial bodies. This will comprise an easy accessible data system, con-taining information on the distribution of marine habitats and species, economic val-ues, and human uses.
Hermione (Hotspot Ecosystem Research and Man's Impact on European Seas, eu-hermione.net) is designed to increase our knowledge of the functioning of deep-sea ecosystems and their contribution to the production of goods and services. This will be achieved through a highly interdisciplinary approach that will integrate biodiver-sity, specific adaptations and biological capacity in the context of a wide range of highly vulnerable deep-sea habitats (www.eu-hermione.net/science).
CoralFish (www.eu-fp7-coralfish.net) will assess the interaction between corals, fish and fisheries, in order to develop monitoring and predictive modelling tools for eco-system based management in the deep waters. New data acquisition is an important goal of CoralFish.
26 | ICES WGMHM REPORT 2010
4.4 National programme report for Sweden
Martin Isaeus (AquaBiota Water Research) and Cecilia Lindblad (Swedish En-vironmental Protection Agency)
4.4.1 Swedish offshore bank survey
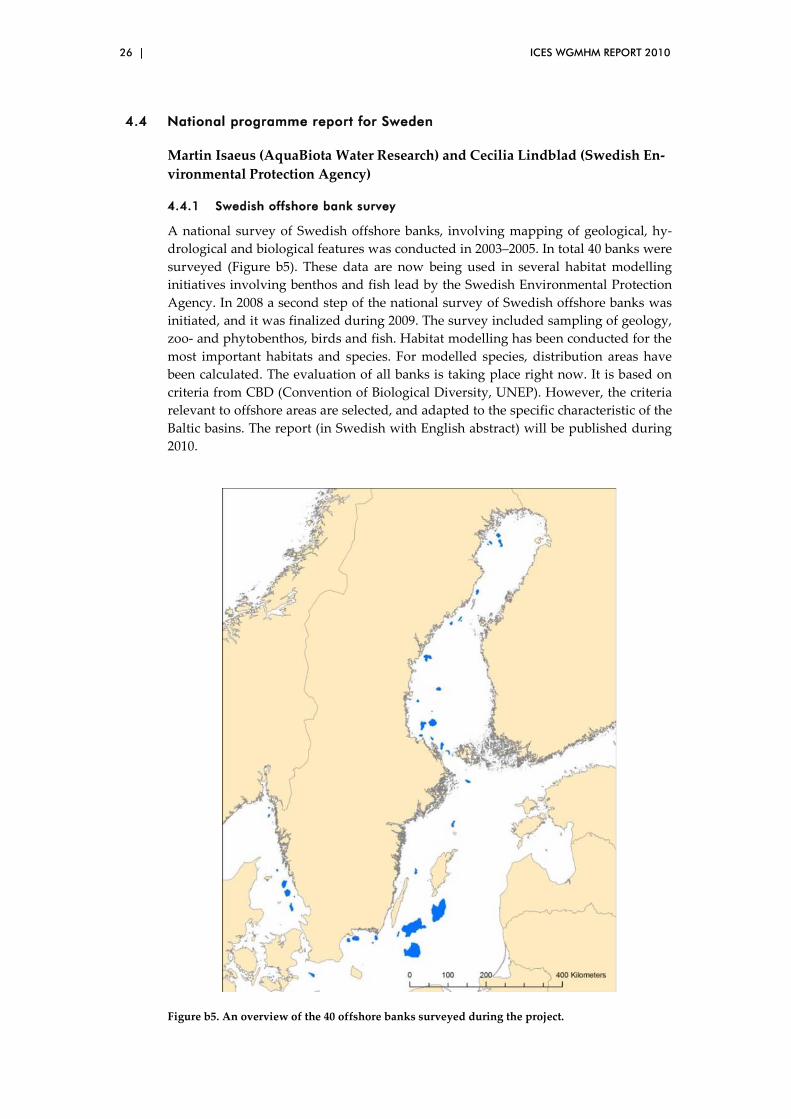
A national survey of Swedish offshore banks, involving mapping of geological, hy-drological and biological features was conducted in 2003–2005. In total 40 banks were surveyed (Figure b5). These data are now being used in several habitat modelling initiatives involving benthos and fish lead by the Swedish Environmental Protection Agency. In 2008 a second step of the national survey of Swedish offshore banks was initiated, and it was finalized during 2009. The survey included sampling of geology, zoo- and phytobenthos, birds and fish. Habitat modelling has been conducted for the most important habitats and species. For modelled species, distribution areas have been calculated. The evaluation of all banks is taking place right now. It is based on criteria from CBD (Convention of Biological Diversity, UNEP). However, the criteria relevant to offshore areas are selected, and adapted to the specific characteristic of the Baltic basins. The report (in Swedish with English abstract) will be published during 2010.
Figure b5. An overview of the 40 offshore banks surveyed during the project.

ICES WGMHM REPORT 2010 | 27
4.4.2 Marine Modelling of Östergötland (MMÖG)
In 2009 a project on producing maps for marine management covering the whole county of Östergötland (Figure b6) was initiated, and the project is being finalized during 2010. The project is funded by the Swedish Environmental Protection Agency, lead by AquaBiota Water Research in collaboration with the County Administration Board, Swedish Maritime Board, Swedish Geological Survey and the municipality of Norrköping. The project includes the following main work packages:
• Collating and management of existing field data. • Oceanographic modelling of salinity and bottom currents in 50 m resolu-
tion. • Modelling of surface sediments based on surveyed marine geology and
environmental parameters. • Digitizing old depth measurements, and interpolating them into a
bathymetry grid. • Complementary biological sampling for calibration and validation of
models. Drop-down video was used at 1400 stations. Altogether data from 2500 drop-video stations and 150 dive transects were used in the project.
• Modelling of distribution of phytobenthic species distributions. About 50 different probability maps were produced showing the distribution of ben-thic species and assemblages in 25 m resolution.
• Accuracy calculations of environmental layers and species predictions. The validating was performed using independent field data.
• In collaboration with managers at national, county and municipality level selected probability maps were converted into maps showing “key bio-topes” of special importance for management. The key biotopes displayed important areas for Blue mussel (Mytilus edulis), High vascular plants, Per-ennial redalgae, Bladderwrack (Fucus vesiculosus) and Eelgrass (Zostera ma-rina).

28 | ICES WGMHM REPORT 2010
Figure b6. The project MMÖG is conducted in the county of Östergötland, which is displayed in green. A similar project is in progress in Västernorrland (red), and preparations for a project is conducted in Södermanland and Stockholm (orange). There is also an application for a similar project in Skåne and Blekinge (yellow).
The report will be written during 2010 (in Swedish with English abstract), and se-lected parts will be published in scientific articles.
The coming projects (Figure b6) will also include modelling of macrozoobenthic spe-cies, fish recruitment areas, and include anthropogenic effects.
4.4.3 Mapping human activities
A national program has started to map human activities in the Swedish marine area. The project is funded by Swedish environmental protection area and performed by Metria miljöanalys. Information from aerial photographs on bridge and harbour den-sity along the shoreline are collected as well as shipping density from AIS data and movement of recreational boating.
Next step will be to combine maps on for example boat traffic and natural harbours for leisure boats with habitat models on vulnerable species or important fish spawn-ing areas.
4.5 National programme report for Portugal
Roberto Martins (Department of Biology and Centre for Environmental and Marine Studies, University of Aveiro)
The largest marine research project currently underway in Portugal is with the Task Group for the Extension of the Portuguese continental shelf (EMEPC). This group, in 2009, submitted a proposal to the Commission on the Limits of the continental shelf, re-

ICES WGMHM REPORT 2010 | 29
garding the extension of the Portuguese continental shelf beyond 200 nautical miles, corresponding to a nearly 2.150.000 km2 (Figure b7). To carry out this mission, several resources of the Portuguese Hydrographic Institute and partnerships with civil insti-tutes were used to perform a surveying programme and to produce geophysical, geological (seismic data, gravimetric and magnetic data) and biological datasets for extensive deep-sea areas within and outside the Portuguese EEZ. The programme M@rBIS was launched in 2008 to develop a marine biodiversity information system which will be an important tool to collate all information spread over distinct institu-tions and universities into a GIS database and to establish links and to harmonize the data with international databases. One of the most important information sources will be the EMEPC (http://www.emepc.pt).
Figure b7. Map of the outer limits of the extended continental shelf of Portugal. (www.emepc.pt)
4.5.1 ACOBIOS and ACOSHELF
These projects, aims to identify, to map and to characterize the benthic biotopes over the Portuguese coast, namely, some coastal lagoons and the Portuguese continental shelf. This studies have been carried out by the University of Aveiro/CESAM using acoustic techniques (single beam echosounder; acoustic ground discrimination sys-tem is QTC View, Series IV and V) which have been validated by grab samples used for the study of superficial sediments and benthic macrofauna. Datasets generated (and the ones in progress) includes benthic biotopes maps, bathymetry and seabed characteristics (grain size, organic matter content, geochemistry, others). Some results

30 | ICES WGMHM REPORT 2010
are already published (Figure B8–10; Freitas, et al., 2003a6; 2003b7; 20058
) and others are under publication.
Figure b8. Study areas under the ACOSHELF and ACOBIOS project. A – Portuguese continental shelf and Cádiz; B – Near shore shelf off Algarve; C - Near shore shelf off Aveiro; D - Mid shelf off Lisbon.
6 Freitas, R., Silva, S., Quintino, V., Rodrigues, A.M., Rhynas, K., Collins,W.T., 2003. Acoustic seabed classi-fication of marine habitats: studies in the Western Portuguese coastal shelf. ICES Journal of Marine Science. 60: 600 - 609. 7 Freitas, R., Rodrigues, A.M., Quintino, V., 2003. Benthic biotopes remote sensing using acoustics. Journal of Experimental Marine Biology and Ecology, 285–286: 339–353.
8 Freitas, R., Sampaio, L., Rodrigues, A.M., Quintino, V., 2005. Sea-bottom classification across a shallow water bar channel and near shore shelf, using single beam acoustics. Estuarine, Coastal and Shelf Science, 65: 625 - 632.
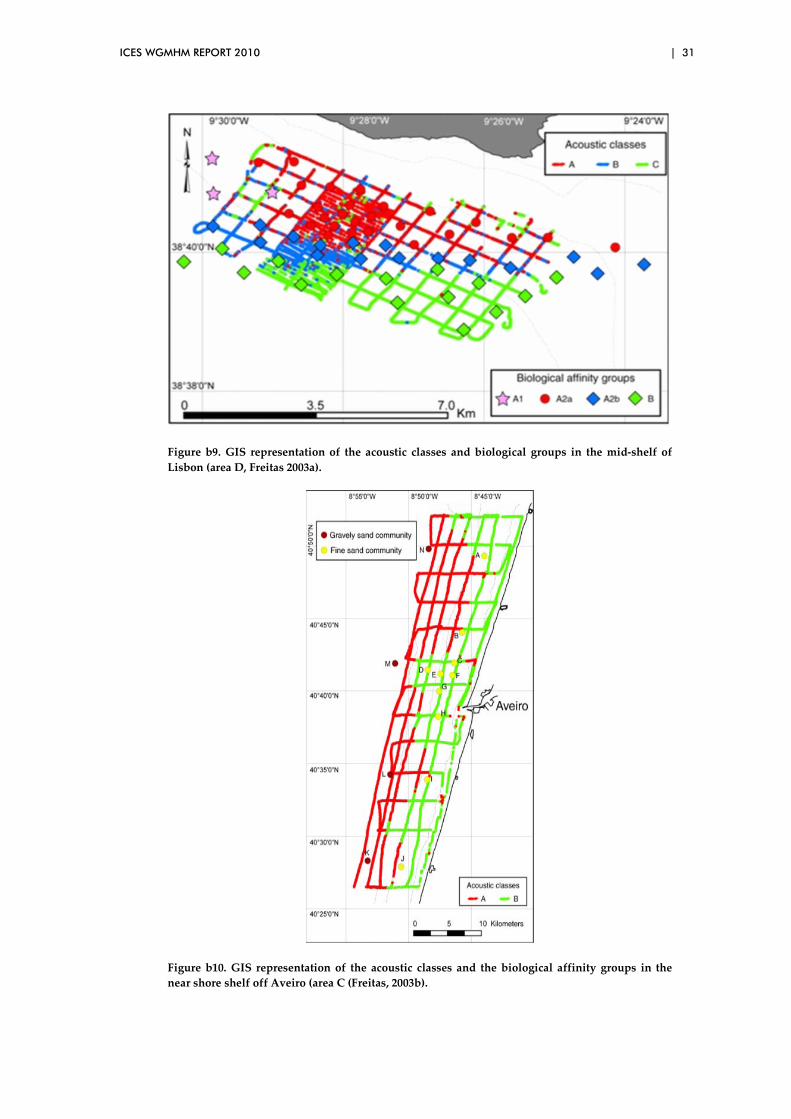
ICES WGMHM REPORT 2010 | 31
Figure b9. GIS representation of the acoustic classes and biological groups in the mid-shelf of Lisbon (area D, Freitas 2003a).
Figure b10. GIS representation of the acoustic classes and the biological affinity groups in the near shore shelf off Aveiro (area C (Freitas, 2003b).

32 | ICES WGMHM REPORT 2010
RENSUB (www.rensub.com)
This is a project performed in the South coast of Portugal by University of Al-garve/CCMAR, which aims to describe and map the principal coastal biocenoses (habitats and species) of the central Algarve coast, in the subtidal zone from 0 to 30 m depth and to produce a final map of marine biodiversity hot spots to the environ-mental administration for coastal management purposes (Figure b11). To carry out this study several sampling procedures were included, namely underwater visual census for ichthyofauna and macrofauna on rocky bottoms, quadrats for algae, beam trawl and video transects for sandy bottoms. Side scan sonar was also used to effi-ciently create an image of large areas from the seabed. All the information is being integrated in Geographic Information Systems for a complete analysis of all the dif-ferent maps. Density maps (1:50000 scale), biodiversity, vulnerability and ecological sensibility indexes are the type of generated datasets, which will be available by summer 2010.
Figure b11. A: Final map for stakeholders with 5 levels of ecological importance from 1 (dark blue – less important) to 5 (red – more important); B: Study area under the RENSUB project; C: Side scan sonar image obtained in the south coast of Portugal (source: Professor Jorge Gonçalves).
Deep Reefs (www.deepreefs.com)
PhD project recently started, supported by University of Algarve/CCMAR and others public institutions and private companies, which aims to create 3D maps of deep reef’s marine biodiversity from the Portuguese continental shelf (specially the south and southwest shelves), between 30 and 70 meters depth. The survey techniques in-clude underwater visual census, hand-picked biological samples and side scan sonar.
BIOMARES (www.ccmar.ualg.pt/biomares)
Biomares deals with restoration and management of biodiversity in the Marine Park Site in Arrábida (SW coast of Portugal). The project proposes an active management strategy for Habitat 1170 (Reefs) and Habitat 1110 (Sandbanks, permanently covered with seawater). BIOMARES aims to perform a seabed physical and biological charac-terization (to map sediments and macrozoobenthos communities distribution; to identify the ichthyofauna and to correlate with depth and sediment), to restore the
5 4 3 2
Levels of ecological importance
A
Faro
Vilamoura C
Atlantic ocean
Algarve
B

ICES WGMHM REPORT 2010 | 33
lost seagrass meadow, to manage and to invert the current tendency for overexploita-tion and damage in those habitats, which are the last truly marine example of this habitat on Atlantic Iberian coastlines. To achieve these proposals several survey tech-niques have been used, namely acoustic techniques (single beam echosounder; AGDS: Rox-Ann), grab sampling (macrozoobenthos and granulometry), video cam-era (drop down) and trawlnet fishing (ichthyofauna sampling). The scientific coordi-nation of the project is made by Centre of Marine Sciences (CCMAR – University of Algarve); IPIMAR is responsible for the creation of the benthic biotope maps; other partners are included in that multidisciplinary project, like ISPA, ICNB and CSIC.
CONDOR (www.condor-project.org)
CONDOR aims to describe and analyse the biodiversity of the Condor seamount (10 nautical miles SW of the Island of Faial, Azores). A permanent underwater observa-tion station will be implemented and will be used for monitoring and experimental purposes, adopting a multidisciplinary approach, supported by advanced technology (e.g. multibeam echosounders, ROV). For example, the occurrence of coral gardens and deep-sea sponge aggregations, two biotopes of high conservation importance under the OSPAR Convention, has been recorded to be used in the coral habitat suit-ability modelling.
4.5.2 Other international projects
University of Aveiro/CESAM, University of Azores and Portuguese Hydrographic Institute continue their participation in the FP7 project HERMIONE, which aims to create a GIS-database of canyons, corals, mounds, chemosynthetic ecosystems (hydrothermal vents, cold seeps), landslides, seamounts within OSPAR area9
Concerning to the DEEPSETS project (
.
www.marbef.org/projects/deepsets/index.php), a PhD study about host chemosynthetic environments is being performed in the Uni-versity of the Azores. In this project several sites in Europe are being studied, namely the MoMAR area, within Azores islands, which contains one of the largest known active vent fields “in the modern ocean”, Lucky Strike.
Mar-ECO project (www.mar-eco.no) is studying the biodiversity, distribution and ecology patterns along the Mid Atlantic Ridge (including Azores). The Portuguese partners involved are the University of the Azores/DOP, IPIMAR, Marine Biology Station of Funchal and Madeira’s Fisheries Institutional Department. Several deep-sea biodiversity data will be obtained.
The FP7 project CoralFISH (http://eu-fp7-coralfish.net/) aims to assess the interaction between corals, fish and fisheries, in order to develop monitoring and predictive modelling tools, for ecosystem based management in the deep waters of Europe, including Azores islands (marine protected areas, hydrothermal vents, oceanic sea-mounts). Institute for Marine Research (University of Azores) is the Portuguese part-ner involved. Bathymetry, coral and fish habitat maps will be generated.
SeaDataNet is a FP7 project (www.seadatanet.org), which brings together 49 part-ners, including the Portuguese Hydrographic Institute. That project aims to develop a marine data management infrastructure, which integrates and makes interoperable the existing systems and the results of several past EU projects. IH is helping in the
9 Weaver et al. (2009) The future of integrated deep-sea research in Europe: The HERMIONE project. Ocea-nography 22 (1), 179–191.

34 | ICES WGMHM REPORT 2010
development of standard protocols for communication and data qualification, as well the development of software tools for interconnecting and transnational access of the Data Centers, and also data products for the Atlantic and global oceans.
4.6 National programme report for UK
Natalie Coltman (JNCC) and Mike Robertson (MS-S Marine Laboratory)
This update covers survey work carried out in 2009–2010, new habitat mapping ini-tiatives (not necessarily survey), data interpretation projects and future surveys.
4.6.1 Survey work 2009–10
The programme of offshore SAC surveys has continued, with surveys this year of Anton Dohrn and East Rockall Bank in the northwest approaches, and of northwest Anglesey in the Irish Sea (Figure b12).
Figure b12. JNCC Offshore survey 2009–2010.
The surveys of “Anton Dohrn” and East Rockall bank took place in July 2009 and surveyed two Areas of Search (AoS) for offshore Special Areas of Conservation (SACs); “Anton Dohrn” Seamount located 155km west of the St Kilda archipelago, and East Rockall Bank located 260km west of the St Kilda archipelago.
Commissioned by JNCC, the surveys were undertaken by the British Geological Sur-vey, University of Plymouth and Marin Mättenik AB. Its key objective was to acquire high quality acoustic and photographic ground-truthing data to enable the distribu-
Seabed habitat derived from BGS 1:250,000 seabed sediment maps © NERC. The exact limits of the UK Continental Shelf are set out in orders made under section 1(7) of the Continental Shelf Act 1964 (© Crown Copyright). World Vector Shoreline © US Defense Mapping Agency. Map copyright JNCC 2010.
Anton Dohrn
East Rockall
North West

ICES WGMHM REPORT 2010 | 35
tion, extent and biological characterization of Annex I reef within both Areas of Search.
4.6.2 Anton Dohrn Seamount
Figure b13. JNCC survey of Anton Dohrn Seamount (2009).
This survey acquired 215 line kilometres of multibeam echosounder data and 10 pho-tographic ground-truthing sites targeted within Anton Dohrn Seamount Area of Search. Although data are still being analysed and interpreted, initial observations revealed the flanks and area immediately adjacent to Anton Dohrn Seamount to comprise predominantly gravel-rich sediment with bedrock outcropping on the steeper sections of the seamount flanks. Interestingly, the parasitic cones surveyed within the Anton Dohrn Seamount Area of Search comprised predominantly corals, including large gorgonian species, small bamboo coral, the soft coral Anthomastus sp. and the antipatharian Leiopathes sp

36 | ICES WGMHM REPORT 2010
4.6.3 East Rockall Bank
Figure b14. JNCC Survey of East Rockall Bank (2009).
Within East Rockall Bank Area of Search, 692 line kilometres of multibeam echo-sounder and 168 line kilometres of sidescan sonar data were acquired - 17 photo-graphic ground-truthing sites were also targeted. Initial observations indicate East Rockall Bank to comprise predominantly gravelly muddy sand on the eastern flank of the Bank with gravel- and sand-rich sediments dominating the crest of the Bank. Significant bedrock reef was encountered along an escarpment located on the eastern flank of Rockall Bank roughly coincident with the 500m bathymetric contour. This laterally extensive feature primarily comprises volcanic bedrock with possible sedi-mentary bedrock cropping out at seabed colonized by large stylasterid hydrocorals and sponges.
Preliminary observations and interpretation of the data acquired during the course of this cruise suggest that several sites at both Areas of Search may fit the definition of Annex I reef under the EC Habitats Directive. Reporting was completed at the end of March 2010, and currently the sites will undergo assessment against site selection criteria for possible consideration as SACs.
4.6.4 North-west Anglesey
The aim of the northwest Anglesey survey was to identify and map the extent of Modiolus reef in the Irish Sea. From previous work it has been established that Modio-lus occurs both sides of the 12nm limit and therefore this interests both Countryside Council for Wales (CCW) and JNCC as any resulting SAC would be a cross-boundary site. There have so far been two surveys regarding this work. The first, an acoustic survey was undertaken within a Memorandum of Understanding by Cefas. This highlighted potential areas for further investigation. The second survey, led by CCW undertook video transects and Modiolus was found. These videos are been analysed at present and there are plans for further video work scheduled for June 2010.

ICES WGMHM REPORT 2010 | 37
Figure b15. JNCC Survey of North-west Anglesey.
In Northern Ireland, investment in seabed mapping is increasing, with the appoint-ment of a permanent mapping scientist at AFBI. Currently, a State of the Seas report for Northern Ireland is being prepared for delivery at the end of July 2010. This will be structured according to the MSFD Descriptors, and is a national version of the Charting Progress 2 assessment for the UK (also due to be published in July 2010). This State of the Seas report will include indications of multibeam coverage, habitat availability (including maps derived from single beam), and spatial information about human activities. Northern Ireland agencies have also formed a Seabed Map Users Group (Marine and Coastguard Agency, British Geological Survey, Depart-ments of NI Government) to coordinate survey effort, and have established a Memo-randum of Understanding with the Civil Hydrography Programme. This Memorandum enables easier access to data, in return for collecting multibeam to a higher standard so that it can be used in the Civil Hydrography Programme.
The Scottish Government has recently identified large areas around the Scottish coastline which are considered ideal for the generation of electricity by wind, wave or tidal generators. To help and encourage inward investment from interested compa-nies, a programme of targeted seabed mapping was implemented in 2009 which would provide broad scale maps of local bathymetric conditions and information on sediment types and their distributions.
To this end, a Reson 7125 dual frequency multibeam echosounder was purchased and installed on-board FRV “Scotia” and, after a series of short trial and training cruises, a survey of the seabed around the Orkney Isles and throughout the Pentland Firth ar-eas was completed in July / August 2009. Acoustic data were acquired and prelimi-nary processing was carried out on board the research vessel while ground-truthing using grab, digital still camera and TV camera tows were also completed from throughout the survey area. On completion of this cruise, the bathymetric data were cleaned and displayed using CARIS Hips and Sips while the Fledermaus graphics package was used to visualize the data as 3D seabed maps. These maps and associ-ated processed data were made generally available to power companies and consult-
38 | ICES WGMHM REPORT 2010
ant companies while most of the video and TV images can be down loaded from the Scottish Government website and displayed via Google Earth. See URL below.
During the 2009 cruise, we also logged backscatter data from the echosounder (snip-pets data). These have been processed using QTC Multiview while QTC Clams will also be applied in the near future. Maps of sediment cluster have been produced and, although not giving complete coverage of the work area, clearly show where areas of bedrock, boulders, stones and soft sediments are located. Further work on the back-scatter data will be carried out using the Fledermaus geocoder tools and these maps will also be published on the Scottish Government website.
Plans for 2010 include a 21 day survey to the west of the Outer Hebrides, throughout the Minches and in the general areas around the inner Hebridean islands of Tiree and Colonsay. Further refinement of the 2009 data and post-processing of all the 2010 data will also be completed.
http://www.scotland.gov.uk/About/Directorates/Wealthier-and-Fairer/marine-scotland
Also in Scottish waters, the British Geological Survey has started an extensive pro-gramme of multibeam mapping in shallow coastal waters, in the area known as the ‘blue ribbon’. Generally this ranges from 2–20m; a new shallow water vessel has been purchased for this purpose.
4.6.5 Relevant initiatives
Recently there have been some important moves in the UK which are relevant to this group but which are not new survey work. For example, Charting Progress 2 (part of the UK Marine Monitoring and Assessment Strategy) provides an assessment of the state of the UK’s marine environment, and includes a summary of the areas of the UK for which various types of bathymetric data are available. It is expected that the final report of Charting Progress 2 will be published in July 2010.
In the last year, the UK has established a Marine Biodiversity Monitoring Pro-gramme. This research and development Programme will, by mid 2013–14, propose options to UK Governments for a coordinated and integrated monitoring system for most marine biodiversity, both in the wider marine environment and in protected sites. It will also enable protected sites to be placed in the context of the wider envi-ronment. As it will be necessary to pilot any proposals, the Programme will also pro-vide the first data point in a long term trend dataset for one or more regional seas.
There are many policy drivers for this work. The Governments have set out their vision for ‘clean, safe, healthy, productive and biologically diverse oceans and seas’10
10 Safeguarding our Seas, 2002.
. The UK is party to a number of European-regional agreements and European Com-munity obligations such as the OSPAR Convention, Habitats and Birds Directives and the recent Marine Strategy Framework Directive. Finally, the marine environ-ment is a resource that contributes to societal well-being and its efficient management will sustain it in the long term and minimize the effects of climate change. However, it is not the intention to develop schemes specific to each driver, but instead to de-velop a monitoring scheme that is general in nature, so it can be used for both exist-ing policies and to respond to new policies and pressures in future.

ICES WGMHM REPORT 2010 | 39
The Programme is still evolving, but it is hoped that, for seabirds, cetaceans and ben-thic habitats, it will be undertaken by the Great Britain conservation bodies and Northern Ireland Environment Agency for all the seas of the UK, working within the context of the UK Marine Monitoring and Assessment Strategy’s (UKMMAS) Healthy and Biologically Diverse Seas Evidence Group (HBDSEG). Core to this work will be a Strategy that will provide a common set of principles for the species and habitat work to follow. An essential element of this Strategy will be the use of infor-mation about human activities and their associated pressures and impacts. This in-formation will be used as a means of allocating sampling effort, as a surrogate for some sampling of biodiversity, and as a basis for evidence of the causes of change.
Working with other HBDSEG partners, this same Strategy could also provide the basis for developing existing monitoring for fish, turtles, plankton, seals and cepha-lopods into an integrated programme to meet policy needs.
Costs of monitoring in the marine environment are high due to platform (ship and aircraft) costs. However, such platforms can provide a base for multiple sampling techniques to be deployed at the same time. Integration, both among biodiversity schemes, and significantly between other marine monitoring schemes, will enable individual scheme platform costs per scheme to be kept down.
The UK is committed to the establishment of a network of marine protected areas (MPAs) to conserve marine ecosystems and marine biodiversity. The UK Govern-ment has also made a commitment under the Marine and Coastal Access Act11
References
to take forward a network of conservation sites to conserve, and promote the recovery, of a wide range of habitats and species. A number of contracts have been completed in 2009–10, delivering biophysical data layers for UK waters which will be used to es-tablish this network of MPAs. Products of relevance to this group include a map of hard substrate at or near the surface of the seabed, maps of geological features, maps of features of conservation importance, and confidence layers for input data to habi-tat models.
Blyth-Skyrme, V., Lindenbaum, C., Verling, E., Van Landeghem, K., Robinson, K., Mackie, A., Darbyshire, T. 2008. Broad-scale biotope mapping of potential reefs in the Irish Sea (north-west of Anglesey). JNCC Report 423.
Stewart, H., Davies, J., Long, D., Strömberg, H. and Hitchen, K. 2009. JNCC Offshore Natura Survey: Anton Dohrn Seamount and East Rockall Bank. 2009/03-JNCC Cruise Report. Report No. CR/09/113.
4.7 National programme report for the Netherlands
Jan van Dalfsen (Deltares) and Jeroen Wijsman (IMARES)
Jan van Dalfsen (Deltares) updated the group in his presentation about the status of marine habitat mapping work and related projects in the Netherlands.
11 http://www.defra.gov.uk/environment/marine/legislation/mcaa/index.htm

40 | ICES WGMHM REPORT 2010
4.7.1 Habitat mpping work
Ecological Atlas (Marine Protected areas)
In 2009 the Ecological Atlas North Sea was printed. It gives an overview of the distri-bution of the various marine species, environmental data and human activities in the North Sea the results are presented in more than 200 maps. Special attention is paid to areas with specific ecological values. The results are used to designate Marine Pro-tected Areas in the North Sea.
Netherlands continental shelf. Update of surface and subsurface geological map (Geological survey)
As new data analysis methods came available in 2009 the Netherlands will undertake an update of the surface and subsurface geological map of the Dutch continental shelf using existing seismic information.
Zeeland banks:
Experimental survey with boxcorer to assess the biological importance of the area in preparation for a bottom sediment extraction effect analysis. Based on the results of the survey different benthic communities are identified and related to environmental conditions
Use of aerial photography for monitoring of intertidal shellfish
The mapping of intertidal shellfish beds is labour-intensive and potentially danger-ous; it requires a field survey in which the circumference of mussel beds is deter-mined by walking around them with a GPS. Therefore a project was initiated to study the possibility of mapping mussel beds using aerial photography. The aerial pictures were analysed by human eye and by recognition software (E-cognition). Both meth-ods were compared in effectiveness and time efficiency.
The results show that both methods have their advantages and disadvantages. Al-though the success of human eye recognition was higher compared to software rec-ognition, many structures were wrongly defined as mussel bed structures in both methods. Because of this, ground-truthing will remain necessary to validate the analysis from aerial pictures, but can take place in a much smaller scale as only un-certainties have to be checked.
The use of aerial pictures, in combination with ground-truthing, will result in a less labour-intensive and a more detailed and repeatable monitoring program.
GEO Seas
The Netherlands are involved in the GEO Seas project
GeoHab Atlas
The Netherlands are participating in the development of the GeoHab Atlas, a product of GeoHab.
Single beam and multi beam data analysis (TU Delft M. Snellen)
Jan van Dalfsen introduced the group briefly to some newly developed or used tech-niques for seabed mapping in the Netherlands.
In the last years Mirjam Snellen from the Technical University of Delft developed a new approach in modelling single and multibeam echosounder signals for acoustic

ICES WGMHM REPORT 2010 | 41
seabed sediment classification. The technique looks promising but needs some devel-opment to become a sea going applicable tool. Further information can be obtained directly from Mirjam Snellen ([email protected]) or by contacting Jan van Dalfsen (jan.van [email protected])
4.7.2 Mapping related to coastal conservation, beach and foreshore nourish-ments
Jarcus: Since 1990 the Dutch coast is maintained following a Dynamic Maintenaince approach which used the coastline should not within the basic borders set for the reference year 1990. This basic coastline is the result of a trend analysis of the coastal development between 1980 and 1989. According to this guideline the total Dutch coast is annually being mapped for its bathymetry from the dune foot up to the -20 m depth contour. Based on the results a maintenance strategy is developed indicating stretches of the coast, beach or dunes that need to be replenished to combat coastal and foreshore erosion. Transects are run with a 250 m interval.
Surveys at the coastal zone of the Wadden Sea islands Ameland and Texel
The coastal zone of the Wadden Sea is part of the Bird and Habitat Directive areas of the Netherlands. Due to this potential impact of nourishment need to be assessed. Baseline surveys were conducted in 2009 to describe the macrobenthic community and sediment in the foreshore at Ameland and Texel. Seabed sampling is conducted using grab samplers (Van Veen Grab or boxcorer). The recovery of the macrobenthic community after the beach nourishment will be followed the following years
Annual Shellfish monitoring Dutch coastal zone
Surveys of marine shellfish communities are performed as part of annual monitoring programmes as well as part of projects. Yearly surveys on the shellfish community are performed in the Dutch coastal zone. Sampling is done quantitatively with a ben-thic sledge (fig1) and a suction dredge.
Figure b16. Benthic sledge for shellfish survey in the coastal waters.
Altogether about 800 locations are visited and sampled yearly. The organisms are sieved in situ over a 0.5 cm mesh, identified, counted and weighted. The sampling areas per location covers 15–30 m2. From the sampled the total stock and distribution of the various species is calculated
Annual inventories are made on the distribution and abundance of intertidal mussel beds in the whole Dutch Wadden Sea. The mapping is done with aerial inventory followed by detailed mapping is done by foot using GPS.
42 | ICES WGMHM REPORT 2010
Mussel seed and cockle survey:
Annual mapping of sublitoral beds is conducted in the Wadden Sea to locate and estimate the total stock of sublitoral seed mussels. The information is used to make a management plan for the fishery on seed mussels. Development of littoral mussel beds is followed over the years. Mapping of the beds is done with GPS.
Also a yearly the cockle stocks at intertidal areas in the Wadden Sea and Delta area are investigated based on ground-truthing information. From the data the total stocks are calculated.
PRODUS (2008– 2012):
In this project the carrying capacity of the benthic ecosystem of the Wadden Sea is investigated to assess the possible impacts of the installation of seed mussel collectors (SMC).
Studies on subtidal mussel beds are laborious as the object of study is situated un-derwater. As mussel beds are generally rather patchy many samples with sampling gear have to be taken to get an idea of the outward appearance of the bed. The PRO-DUS project (dp 3: subtidal nature values) studies the effects of mussel seed fisheries on the development of subtidal mussel beds. Side Scan Sonar and imaging is used to reveal bed structure, mussel distribution and mussel bed contours in research plots. It is demonstrated that the use of Side Scan Sonar images and the conclusions which can be drawn from these images. In combination with quantitative sampling, Side Scan Sonar images are useful to improve insight in bed structure, mussel distribution and the contours of subtidal mussel beds. In effect studies these are important pa-rameters that cannot be visualized with quantitative sampling alone.
Mapping of Pacific Oysters Oosterschelde
Pacific oysters have become invasive in the Dutch coastal waters. In the Ooster-schelde the species have reached high densities and they have an effect in the func-tioning of the ecosystem by providing hard substrate and filtering phytoplankton from the water column. The development of the distribution and coverage of Pacific oysters at the intertidal mudflats in the Oosterschelde are followed on an irregular basis using aerial photography and ground-truthing. The first experimental investi-gations have been started to map the sublitoral oyster banks using side scan sonar techniques (Van Overmeeren, R., J. Craeymeersch, J. van Dalfsen, F. Fey, S. van Heteren and Erik Meesters 2009. Acoustic habitat and shellfish mapping and moni-toring in shallow coastal water – Sidescan sonar experiences in The Netherlands. Estuarine, Coastal and Shelf Science 85 (2009) 437–448.
Potential habitats for various shellfish species using HABITAT model. Map-ping based on various environmental data
Using habitat modelling, habitat suitability maps are produced for predicting the potential distribution of Pacific oysters in the southwestern delta area and for various shellfish species in the coastal area of the North sea; mussel beds and seed mussels. The maps are produced based on various environmental data such as bathymetry, current velocity, salinity, substrate availability, bottom shear stress etc. These maps are developed for management purposes (sensitive areas for sand extraction) and to forecast the effect of climate change.

ICES WGMHM REPORT 2010 | 43
Wadden seagrass restoration prediction map
In 2010 Rijkswaterstaat initiated a project to restore the seagrass community in the Wadden Sea. Sea grass was an important environment in large parts of the shallow Wadden Sea, but has disappeared completely from the Dutch marine waters after a disease in 1930 seagrass. Natural recovery did not happen possible related to large environmental changes that have occurred in the following decades, such as the building of the Afsluitdijk and eutrofication in the following decades. Several at-tempts were made to reintroduce seagrass but these were unsuccessful, although slight recovery occurred naturally on one site in the Eastern Wadden Sea. Based on the HABITAT model and the ecotope description of the species a potential habitat map was produced for the Wadden Sea. This map indicates areas with high potential for successful introduction by seeding including the potential to further dispersion from these test seed sites.
4.7.3 Related projects
Monitoring Sand extraction and compensation areas Port of Rotterdam
Directly to the west of the current port of Rotterdam, an extension of the port is cre-ated in the North Sea, Maasvlakte 2. The land reclamation will measure around 265 million m³ of sand which will be extracted from the North Sea outside the -20 m depth contour. The extension, however, is situated in a Natura 2000 area. As part of the licensing procedure, compensation of the loss of nature due to the construction of Maasvlakte 2 is obligatory and comprises altogether 31,250 hectares.
The Rotterdam Harbor authorities have set up a monitoring project that comprises extensive mapping and ground-truthing activities from the delta region up to the Wadden Sea entrance at the Marsdiep both at the compensation area as well as at the sand extraction area. Measurements include multibeam, sediment, infauna (boxcorer) and epifauna and larger infauna (benthic sledge).
Ecoshape: Building with Nature
• Sand Motor project • Landscaping of extraction area
Climate change and its consequences like sea level rise and increasing storm frequen-cies will increase the demand for marine and coastal protection measurements and to maintain the coastline position. At present coastal management in the Netherlands is heavily based on sand nourishment of eroding areas on a 4 to 5 year interval.
In 2007 the Dutch government installed a Delta Committee to advice on protecting the coast and the entire low lying part of the Netherlands against the consequences of climate change. The results of the Delta Committee were presented in September 2008. A summary of the Advice can be found on http://www.deltacommissie.com/. For coastal management the committee recommended a strong increase of nourish-ments to cope with expected effects of climate change with an emphasis on using natural processes. The annual volume of extracted sand may rise from approximately 26 Mm3 since 2004 to 85 Mm3 in the future. Such large-scale extractions and nour-ishments could result in a new morphology in the coastal zone. Therefore the geo-morphological and especially the ecological implications at sea and in the coastal area, the benefits, economic requirements as well as the governance aspects associ-ated with the nourishment of such large volumes should be investigated.

44 | ICES WGMHM REPORT 2010
The Dutch program Building with Nature is an innovative research program aimed at developing new design concepts for the layout and sustainable exploitation of river, coastal and delta areas. It is coordinated by EcoShape, an initiative of Dutch dredging industry. Within the program opportunities to use natural processes are identified and integrated into the planning and designs process, balancing natural ecosystems and human intervention. These are tested in real-world projects initia-tives. The potential to the development of innovative, sustainable solutions which anticipate to the scale increase in Dutch Coastal Zone Management was briefly illus-trated on the basis two examples: the application of mega-nourishments for coastal development and ecological landscaping in sand extraction areas.
The Province of South-Holland initiated a plan for mega nourishment under the name “Sand Engine”. This project can be seen as the next step in coastal manage-ment, seeking an alternative for the present frequent nourishment of small-scale coastal stretches. The Sand Engine project consists of nourishing a large volume of sand in the order of 20 Mm3. The mega nourishment at Delfland is envisioned to lead to wider beaches and possible salt marsch development, and will instigate active dune formation in the coming decades. These are habitats under the Habitat and Bird Directive, and part of the Natura 2000 network in the Netherlands.
The Building with Natures project ‘Landscaping for ecological enhancement’ will investigate the promotion of an ecosystem approach in marine extraction projects through an ecological design and realization turning threats into sustainable oppor-tunities. Through landscaping of an extraction area according to a predefined design of its dimensions (shape and contours) the characteristics of the seabed within the extraction area will be arranged or modified, even with possible effects on the sur-rounding area. The understanding of the interactions and feedbacks between the physical and biological processes can therefore be deployed to alter the environment in such a way that ecologically valuable habitats can develop, attracting benthos, fish and birds giving opportunities for enhancing the ecological and economic potential of the post-dredging situation. Being allowed to use the large dredging site which is created for the extension of the Rotterdam harbour (Maasvlakte 2) as test site the possibilities for landscaping a dredging site will be investigated.
4.7.4 Techniques
Presently a jet ski applied with multibeam is used for mapping morphological changes in the seabed in the very shallow foreshore of the Dutch coast. This tech-nique provides a practical tool to collect data in a normally difficult to access part of the coastal system. The system with a mobilization time of only a few hours allows also a quick response to sudden events as storms.
4.8 National programme for Ireland
Fergal McGrath (INFOMAR Programme) presented an overview of the work cur-rently being undertaken in Ireland.
4.8.1 National Mapping Programme – INFOMAR
INFOMAR (Integrated Mapping for the Sustainable Development of Ireland’s Marine Resource) was launched in 2006 as a follow on the successful Irish National Seabed Survey (INSS) which ran from 1999 – 2005. The INSS mapped over 80% of Irelands offshore EEZ using MBES, sub-bottom profiler, gravimeter and opportunistic sam-pling. The current coverage map, comprising INSS and INFOAMR is presented be-low:
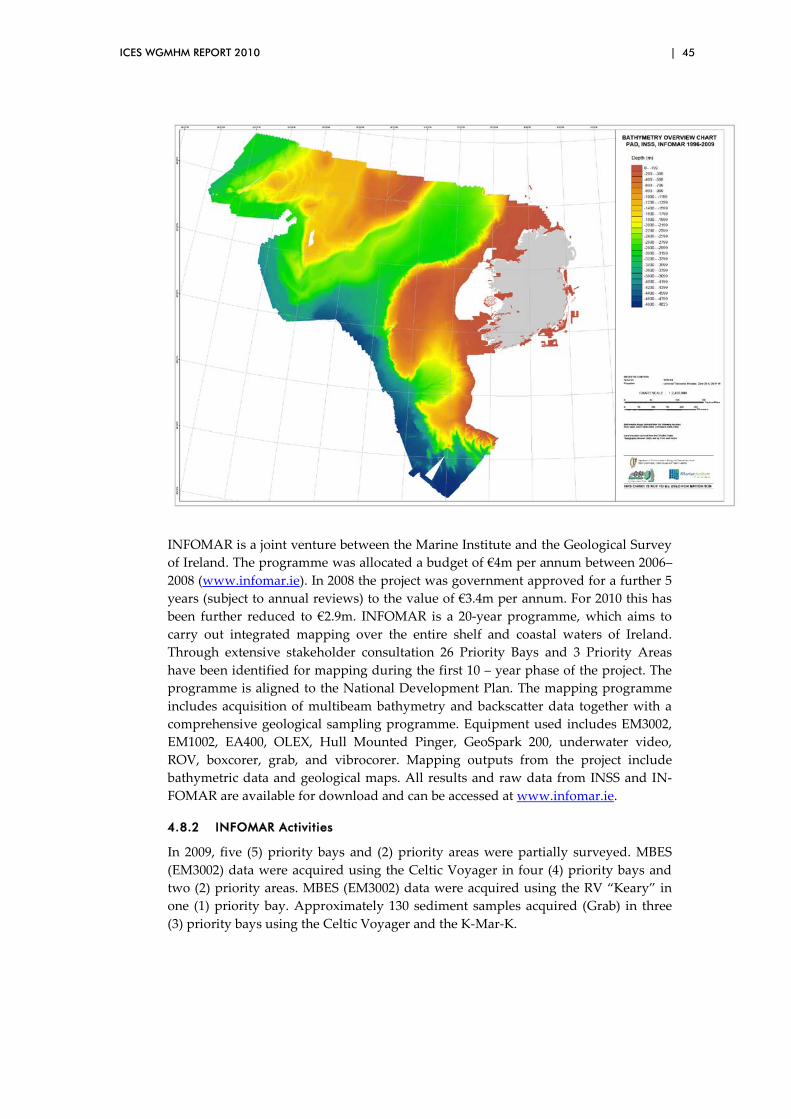
ICES WGMHM REPORT 2010 | 45
INFOMAR is a joint venture between the Marine Institute and the Geological Survey of Ireland. The programme was allocated a budget of €4m per annum between 2006–2008 (www.infomar.ie). In 2008 the project was government approved for a further 5 years (subject to annual reviews) to the value of €3.4m per annum. For 2010 this has been further reduced to €2.9m. INFOMAR is a 20-year programme, which aims to carry out integrated mapping over the entire shelf and coastal waters of Ireland. Through extensive stakeholder consultation 26 Priority Bays and 3 Priority Areas have been identified for mapping during the first 10 – year phase of the project. The programme is aligned to the National Development Plan. The mapping programme includes acquisition of multibeam bathymetry and backscatter data together with a comprehensive geological sampling programme. Equipment used includes EM3002, EM1002, EA400, OLEX, Hull Mounted Pinger, GeoSpark 200, underwater video, ROV, boxcorer, grab, and vibrocorer. Mapping outputs from the project include bathymetric data and geological maps. All results and raw data from INSS and IN-FOMAR are available for download and can be accessed at www.infomar.ie.
4.8.2 INFOMAR Activities
In 2009, five (5) priority bays and (2) priority areas were partially surveyed. MBES (EM3002) data were acquired using the Celtic Voyager in four (4) priority bays and two (2) priority areas. MBES (EM3002) data were acquired using the RV “Keary” in one (1) priority bay. Approximately 130 sediment samples acquired (Grab) in three (3) priority bays using the Celtic Voyager and the K-Mar-K.

46 | ICES WGMHM REPORT 2010
NAME ACQUISITION PLATFORM/DATES GRAB
SAMPLES
West Coast SSTI UL ROV Survey
Vibrocoring Celtic Explorer 02/2009
West Coast SSTI Oceanographic Survey
Vibrocoring Celtic Explorer 02/2009
Shannon Approaches and Estuary MBES Celtic Voyager 03/2009
Dingle Bay and Tralee Bay MBES Celtic Voyager 05/2009
Galway Bay Samples Celtic Voyager 07/2009
40
Donegal Bay and Sligo Bay Samples K-Mar-K 07/2009
89
Galway Bay / Aran islands Nephrops Survey - Aran Grounds
MBES Celtic Voyager 07/2009
Wexford, South Priority and SE Priority Areas MBES Celtic Voyager 08/2009
South-West Coast DoEHLG – NPWS
Ground-truthing / Reef SAC Map-ping
Celtic Explorer 10/2009 -
Irish Sea SSTI UCC
MBES Celtic Voyager 10/2009
Dublin Bay Approaches MBES RV Keary 11/2009
4.8.3 Habitat maps
INFOMAR are working closely with Quester Tangent Corporation in evolving their automated classification system (QTC Clams). INFOMAR objectives are to derive and characterize seabed sediment classes based on MBES backscatter image segmentation using MBES Image based baseline classification. Also envisaged is the derivation of geomorphological classes based on high resolution bathymetry using MBES time-series and linear backscatter analysis, and derivation of subsurface sediment classes from MBES andSBES. Using time-series analysis
QTC is currently working on classification of the deepwater INSS Zone 3 dataset (525,000 km2). These data are derived from EM1002. INFOMAR expects delivery of the classified Zone 3 dataset by Quarter 3, 2010. MBES classification point data are gridded and categorically interpolated using QTC Clams. Unsupervised classification is used to cluster pixels on the basis of spectral / statistics similarity, without any user-defined training classes. The clusters are then assigned labels using ground-truthing (samples/video).

ICES WGMHM REPORT 2010 | 47
Seabed classification charts (with a classification foot print is 10mx10m) have been produced for Donegal Bay, Sligo Bay, Galway Bay, Mulroy Bay, Dunmanus Bay, Bantry Bay, Waterford Area and Offshore Dublin. These maps are medium scale (from 1:50,000 to 1:200,000). An example of an INFOMAR classification charts is pre-sented below
4.8.4 Other Programme Activities
RESEARCH CALL: INFOMAR Programme objectives (Value Added Exploitation) include delivery of a programme of national and international value added research to leverage the skills, expertise and data from the INSS and INFOMAR. An open call was issued in October 2008 for research proposals or collaborative value added work. Projects were selected by a panel based on their strategic alignments and fit with INFOMAR objectives. Nine (9) proposals were awarded research funding of €252,066. This was allocated as project budgets of up to €30,000. Work undertaken was to be completed by end 2009
NEPHROPS Fisheries Surveys: INFOMAR acquired EM3002 MBES data (bathym-etry and Backscatter) on Celtic Voyager during an annual nephrops assessment sur-vey in the Aran Grounds off the west coast of Ireland. OLEX was also deployed on the survey. Provision of ground discrimination equipment for use during annual programmes will result in added value acoustic and ground-truth data being col-lected at no cost to INFOMAR, in Phase 2 Areas.
EMODNET: European Marine and Observation and Data NETwork. This project, funded by DG Mare aims to develop EU wide thematic marine maps under three different modules. It will assemble fragmented marine data into interoperable and publicly available data streams for complete maritime basins.

48 | ICES WGMHM REPORT 2010
GEO-SEAS: This project funded through the FP7 infrastructure fund, is a Pan-European Infrastructure for Management of Marine and Ocean Geological and Geo-physical Data. It will represent a network of interconnected ecological/geophysical data centres. The Geological Survey of Ireland and the Marine Institute of Ireland are participating in this (both INFOMAR joint programme managers).
NPWS: Intertidal zone / shallow water surveys for habitat mapping have been car-ried out at several SACs by the National Parks and Wildlife Service and its contrac-tors. Several commercial surveys have also been carried out around the country. These include diver and video transects in Mullet Blacksod Bay Complex (Mayo), Mulroy Bay and St Johns Point.
BIM: The Irish Fisheries Board carried out seed mussel area surveys in 2009. Three small areas off the coast of Wexford and Waterford were surveyed using Roxswath but no sampling was undertaken.
4.9 Guidelines for populating the ICES WebGIS
Following 2010 WGMHM meeting recommendations, work has been done in collabo-ration between the ICES data Centre and Ifremer to build a webGIS showing the pro-gress of habitat mapping throughout the ICES area. To date, the following has been achieved:
a ) a WMS server has been recently set up at ICES Data Centre. This server is ready to incorporate shapefiles showing the outlines of habitat maps. The shapefiles need to have two attributes, namely their unique identifier as well as an attribute describing their nature, because three different types of maps are to be hosted by the server: habitat maps (HM), modelled habitat maps (MHM) and sediment maps (SM).
b ) a GeoNetwork application is running at ICES. It is a fully featured capture environment whereby it is now possible for members to insert their meta-data. Geonetwork is using the ISO 19115 format which can be restricted to core information as described in the 2009 WGMHM report.
c ) the development of a routine has been contracted to a software developer to translate the original Mesh database from Access into XML for auto-matic capture in Geonetwork. It remains to be assessed shortly whether this routine can be made available to WGMHM members to expediate their work.
In Annex 6 a few indications are given as to how Geonetwork should be used. This will be followed soon by the production of a set of guidelines.

ICES WGMHM REPORT 2010 | 49
5 Seabed Habitat Modelling
Evaluate recent advances in marine habitat modelling techniques – ToR c
5.1 5.1 Spatial predictive modelling, with kelp (Laminaria hyperborea) and eelgrass (Zostera marina) as examples
Trine Bekkby, NIVA (the Norwegian Institute for Water Research)
The Norwegian coast is long and complex and a total mapping of species is both practically and economically difficult. Hence, modelling is a helpful tool. Also, simple mapping does not capture the dynamics of the species or provide information on the factors determining the distribution of species – a lot of What and Where, often little Why. So we wanted to learn more about What is Where and Why.
Our study site is at the Sandøy municipality (Møre and Romsdal), at the West coast of Norway. The area covers a wide range of environmental factors. We are studying the distribution and coverage of kelp (Laminaria hyperborea) and eelgrass (Zostera ma-rina) using underwater camera and GPS, analysing the relationships with GAMs and AIC model selection techniques and developing spatial predictive models in GRASP (an extention to S-PLUS). See the figure below for an illustration.
The predictors used in the analyses are modelled/observed depth, terrain (slope and curvature), light exposure (developed from aspect and slope), wave exposure (Isæus 2004) and current speed. The current speed model has a resolution of 25 m, the other model has 10 m resolution. Spatial predictive probability models were developed (see Figure c1). The kelp model was validation using both cross-validation and an inde-pendent dataset. The eelgrass model was validated using cross-validation only.

50 | ICES WGMHM REPORT 2010
Figure c1. Left: The spatial predictive model of kelp (Laminaria hyperborea) at a 10 m resolution. The darker the green, the higher the probability. Right: The spatial predictive model of eelgrass (Zostera marina) at a 10 m resolution. The darker the colour, the higher the probability.
5.2 MAREANO: classification of seabed video observations as a basis to predict biotopes and ecotopes
Pål Buhl-Mortensen, IMR, Norway
The classification of habitats and biotopes in deep water is challenging because there are only a few formally agreed habitat classes, whereas survey data show that there are many new nature types, with deep-sea environments being less homogenous than perceived. Definitions of classes need to consider biology as well as grain size and terrain. To this end, the MAREANO programme has used seabed video and pre-dictors derived from multibeam echosounder data (terrain variables and backscatter) to predict biotopes and habitats.
Video records are split into subsamples, or sequences of equal distance. This is done by aid of in-house software (VideoNavigator) at the Institute of Marine Research. Estimates of the fieldwidth are used together with hydroacoustic positioning to esti-mate areas for the video sequences. Initial analyses of datasets with different scales have been used as a background to select 200 m distance as a standard sequence dis-tance for classification of video observations.

ICES WGMHM REPORT 2010 | 51
Figure c2. Example of predicted habitat/biotope maps based on visual observations made in the field (upper map) and detailed analyses of video records which had an accuracy assessment of 85% (lower map).
Seabed video data collected by the MAREANO programme 2006–2008 have been analysed using VideoNavigator. In the field another piece of in-house software, CampodLogger is used as an event recorder to provide a rapid classification of sea-bed areas. This software allows relevant properties of the video to be recorded, for example the bottom type can be selected from 9 generic options. Using VideoNaviga-tor species abundances are recorded, and together with the standardized area of the video field width, these species observations build a species matrix with abundance per 100m2. Multivariate analysis (Detrended Correspondence Analysis - DCA) is used to group the samples into similar communities.
Physical variables are extracted from multibeam echosounder data collected by the MAREANO programme: bathymetry, backscatter, slope, aspect, terrain variability and relative position. The MBE datasets have a resolution between 5 and 25 m de-pending on depth. The terrain variables are calculated for local, medium and broad scale analyses window in ArcGIS. The outputs of the DCA (the grouped species data) are used in models together with these physical datasets. Forward selection using
52 | ICES WGMHM REPORT 2010
CCA in CANOCO was used to select the strongest explanatory variables (predictors). ArcGIS and MaxEnt are used, and result in both a ranking of the explanatory power of physical variables, as well as a full coverage probability surface for each nature type.
To improve the model, data on bottom currents and temperature will be use in fu-ture, and a group at IMR is developing a fine-scale model for current speeds within the MAREANO mapping area. One limitation of the method is that one model cannot necessary be used across different landscapes or regions (e.g. a model that is devel-oped above the shelf break cannot be applied below the shelf break). Therefore it is necessary to repeat this exercise for different areas in order to determine a set of pre-dictors for each area.
5.3 EUSeaMap
Natalie Coltman (JNCC, UK)
The EuSeaMap project is being developed by a consortium of seven teams under JNCC lead in the frame of European Commission DG/MARE EMODNET preparatory actions.
The project concerns four basins: the Baltic, North and Celtic Seas as well as the Western Mediterranean. The modelling approach is based on the collation of existing physical data to provide a consistent map across these four basins. The combination of physical layers is meant to reproduce higher EUNIS levels with highest potential ecological relevance; however no gap is allowed which means that if Eunis is not sufficient, other codes can still be proposed.
The choice of thresholds for such layers as the energy layer or the way to define depth zones is quite challenging as these notions still require quite a lot of research (see light modelling below) and are not defined the same way in the Atlantic or in the Mediterranean. For example in the latter the upper circalittoral zone is defined as a percentage of incident light while in the former it is defined by the wave base or lower limit of wave action on the seabed.
Seabed substratum segmentation is equally difficult and variable according to re-gions. Translation to Folk classes without having grain size data are a problem. While the mud to sand ration is chosen as 1:4 in the Atlantic, in the Mediterranean four classes along the mud to sand content were deemed necessary to fully represent habi-tats.
Data preparation is drawing to an end. The bathymetry layer (250m resolution) had to be prepared separately from Emodnet Hydrography lot. The sediment layer for the Atlantic area was obtained from the Geology lot in February 2010. Energy (current and waves) was obtained from various models with resolutions between 1 and 6 km. Light data layers (either Meris satellite data or Secchi disk in the Baltic) were specifi-cally prepared by the project (see 5.1).
First full size model runs are planned over summer 2010 and the project is due for delivery at the end of the year. February 2010 interim report can be viewed at:
https://webgate.ec.europa.eu/fpfis/iwt/node/759

ICES WGMHM REPORT 2010 | 53
5.4 Modelling light budget for the definition of the infralittoral zone in EUSeaMap
Jacques Populus, Ifremer, France
The lower limit of the infralittoral zone is the lower limit of Kelp Park or dense foliose algae (Atlantic), or the lower limit of Posidonia and photophilic algae (Mediterranean). As part of the EUSeaMap project, this limit has been investigated using biological data in the Western Mediterranean and in the North and Celtic seas. Light data are available at a 1km resolution from MERIS, as the mean Kpar, computed over a 5 year period (2002–2007). This is a sufficiently long period to compensate for variations due to cloud cover. The boxes in the figure below show areas for which a 250m resolution is currently available; by the end of July 2010 this resolution will be available for the whole area which will generate terrabytes of data volumes.
This 250m resolution is still a relatively coarse dataset for the steeply shelving sub-tidal area in the Mediterranean. Initially a 1% residual light value (Zeu: fraction of light reaching the seabed) was assumed, based on previous work and literature, and this 1% value used to delineate the infralittoral zone. Polygons of healthy Posidonia meadows which have not been impacted by human activities were selected. This was done in areas where the bathymetry was of a high quality. Initial work in Corsica showed a good correspondence between the lower limit of the Posidonia meadows and the 1% limit, with work in Italian waters using 20 polygons giving a geometric mean of close to 1%. However, further work carried out for meadows near Marseille showed that the lower limit of meadows did not correspond to the 1% limit, but fitted much better with a limit around 3.5%. In Brittany, the 1% limit has been compared to single beam echosounder data. Generally the agreement is good, and cases where there is a large disagreement between the single beam and the 1% limit are in areas where the bathymetry is known to be poor. This work is still in progress.
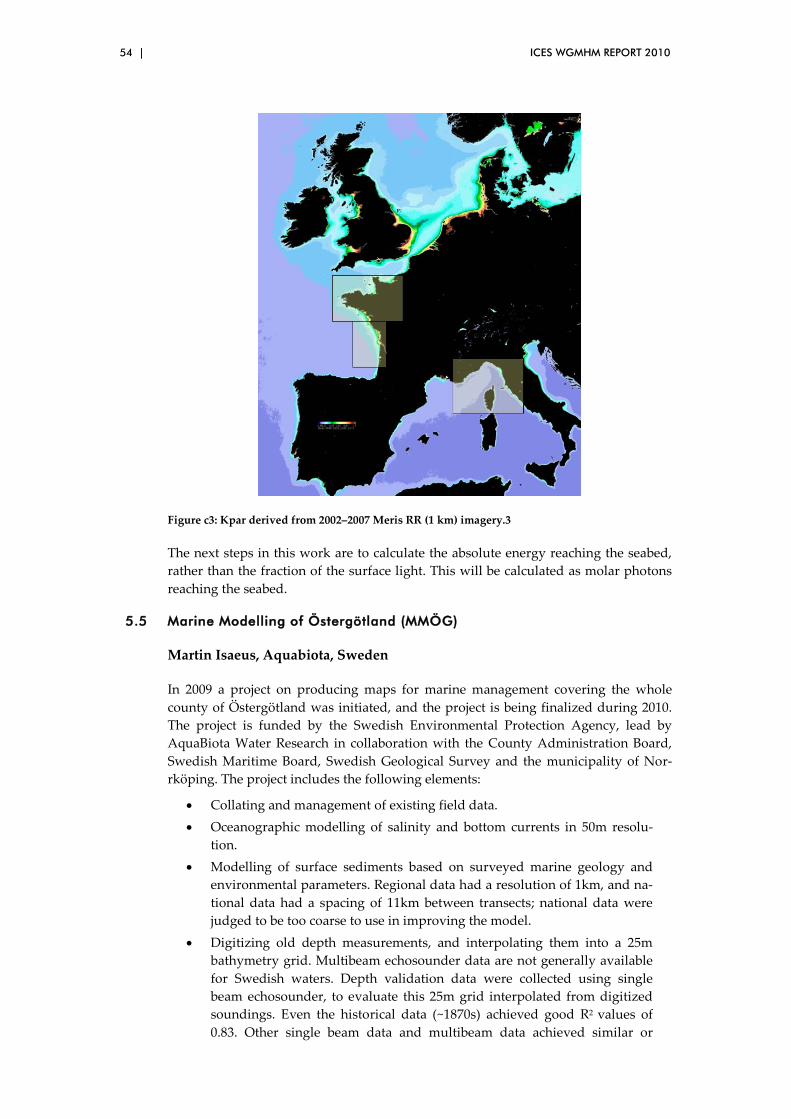
54 | ICES WGMHM REPORT 2010
Figure c3: Kpar derived from 2002–2007 Meris RR (1 km) imagery.3
The next steps in this work are to calculate the absolute energy reaching the seabed, rather than the fraction of the surface light. This will be calculated as molar photons reaching the seabed.
5.5 Marine Modelling of Östergötland (MMÖG)
Martin Isaeus, Aquabiota, Sweden
In 2009 a project on producing maps for marine management covering the whole county of Östergötland was initiated, and the project is being finalized during 2010. The project is funded by the Swedish Environmental Protection Agency, lead by AquaBiota Water Research in collaboration with the County Administration Board, Swedish Maritime Board, Swedish Geological Survey and the municipality of Nor-rköping. The project includes the following elements:
• Collating and management of existing field data. • Oceanographic modelling of salinity and bottom currents in 50m resolu-
tion. • Modelling of surface sediments based on surveyed marine geology and
environmental parameters. Regional data had a resolution of 1km, and na-tional data had a spacing of 11km between transects; national data were judged to be too coarse to use in improving the model.
• Digitizing old depth measurements, and interpolating them into a 25m bathymetry grid. Multibeam echosounder data are not generally available for Swedish waters. Depth validation data were collected using single beam echosounder, to evaluate this 25m grid interpolated from digitized soundings. Even the historical data (~1870s) achieved good R2 values of 0.83. Other single beam data and multibeam data achieved similar or

ICES WGMHM REPORT 2010 | 55
higher R2 values, but the grid derived from contours of the Swedish nauti-cal charts only received a score of 0.52.
• Complementary biological sampling for calibration and validation of models. Drop-down video was used at 1400 stations. Altogether data from 2500 drop-video stations and 150 dive transects were used in the project. Although diving transects are not independent data (points are only 1m apart), tests using independent data showed that using all points from a diving transect, rather than one per transect sector, built stronger models.
• Although MaxEnt does not require absence data, absence data were re-quired for the GAM. Absence data were generated from the drop video and added to the dive transect datasets which otherwise lack absence data.
• Modelling of distribution of phytobenthic species distributions. About 50 different probability maps were produced showing the distribution of ben-thic species and assemblages in 25m resolution. Models were assessed first internally using AUC values, then externally using an independent dataset and AUC values. Based on recommendations in the literature, a scale was used as follows:
0.9 to 1.0 excellent 0.8 to 0.9 good 0.7 to 0.8 intermediate 0.5 to 0.7 poor
• Accuracy calculations of environmental layers and species predictions. The validating was performed using independent field data. Comparison was made between MaxEnt and the GAM, using external accuracy assessment: GAM performed better for 5 out of 6 species, except for one species where MaxEnt was better, but where the results from the 2 models were close.
• In collaboration with managers at national, county and municipality level selected probability maps were converted into maps showing “key bio-topes” of special importance for management. The key biotopes displayed important areas for Blue mussel (Mytilus edulis), High vascular plants, Per-ennial red algae, Bladderwrack (Fucus vesiculosus) and Eelgrass (Zostera marina). Managers selected the most useful maps as those showing a 75% probability of at least 25% cover.
• Discussions are underway with managers about how to assign conserva-tion values to each polygon. For example, large polygons might be consid-ered to be of high value.

56 | ICES WGMHM REPORT 2010
The project MMÖG is conducted in the county of Östergötland, which is displayed in green in the figure above. A similar project is in progress in Västernorrland (red), and preparations for a project are underway in Södermanland and Stockholm (orange). There is also an application for a similar project in Skåne and Blekinge (yellow).
The report will be written during 2010 (in Swedish with English abstract), and se-lected parts will be published in scientific articles. The coming projects will also in-clude modelling of macrozoobenthic species, fish recruitment areas, and include anthropogenic effects.
5.6 Process-driven characterization and mapping of sedimentary seabed habitats within the Basque continental shelf (Bay of Biscay)
Jacques Populus (on behalf of Ibon Galparsoro)
5.6.1 Specific objectives
• Estimation of near-bottom oceanographic and sedimentological character-istics that determines species assemblages
• Correlation between oceanography and biology • Characterisation of benthic habitats • Production of process-driven habitat maps useful for coastal management
Central concept is disturbance (sediment mobilization) vs. Scope for Growth (SfG). Sediment mobilization (resuspension index) is derived from substrate layer (1440 grabs), high-resolution DTM and modelled energy. Scope for Growth was calculated from chlorophyll a and temperature (mean, min, range). Using 630 biota grabs, the top 25 species with the highest biomass and top 25 species with highest density were selected for analysis. Bray–Curtis similarity between samples was calculated and samples were grouped into 17 statistically significant classes.
ICES WGMHM REPORT 2010 | 57
The most significant environmental variables affecting community composition were the annual temperature range and the sediment remobilization, which are related to the SfG and Disturbance.
The method reduces multiple environmental variables to the major selective forces responsible for defining the life-history traits of species. The resulting habitat map shows a continuum of environments where the gradients arise naturally from the data layers
Mapping the combination of SfG and disturbance allows estimation of the potential scale of impacts of different types of human activities on seabed habitats, and their recovery capacity, e.g. very stable and low productivity habitats will have low recov-ery capacity after habitat destruction (deep-water habitats and trawling activity)
5.6.2 Post-talk Discussion
Jan Van Dalfsen: Disturbance is only represented by sediment resuspension; is this sufficient? What about contaminates etc.?
6 Protocols and standards for habitat mapping
Report on advances on survey strategy and data collection and develop guide-lines for data collection by completing the list of recommended operating guidelines (ROGs) produced by Mesh (with particular emphasis on, but not limited to grabs, sonar interferometry, PSA etc.) – ToR d.
6.1 EUNIS Developments for Natura 2000
Touria Bajjouk, Ifremer, France
Habitat classification analysis using EUNIS (Europe) is complex and difficult to use by non-specialists. Problems also exist between the EUNIS terminology and the French classification system (Cahiers d’Habitats). Other classification systems used include the US CMECS that includes geoform, water and benthic cover classification.
The primary objective for this initiative is to develop a classification system suitable for mapping and classifying benthic habitats in waters off the Brittany coast. This will be achieved employing 1) easily observable fauna, 2) simplified classification system and 3) using remote sensing and modelling.
A new scheme / proposal for mapping were presented. It included:
6.1.1 Littoral soft sediments
• Upper shore • Littoral coarse sediments • Littoral sand • Littoral mud • Littoral mixed muddy
(There are 4 classification levels proposed here.)
6.1.2 Sublittoral soft sediments
• A similar system is suggested for sublittoral soft sediment areas.

58 | ICES WGMHM REPORT 2010
6.1.3 Littoral rock
• Rock classified to according to animal, seaweed, salinity and position.
6.1.4 Sublittoral rock
Two second level classes identified.
Other
• OSPAR habitats (Zostera, maerl, littoral Mytilus, Horse mussel) • Engineering species habitats (Sabellaria, Lanice, mussel beds etc) • Invasive species habitats • Ecological habitats (rock pools, sea caves, pools on soft sediments etc)
This study has clarified a certain number of concepts and resulted in pragmatic pro-posals that address fundamental concerns. It produces correlation tables based on detailed analyses. The proposals are also consistent with mapping survey capabilities to meet most inventories and monitoring requirements. The various levels proposed enable adaptations for the site features, scale or objectives set (knowing that it is al-ways possible, if necessary, to go down to the most detailed EUNIS level).
The proposal was incorporated into the specifications for mapping of Natura 2000 coastal sites. This is done in compliance with regulations and the interest in monitor-ing changes and development. This study is now being used at the national level. Additional actions are identified. It will be necessary to more accurately characterize some habitats and to ask for the lacking habitats to be created in EUNIS. Finally, the new proposals were successfully applied to coastal sites (Rade de Brest and Trégor). Their application to the mapping of deep sites needs to be assessed.
6.1.5 Post-talk Discussion
Pal Buhl Mortensen stated that Norway also didn’t fully implement EUNIS classifica-tions and noted that some classes described at higher EUNIS levels were not stable over time i.e. included temporary communities that could change. However, Natalie Coltman stated that it was impractical to include temporary classifications and that information on these communities was lacking. NC noted that although gaps existed in the EUNIS system, it is still suitable for national purposes. Jacques Populus agreed that vegetation featuring at higher classification levels than in EUNIS was an im-provement. JP accepted this as long as links to the existing systems were maintained.
6.2 Cold water Coral (CWC) Habitat Categorisation in Habitat Mapping
Touria Bajjouk (on behalf on Brigitte Guillaumont, Ifremer)
To provide a comprehensive characterization of Cold-water Coral (CWC) habitats in the different areas covered by the EU CoralFISH project, which are representatives of several major European ecoregions, a draft classification has been prepared.
This document records the main categorizations and definitions of habitat dominated by cold water corals, including both reef-building and non-reef-building corals as mentioned in OSPAR Convention, EUNIS classification, international working groups reports (including Vulnerable Marine Ecosystems-VMEs approaches) and scientific publications.
The hierarchical habitat classifications scheme of EUNIS and Coastal and Marine Ecological Classification Standard- CMECS) has also been analysed in this context.

ICES WGMHM REPORT 2010 | 59
Taking into consideration these points, a preliminary proposal for a common catego-rization, allowing the description of the main structural CWC habitats encountered, as well as their morphological context has been drafted.
Cold water corals are found at depths ranging from 40–50 metres but also occur down to depths of 200 to 1000m metres with temperatures ranging from 4 to 14C.
Many types and species occur however the soft corals are considered the most vul-nerable. Some corals are colonial, but most, about 75%, are solitary. Black corals are generally colonial as are gorgonians. Pennatulidae can colonial or aggregate. When employing EUNIS to classify coral habitats, problems occur as EUNIS defines first level classes using the substratum. This is not easy to apply in the deep sea. Class definitions derived from CMECS provides better descriptions.
CWC habitats need to be analysed and to achieve this, new classification categories need to be created:
Cold water coral habitats are:
• CWC reefs • Hard bottom(Scleractinians) • Exposed rock (Stylasterids) • Coral gardens
Classification by geoform is also necessary and can be used in spatial modelling (bathymetry and slope data are required).
Post-talk Discussion
Pal Buhl Mortensen noted that descriptions of communities on rocky outcrops in Norwegian and Faroese waters exist. Natalie Coltman described 2 papers on deepwa-ter community classifications. However, EUNIS requires further development and updating in this area. Input from scientists such as BG and PBM is urgently required.
PBM then noted that corals form part of the general community in deep waters. OSPAR community descriptions only discuss communities where corals are the main community component. Coral gardens are described using the densities of the most common animals / corals observed. It is also easy to describe a community as fragile or vulnerable if using CWC’s as main descriptor. NC noted that the OSPAR team is aware of all these problems and urgently need data and input from working scien-tists such as PBM and BG. However, PBM stated that the OSPAR group should be able to gather data from published work.
6.3 Progress in positioning in-situ sampling
Alain Norro (MUMM, Belgium)
6.3.1 Objective
1 ) Calibration of MBES Backscatter (BS) signal 2 ) Validation of diver georeferencing
6.3.2 Method
Survey area: Areas within Belgium’s EEZ.

60 | ICES WGMHM REPORT 2010
1 ) Diver survey on areas of distinct BS signatures. Dives on site measured sediment depth and undertook particle size analysis. Depth 10–50 m (reached on air or mixed gas diving for deeper sites).
2 ) Dive deployed with both GAP Xsea USBL and GPS attached to a buoy and towed by submerged diver. Video georeferencing was undertaken by syn-chronizing dive computers, GPS and video time stamp. Closed circuit re-breather systems were used to reduce bubble generated acoustic noise (USBL system.
The GPS and USBL were mapped together in GIS. A 10 m buffer was made round the GPS track and it can be seen that most of the USBL positions are within 10 m of the GPS positions. This validates the GPS buoy method. Further statistical analysis will follow.
Figure d1. Difference between GPS position of the towed by diver buoy (black dot) and USBL positions (triangle).
6.3.3 Results/Conclusions
1 ) High level of agreement with in situ observations confirmed BS signatures for ground types (BS class for coarse sediments and bioturbated muddy sands.
2 ) Plotted GPS buoy track was very smooth and showed excellent agreement with USBL. In fact, USBL showed high levels of noise/scatter.
Alain Norro: Discusses the recent analysis of late 19C ground-truthing and its value in providing a reference point.
6.3.4 Post-talk Discussion
Question from Fergal Mac Grath: Was USBL fully surveyed in on vessel? Alain Norro: Location of RTK-GPS on the vessel in relation to USBL MRU specified how-ever professional surveying was considered unnecessary. Question: Any thermocline issues? AN: Not an issue locally well mixed water column: checked with CTD casts.
FMG: Have you compared BS between Kongsberg 1000 and 3000? AN: No, but will with the recent appointment of a new member of staff. FMG: equidistant poor for BS and manual settings can optimize BS.

ICES WGMHM REPORT 2010 | 61
Pal Buhl Mortensen: Speed of dune movement monitored? AN: Not from animated MBES. Jan Van Dalfsen: Suggests 50 m/yr on Dutch coast. AN: All dues are in dy-namic equilibrium and are highly mobile, often exposing unknown archaeological sites annually.
7 Interpretation of survey data
Report on progress in post-processing and interpreting data – ToR e.
7.1 Use of Unsupervised Classification and Optimal Allocation Analysis in Ground-Truthing Survey Design
James Strong (AFBI, UK)
Comparing the small sample volume of grabs in relation to the expansive area of seabed that can be sampled acoustically means that ground-truthing methods are time-consuming, poorly replicated, and expensive.
It is therefore crucial that ground-truthing of large acoustic datasets be undertaken in the most effective and economically viable way possible, i.e. to maximize map confi-dence and yet minimize the time and effort.
Ground-truthing strategies have rarely been addressed adequately or even specified within published benthic-mapping literature. Most strategies rely on expert judge-ment, but in some studies, the ground-truthing strategy uses identified acoustic ground-types with sampling being related to ground-type area.
When considering a standard acoustic remote sensing and ground-truthing survey, the resulting areas of identified acoustic ground-types are easy to calculate within GIS (geographic information system). In the absence of pilot studies or historical habitat data for a study site, measures of ground-type variance are problematic. It seems appropriate acoustic data provide information relating to ground-type hetero-geneity and hence facilitate optimally allocated sampling.
By integrating ground-type areas and variances, a statistical method such as opti-mum allocation analysis (OAA) can recommend how ground-truthing should be proportioned. OAA may be defined as a procedure used in stratified sampling to allocate numbers of sample units to different strata either to maximize precision at a fixed cost or to minimize cost for a selected level of precision; precision in this sense meaning both closeness to a true value and repeatability over time.
7.1.1 Objective
Suggest methods for use of optimal allocation statistics in stratifying ground-truthing effort.
7.1.2 Method
• Benthic Terrain Modeller was used to classify data into ‘zones’ using rule-based modelling.
• Broad-scale potential ground-types identified from bathymetry, backscat-ter and slope angle information: useful in identifying EUNIS levels 3 and 4 habitat.

62 | ICES WGMHM REPORT 2010
• Ground-type summary statistics were calculated for input layers (e.g. slope angle, rugosity, backscatter), which may relate to habitat heterogene-ity.
• Level of precision, as denoted through the coefficient of variation (CoV), set by user e.g. 5% = 95% precision.
• Ground-type summary statistics for each variable was entered into Micro-soft Excel macro.
7.1.3 Results
• OAA recommends number of samples in m2 • OAA does not recommend how samples should be distributed within a
ground-type. • OAA does not explain what sampling technique to use. • OAA objectively directs GT for maximum effect. • It is also an option to input the maximum possible area to be ground-
truthed (e.g. if sampling time is constrained) to obtain a CoV.
Note the differences between the standardized input variables; between sites the ‘influence’ of these variables differs, but in both cases backscatter generally shows less variance than slope angle or aspect and therefore lessens the requirement for ground-truthing. Zone 3 has one of the smallest areas.
Actual CV for video is approximately 5%. However, PSA parameters were near 12.9%; a product of not collecting the required number of grabs.
7.1.4 Conclusions
• Ground-type maps, through an unsupervised classification of data, can be used to drive ground-truthing survey design through the use of Optimal Allocation Analysis (OAA)
• OAA relies upon a set coefficient of variation and area to derive recom-mended ground-truthing sample areas for each ground-type
• How such ground-truthing is undertaken (distribution in ground-type patches and type of sampling equipment) depends on expert judgment
• Although still work in progress, OAA objectively directs GT for maximum effect
• OAA provides confidence estimates
7.1.5 Post-talk Discussion
Pal Buhl Mortensen noted that if he had a certain number of grab samples to collect in an area, would OAA indicate the number that is actually needed? JS replied that the macro would do this with precision around 95%. A paper has been published and is available (as is the OAA macro) on the WGMHM Sharepoint. PBM also enquired as to the duration of each video run? JS states that still images are extracted randomly within 30-second sections. Alain Norro stated that it is important to measure vari-ables along a gradient because variables are changing however, positioning and sam-pling accuracy is important. JS noted that OAA doesn’t indicate where or how to sample, but does highlight areas with high variance, within strata, for more sam-pling. Natalie Coltman asked whether it is possible to use different variables other than those used by JS in his presentation. – JS: yes, but the variables used must be meaningful for the ground types/habitats in the work area. PBM asked whether maps
ICES WGMHM REPORT 2010 | 63
of variance could be plotted from within each class identified to help direct sampling. JS considered this a useful idea.
7.2 Identification of Deep sea Flora on Video Imagery
Cyril Carré (Ifremer, France)
• SCAMPI-towed body with adjustable diving plane capable of taking pho-tographs.
• ROV Victor 6000 equipped with video and still photography. Positioning available using a BUC transponder system.
7.2.1 Camera positioning
• Vertical – used to id species, habitat and fascias. Coverage can be calculated by imposing a grid on the image or by placing points randomly across the image. Picture mosaics can also be created using a GIS.
• Oblique – easier to identify species also better at habitat identification. • Rotating – camera mounted on a pan and tilt head.
7.2.2 Submarine positioning and picture georeferencing: GPS and track linked with video with time code. GIS visualization logging date, time, Lat, Long and depth
Further explanation was provided for:
• Video processing, especially mosaicing • Density calculations • Observer data sheets • Data storage within modified Adelie*
*Taxa and associated information held on tables – the Adelie software package, avail-able from Ifremer.
7.2.3 Discussion
PBM said that MAREANO also has a bespoke operator logging system, Video Navi-gator, that it is available for free. Surveying questions still exist however, for example, how many video tows are required in order to map an area and how far apart must each tow be? Also, the definition of image quality is problematic. PBM has circulated a document about objectively assessing footage quality – this has been stimulated by poor footage collection by the oil and gas industry.
8 Accuracy and confidence in habitat maps - ToR f
Report on case studies and methodology for the assessment of accuracy and confidence in sediment maps and modelled habitat maps (ToR f)
8.1 Assessing Sediment Confidence
Natalie Coltman (JNCC, UK)
This ToR focused on the issue of confidence assessment in sediment maps and mod-elled habitat maps. Natalie Coltman gave a case study presentation on assessing the confidence of the sediment maps.

64 | ICES WGMHM REPORT 2010
Assessing confidence in sediment maps is essential to determine spatial confidence of maps produced by models, and potentially enables direct comparison to habitat maps. Broadscale models of the type produced by EUSeaMap are heavily reliant on sediment data. It is also important to remember that in some areas, where the sedi-ment data behind the model might be more recent than the survey data, we may have higher confidence in the outputs of habitat models than of some types of survey map. Previous broadscale marine habitat predictions in the UK (e.g. UKSeaMap, MESH) have used point sample data to ‘validate’ the classes produced. This approach is un-satisfactory, because of the patchy data coverage and mismatch in scale between the point data and the modelled features.
The UK case study in this instance was assessing the confidence of a sediment map prepared for created for UKSeaMap 2010, covering all of the UK marine area. This map has been compiled from various data sources including updated BGS products (DigSBS 250 version 2), recently compiled hard substrate data (at or near the seabed to 30cm underneath sediment surface), deep-water data (NOC), and WFD typology for the inshore areas. This comprised a coarse scale sediment map presenting a 1nm coastal grid and a 0.1nm transitional waters grid. There remains a large gap between where BGS
Confidence is defined as a statement about how reliable a map user thinks the map is, given its purpose12
• Accuracy measures
. This is not a mathematical definition like accuracy or uncertainty, but is a judgement made by the map-user and may therefore vary for any map. How-ever, this judgment can be supported by evidence from:
• Supporting maps showing underlying evidence used to interpret map • Evaluation of all contributing data • Independent validation • Expert opinion • User support
Following this definition, the MESH project developed a tool to assess the confidence in habitat maps, at www.searchmesh.net/confidence. To date, this method has been used only to assess the confidence of surveyed habitat or substrate maps, for example where remote sensing data and ground-truthing data have been interpreted to pro-duce mapped seabed types. The tool assesses the quality of the remote sensing, ground-truthing, and overall map interpretation.
The UKSeaMap 2010 project adapted this MESH confidence assessment method to produce confidence maps. In selecting this method, consideration was given to the absence of median grain size analysis and no previous holistic assessments for the sediment maps.
The MESH assessment method required metadata to indicate how the sediment map was made. The output of this method is a percentage score for different subsections of the map – for example areas with enhanced acoustic data. In addition, this method was augmented by modifiers suggested by BGS: sample density, depth areas and heterogeneity of seabed. Sample density resulted in a surface showing density of points per grid cell. Three broad depth zones were suggested to reflect stability of deep-sea environments. The weightings were: (0) for shelf areas from 35m to 500m, (-
12 MESH definition
ICES WGMHM REPORT 2010 | 65
1) for shallow areas <35m, (+1) for deep areas >500m. These were suggested as a modification weighting to the sample density modifier. The heterogeneity of seabed was based on the number of broad sediment (EUNIS) classes (recorded in sample data) within a specified search area, in this case ~300km2.
The validity of these modifiers was discussed. For example, in the deep-sea topogra-phy might be a more relevant proxy to identify the deep and typically more stable abyssal plains. The integration of these modifiers with the MESH assessment method has not yet been carried out. This work will be taken forward at a European scale through the EMODNET geology contract and the EUSeaMap project.
8.2 Considerations on assessment of a global modelled map
Jacques Populus (Ifremer, France)
Jacques Populus gave a presentation on potential methodologies for assessing the confidence of a global modelled map for EUSeaMap. The underlying principle being that every habitat map should be associated with its own confidence assessment map.
Three methods of confidence assessment of a modelled EUNIS habitat map were proposed for discussion.
1. Qualitative assessment of broad-scale sediment and depth data layers that form the basis of the model. Each map would be assessed individually using methodologies based on the MESH confidence assessment tool. Substrate maps and habitat maps are produced in similar ways and the method implemented in MESH for habitat maps can easily be adapted to sediment maps.
Bathymetry is the only variable common to depth zones that could bear a criterion of quality. Depth maps would be assessed on (but not limited to) resolution, soundings, interpolation methods and age of survey. It was accepted that this method would generate a ‘blocky’ confidence assessment map with clearly defined limits. The pri-mary advantage of this method is its fully spatial aspect, which would lead to a reli-ability map at the same scale as the modelled map where the assessment is provided for each pixel, in line with EUSeaMap requirements. It would also enable the project to give feedback on physical layers to their providers, a condition of future improved deliveries.
2. Fuzzy logic could be applied to map thresholds (e.g. depths threshold, biological benthic threshold). This would introduce a transition across defined limits. The boundaries (e.g. depth zones, energy thresholds) would be presented in a transitional way. The final habitat map product will have hard, clearly defined boundaries. A benefit of this approach was proposed as being that maps could be redesigned to facilitate different requirements at CZM level.
3. The other potential way is a statistical one based on local checks carried out against external data from recent habitat maps. This comprises external validation of mod-elled maps using data from surveys representative of the geographical area covered by the habitat map. Data from recent local habitat maps could be used to make a con-tingency matrix, i.e. a matrix with modelled data in one dimension and surveyed data in the other. Maps could be generated for these sample areas to validate the model, with results presented as a score / percentage / contingency matrix. The first check method is based on ground-truth data, more precisely on EUNIS class contents expressed at the locations of the seabed samples used to interpret the local maps. The reason for choosing these particular locations is because it is where the polygons of

66 | ICES WGMHM REPORT 2010
the interpreted maps are most likely to be as close to reality as possible. At these loca-tions, the EUNIS class could be summarized to the same level as that provided by the model (basically level 3) and a statistical comparison carried out using a point to polygon spatial link.
The second check method is a comparison applying to the full outlines of the sur-veyed maps. In this case a spatial intersection between modelled polygons and inter-preted polygons would provide the material to build the contingency matrix. Similarly the EUNIS levels of the two sources would need to be made compatible beforehand.
However for both these methods it should be kept in mind that polygons from inter-preted maps are in essence different from those of modelled maps, although both types are expressed in EUNIS. Data from surveys are a strict expression of EUNIS classes designed according to their contents in sediment and benthos, most of the time without knowledge of the prevailing physical parameters. On the contrary data from modelled maps are also Eunis types but they are defined as an assemblage of physical features. These two expressions of the same reality may differ for a number of reasons. Such comparisons are attempts to reconcile two different views of reality and are likely to differ to some - unpredictable - extent. The main contributor to habi-tat maps (the sediment layer) is likely to produce the main discrepancy between the two sources. The global sediment layer is mostly “historical”, a result of the compila-tion of maps made without remote sensing techniques where polygons were drafted based on mere samples contents.
It was suggested that field validation would be the preferable method, however, it was accepted that spatial distribution of the control data would present a challenge as it would be necessary to gather a number of recent habitat maps along with the locations of their associate samples. These maps would need to fully describe the variety of habitats present.
Other challenges related to the use and confidence assessment of source data would arise from differences in modelling methodologies, use of data from older surveys, lack of validation data from recent surveys, the original intended use/presentation of the source data.
9 Habitat maps for management
Review practise about the use of habitat maps in different countries for vari-ous purposes – ToR g
9.1 Swedish Offshore Bank Survey
Martin Isaeus (Aquabiota, SE)
Martin Isaeus presented the SOBS project to the group. The SOBS is a project re-quested by the Swedish government in order to provide information to comply with the Habitat Directive as well as to manage the development of offshore wind energy. The aim was to collect new data on morphology and biology (flora and fauna com-ponents).
The project fieldwork was conducted in two phases, Phase I (2003 -2004) and Phase II (2008–2009). In total 40 banks were described along the Swedish coast in various en-vironments ranging from marine to almost freshwater conditions. Banks were se-

ICES WGMHM REPORT 2010 | 67
lected based on digital Terrain Modelling, Habitat Directive definitions and expert opinion. Most of the banks consisted of sediment originating in moraine deposits.
Methods deployed included video transects of > 1 km, scuba diving, ROV, grab and dredge sampling. Fish surveys were conducted using acoustics and gillnets. Birds surveys were conducted from aerial transect surveys using standard methods.
In the modelling phase of the project the information was analysed to derive maps visualizing the distribution of species. These enabled to select areas of importance to different species. Several examples of distribution maps were presented to the group.
The results were evaluated in which several indicators were used, such as diversity, rarity, density, vulnerability, ecosystem importance. Based on this information rele-vant numerical criteria were developed for benthic biology, fish and birds. A weight-ing procedure was carried out on these criteria which resulted in scores ranging from 1–3 for the different groups.
9.2 Recent Developments in Habitat Mapping in Scottish Waters
Mike Robertson (MS-S Marine Laboratory, UK)
The Scottish Government has recently identified large areas around the Scottish coastline which are considered ideal for the generation of electricity by wind, wave or tidal generators. To help and encourage inward investment from interested compa-nies, a programme of targeted seabed mapping was implemented in 2009 which would provide broad scale maps of local bathymetric conditions and information on sediment types and their distributions.
To this end, a Reson 7125 dual frequency multibeam echosounder was purchased and installed on-board FRV “Scotia” and, after a series of short trial and training cruises, a survey of the seabed around the Orkney Isles and throughout the Pentland Firth ar-eas was completed in July / August 2009. Acoustic data were acquired and prelimi-nary processing was carried out on board the research vessel while ground-truthing using grab, digital still camera and TV camera tows were also completed from throughout the survey area. On completion of this cruise, the bathymetric data were cleaned and displayed using CARIS Hips and Sips while the Fledermaus graphics package was used to visualize the data as 3D seabed maps. These maps and associ-ated processed data were made generally available to power companies and consult-ant companies while most of the video and TV images can be down loaded from the Scottish Government website and displayed via Google Earth. See URL below.
During the 2009 cruise, we also logged backscatter data from the echosounder (snip-pets data). These have been processed using QTC Multiview while QTC Clams will also be applied in the near future. Maps of sediment cluster have been produced and, although not giving complete coverage of the work area, clearly show where areas of bedrock, boulders, stones and soft sediments are located. Further work on the back-scatter data will be carried out using the Fledermaus geocoder tools and thease maps will also be published on the Scottish Government website.
Plans for 2010 include a 21 day survey to the west of the Outer Hebrides, throughout the Minches and in the general areas around the inner Hebridean islands of Tiree and Colonsay. Further refinement of the 2009 data and post-processing of all the 2010 data will also be completed.
http://www.scotland.gov.uk/About/Directorates/Wealthier-and-Fairer/marine-scotland
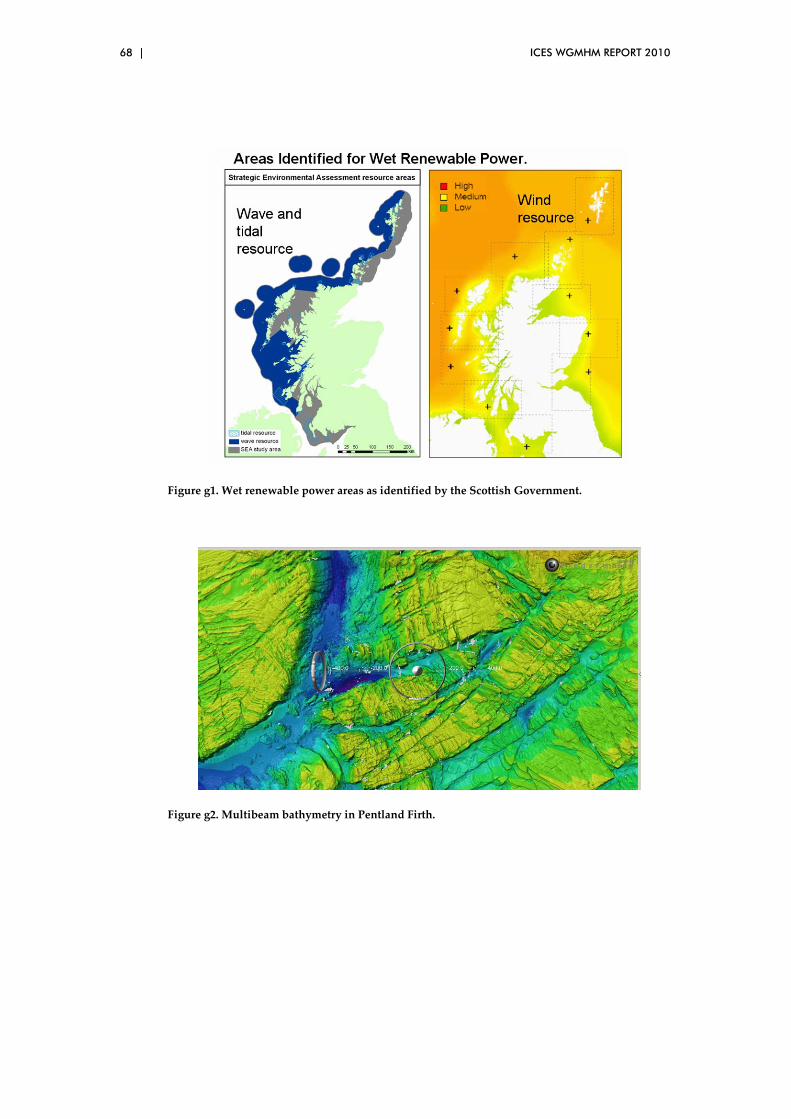
68 | ICES WGMHM REPORT 2010
Figure g1. Wet renewable power areas as identified by the Scottish Government.
Figure g2. Multibeam bathymetry in Pentland Firth.
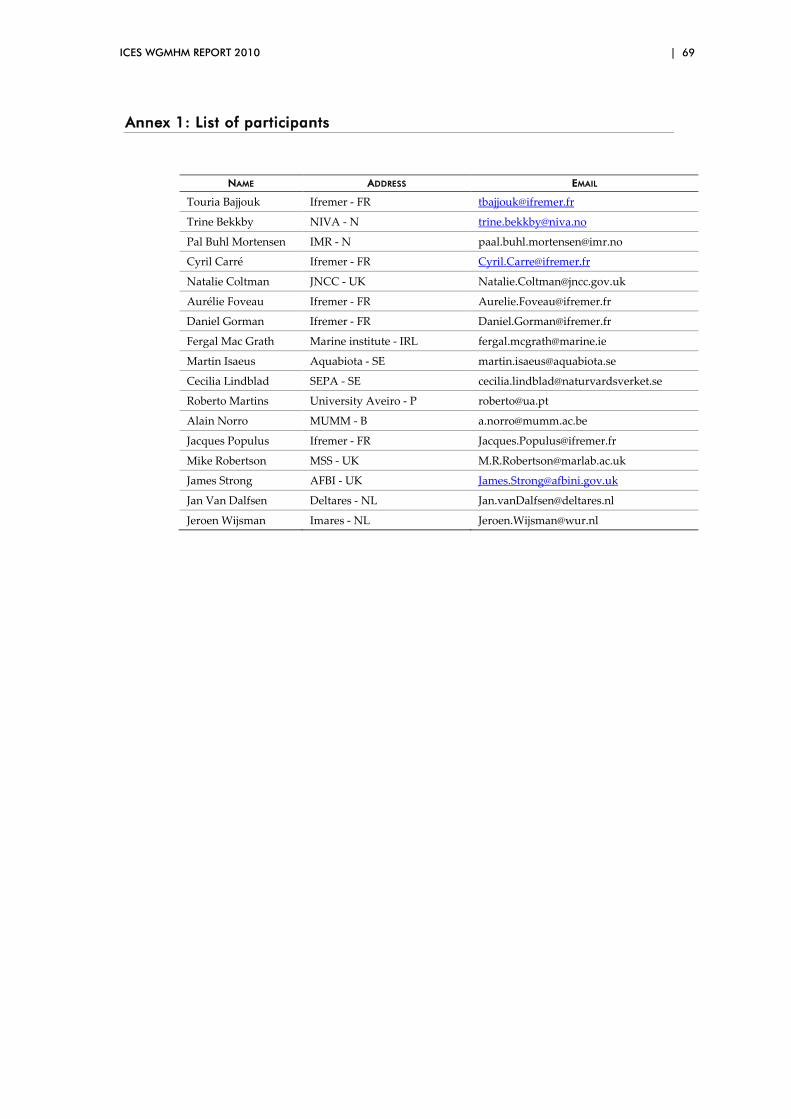
ICES WGMHM REPORT 2010 | 69
Annex 1: List of participants
NAME ADDRESS EMAIL
Touria Bajjouk Ifremer - FR [email protected]
Trine Bekkby NIVA - N [email protected]
Pal Buhl Mortensen IMR - N [email protected]
Cyril Carré Ifremer - FR [email protected]
Natalie Coltman JNCC - UK [email protected]
Aurélie Foveau Ifremer - FR [email protected]
Daniel Gorman Ifremer - FR [email protected]
Fergal Mac Grath Marine institute - IRL [email protected]
Martin Isaeus Aquabiota - SE [email protected]
Cecilia Lindblad SEPA - SE [email protected]
Roberto Martins University Aveiro - P [email protected]
Alain Norro MUMM - B [email protected]
Jacques Populus Ifremer - FR [email protected]
Mike Robertson MSS - UK [email protected]
James Strong AFBI - UK [email protected]
Jan Van Dalfsen Deltares - NL [email protected]
Jeroen Wijsman Imares - NL [email protected]

70 | ICES WGMHM REPORT 2010
Annex 2: WGMHM terms of reference for the 2010 meeting
The Working Group on Marine Habitat Mapping [WGMHM] (Chair: Jacques Popu-lus, France) will meet in Calvi, France (at the Stareso Marine Station) from 20 to 24 April 2010 to:
International programmes
a ) Report on progress in international mapping programmes (including OSPAR and HELCOM Conventions, EuSeaMap, EC and EEA initiatives, CHARM, Prehab, Sesma and Mesh-Atlantic projects)
National programmes (National Status Reports)
b ) Present and review national habitat mapping activity during the preceding year, providing National Status Report updates according to the standard spreadsheet reporting format and in geographic display in the ICES webGIS and focusing on particular issues of relevance to the rest of the meeting
Modelling
c ) Evaluate recent advances in marine habitat modelling techniques
Protocols and standards for habitat mapping
d ) Report on advances on survey strategy and data collection and develop guidelines for data collection by completing the list of recommended oper-ating guidelines (ROGs) produced by Mesh (with particular emphasis on, but not limited to grabs, sonar interferometry, PSA etc.)
e ) Report on progress in post-processing and interpreting data (e.g. Sonar-scope)
Accuracy and confidence f ) Review methods for accuracy and confidence assessment on both mod-
elled maps and interpreted maps and initiate production of written guide-lines.
Uses of habitat mapping for management
g ) Review practise about the use of habitat maps in different countries for various purposes.
WGMHM will report by end of May 2010 for the attention of SCICOM as well as ACOM.

ICES WGMHM REPORT 2010 | 71
Annex 3: WGMHM 2010 agenda
Progress in international mapping programmes - ToR a
- MSFD, Mesh-Atlantic, HELCOM Convention, OSPAR Convention, EMODNET, PREHAB, CHARM 3, CORALFISH, MESMA
National programmes (National Status Reports) - ToR b
- National status report : 9 countries NSR presented by national delegates
- Guidelines for populating the ICES WebGIS
Seabed Habitat Modelling - ToR c
- Modelling kelp in Norway
- Prediction of biotopes and key habitats
- EuSeaMap
- Modelling light budget for the definition of the infralittoral zone in EuSeaMap
- A large-scale example on marine modelling for coastal zone management in Östergötland, Sweden
- Process-driver characterization and mapping of sedimentary seabed habitats within the Basque continental shelf (Bay of Biscay)
Protocols and standards for habitat mapping – ToR d
- Eunis developments for Natura 2000
- Deep habitat classification
- Progress in positioning in-situ sampling
Interpretation of survey data - ToR e
- In situ optimal allocation analysis
- Identification of deep-sea flora on video imagery
Accuracy and confidence in habitat maps – ToR f
- How to assess confidence in sediment maps
- Confidence assessment for modelled habitat maps (JP)
Habitat maps for management – ToR g
- Developments in habitat mapping in Scottish waters (MR)
- Survey, mapping, and evaluation of 40 offshore banks along the Swedish coast (MI).

72 | ICES WGMHM REPORT 2010
Annex 4: WGMHM 2011 terms of reference
It was decided by WGMHM members that the list of ToRs as it stands is best to ac-commodate any contributions from members. It is therefore decided to leave this list in its present form. The ToRs are reproduced below:
The Working Group on Marine Habitat Mapping (WGMHM), chaired by Jacques Populus, France, will meet in Calvi, France (at the Stareso Marine Station) from 10–13 May 2011 to:
International programmes – ToR a
a) Report on progress in international mapping programmes (including OSPAR and HELCOM Conventions, EuSeaMap, EC and EEA initiatives, CHARM, Prehab, Sesma and Mesh-Atlantic projects)
National programmes (National Status Reports) – ToR b
b) Present and review national habitat mapping activity during the preceding year, providing National Status Report updates according to the standard spreadsheet reporting format and in geographic display in the ICES webGIS and focusing on particular issues of relevance to the rest of the meeting
Modelling – ToR c
c) Evaluate recent advances in marine habitat modelling techniques
Protocols and standards for habitat mapping – ToR d
d) Report on advances on survey strategy and data collection and develop guidelines for data collection by completing the list of recommended operat-ing guidelines (ROGs) produced by Mesh (with particular emphasis on, but not limited to grabs, sonar interferometry, PSA etc.)
Data interpretation – ToR e
e) Report on progress in post-processing and interpreting data (e.g. Sonar-scope)
Accuracy and confidence – ToR f
f) Review methods for accuracy and confidence assessment on both modelled maps and interpreted maps and initiate production of written guidelines.
Uses of habitat mapping for management – ToR g
g) Review practise about the use of habitat maps in different countries for various purposes.
WGMHM will report by 15 June 2011 (via SSGSUE) for the attention of SCICOM and ACOM.
SUPPORTING INFORMATION
Priority This Group coordinates the review of habitat classification and mapping activities in the ICES area and promotes standardization of approaches and techniques to the extent possible.
Scientific justification The working group provides an important forum to discuss international and national seabed mapping programmes, along with their relevance to Regional conventions and European directives. Designing appropriate

ICES WGMHM REPORT 2010 | 73
optimal strategies and harmonising them throughout the ICES area is all the more important that policies now currently extend from the coastal zone to deeper waters.
The compilation of National status report is important to give visibility to all stakeholders in terms of the actual mapping coverage of the ICES area. Efforts should be continued to shortly provide users with a geographic view of this coverage at a glance in the ICES webGIS. From there adequate links could be provided to actual data owners.
The trend is with running multibeam surveys and ground truthing them with observations such as video techniques. Running video surveys and post-processing the data is making great steps and common workshops are needed. There are also many issues with processing backscatter imagery from multibeam techniques. These are topics the expert group would need to address more thoroughly.
In parallel, modelling based on limited field data and an improved description of the links between abiotic factors and biota is to take a larger role in future. These methods are acceptable provided they are duly quality assessed and the confidence of the resultant maps made available to the users.
Participants Representatives from Member Countries with experience in habitat mapping and classification. Participation of the Baltic countries and from USA and Canada is particularly sought. The participation of members of BEWG, WGEXT, WGECO, WGDEC, WGFAST and WGICZM would be helpful in developing appropriate linkages to other areas of ICES work.
Linkage to advisory committee
ACOM
Linkages to other committees or groups
BEWG, WGEXT, WGECO, WGDEC, WGFAST and SGEH, WGICZM
Linkages to other organizations
OSPAR, HELCOM, EEA

74 | ICES WGMHM REPORT 2010
Annex 5: Recommendations from WGMHM 2010
RECOMMENDATION FOR FOLLOW UP BY:
1. The National Status Reports is made more formally, i.e. by following a template to be prepared by the group.
WGMHM
2. The webGIS is progressed over the next few months to provide the group’s national delegates with a means to upload the out-lines of their national habitat maps into the ICES database. This will provide a geographic view of the status of habitat maps coverage throughout ICES. This will come along with a metada-tabase and the Geonetwork open access tool for metadata capture by each national delegate.
WGMHM ICES Data Centre
3. Based on recent progress on accuracy and confidence for mod-elled maps it is planned that the group will review a paper on that topic to be drafted under the lead of WGMHM Chair, with a view to a final review at WGMHM 2011 and possible publication for ASC 2011.
WGMHM
4. It is not only necessary to have reliable habitat maps, there is a need to study their sensitivity (related to MSFD GES 1). The group recommends that the soon-to-be formed WG on Marine Spatial Planning work with mapping pressures on habitats (MSFD GES 6). A link with EEA Eionet is also suggested).
WGMHM WGMSP
5. There is a growing need to make habitat maps available for spatial planning. There should be an effort by WGMHM to come up with informed examples on how habitat maps are being used (e.g. probability maps). It is suggested to liaise with three experts groups on this topic: the ICZM, WGEXT and Marine Spatial Planning groups.
WGICZM WGMSP WGEXT
6. Initiate mutual information with BEWG on the topic of habitat suitability modelling and meet at ASC 2010 in Nantes to discuss future plans.
BEWG

ICES WGMHM REPORT 2010 | 75
Annex 6: Geonetwork for metadata capture
The Metadata catalogue
The GeoNetwork application is a Free and Open source catalogue application to manage spatially referenced resources through the web.
Figure 4: Home page
There are many different ways to search the catalogue for maps.
• Simple search: allows users to query the data with one or two parameters (free text search, geographic search)
• Advanced search: allows multi-parameter search
(the search categories are arranged in the same way as on the simple search page, with a tick box next to each option. Users can select options from more than one cate-gory.)

76 | ICES WGMHM REPORT 2010
• Searching by categories: a list of categories is provided to the user to iden-tify data at a more generic level.
Analysing search results

ICES WGMHM REPORT 2010 | 77
Figure 5: Search results
The Metadata section describes the dataset and could contain links to other websites, to map custodians …
There are small and large overviews of the map used to properly evaluate usefulness of the data, especially if the interactive map is not available (Simply click on the small image to enlarge it).
Adding new records or editing metadata into the GeoNetwork catalogue
You must be registered as an Editor in the working group.
Figure 6: Administration panel
The system is based on the ISO 19115:2003 geographic metadata standard and on the ISO 19139:2007 schemas. GeoNetwork provides a set of simplified metadata tem-plates based on the ISO 19115:2003. You can switch to another view at any time while editing.
The title
Keywords
An abstract

78 | ICES WGMHM REPORT 2010
Default view: selection of the main fields from different categories of information, in one single view.
Advanced view: visualization and editing of the entire metadata structure organized by package (12 sections) or by ISO group (ISO minimum, ISO Core, ISO All)
XML view shows the entire content of the metadata in the hierarchical structure, which is composed of tags and closing tags. It requires knowledge of the XML lan-guage
Entering metadata for your map
Figure 7: Default view

ICES WGMHM REPORT 2010 | 79
The most important fields:
Title Alternate title of the dataset, in the form of a two-letter country code + 6
digits; each alternate title must correspond to a record in the DEF Date of creation or publication Abstract Language used for documenting data Topic category Scale Maintenance and update frequency Metadata author Language used for documenting metadata
Some optional but critical fields should also be included:
Purpose Keywords Presentation form Status Spatial representation type Geographic location Reference system information Temporal extent Data quality information Access and use constraints Point of contact: organization(s) or person(s) responsible for the resource Distribution access: online resources

80 | ICES WGMHM REPORT 2010