Embed Size (px)
Citation preview

ICICI Bank: strategy &
performance
November 2016

Certain statements in these slides are forward-looking statements.
These statements are based on management's current expectations and
are subject to uncertainty and changes in circumstances. Actual results
may differ materially from those included in these statements due to a
variety of factors. More information about these factors is contained in
ICICI Bank's filings with the US Securities and Exchange Commission.
All financial and other information in these slides, other than financial
and other information for specific subsidiaries where specifically
mentioned, is on an unconsolidated basis for ICICI Bank Limited only
unless specifically stated to be on a consolidated basis for ICICI Bank
Limited and its subsidiaries. Please also refer to the statement of
unconsolidated, consolidated and segmental results required by Indian
regulations that has, along with these slides, been filed with the stock
exchanges in India where ICICI Bank’s equity shares are listed and with
the New York Stock Exchange and the US Securities and Exchange
Commission, and is available on our website www.icicibank.com
2

Operating environment 1
3
ICICI Group: positioning & strengths 2

4
Emerging trends in India
Improving macro-economic conditions and structural
changes
Strong momentum in digital
Scope for increase in penetration of financial services

• Repo rate reduced by 175 basis points since January 2015
• Current account deficit at 0.1% of GDP in Q1-2017
5
Recent trends in the Indian economy
• GDP grew by 7.6% in FY2016 compared to 7.2% in FY2015
• Monsoon deficit of only 3.0% of long period average with
reasonable spatial distribution; crop area under cultivation stable
Continuing improvement in economic conditions
Inflation at 4.3% in September 2016; monetary policy stance
continues to be accommodative
Strong external sector trends: BoP remains in surplus
However, issues remain including weak manufacturing
sector growth, subdued private investments and weak global
environment

6
Significant structural reforms
• Demonetised ₹ 500 and ₹ 1,000 currency notes to curb shadow
economy; expected to support increase in formal financial savings,
low inflation and interest rates, improved fiscal position and impetus
to digital payments
• Liberalised most sectors for foreign investments under the
automatic route
• Progress made on implementation of GST; constitution amendment
for implementation of GST ratified by states, rate structure finalised
by GST Council; plan to implement from FY2018
• Amendments made to debt resolution laws to fast track process;
Insolvency and Bankruptcy Code enacted; 100% FDI in ARCs
allowed
Structural and institutional changes underway
ARCs: Asset Reconstruction Companies
Several digital solutions introduced in financial services
7
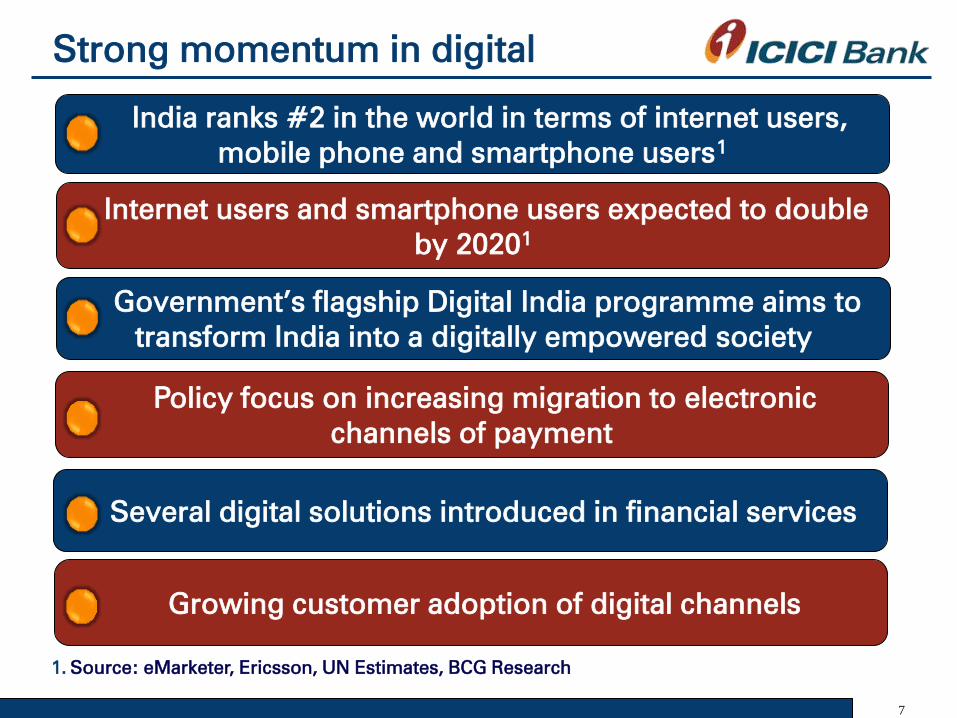
Strong momentum in digital
1. Source: eMarketer, Ericsson, UN Estimates, BCG Research
India ranks #2 in the world in terms of internet users,
mobile phone and smartphone users1
Internet users and smartphone users expected to double
by 20201
Government’s flagship Digital India programme aims to
transform India into a digitally empowered society
Policy focus on increasing migration to electronic
channels of payment
Growing customer adoption of digital channels

8
Penetration of financial services
• Net financial savings of household sector increased from 7.2% of
GNDI1 in FY2013 to 7.7% of GNDI
1 in FY2016
Rising financial savings of households
• Life insurance was 2.0% of GNDI1 in FY2016
• Mortality protection gap high at USD 8.5 trillion3
• General insurance penetration at 0.7%2 of GDP in FY2016
Significant under-penetration in insurance
• Equity market turnover4 has almost doubled compared to FY2014
• ~17% y-o-y growth in outstanding corporate bonds and
commercial paper at Sep 30, 2016
Healthy equity and debt capital market flows
1. GNDI: Gross National Disposable Income
2. General insurance premium as % of GDP
3. Swiss Re, Economic Research and Consulting “Mortality Protection Gap Asia-Pacific 2015
4. Daily average; includes cash and derivative turnover

Operating environment 1
9
ICICI Group: performance highlights 2

ICICI Group
Savings
Investments
Capital
flows
Protection
Credit
Spanning the spectrum of financial services
10

11
ICICI Bank: 4 x 4 agenda
Robust funding profile Digital leadership & strong
customer franchise
Continued cost efficiency Focus on capital efficiency
including value unlocking
Monitoring focus Improvement in portfolio
mix
Concentration risk
reduction Resolution of stress cases
En
han
cin
g
fran
ch
ise
Po
rtfo
lio
qu
ality
12
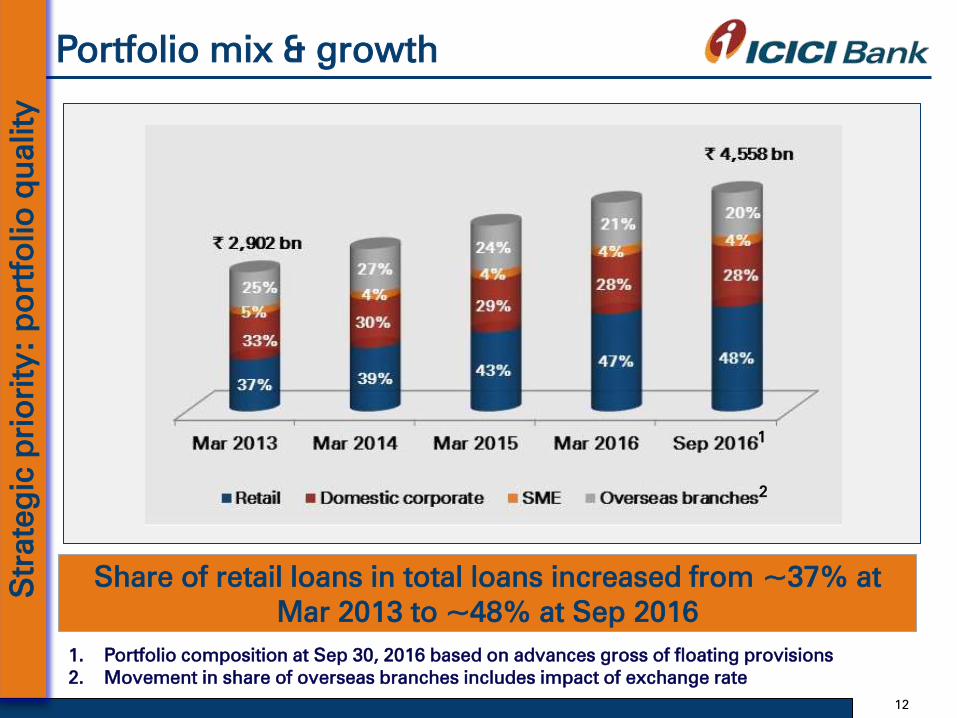
Share of retail loans in total loans increased from ~37% at
Mar 2013 to ~48% at Sep 2016
2
1
1. Portfolio composition at Sep 30, 2016 based on advances gross of floating provisions
2. Movement in share of overseas branches includes impact of exchange rate
Portfolio mix & growth
Strateg
ic p
rio
rit
y: p
ortfo
lio
q
uality

Strong growth across retail products
13
•About one-third of home loan
business originated from
branches in H1-2017
•Auto loans: focus on
profitability
•Commercial vehicles: growth
linked to industry trends
• Focus on granular lending
•Key products include kisan
credit cards, agri term loans,
loans to Self Help Groups and
loans against gold jewelry
Strateg
ic p
rio
rit
y: p
ortfo
lio
q
uality

14
• 65-70% of incremental
disbursements to existing
customers; ~60% sourcing
through internal channels1
•No. of cards-in-force
increased from 2.8 mn in Mar
2013 to 3.9 mn in Sep 2016
•~70% of cards sourced
through internal channels
•Collateral based lending to
small businesses
•Average ticket size of ~` 10
mn
1. Internal channels include branches, online, tele-calling and other direct channels
Strong growth across retail products
Strateg
ic p
rio
rit
y: p
ortfo
lio
q
uality

Corporate business: selective lending
15
CAGR: compounded annual growth rates
•Growth calibrated to trends in the
environment since Mar 2013
• Focus on lending to higher rated
corporates and improving
portfolio mix
•Robust growth in loans other than
non-performing loans,
restructured loans and loans to
companies included in drilldown
exposures, at Sep 30, 2016
Strateg
ic p
rio
rit
y: p
ortfo
lio
q
uality
• Focus on concentration risk
reduction

Monitoring focus
16
Continuous monitoring of delinquency trends in retail
business
• Focus on use of analytics and day-to-day credit monitoring of
wholesale banking and SME customers
• Use of predictive models for stress identification
• Use of internal transaction data and external newsfeeds for
triggers
• Parameters for early warning signals identified
• Credit monitoring dashboard designed and rolled out
Apart from an independent Risk Management Group, Credit
Monitoring Group formed for wholesale & SME business
Strateg
ic p
rio
rit
y: p
ortfo
lio
q
uality
17
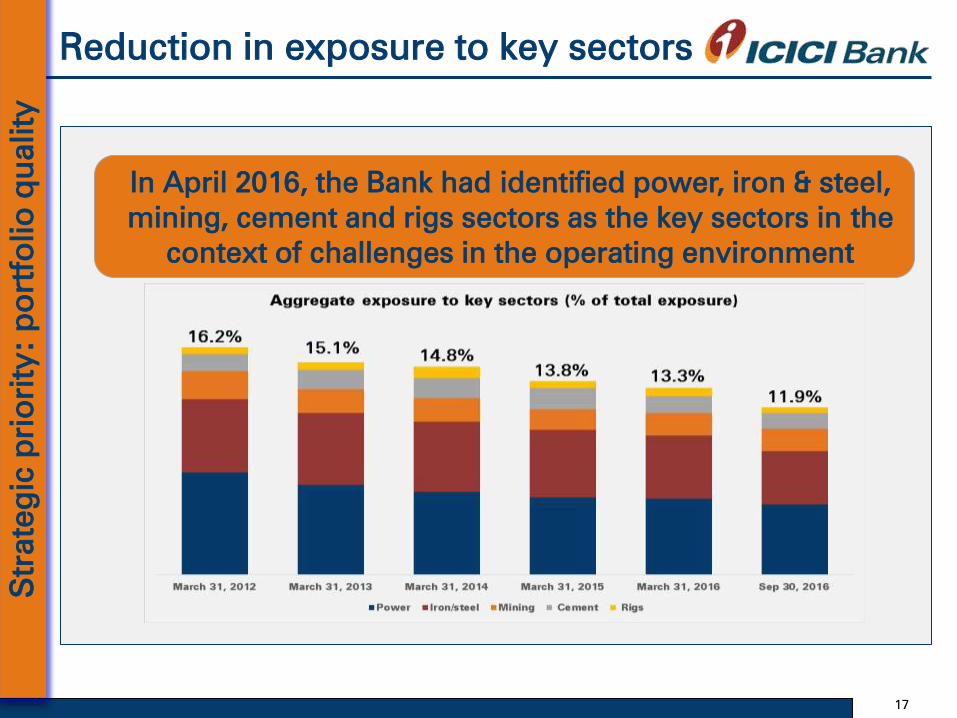
Reduction in exposure to key sectors
In April 2016, the Bank had identified power, iron & steel,
mining, cement and rigs sectors as the key sectors in the
context of challenges in the operating environment
Strateg
ic p
rio
rit
y: p
ortfo
lio
q
uality

18
Drilldown exposures
• Net reduction in exposure and rating upgrades of ₹ 24.61
billion during H1-2017
• Based on the transactions announced by certain
borrowers, significant further reduction expected over
next six to nine months, subject to necessary approvals
and completion of transactions
The Bank had disclosed exposure to ‘below investment
grade’ rated entities in key sectors and promoter entities1
1. Promoter entities where underlying is partly linked to the key sectors
Strateg
ic p
rio
rit
y: p
ortfo
lio
q
uality

Robust funding
19
16.8% y-o-y growth in total deposits at Sep 2016;
proportion of retail deposits at about 76%
• 21.7% y-o-y growth in CASA deposits at Sep 2016
• 18.3% y-o-y growth in period-end CASA deposits at Sep
2016
Strateg
ic p
rio
rit
y: e
nh
an
cin
g fran
ch
ise

Extensive geographical presence
20
Significant investments made in distribution
~52% of branches in semi-
urban and rural areas;
presence across ~2,600
centers
Supplemented by
14,295 ATMs
Branch network
429
318
677
190
23
31
36
210
130
177
34
433
166
59
131
54
80
247
218
5 6
64
10
7
7
2 8
31
239
2
2
262
5
172
0
3
Strateg
ic p
rio
rit
y: en
han
cin
g fran
ch
ise
1,707
4,468

Digital leadership
Digitizing
channels
Digitizing
experience
Digitizing
core
21
Focus on analytics across areas to improve productivity &
efficiency
Strateg
ic p
rio
rit
y: e
nh
an
cin
g fran
ch
ise

Best-in-class mobile application
22
Highest overall score in 2016 India Mobile Banking
Functionality Benchmark study conducted by Forrester
More than 150 services
Industry first features:
Favourites for faster transactions
Chat services & authenticated
call
Rail ticket booking
Touch ID Login & Watch Banking
Instant Tax Payment
SmartKeys: transfer of funds
without switching between
applications
iMobile
Strateg
ic p
rio
rit
y: e
nh
an
cin
g fran
ch
ise

Comprehensive digital wallet: Pockets
23
Over 5.3 million downloads; significant interest from non-ICICI
Bank users
• India’s first digital bank
• Innovation in payments, banking and
shopping
• Sending money through SMS, Email,
WhatsApp, Google+
• Non banking features such as movie tickets,
split bills, gift vouchers
•Amongst the top 4 wallet apps in terms of
time spent on the app1
•Only bank app to figure in the top wallet apps
1. As per Nielsen Whitepaper on Wallets
Strateg
ic p
rio
rit
y: e
nh
an
cin
g fran
ch
ise

Growing payments franchise
Number
of cards
Card spends
Strateg
ic p
rio
rit
y: e
nh
an
cin
g fran
ch
ise

Payment solutions
25
Launched ‘Unified Payments Interface’ (UPI) for its mobile
banking applications
• Offers UPI in ‘Pockets’ and ‘iMobile’
• Enables both P2P (Person to Person)
and P2M (Person to Merchant)
transactions
• Transactions are done using a Virtual
Payment Address (VPA) where bank
account details not required
The Bank worked closely with National Payments Corporation of
India (NPCI) for the launch of the UPI
Over 200,000 Virtual Payment Addresses (VPA) created
Strateg
ic p
rio
rit
y: e
nh
an
cin
g fran
ch
ise

Digitising sales
• KYC through scanned documents
• Demo videos for products and services
• Upsell of mutual funds & insurance
• Being introduced for loan products
26
About 80% of new savings accounts sourced through tab
banking
With digitisation, an account can be opened within a day as
against about four days earlier
Strateg
ic p
rio
rit
y: e
nh
an
cin
g fran
ch
ise

Software robotic systems
• Over 200 software robotic systems
perform over 1.0 million banking
transactions every working day
• Reduced response time for customers
by up to 60%; improved productivity
• Leveraging advancements in artificial
intelligence such as facial and voice
recognition, natural language
processing, machine learning and bots
27
First bank in the country and among few, globally, to roll-out
‘Software robotic systems’
Plan to more than double the software robotic systems to
over 500 business processes by end of FY2017
Strateg
ic p
rio
rit
y: e
nh
an
cin
g fran
ch
ise
28
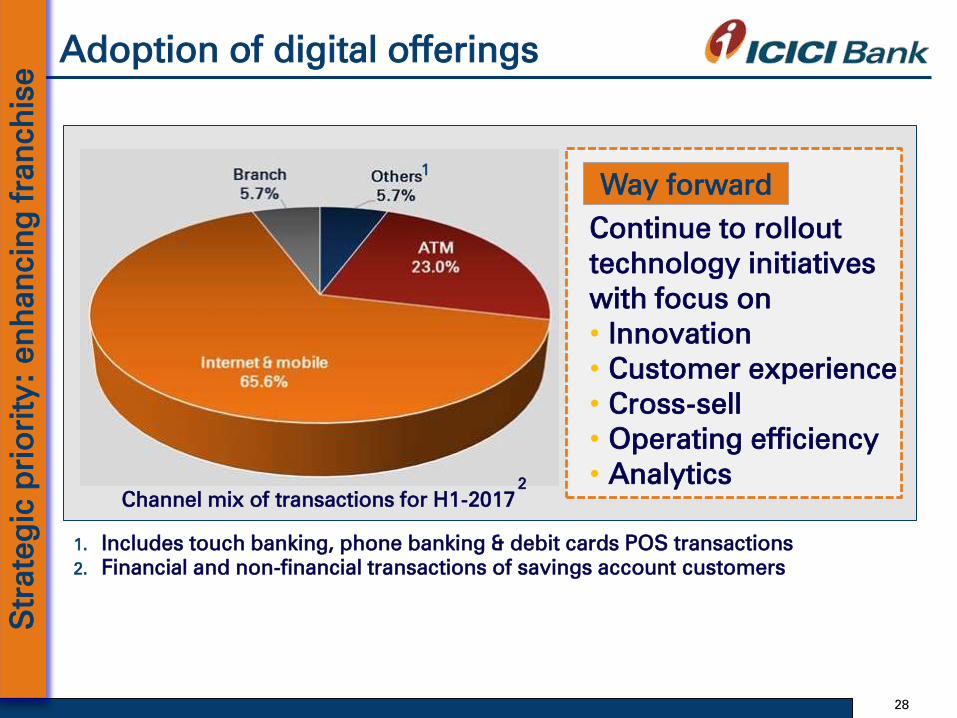
Adoption of digital offerings
1. Includes touch banking, phone banking & debit cards POS transactions
2. Financial and non-financial transactions of savings account customers
Continue to rollout
technology initiatives
with focus on
• Innovation
• Customer experience
• Cross-sell
• Operating efficiency
• Analytics
Way forward
1
Strateg
ic p
rio
rit
y: e
nh
an
cin
g fran
ch
ise
Channel mix of transactions for H1-2017
2

29
Focus on cost efficiency, while investments in franchise
being made
Excluding gains on sale in
shareholding in insurance
subsidiaries; cost-to-income
ratio at 38% and 41% in
FY2016 and H1-2017
respectively
Cost efficiency
Strateg
ic p
rio
rit
y: en
han
cin
g fran
ch
ise

30
Significant value in subsidiaries
Completed initial public offer of ICICI Prudential Life
Insurance Company Limited in Q2-2017
The Bank sold 12.63% stake in the IPO and realised gains
of ₹ 56.82 billion in Q2-2017; shareholding of 54.9% after
the sale
The Bank sold 6.0% stake in ICICI Life and 9.0% stake in
ICICI General in FY2016; aggregate gains of ` 33.74 billion
H1-2017
FY2016
Strateg
ic p
rio
rit
y: en
han
cin
g fran
ch
ise

Capital efficiency
31
1. As per RBI guidelines on Basel III norms
•Capital ratios significantly higher than regulatory requirements
•Tier-1 capital composed almost entirely of core equity capital
•Substantial scope to raise Additional Tier-1 and Tier-2 capital
8.4% y-o-y growth in risk weighted assets compared to 14.4%
y-o-y growth in total assets at September 30, 2016
Strateg
ic p
rio
rit
y: en
han
cin
g fran
ch
ise
Investment in overseas banking subsidiaries decreased from
11.0% of net worth at Mar 2010 to 4.4% of net worth at Sep
2016

Trends in operating revenues
32

Net interest margins
33
Margins impacted by non-accrual of interest on NPAs and
implementation of resolution for stressed borrowers

Fee income
34
Fee income growth has been subdued since fiscal 2014
given the focus on re-orienting corporate lending and weak
corporate activity
Growth in retail fees has
been higher:
• Focus on cross-sell of
third party products to
existing customers
• Leadership in
distribution of
insurance
• Large mutual fund
distribution
Asset quality & exposures
35

36
NPA & restructuring trends
Asset quality trends impacted by challenges in the
corporate segment; retail asset quality healthy and stable

About 79% of the gross additions to NPAs for the
wholesale & and SME businesses in H1-2017 were on
account of slippages relating to companies internally
rated below investment grade in key sectors,
restructured portfolio and accounts classified as non-
performing in earlier periods
Additions to NPA
Movement of NPA
38

38
Drilldown exposures: movement
1. Aggregate fund based limits and non-fund based outstanding
2. Excludes net exposure of ₹ 5.82 bn to central public sector owned undertaking
3. Includes promoter entities where underlying is partly linked to the key sectors
4. Includes non-fund based outstanding in respect of accounts included in the
drilldown exposure where the fund based outstanding has been classified as
non-performing
5. In addition to the above, the non-fund based outstanding to borrowers classified
as non-performing was ₹ 32.86 bn at Sep 30, 2016
Aggregate exposure1,2,3,4
Q2-2017 H1-2017
Opening balance 387.23 440.65
Net reduction in exposure (16.77) (20.36)
Net rating upgrade to ‘investment
grade’ - (4.25)
Classified as non-performing (45.55) (91.14)
Closing balance 324.90 324.90
₹ billion
Sector-wise details

39
Strengthening Balance Sheet
Asset quality and provisioning
Strengthened balance sheet with additional provisioning
Additional provisions in Q2-2017 (` billion) 35.88
Additional provisions for standard loans
Entire loss on sale of NPAs in H1-2017 recognised
upfront (permitted to be amortised as per RBI
guidelines)
16.78
3.95
1
2
3 Floating provisions 15.15
Provisioning coverage ratio on non-performing loans at
59.6% including cumulative technical/ prudential write-offs
and floating provisions
Collective contingency and related reserve of ` 20.55 billion
at Sep 30, 2016

Performance of subsidiaries
40

41
Life insurance
• Sustained leadership in private sector
with an overall market share of 12.4%1
H1-2017
•New business profit margin2
increased from 8.0% in FY2016 to
9.4% in H1-2017
Strong growth
& improvement
in market share
1. Based on retail weighted received premium
2. Based on actual cost
• PAT of ` 16.53 billion in FY2016; ₹ 8.24
billion in H1-2017; ROE of ~28% in H1-
2017
Sustained &
strong
profitability
• AUM at ~` 1,128 billion at September
30, 2016 Growth in AUM
Indian Embedded Value increased from ₹ 139.39 billion at
March 31, 2016 to ₹ 148.38 billion at September 30, 2016
42
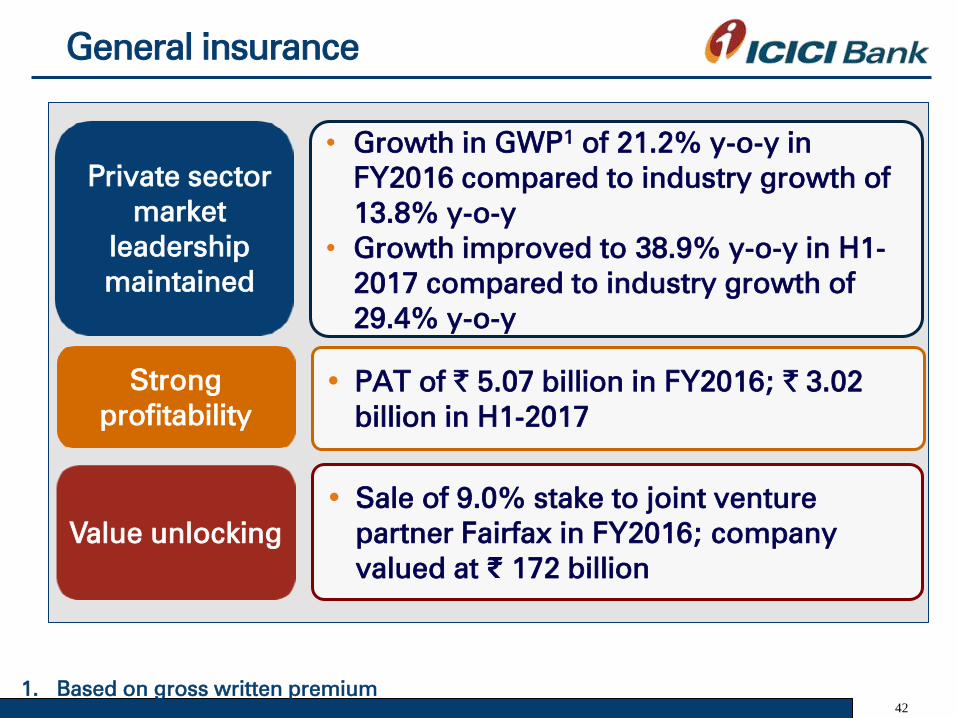
General insurance
• Growth in GWP1 of 21.2% y-o-y in
FY2016 compared to industry growth of
13.8% y-o-y
• Growth improved to 38.9% y-o-y in H1-
2017 compared to industry growth of
29.4% y-o-y
Private sector
market
leadership
maintained
• PAT of ` 5.07 billion in FY2016; ` 3.02
billion in H1-2017
Strong
profitability
• Sale of 9.0% stake to joint venture
partner Fairfax in FY2016; company
valued at ₹ 172 billion
Value unlocking
1. Based on gross written premium

43
Other businesses
• Largest AMC in India based on average
AUM in Q2-2017
• PAT of ` 3.26 billion in FY2016; ` 2.28
billion in H1-2017 (39.0% y-o-y increase)
Asset
management
• Strong platforms for leveraging
favourable markets
• ICICI Securities PD: amongst the leaders
in Indian fixed income & money markets;
PAT of ` 1.95 billion in FY2016; ` 2.47
billion in H1-2017
• ICICI Securities: ~3.9 million customers;
PAT of ` 2.39 billion in FY2016; ` 1.68
billion in H1-2017
Securities &
primary
dealership
44
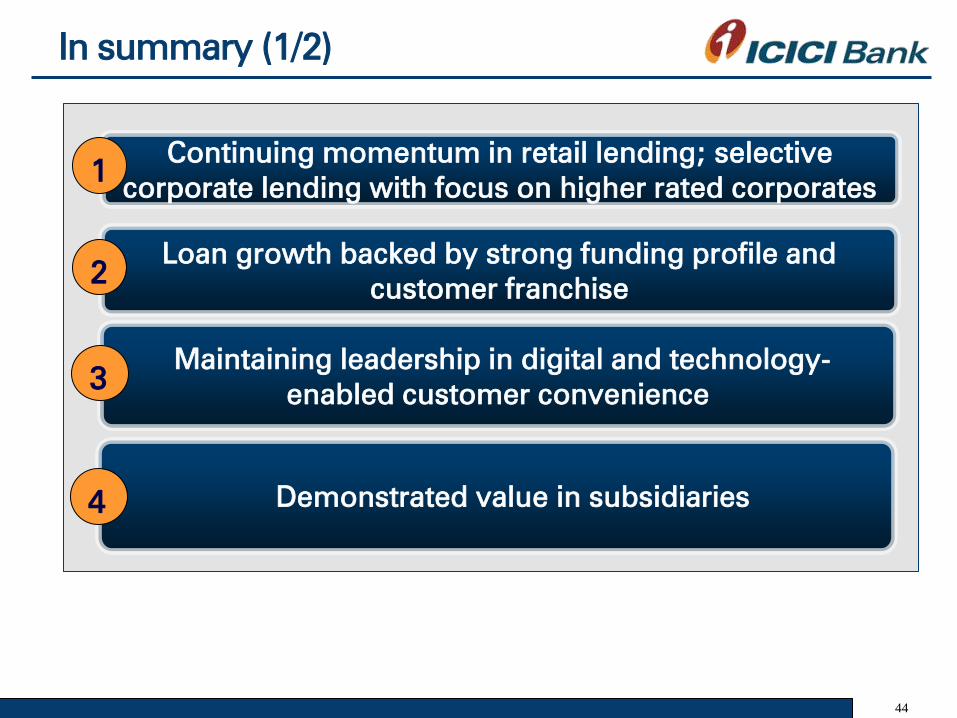
In summary (1/2)
Continuing momentum in retail lending; selective
corporate lending with focus on higher rated corporates 1
Loan growth backed by strong funding profile and
customer franchise 2
Maintaining leadership in digital and technology-
enabled customer convenience 3
Demonstrated value in subsidiaries 4

45
In summary (2/2)
1. Including profits for H1-2017
Strong capital base with Tier-1 capital adequacy of
13.26%1
Encouraging progress on resolution of key sector
exposures 6
Further strengthened balance sheet with additional
provisions
8
Decreasing trend in exposure to key sectors 5
7

Thank you
46
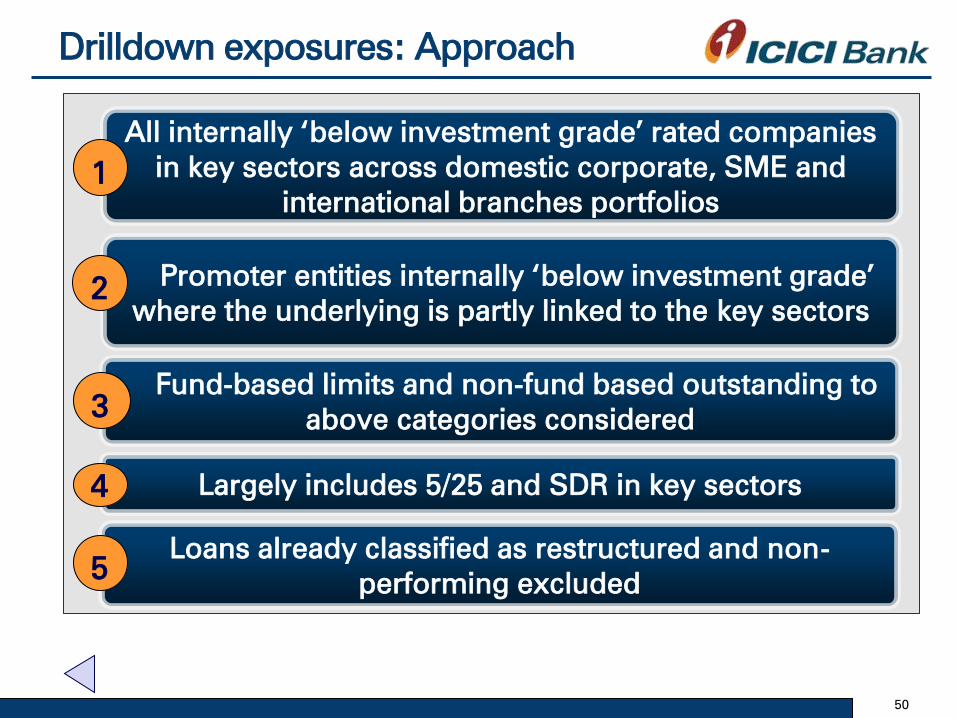
All internally ‘below investment grade’ rated companies
in key sectors across domestic corporate, SME and
international branches portfolios
Promoter entities internally ‘below investment grade’
where the underlying is partly linked to the key sectors
Largely includes 5/25 and SDR in key sectors
Fund-based limits and non-fund based outstanding to
above categories considered
1
2
3
4
Loans already classified as restructured and non-
performing excluded 5
Drilldown exposures: Approach
50

Movement of NPA
1. The Bank sold net NPAs amounting to ` 22.32 billion and ₹ 8.82 billion to ARCs in
Q1-2017 and Q2-2017 respectively. In Q2-2017, the Bank has recognised entire loss
on sale of NPAs in H1-2017, which is permitted to be amortised as per RBI
guidelines
2. Based on customer assets
` billion FY2016 Q2-2016 Q1-2017 Q2-2017
Opening gross NPA
152.42 152.86 267.21 275.63
Add: gross additions
171.13 22.42 82.49 80.29
- of which:
slippages from
restructured assets 53.00 9.31 13.21 12.31
- of which: Slippages from
exposure to ‘below investment
grade’ companies in key sectors
reported - - 45.59 45.55
Less: recoveries & upgrades 21.84 7.09 7.92 8.00
Net additions 149.29 15.33 74.57 72.29
Less: write-offs & sale1
34.50 8.13 66.15 22.44
Closing gross NPAs 267.21 160.06 275.63 325.48
Gross NPA ratio2
5.21% 3.36% 5.28% 6.12%
48
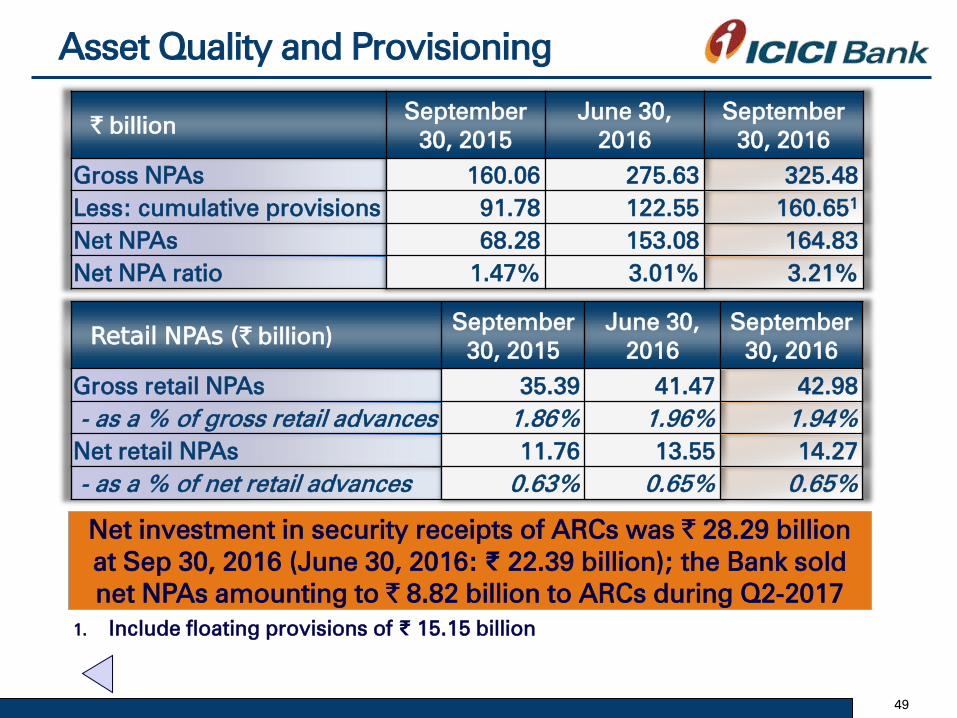
Asset Quality and Provisioning
` billion September
30, 2015
June 30,
2016
September
30, 2016
Gross NPAs
160.06 275.63 325.48
Less: cumulative provisions
91.78 122.55 160.651
Net NPAs 68.28 153.08 164.83
Net NPA ratio
1.47% 3.01% 3.21%
Retail NPAs (` billion) September
30, 2015
June 30,
2016
September
30, 2016
Gross retail NPAs
35.39 41.47 42.98
- as a % of gross retail advances
1.86% 1.96% 1.94%
Net retail NPAs 11.76 13.55 14.27
- as a % of net retail advances
0.63% 0.65% 0.65%
Net investment in security receipts of ARCs was ` 28.29 billion
at Sep 30, 2016 (June 30, 2016: ₹ 22.39 billion); the Bank sold
net NPAs amounting to ` 8.82 billion to ARCs during Q2-2017
1. Include floating provisions of ₹ 15.15 billion
49

Drilldown exposures: Sector-wise details
At March 31, 2016 At September 30, 2016
` billion Exposure1,2,3
% of total
exposure Exposure
1,2,3 % of total
exposure
Power 119.60 1.3% 90.03 0.9%
Mining 90.11 1.0% 75.84 0.8%
Iron/steel 77.76 0.8% 47.13 0.5%
Cement 66.43 0.7% 56.17 0.6%
Rigs 25.13 0.3% 0.44 -
Promoter entities3
61.62 0.7% 55.29 0.6%
1. Aggregate fund based limits and non-fund based outstanding
2. Excludes net exposure of ₹ 5.82 bn to central public sector owned undertaking
3. Includes promoter entities where underlying is partly linked to the key sectors
4. Includes non-fund based outstanding in respect of accounts included in the
drilldown exposure where the fund based outstanding has been classified as
non-performing
5. In addition to the above, the non-fund based outstanding to borrowers classified
as non-performing was ₹ 32.86 bn at Sep 30, 2016
51